Submitted:
02 September 2025
Posted:
03 September 2025
You are already at the latest version
Abstract
The logging system carries the task of collecting and analyzing key operation status and user interaction data in augmented reality (AR) platform. In this paper, we start from performance profiling to locate the performance bottlenecks of AR device logging service in high-frequency I/O scenarios, and propose a set of asynchronous write buffer mechanism, fast path optimization scheme, and flash-friendly compression strategy. In multiple rounds of real-world tests, the system can maintain a 15.4% CPU occupancy reduction and 41.7% write latency reduction under log write pressure. The study shows that the performance optimization of the logging system, as the underlying guarantee of system maintainability, is of key significance to platform stability.
Keywords:
logging system
; performance bottleneck
; asynchronous processing
; augmented reality
; system optimization
1. Introduction
With the wide application of augmented reality technology in the fields of industrial guidance, remote collaboration and immersive interaction, the operational reliability and data traceability requirements of the underlying system have been significantly improved, and the logging system, as a core support component, has gradually emerged as a performance bottleneck. Write blocking under high-frequency I/O triggering, context switch amplification and flash memory load intensification have become key factors restricting the stable operation of AR platform. In order to accurately identify and optimize the response to bottlenecks in complex systems, it is necessary to establish a technical system with causal modeling capability and scheduling adaptability to improve platform operation efficiency and system maintainability.
2. Logging System Performance Bottleneck Identification Method
2.1. Construction of Performance Index System
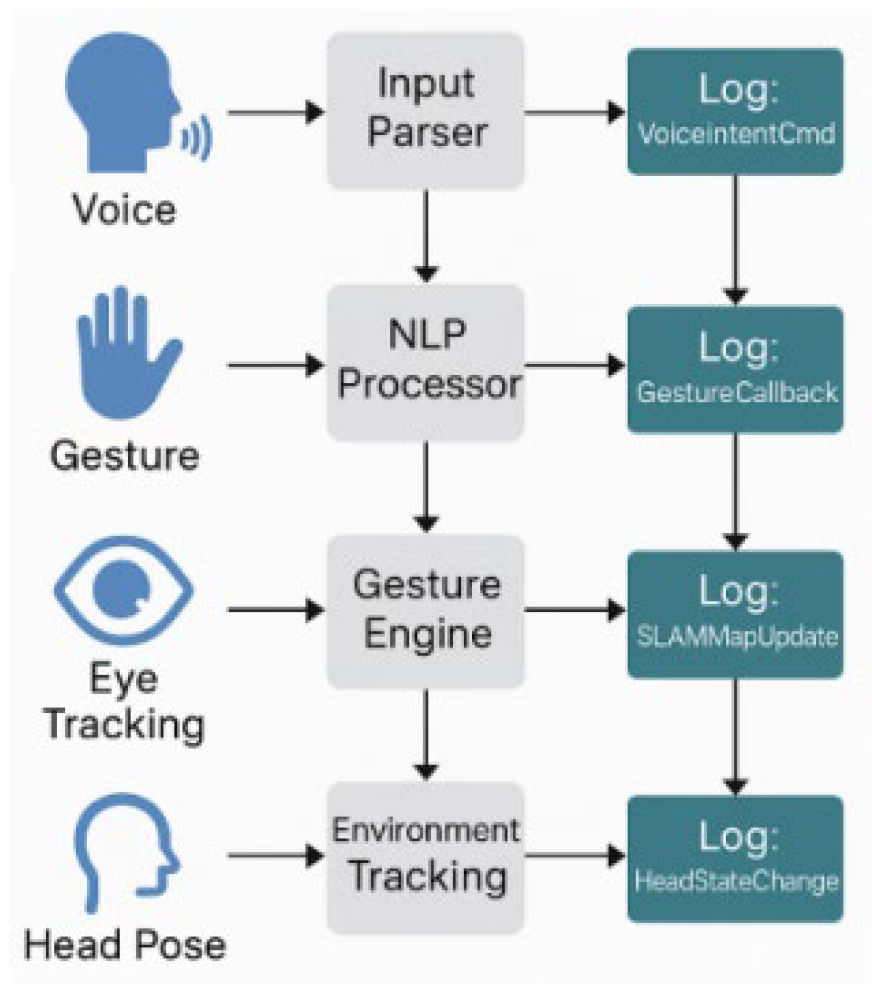
In augmented reality platforms, logging systems must handle high-frequency, multi-threaded concurrent writes. Identifying performance bottlenecks requires a quantifiable, computable, and correlatable indicator system covering the entire log data lifecycle, including write path (Wpath), buffering policy (Bpolicy), compression processing (Ccomp), and persistence efficiency (Pstore) [1]. This paper categorizes metrics into three types: system resource usage (CPU utilization, memory peak, context switching frequency), I/O behavior (write latency, throughput, log loss rate), and device adaptation (flash write amplification, page alignment mismatch rate) [2]. As shown in Table 1, each metric is defined as a measurable parameter or expression, with assigned correlation weights to support bottleneck clustering and prioritization. This system guides subsequent data collection and preprocessing while serving as a standardized input for bottleneck identification algorithms. To illustrate the multimodal pressure logging systems face in AR scenarios, a scene diagram maps interaction processes to logging events.
Figure 1.
AR multimodal interaction scene and log event mapping diagram.
2.2. Data Acquisition and Preprocessing
Building on the multi-dimensional performance index system, a high-precision data collection and preprocessing framework is developed for the AR platform’s logging subsystem (Figure 2). The acquisition module is embedded in the logging service path, using hook mechanisms to intercept write requests, buffer states, and disk drop events in real time [3]. It also integrates low-overhead tracing tools (e.g., perf_event_open, eBPF) to record context switches and CPU usage accurately [4]. To maintain timing consistency, all data are aligned using a unified timestamp from clock_gettime(CLOCK_MONOTONIC_RAW). Preprocessing adopts a dual-channel design: one channel uses a sliding window to filter outliers and transient noise (e.g., hibernation, background I/O bursts), while the other normalizes and bins data to unify scale and enhance clustering convergence.
2.3. Bottleneck Identification Algorithm Design
After data collection and normalization, bottleneck identification is enhanced via machine learning-based anomaly detection to overcome the limitations of static thresholds in dynamic AR environments. The framework adopts an unsupervised architecture that models evolving system states in real time. Performance indicators are encoded using a lightweight autoencoder to extract latent behaviors, followed by Isolation Forest for sparse anomaly detection. A One-Class SVM trained on normal windows identifies deviations, while an LSTM model predicts key metrics (e.g., write latency, context switches); large prediction errors indicate emerging bottlenecks. Together, these generate a dynamic anomaly probability map A(t). To improve robustness across workloads, a weighted feature interaction graph G = (V, E, w) is maintained as in [5], where nodes represent normalized indicators and edge weights reflect coupling strength. Bottleneck regions are extracted via graph-based clustering (e.g., Label Propagation), guided by anomaly probabilities. Time-series dependencies are retained using an improved GMM-HSMM model [6], and the bottleneck scoring function is:
Where γt denotes the probability that moment t is categorized as a bottleneck state, and ΔLt is the deviation of the log delay from the global mean at that moment. The algorithm outputs bottleneck labels and an influence matrix for further attribution and optimization.
2.4. Bottleneck Localization and Analysis Modeling
To translate bottleneck identification results into system-level optimization strategies, a localization and analysis model is proposed by combining causal mapping and attention mechanisms. The model takes the bottleneck label sequence and feature influence matrix as inputs and constructs a causal dependency graph G=(V,E,δ), where δij represents the Granger causal intensity of indicator vi on vj during the bottleneck phase. Structure learning with residual stability constraints extracts high-confidence dependency paths [7], identifying critical conduction chains. A multi-head temporal attention module further assigns dynamic weights to these paths [8], using the loss function:
Where αit is the attention weight of the i-th head at time t, and Pit and Qit are the predicted and actual distributions of key indicators before and after the bottleneck. The model outputs bottleneck-critical paths and indicator impact scores, which guide prioritization and strategy design (Figure 3).
3. Logging System Performance Optimization Strategy
3.1. Storage Architecture Optimization
To address congestion in the "buffer–write-back–flash" path, a dual-channel storage architecture with page alignment optimization is proposed. It introduces asynchronous write channels alongside the original synchronous I/O path and uses a hierarchical cache (L1 memory pool + L2 page cache) [9] to absorb burst traffic and reduce main thread blocking. A logical write alignment module corrects data offsets to meet the page alignment rule, where N is the log block size and P = 4096 is the alignment base. Logical offsets are mapped to physical page blocks via metadata index reorganization, and an I/O scheduler interrupt reordering strategy further decouples long write-back operations from short, high-frequency logging tasks.
3.2. Asynchronous Write Buffer Mechanism
Building on the dual-channel architecture, an asynchronous buffer mechanism is designed for high-concurrency logging scenarios, using thread isolation and event-driven scheduling to decouple log writing from the main path. Log messages first enter L1 (Write Buffer Pool), a lockable ring queue supporting multi-producer single-consumer access. An asynchronous flush thread (Async Flush Thread) periodically scans L1 and triggers flushes to the L2 page cache. The scheduling interval Δt is dynamically adjusted by:
Where Qlen denotes the current queue length of the buffer, Rflush is the current system flush rate, and Tmax is the maximum tolerable delay window. To ensure responsiveness, an event-triggered short-circuit path handles high-priority logs or abnormal pressure instantly. For crash resilience, each log block in L1 is tagged with a write-ahead marker (timestamp, intent flag, checksum), validated before flush. Memory fences (e.g., __sync_synchronize()) ensure visibility across CPU cores. Flush acknowledgment occurs only after integrity checks at L2. A lightweight journal ring buffer mirrors L1 for fail-safe recovery—supporting critical logs like SLAM or voice commands—enabling replay after power failure or kernel panic. These mechanisms improve durability and correctness with minimal latency overhead. Core components are detailed in Table 2.
3.3. Fast Path Optimization Scheme
To further reduce response latency for critical log writes, a Fast Path mechanism is designed atop the asynchronous buffer. It uses log priority labeling and request classification to direct low-latency, high-frequency logs into a dedicated Fast Path, bypassing the main buffer and writing directly to a lock-free memory region, followed by page-level merge and flush. The decision function is defined as:
Where Px denotes the log priority score, Sx is the log size, and θ1 and θ2 are the Fast Path trigger thresholds for priority and size, respectively. The classifier routes qualifying logs via a lightweight Ring Buffer, avoiding context switches and queue delays. To prevent system-level interference (e.g., Fast Path preempting rendering-critical AR tasks), a runtime monitor samples CPU usage, cache pressure, and latency variance. If contention is detected, θ₁ and θ₂ are raised to throttle Fast Path traffic, redirecting mid-priority logs to the standard path. To further isolate Fast Path execution, its thread can be pinned to a dedicated core under high load. These safeguards preserve Fast Path efficiency without sacrificing fairness or stability.
3.4. Flash-Friendly Compression Strategy
Building on Fast Path page-level aggregation, a lightweight compression strategy is designed to reduce write amplification and I/O overhead while maintaining alignment with flash memory characteristics. The two-stage framework includes a Pre-Compress Filter for short-cycle data aggregation and algorithm selection at the page cache layer, and a Compression Core that dynamically chooses low-latency algorithms (e.g., LZ4, Zstandard) based on the predicted compression ratio Rc [10]. The selection function is:
Where x denotes the original page block, Rc(x) is the compression ratio prediction value within the history window, and δ is the compressibility threshold (generally taken as 1.5).To balance compression ratio and decompression latency—critical for time-sensitive AR logs—a profiling module evaluates lightweight codecs under real workloads. Tests show Zstandard achieves ~2.1× compression but with higher decompression latency (~0.83 ms/4KB), while LZ4 offers ~1.7× with lower delay (~0.31 ms), making it preferable for high-frequency short logs like gesture or voice commands. The selector applies a latency-aware utility function, ensuring optimal trade-offs for log replay scenarios. For bursty or periodic patterns, the profiler assesses block entropy, applying low-latency codecs to time-sensitive data and higher-ratio options to batch logs. All compressed blocks are aligned to 4KB to minimize NAND write amplification. Module details and dependencies are shown in Table 3. This adaptive design aligns compression decisions with hardware constraints and AR access patterns, enhancing storage efficiency without compromising responsiveness.
4. Experimental Evaluation and Analysis
4.1. Experimental Environment and Data Set
To evaluate the proposed bottleneck identification and optimization strategies, experiments are conducted on an Android 13-based AR development platform (SoC: Qualcomm Snapdragon XR2, 2.84GHz CPU, 6GB LPDDR5 RAM, UFS 3.1 flash). The self-developed logging module integrates hook components and asynchronous scheduling threads, while the kernel enables ftrace and eBPF for high-precision tracing. The dataset covers six representative AR scenarios: visual SLAM, gesture interaction, voice command parsing, multi-camera fusion, cloud sync, and long-term tracking. Additional cases include graphics-intensive transitions, real-time object tracking, and multi-modal interactions (gesture, voice, gaze), reflecting tightly coupled perception–rendering workloads. These scenarios increase logging density and stress I/O and CPU concurrency, effectively revealing performance bottlenecks under burst traffic. Each task runs ≥30 minutes under real device conditions, with variations in interaction frequency, rendering load, and background processes. A total of 1.28 million raw log samples were collected and split into training and validation sets by time window and system state. Sample characteristics are summarized in Table 4, serving as the basis for algorithm evaluation and multi-strategy comparison.
4.2. Performance Bottleneck Identification Effect Analysis
During training, the system uses a joint recognition algorithm combining performance metrics and sampled data to detect abnormal fluctuations in high-frequency log write cycles. A sliding window compares bottleneck label distribution with actual delay fluctuations to assess identification accuracy and temporal continuity. Table 5 presents the top five performance indicators and their average attention weights across three typical bottleneck time windows. These weights reflect the model’s focus on different metrics over time, revealing system dynamics during bottlenecks. Results show that under high-concurrency conditions, “write latency,” “context switch frequency,” and “page alignment mismatch rate” exhibit strong synergy and dominate attention weights. This indicates the model effectively captures short-term I/O congestion patterns with good temporal sensitivity and feature discrimination.
4.3. Comparison of Optimization Strategies
To evaluate the effectiveness of the proposed optimization strategies, we compare the original and optimized systems across five key metrics: CPU usage, write latency, queue congestion frequency, flash write amplification, and context switch frequency. Table 6 summarizes the performance under high-concurrency scenarios. All metrics are averaged under stable conditions, and improvement rates are calculated to highlight optimization gains. Results show that the multi-strategy optimization significantly enhances logging performance, with notable reductions in resource consumption and latency, demonstrating strong adaptability and scalability on resource-constrained AR platforms.
5. Conclusions
The proposed logging performance bottleneck identification method and multi-policy optimization path systematically improve the processing efficiency and stability of the logging system in the augmented reality platform. Through the mechanisms of asynchronous buffering, fast path diversion, and flash-friendly compression, the latency and resource consumption are effectively reduced, showing strong engineering applicability. Although there is still room for further expansion in terms of algorithm generalization and heterogeneous platform adaptation, the constructed index system and causal analysis model provide a theoretical basis for the intelligent scheduling and adaptive optimization of subsequent logging systems. In the future, we can combine the cross-platform logging framework with the deep temporal learning model to continuously expand the perception accuracy and scheduling flexibility of the system.
References
- Ren P, Liu L, Qiao X, et al. Distributed edge system orchestration for web-based mobile augmented reality services[J]. IEEE Transactions on Services Computing, 2022, 16(3): 1778-1792.
- Qian W, Coutinho R W L. Performance evaluation of edge computing-aided iot augmented reality systems[C]//Proceedings of the 18th ACM International Symposium on QoS and Security for Wireless and Mobile Networks. 2022: 79-86.
- Dzeng R J, Cheng C W, Cheng C Y. A scaffolding assembly deficiency detection system with deep learning and augmented reality[J]. Buildings, 2024, 14(2): 385.
- Pereira N, Rowe A, Farb M W, et al. Arena: The augmented reality edge networking architecture[C]//2021 IEEE International Symposium on Mixed and Augmented Reality (ISMAR). IEEE, 2021: 479-488.
- Kamdjou H M, Baudry D, Havard V, et al. Resource-constrained extended reality operated with digital twin in industrial internet of things[J]. IEEE Open Journal of the Communications Society, 2024, 5: 928-950.
- Hu, L. (2025). Hybrid Edge-AI Framework for Intelligent Mobile Applications: Leveraging Large Language Models for On-device Contextual Assistance and Code-Aware Automation. Journal of Industrial Engineering and Applied Science, 3(3), 10-22.
- Morales Méndez G, del Cerro Velázquez F. Adaptive Augmented Reality Architecture for Optimising Assistance and Safety in Industry 4.0[J]. Big Data and Cognitive Computing, 2025, 9(5): 133.
- Niyazov A, Ens B, Satriadi K A, et al. User-driven constraints for layout optimisation in augmented reality[C]//Proceedings of the 2023 CHI Conference on Human Factors in Computing Systems. 2023: 1-16.
- Alshamsi, S. Improving industrial operations with real-time information using augmented reality[C]//Abu Dhabi International Petroleum Exhibition and Conference. SPE, 2023: D041S127R008.
- Endrigo Sordan J, Andersson R, Antony J, et al. How Industry 4.0, artificial intelligence and augmented reality can boost Digital Lean Six Sigma[J]. Total Quality Management & Business Excellence, 2024, 35(13-14): 1542-1566.
Figure 2.
Flowchart of log system performance data collection and cleaning.
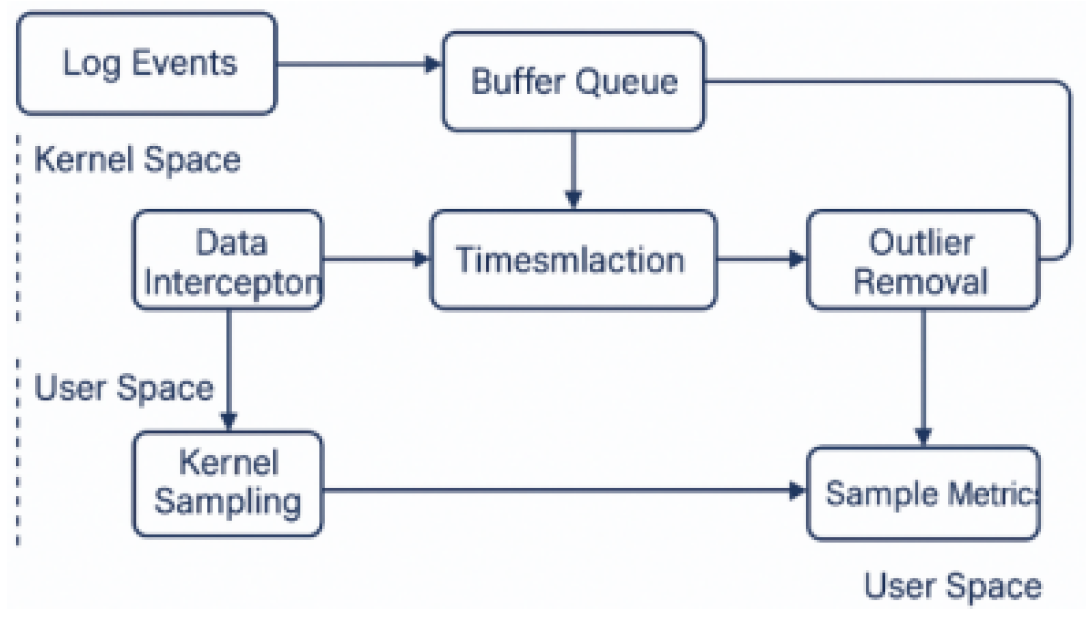
Figure 3.
System bottleneck causal path and attention weight distribution diagram.
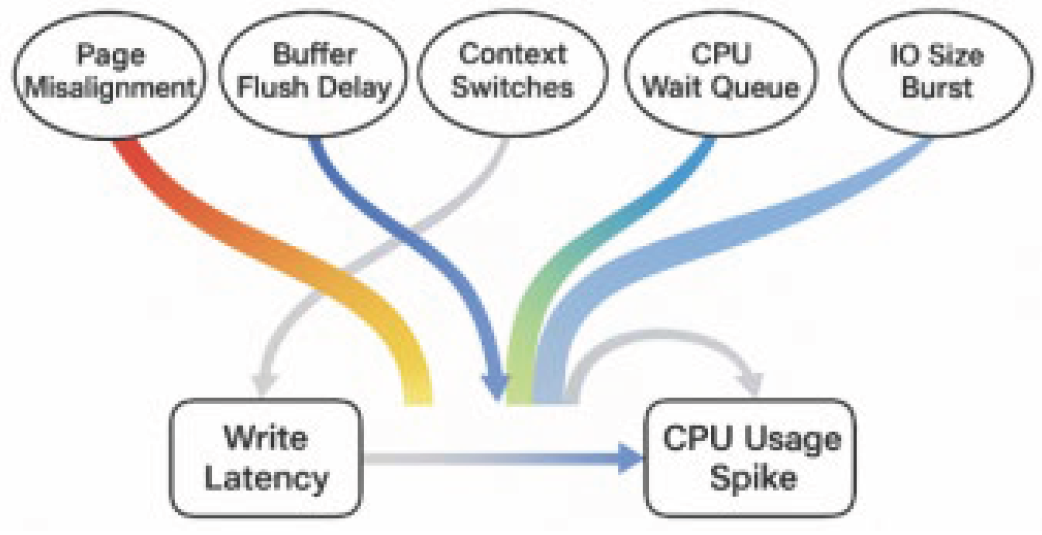

Table 1.
Performance indicator system and calculation method.
| Indicator Name | Indicator Category | Expression/Unit |
|---|---|---|
| CPU Utilization | System Resources | top sampling, unit: % |
| Context switching frequency | System Resource Class | Captured using perf stat |
| Write latency | I/O Behavior Classes | Milliseconds, latency average |
| Throughput | I/O Behavior Class | KB/s, total number of writes/time interval |
| Log Loss Rate | I/O Behavior Class | %, (number of writes - number of dropped disks)/number of writes |
| Flash write amplification factor | Device Adaptation Class | Obtained through F2FS or logging system statistics |
| Page Alignment Mismatch Ratio | Device Adaptation Class | %, monitor 4KB page boundary offset rate |
Table 2.
Asynchronous write buffer mechanism core component design.
| Component Name | Component Description | Technical Characteristics |
|---|---|---|
| Write Buffer Pool | Memory ring cache to receive log messages | Support for locking mechanisms, configurable thresholds |
| Async Flush Thread | Periodically traverses the buffer pool and triggers a flush | Based on thread pool, supports dynamic prioritization |
| Event Dispatcher | Detects write exceptions and interrupts the main thread | Can be triggered to force a flush or discard a low priority log block |
| Flush Scheduler | Calculate scheduling period Δt\Delta t | Delay-sensitive tuning algorithm to avoid frequent scheduling |
Table 3.
Flash-friendly compression module design.
| Module Name | Functional Description | Technical Characteristics |
|---|---|---|
| Pre-Compress Filter | Determines if data needs to be compressed | Quickly estimate the compression rate to avoid redundant processing. |
| Compression Core | Performs core compression tasks | Dynamic switching of algorithms to support parallel page compression |
| Page Align Writer | Aligns and fills pages before writing | Avoids flash page-level write amplification |
| Compression Profiler | Maintains compression ratio prediction models and supports window tuning | Maintains sliding window-based maintenance, supports online learning |
Table 4.
Log data sample structure and sampling distribution.
| Scenario type | Number of samples | Write frequency (bar/s) | Single log mean size (B) |
|---|---|---|---|
| SLAM build map | 210,436 | 320 | 86 |
| Gesture Interaction | 187,920 | 240 | 72 |
| Multimodal Recognition | 205,117 | 305 | 91 |
| Speech Command Processing | 148,220 | 190 | 69 |
| Cloud Synchronization | 164,899 | 170 | 83 |
| Continuous Environmental Tracking | 164,612 | 150 | 77 |
Table 5.
Average Attention Weights of Each Metric During Bottleneck Time Windows.
| Time Window | Write Latency | Context Switch Frequency | Page Alignment Mismatch Rate | CPU Utilization | Log Loss Rate |
|---|---|---|---|---|---|
| T1 (0–5s) | 0.32 | 0.28 | 0.15 | 0.14 | 0.11 |
| T2 (5–10s) | 0.41 | 0.30 | 0.10 | 0.11 | 0.08 |
| T3 (10–15s) | 0.37 | 0.34 | 0.14 | 0.10 | 0.05 |
Table 6.
Comparison of Key Performance Metrics of the Logging System Before and After Optimization.
| Performance Metric | Original Value | Optimized Value | Improvement Rate (%) |
|---|---|---|---|
| Write Latency (ms) | 12.0 | 7.0 | ↓ 41.7 |
| CPU Utilization (%) | 46.1 | 39.0 | ↓ 15.4 |
| Queue Blocking Frequency (times/min) | 84 | 52 | ↓ 38.1 |
| Write Amplification Factor | 2.4 | 1.7 | ↓ 29.2 |
| Context Switch Frequency (times/s) | 3120 | 2487 | ↓ 20.3 |
Disclaimer/Publisher’s Note: The statements, opinions and data contained in all publications are solely those of the individual author(s) and contributor(s) and not of MDPI and/or the editor(s). MDPI and/or the editor(s) disclaim responsibility for any injury to people or property resulting from any ideas, methods, instructions or products referred to in the content. |
© 2025 by the authors. Licensee MDPI, Basel, Switzerland. This article is an open access article distributed under the terms and conditions of the Creative Commons Attribution (CC BY) license (http://creativecommons.org/licenses/by/4.0/).
Copyright: This open access article is published under a Creative Commons CC BY 4.0 license, which permit the free download, distribution, and reuse, provided that the author and preprint are cited in any reuse.


