Submitted:
02 September 2025
Posted:
03 September 2025
You are already at the latest version
Abstract
Sodium bentonite mixes commercially used in oil and gas well operations and plugging were evaluated to identify the critical coagulation concentration (CCC) of electrolyte salts that may be present in the wellbore environment or the well cement. Concentrations of the sodium bentonite mixes from 4% to 10% were prepared, mixed with small amounts of CaCl2 (from 2 g to 18 g) and NaCl (in amounts from 8 g to 90 g) and the degree of dispersion was recorded over time as agglomeration and eventually sedimentation occurred in the samples. The CCC of the electrolyte salts of each sodium bentonite mix concentration was identified. Relatively low levels of CaCl2, at levels commonly found in public water sources, were identified as the CCC where significant flocculation occurs, highlighting the importance to provide guidance on mix water testing.
Keywords:
bentonite clay gel
; degree of dispersion
; oil and gas industry
; wellbore plugging materials
; critical coagulation concentration
1. Introduction
In the energy sector, bentonite clays are used for their high sealing and self-healing properties, including isolation of radioactive waste products [1,2,3,4] and by the oil and gas industry in isolating oil and gas wells and boreholes. In the oil and gas industry, bentonite clays are used in various applications due to their distinctive properties, such as high capillarity, rheological characteristics, hardening, plasticity, thixotropy, and swelling capabilities [5,6,7,8,9,10]. They are used as cement additives to prevent free water, to improve the viscosity of cement and drilling fluids, or as cement extenders to reduce the weight of cement slurry [11,12,13,14,15,16,17,18]. Bentonite clay is also used in oil and gas well plugging operations. Well plugging requires that potential flow zones, including hydrocarbon zones, shallow gas or over-pressurized water zones, must be isolated with a suitable barrier, and cement is generally used and required in these zones and a suitable "mud" is placed between the plugged zones [19,20,21]. In some states, the mud is specified as bentonite gel or is primarily made up of bentonite or bentonite mixes and is used between cement plugs to support the placement in the required zones of the formation [22,23,24]. Bentonite clay mixtures are also used to clean out the well to ensure better cement placement or are used as a spacer material to prevent cement contamination from drilling or other fluids [25].
The definition of clay can differ between disciplines. Generally speaking, clays and clay minerals are hydrated aluminosilicates composed of infinite two-dimensional sheets and are classified as phyllosilicates [26]. Bentonite clay is mainly composed of the mineral montmorillonite from the smectite group of clays [17,27]. Bentonite is known to have thixotropic [17] and shear thinning properties. The latter facilitates the flow of bentonite during placement at high pumping rates and allows it to form a highly viscous gel at appropriate concentrations. Sodium bentonite also has predominantly Na cations occupying its interlayers, providing it with high water swelling capacity [9,10,28] and the ability to form a gel at sufficiently high concentrations of bentonite solids in water. The specific crystal lattice of smectite allows it to swell significantly, creating a stable dispersion with low permeability, making it an almost ideal sealant. However, small amounts of salt when mixed with sodium bentonite clay are known to cause destabilization of the gel, sedimentation, a reduction in yield stress and viscosity [29,30], and decrease its effectiveness for use in the well. Salts can include electrolytes that may be present in the mix water used to prepare bentonite-based gel materials, brine and other fluids in the well, and common cement additives [15,18].
This study explores the amount of electrolyte salts that would cause the destabilization and sedimentation of four different commercially available sodium bentonite clay mixtures used in oil and gas operations at various concentrations to evaluate and provide guidance on their use in the well. The next sections outline the theoretical aspects of the coagulation mechanism in dispersions caused by the addition of electrolytes, followed by the experimental setup, sample preparation, and assessment procedures. This is followed by a discussion of the experimental observations and results. Finally, conclusions are presented.
2. Effect of Electrolytes and Coagulation Mechanism
In bentonite dispersions, the amount of electrolyte dissolved in the mixing water critically influences the dispersion stability [29,31]. An excessive electrolyte concentration can lead to dispersion degradation through the process of coagulation. The concept of the double layer, originally introduced in the Derjaguin-Landau-Verwey-Overbeek (DLVO) theory [32], provides a classical framework for explaining the agglomeration behavior of colloidal systems. According to the DLVO theory, colloidal particles are subject to both Van der Waals attraction and electrostatic repulsion, with the interplay of these forces dictating the stability of colloidal systems.
The concept of the double layer is comprehensively visualized in Figure 1, which was adapted from the figures in Ravina et al. [33]. The negatively charged surfaces of colloid particles attract positive ions from the surrounding solution. This results in the formation of a firmly attached layer around the particle surface, called the Stern layer [34,35]. Beyond the Stern layer, additional positive ions from the solution continue to be attracted to the negative colloid but are also repelled by the positive Stern layer, leading to a dynamic equilibrium that forms the diffuse layer. Outside the diffuse layer, the concentration of positive ions is counterbalanced by negative ions resulting in a net zero charge. The concentration of negative ions decreases from this balanced state to nearly zero within the Stern layer [36]. This overall distribution creates a cloud of positive charge around the colloidal particles, leading to their mutual electrostatic repulsion.
Figure 2 illustrates the coagulation mechanism and the balance between attractive and repulsive energy. As colloidal particles in suspension come closer together, their diffuse double layer (DDL) clouds create electrostatic repulsion. Attractive van der Waals forces are strong but short-range, so the particles must possess a significant kinetic energy to overcome the energy barrier to reach a close proximity, where attractive forces prevail [38,39]. However, the presence of a sufficient concentration of electrolyte salt in the solution significantly decreases the thickness of the double layer by compressing it as shown in Figure 1b. For example, DLVO theory predicts that the double layer thickness is inversely proportional to the square root of the concentration of the symmetrical electrolyte [40,41]. This reduction in thickness can reduce or even eliminate the energy barrier, facilitating aggregation and flocculation.
Coagulation causes aggregated particles to form flocs leading to gradual separation of the bentonite mixture into sediment and the overlying supernatant. This process is commonly quantified by the degree of dispersion, defined as "the volume of sediment divided by the total volume of the mixture" [39]. A degree of dispersion of indicates "no observable sedimentation". However, "no observable sedimentation" does not necessarily imply that the physical properties of the dispersion remain unchanged in comparison to a scenario without added electrolytes. It has been observed that even in the absence of visible sedimentation, a small amount of added electrolyte can still impact properties such as the rheological characteristics of the mixture [29,42,43,44,45]. To quantify the onset of dispersion instability, the term Critical Coagulation Concentration (CCC) will be used. Van Olphen loosely defined CCC as "the minimum electrolyte concentration that will cause a rapid flocculation of a suspension within a defined period" [46]. Although this definition may appear somewhat subjective, CCC serves as a valuable metric for assessing suspension stability. Formally, it can be derived from the DLVO theory assuming a negligibly small energy barrier [47]. However, from a practical point of view, it is not easy to reliably assess the magnitude of this barrier. Therefore, for the purposes of this paper, the value of CCC will be assumed as the maximum electrolyte concentration that still provides 100% degree of dispersion (i.e., no observable sedimentation; for example, see [39]). This study will focus on four key factors that significantly influence the degree of dispersion and CCC, such as:
- Bentonite concentration;
- Electrolyte concentration;
- Type of electrolyte;
- Aggregation time.
Presumably, the brand of bentonite may also play a role, because of differences in grain size and material composition. Therefore, results are compared for several different brands used in the North American market and described in the following section.
3. Experimental Setup, Samples Preparation and Assessment Procedure
This study examines four brands of natural Wyoming sodium bentonite, each exhibiting slight variations in physical appearance, particle size, chemical composition, and standard applications (Table 1). The finely powdered bentonite is often used as a cement additive in oil and gas wells. This powder from BPM Minerals, LLC was included in this study and identified as the Bentonite as Cement Additive (BCA). BenSeal (BS), produced by Baroid Industrial Drilling Products, is a granular Wyoming sodium bentonite with an 8-mesh particle size (sieve size of mm) intended for sealing and grouting well casings. Quik-Grout (QG), also from Baroid Industrial Drilling Products, is a sodium bentonite-based grout that includes up to ammonium sulfate and is not recommended for use as a cement additive. Finally, VolClay (VC), from American Colloid Company, is a 200 sieve bentonite, corresponding to particle sizes of approximately microns, effectively removing most sand and iron impurities from the clay. Figure 3 illustrates a physical appearance comparison of all four brands, arranged from coarsest (left) to finest (right).
Four concentrations by mass of bentonite in water dispersions were used: , , , and . The concentrations, C, of the bentonite dispersions were determined as follows:
The electrolytes considered are the cations Na and Ca, which are among the most prevalent electrolytes in geological environments. Preliminary experiments with these electrolytes indicated a noticeable sedimentation at concentrations of approximately g/L HO for Ca and g/L HO for Na. Therefore, amounts in these ranges were added to the different bentonite concentration solutions for the present study on the degree of dispersion in bentonites and identification of the CCC.
Sedimentation does not occur immediately after the mixing process is stopped. Thus, the timing of sedimentation can be a critical factor. At higher electrolyte concentrations, the effects of sedimentation become noticeable within minutes, whereas at lower electrolyte levels it can take days or even weeks for the dispersion to attain a steady state. Over three weeks following preparation (and in some cases longer), the sedimentation process for each sample was periodically evaluated and the corresponding degree of dispersion was recorded.
Table 2 summarizes the approximate values and ranges of the four factors introduced above for the experimental study. A Sterling Multi Products, Inc. multimixer, model 9B5CH1 (Figure 4), featuring a single agitator built for mud mixing, was employed to create all the dispersions. This device adheres to API 13A standards for mixing water-based drilling fluids. First, the specified amount of electrolyte salt was added to distilled water through mixing until fully dissolved. The specified amount of bentonite was gradually added to the electrolyte salt-water and mixed for approximately 1 hour. Special attention was given to prevent clumping and achieve a uniform dispersion, especially for the granular BS. It is important to note that because the distilled water used was not freshly prepared, it absorbed some carbon dioxide from the atmosphere, resulting in a slightly acidic pH of approximately . Each prepared dispersion was then transferred into a 50 mL vial, sealed to prevent fluid loss, and sedimentation was observed over time. Figure 5 provides an example of five samples from the QG group, mixed with 2, 3, 4, 6, and 12 grams of CaCl, respectively, per liter of distilled water. Each sample was observed until a steady degree of dispersion was achieved, resulting in a stable sediment layer with a clear liquid above. This asymptotic value can be considered as a degree of dispersion at the infinite time limit and that is how it will be referred to in the rest of this paper. Comparative samples were prepared for all brands and concentrations of bentonite.
4. Experimental Observations and Results
For each bentonite sample, the volume of sediment normalized by the total sample volume was plotted over time to evaluate the impact of salts on the different concentrations of each bentonite mixture. This detailed analysis of different bentonite brands and concentrations helps to provide insight into the stability of the dispersions and sedimentation dynamics in the presence of electrolyte salts. Figure 6 shows the change in sediment height with respect to time for the concentrations of BS samples and the amounts of NaCl concentrations within the ranges listed in Table 1.
The sedimentation curves qualitatively confirm existing knowledge about the behavior of clay dispersions in the presence of salts: higher concentrations of NaCl lead to faster sedimentation and denser sediment formation. The addition of a sufficient concentration of NaCl (for example, g/L of HO) results in a rapid degradation of the bentonite dispersion. Within the first 24 hours, the supernatant comprises of the total volume, depending on the concentrations of both the electrolyte and bentonite. Even at lower NaCl concentrations, sedimentation in the dispersion becomes significant within the first few days.
Figure 7 presents the change in sediment height with respect to time for BS over the initial 500 hours and shows the effects of CaCl on the samples. As the CaCl concentration exceeds approximately g/L HO, there is a rapid degradation of the dispersion’s properties: within the first 24 hours, the supernatant accounts for to of the total volume, depending on concentrations of both the CaCl and bentonite. Even at lower CaCl levels, significant sedimentation occurs within the first few days, indicating that electrolyte concentration quickly impacts the stability and behavior of the dispersion.
As the amount of clay material increases in each sample, a greater amount of salt is necessary to achieve the same degree of sedimentation. This observation aligns with the expectation that salt concentrations influence both the rate and extent of sedimentation in clay dispersions, reinforcing the importance of adjusting salt levels based on clay content to effectively control dispersion stability. Figure 6 & Figure 7, depicting the sedimentation that occurs with BS, highlight an important difference with respect to the amounts of NaCl and CaCl required for effective coagulation of BS dispersions. Specifically, the amount of NaCl needed for sufficient coagulation is six to eight times greater than the amount of CaCl, which qualitatively aligns with similar studies [48,49]. As a result, the maximum recommended concentration of NaCl in a water source can be considerably higher than that of CaCl before the critical amount of electrolyte to destabilize the dispersion would be reached.
Figure 8, Figure 9, and Figure 10 illustrate the sedimentation observed for QG, BCA, and VC bentonite, respectively, with CaCl concentration during the first 500 hours.
The sedimentation curves for different sodium bentonite brands exhibit qualitatively similar behavior (as shown in Figure 7, Figure 8, Figure 9, Figure 10); however, due to the variation in the commercial bentonite brands and mixes, there are notable quantitative differences among them. These distinctions are better highlighted visually at the infinite time limit, when the degree of dispersion reaches its steady value. Thus, the focus will be on the asymptotic limits of each curve shown in Figure 7 through Figure 10. With time no longer a variable, Figure 11, illustrates the degree of dispersion for BS as a function of NaCl and CaCl at the infinite time limit. Similarly, Figure 12 summarizes the degree of dispersion at the infinite time limit as a function of CaCl concentration for the four bentonite brands (from Figure 7, Figure 8, Figure 9, and Figure 10), highlighting the effects on sedimentation by Ca. The data from Figure 11 and Figure 12 was fit to the following equation form, where D is the degree of dispersion, M is the electrolyte concentration, and a, b, c are constants determined for each concentration and bentonite brand:
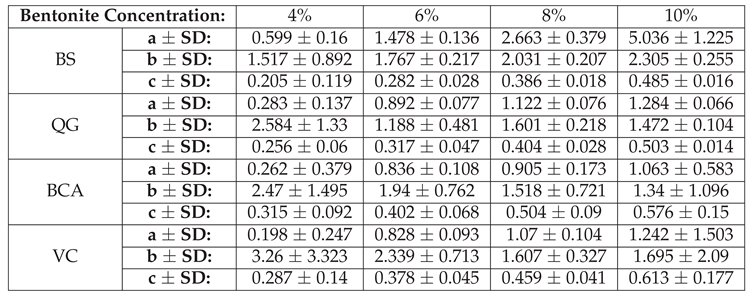
The values of constants a, b, and c are summarized in Table A1 and Table A2 of the Appendix. Table A1 provides the best fit values for Figure 11 (NaCl additives to BS dispersions), while Tables A2 shows the best fit values for Figure 12 (CaCl additives to different bentonite brands).
The data in Figure 11 and Figure 12 provides a viable approach to evaluate CCC. Specifically, a degree of dispersion equal to unity indicates no visible coagulation in the dispersion. Therefore, the points where each curve in Figure 11 and Figure 12 reaches a " degree of dispersion equal to one" can be considered as the CCC. Table 4 summarizes these CCC values determined from the data in Figure 11 and Figure 12.
The CCC curves as functions of bentonite concentrations can establish a reasonable boundary to achieve stable, uniform dispersions of bentonite mixtures. Alternatively, these curves can be interpreted as indicators of the conditions for instability in bentonite dispersions. The data from the four bentonite brands reveals a reliable trend that closely approximates linear dependence, as seen in Figure 13 and Figure 14. The areas above each of the curves represent the instability regions for that brand since the CCC is the minimum concentration needed for observable sedimentation. Within the range of tested bentonite concentrations (from 4% to 10%), the CCC for every bentonite brand can be approximated with the following equation, where M represents the electrolyte concentration, C represents the concentration of the bentonite sample, while and are the constants determined by the best fit of the data:
To visualize the effect of the ion valency, Figure 14 compares the results for both electrolytes of interest, NaCl and CaCl, and the instability region is marked by shading. The purpose of this paper was to test the mixes with relatively high bentonite content (>=4% by mass). Although for lower concentrations a similar trend is expected, it may slightly deviate from the proposed linear approximation. It is also worth noting that the 8 mesh granular product, BS, exhibits a slightly better stability when mixed with water containing an electrolyte salt compared to the other three bentonite brands, which display very similar results.

Table 3.
Values of constants and SD for fitted curve from Figure 14.
Table 3.
Values of constants and SD for fitted curve from Figure 14.
| Bentonite Brand: | BS(NaCl) | BS(CaCl) | QG | BCA | VC |
|---|---|---|---|---|---|
| ± SD: | 2.13 ± 0.423 | 0.307 ± 0.017 | 0.193 ± 0.019 | 0.211 ± 0.0325 | 0.217 ± 0.009 |
| ± SD: | -2.507 ± 3.111 | -0.376 ± 0.1278 | -0.087 ± 0.1389 | -0.144 ± 0.239 | -0.189 ± 0.069 |
A final observation is that the CCC curves only indicate a sufficient condition for the onset of dispersion instability. The influence of electrolytes on the physical and rheological properties of bentonite dispersions can manifest at electrolyte concentrations below the CCC. Consequently, it is essential to examine the variations in physical properties, particularly rheological characteristics, at electrolyte concentrations near the CCC.
5. Discussion
Although the DLVO theory provides good insight into the physics of the colloidal systems and adequately reflects some phenomena, it cannot reliably quantify the CCC values for various formulations of bentonite dispersions. Any light scattering method is also inapplicable due to the high solid/liquid ratio ( to ). Therefore, an experimental method was implemented that involved a parametric analysis of the degree of dispersion in bentonite mixtures.
The valency of the cations plays a critical role in the flocculation process. DLVO theory suggests a complicated dependence between the CCC and the valency of the counterions in the dispersion. For the low potential of the colloidal particles (see for example, Doroszkowski), CCC is inversely proportional to the second power of the electrolyte cation valency, CCC , while for very high potential the inverse proportionality increases to the sixth power, CCC .
This implies that flocculation efficiency may increase from four times (for low particle charges) to as much as 64 times (for very high charges) as we switch from a monovalent to a bivalent electrolyte. That is, the effect of cation valency on highly charged particles is stronger. To properly compare the flocculation effect of monovalent cations of Na+ versus bivalent cations Ca in our bentonite dispersions of high solid content, the corresponding CCC values in Table 4 were converted from g/kg to mmol/L:
Table 4.
CCC for the tested bentonite concentrations.
| Bentonite Concentration: | 4% | 6% | 8% | 10% |
|---|---|---|---|---|
| BS (): | g | g | g | g |
| BS (): | g | g | g | g |
| QG (): | g | g | g | g |
| BCA (): | g | g | g | g |
| VC (): | g | g | g | g |
Table 5 shows that the flocculation strength of bivalent cations is approximately times greater than that of monovalent cations. This value reasonably fits in the middle of the range [4,47], considering that bentonite colloidal particles have a medium high surface charge. This demonstrates that levels of bivalent cations in water sources are significantly more critical in altering the properties of bentonite dispersions and indicates that water sources should be thoroughly tested before use. Since relatively low levels of Ca can significantly alter the properties of the bentonite, all bentonite brands were tested with and focused primarily on the most abundant bivalent cation found in geological formations, Ca.
As summarized in Table 4, the CCC of dissolved CaCl for all tested bentonite brands ranges from to g CaCl per kg of HO, depending on the brand and the mass concentration of bentonite. Multiplying these values by the ratio of molar masses for Ca versus CaCl:
the CCC range for dissolved Ca cations will be approximately to g of Ca per kg of HO. BS has a significantly larger particle size compared to the other brands and its CCC is appreciably higher for all the measured solid/liquid ratios.
Temporal evolution of the degree of dispersion provides an additional insight to the high solid/liquid ratio systems. The equilibrium values of the degree of dispersions, that are smaller than roughly , are reached relatively fast – in a couple of hours. On the other hand, larger values of the degree of dispersion equilibrate rather slow – it may not even reach steady value after 500 hours.
6. Conclusions
It was found that, for the high solid/liquid ratios, the CCC is almost a linear function of the bentonite concentration for both mono- and divalent electrolytes. The flocculation strength of bivalent Ca ions was found to be approximately times higher than monovalent Na ions for all the tested bentonite concentrations. The CCC values in Table 4 for Ca are relatively low; it is not uncommon for groundwater hardness to exceed 1 or even 2 grams of Ca+Mg per kg of HO. This raises potential concerns regarding water sources in terms of hardness when considering their use in the well environment. If excessively hard water is utilized for mixing bentonite dispersions, irreversible flocculation and gradual sedimentation of clay particles could undermine the intended benefits of the bentonite mixes - normally characterized by higher viscosity, yield stress, and lower permeability - within a well.
Author Contributions
Conceptualization, I.H., R.S. and E.R; methodology, I.H; formal analysis, I.H. and C.G; investigation, I.H., C.G., R.S. and E.R; resources, E.R; writing—original draft preparation, I.H. C.G. and E. R; writing—review and editing, J.B. and R.S; visualization, I.H. J.B. C.G and E. R; supervision, R.S. and E.R; project administration, E.R; funding acquisition, E.R. All authors have read and agreed to the published version of the manuscript.
Acknowledgments
This work was performed in support of the U.S. Department of Energy’s (DOE) Office ofFossil Energy and Carbon Management’s Advanced Remediation Technologies Program and executed through the National Energy Technology Laboratory’s (NETL) Research & Innovation Center’s Remediation and Reuse of Onshore Resources Portfolio
Conflicts of Interest
The authors declare no conflicts of interest.
Disclaimer
This project was funded by the United States Department of Energy, National Energy Technology Laboratory, in part, through a site support contract. Neither the United States Government nor any agency thereof, nor any of their employees, nor the support contractor, nor any of their employees, makes any warranty, express or implied, or assumes any legal liability or responsibility for the accuracy, completeness, or usefulness of any information, apparatus, product, or process disclosed, or represents that its use would not infringe privately owned rights. Reference herein to any specific commercial product, process, or service by trade name, trademark, manufacturer, or otherwise does not necessarily constitute or imply its endorsement, recommendation, or favoring by the United States Government or any agency thereof. The views and opinions of authors expressed herein do not necessarily state or reflect those of the United States Government or any agency thereof.
Appendix A
Table A1.
Values of constants for fitted curves in Figure 11 (NaCl additives to BS).
Table A1.
Values of constants for fitted curves in Figure 11 (NaCl additives to BS).
| Bentonite Concentration: | 4% | 6% | 8% | 10% |
|---|---|---|---|---|
| a ± SD: | 2.688 ± 2.762 | 6.702 ± 14.948 | 25.44 ± 128.46 | 13.26 ± 31 |
| b ± SD: | 0.424 ± 1.605 | 0.848 ± 1.09 | 1.304 ± 1.841 | 1.049 ± 0.9 |
| c ± SD: | -0.297 ± 2.252 | 0.087 ± 0.497 | 0.282 ± 0.304 | 0.366 ± 0.238 |
Table A2.
Values of constants for fitted curves in Figure 12. (CaCl2 additives to different bentonite brands)
Table A2.
Values of constants for fitted curves in Figure 12. (CaCl2 additives to different bentonite brands)
 |
References
- Pusch, R. Highly Compacted Sodium Bentonite for Isolating Rock-Deposited Radioactive Waste Products. Nuclear Technology 1979, 45, 153–157. [Google Scholar] [CrossRef]
- Pusch, R. Use of bentonite for isolation of radioactive waste products. Clay Minerals 1992, 27, 353–361. [Google Scholar] [CrossRef]
- Li, K.P.; Chen, Y.G.; Ye, W.M.; Wang, Q. Self-sealing behavior of bentonite-based materials in high-level radioactive waste disposal: A systematic review. Applied Clay Science 2023, 235, 106873. [Google Scholar] [CrossRef]
- Kaufhold, S.; Dohrmann, R. Distinguishing between more and less suitable bentonites for storage of high-level radioactive waste. Clay Minerals 2016, 51, 289–302. [Google Scholar] [CrossRef]
- Oliveira, L.R.C.d.; Lima, M.C.d.S.; Costa, W.R.P.d.; Gonçalves, R.L.d.N.; Costa, A.C.A.; Nóbrega, K.C.; Souza, E.A.d.; Amorim, L.V. Mechanical performance of bentonite plugs in abandonment operations of petroleum wells. Resources 2024, 13, 103. [Google Scholar] [CrossRef]
- Magzoub, M.; Mahmoud, M.; Nasser, M.; Hussein, I.; Elkatatny, S.; Sultan, A. Thermochemical upgrading of calcium bentonite for drilling fluid applications. Journal of Energy Resources Technology 2019, 141, 042902. [Google Scholar] [CrossRef]
- Garcia, C.A.; Rosenbaum, E.; Spaulding, R.; Haljasmaa, I.V.; Sharifi, N.P.; Vandenbossche, J.M.; Iannacchione, A.T.; Brigham, J.C. Numerical approach to simulate placement of wellbore plugging materials using the Lattice Boltzmann method. Geoenergy Science and Engineering 2023, 228, 212047. [Google Scholar] [CrossRef]
- Garcia, C.A.; Rosenbaum, E.; Grasinger, M.; Vandenbossche, J.M.; Iannacchione, A.T.; Brigham, J.C. A computational strategy to evaluate the occurrence and characteristics of gas migration in wellbore cement using the lattice Boltzmann method. Geoenergy Science and Engineering 2025, 246, 213530. [Google Scholar] [CrossRef]
- Savic, I.; Stojiljkovic, S.; Savic, I.; Gajic, D. Industrial application of clays and clay minerals. Clays and Clay Minerals: Geological Origin, Mechanical Properties and Industrial Applications; Wesley, LR, Ed 2014, pp. 379–402.
- Uddin, F. Clays, nanoclays, and montmorillonite minerals. Metallurgical and Materials Transactions A 2008, 39, 2804–2814. [Google Scholar] [CrossRef]
- An Environment Friendly and Economically Attractive Thermal Degradation Inhibitor for Bentonite Mud, Vol. SPE Europec/EAGE Annual Conference and Exhibition, SPE Europec featured at EAGE Conference and Exhibition, 2006, [https://onepetro.org/SPEEURO/proceedings-pdf/06EURO/06EURO/SPE-99410-MS/3551583/spe-99410-ms.pdf]. [CrossRef]
- Kjeldal, V.N.; Wise, J.; Hareland, G.; Al Dushaishi, M.F. Evaluation of nanoparticle effect on heavy and light wellbore cement slurries. CEMENT 2024, 16, 100100. [Google Scholar]
- Mayibeki, D.; Kjeldal, V.; Akhtarmanesh, S.; Hareland, G. Nanoparticle-based cement: a solution to reduce non-productive time and improve wellbore integrity? In Proceedings of the ARMA US Rock Mechanics/Geomechanics Symposium. ARMA, 2021, pp. ARMA–2021.
- Kutchko, B.G.; Strazisar, B.R.; Huerta, N.; Lowry, G.V.; Dzombak, D.A.; Thaulow, N. CO2 reaction with hydrated class H well cement under geologic sequestration conditions: Effects of flyash admixtures. Environmental science & technology 2009, 43, 3947–3952. [Google Scholar]
- Nelson, E.B.; Baret, J.F.; Michaux, M. 3 Cement additives and mechanisms of action. In Developments in Petroleum Science; Elsevier, 1990; Vol. 28, pp. 3–1.
- Guillot, D.; Hendriks, H.; Callet, F.; Vidick, B. 5 Mud Removal. Developments in Petroleum Science 1990, 28, 5–1. [Google Scholar]
- Mukherjee, S. The science of clays. Netherlands: Springer Science and Business Media 2013.
- Broni-Bediako, E.P.E.; Joel, O. Oil Well Cement Additives: A Review of the Common Types. Oil & Gas Research 2016, 2. [Google Scholar] [CrossRef]
- Achang, M.; Yanyao, L.; Radonjic, M. A review of past, present, and future technologies for permanent plugging and abandonment of wellbores and restoration of subsurface geologic barriers. Environmental Engineering Science 2020, 37, 395–408. [Google Scholar] [CrossRef]
- Institute, A.P. 10B-2, API Recommended practice for testing well cements, second.
- Institute, A.P. API Recommended Practice 65-3 Wellbore Plugging and Abandonment.
- CHAPTER 78. OIL AND GAS WELLS 25 § 78.1, 1987.
- W. Va. Code R. § 35-4-14.
- 4 Va. Admin. Code § 25-150-435.
- Issues and Techniques of Plugging and Abandonment of Oil and Gas Wells, Vol. SPE Annual Technical Conference and Exhibition, SPE Annual Technical Conference and Exhibition, 1994, [https://onepetro.org/SPEATCE/proceedings-pdf/94SPE/94SPE/SPE-28349-MS/3489915/spe-28349-ms.pdf]. [CrossRef]
- Awad, A.M.; Shaikh, S.M.; Jalab, R.; Gulied, M.H.; Nasser, M.S.; Benamor, A.; Adham, S. Adsorption of organic pollutants by natural and modified clays: a comprehensive review. Separation and Purification Technology 2019, 228, 115719. [Google Scholar] [CrossRef]
- Moosavi, M. Bentonite clay as a natural remedy: a brief review. Iranian journal of public health 2017, 46, 1176. [Google Scholar]
- Kumar, A.; Lingfa, P. Sodium bentonite and kaolin clays: Comparative study on their FT-IR, XRF, and XRD. Materials Today: Proceedings 2020, 22, 737–742. [Google Scholar] [CrossRef]
- Abu-Jdayil, B. Rheology of sodium and calcium bentonite–water dispersions: Effect of electrolytes and aging time. International journal of mineral processing 2011, 98, 208–213. [Google Scholar] [CrossRef]
- Kelessidis, V.C.; Tsamantaki, C.; Dalamarinis, P. Effect of pH and electrolyte on the rheology of aqueous Wyoming bentonite dispersions. Applied Clay Science 2007, 38, 86–96. [Google Scholar] [CrossRef]
- Niu, X.; Feng, G.; Han, Y.; Liu, Q.; Xue, G.; Cui, J.; Song, C. Synergistic effect of surfactant and chlorine salt on dispersion of nano-SiO2 and performance of cement-based grout containing a large amount of bentonite. Cement and Concrete Composites 2022, 131, 104587. [Google Scholar]
- Derjaguin, B.; Churaev, N.; Muller, V.; Derjaguin, B.; Churaev, N.; Muller, V. The Derjaguin—Landau—Verwey—Overbeek (DLVO) theory of stability of lyophobic colloids. Surface forces 1987, pp. 293–310.
- Ravina, L.; Moramarco, N. Everything you want to know about Coagulation & Flocculation. Zeta-Meter, Inc 1993, pp. 1–37.
- Tripathy, S.; Bag, R.; Thomas, H.R. Effect of Stern-layer on the compressibility behaviour of bentonites. Acta Geotechnica 2014, 9, 1097–1109. [Google Scholar] [CrossRef]
- Leroy, P.; Revil, A.; Coelho, D. Diffusion of ionic species in bentonite. Journal of Colloid and Interface Science 2006, 296, 248–255. [Google Scholar] [CrossRef] [PubMed]
- Meegoda, J.N.; Hewage, S.A.; Batagoda, J.H. Application of the diffused double layer theory to nanobubbles. Langmuir 2019, 35, 12100–12112. [Google Scholar] [CrossRef]
- Ravina, Louis (Zeta-Meter, I. Everything you want to know about Coagulation & Flocculation ....
- Lagaly, G.; Ziesmer, S. Colloid chemistry of clay minerals: the coagulation of montmorillonite dispersions. Advances in colloid and interface science 2003, 100, 105–128. [Google Scholar] [CrossRef]
- Kaufhold, S.; Kaufhold, A.; Dohrmann, R. Comparison of the critical coagulation concentrations of allophane and smectites. Colloids and Interfaces 2018, 2, 12. [Google Scholar] [CrossRef]
- Macdonald, J.R.; Barlow Jr, C.A. Theory of double-layer differential Capacitance in electrolytes. The Journal of Chemical Physics 1962, 36, 3062–3080. [Google Scholar] [CrossRef]
- Lambourne, R.; Strivens, T.A. Paint and surface coatings: theory and practice; Elsevier, 1999.
- Montoro, M.A.; Francisca, F.M. Effect of ion type and concentration on rheological properties of natural sodium bentonite dispersions at low shear rates. Applied Clay Science 2019, 178, 105132. [Google Scholar] [CrossRef]
- Vryzas, Z.; Kelessidis, V.C. Nano-based drilling fluids: A review. Energies 2017, 10, 540. [Google Scholar] [CrossRef]
- Zhao, Z.; Chen, S.; Zhou, F.; Wei, Z. Gel Stability of Calcium Bentonite Suspension in Brine and Its Application in Water-Based Drilling Fluids. Gels 2022, 8, 643. [Google Scholar] [CrossRef]
- Siyao, H.; Mingbiao, X.; Peng, X.; Yu, Z.; Xinying, W. Composite hydration process of clay minerals simulating mineral clay components and influence mechanism of cations. Energies 2022, 15, 7550. [Google Scholar] [CrossRef]
- Van Olphen, H. An introduction to clay colloid chemistry; Wiley, New York, NY, USA, 1977.
- Galli, M.; Sáringer, S.; Szilágyi, I.; Trefalt, G. A simple method to determine critical coagulation concentration from electrophoretic mobility. Colloids and Interfaces 2020, 4, 20. [Google Scholar] [CrossRef]
- Sakr, M.A.; Mohamed, M.G.; Wu, R.; Shin, S.R.; Kim, D.; Kim, K.; Siddiqua, S. Development of bentonite-gelatin nanocomposite hybrid hydrogels for tissue engineering. Applied Clay Science 2020, 199, 105860. [Google Scholar] [CrossRef]
- Muhammad, N.; Siddiqua, S. Calcium bentonite vs sodium bentonite: The potential of calcium bentonite for soil foundation. Materials Today: Proceedings 2022, 48, 822–827. [Google Scholar] [CrossRef]
Figure 1.
The double layer around a negative colloid is depicted with the charge density shown as rings around the colloid particle. The right side of each image depicts the distribution of the ions around the particle. (a.) Lower electrolyte concentration. (b.) Compressed double layer due to higher electrolyte concentration. (adapted from [37]).
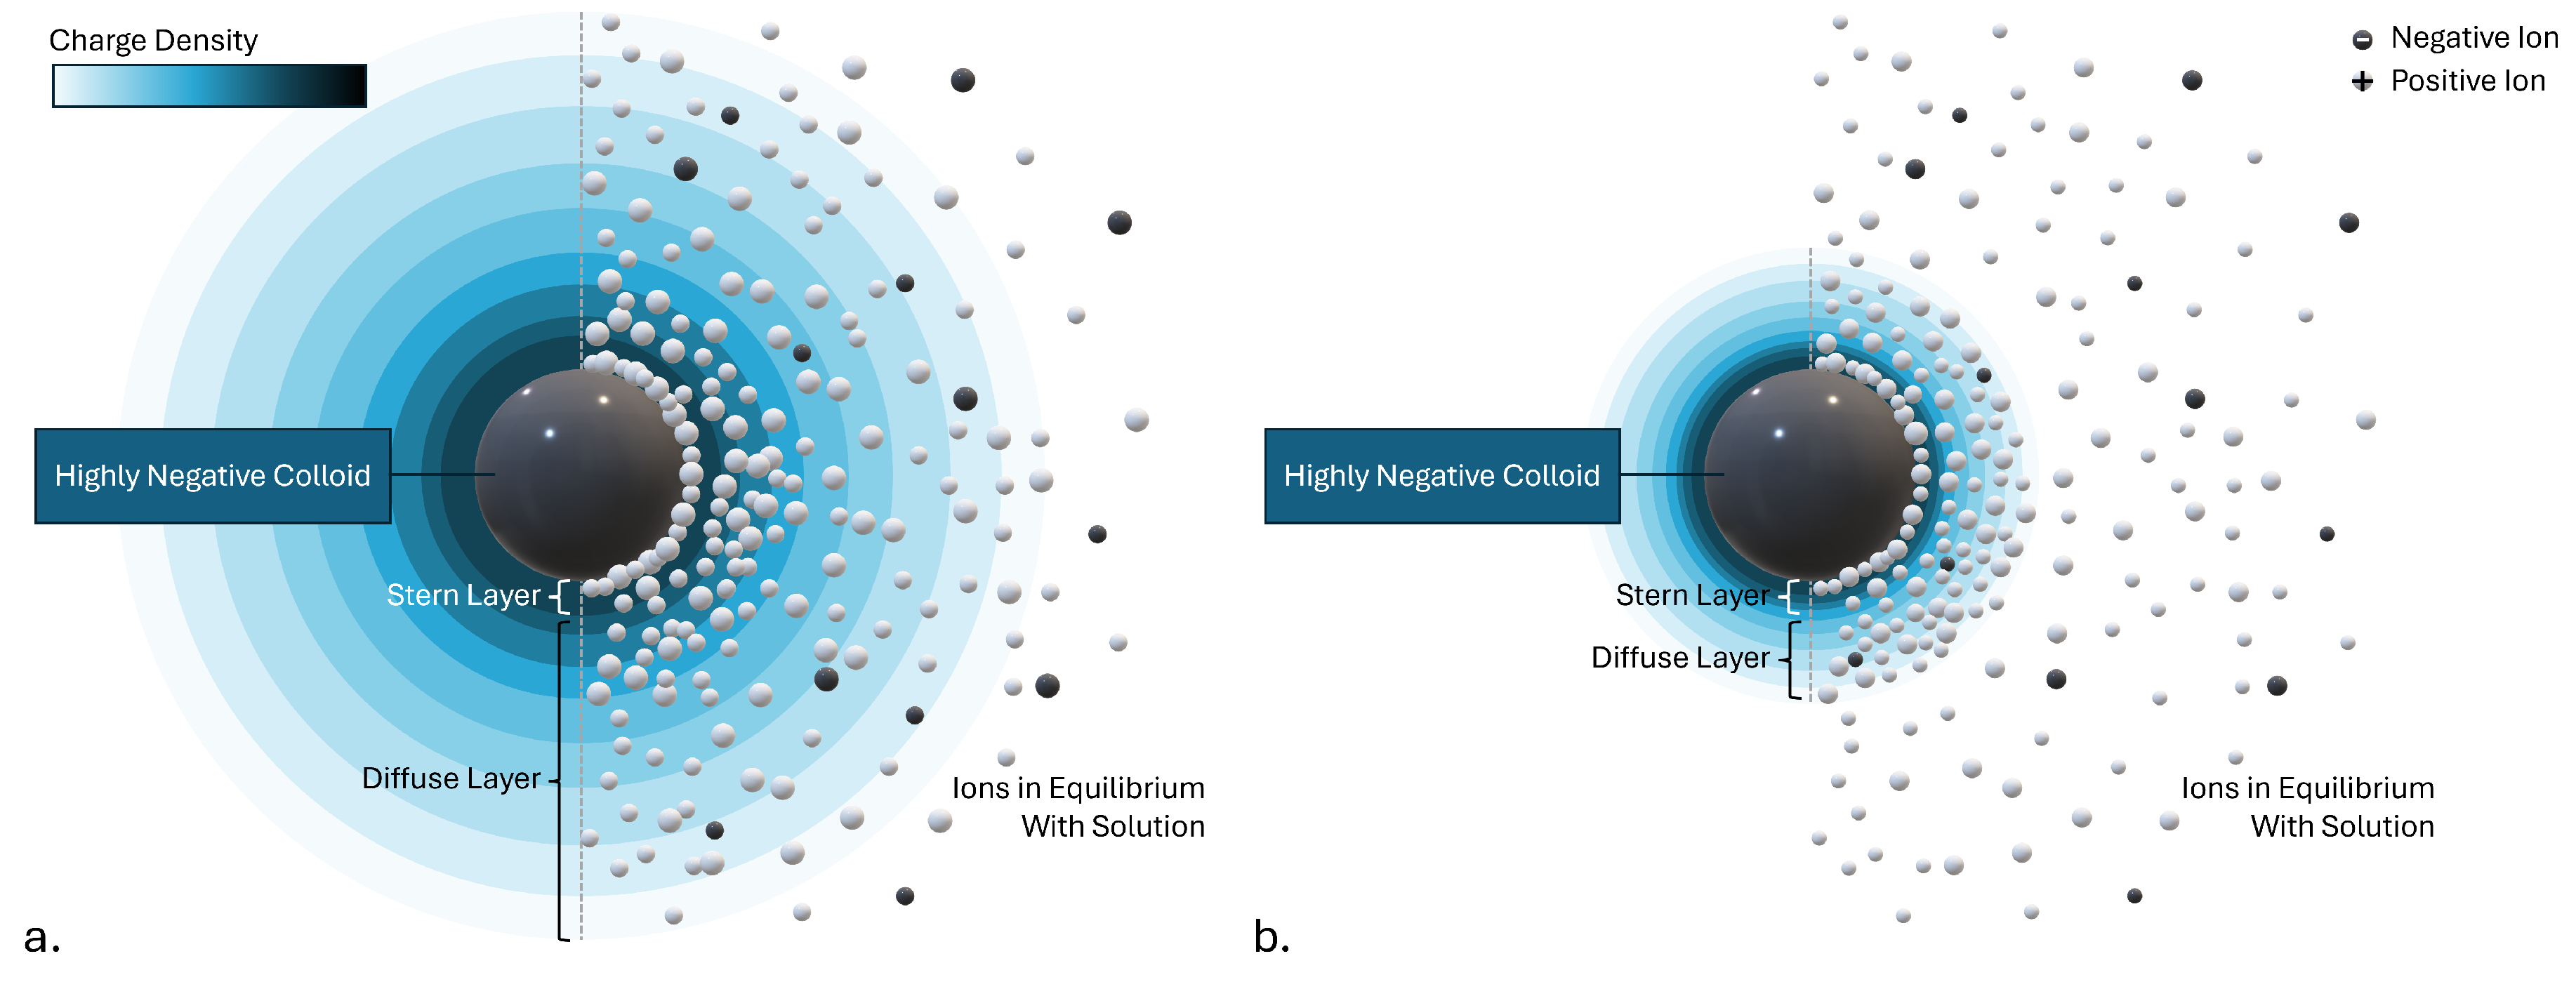
Figure 2.
Particles interactions in bentonite dispersions: red - electrical repulsion (positive); blue - Van der Waals attraction (negative); purple - net interaction (positive + negative). The solid red curve represents a suspension with a negligible electrolyte salt concentration and high energy barrier. The net interaction curves demonstrate the resulting impact of an electrolyte on the energy barrier, where initially (solid purple) there is an appreciable energy barrier to overcome but the addition of the salt compresses the double layer and reduces the range of the electrostatic repulsion (dashed red) and lowers (or eliminates) the energy barrier (dashed purple).
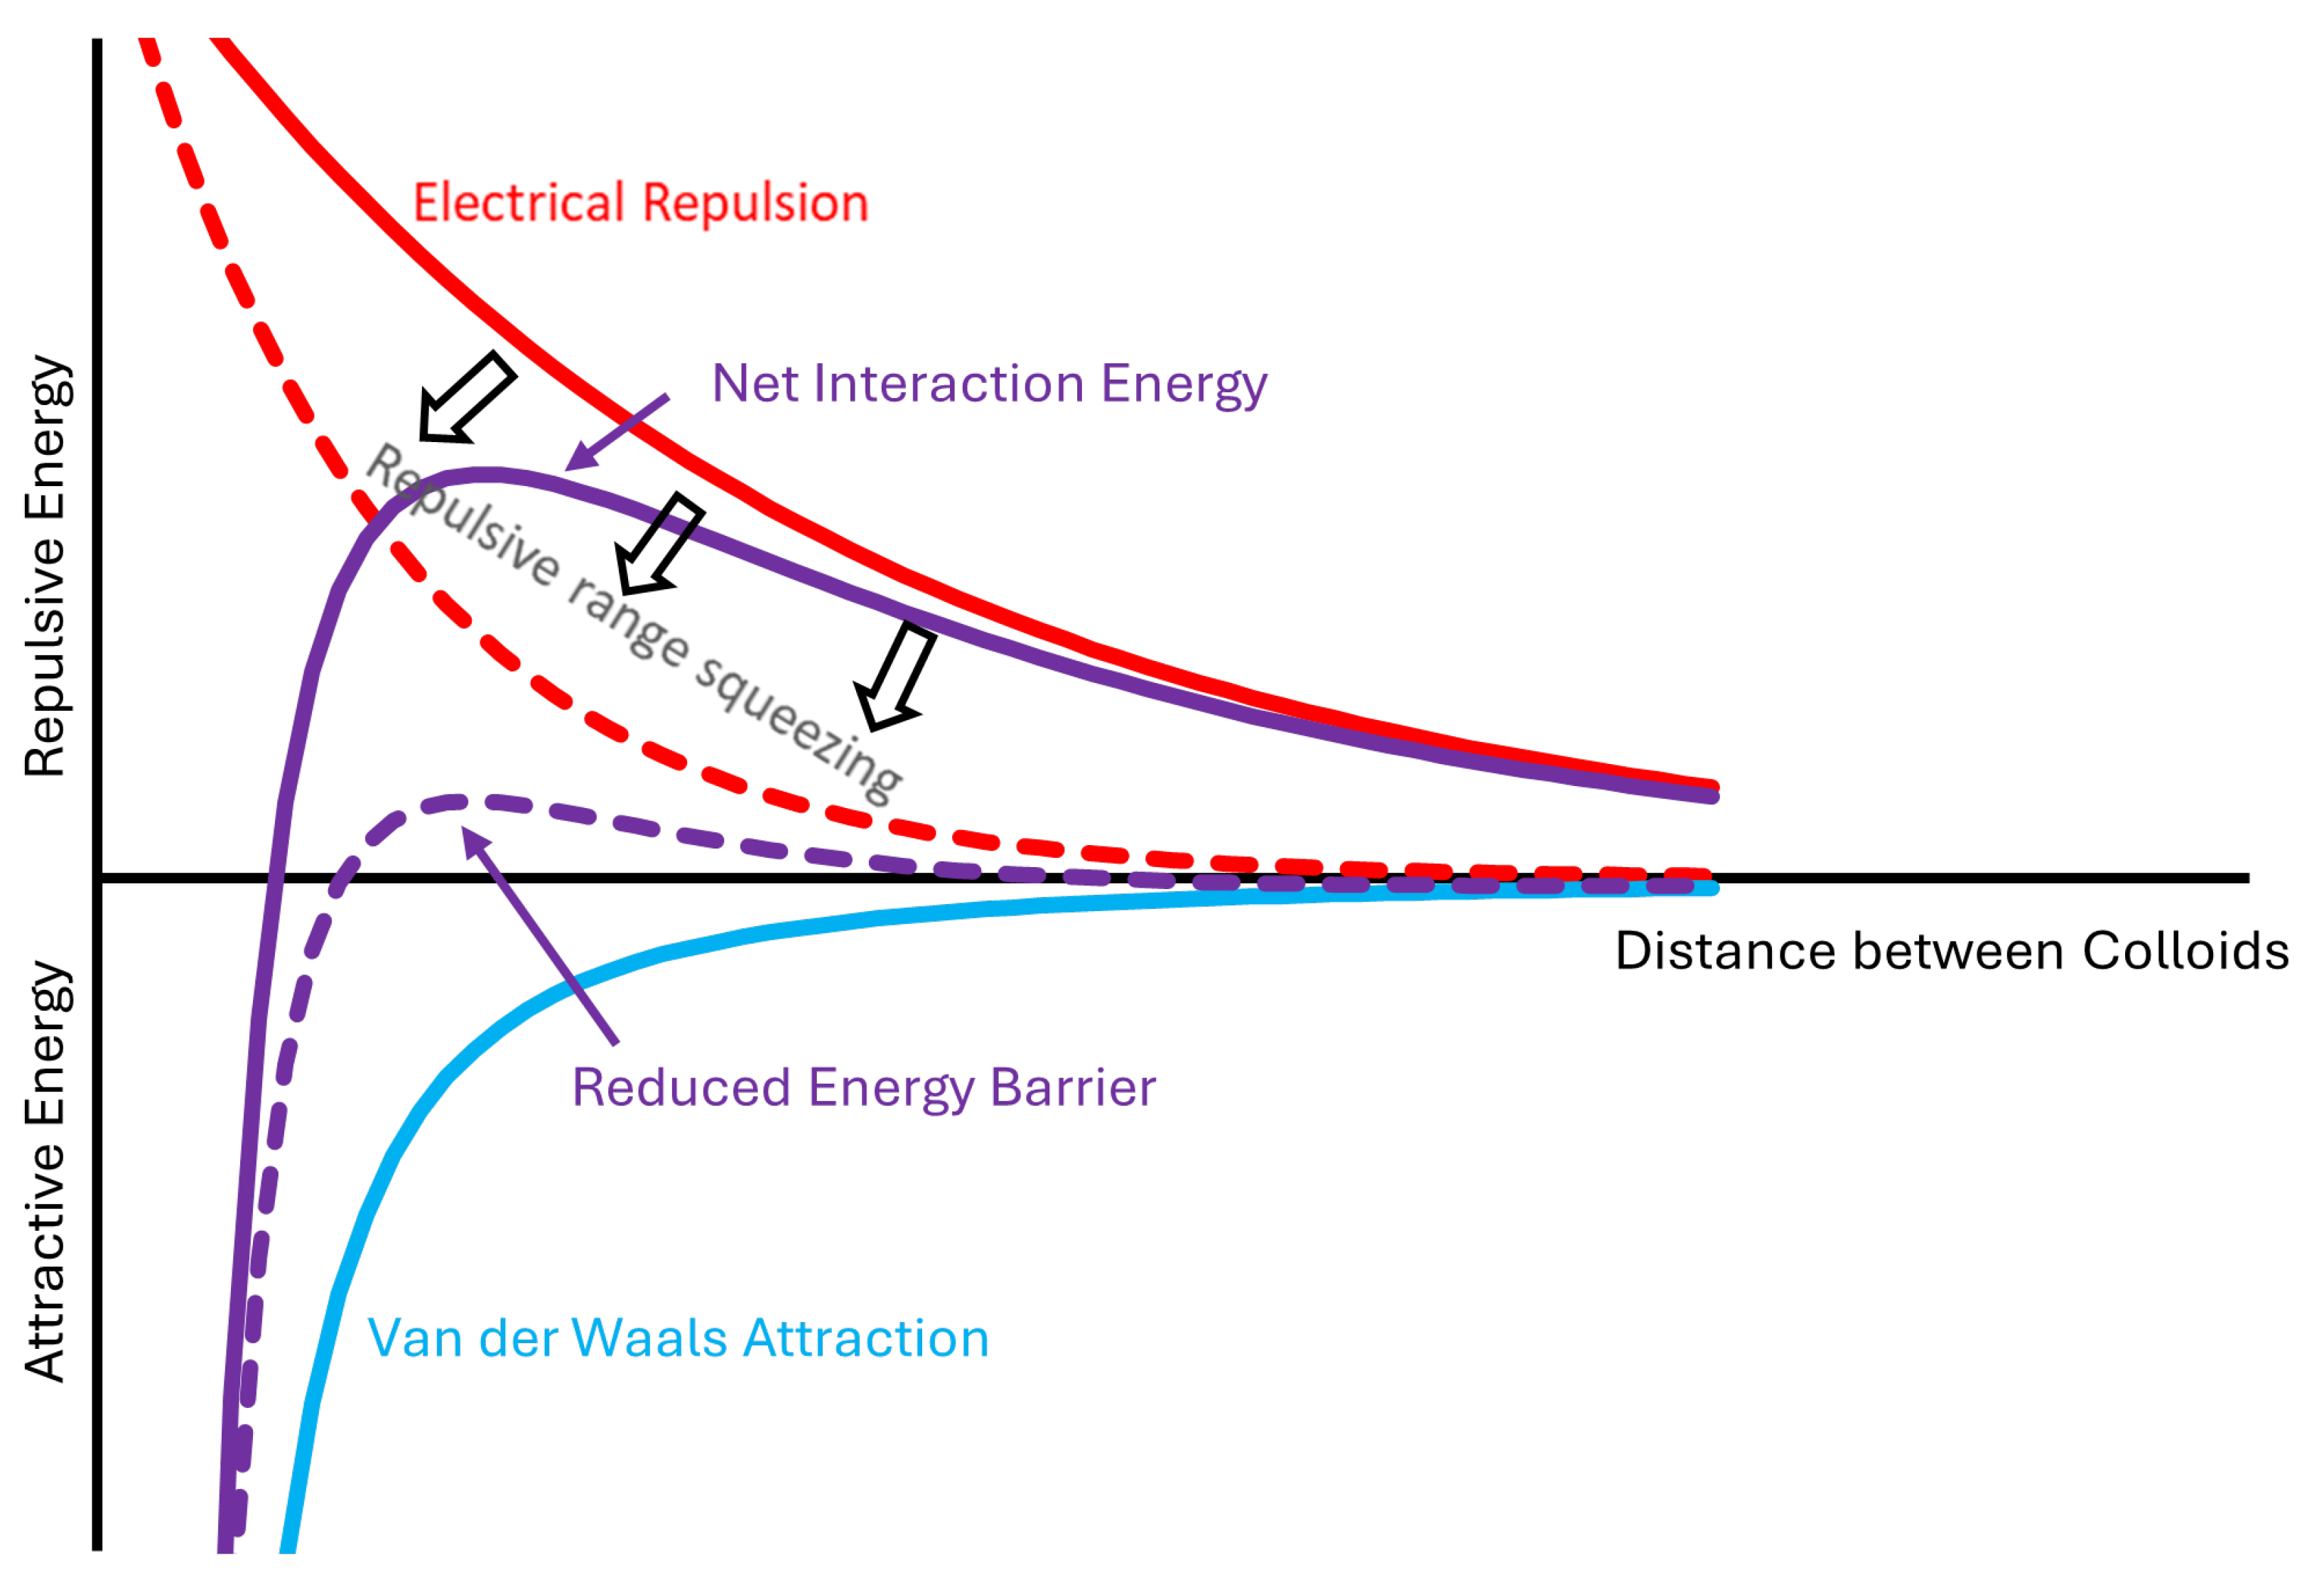
Figure 3.
Representative samples of four Wyoming sodium bentonite brands: BS, QG, BCA, and VC.
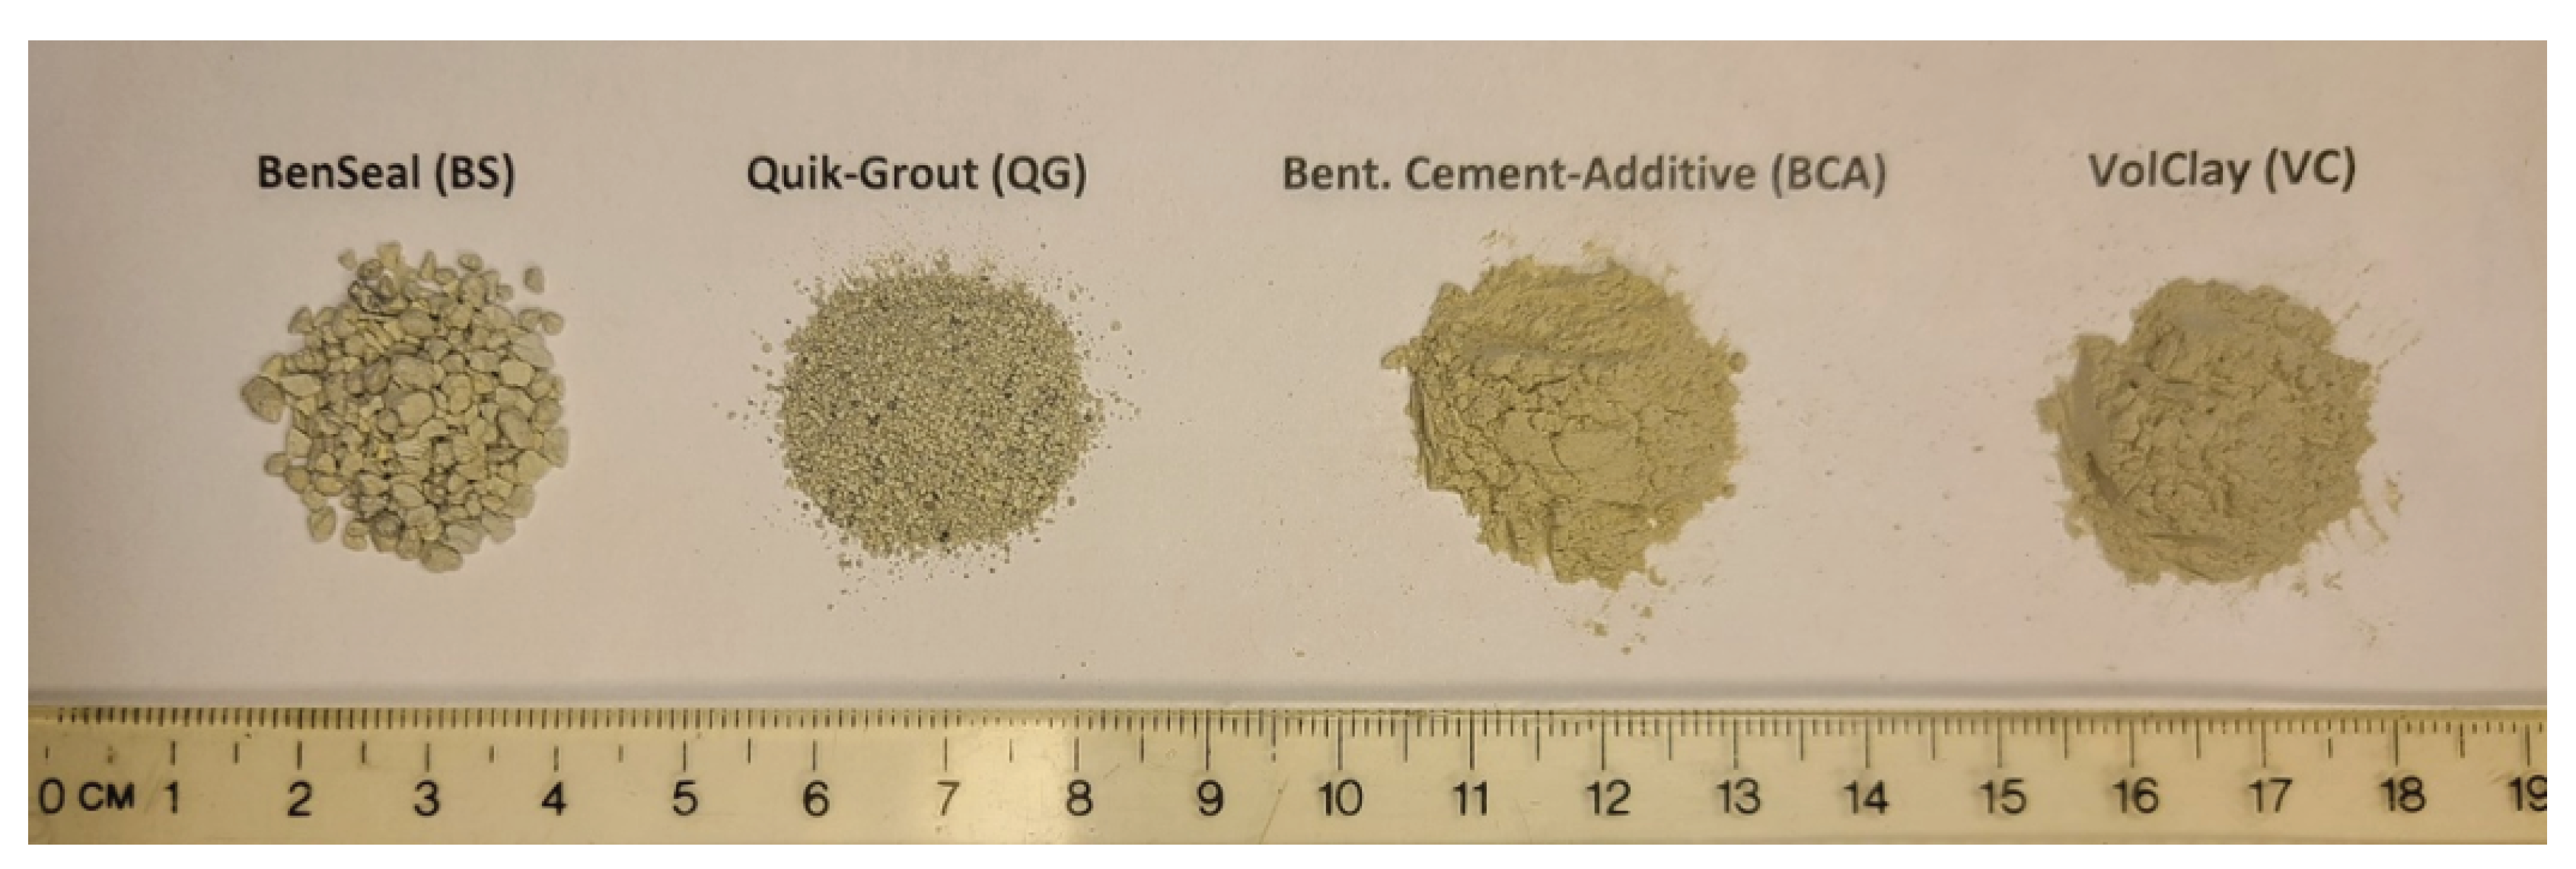
Figure 4.
Multimixer from Sterling Multi Products, Inc., model 9B5CH1 used to generate bentonite mixtures.
Figure 4.
Multimixer from Sterling Multi Products, Inc., model 9B5CH1 used to generate bentonite mixtures.
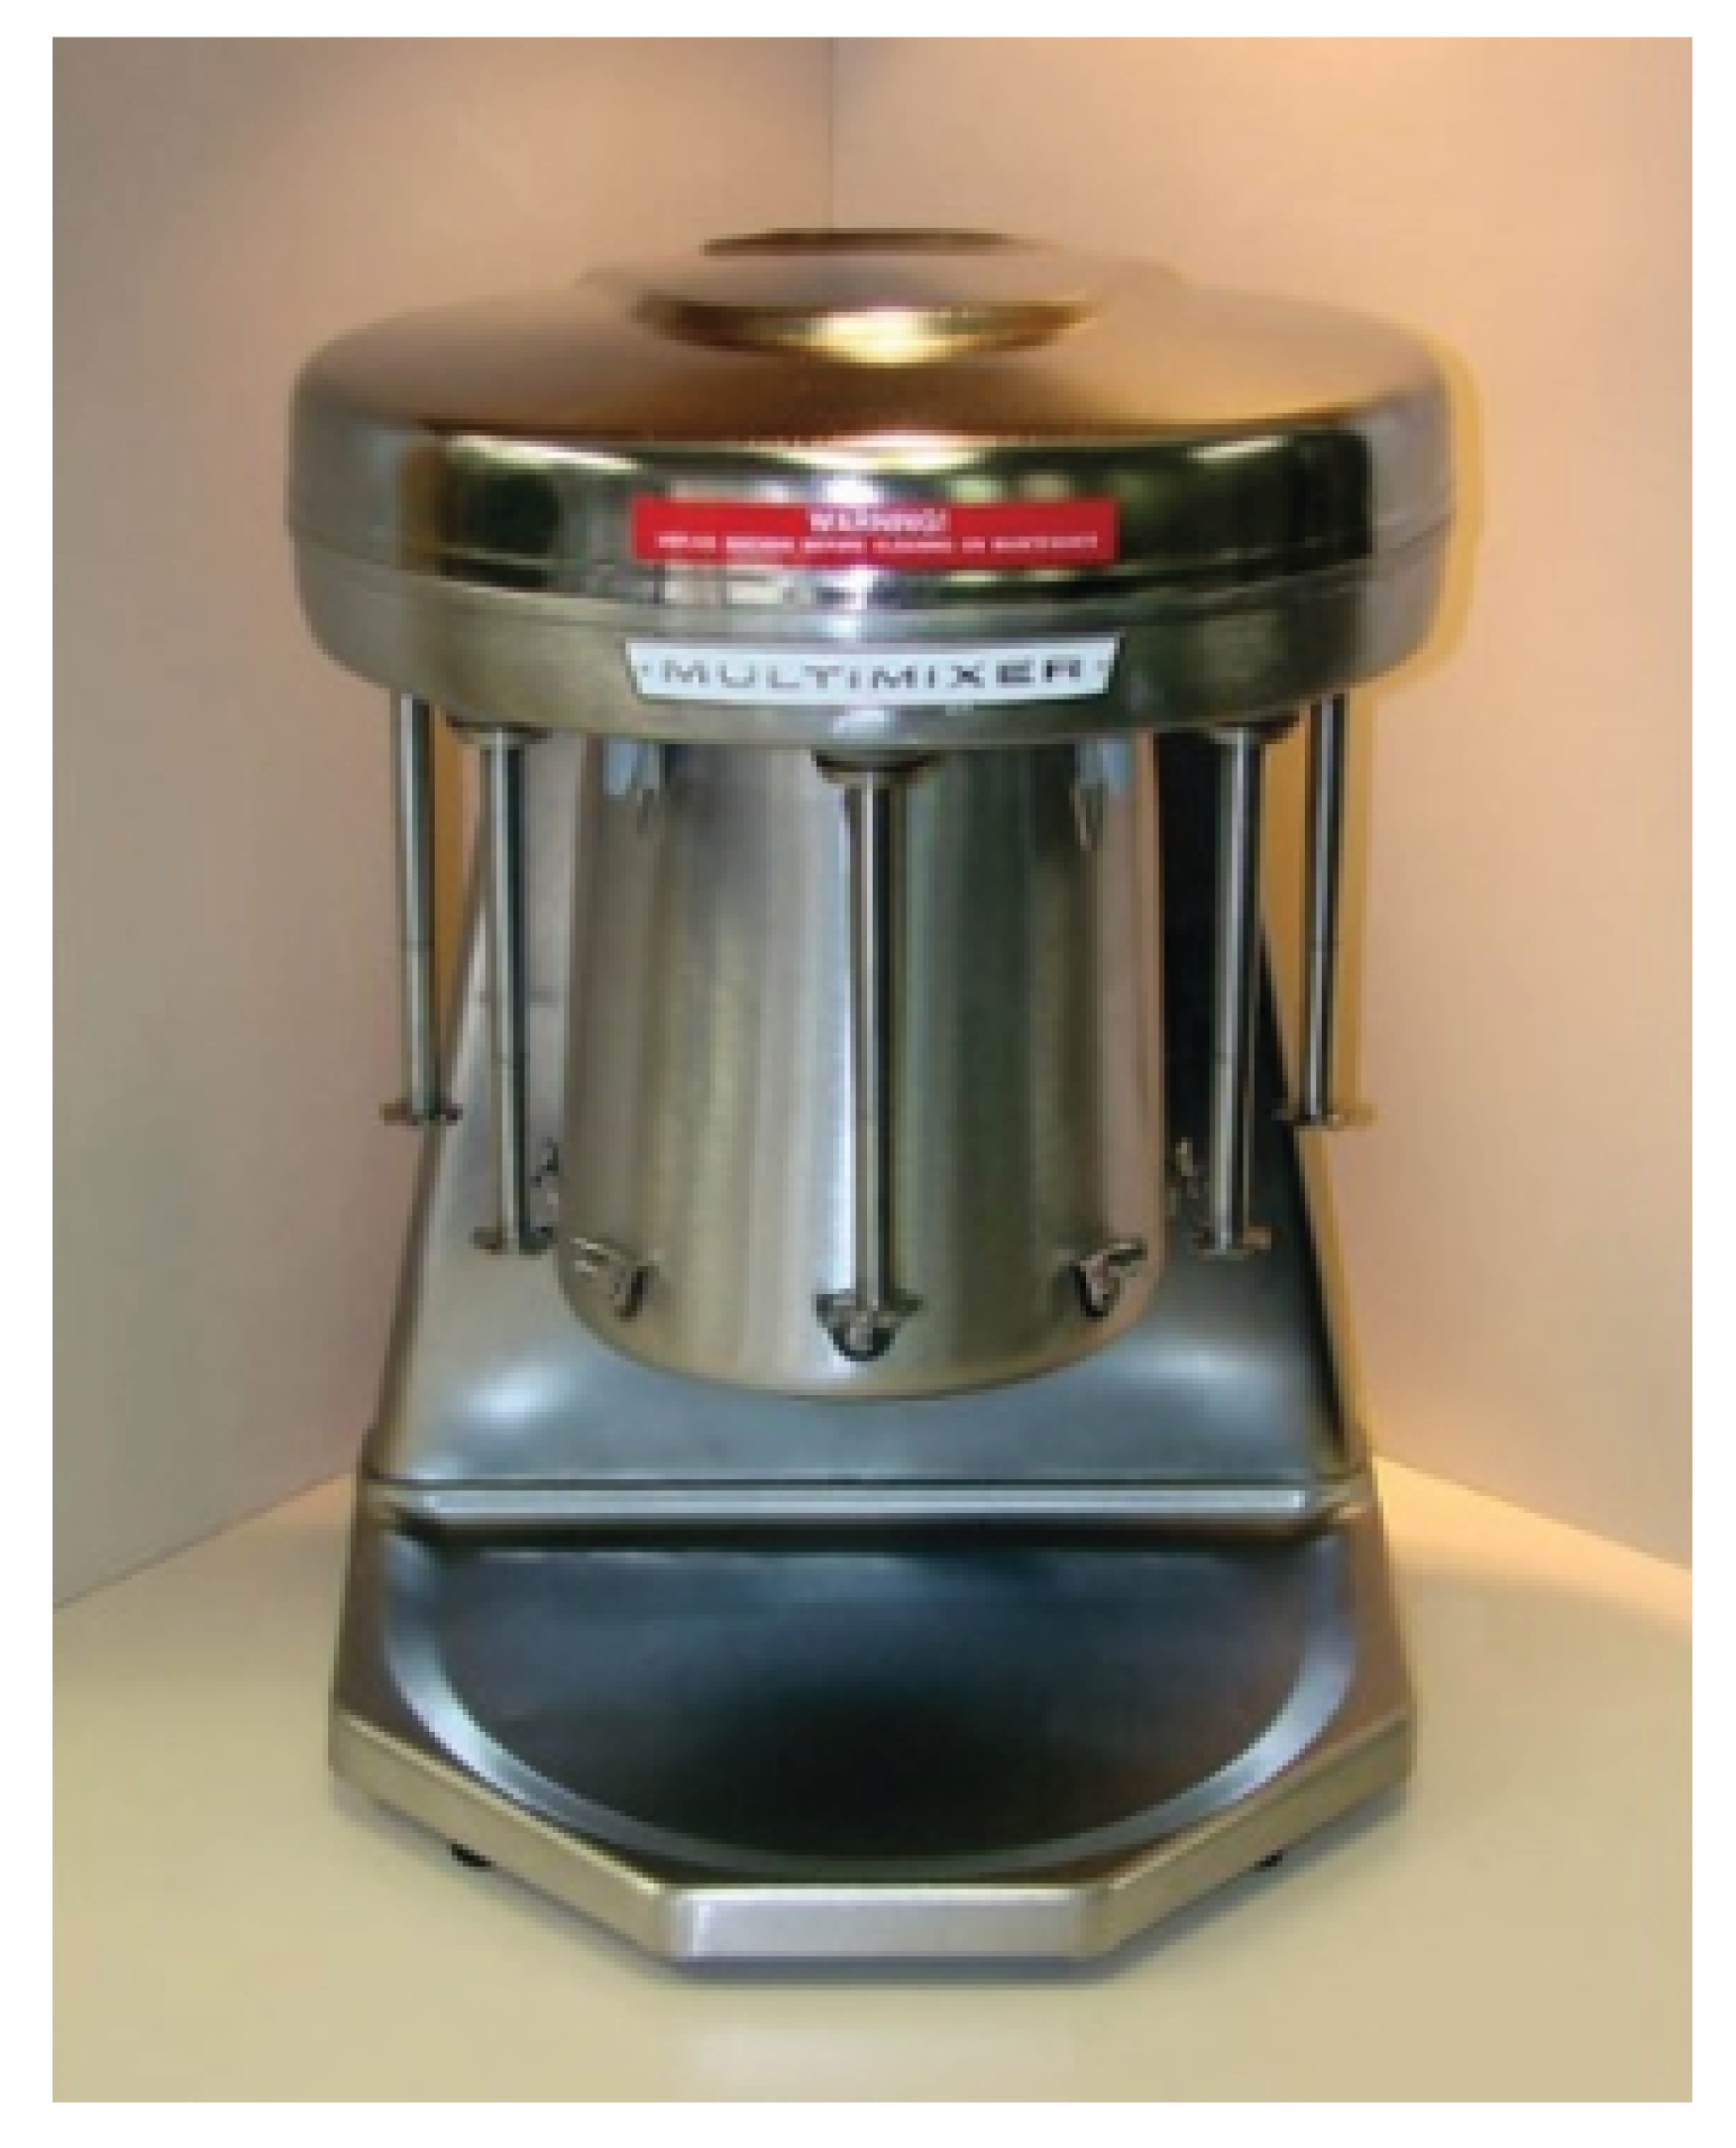
Figure 5.
QG dispersed in , and 12 g CaCl per liter of distilled water. Picture was taken after a constant degree of dispersion was achieved at the infinite time limit.
Figure 5.
QG dispersed in , and 12 g CaCl per liter of distilled water. Picture was taken after a constant degree of dispersion was achieved at the infinite time limit.
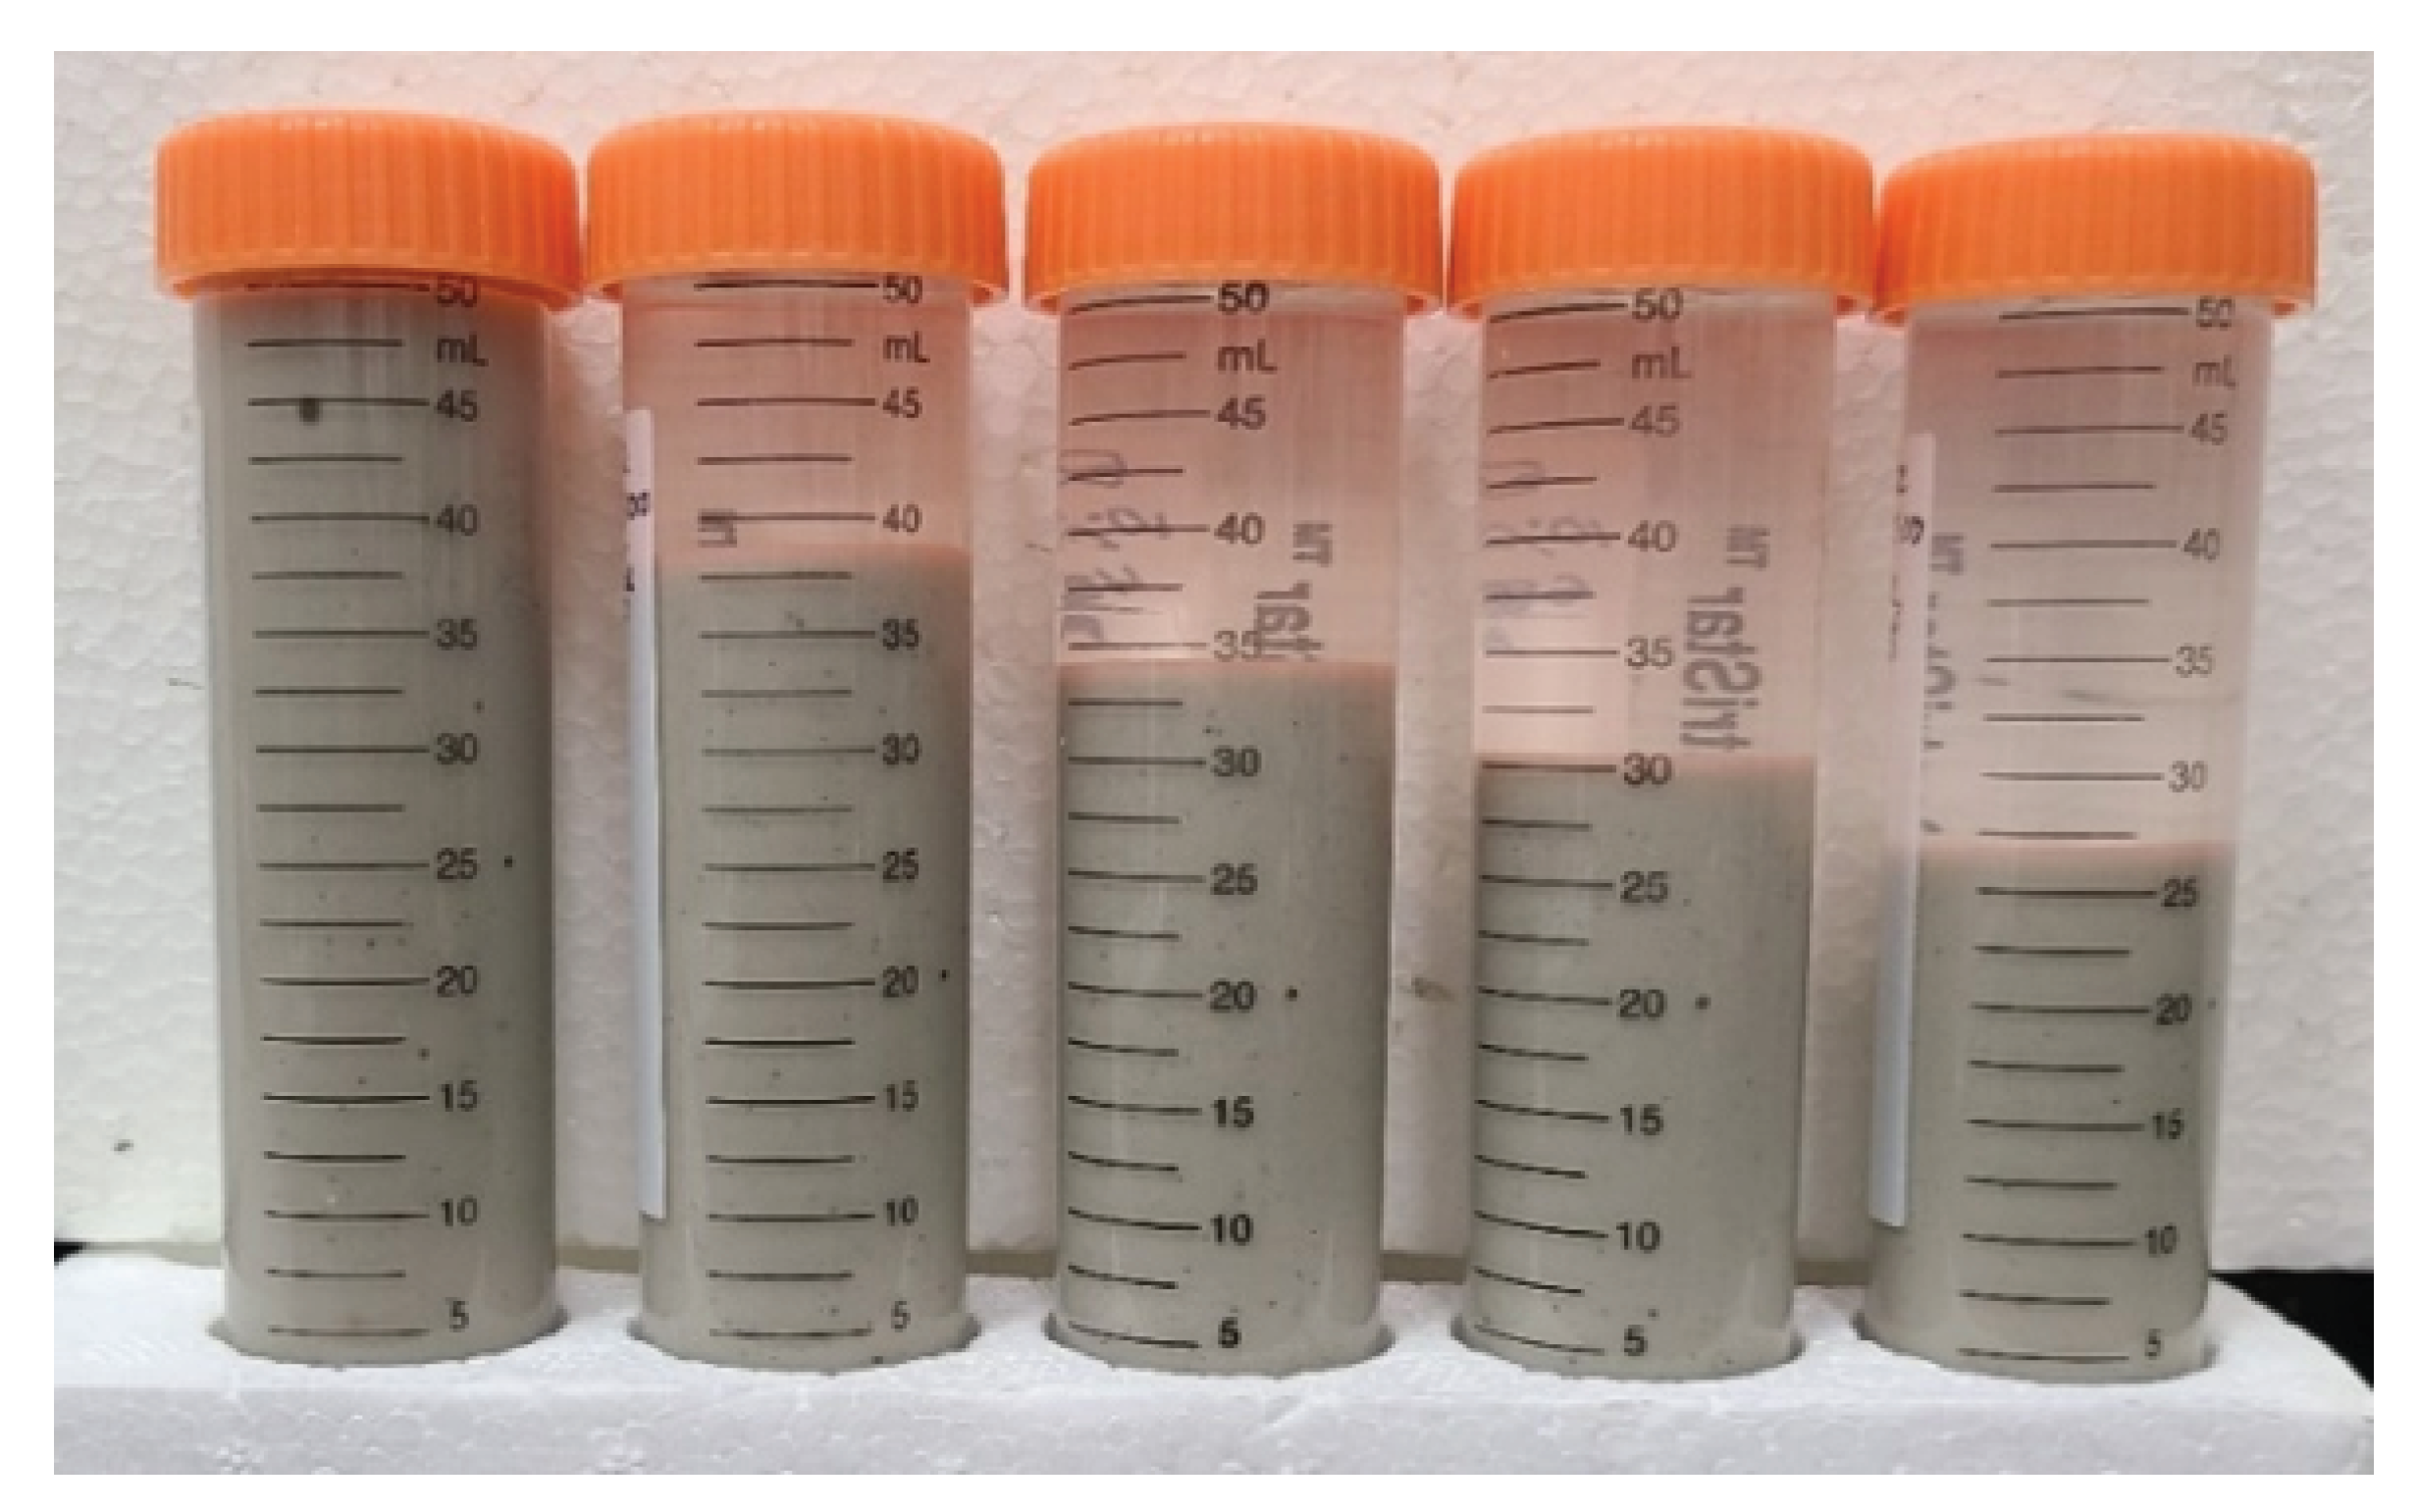
Figure 6.
Sedimentation of BS (at concentrations of 4, 6, 8, and by mass) dispersions. Parameters affecting sedimentation are bentonite concentrations (% by mass) and NaCl concentration (grams per kg of HO).
Figure 6.
Sedimentation of BS (at concentrations of 4, 6, 8, and by mass) dispersions. Parameters affecting sedimentation are bentonite concentrations (% by mass) and NaCl concentration (grams per kg of HO).
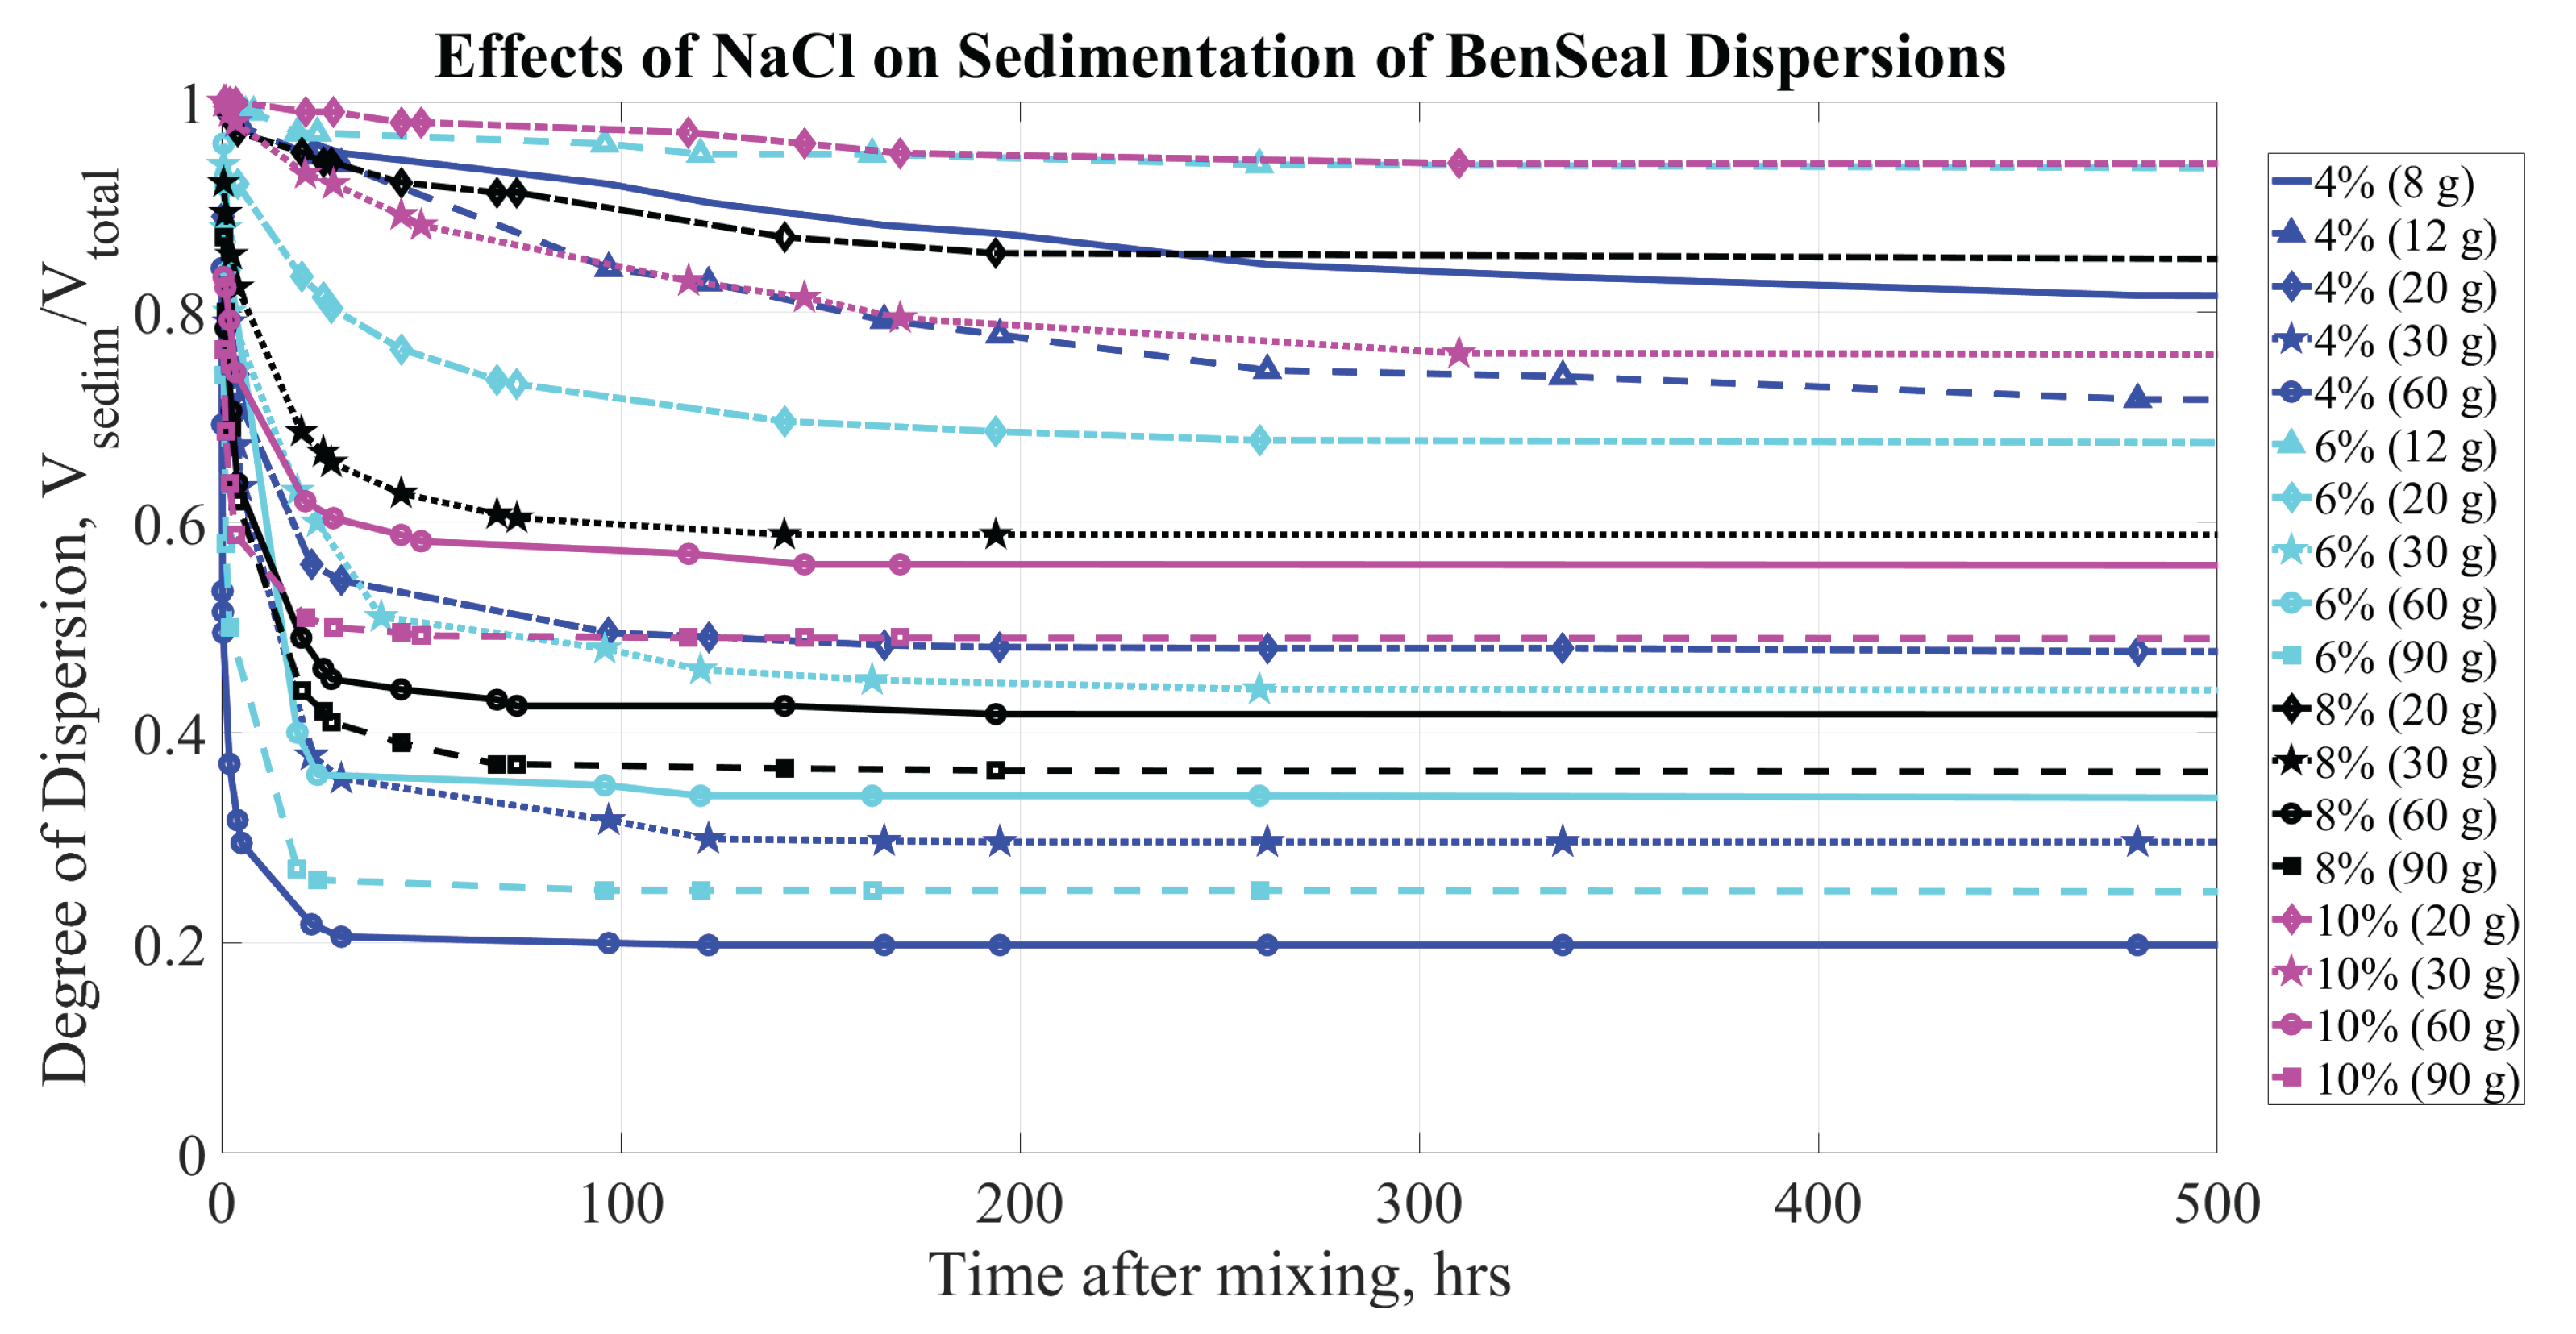
Figure 7.
Sedimentation of BS (at concentrations of 4, 6, 8, and by mass) dispersions. Parameters affecting sedimentation are bentonite concentrations (% by mass) and CaCl concentration (grams per kg of HO).
Figure 7.
Sedimentation of BS (at concentrations of 4, 6, 8, and by mass) dispersions. Parameters affecting sedimentation are bentonite concentrations (% by mass) and CaCl concentration (grams per kg of HO).
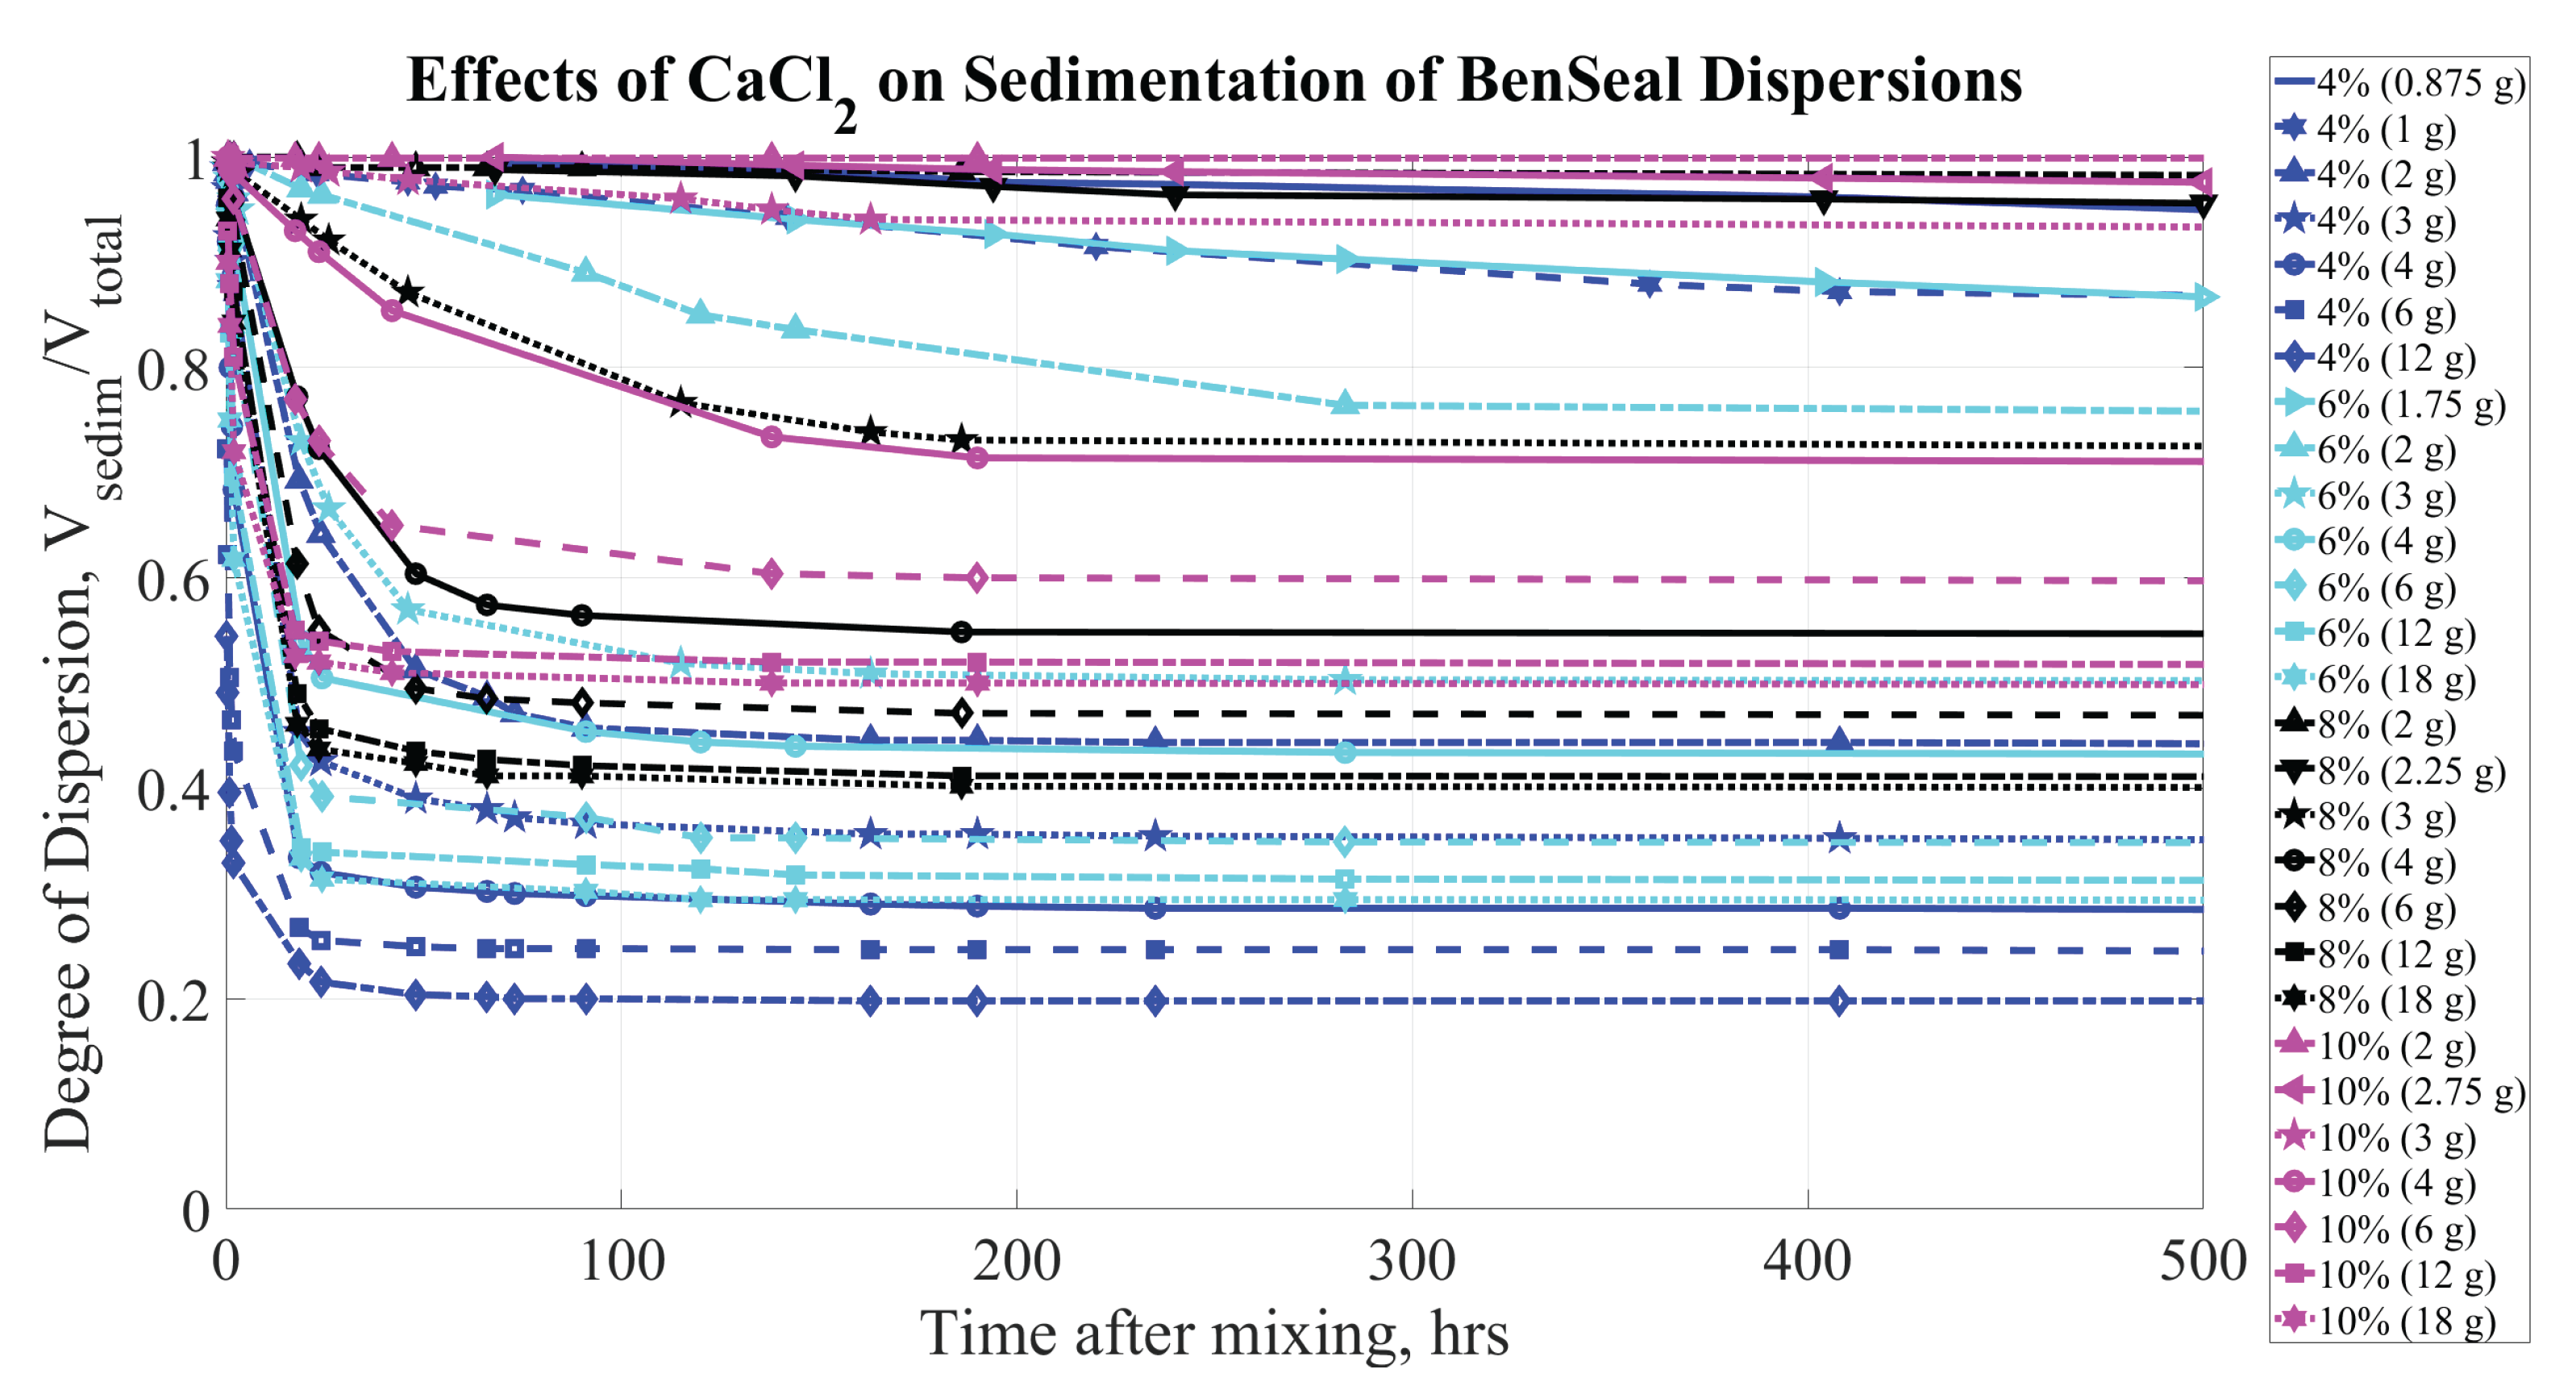
Figure 8.
Sedimentation of QG (at concentrations of 4, 6, 8, and by mass) dispersions. Parameters affecting sedimentation are bentonite concentrations (% by mass) and CaCl concentration (grams per kg of HO)
Figure 8.
Sedimentation of QG (at concentrations of 4, 6, 8, and by mass) dispersions. Parameters affecting sedimentation are bentonite concentrations (% by mass) and CaCl concentration (grams per kg of HO)
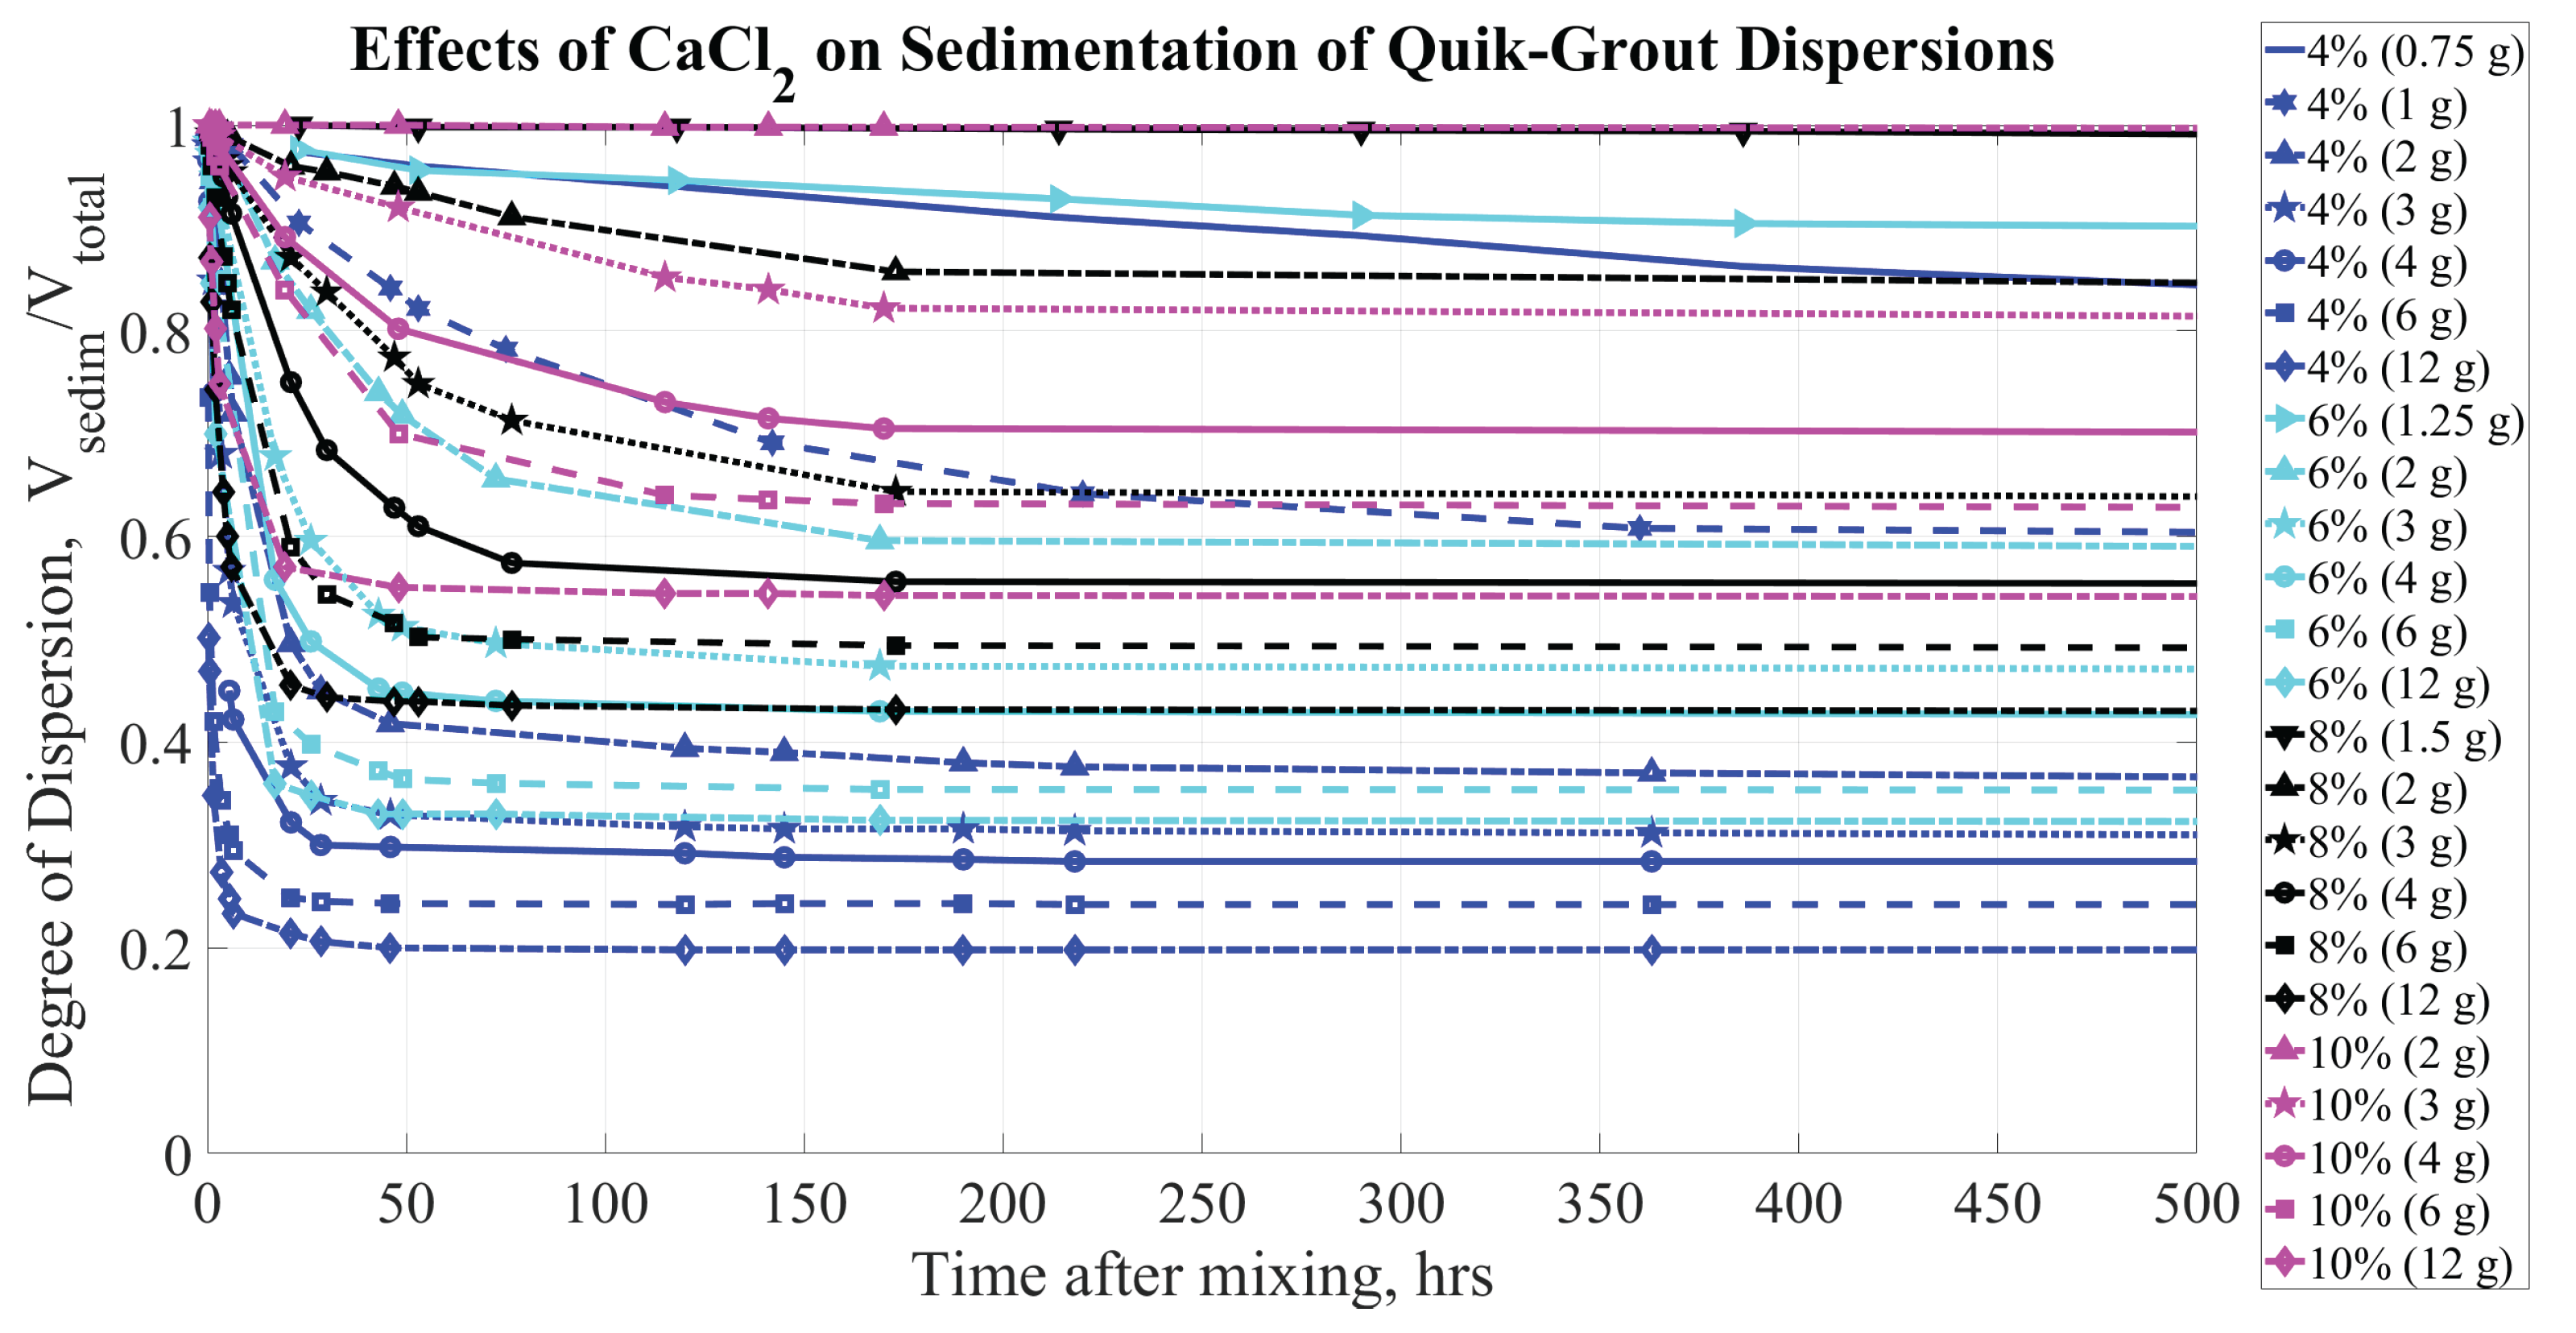
Figure 9.
Sedimentation of BCA (at concentrations of 4, 6, 8, and by mass) dispersions. Parameters affecting sedimentation are bentonite concentrations (% by mass) and CaCl concentration (grams per kg of HO).
Figure 9.
Sedimentation of BCA (at concentrations of 4, 6, 8, and by mass) dispersions. Parameters affecting sedimentation are bentonite concentrations (% by mass) and CaCl concentration (grams per kg of HO).
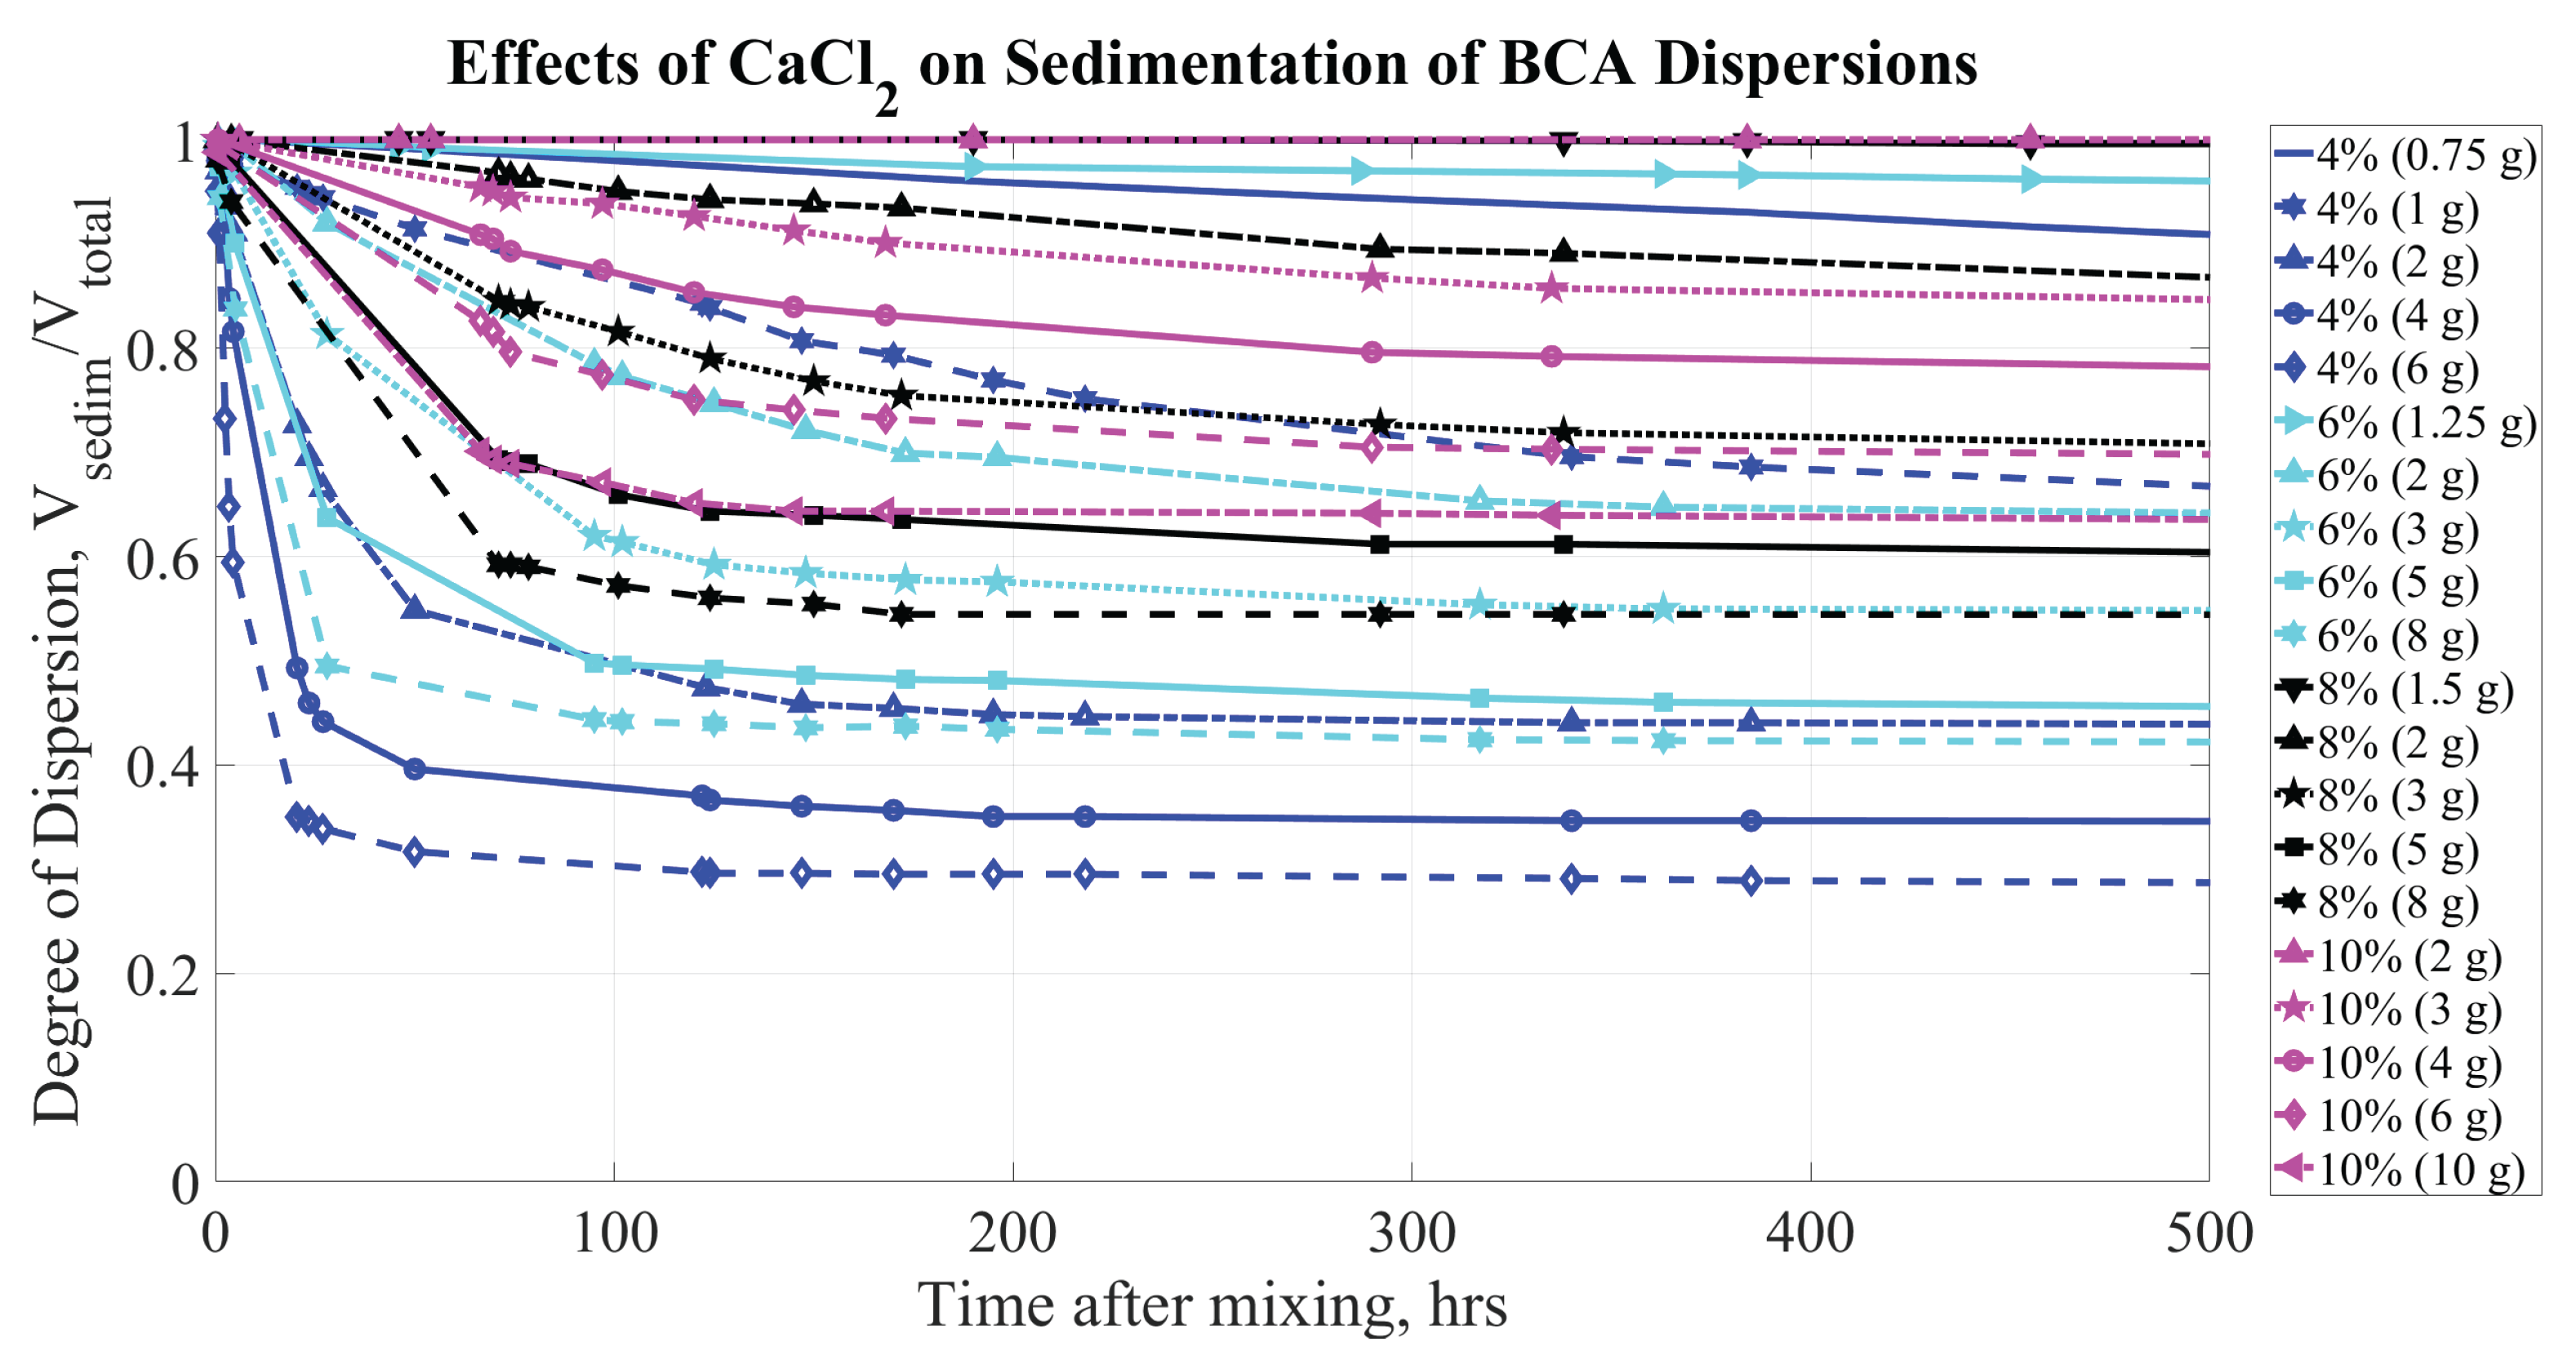
Figure 10.
Sedimentation of VC (at concentrations of 4, 6, 8, and by mass) dispersions. Parameters affecting sedimentation are bentonite concentrations (% by mass) and CaCl concentration (grams per kg of HO).
Figure 10.
Sedimentation of VC (at concentrations of 4, 6, 8, and by mass) dispersions. Parameters affecting sedimentation are bentonite concentrations (% by mass) and CaCl concentration (grams per kg of HO).
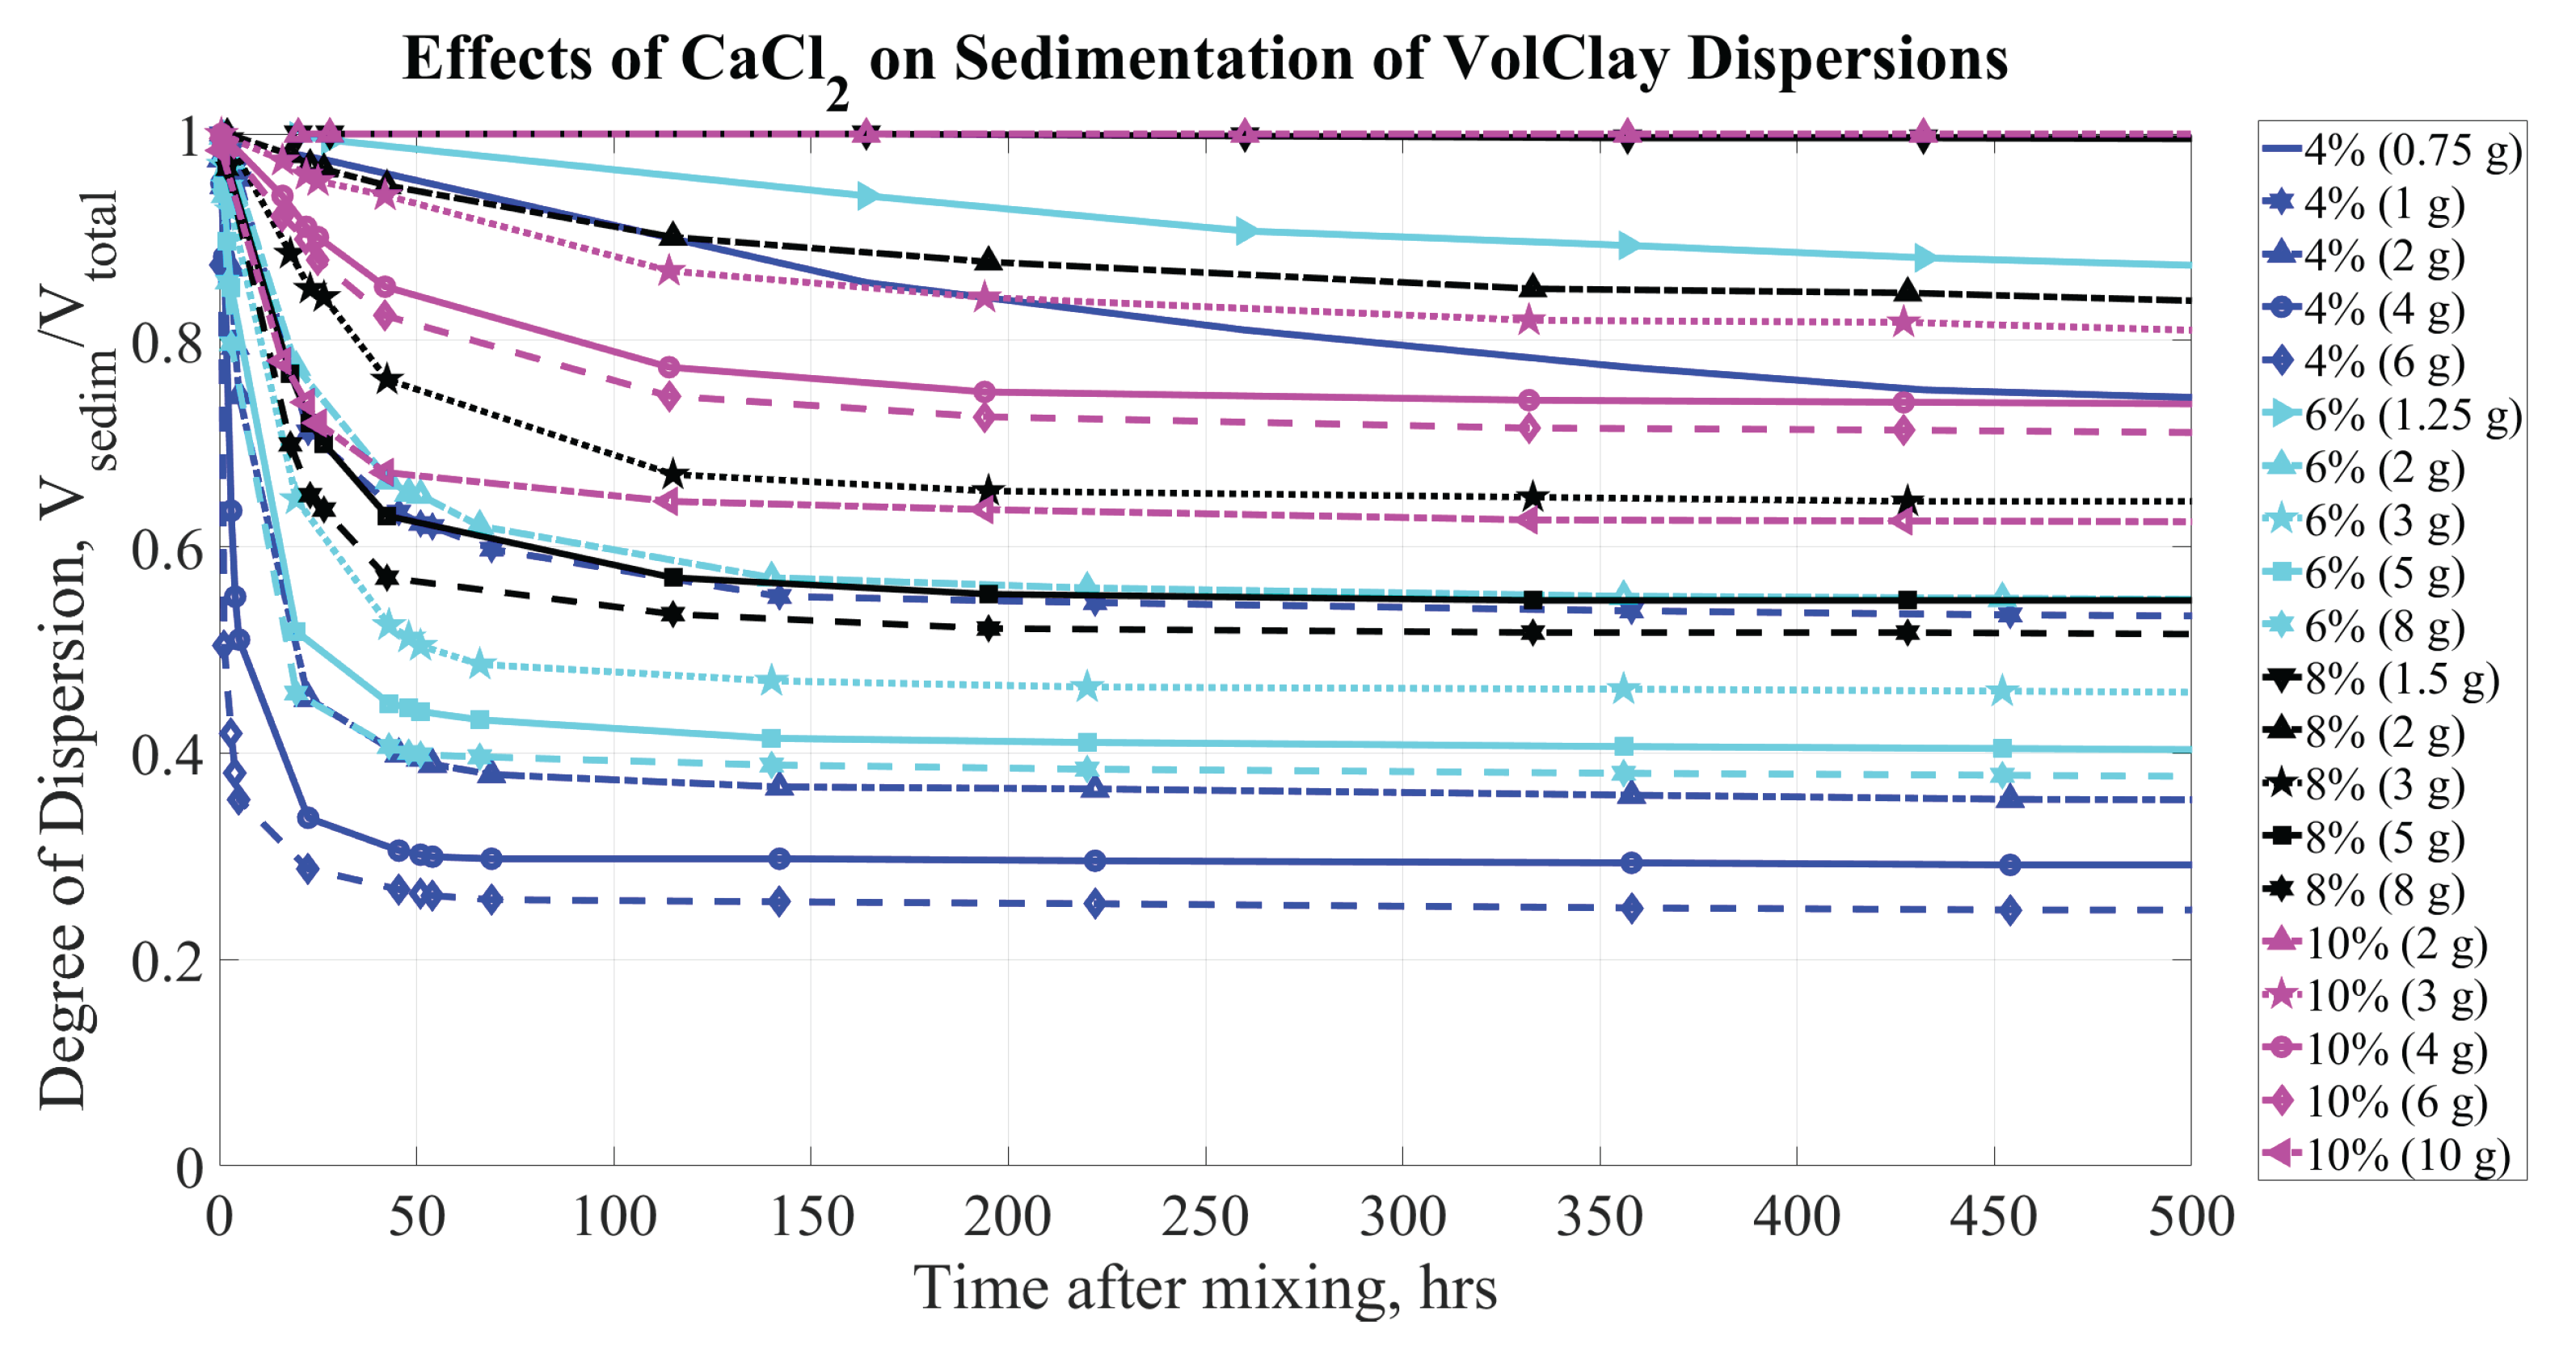
Figure 11.
Degree of dispersion for the BS brand of bentonite mixtures as a function of NaCl and CaCl concentration at steady state (infinite time limit).
Figure 11.
Degree of dispersion for the BS brand of bentonite mixtures as a function of NaCl and CaCl concentration at steady state (infinite time limit).
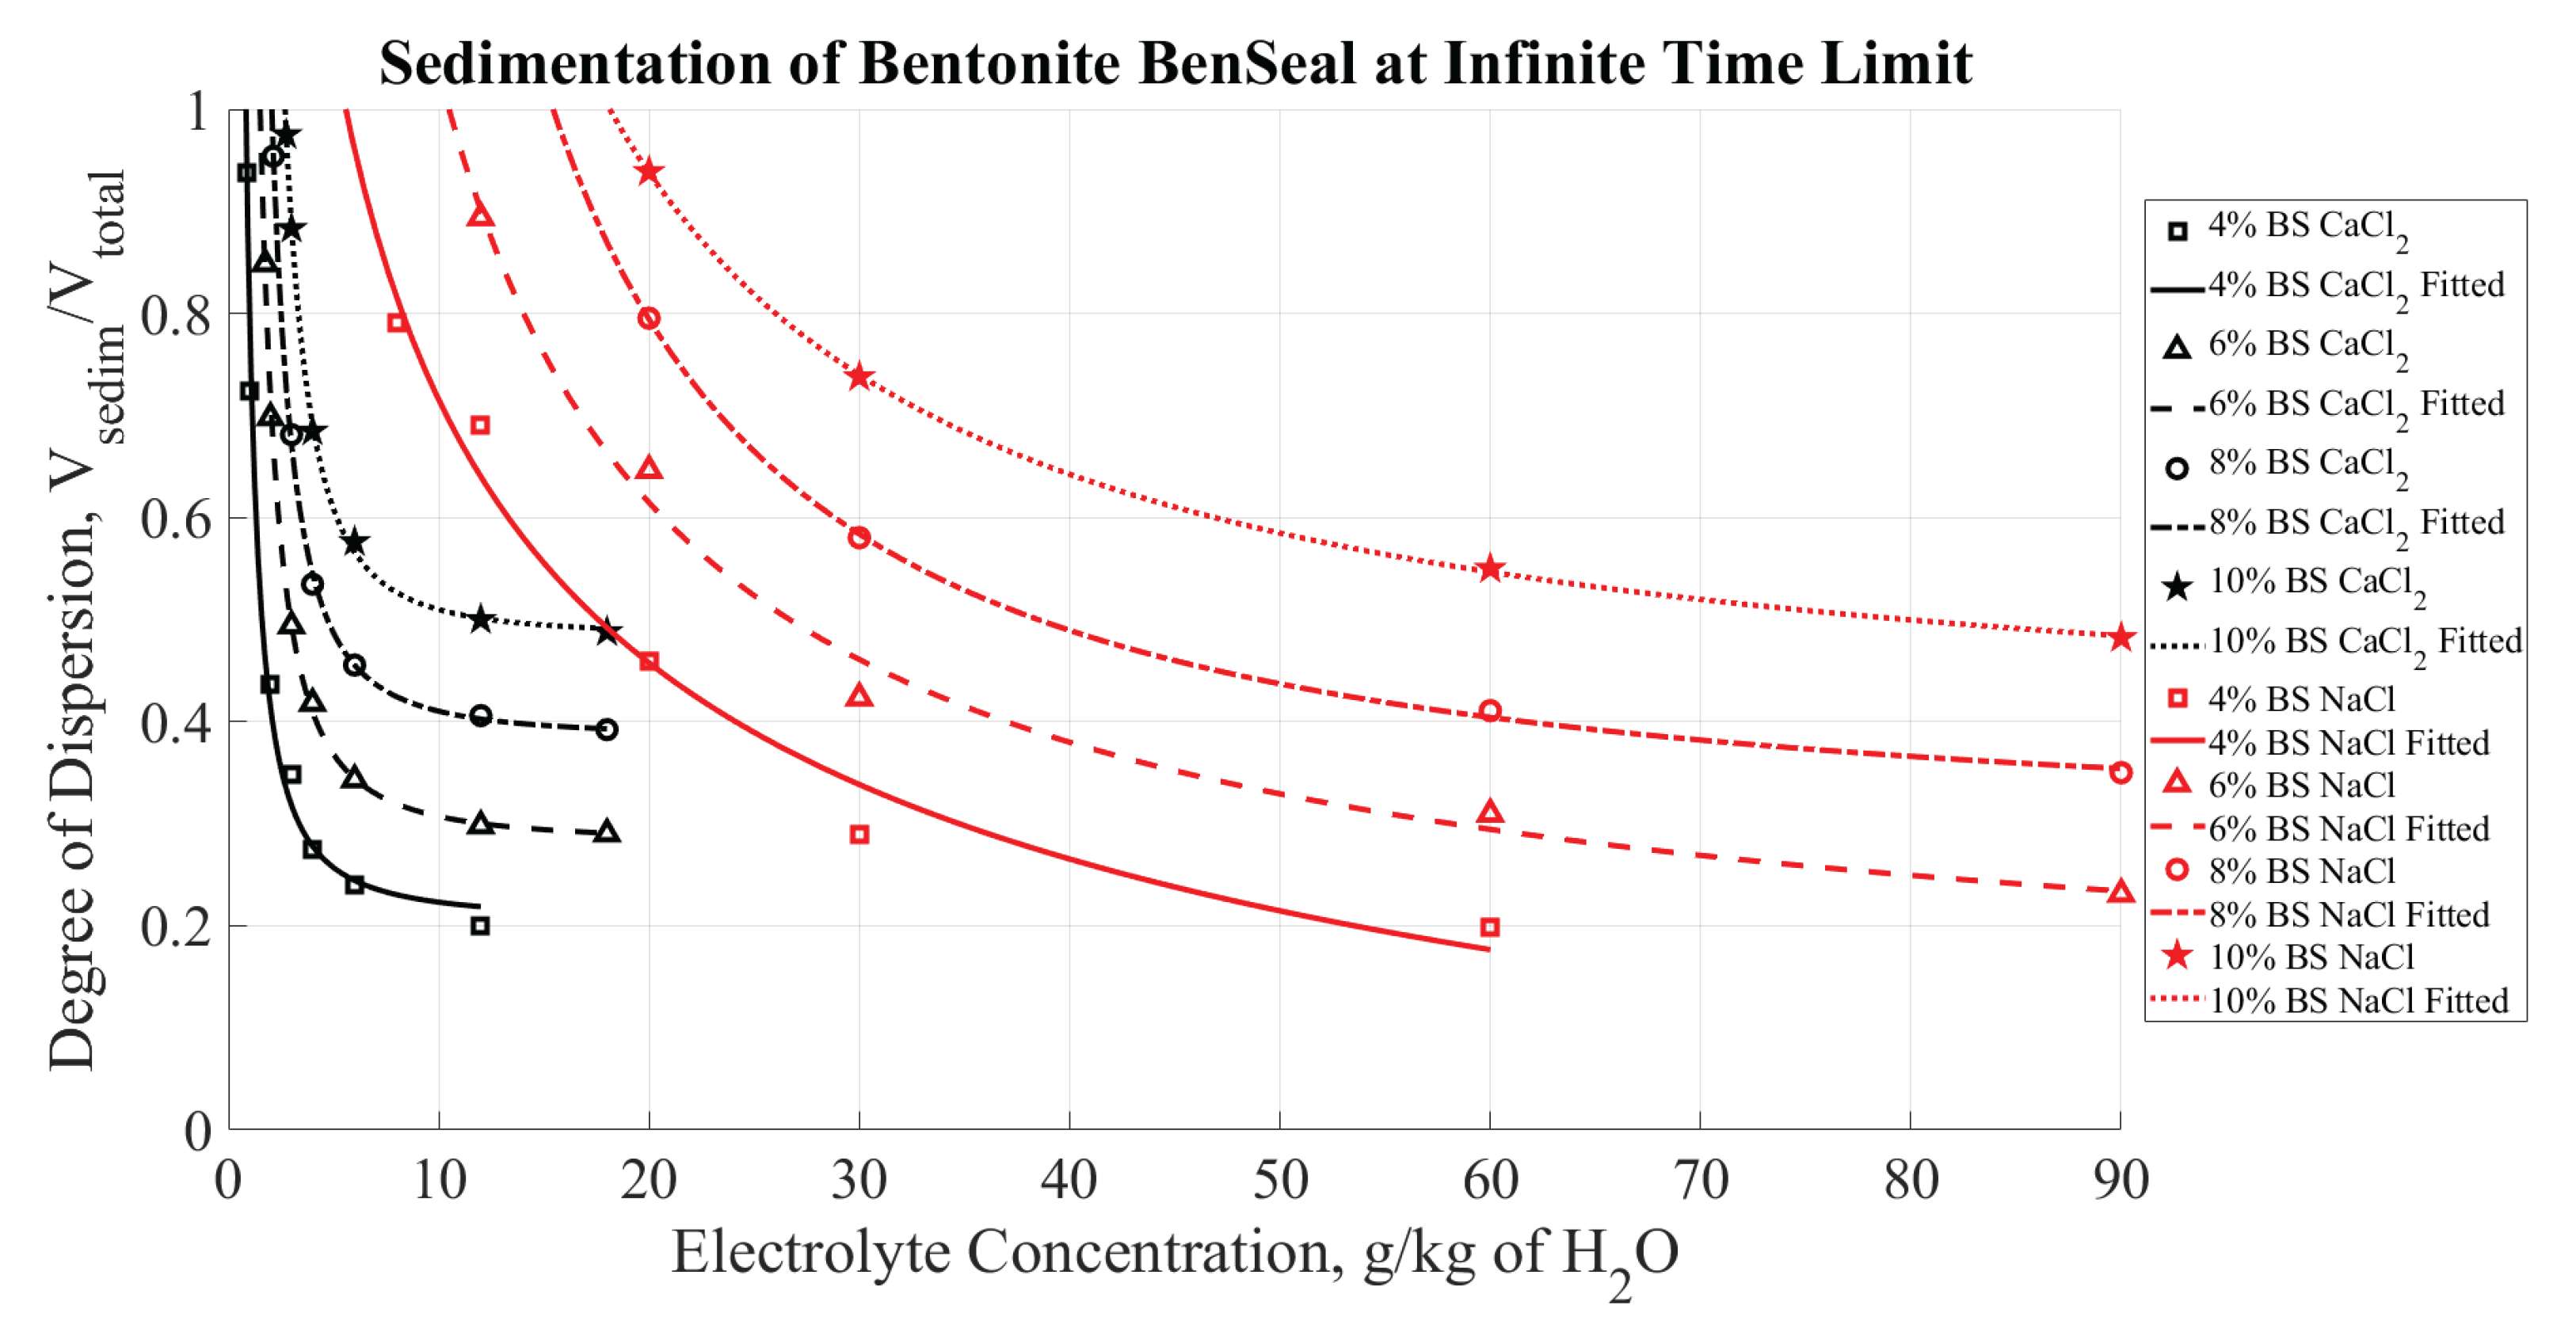
Figure 12.
Degree of dispersion for four bentonite brands (color coded) as a function of CaCl concentration at steady state (infinite time limit).
Figure 12.
Degree of dispersion for four bentonite brands (color coded) as a function of CaCl concentration at steady state (infinite time limit).
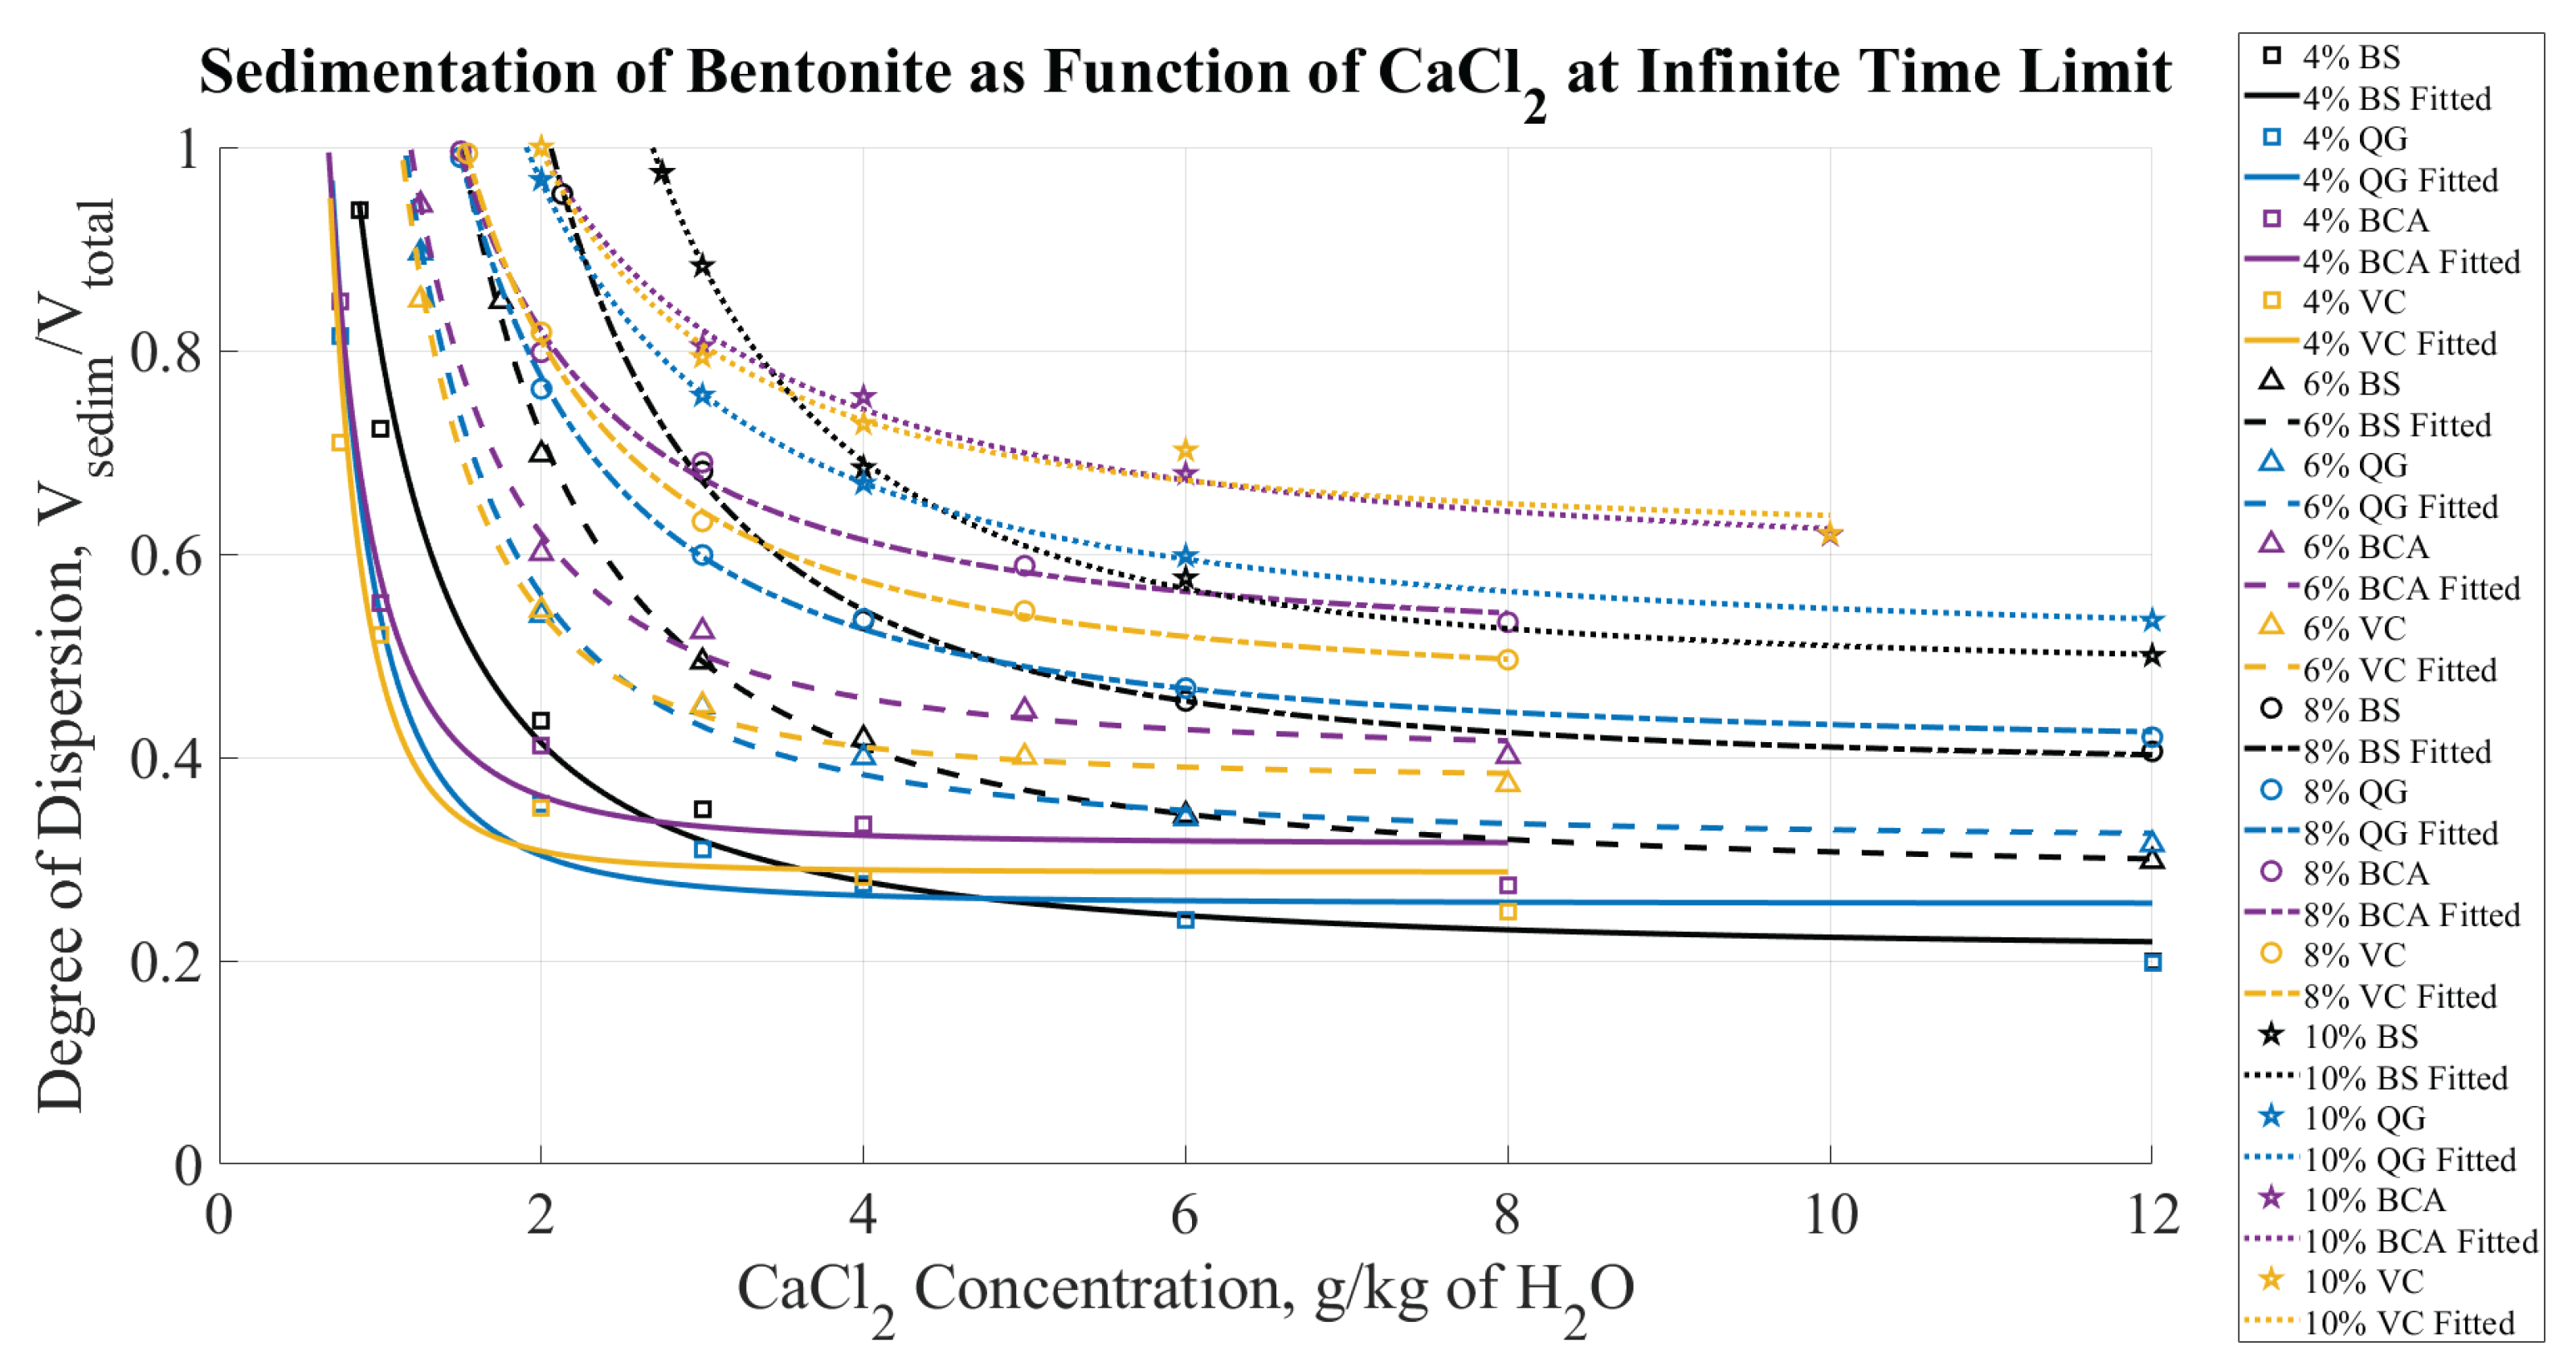
Figure 13.
The CCC of CaCl as a function of the bentonite concentration (i.e., solid content) shown for all bentonite mixtures tested. The markers indicate the CCC and fitted lines indicate the minimum amount of CaCl that would destabilize the bentonite mixtures. The areas above each of the fitted lines correspond to the unstable dispersion for the respective bentonite brand.
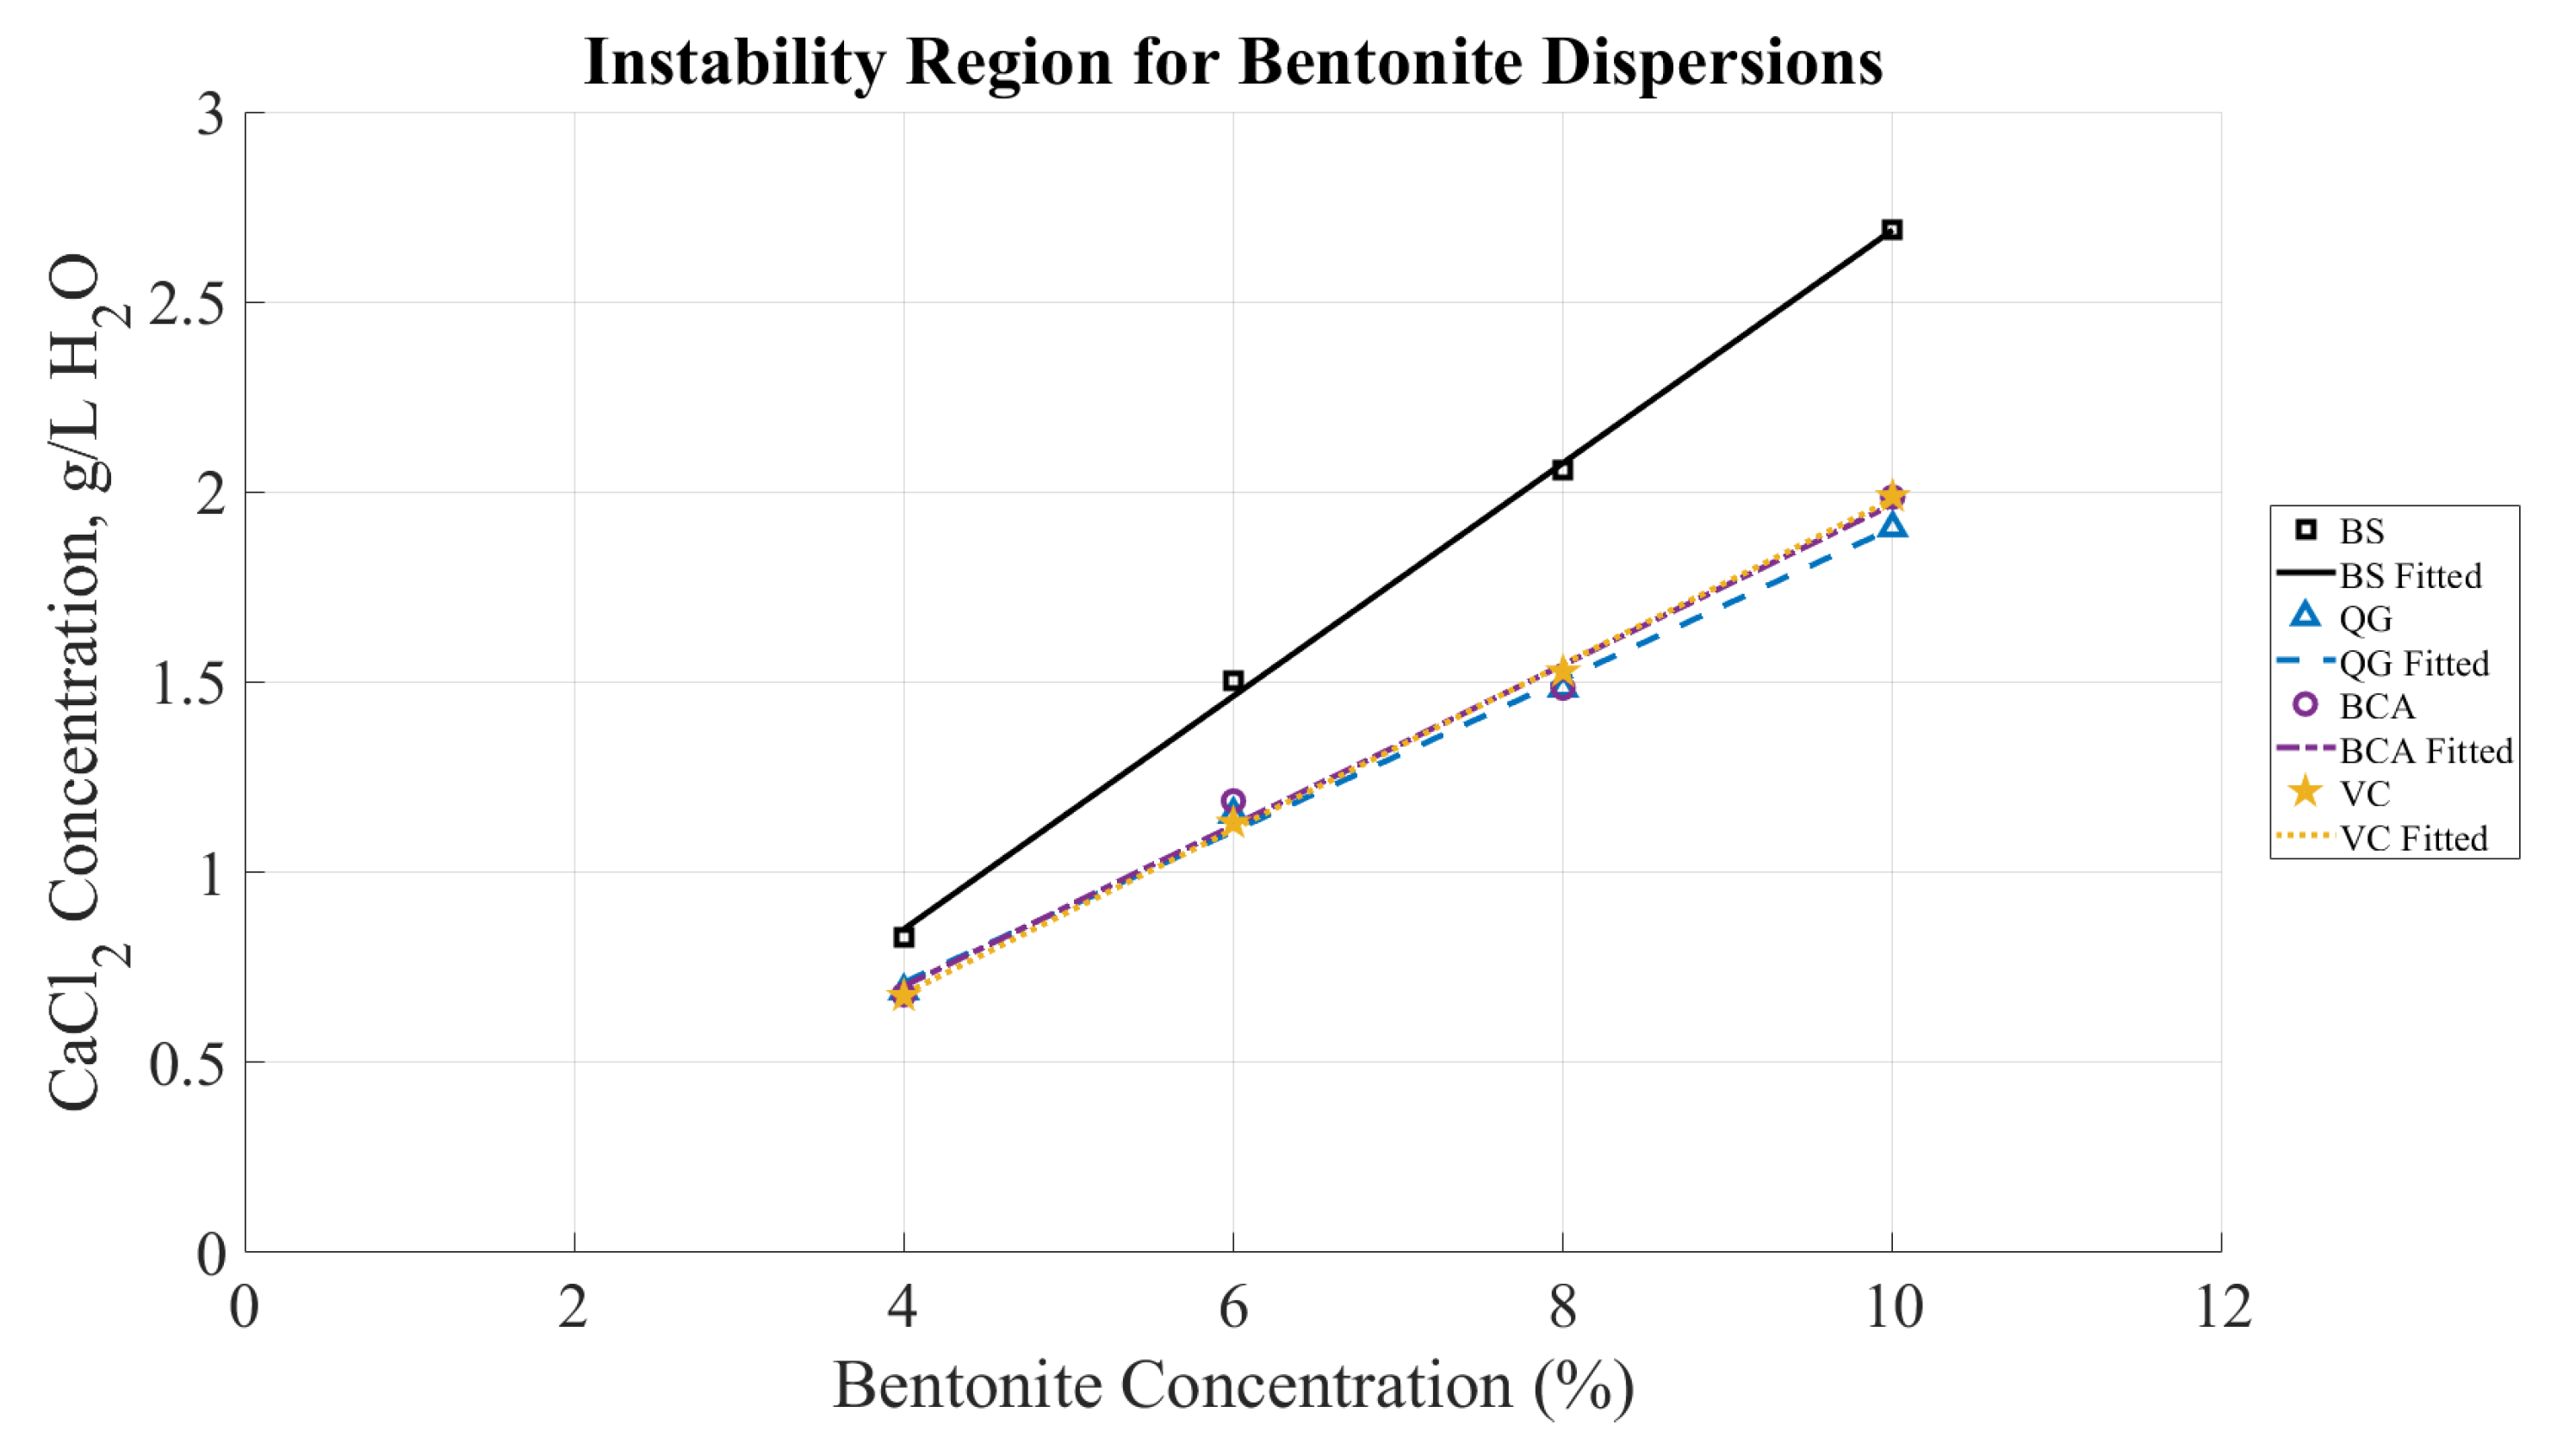
Figure 14.
The CCC of electrolyte salt as a function of the bentonite concentration is shown for all bentonite mixtures tested. The markers indicate the CCC. The instability region is the area above the fitted lines and indicated with shading for the BS with NaCl, however, the areas above each of the fitted lines correspond to the unstable dispersion for the respective bentonite brand.
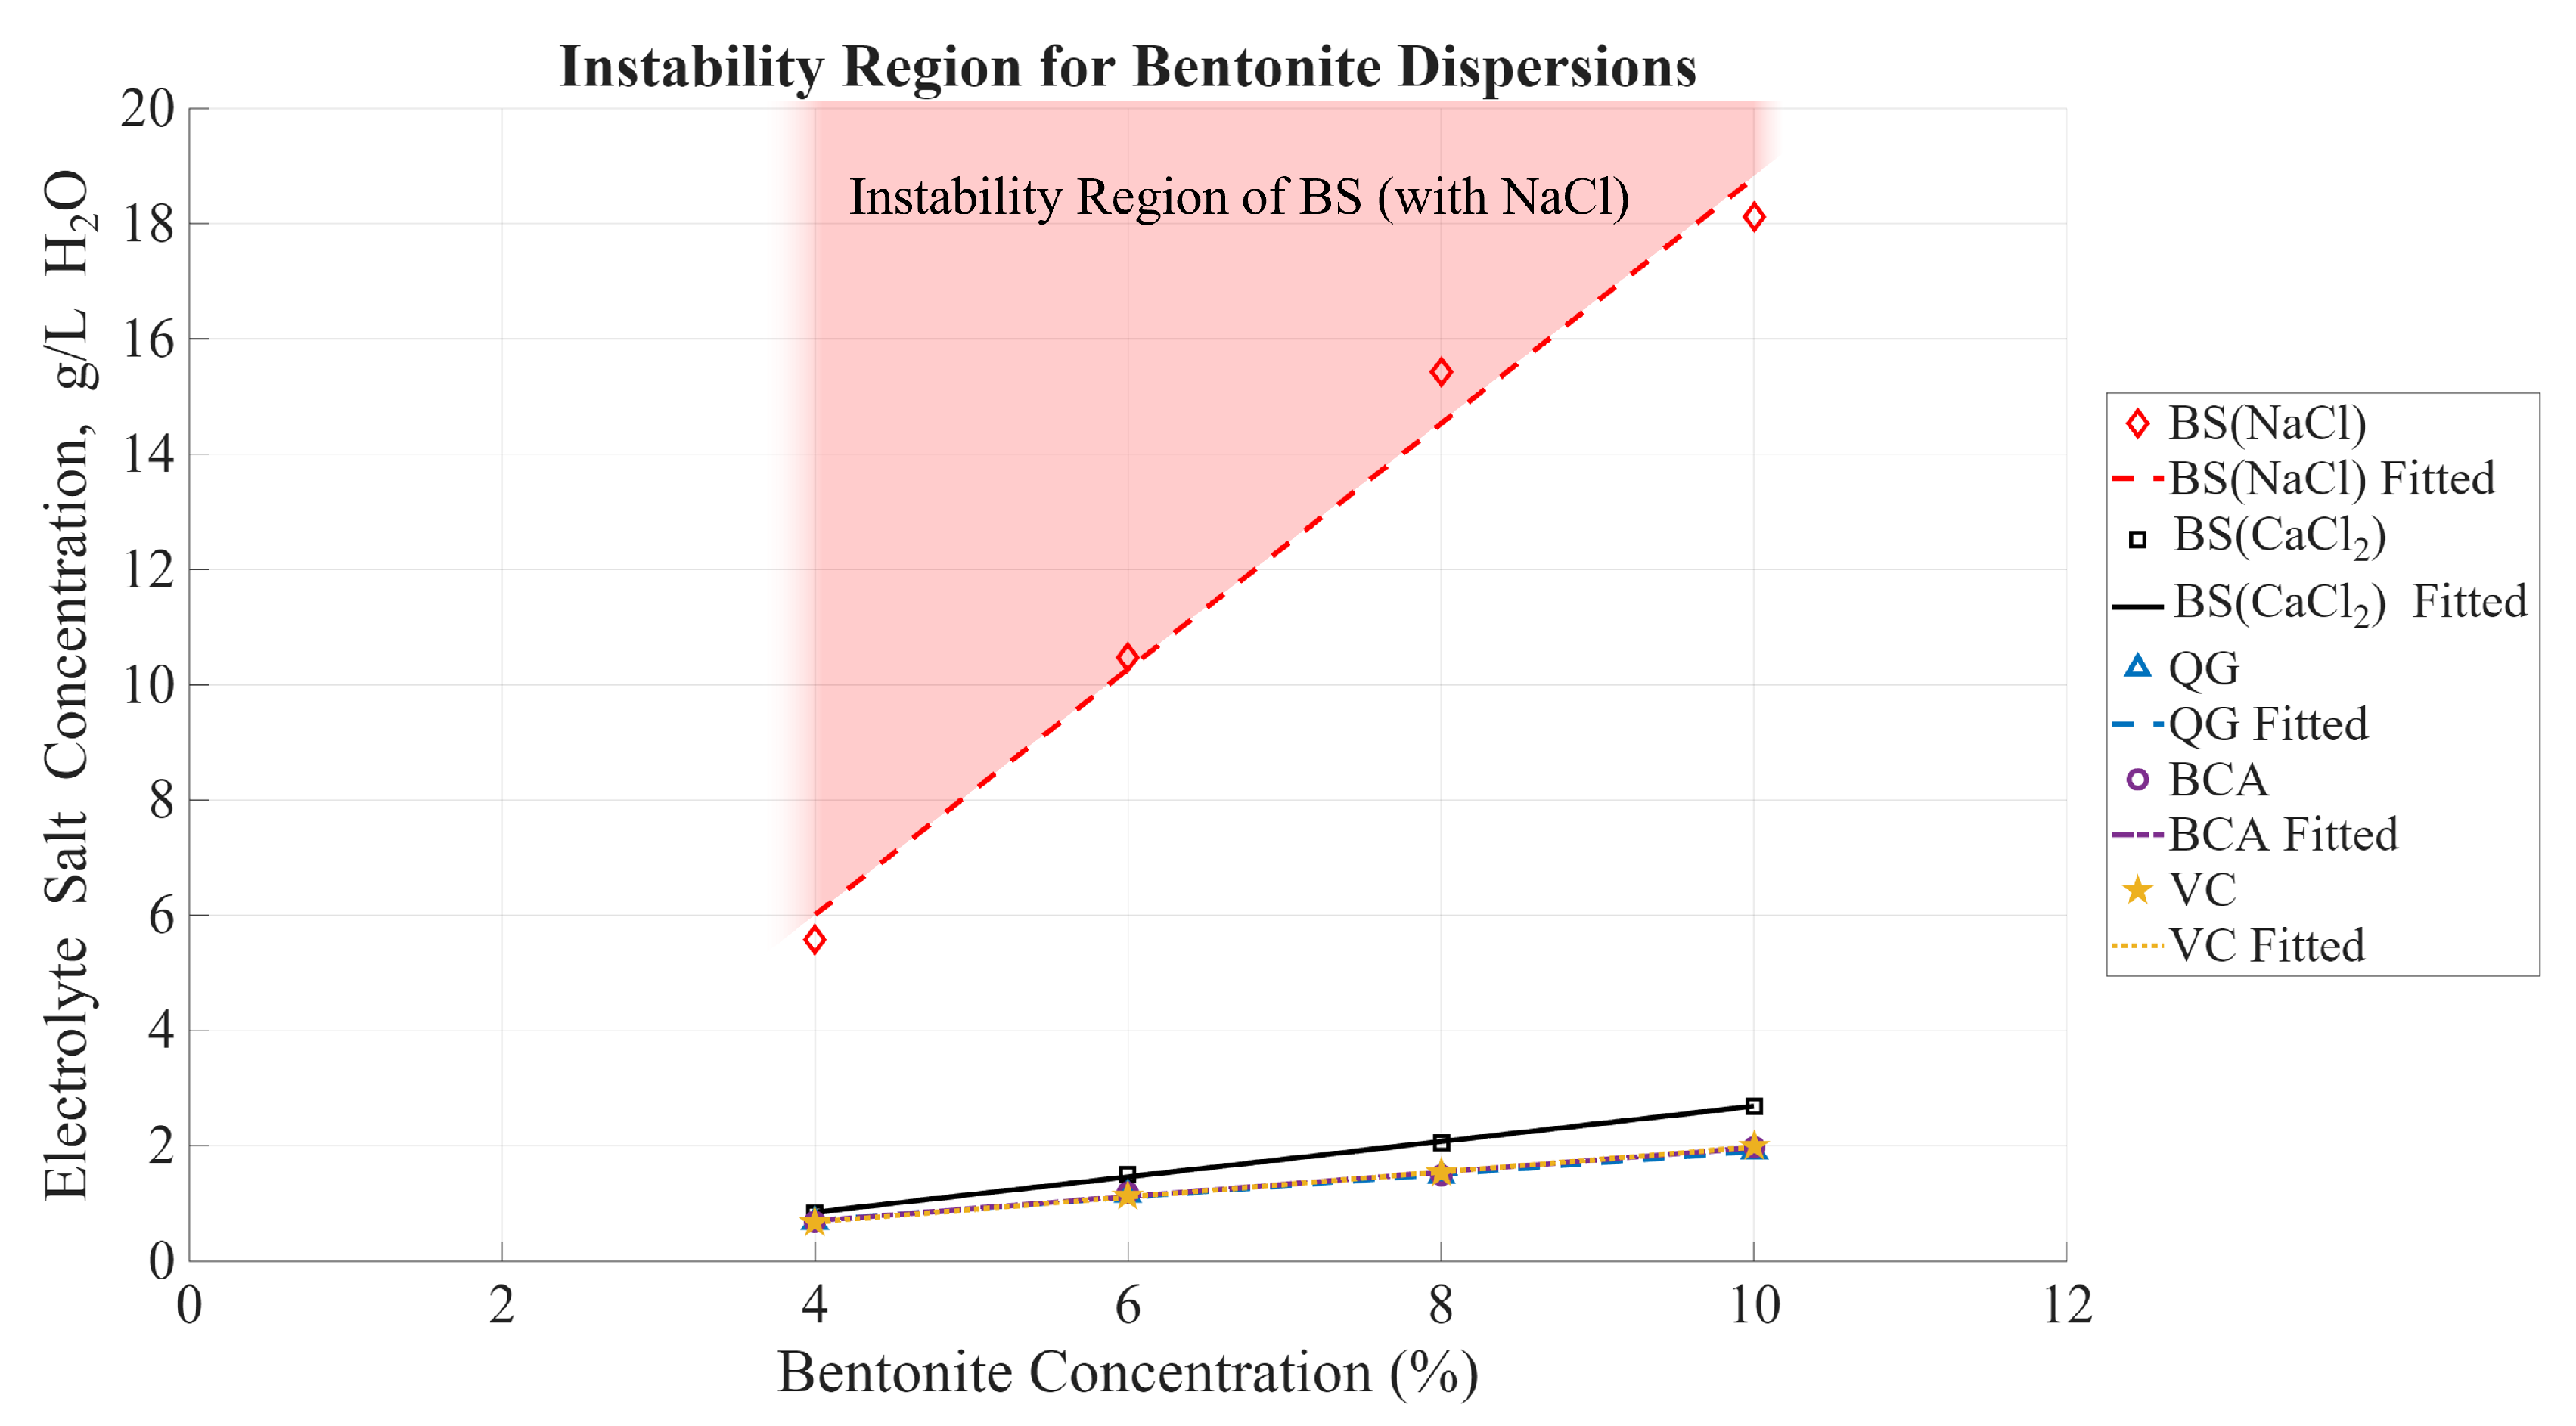
Table 1.
Wyoming Sodium Bentonite Mixes.
| Name (Abbr.) | Manufacturer | Composition | Particle Size |
|---|---|---|---|
| National Premium WT (BCA) | BPM Minerals LLC | 1–5% Quartz | 200-mesh (0.074 mm) |
| BenSeal (BS) | Baroid Industrial Drilling Products | 60–100% Sodium Bentonite, | |
| 0–1% Cristobalite, | 8-mesh (2.38 mm) | ||
| 0–1% Tridymite, | |||
| 0–5% Quartz | |||
| Quik-Grout (QG) | Baroid Industrial Drilling Products | 60–100% Sodium Bentonite, | |
| 0–1% Cristobalite, | |||
| 0–1% Tridymite, | 200-mesh (0.074 mm) | ||
| 0–5% Quartz, | |||
| 0–5% ammonium sulfate | |||
| VolClay (VC) | American Colloid Company | <2% Cristobalite, | 200-mesh (0.074 mm) |
| <6% Quartz |
Table 2.
Parameters affecting coagulation and their values used in this experimental study.
| Bentonite brands: | BCA, BS, QG, and VC |
|---|---|
| Bentonite concentration, C: | 4%, 6%, 8%, and 10% by mass |
| Electrolyte types: | NaCl and CaCl2 |
| NaCl concentrations: | 8–90 g/L dist.H2O |
| CaCl2 concentrations: | 0.75–12 g/L dist.H2O |
| Aggregation (and sedimentation) time: | Evolution for at least 3 weeks (≈500 hours) |
Table 5.
CCC of monovalent versus bivalent cations in BS dispersions.
| Bentonite Concentration: | 4% | 6% | 8% | 10% |
|---|---|---|---|---|
| Na (mmol/L): | 96 | 181 | 266 | 312 |
| Ca (mmol/L): | 7.5 | 13.6 | 18.5 | 24.2 |
Disclaimer/Publisher’s Note: The statements, opinions and data contained in all publications are solely those of the individual author(s) and contributor(s) and not of MDPI and/or the editor(s). MDPI and/or the editor(s) disclaim responsibility for any injury to people or property resulting from any ideas, methods, instructions or products referred to in the content. |
© 2025 by the authors. Licensee MDPI, Basel, Switzerland. This article is an open access article distributed under the terms and conditions of the Creative Commons Attribution (CC BY) license (http://creativecommons.org/licenses/by/4.0/).
Copyright: This open access article is published under a Creative Commons CC BY 4.0 license, which permit the free download, distribution, and reuse, provided that the author and preprint are cited in any reuse.


