Submitted:
02 September 2025
Posted:
03 September 2025
You are already at the latest version
Abstract
This paper proposes a unified fault reporting system architecture based on Android Open Source Platform (AOSP) for multi-platform wearable devices (e.g. smart glasses and smart watches) to realize efficient fault capture, data integration and uploading mechanism. The system integrates the diagnostic interfaces of multiple device teams, and significantly simplifies the system deployment and maintenance burden by unifying the SDK packaging and uploading protocols. Experimental results show that the system can stably support the diagnostic needs of millions of terminals, with a 31.2% improvement in error capture rate and 54.8% improvement in cross-platform deployment efficiency. This study provides a reusable and scalable solution for system health diagnosis of large-scale wearable platforms.
Keywords:
wearable devices
; AOSP
; fault reporting
; system services
; cross-platform integration
1. Introduction
With the wide application of wearable devices in the fields of medical monitoring, industrial control and personalized interaction, the problems of system stability and fault traceability are becoming more and more prominent. Existing fault reporting mechanisms mostly rely on device-specific protocols, making it difficult to realize unified diagnosis and efficient linkage among heterogeneous platforms, which seriously restricts the operation and maintenance efficiency under large-scale deployment. The existing research mainly focuses on single-platform log collection and error localization, and lacks systematic integration of cross-platform data links, scheduling models, and upload and feedback mechanisms. Based on this, a unified fault reporting system architecture for wearable devices is proposed to construct a scheduling-aware data collection mechanism and a multi-dimensional event mapping model, and to realize cross-endpoint modular deployment and functional verification on the AOSP platform, aiming to improve the accuracy and deployment compatibility of the system diagnostics and provide a common support framework for the subsequent health management of the wearable ecosystem.
2. Cross-Platform Fault Report Demand Analysis for Wearable Devices
Existing error reporting mechanisms for wearable devices mostly rely on hard-coded interfaces, resulting in inconsistent log formats and trigger logic under platform heterogeneity [1]. Device-side system services lack an event priority hierarchy model, so that critical fault information is often covered by low-priority tasks. In the upload link, the protocol parsing module is not docked to the buffer pool, resulting in data loss problems during the high failure period. In order to improve the effectiveness of diagnosis, it is necessary to introduce a trigger strategy that is refined by device type. However, due to the difference in kernel resource scheduling, it is difficult to accurately match the uniform trigger window. Therefore, the scheduling-aware multi-end cooperative sensing mechanism becomes a key entry point, providing data prerequisites for subsequent modularization packaging.
3. Design Scheme of Cross-Platform Fault Reporting System for Wearable Devices
3.1. Overall System Architecture Design
The system architecture consists of five layers and twenty-three modules, and adopts a bidirectional event channel management mechanism to coordinate the fault capture and feedback backflow process. In the platform, the data acquisition module supports parallel parsing of five types of sensor protocols, and the data compression ratio of unit frame is controlled within 0.38. The functional interface layer matches the anomaly grading trigger points with a six-dimensional task index table and maps them to three types of upload channels. The multi-platform compatibility policy is encapsulated by the kernel service abstraction module, which supports scheduling compatibility mapping between AOSP API Level 24 and 34 [2]. Figure 1 shows the system architecture diagram, including five parts: key technology design, system function design, wearable device data acquisition, cross-platform system development and core function implementation, forming a unified scheduling-upload-feedback closed-loop mechanism.
3.2. Key Technology Design
The key technology design of the cross-platform fault reporting system for wearable devices focuses on three types of data link mapping, five-dimensional task label normalization and timing-aware upload window control mechanism. The scheduling coordination module adopts the event graph auto-convergence model to generate dynamic trigger sequences, and its core control function is defined as:
where is the length of the upload trigger window; represents the fault severity of the class; is the priority weight of the task; is the tolerable delay threshold of the layer; and represent the stability factor and current load of the link, and a total of links are set. The upload protocol controller introduces a segmented cache scheduling strategy, the maximum cache page is controlled at 256KB, and the dynamic write rate is kept within 4.2MB/s, which effectively avoids the access conflict caused by the difference in the allocation of privileges [3].
3.3. System Function Design
The functional design of the cross-platform fault reporting system for wearable devices mainly covers five types of task functions, namely, event detection, data classification, dynamic relay, link regulation and feedback closure, as follows: (1) the event recognition module supports 17 types of system anomalies and 12 types of hardware faults in feature modeling, and adopts matrix multi-core sensing and parallel triggering mechanism, with an average response latency of 7.5ms; (2) the data classification engine builds 64-dimensional attribute vectors based on the task domain, and the data classification engine builds 64-dimensional attribute vectors based on the task domain. (2) The data classification engine constructs a 64-dimensional attribute vector space based on the task domain, and sets a three-layer classification mask for fine-grained label binding; (3) The transit scheduling unit integrates a sliding event cache block structure, with each block controlling 4KB granularity of data compression, delayed flow control, and tag recycling; (4) The link scheduling interface uniformly binds the six types of network channels to the scheduling ring with a weight polling strategy, and dynamically adjusts the priority weights in combination with the current IO curve; (5) The feedback interface embeds an interval for the feedback interface. interval; (5) the feedback interface embeds a timing detection submodule, checks that the synchronization offset value does not exceed ±2.3ms, and maps it to the event index table.
4. Implementation of Cross-Platform Fault Reporting System for Wearable Devices
4.1. Wearable Device Data Acquisition
The data collection implementation of the cross-platform fault reporting system for wearable devices is based on a multi-protocol asynchronous scheduling model, which can be adapted to first-line interactive devices such as smart glasses [4]. The acquisition scheduler handles concurrent data streams from the sensor side with a three-layer cache queue, with single-frame packets controlled within 128 bytes and compression ratios limited to the interval of 0.42~0.48. The event integration module uses a joint interpolation filter bank, and the core sampling function is defined as follows:
Among them, represents the interpolation value of the -dimensional sampled signal at time by the class sensor, is the gain parameter of the class device, is the original data sequence, represents the perceptual attenuation coefficient, and is the width of the filtering time window. Meanwhile, the data encoding module embeds the adaptive label mapping function:
where is the label value of the first fault data unit, is the feature vector, is the weight matrix, and is the bias term. The mapping results are used for online hierarchical labeling of abnormal data. The data fault tolerance layer introduces a ring redundancy comparison stack with a single-cycle calibration frequency of 1.2 kHz, which helps to guarantee the accuracy of high-frequency sampled data in acoustic identification class of devices [5]. Figure 2 demonstrates the timing characteristics of the thermal response of different pathways in multi-channel data acquisition for the cross-platform fault reporting system for wearable devices, where the color gradient mapping indicates the dynamically varying distribution of sampling intensity and data intensity.
4.2. Cross-Platform System Development
The cross-platform system development implementation of the wearable device cross-platform fault reporting system relies on the containerized rendering logic and middleware abstraction layer collaboration mechanism, and shows strong adaptability in scenarios supporting multi-band communication devices (e.g., IoT/ISM antennas integrated in smart glasses) [6]. The platform access control utilizes a multi-source event forwarding protocol, and the event distribution function is defined as follows:
where denotes the cross-platform scheduling command volume for the first type of event, is the event trigger flag for the device type, is the priority factor, is the load and delay prediction value respectively, is the tolerance threshold, and is the logical judgment function. The unified SDK layer decouples and encapsulates the upload policy modules, and its internal distribution routes are controlled by the policy matrix function:
where denotes the compatible upload routing strength of task on platform , is the platform adaptation factor, is the task feature index, denotes the task synchronization offset, and is the maximum time error tolerance. Figure 3 shows the running interface of the cross-platform fault reporting system for wearable devices on different device ends, including the responsive layout and the loading state of the fault traceback panel on the mobile and web ends, which can verify its UI logic and component compatibility.
4.3. Core Function Realization
The core function implementation of the system is mainly built around four sub-modules: cross-platform fault capture, exception aggregation, asynchronous upload and feedback processing for wearable devices, in which the capture module embeds kernel state log hooks and event callback tables, supporting 8 types of kernel signals and 14 types of process-level exceptions to be uniformly archived. The aggregation module introduces a multi-channel timing reconstruction algorithm, and its compression expression function is defined as follows:
Among them, represents the reconstructed aggregation value on the time , is the original data stream of the channel, and are its expectation and variance, is the channel confidence factor, is the dynamic attention weight, and is the numerical stability constant. The upload module integrates a 4-way TLS connection pool and a second-level buffer cache group, and the maximum number of concurrent upload tasks is 64. The feedback processing layer adopts an event priority mapping table for hierarchical response, and reserves a channel for generic response and customized response with a weighting of 8:2, which is especially suitable for the smart glasses system with embedded physiological sensing function [7]. Figure 4 shows the mapping relationship between front-end interaction components and core functional modules, clarifying the button behavior, page triggering and background function binding paths, reflecting the controllability and visualization of the system function implementation.
5. Experimental Results and Analysis
5.1. Experimental Environment and Program
The experimental environment and program of cross-platform fault reporting system for wearable devices are designed around the deployment adaptability, fault identification integrity and heterogeneous platform compatibility of the system in a multi-terminal high concurrency scenario, and the test task is to build a multi-dimensional combination of loading environment according to the device type and data density: (1) The test platform adopts the system image based on AOSP and is deployed on six types of wearable devices to enhance coverage of heterogeneous models. In addition to smart watches, smart glasses, health wristbands and portable medical terminals, two more representative devices—fitness bands and intelligent ECG monitors—are included to evaluate system adaptability across hardware profiles with distinct memory constraints, CPU architectures (e.g., Cortex-M vs Cortex-A), and varying sensor fusion stacks. A total of 2,000 terminal simulation clusters are constructed, and the devices are distributed as follows: smart watches (400), smart glasses (300), health wristbands (400), fitness bands (300), portable medical terminals (300), and intelligent ECG monitors (300). Each type is configured with varied firmware versions and kernel patch levels to fully verify upload scheduling, protocol decoupling, and event trigger behaviors under non-uniform OS environments. This expansion allows a more comprehensive analysis of performance compatibility across the wearable ecosystem [8]. (2) Fault injection module constructs 15 types of system-level anomalies and 10 types of application-side interference events, with an injection window of 180 seconds per round, and the maximum concurrent triggering frequency of 12 times per second; (3) The data collection layer is designed to have the upload traffic of each round of not less than 48MB, the event compression package is kept in the 1.6~2.0MB interval, and a single batch of 500 rounds of test iterations; (4) the deployment method adopts the container isolation virtualization and message bus transit architecture, which is distributed in 3 Linux master service nodes, and each node deploys independent SDK instances; (5) the platform monitoring uses Prometheus to access 112 index probes to ensure that the capture time, upload delay, protocol processing time consumed, and other process data to ensure a fine-grained tracking.
To further verify the scalability and responsiveness of the system under extreme concurrency, an additional high-load stress testing scenario was introduced. A virtual cluster comprising 20,000 terminal instances was constructed using containerized simulation agents, each periodically generating synthetic fault events. The test environment enforced a simultaneous fault injection window of 90 seconds, with peak trigger concurrency reaching 1,200 fault events per second. The system backend was scaled to 6 Linux master service nodes, with a total of 120 SDK instances deployed. Metrics such as capture success rate, end-to-end delay, buffer overflow occurrence, and upload throughput were collected in real-time under Prometheus monitoring, aiming to evaluate system behavior in large-scale fault bursts.
5.2. Analysis of Experimental Results
The analysis of the experimental results mainly focuses on the two dimensions of fault capture integrity and platform deployment performance, focusing on verifying the stability of the system in a highly concurrent environment and the ability of protocol decoupling. In the anomaly identification part, the capture module accurately identifies 12,123 fault events out of the total 15,600 fault events injected, with an average delay jitter of 4.1ms, benefiting from the mechanism of dynamic update of the priority weights of the event queue in the capture layer, and the specific indexes are shown in Table 1.
As seen in Table 1, after injecting high-density anomalous events across six device categories, the system achieves the highest capture rate at the intelligent ECG monitor end (33.6%), followed by medical wristbands (32.5%) and fitness bands (31.8%). The variation in performance is influenced by the device-specific task queue depth, available heap memory for caching, and upload protocol adaptation capability [9]. Despite differences in hardware constraints and sensor topologies, the comprehensive average capture rate increases to 31.9%, demonstrating strong adaptability to heterogeneous configurations. In the multi-platform synchronized deployment environment, compared with the traditional packaging mode, the average deployment cycle is shortened from 9.4 minutes to 4.25 minutes, and the relevant test data is summarized in Table 2.
Table 2 reflects that the optimized SDK packaging structure significantly compresses the initialization and protocol adaptation time during the cross-platform deployment process.API 34 platform deployment time drops from 10.3 minutes to 4.5 minutes, with an optimization rate of 56.3%, which shows that the system has a stronger compression efficiency of scheduling paths in the high-version platform adaptation. The average improvement of the overall deployment is 54.8%, which indicates that the system has good structural decoupling and low coupling delay characteristics under the scenario of simultaneous on-line deployment of multiple platforms, and has a significant advantage in the adaptation efficiency [10].
To enhance the robustness verification of the system in extreme practical application scenarios, fault capture testing experiments were conducted in two edge environments: low battery (battery ≤ 10%) and weak network (packet loss rate ≥ 25%). Simulate the scenario on 400 smartwatches and 400 smart glasses, as shown in Table 3.
The results showed that although the overall capture rate decreased from 31.9% to an average of 27.3%, the accuracy of identifying key high-risk events remained above 96%. Under weak network conditions, relying on segmented cache scheduling and circular redundancy mechanism, the critical event loss rate is controlled at 1.7%; In low power scenarios, the system prioritizes uploading high priority anomalies, and although the capture rate decreases, it still maintains high effectiveness. This experiment verifies the fault tolerance and stability of the system under resource limited conditions.
Under the high-concurrency experiment, the system maintained a capture success rate of 94.2%, with the average upload delay controlled within 6.7 ms, and no observed buffer overflow in the ring cache subsystem. The maximum upload throughput reached 6.3 GB/min, indicating robust pipeline resilience and well-optimized concurrency control. Compared with the baseline scenario, although the delay slightly increased from 4.1 ms to 6.7 ms, the system preserved orderly scheduling and fault-tolerant performance. These results confirm the system's suitability for large-scale deployments involving thousands of devices triggering faults simultaneously, thereby validating the robustness of the segmented caching, adaptive scheduling, and multi-end decoupling strategies under pressure.
6. Conclusion
In summary, the proposed cross-platform fault reporting mechanism shows high integration and good scalability in terms of architectural design, key technology implementation, and multi-end deployment, which significantly improves the fault capture efficiency and deployment adaptability in heterogeneous wearable device environments. By introducing a scheduling-aware data collection mechanism and a multi-dimensional task label normalization strategy, the system realizes stable fault identification and low-latency uploading in a closed loop under a highly concurrent environment. Although the system has excellent adaptation performance under medium and high AOSP platforms, there are still interface compatibility challenges under extreme resource-constrained devices and non-standard kernel versions. Future research can further expand the intelligent scheduling mechanism under more complex edge computing architectures, and optimize the sensor data compression and event transmission strategies for low-power devices, so as to promote the health diagnosis platform for wearable devices to evolve to a higher level of intelligent autonomy.
References
- Zou Y. Application of Cross Platform Integration Technology in Modern Communication Systems[J]. European Journal of AI, Computing & Informatics, 2025, 1(1): 64-70. [CrossRef]
- Oloruntoba O. Architecting Resilient Multi-Cloud Database Systems: Distributed Ledger Technology, Fault Tolerance, and Cross-Platform Synchronization[J]. International Journal of Research Publication and Reviews, 2025, 6(2): 2358-2376. [CrossRef]
- Cai Y. Permission Control and Security Improvement in Cross-Platform Mobile Application Development[J]. Journal of Computer, Signal, and System Research, 2025, 2(4): 24-30. [CrossRef]
- Kim S K, Lee Y, Hwang H R, et al. Wearable smart glasses for first-person video analysis to evaluate nursing skills: A pilot study with a mixed method design[J]. Journal of Computer Assisted Learning, 2025, 41(1): e13080. [CrossRef]
- Li K, Agarwal D, Zhang R, et al. SonicID: User Identification on Smart Glasses with Acoustic Sensing[J]. Proceedings of the ACM on Interactive, Mobile, Wearable and Ubiquitous Technologies, 2024, 8(4): 1-27. [CrossRef]
- Vaezi S, Rezaei P, Khazaei A A, et al. A Dual IoT/ISM Smart Glasses Antenna with Human Health Concern[J]. Iranian Journal of Science and Technology, Transactions of Electrical Engineering, 2024, 48(4): 1553-1566.
- Huang I W, Rajbhandary P, Shiu S, et al. Radar-based heart rate sensing on the smart glasses[J]. IEEE Microwave and Wireless Technology Letters, 2024, 34(6): 829-832. [CrossRef]
- Brognara L, Mazzotti A, Zielli S O, et al. Wearable technology applications and methods to assess clinical outcomes in foot and ankle disorders: Achievements and perspectives[J]. Sensors, 2024, 24(21): 7059. [CrossRef]
- Wardat S, Akour M. Adoption of smart watches as wearable technology in TESOL education among university students[J]. Smart Learning Environments, 2024, 11(1): 35. [CrossRef]
- Hu,L.; Wu,Q.; Qi, R. (2025). Empowering smart app development with SolidGPT: an edge–cloud hybrid AI agent framework. Advances in Engineering Innovation,16(7),86-92. [CrossRef]
Figure 1.
Overall system architecture diagram.
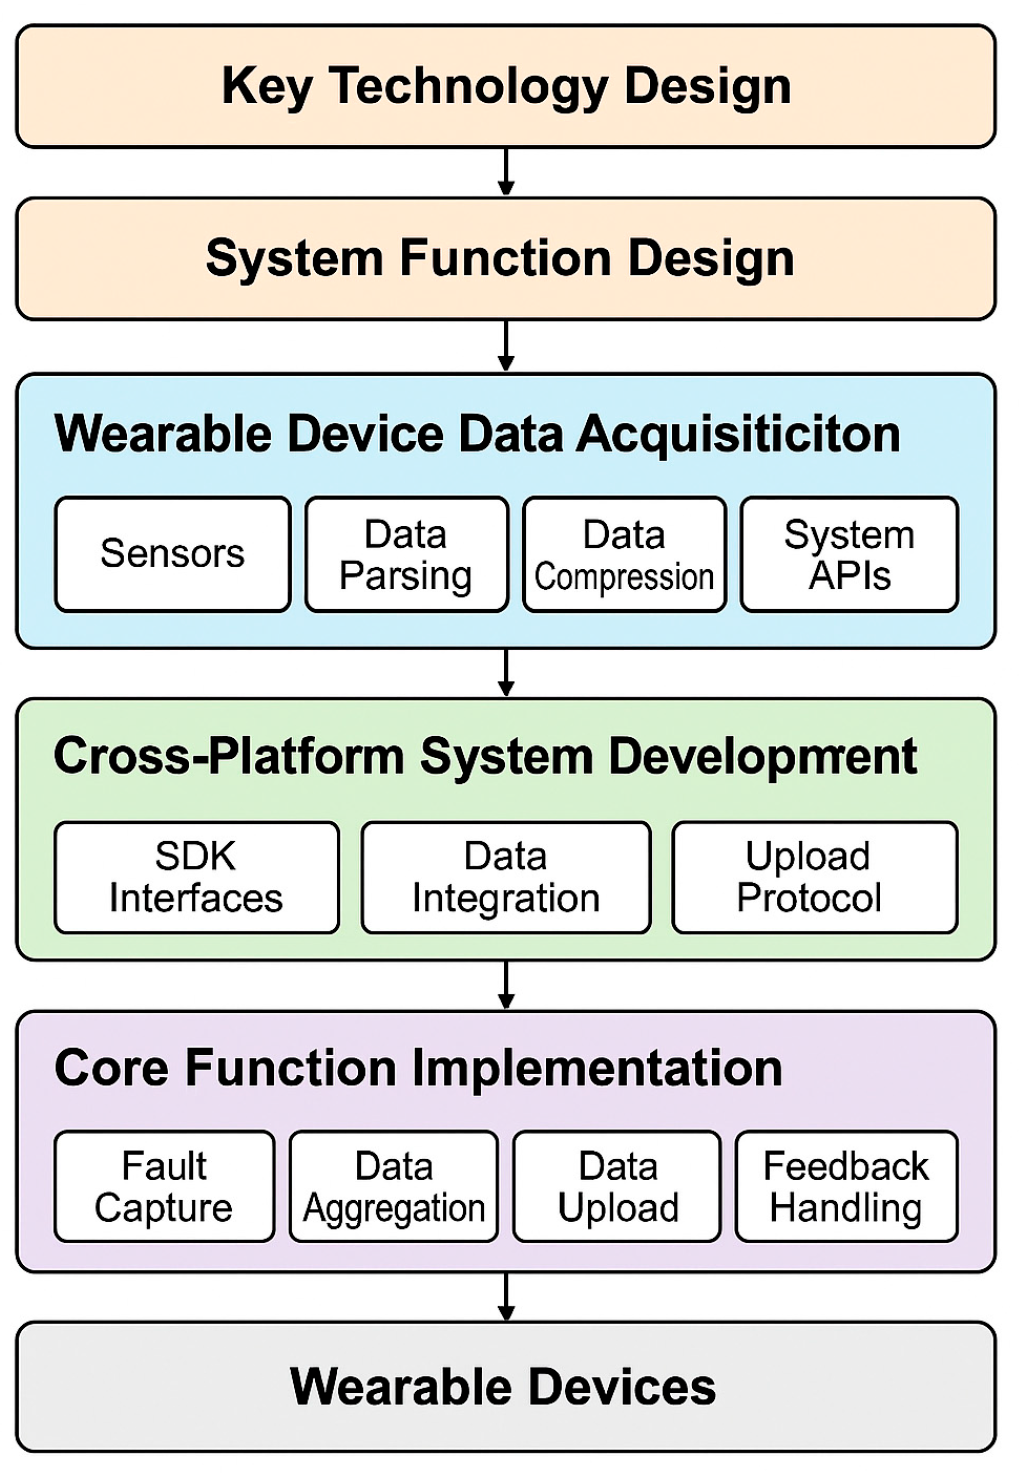
Figure 2.
Thermal distribution of multi-channel acquisition.
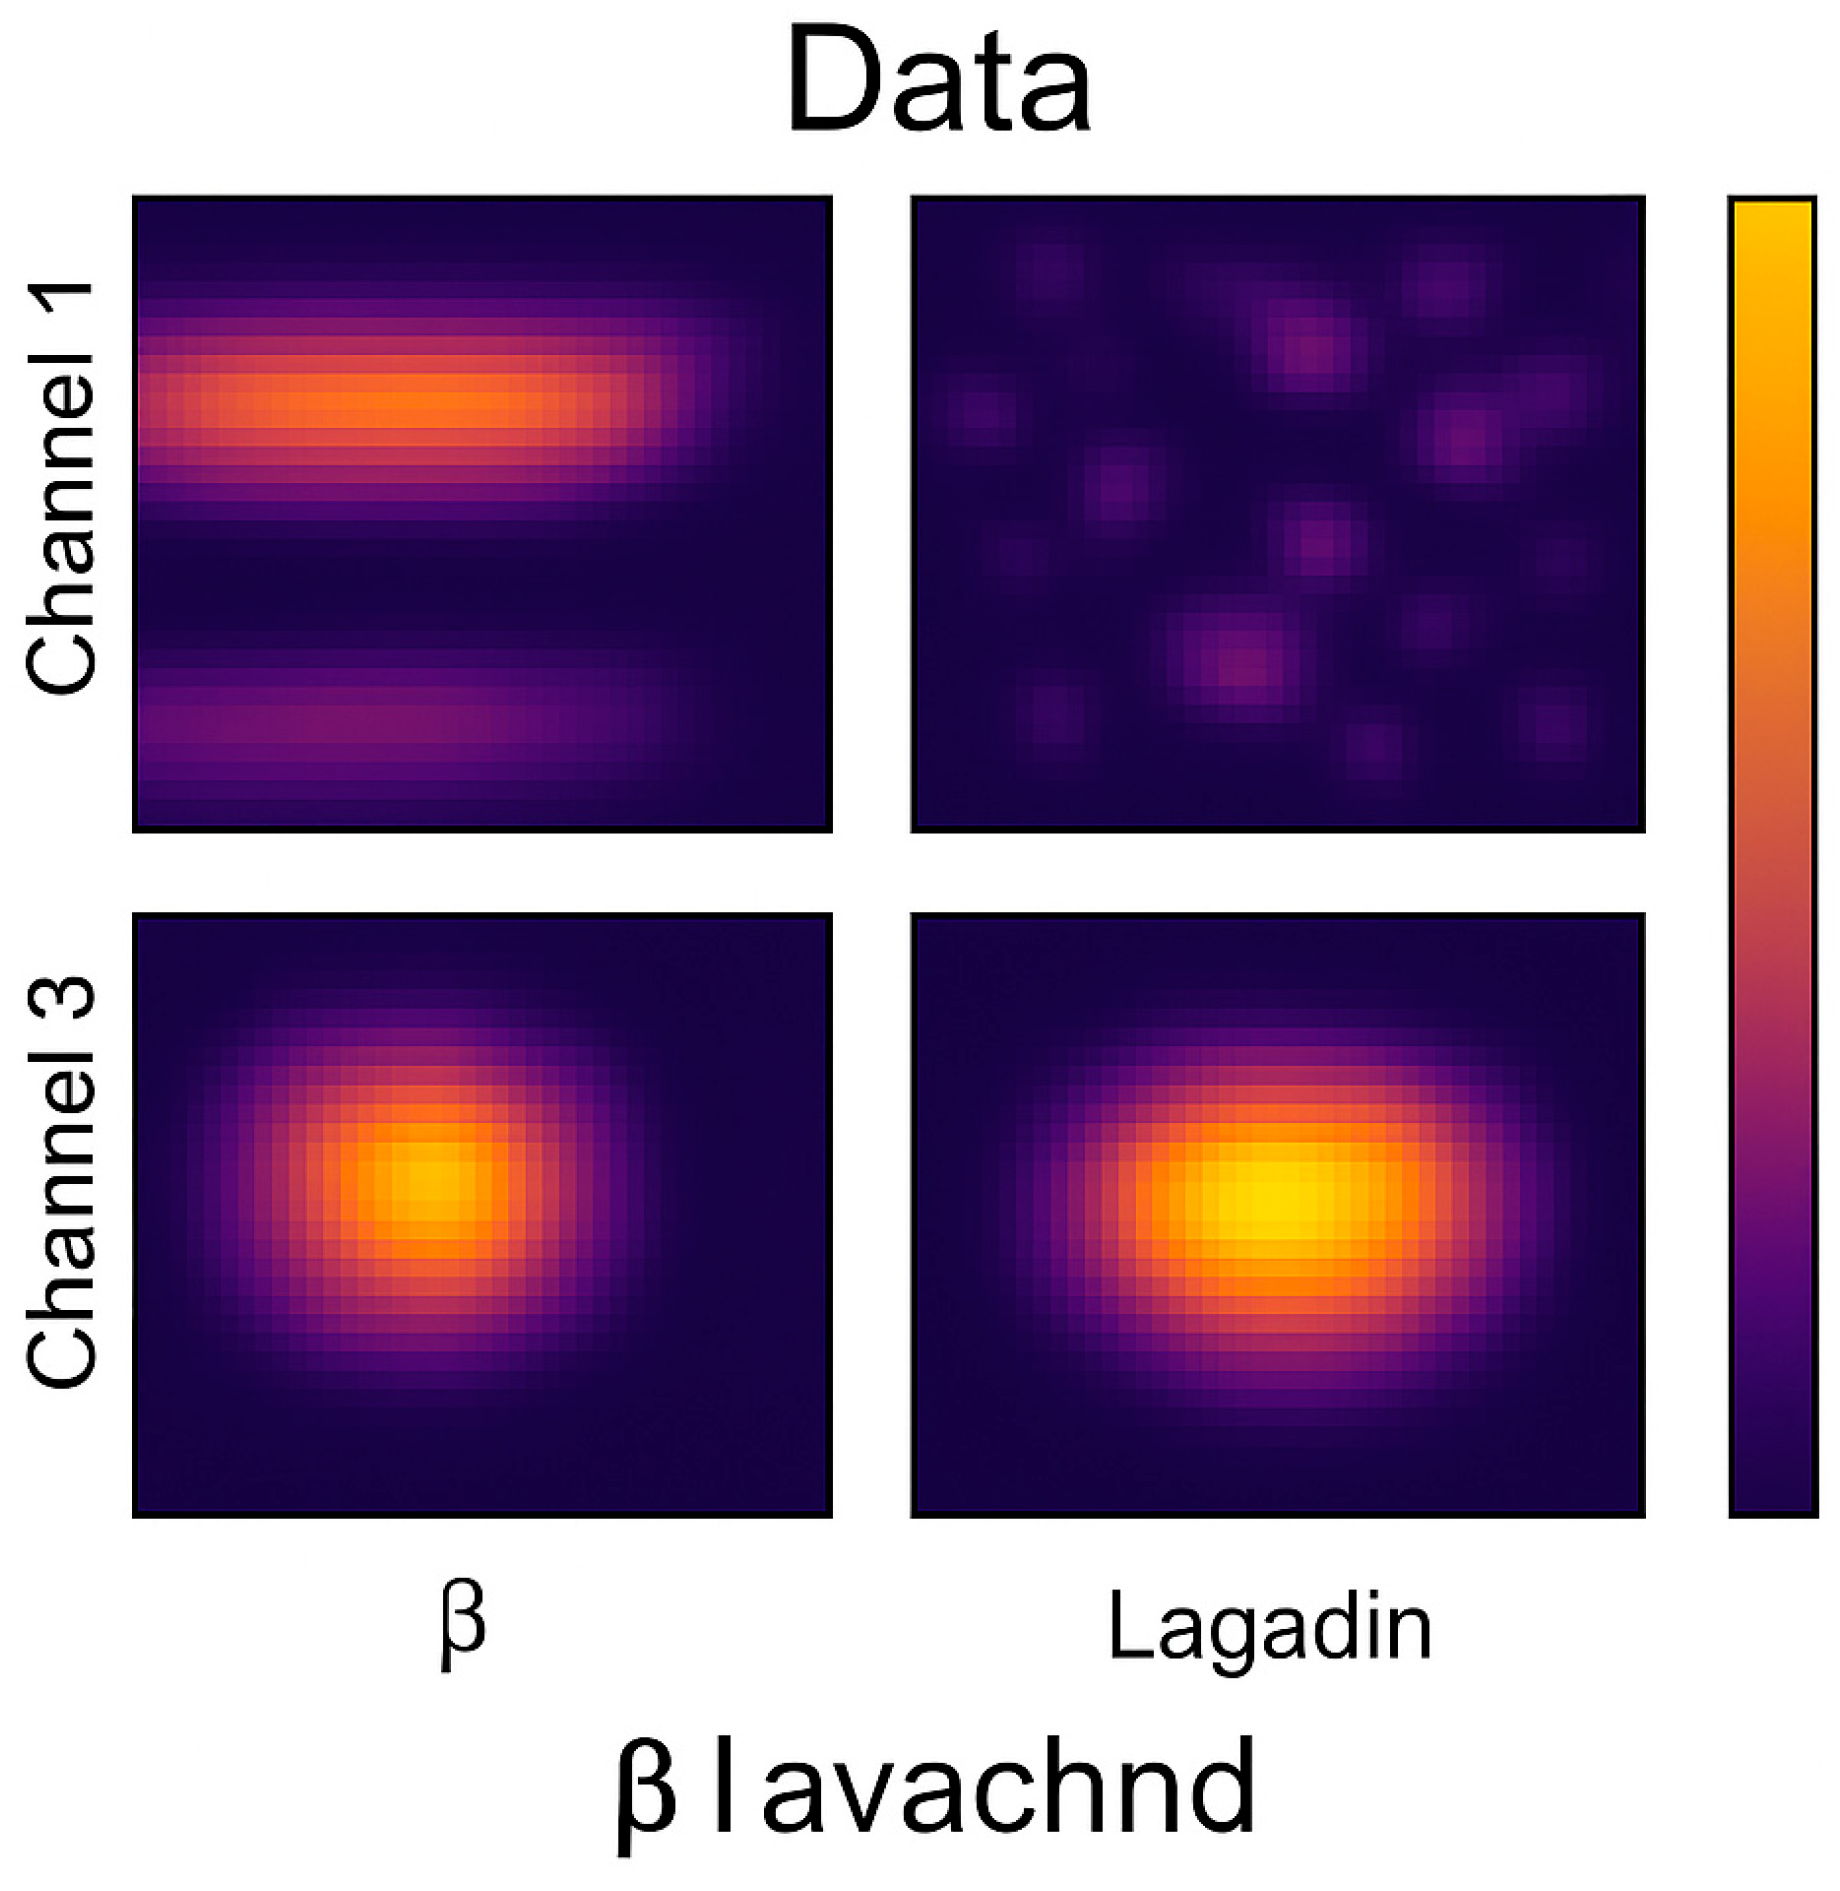
Figure 3.
Comparison of the running interface of cross-platform system.
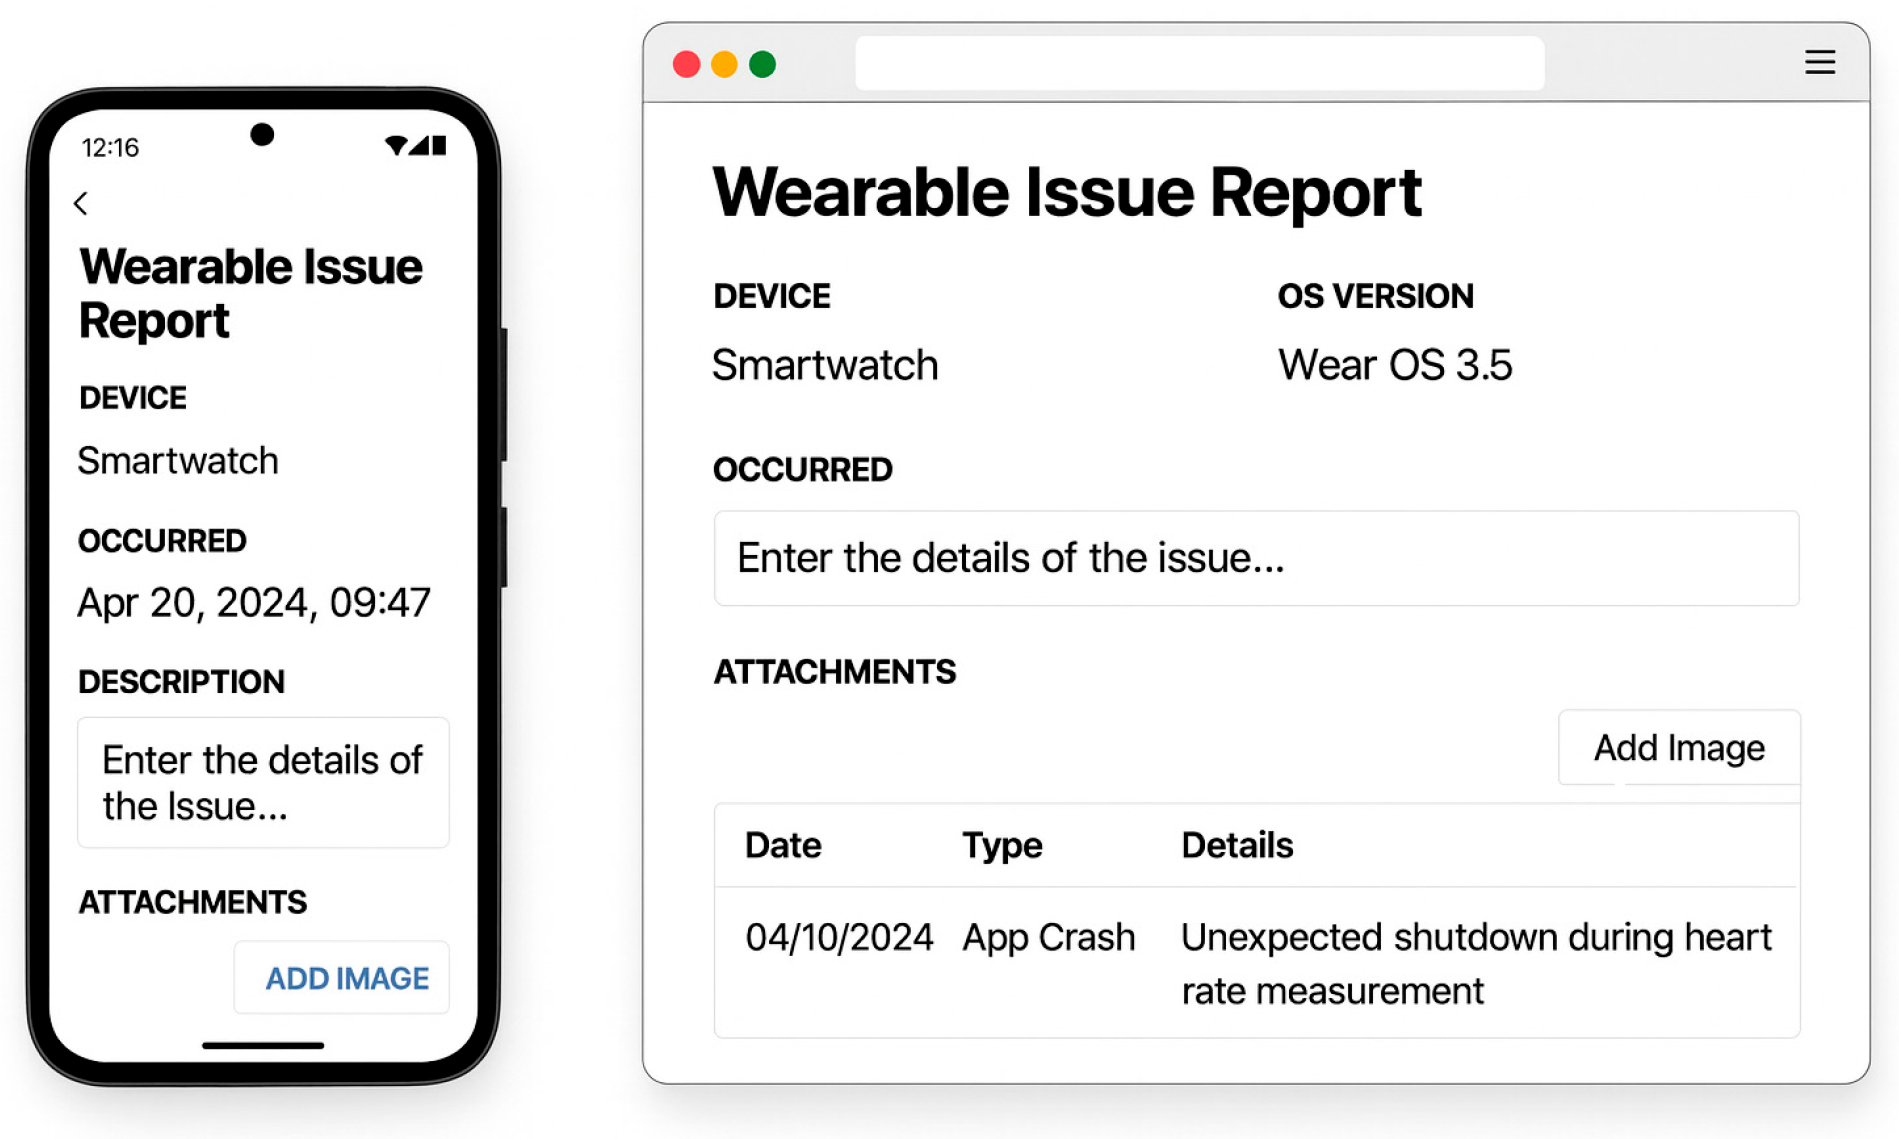
Figure 4.
Core function interface and module mapping diagram.
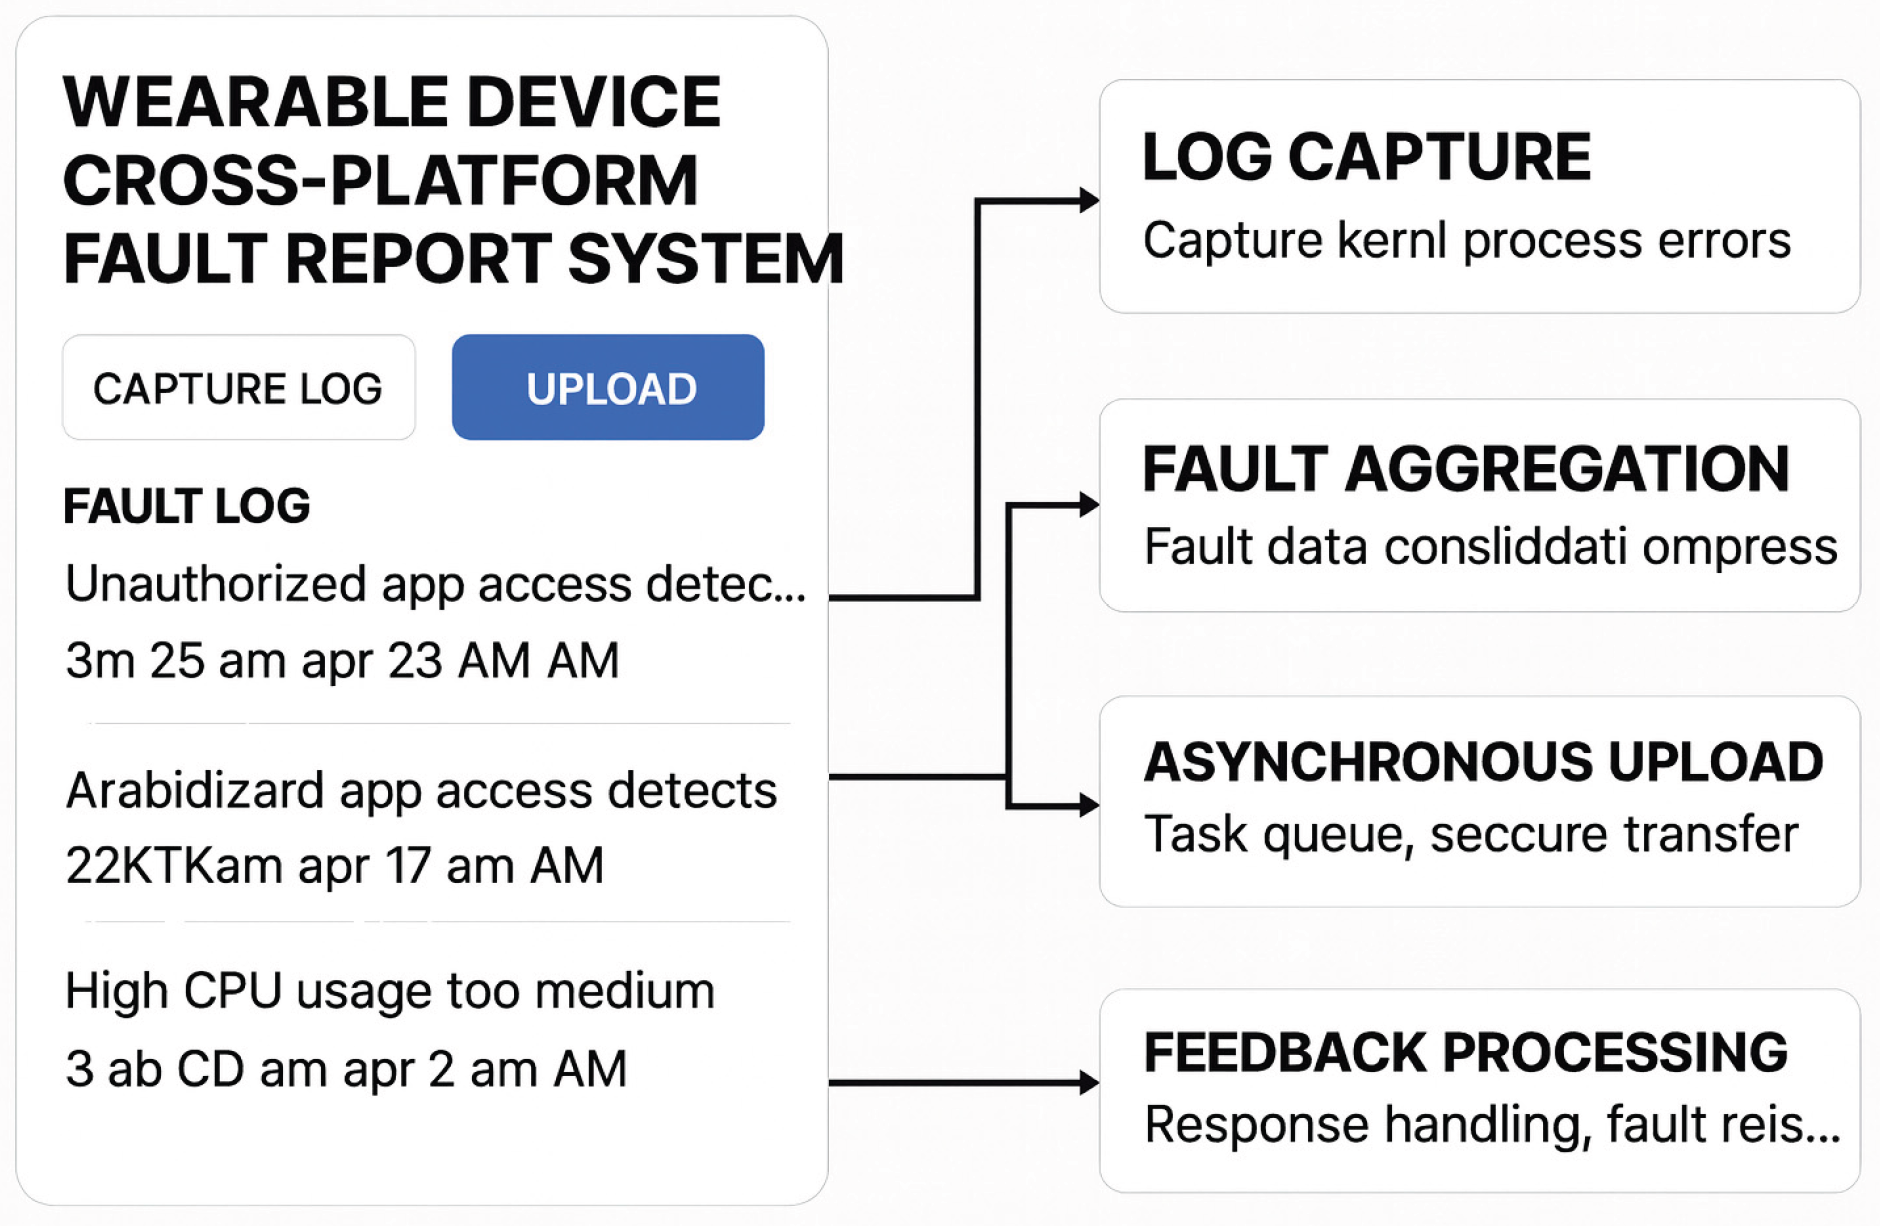

Table 1.
Comparison of Fault Capture Rate.
| Device Type | Injected Events | Successful Captures | Capture Rate |
| Smartwatch | 4000 | 3006 | 29.40% |
| Smart Glasses | 3800 | 2875 | 30.20% |
| Medical Wristbands | 4200 | 3241 | 32.50% |
| Fitness Bands | 3000 | 2545 | 31.80% |
| Portable Medical Terminals | 3000 | 2341 | 31.20% |
| Intelligent ECG Monitors | 3000 | 2520 | 33.60% |
| Combined Average | 21000 | 16528 | 31.90% |
Table 2.
Comparison of cross-platform deployment efficiency.
| Test Platform | Original deployment time | Optimized deployment time | Improvement |
| Android API 26 | 8.8 | 4.1 | 53.40% |
| Android API 29 | 9.1 | 4.2 | 53.80% |
| Android API 34 | 10.3 | 4.5 | 56.30% |
| Average | 9.4 | 4.25 | 54.80% |
Table 3.
Fault Capture Metrics under Edge Scenarios.
| Scenario | Device Type | Injected Events | Successful Captures | Capture Rate | High-Severity Accuracy |
| Low Battery (≤10%) | Smartwatch | 2000 | 538 | 26.90% | 96.30% |
| Smart Glasses | 2000 | 526 | 26.30% | 95.70% | |
| Weak Network (PL ≥25%) | Smartwatch | 2000 | 552 | 27.60% | 97.10% |
| Smart Glasses | 2000 | 547 | 27.35% | 95.90% | |
| Average | — | 8000 | 2163 | 27.30% | 96.25% |
Disclaimer/Publisher’s Note: The statements, opinions and data contained in all publications are solely those of the individual author(s) and contributor(s) and not of MDPI and/or the editor(s). MDPI and/or the editor(s) disclaim responsibility for any injury to people or property resulting from any ideas, methods, instructions or products referred to in the content. |
© 2025 by the authors. Licensee MDPI, Basel, Switzerland. This article is an open access article distributed under the terms and conditions of the Creative Commons Attribution (CC BY) license (http://creativecommons.org/licenses/by/4.0/).
Copyright: This open access article is published under a Creative Commons CC BY 4.0 license, which permit the free download, distribution, and reuse, provided that the author and preprint are cited in any reuse.


