Submitted:
02 September 2025
Posted:
03 September 2025
You are already at the latest version
Abstract
Development of cerebellum is a compound process, taking place pre- and postnatally. It is governed by multiple intra- and extracellular factors. Many studies have revealed the molecular mechanisms regulating different aspects of cerebellar development and related pathological entities. However, our understanding about certain factors modulating cerebellar development is still insufficient. Natural mutants and genetically engineered animal models allow to target particular gene products and to understand their role. Therefore, we performed experiments on homozygous knockout mice (Zbtb20-/-) and wild-type animals (controls) to examined the effect of transcription factor Zbtb20 on Purkinje cells (PCs) development during the early postnatal (P) stages – days 4, 8, and 12. Parasagital sections were treated immunocytochemically with antibody against the PCs’ marker Calbindin. Zbtb20 showed time- and space-differential effect: on P4, the lack of Zbtb20 resulted in total upregulation of PCs number, and selectively in folia 3, 8, 9 and 10; on P8 only folium 3 and 10 in the mutants had higher PCs number, while on P12 the opposite was observed – lower PCs’ number in the mutants. Additionally, a difference in the Pcs’ dendritic arborization was detected in Zbtb20-/-. To the best of our knowledge, this is the first study on the role of Zbtb20 on early postnatal PCs development. These findings provide new insights to the cerebelar development, and could have a significant clinical relevance.
Keywords:
cerebellum
; Zbtb20 knockout mice
; transcription factor Zbtb20
; development
; cerebellar folia
; Purkinje cells
; Calbindin
1. Introduction
Cerebellum is part of the central nervous system (CNS) playing a pivotal role in motor control. However, it also has cognitive functions such as attention and language, as well as emotional control regarding fear and pleasure responses [1,2]. Cerebellar development has been extensively studied for more than a century. Fundamental studies of Ramon y Cajal provided the first evidence for the neuron theory and created a complete scheme of the cerebellum circuitry [3,4]. His concept that the Purkinje cells (PCs) are continuously varying population is still considered accurate [5,6].
Development of cerebellum is a compound process related to extensive rearrangement of a limited array of specific cell types. The cerebellar primordium derives mainly from the dorsal (alar) neural epithelium lining the first rhombomere, but part of the mesencephalic vesicle also contributes, forming the cerebellar vermis [7,8]. In mice cerebellar development starts at about embryonic (E) day 9 when the neural tube bends and forms the rhombic flexure, followed by migration of the dorsal part of the neural tube close to the midline, which gets displaced laterally. Thus, the fourth ventricle is formed and the primordium of the cerebellum appeared as bilaterally symmetric bulges in the roof of the ventricle at E12.5 [9]. By E15.5 the cerebellar anlage transforms into a smooth cylindrical structure, wrapped around the dorsal part of the brain [7]. The first two postnatal weeks are the time when folds of cerebellum develop, and three regions become discernible – centrally located vermis, two hemispheres laterally, and the lateral-most paraflocculi. Within each of the regions specific fissures appear along the anterior-posterior axis.
The cytoarchitecture of the cerebellar folia is highly conserved in all mammals. It is relatively simple: only a few cell types (Purkinje, stellate, basket, Golgi, granule cells, Lugaro cells, and unipolar brush cells) are arranged into three layers - from superficially to deep they are known as molecular layer, consisting of interneurons and glial cells, a monolayer of Purkinje cells (PCs) in the middle, and internal granule cell layer [10] (Figure 1). Granule cells are the only excitatory neurons, while all the other are inhibitory [11]. PCs constitute the principal neurons in cerebellar cortex and they provide the only output of it. Their loss is related not only to several neurological disorders such as cerebellar ataxia [12], autism spectrum disorders [13] and progressive myoclonic epilepsies [14] but also to specific peripheral immune alterations [15]. However, our knowledge about the events regulating their development is still limited.
Cerebellar development depends on multiple factors, molecular and cellular, including growth factors, hormones, transcription factors and epigenetic factors, as well as cell-to-cell interactions. Zinc fingers are the largest group of transcription factors with the finger domain, which play a pivotal role in gene regulation [16]. The zinc finger and BTB domain-containing 20 (Zbtb20) gene encodes for a transcription factor, involved in pre- and postnatal development, as well as in a range of pathological conditions [17,18]. As a transcription factor, Zbtb20 acts as a molecular switch, guaranteeing that genes regulating various cellular processes, including autophagy, apoptosis, differentiation, metabolism, and immune responses, depending on the specific cell type, are expressed at the appropriate time.
Existence of natural mutants hampering cerebellar development and functioning, together with genetically engineered animal models, allowed to target particular gene products in certain cell lineages, thus revealing their developmental and functional implication [19,20]. Zbtb20 gene of the mutants lacks the functionally important BTB domain of the protein, as well as the first zinc finger. Knockout of Zbtb20 results in direct or indirect downregulation of cell division rates in a variety of cell types, including chondrocytes, post-stroke astrocytes, and cortical radial glia progenitors [21,22,23]. Conditional deletion of Zbtb20 in cortical progenitors, and to lesser extend in differentiating neurons, results in an increase in the number of neurons in layer IV at the expense of layers II and III [24]. Increased Zbtb20 expression in patients with hepatocellular carcinoma is associated with poor clinical prognosis and high relapse rate [25,26]. However, the role of Zbtb20 in cerebellar development, particularly in the PCs genesis and function, has not been studied yet. Understanding the mechanisms behind those processes may pave the road to potential intervention in variety of pathological entities related to PCs insufficient development or degeneration.
2. Results
In order to explore the effect of transcription factor Zbtb20 on the PCs development, we examined specimens from wild-type mice (WT, Zbtb20+/+), used as controls, and knockout mice (Zbtb20-/-), referred to as mutants, at different postnatal stages: postnatal (P) day 4, 8, and 12. The PCs were detected via immunofluorescent method using antibody against Calbindin (CB), a specific marker of these cells. Quantitative analysis was performed to compare the time- and space distribution of PCs in corresponding sections of cerebellum from the two experimental groups. Cell number was counted as average per cerebellar folium, per 1 mm length of the Purkinje layer, and in 10 000 µm2 from regions of interest (ROI). The latter was particularly important for the comparative analysis of specimens at the early developmental stage (P4), when PCs are not yet arranged in a monolayer.
2.1. Development of PCs at Postnatal Day 4
At postnatal day 4, PCs are undergoing significant changes. At this stage, some of the unique features of the PCs are already noticeable – cells have more or less stellate appearance, somas are not yet arranged in a thin single-celled layer; the dendritic trees and axons undergo rapid development. Overview image of a parasagittal sections of cerebellum from a wild-type (+/+) and knockout mouse (-/-) is shown in Figure 1
Quantitative comparison of PCs distribution among the folia indicated that in most of the folia of the mutant cerebellum the number of PCs per areas of 10 000 µm2 is higher than in the controls (Figure 2).
Additionally, the number of cells per 1 mm length of randomly chosen areas of the Purkinje layer, without taking into consideration the number of the folium, was counted. Statistical analysis indicated that the average number was significantly higher in the Zbtb20-/- mutants (27 cells/1 mm) compared with the wild-type animals (25 cells/1 mm) (Figure 3). Similar correlation was observed when the total number of PCs per corresponding cerebellar sections were compared: in the mutants - 270 cells per section, vs. 255 cells per section from the controls (Figure 4).
2.2. Development of PCs at Postnatal Day 8
On the P8, PCs showed significant developmental alterations. Their dendritic processes were more complex (Figure 5) and distal spines were observed (not shown here). Additionally, PCs demonstrated branching axonal pattern. The quantitative analysis on average number of PCs per folium showed tremendous difference between the folia in each experimental group, as well as comparing the two types of mice. They were most numerous in folium 4-5 (96 cells in mutants, and 89 in the controls), followed by folium 3 and 6 with (63 vs. 86, and 73 vs. 53 cells, respectively). However, we found more PCs in folia 3 and 8 of the controls, while in the rest of the folia their number prevailed in the homozygous mutants (Figure 6).
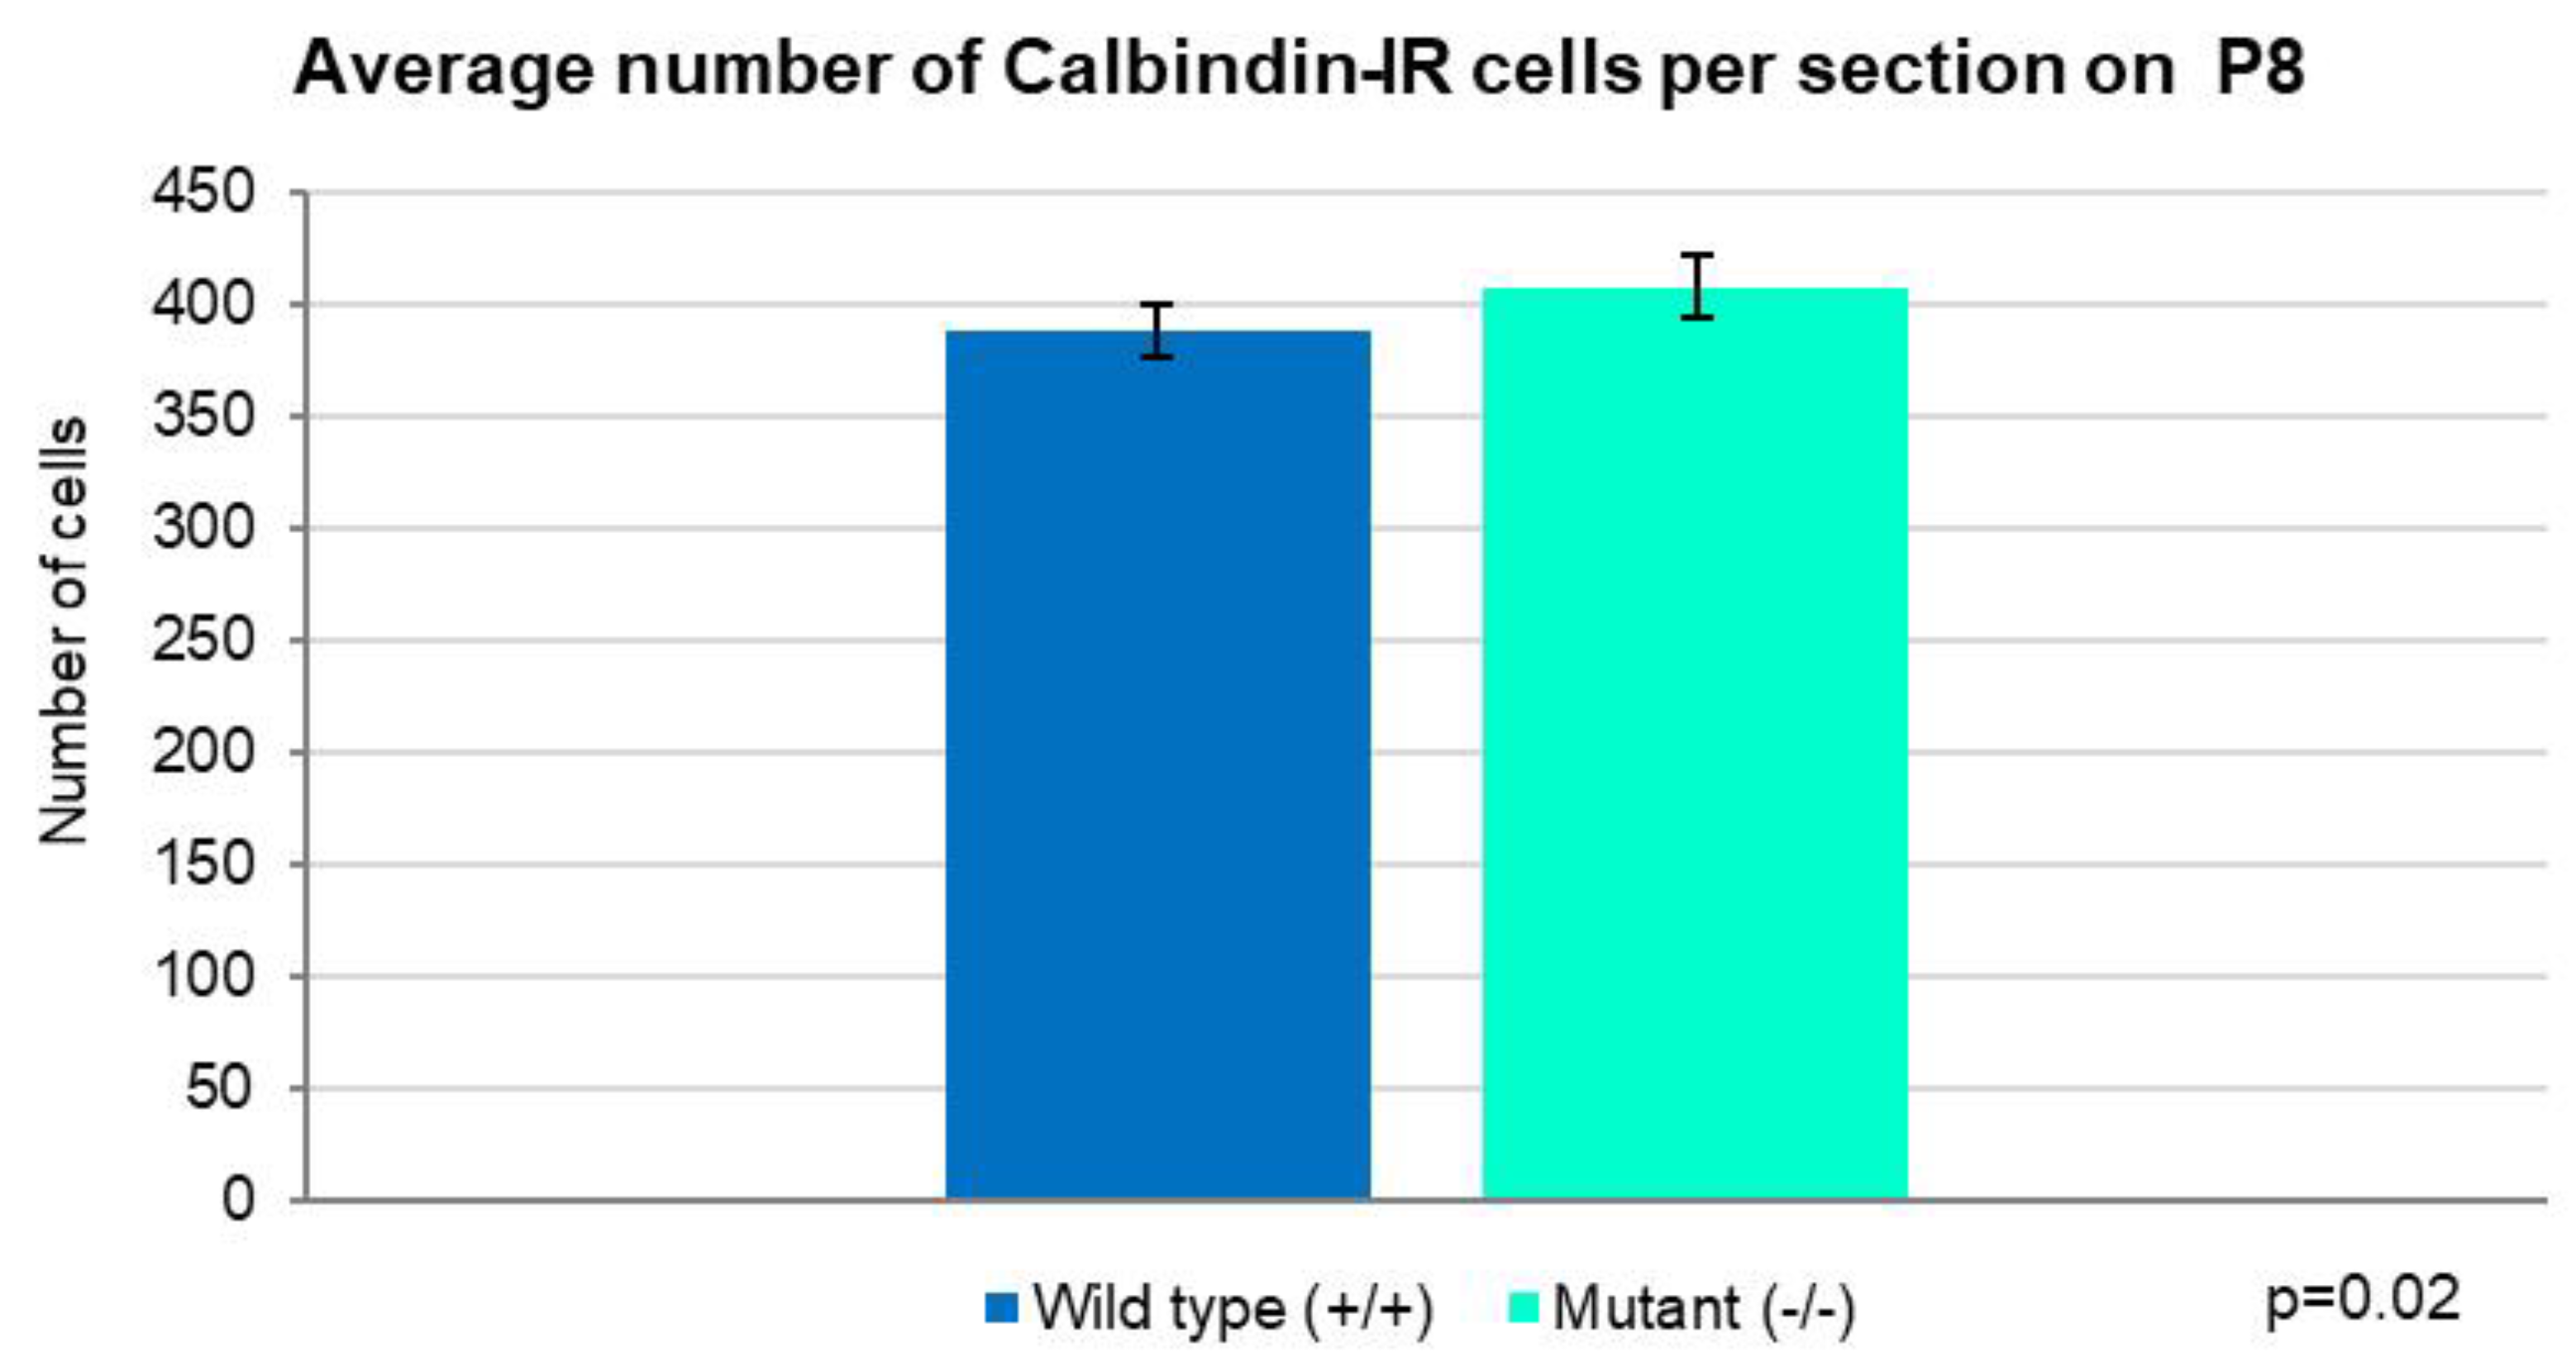
When we looked at the density of the PCs in the individual folia we noticed that only in folium 2 there were more CB-IR cells per 10,000 µm2 in the wild-type mice compared with the mutants, though the difference was insignificant (Figure 7). In the rest of the folia, PCs were more numerous per ROI in the knockout animals, with statistical significance only in folia 3 and 10 (p<0.05) (Figure 7). Comparison of the average total number of PCs per section again showed higher density in the mutants (p=0.02) (Figure 8).
2.3. Development of PCs at Postnatal Day 8
Changes in the morphology of the PCs at postnatal day 12 are significant, and on the overview photo, the advancement in dendritic tree branching is clearly visible (Figure 9). Highly branched dendrites already exhibit “espalier” morphology, characterized by extend primarily in a plane, which makes them look like thin leaflets. However, at higher magnification, PCs from the Zbtb20-/- group (d) showed fewer branch points and less density of the dendritic tree compared with the controls (b).
Figure 9.
Overview of the developing cerebella on P12, stained for detection of CB; (a, c) Parasagittal sections at low magnification. (b, d) Higher magnification of the fragments on (a, c). Arrows point at the intricately branched dendrites of the PCs. Of notice is the less dense branching in the mutants.
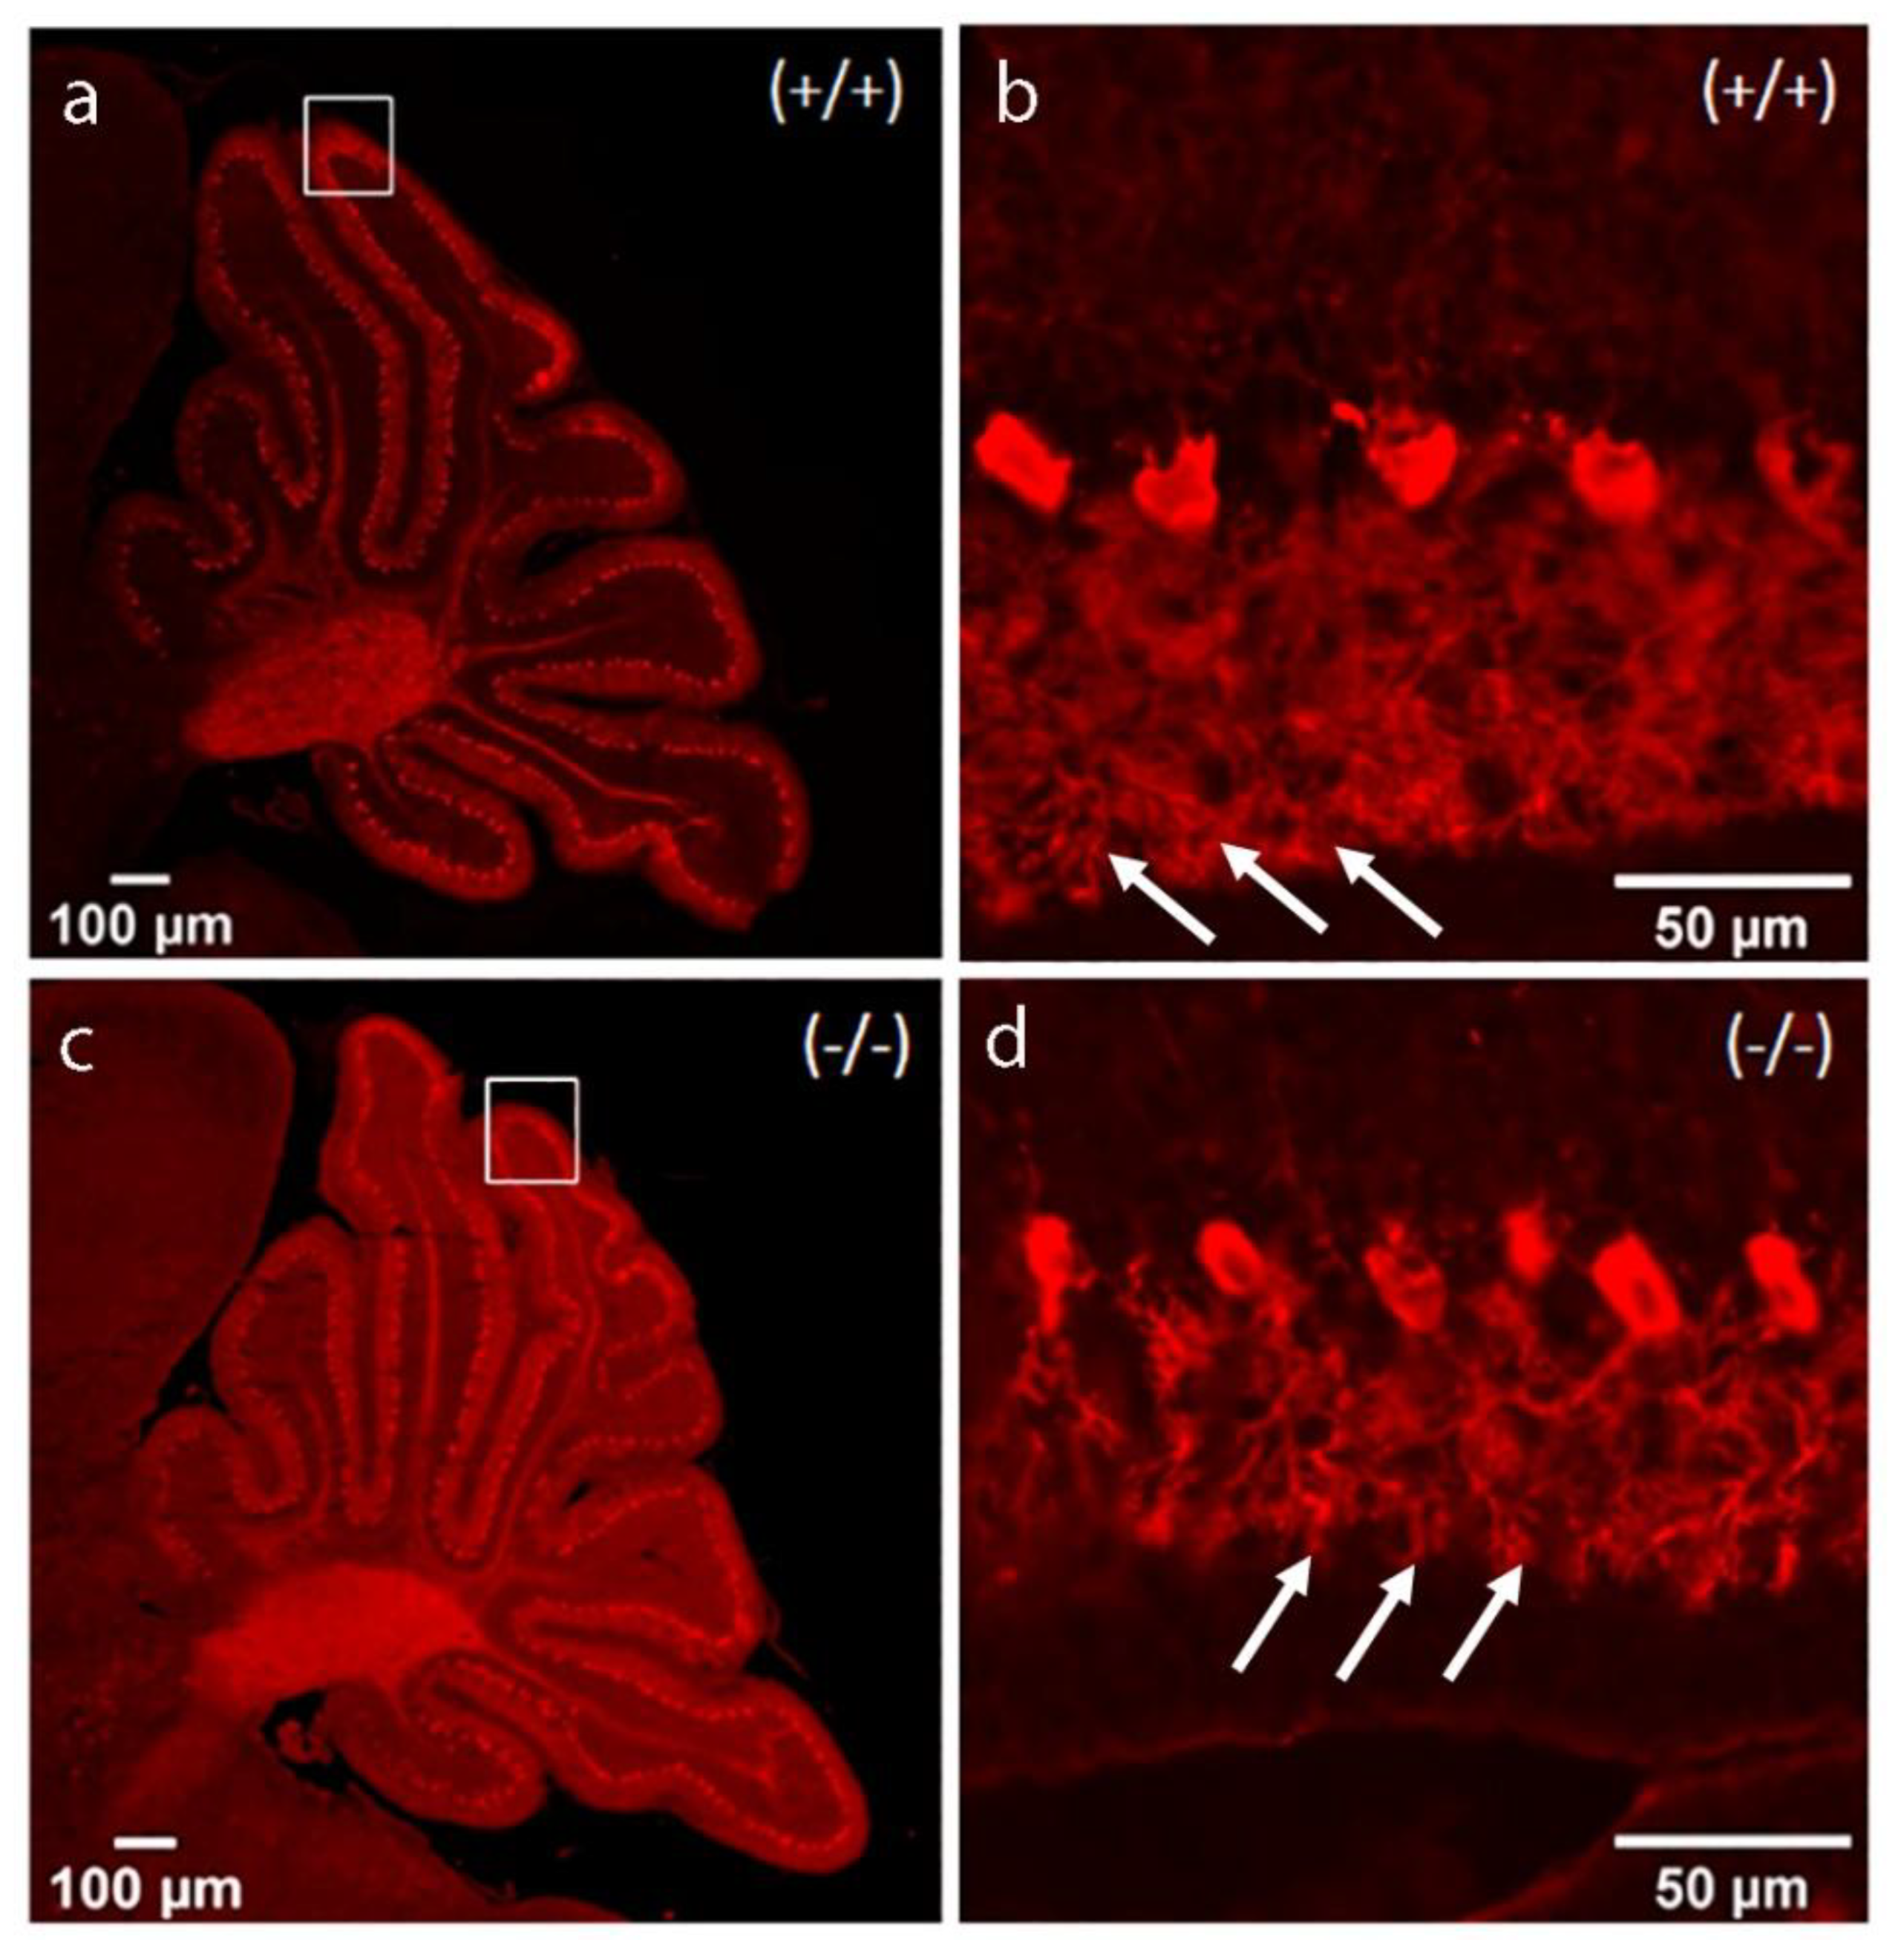
Figure 10.
Graph representing the distribution of PCs within 1 mm of the Purkinje layer in the individual folia. At P12 most of the folia of the wild-type (Zbtb20+/+) mice express higher number of cells, a significant difference found only in folium 10 (Independent T-test, p<0.05). Error bars indicate the SD.
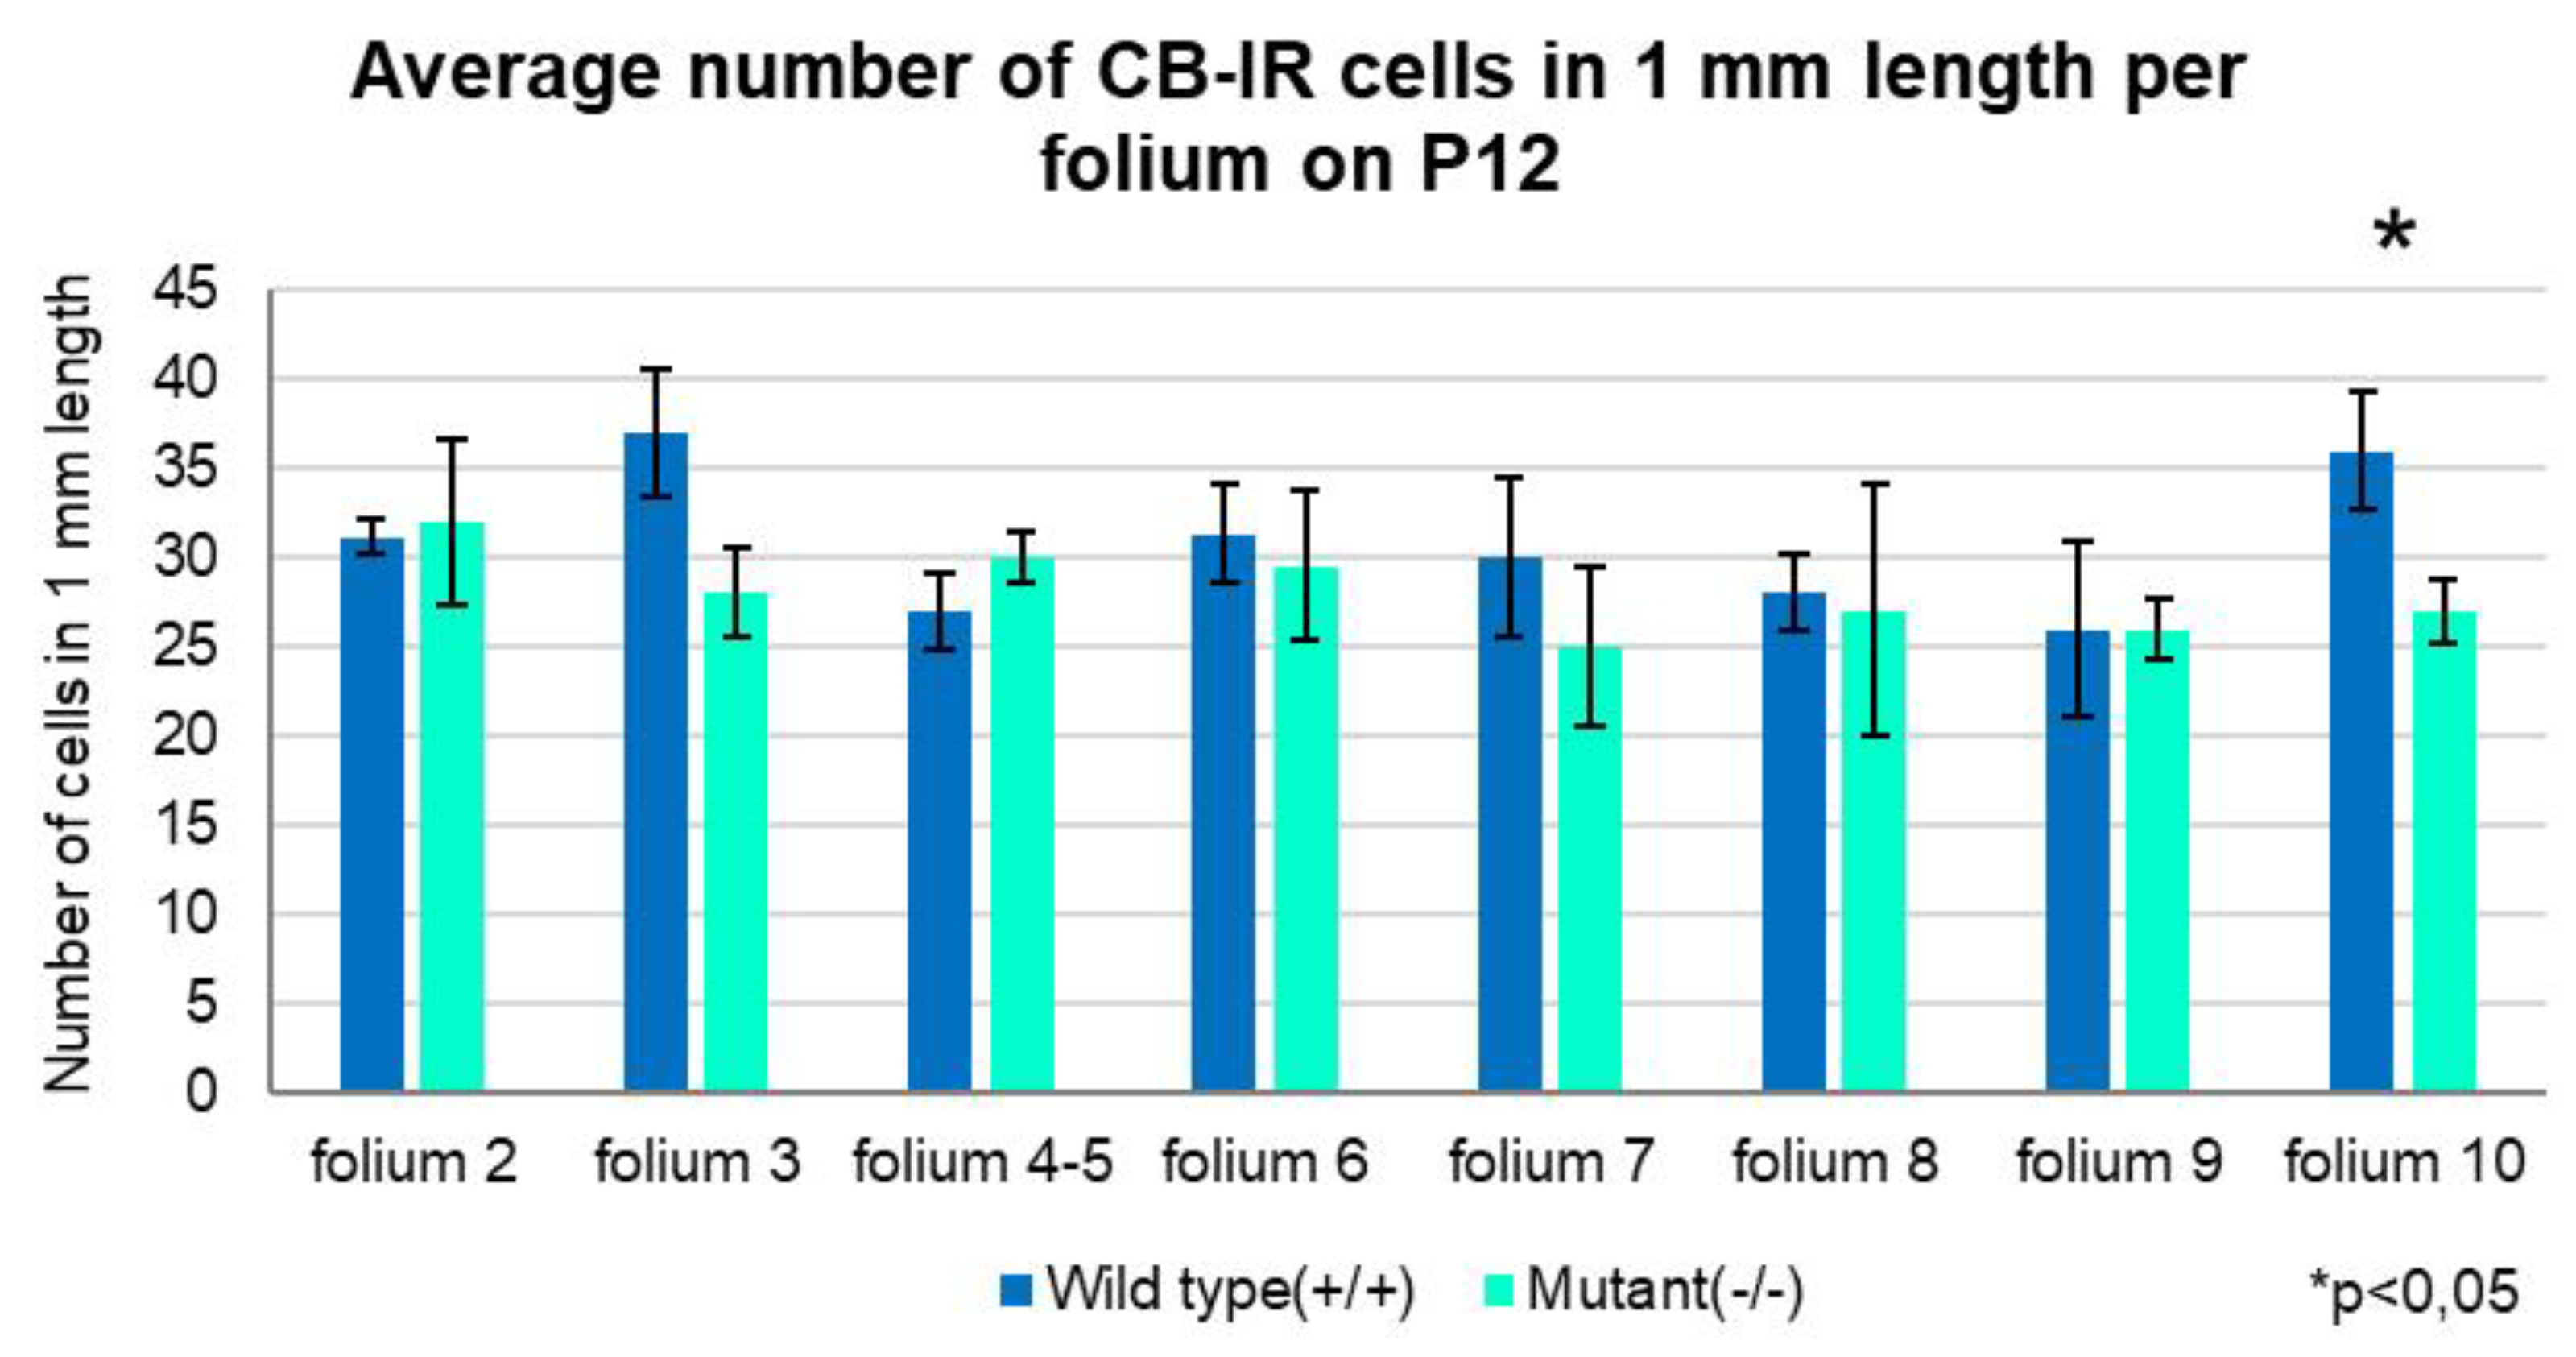
Figure 11.
Graph summarizing the number of Purkinje cells per 1 mm length of the layer in the entire section. On postnatal day 12, the average number of PCs was slightly higher in the wild-type (31) vs. 28 in the Zbtb20-/- group (Independent T-test, p=0.137). Error bars indicate the SD.
Figure 11.
Graph summarizing the number of Purkinje cells per 1 mm length of the layer in the entire section. On postnatal day 12, the average number of PCs was slightly higher in the wild-type (31) vs. 28 in the Zbtb20-/- group (Independent T-test, p=0.137). Error bars indicate the SD.
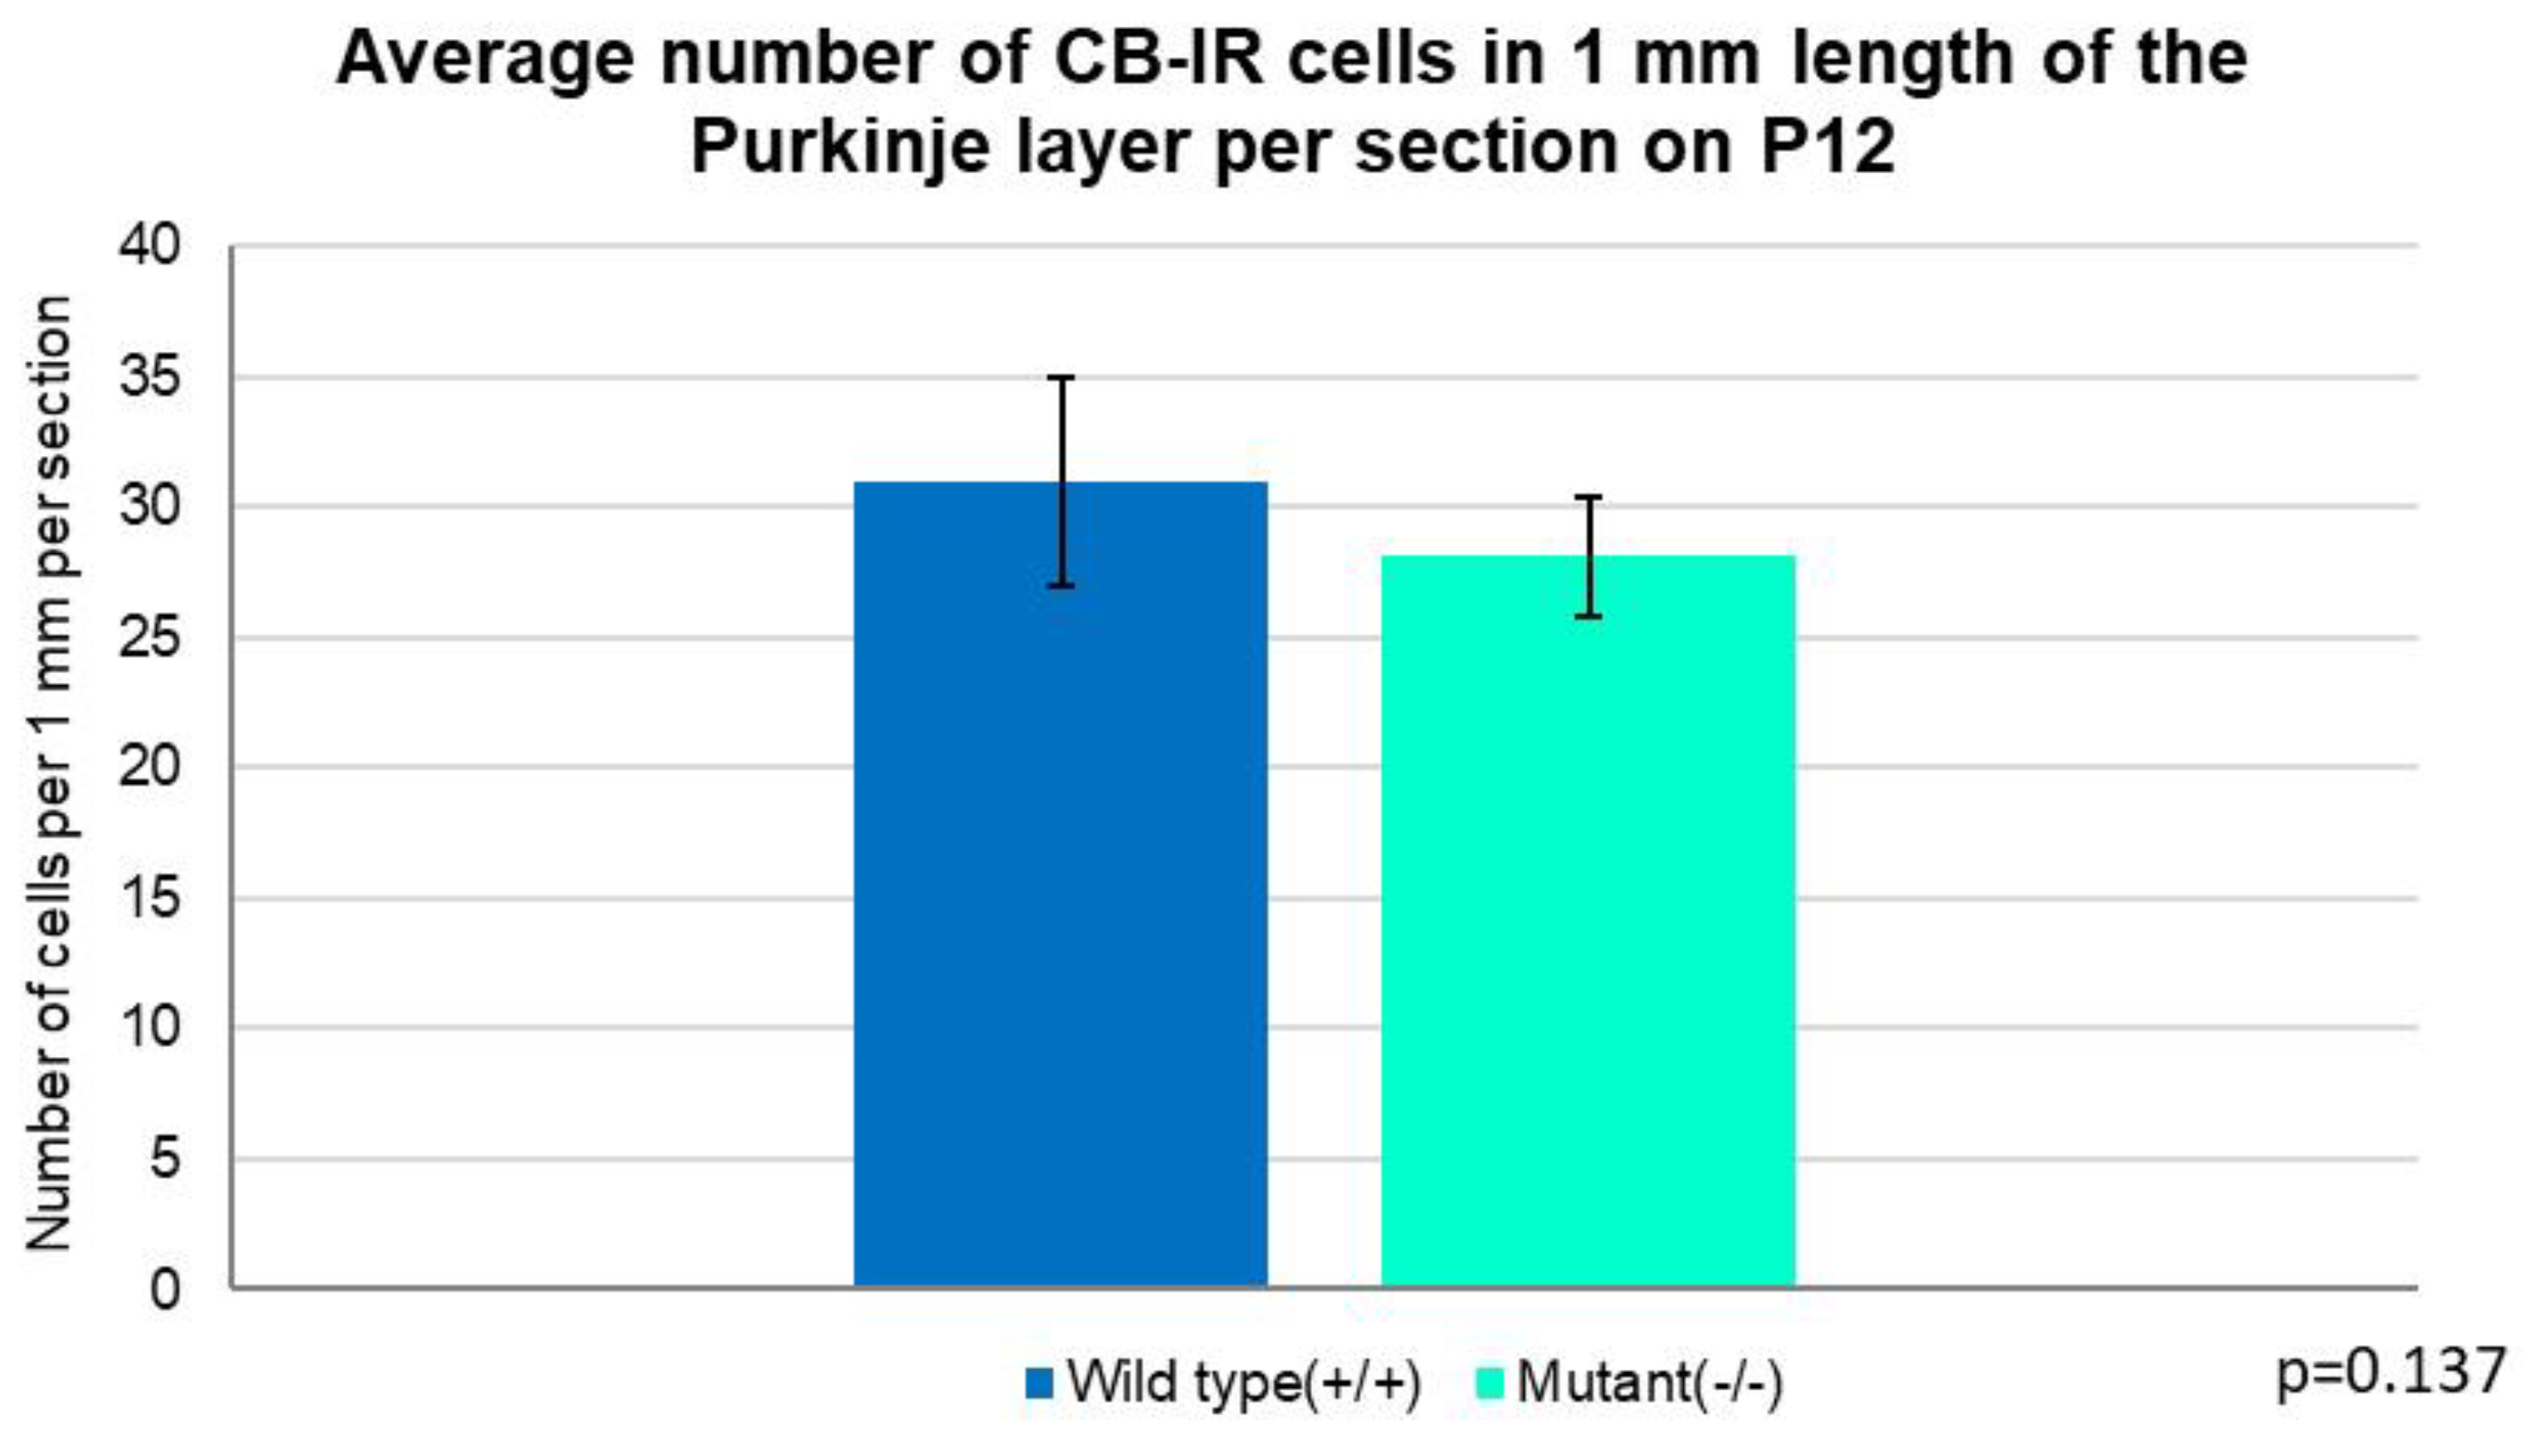
Figure 12.
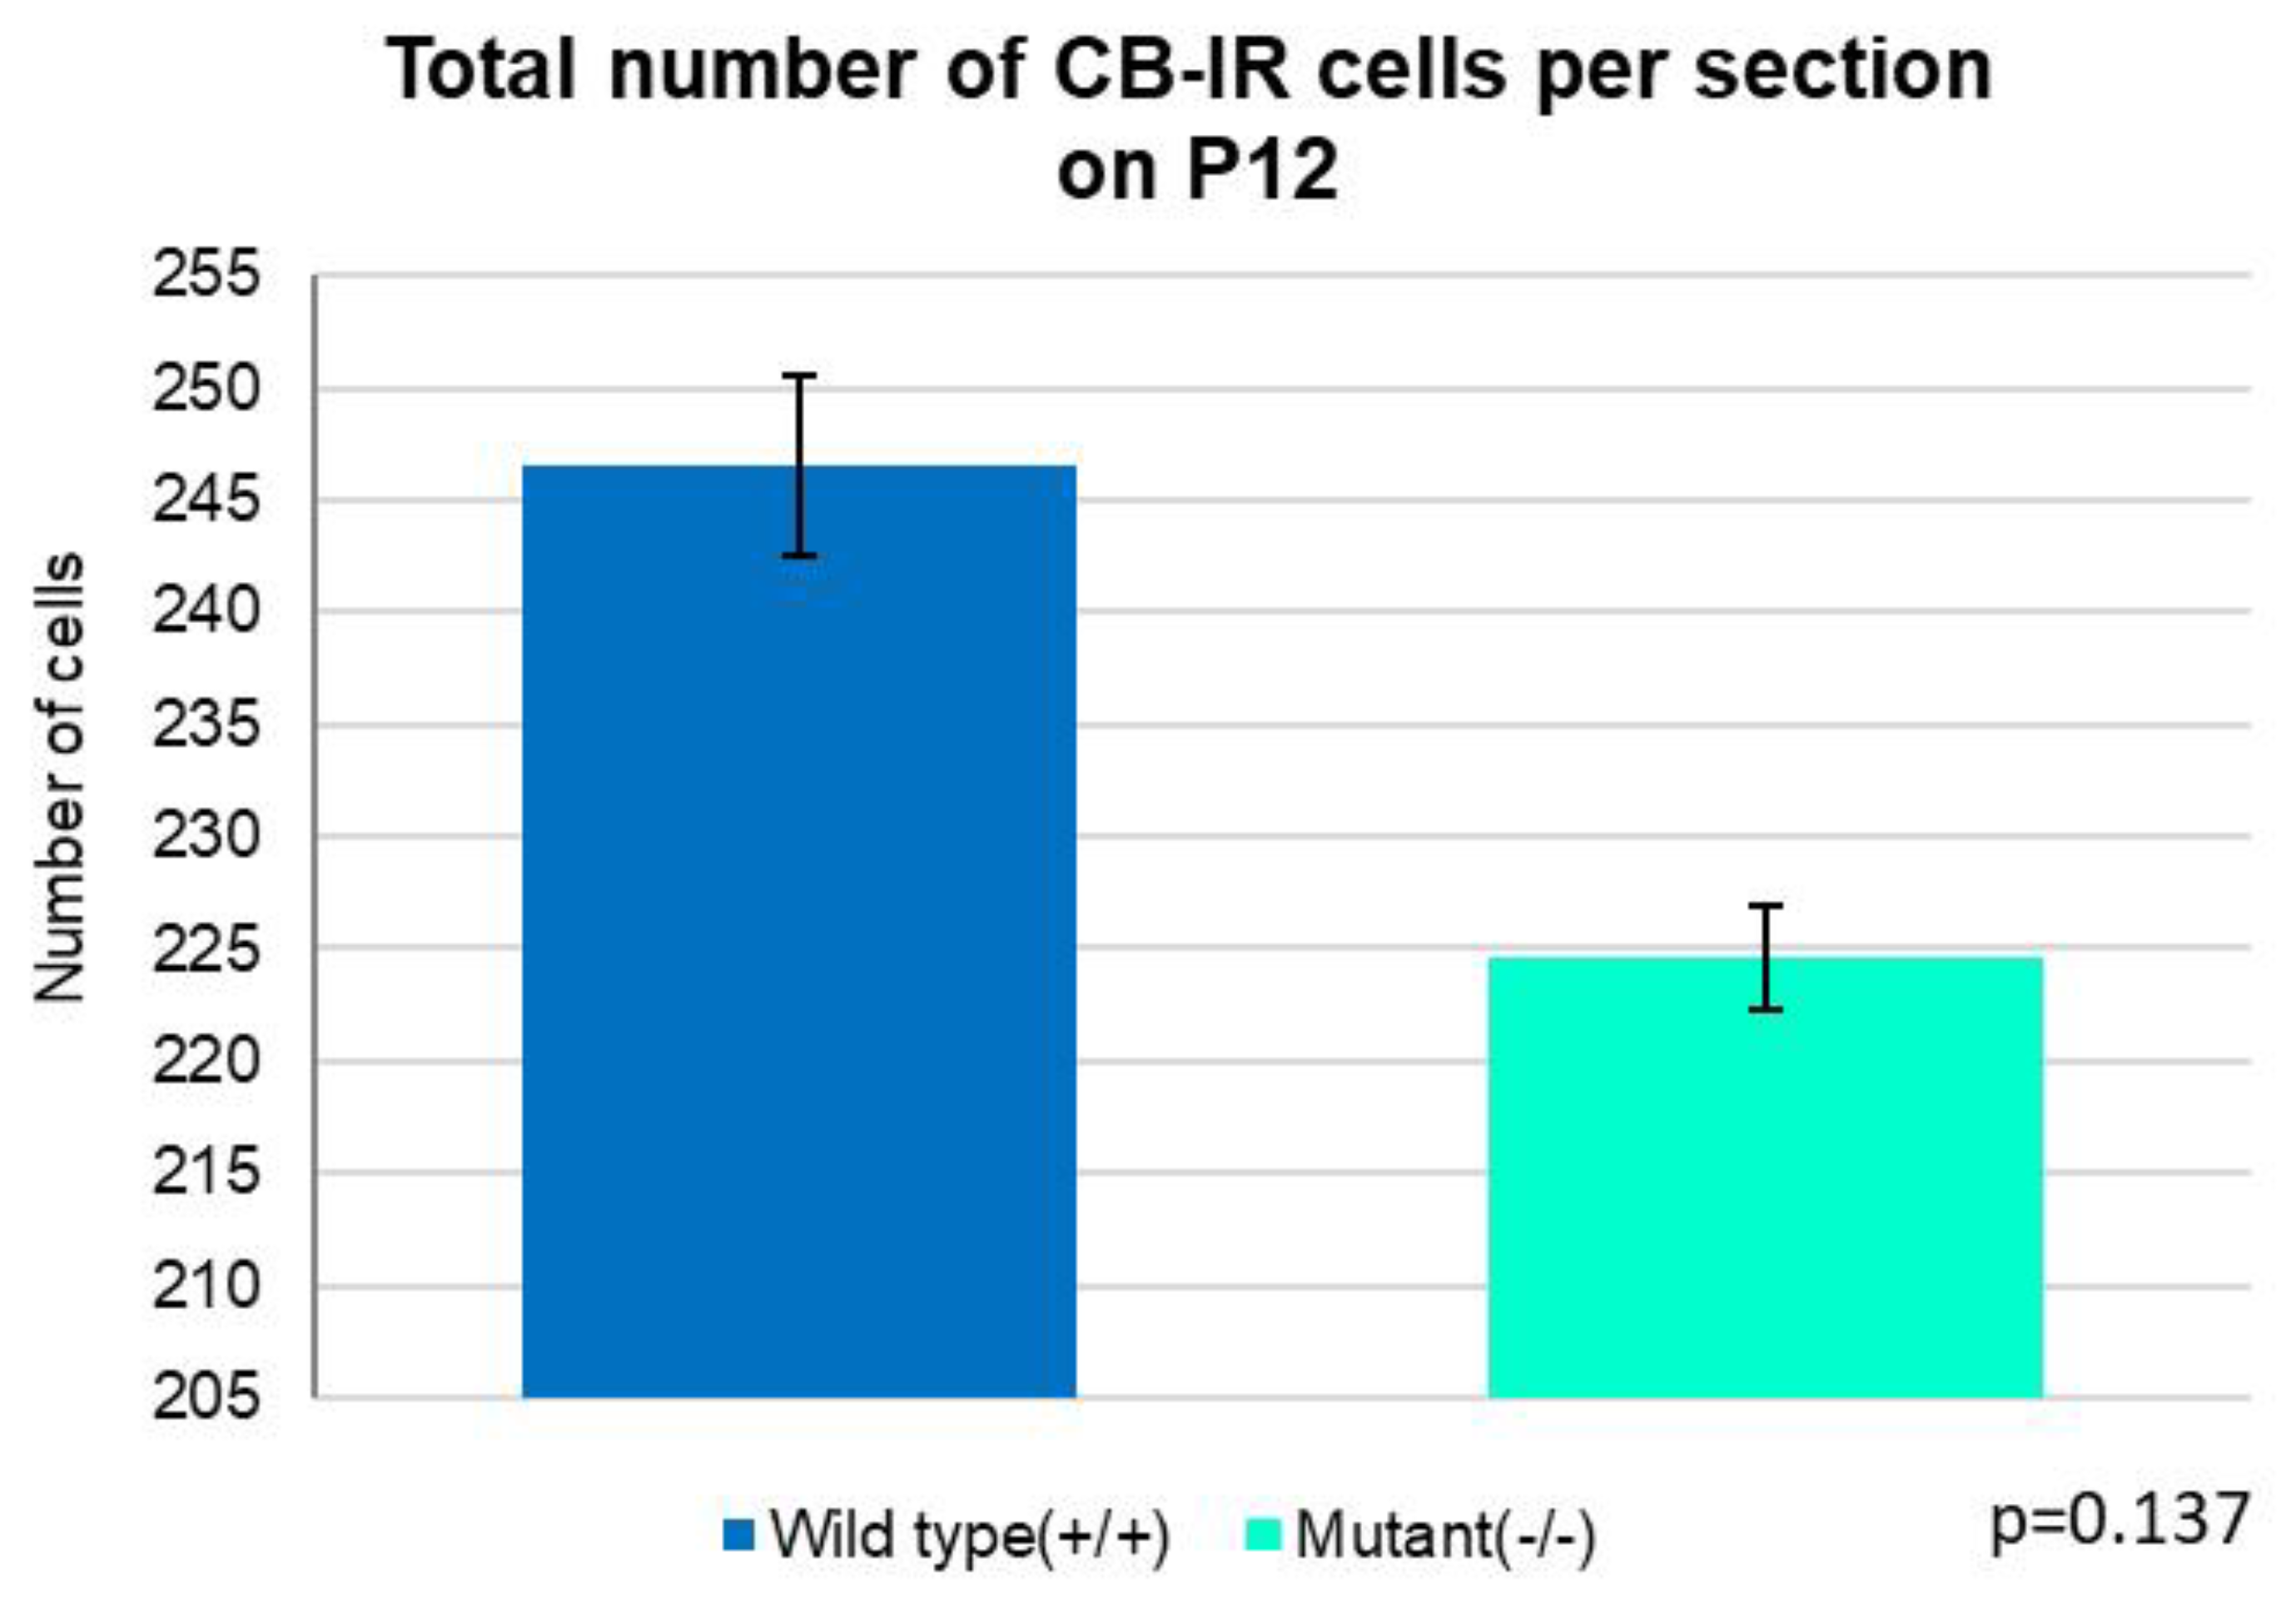
The average total number of PCs in entire cerebellar section of control animal (247 cells) insignificantly exceeded the one of the mutants (225 cells) (Independent T-test, p=0.137). Error bars indicate the SD.
Figure 12.
The average total number of PCs in entire cerebellar section of control animal (247 cells) insignificantly exceeded the one of the mutants (225 cells) (Independent T-test, p=0.137). Error bars indicate the SD.
3. Discussion
Here we investigated the role of Zbtb20 in developing cerebellar cortex, particularly its effect on Purkinje cells generation and distribution along the middle cortical layer. Our results showed that the transcription factor has time- and space-differential effect on these processes: on P4, the lack of Zbtb20 in knockout mice resulted in upregulated number of PCs per 10,000 µm2, as well as selectively in folia 3, 8, 9 and 10; on P8 the PCs’ number was higher only in folia 3 and 10 of the knockout animals, while on P12 we observed the opposite – slightly lower number of PCs in most of the mutant folia, but in folium 10 this difference was significant. To the best of our knowledge, this is the first such study on the role of Zbtb20 on early postnatal development of the Purkinje cells.
Undoubtedly, PCs are the most conspicuous neurons in the cerebellum, and the processes of formation of their space-filling and non-overlapping dendritic tree pattern has been studied extensively [27,28]. Purkinje cell dendrites grow in two stages: first the thicker primary dendrites are formed and then thinner once covered in spines [29]. Mature PCs have distinctively flat dendrite, almost two-dimensional, providing maximal contact with perpendicular parallel fibers. During the early postnatal development, PCs grow two or more dendritic trees, and then only one stays as a primary tree, while the others retract [30]. The events are regulated via environmental factors, such as hormones, neuronal growth factors, protein kinase C [28], and particularly the parallel fiber of granule cells [31,32], which, via their synaptic inputs, stimulate the elaboration of dendritic trees [33,34,35]. The mechanisms of these interactions have been studied widely, using in vitro and in vivo methods, including genetically manipulated experimental animal models, for more precise identification of molecules involved.
Validation of the synaptotrophic hypothesis [33] was provided by genetic manipulation of the best-characterized proteins responsible for synaptogenesis between granule cells and PCs – the presynaptic ligand cerebellin-1 (Cbln1) and postsynaptic receptor GluD2, which also binds neurexin, a presynaptic plasmalemma protein [32], thus forming a tripartite synaptic adhesion complex [36,37]. GluD2 sparse knockout mice lose nearly half of synapses between the parallel fibers and PCs’ dendrites. Additionally, density of the branch points at the PCs’ bodies appears lower, compared with the wild-type, as early as P10 [32]. Surprisingly, without specifically investigating the type of dendritic arborizations, we observe a similar phenomenon in the specimens from Zbtb20-/- group. Whether this phenomenon is due to more intense retraction or underdevelopment of dendritic trees is still unclear. Nevertheless, we cannot rule out the possibility that Zbtb20 is involved in PCs’ synaptogenesis. Therefore, further research is needed to clarify this probable function of the transcription factor, and to focus also on effect on dendritic spines development.
In this study we observed dynamic spatio-temporal pattern of PCs distribution among the cerebellar folia during the early postnatal period. Initially, at stage P4, the number of PCs was higher in most of the folia of Zbtb20-/- mutants compared with the wild-type controls. However, this changed gradually, and on P12 most of the cerebellar folia showed the opposite proportion; even in folium 10 of the controls the population of CB positive PCs was significantly higher than in the corresponding folium in knockout animals. These results suggest that Zbtb20 probably suppresses precursors’ proliferation and generation of PCs immediately after birth, thereafter, the effect gradually weakens, and by the end of the second week it is completely absent in all cerebellar folia of the mutants.
Alterations in the PCs population developments, similar to which we found in our Zbtb20-deficit mice, has been related to mutations in the gene encoding β-III spectrin. Spectrin-actin network at the plasma membrane is required to maintain cellular morphology and function [38]. Experiments with functional β-III spectrin knockout mouse (β-III−/−) provided evidence that the animals develop motor deficits and age-related PCs loss [39]. The phenomenon was related to PCs dysfunction recapitulating behavior and neuropathology of spinocerebellar ataxia 5 in humans [40]. However, despite the similarity in the histological findings in these and our experiments, we still cannot say what the exact role of Zbtb20 is in cerebellar pathology.
Our findings of changes in the shape and number of CB-expressing PCs in Zbtb20-/- mutants is in accordance with the recently reported induced alterations in PCs of fetuin-A knockout mouse, also a model of Parkinson’s disease [41]. In this single study, fetuin-A expression in cerebellum was found reduced proportionally to the severity of Parkinson’s disease. However, the exact mechanisms of PCs’ impairment are still elusive. Nevertheless, fetuin-A is known as a multifunctional protein involved in a myriad of essential biological processes. It is essential for the mineral homeostasis, particularly calcium metabolism, it has immunomodulatory functions, and plays a role in brain development and protection [42,43]. The neuroprotective function was ascribed to the anti-inflammatory effect of fetuin-A, due to reduction of TNF-alpha synthesis, as well as downregulation of macrophage and microglial activity [44]. Whether Zbtb20 acts through similar mechanisms, we do not yet know.
Overall, the role of Zbtb20 in the CNS under normal and pathological conditions has been extensively studied. Zbtb20 was found essential for cochlear maturation, hearing [45] and nociception [46], olfactory bulb development [23], dendritic arborization and dendritic spine morphology in the cerebral cortex [47], pyramidal hippocampal neurons generation [48], etc. Pathological entities, underlined by mutations in Zbtb20, comprise a broad spectrum of morphological, neurological and behavioral alterations [49,50,51,52]. However, there is still a lack of knowledge about the guiding role of Zbtb20 in cerebellar development. Our study is the first to reveal some of the effects of Zbtb20 on PCs population, and to certain extent on their appearance. It suggests that some of the cerebellar disorders could also be etiologically related to this transcription factor. We believe that deeper insights into the topic will be essential for the design of new effective strategies for neuroprotection and the alleviation of some neurodegenerative disorders.
4. Materials and Methods
4.1. Experimental Animals and Tissues Preparation
The samples of Zbtb20 knockout mutant mice and normal wild-type animals were used in this study. The procedure for generation of homozygous Zbtb20-/- mutant mice has been previously described in detail [53]. Permission for the animal experiments was received by the Niedersächsische Landesamt für Verbraucherschutz und Lebensmittelsicherheit (LAVES)/Oldenburg, resolution № 33.9-42502-04-11/0622 of 07.12.2011. The animals have been handled in accordance with the German Animal Protection Law. Briefly, animals were sacrificed at P4, P8, and P12 via transcardiac perfusion with ice-cold 4% paraformaldehyde. The brains were isolated, and the cerebella were dissected and immersed in paraformaldehyde at 4°C for post-fixation. Prior to sectioning, tissues were cryoprotected with PBS/Sucrose (30%), and embedded in OCT. The sections were cut at 10 µm.
4.2. Immunofluorescent Staining
Immunostaining was performed on 36 slices, equally distributed in two major groups, i.e.; WT and mutants, and 3 subgroups of P4, P8, and P12, respectively. The removal of OCT was followed by antigen retrieval for 5 min at 95oC in citrate buffer (pH 6.0). Appropriate washes in PBS (3 × 5 min) followed this and subsequents treatments. Sections were immersed in 1% bovine serum albumin (in PBS containing 0.01% Triton-X) for 20 min. and incubated for 20 h at room temperature in monoclonal rabbit primary antibody against Calbindin (CB), marker for the Purkinje cells (1:500, dilution Sigma). Following several washes, the specimens were incubation in the secondary antibody (IgG conjugated to Alexa fluorochrome) AF546 or AF488 goat anti-rabbit (Invitrogen, dilution 1:200) was for 2 hours, at room temperature. The samples were counterstained with the fluorescent dye 4′,6-diamidino-2-phenylindole DAPI (cat. # 10236276001, Merck, Germany, dilution 1:1000) at room temperature for 15 min. After several washes in PBS, specimens were rinsed in distilled water, and embedded in fluorescent mounting medium (Carl Roth, Germany).
4.3. Imaging and Statistical Analysis
Miscroscopic images were captured using a fully motorized wide-field microscope Zeiss AxioImager Z.2 (Carl Zeiss, Germany) equipped with the appropriate filter, and an AxioCam Mrm rev.3 monochrome CCD camera (Carl Zeiss, Germany), and AxioVision v.4.9 software through an EC Plan-Neofluar objectives 5x, 10x, 20x, and 40x. Shading from the irregular illumination field was corrected during the acquisition via the camera built-in shading correction. The images were saved.zvi format (Zeiss) of the AxioVision software, stitched together, and exported to an 8-bit TIFF format for further processing and analysis with the ImageJ2 (Version 2.3.0/1.53f, Fiji). The number of PCs was counted per folium - in 1 mm length of the Purkinje layer or in regions of interest (ROI) along the layer, with size of 100x100 µm. The latter was applied because at the early postnatal stage (P4), the PCs are not yet arranged in a monolayer. However, for consistency, we continued applying it to the specimens from the later stages of development, P8 and P12. Additionally, quantitative analyses were performed per section – calculating the total number of PCs.
Statistical analysis was performed using IBM SPSS Statistics for Windows, version 29.0.0.0 (241) (IBM Corp.; Armonk, NY, USA). Independent T-test was applied for the given values with a Confidence Interval (CI) of 95%. Statistical significance between the two experimental groups was considered if p< 0.05. Error bars indicate the Standard Deviation (SD).
Author Contributions
Conceptualization, I.V. and I.S.; methodology, I.V. and I.S.; formal analysis, I.V.; I.S.; M.B. and T.P..; investigation, I.V..; data curation, I.S..; writing—original draft preparation, I.S..; writing—review and editing, I.V.; M.B. and T.P; visualization, I.V. and I.S..; supervision, I.S.; project administration, I.S. All authors have read and agreed to the published version of the manuscript.
Funding
This research received no external funding.
Institutional Review Board Statement
Permission for the animal experiments was received by the Niedersächsische Landesamt für Verbraucherschutz und Lebensmittelsicherheit (LAVES)/Oldenburg, resolution № 33.9-42502-04-11/0622 of 07.12.2011. The animals have been handled in accordance with the German Animal Protection Law.
Data Availability Statement
The original contributions presented in this study are included in the article. Further inquiries can be directed to the corresponding author.
Acknowledgments
The authors are grateful to Professor A. Stoyakova, Max Plank Institute for Biophysical Chemistry and Molecular Development Neurobiology Laboratory, Göttingen, Germany, for providing us with the specimens used in this study. We thank V. Kenovska, Y. Yaneva, S. Kostadinova and E. Boeva† for their technical support in the lab.
Conflicts of Interest
The authors declare no conflicts of interest.
Abbreviations
The following abbreviations are used in this manuscript:
| Zbtb20 | Zink finger and BTB domain-containing protein 20 |
| PCs | Purkinje cells |
| CB | Calbindin |
| IR | Immunoreactive |
References
- Schmahmann, J.D. and D. Caplan, Cognition, emotion and the cerebellum. Brain 2006, 129, 290–2. [Google Scholar] [CrossRef] [PubMed]
- Schmahmann, J.D. ; The cerebellum and cognition. Neurosci Lett 2019, 688, 62–75. [Google Scholar] [CrossRef]
- y Cajal, S.R. ; Estructura de los centros nerviosos de las aves. 1888.
- Cajal, S.R. ; Recuerdos de mi vida, Vol. 2, Historia de mi labor científica. Madrid: Moya, 1917.
- Sultan, F. and J.M. Bower, Quantitative Golgi study of the rat cerebellar molecular layer interneurons using principal component analysis. Journal of Comparative Neurology 1998, 393, 353–373. [Google Scholar] [CrossRef]
- Leto, K.; et al. Different types of cerebellar GABAergic interneurons originate from a common pool of multipotent progenitor cells. Journal of Neuroscience 2006, 26, 11682–11694. [Google Scholar] [CrossRef]
- Sgaier, S.K.; et al. Morphogenetic and cellular movements that shape the mouse cerebellum; insights from genetic fate mapping. Neuron 2005, 45, 27–40. [Google Scholar] [CrossRef]
- Schilling, K. ; Moving into shape: cell migration during the development and histogenesis of the cerebellum. Histochem Cell Biol 2018, 150, 13–36. [Google Scholar] [CrossRef]
- Herrup, K. and B. Kuemerle, The compartmentalization of the cerebellum. Annu Rev Neurosci 1997, 20, 61–90. [Google Scholar] [CrossRef]
- Ashida, R.; et al. Principles of organization of the human cerebellum: macro- and microanatomy. Handb Clin Neurol 2018, 154, 45–58. [Google Scholar] [PubMed]
- Geurts, F.J. E. De Schutter, and S. Dieudonné, Unraveling the cerebellar cortex: cytology and cellular physiology of large-sized interneurons in the granular layer. Cerebellum 2003, 2, 290–9. [Google Scholar] [CrossRef]
- Parvez, M.S.A. and G. Ohtsuki, Acute Cerebellar Inflammation and Related Ataxia: Mechanisms and Pathophysiology. 2022, 12.
- Tsai, P.T.; et al. Autistic-like behaviour and cerebellar dysfunction in Purkinje cell Tsc1 mutant mice. Nature 2012, 488, 647–51. [Google Scholar] [CrossRef] [PubMed]
- Bernardi, S. F. Gemignani, and M. Marchese, The involvement of Purkinje cells in progressive myoclonic epilepsy: Focus on neuronal ceroid lipofuscinosis. Neurobiol Dis 2023, 185, 106258. [Google Scholar] [CrossRef]
- Del Pilar, C.; et al. The Selective Loss of Purkinje Cells Induces Specific Peripheral Immune Alterations. Front Cell Neurosci 2021, 15, 773696. [Google Scholar] [CrossRef]
- Li, X.; et al. Structures and biological functions of zinc finger proteins and their roles in hepatocellular carcinoma. 2022. 10, 2.
- Kelly, K.F. and J.M. Daniel, POZ for effect--POZ-ZF transcription factors in cancer and development. Trends Cell Biol 2006, 16, 578–87. [Google Scholar] [CrossRef]
- Albagli, O.; et al. The BTB/POZ domain: a new protein-protein interaction motif common to DNA- and actin-binding proteins. Cell Growth Differ 1995, 6, 1193–8. [Google Scholar]
- Ben-Arie, N.; et al. Math1 is essential for genesis of cerebellar granule neurons. Nature 1997, 390, 169–72. [Google Scholar] [CrossRef]
- Oberdick, J.; et al. A promoter that drives transgene expression in cerebellar Purkinje and retinal bipolar neurons. Science 1990, 248, 223–6. [Google Scholar] [CrossRef] [PubMed]
- Tonchev, A.B.; et al. Zbtb20 modulates the sequential generation of neuronal layers in developing cortex. Mol Brain 2016, 9, 65. [Google Scholar] [CrossRef] [PubMed]
- Zhou, G.; et al. Zbtb20 regulates the terminal differentiation of hypertrophic chondrocytes via repression of Sox9. Development 2015, 142, 385–93. [Google Scholar] [CrossRef]
- Doeppner, T.R.; et al. Zbtb20 Regulates Developmental Neurogenesis in the Olfactory Bulb and Gliogenesis After Adult Brain Injury. Mol Neurobiol 2019, 56, 567–582. [Google Scholar] [CrossRef]
- Medeiros de Araújo, J.A.; et al. ZBTB20 is crucial for the specification of a subset of callosal projection neurons and astrocytes in the mammalian neocortex. 2021, 148.
- Wang, Q.; et al. Zinc finger protein ZBTB20 expression is increased in hepatocellular carcinoma and associated with poor prognosis. BMC Cancer 2011, 11, 271. [Google Scholar] [CrossRef] [PubMed]
- To, J.C.; et al. ZBTB20 regulates WNT/CTNNB1 signalling pathway by suppressing PPARG during hepatocellular carcinoma tumourigenesis. JHEP Rep 2021, 3, 100223. [Google Scholar] [CrossRef]
- Kato, M. and E. De Schutter, Models of Purkinje cell dendritic tree selection during early cerebellar development. 2023; 19, e1011320. [Google Scholar]
- Kapfhammer, J.P. ; Cellular and molecular control of dendritic growth and development of cerebellar Purkinje cells. Prog Histochem Cytochem 2004, 39, 131–82. [Google Scholar] [CrossRef]
- Cuntz, H.; et al. One rule to grow them all: a general theory of neuronal branching and its practical application. PLoS Comput Biol 2010, 6. [Google Scholar] [CrossRef] [PubMed]
- Armengol, J.A. and C. Sotelo, Early dendritic development of Purkinje cells in the rat cerebellum. A light and electron microscopic study using axonal tracing in ‘in vitro’ slices. Brain Res Dev Brain Res 1991, 64, 95–114. [Google Scholar] [CrossRef] [PubMed]
- Tanaka, M.; et al. Dendritic morphogenesis of cerebellar Purkinje cells through extension and retraction revealed by long-term tracking of living cells in vitro. Neuroscience 2006, 141, 663–674. [Google Scholar] [CrossRef] [PubMed]
- Takeo, Y.H.; et al. GluD2- and Cbln1-mediated competitive interactions shape the dendritic arbors of cerebellar Purkinje cells. Neuron 2021, 109, 629–644.e8. [Google Scholar] [CrossRef]
- Vaughn, J.E.; C. K. Henrikson, and J.A. Grieshaber, A quantitative study of synapses on motor neuron dendritic growth cones in developing mouse spinal cord. J Cell Biol 1974, 60, 664–72. [Google Scholar] [CrossRef]
- Bosman, L.W. and A. Konnerth, Activity-dependent plasticity of developing climbing fiber-Purkinje cell synapses. Neuroscience 2009, 162, 612–23. [Google Scholar] [CrossRef]
- Cline, H. and K. Haas, The regulation of dendritic arbor development and plasticity by glutamatergic synaptic input: a review of the synaptotrophic hypothesis. J Physiol 2008, 586, 1509–17. [Google Scholar] [CrossRef]
- Matsuda, K.; et al. Cbln1 is a ligand for an orphan glutamate receptor delta2, a bidirectional synapse organizer. Science 2010, 328, 363–8. [Google Scholar] [CrossRef]
- Uemura, T.; et al. Trans-synaptic interaction of GluRdelta2 and Neurexin through Cbln1 mediates synapse formation in the cerebellum. Cell 2010, 141, 1068–79. [Google Scholar] [CrossRef]
- Bennett, V. and A.J. Baines, Spectrin and ankyrin-based pathways: metazoan inventions for integrating cells into tissues. Physiol Rev 2001, 81, 1353–92. [Google Scholar] [CrossRef]
- Gao, Y.; et al. β-III spectrin is critical for development of purkinje cell dendritic tree and spine morphogenesis. J Neurosci 2011, 31, 16581–90. [Google Scholar] [CrossRef] [PubMed]
- Perkins, E.M.; et al. Loss of beta-III spectrin leads to Purkinje cell dysfunction recapitulating the behavior and neuropathology of spinocerebellar ataxia type 5 in humans. J Neurosci 2010, 30, 4857–67. [Google Scholar] [CrossRef]
- Yoon, S.; et al. Reduction of fetuin-A levels contributes to impairment of Purkinje cells in cerebella of patients with Parkinson’s disease. BMB Rep 2023, 56, 308–313. [Google Scholar] [CrossRef]
- Chekol Abebe, E.; et al. The structure, biosynthesis, and biological roles of fetuin-A: A review. Front Cell Dev Biol 2022, 10, 945287. [Google Scholar] [CrossRef] [PubMed]
- Elsas, J.; et al. Fetuin-a in the developing brain. Dev Neurobiol 2013, 73, 354–69. [Google Scholar] [CrossRef]
- Wang, H.; et al. Peripheral administration of fetuin-A attenuates early cerebral ischemic injury in rats. J Cereb Blood Flow Metab 2010, 30, 493–504. [Google Scholar] [CrossRef] [PubMed]
- Xie, Z. and X.H. Ma, ZBTB20 is essential for cochlear maturation and hearing in mice. 2023; 120, e2220867120. [Google Scholar]
- Ren, A.J.; et al. ZBTB20 regulates nociception and pain sensation by modulating TRP channel expression in nociceptive sensory neurons. Nat Commun 2014, 5, 4984. [Google Scholar] [CrossRef]
- Jones, K.A.; et al. Neurodevelopmental disorder-associated ZBTB20 gene variants affect dendritic and synaptic structure. 2018, 13, e0203760.
- Nielsen, J.V.; et al. Zbtb20-induced CA1 pyramidal neuron development and area enlargement in the cerebral midline cortex of mice. Cereb Cortex 2010, 20, 1904–14. [Google Scholar] [CrossRef]
- Alby, C.; et al. Novel de novo ZBTB20 mutations in three cases with Primrose syndrome and constant corpus callosum anomalies. 2018, 176, 1091–1098.
- Wang, Y.; et al. ZBTB20-AS1 promoted Alzheimer’s disease progression through ZBTB20/GSK-3β/Tau pathway. Biochem Biophys Res Commun 2023, 640, 88–96. [Google Scholar] [CrossRef] [PubMed]
- Gulbranson, D.R.; et al. Phenotypic Differences between the Alzheimer’s Disease-Related hAPP-J20 Model and Heterozygous Zbtb20 Knock-Out Mice. 2021, 8.
- Lee, S. and S.H. Kim, Genetic Diagnosis in Neonatal Encephalopathy With Hypoxic Brain Damage Using Targeted Gene Panel Sequencing. 2024; 20, 519–528. [Google Scholar]
- Rosenthal, E.H.; et al. Regulation of archicortical arealization by the transcription factor Zbtb20. Hippocampus 2012, 22, 2144–56. [Google Scholar] [CrossRef] [PubMed]
Figure 1.
Fluorescent images of parasagittal sections of cerebella from WT (Zbtb+/+) and mutant mice (Zbtb-/-). Specimens are stained for immunodetection of the PCs marker Calbindin. PCs (green) somas are not yet completely arranged in a thin single-celled layer; dendritic trees are not fully developed, though single or two primary dendritic branches are discernable. Axons (arrows) undergo development as well.
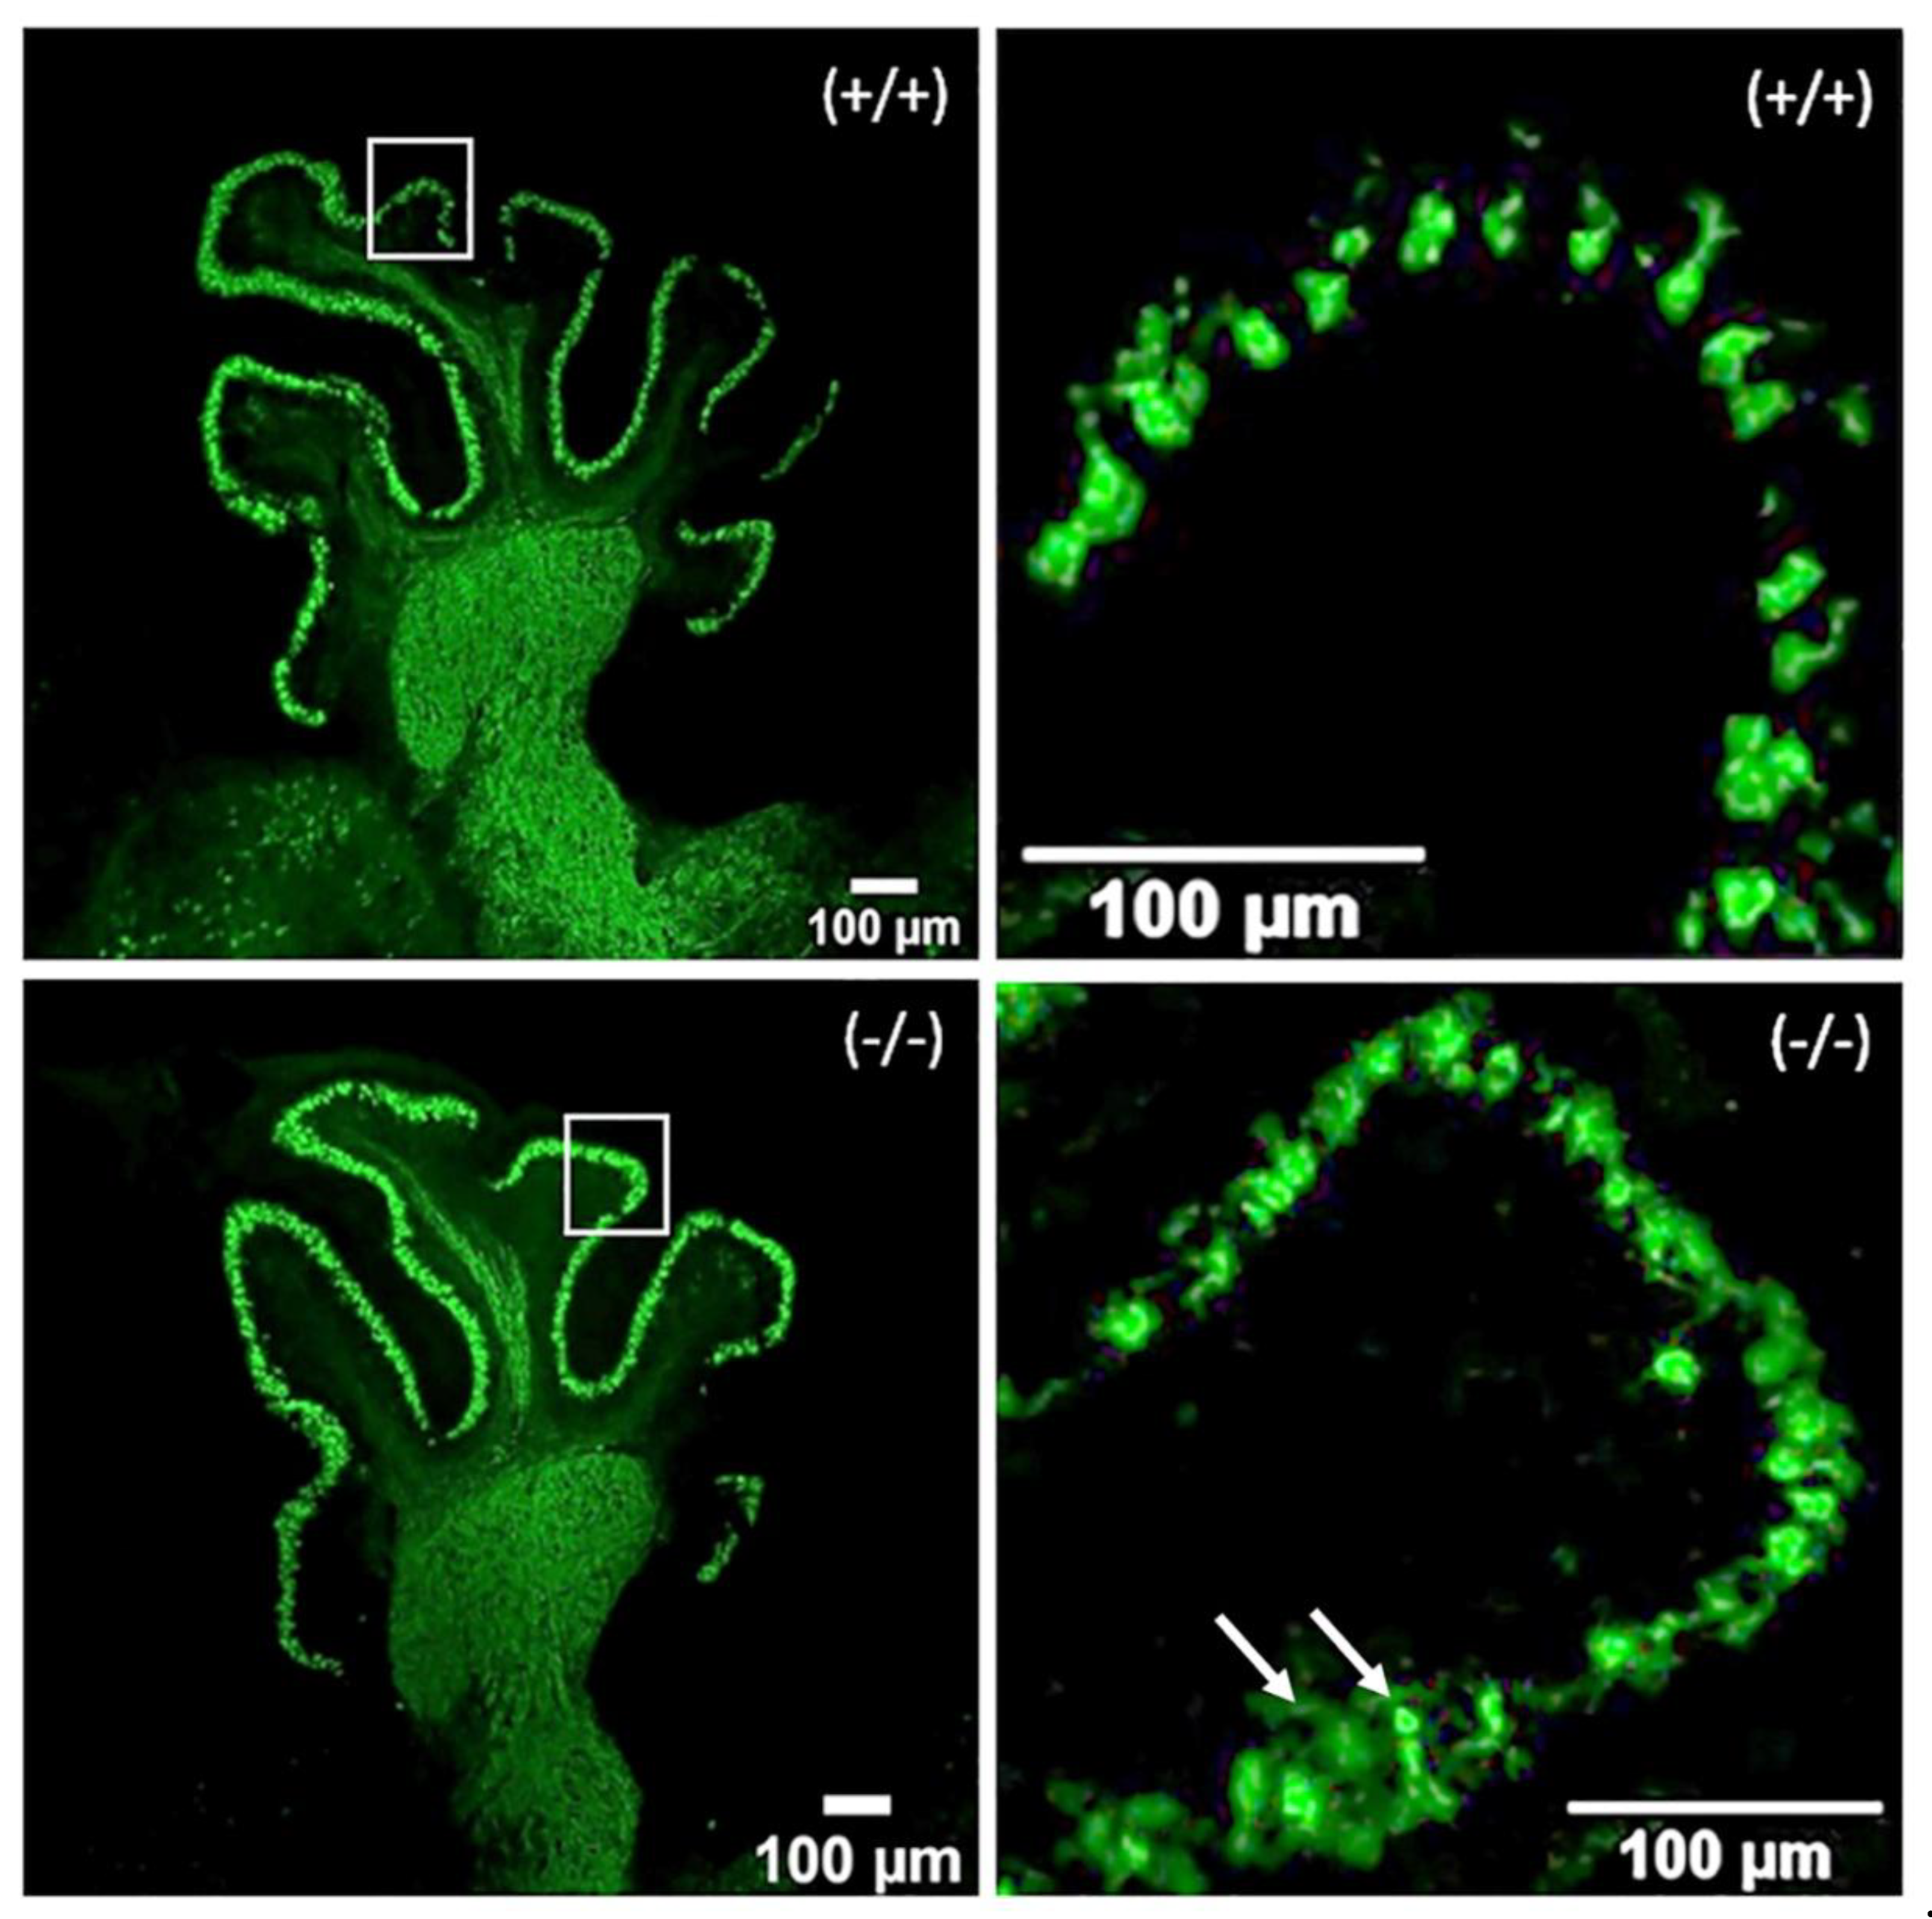
Figure 2.
Graphical illustration on average number of Calbindin-IR cells in areas of 10,000 µm2 per folium on P4. There is a prevalence of the PCs number in the mutants, compared with the wild-type animals. The Independent T-test with a Confidence Interval (CI) of 95% showed statistically significant difference (p<0.05) in folia 3, 4-5, 8, 9 and 10. The error bars indicate the Standard Deviation (SD).
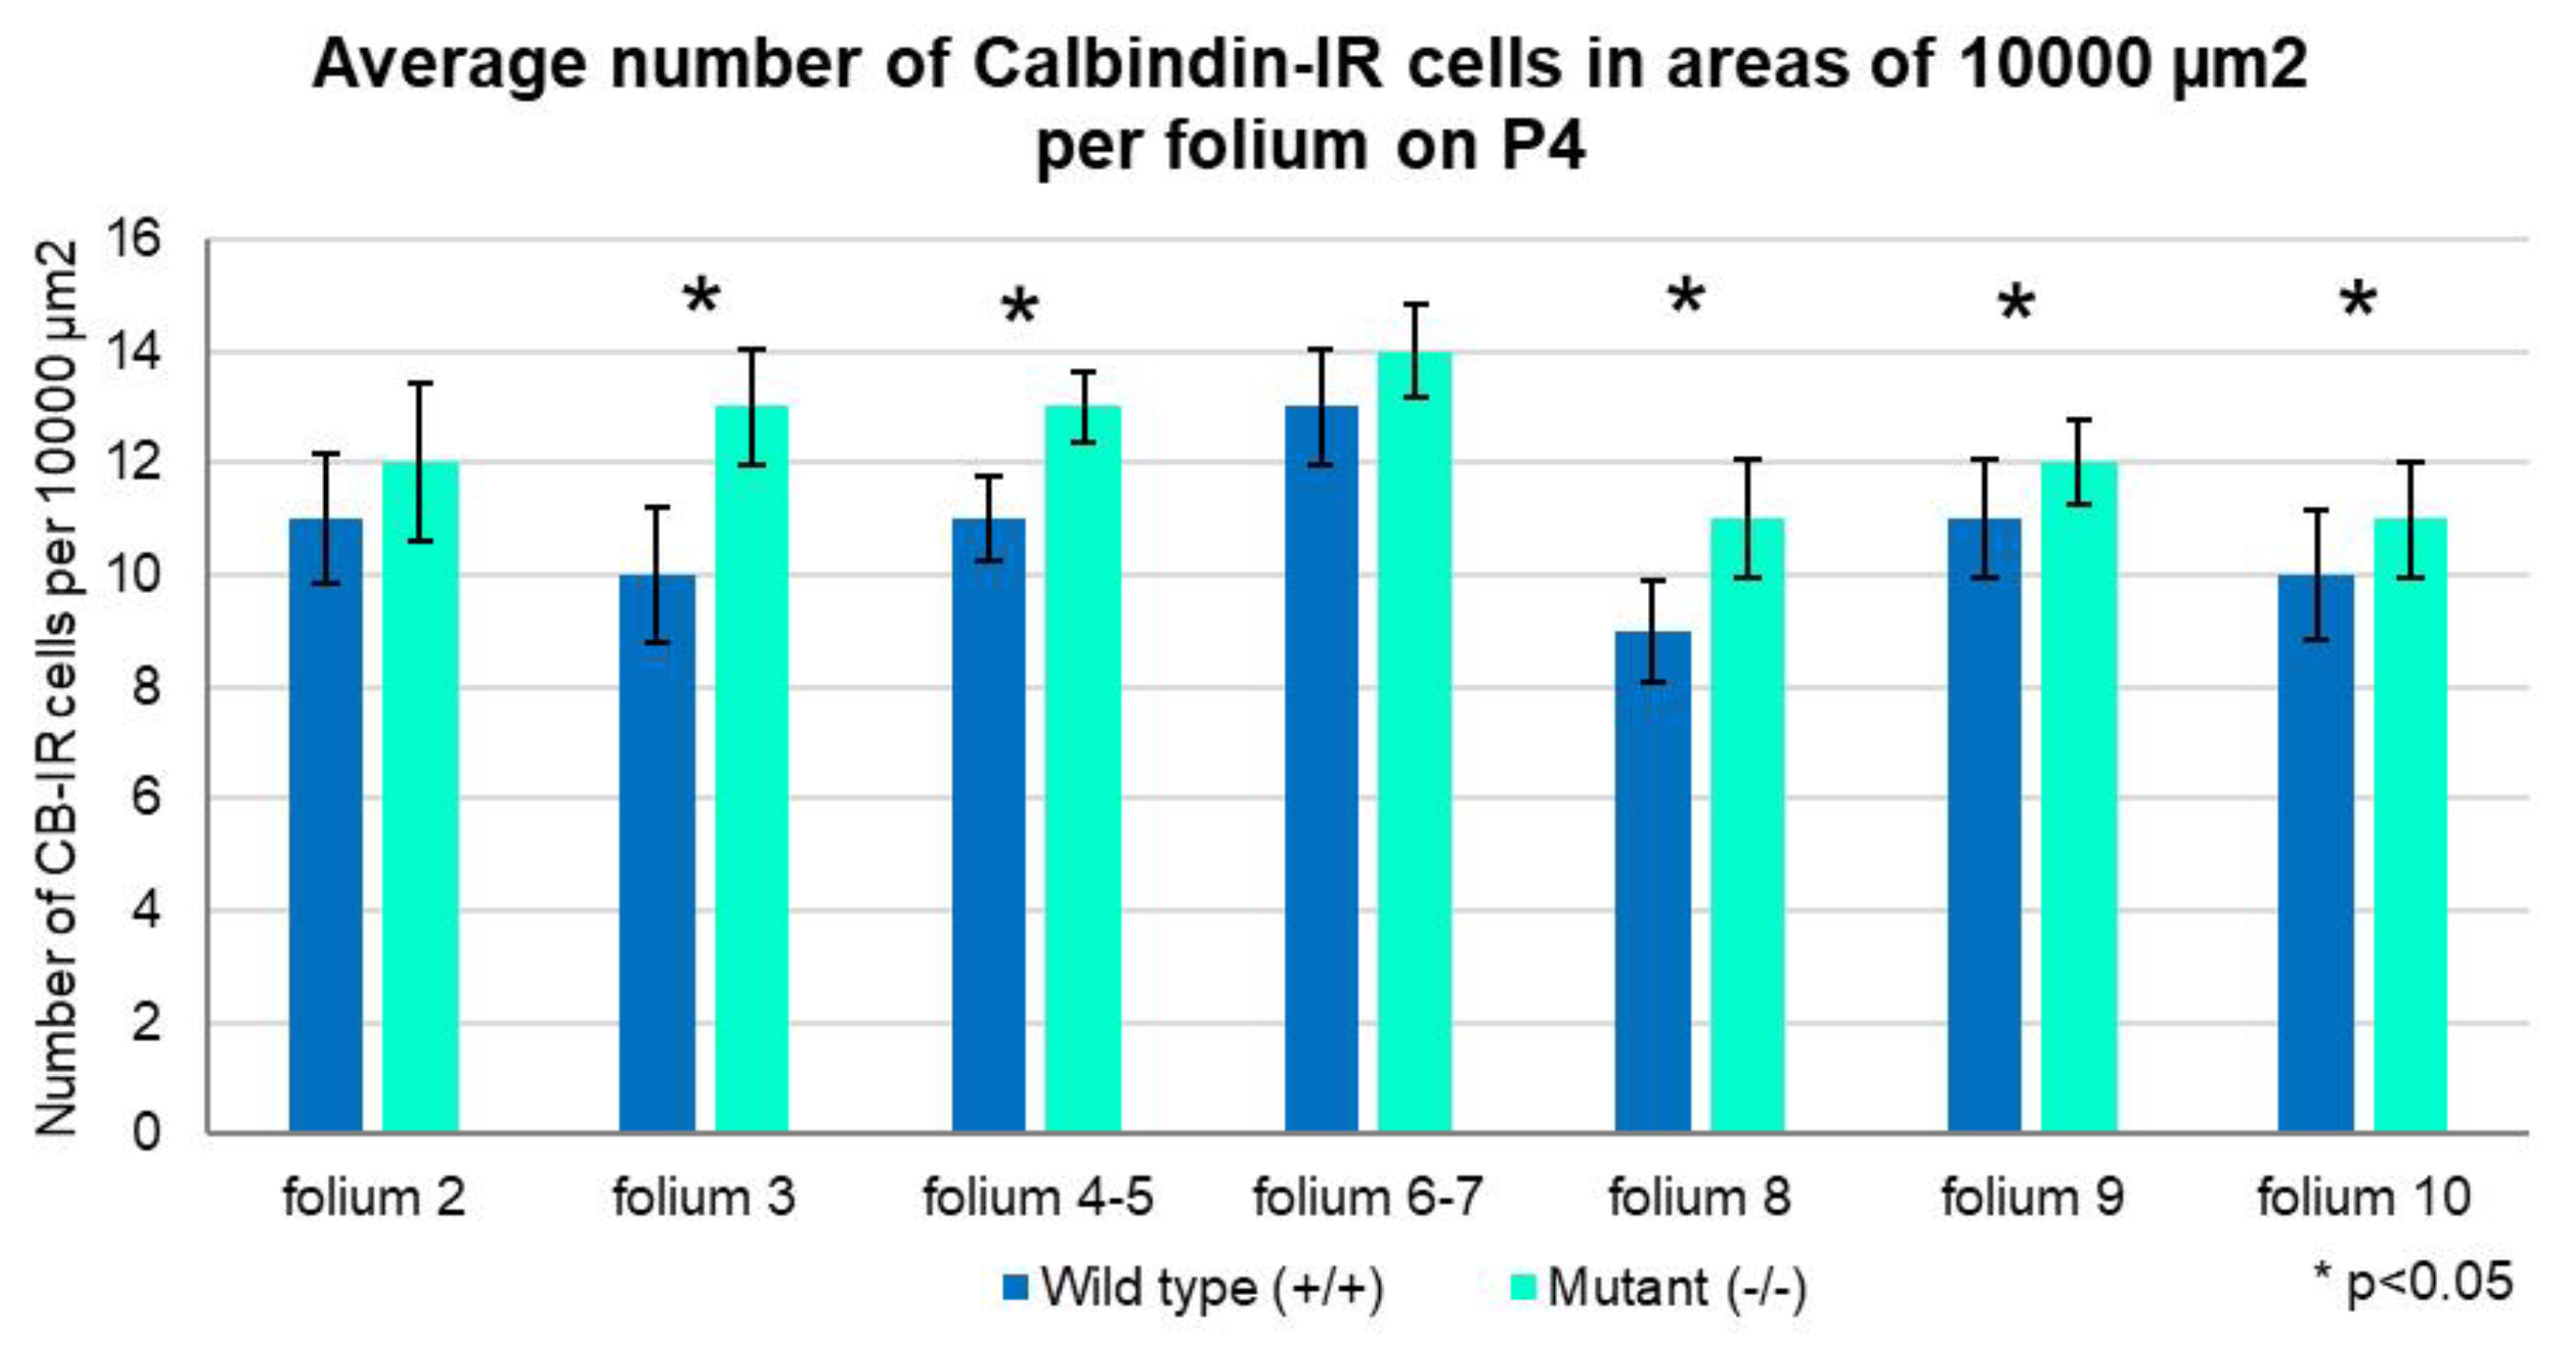
Figure 3.
Quantitative analysis on CB-IR cell distribution per 1 mm length of the Purkinje layer in corresponding cerebellar sections at P4. The Independent T-test shows that on average the PCs are significantly more numerous in the mutants than in the wild-type mice (p=0.005). Error bars indicate the SD.
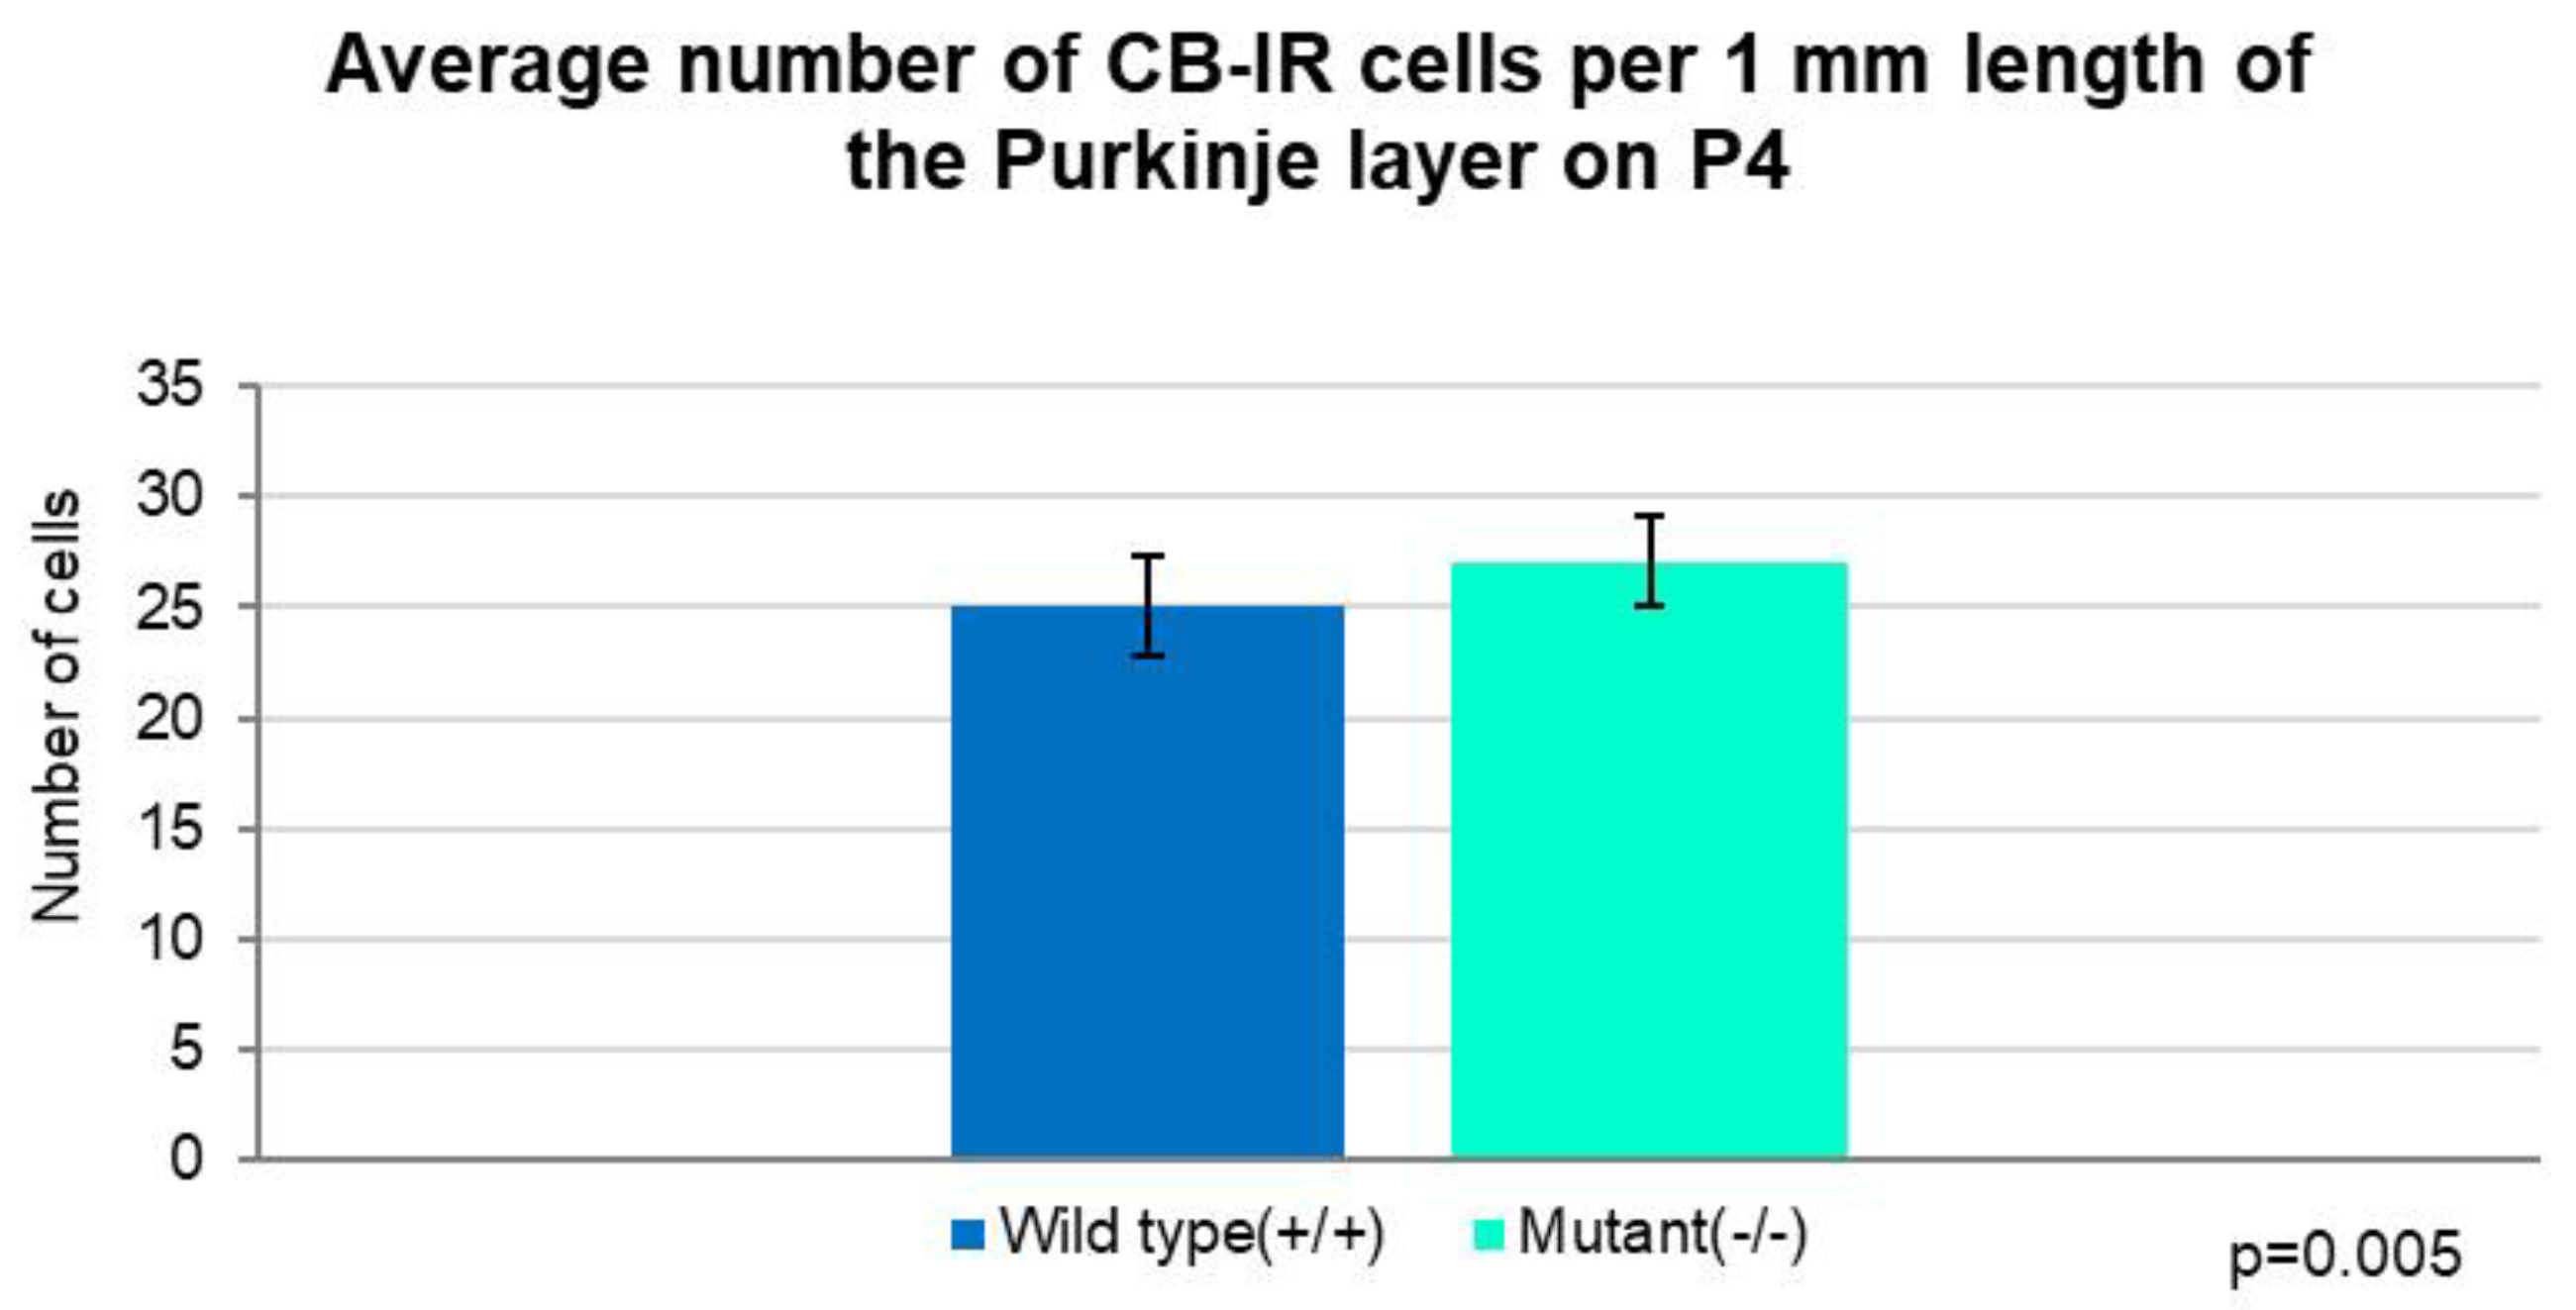
Figure 4.
Comparison of the average number of CB-IR cells per section on P4. The total number of Purkinje cells per section was significantly higher in the Zbtb20-/- homozygote mutant mice than in the controls (Independent T-test, p=0.045). Error bars indicate the SD.
Figure 4.
Comparison of the average number of CB-IR cells per section on P4. The total number of Purkinje cells per section was significantly higher in the Zbtb20-/- homozygote mutant mice than in the controls (Independent T-test, p=0.045). Error bars indicate the SD.
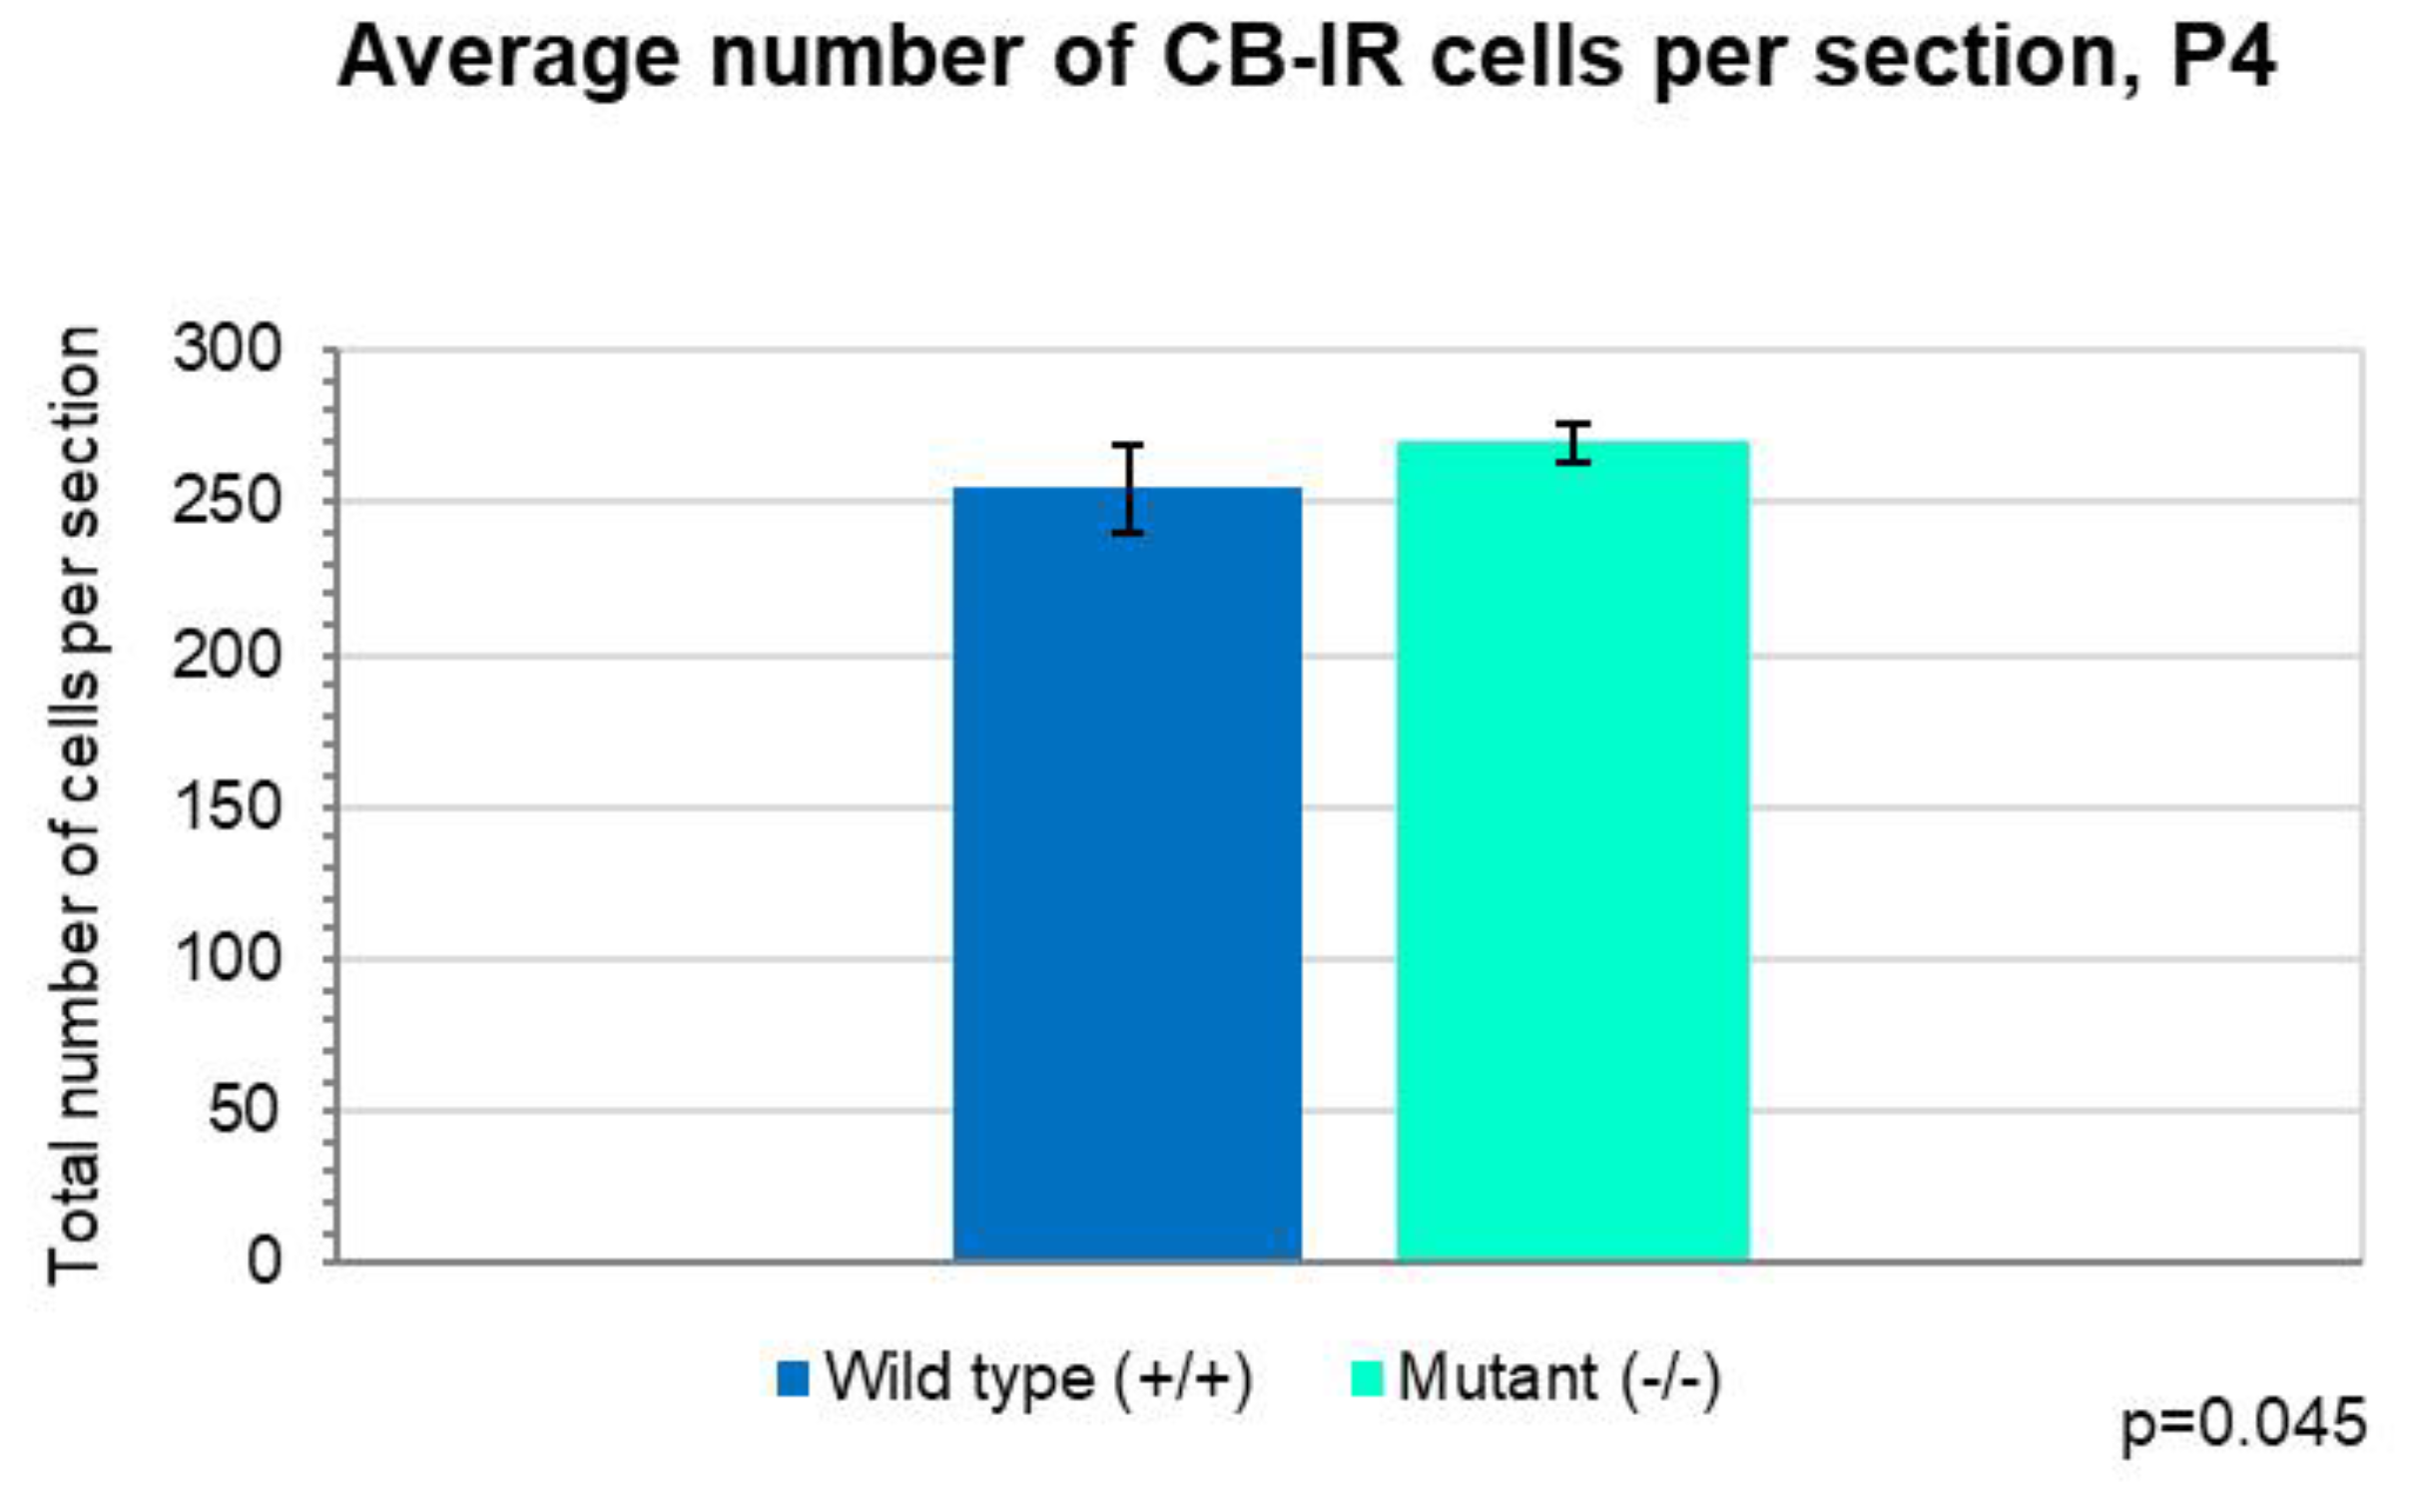
Figure 5.
Dark field microphotograph of cerebellar sections from both experimental groups at P8, illustrating the advance in the development of the PCs. (a) Parasagittal cerebellar section from a control mouse and (c) from a mutant at low magnification. (b) Closer view of the framed part at (a). The arrows point at an axon with adult-like branching pattern. (d) Higher magnification of the fragment from (c). More complex dendritic tree arborizations are visible (arrow heads).
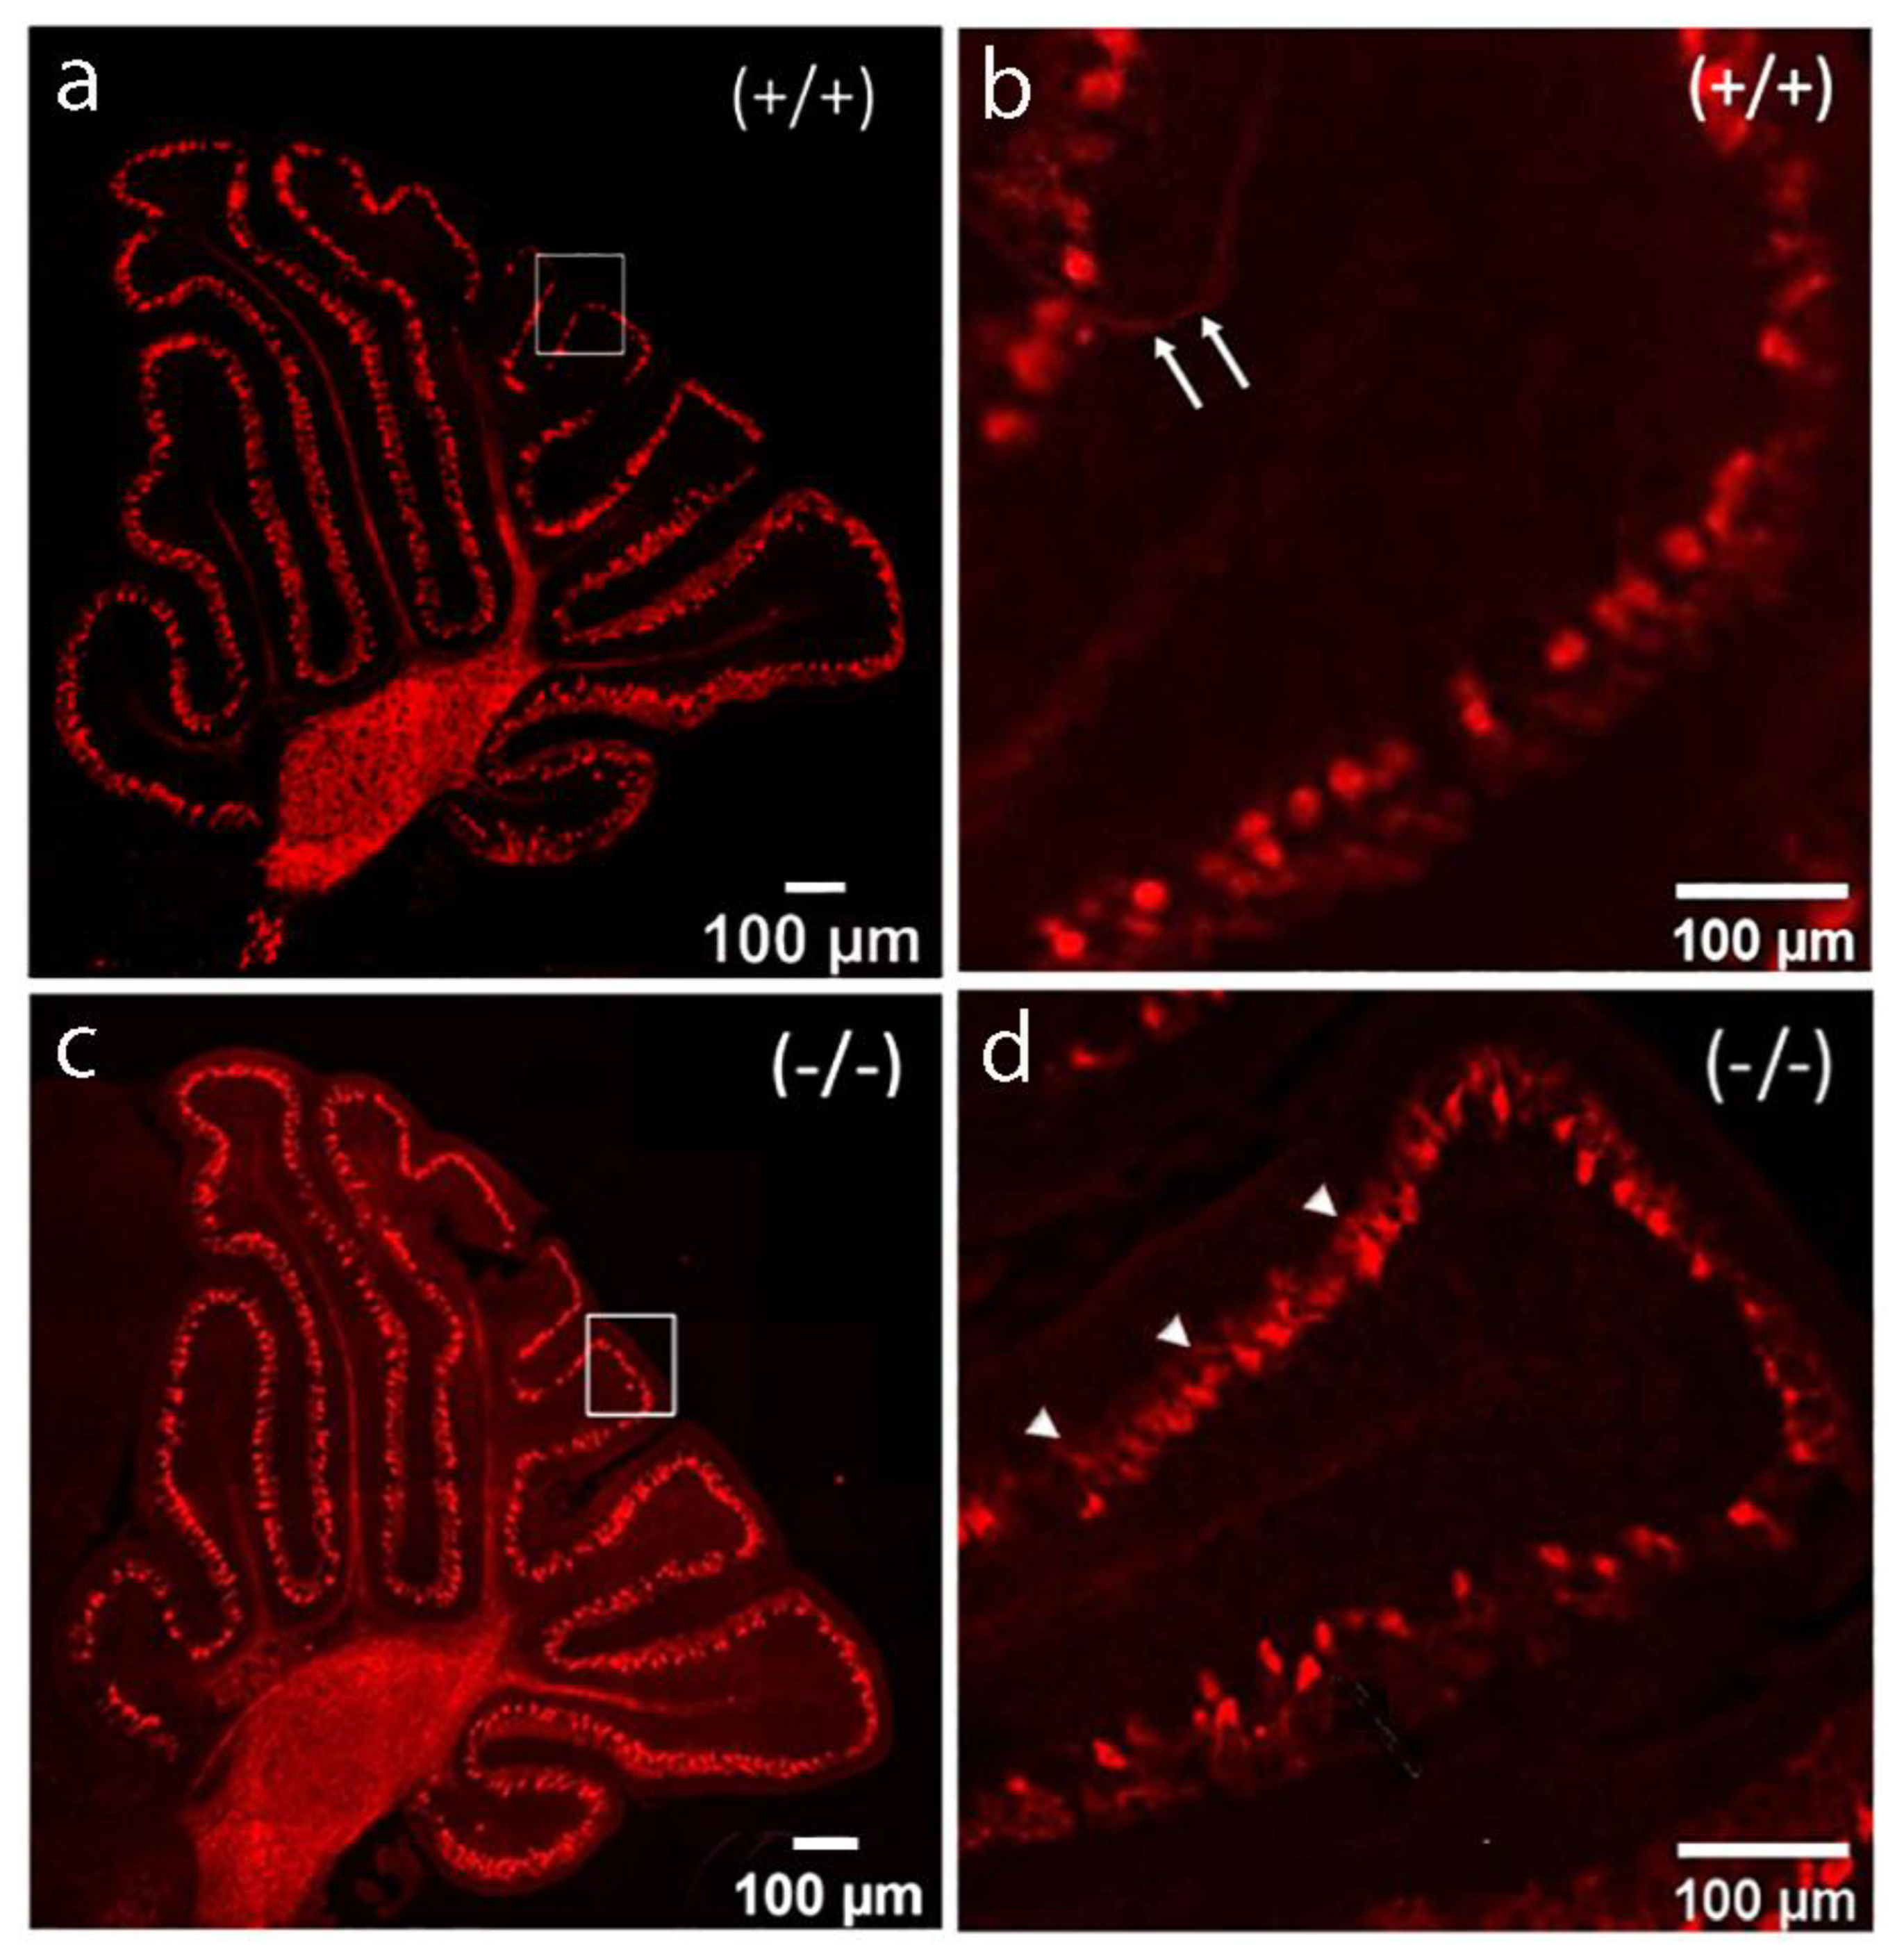
Figure 6.
Chart illustrating the distribution of PCs per folia on P8. In most of the folia, the average number of CB-IR cells was higher in the mutants, except for folium 3. There was no difference between folium 2 of the two experimental groups. Independent T-test, p<0.05. Error bars indicate the SD.
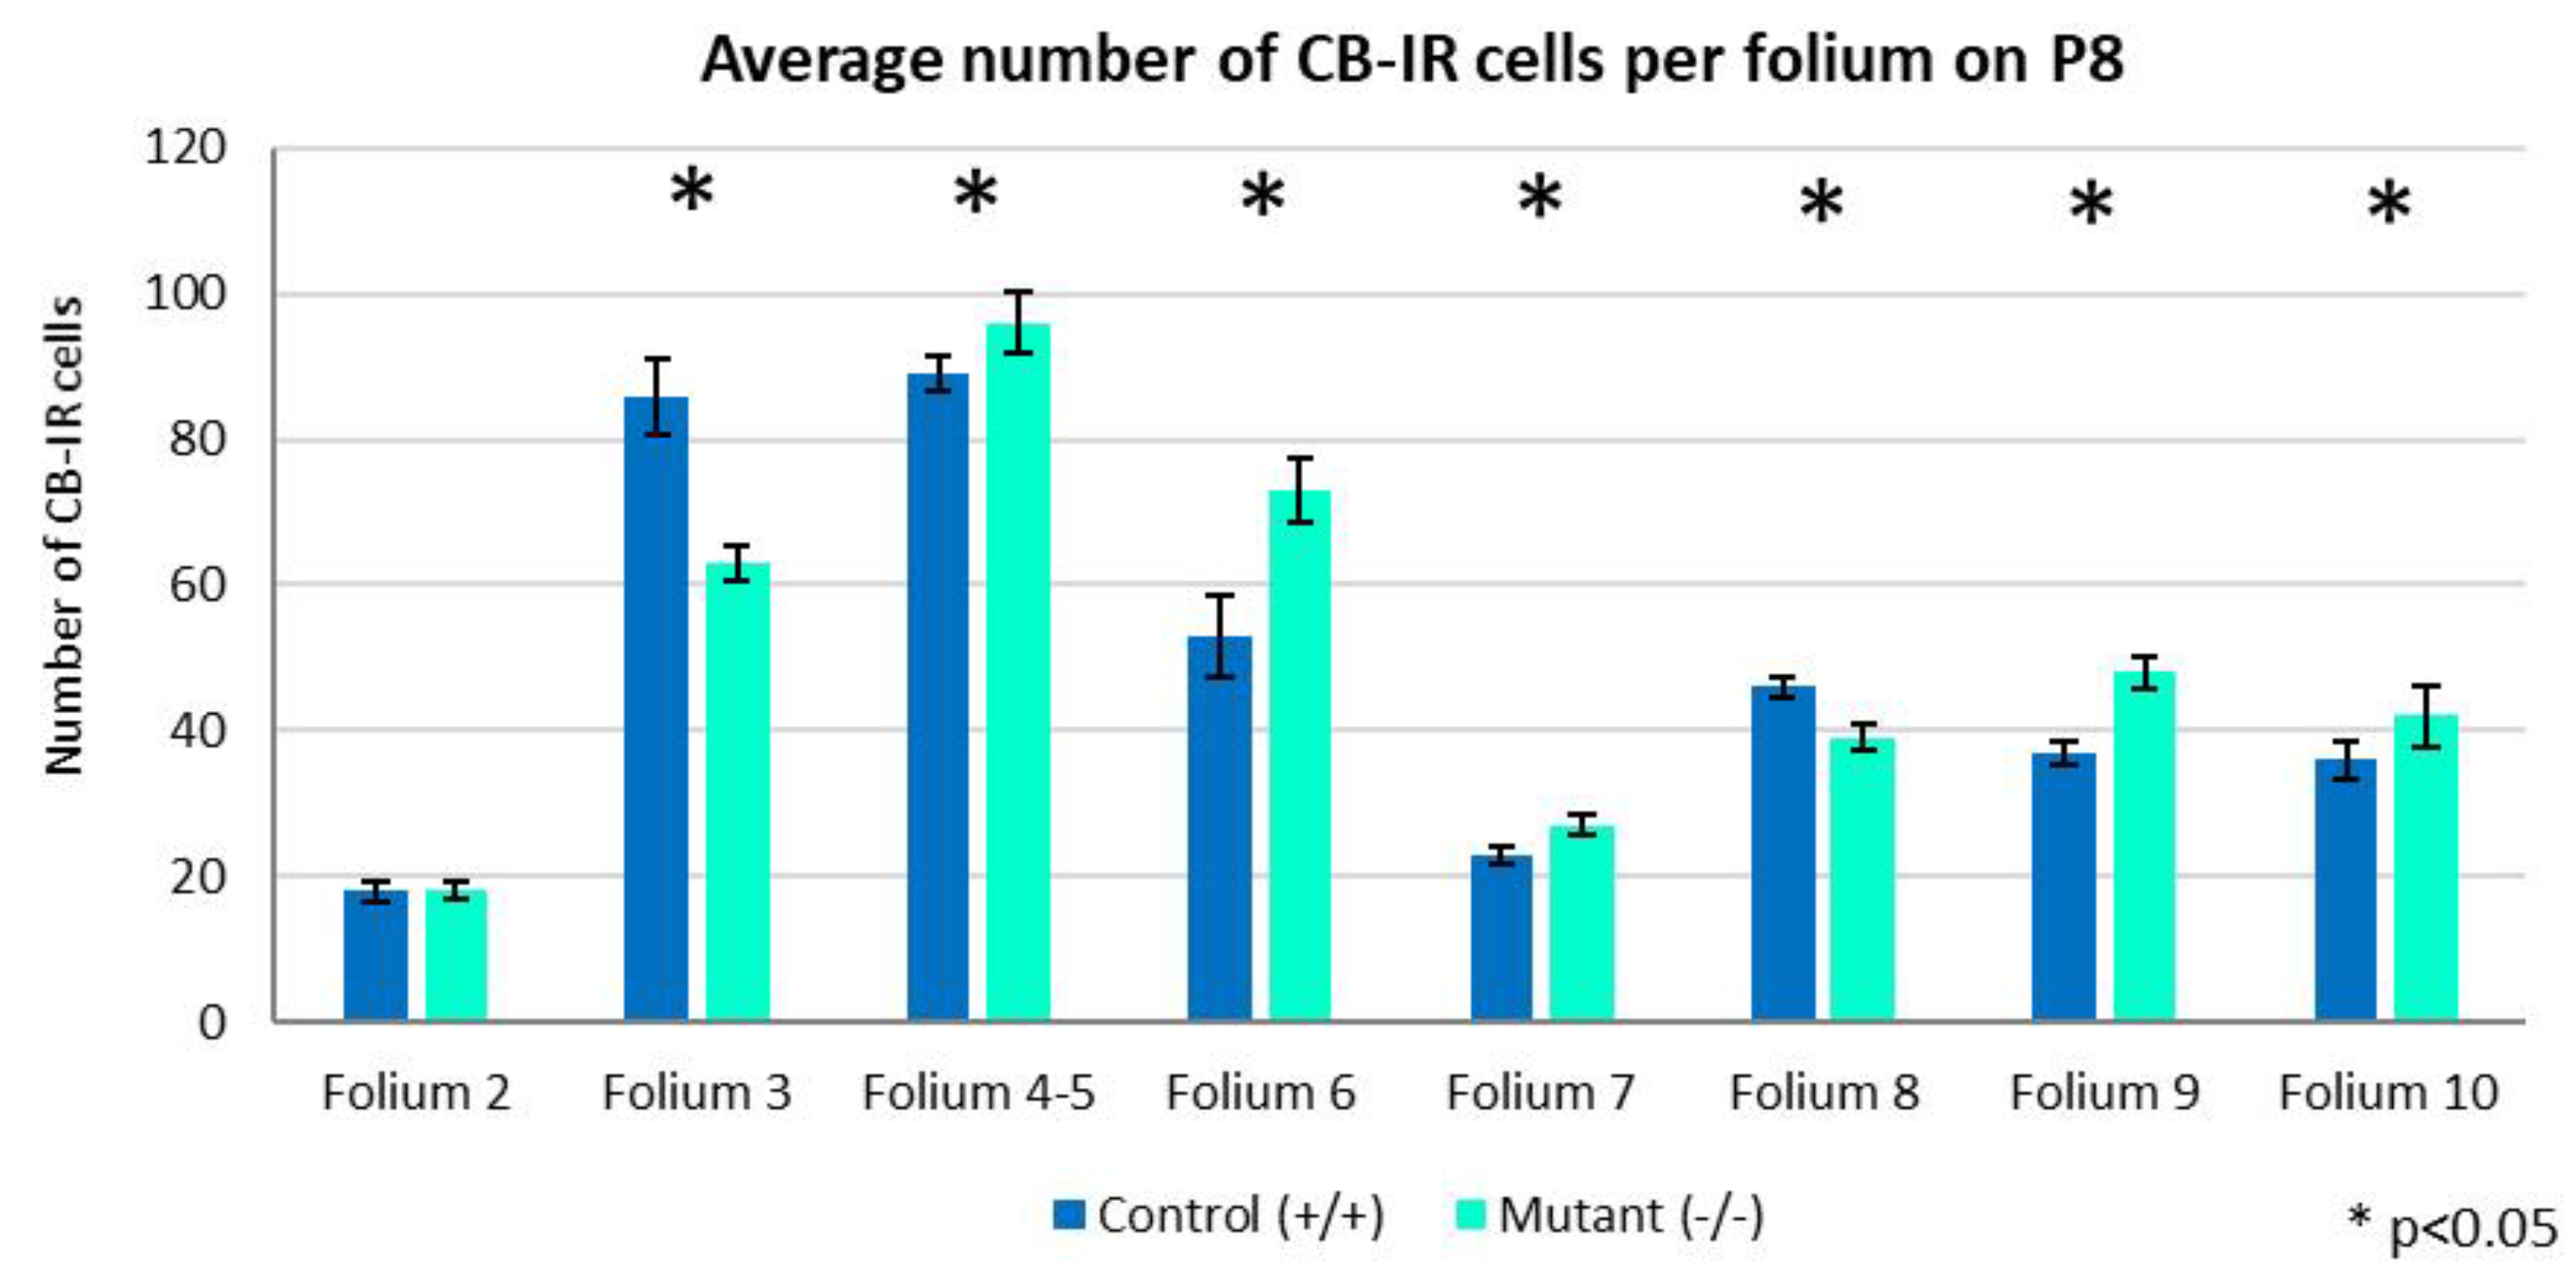
Figure 7.
Comparative statistical analysis of the results illustrating the distribution of PCs per 10,000 µm2 across folia. Except for folium 2, the density of the cells is higher in the Zbtb20-/-. Only in folia 3 and 10 was the difference is significant (p<0.05).
Figure 7.
Comparative statistical analysis of the results illustrating the distribution of PCs per 10,000 µm2 across folia. Except for folium 2, the density of the cells is higher in the Zbtb20-/-. Only in folia 3 and 10 was the difference is significant (p<0.05).
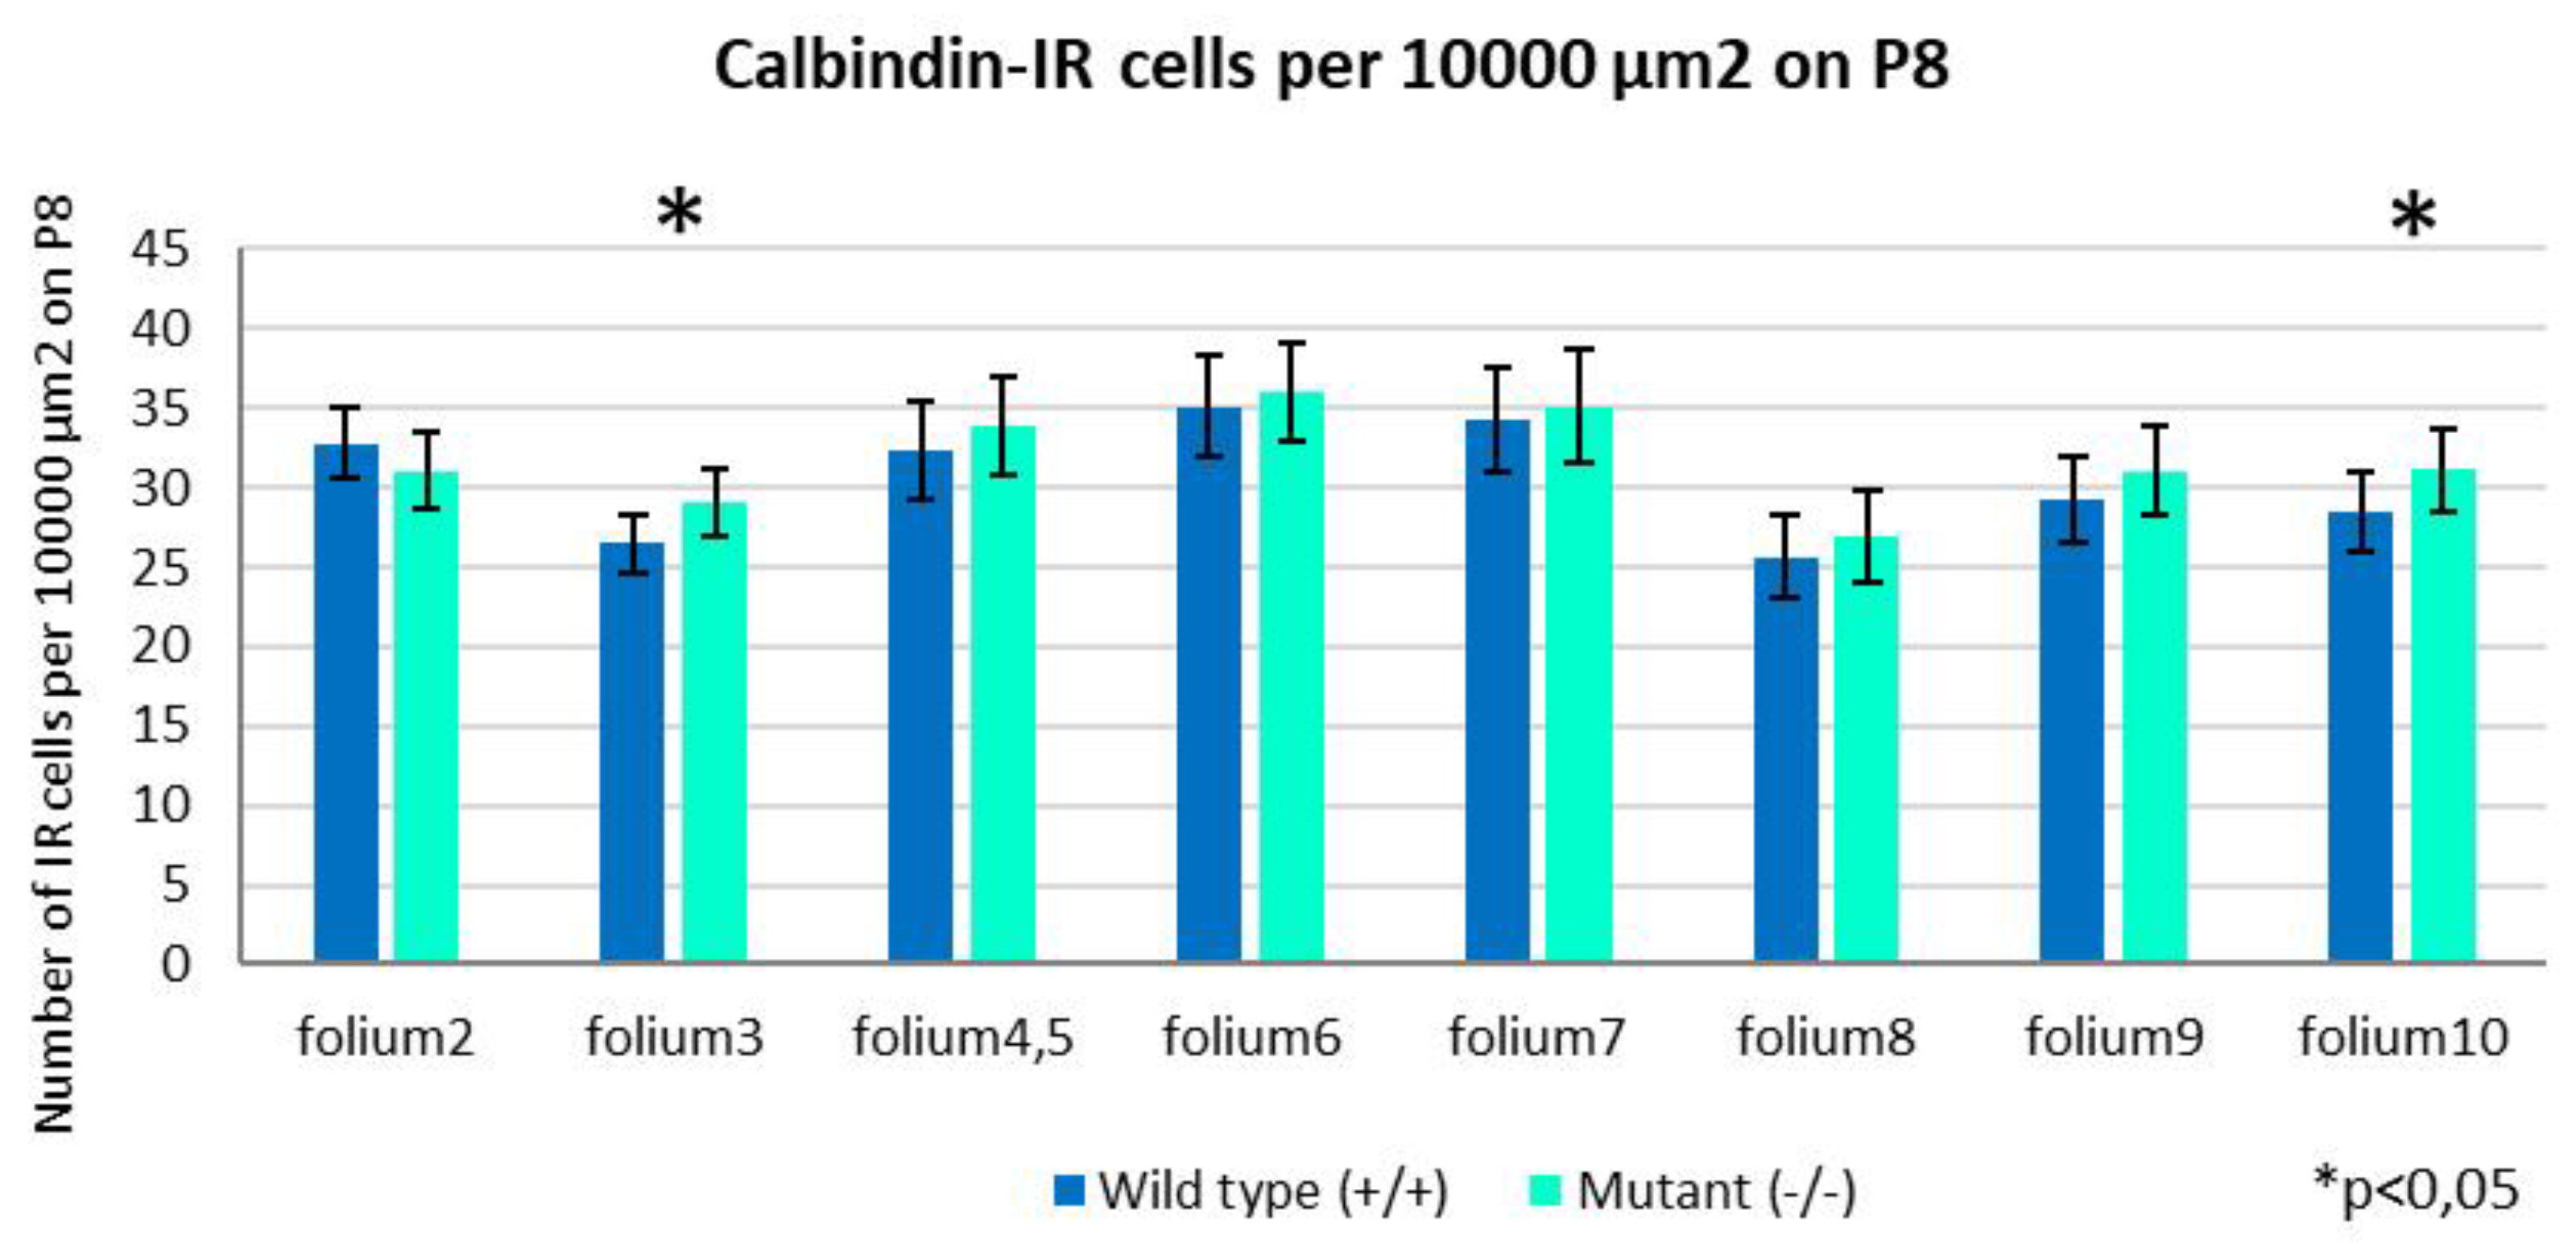
Figure 8.
Quantitative illustration of the average number of PCs per section on P8. There is a substantial prevalence in the homozygote mutants compared with the controls (Independent T-test, p=0.02). Error bars indicate the SD.
Figure 8.
Quantitative illustration of the average number of PCs per section on P8. There is a substantial prevalence in the homozygote mutants compared with the controls (Independent T-test, p=0.02). Error bars indicate the SD.
Disclaimer/Publisher’s Note: The statements, opinions and data contained in all publications are solely those of the individual author(s) and contributor(s) and not of MDPI and/or the editor(s). MDPI and/or the editor(s) disclaim responsibility for any injury to people or property resulting from any ideas, methods, instructions or products referred to in the content. |
© 2025 by the authors. Licensee MDPI, Basel, Switzerland. This article is an open access article distributed under the terms and conditions of the Creative Commons Attribution (CC BY) license (http://creativecommons.org/licenses/by/4.0/).
Copyright: This open access article is published under a Creative Commons CC BY 4.0 license, which permit the free download, distribution, and reuse, provided that the author and preprint are cited in any reuse.


