Preprint
Article

This version is not peer-reviewed.

EGFR mRNA-Engineered Mesenchymal Stem Cells (MSCs) Demonstrate Radioresistance to Moderate Dose of Simulated Cosmic Radiation

A peer-reviewed article of this preprint also exists.

Submitted:

25 August 2025

Posted:

03 September 2025

You are already at the latest version

Abstract

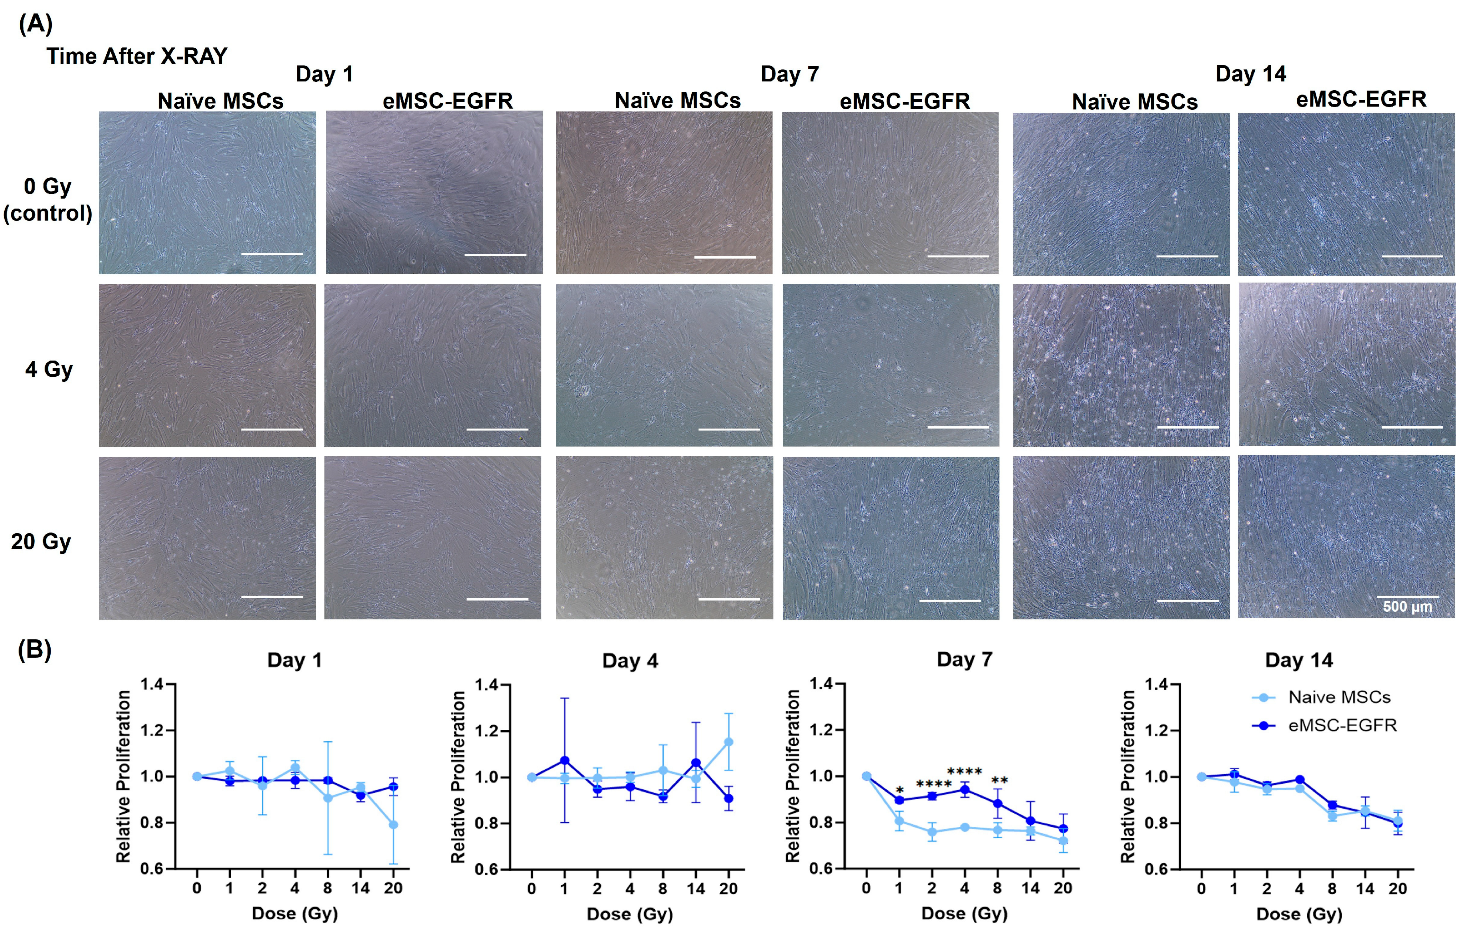
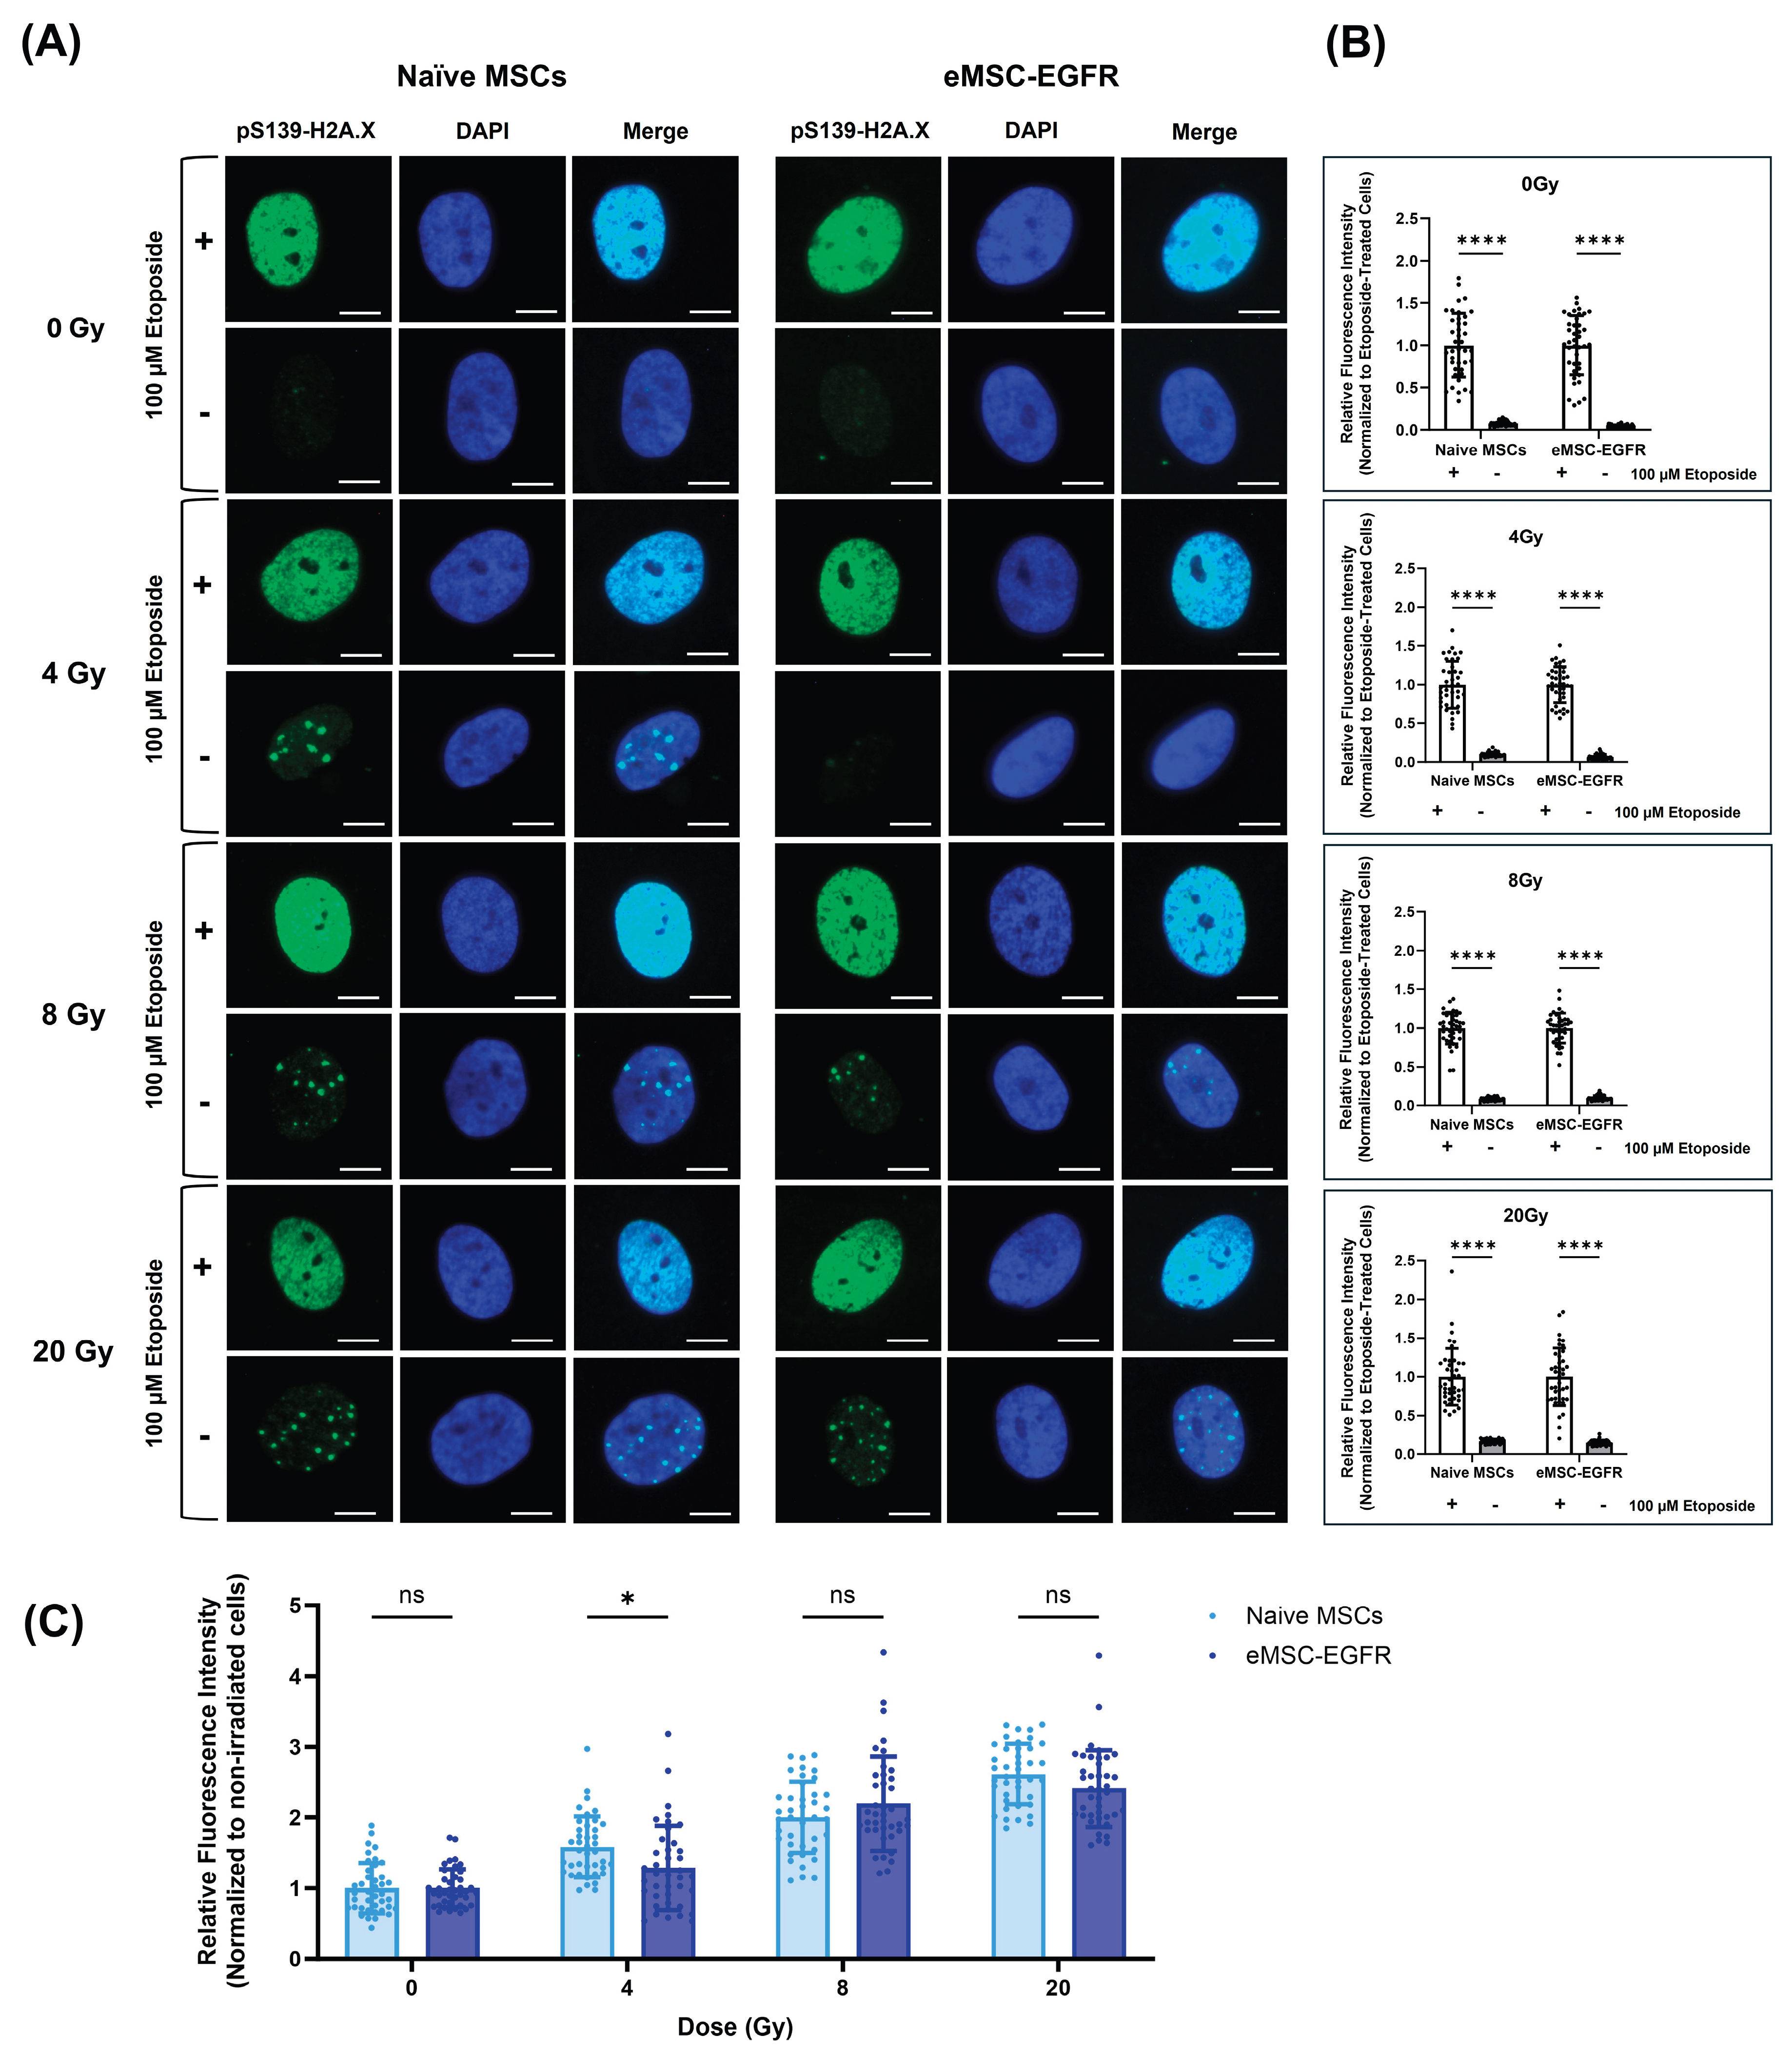
Galactic cosmic ray (GCR) radiation is a major barrier to human space exploration beyond Earth’s magnetic field protection. Mesenchymal stem cells (MSCs) are found in all organs, and they play a critical role in repair and regeneration of tissue. We specifically use engineered bone marrow-derived MSCs as a model to evaluate the effect of radiation exposure during deep space travel and long-duration spaceflight. Epidermal growth factor receptor (EGFR) expression by certain types of cancers has been shown to induce radioresistance. In this study, we tested the feasibility of engineering MSCs to overexpress EGFR (eMSC-EGFR) and evaluated their capacity to tolerate and recover from exposure to x-ray exposure (1 – 20 Gy). Quantitative real-time PCR (qRT-PCR) and immunoblotting results have shown that EGFR was efficiently transfected into MSCs and EGFR protein was produced. eMSC-EGFR maintained characteristics of human MSCs as outlined by the International Society for Cell & Gene Therapy. Then, both eMSC-EGFR and naïve MSCs were exposed to various dose rates of x-ray irradiation to assess the potential radioprotective role of EGFR overexpression in MSCs. Analysis included post-irradiation evaluation of morphology, cell proliferation, tumorigenic potential, and DNA damage. eMSC-EGFR showed signs of radioresistance compared to naïve MSCs when assessing relative proliferation one week following exposure at doses of 1–8 Gy and significantly lower DNA damage content 24 hours after exposure to 4 Gy. We establish for the first time the feasibility of efficiently generating EGFR overexpressing MSCs as a model for enhancing the human body to tolerate and recover from moderate dose radiation injury in long-term manned space travel.

Keywords: 
;  ;  ;  

1. Introduction

Deep space travel unlocks new adventures for humans to go further into the cosmos than ever before while also raising serious concerns about their health and safety in doing so. Participants in deep space missions face exposure to space radiation impacting a variety of body systems and physiological processes, including ionization of tissues, DNA damage, and other detrimental effects. This is a result of the dynamic and complex high and low energy particles found in space, like galactic cosmic rays (GCR), solar energetic particles (SEP) and radiation trapped by the Earth's magnetic field [1,2,3,4]. With the advancements in human spaceflight technologies and the movement of humans beyond suborbital flight and low Earth orbit to lunar settlement and long-duration spaceflight, the effects of space radiation on human health need to be fully understood.
Mesenchymal stem cells (MSCs) are multipotent adult stem cells found in the bone marrow which play a critical role in the repair and regeneration of tissue. Exposure of MSCs to radiation during deep space travel and long-duration spaceflight could have negative effects on the role of MSCs in maintaining homeostasis and downstream effects. This includes the hematopoietic system, which is highly sensitive to ionizing radiation due to the rapid turnover and proliferation of cells [5]. MSCs play a vital role in supporting the hematopoietic system by forming the bone marrow stromal niche that regulates hematopoietic stem cell (HSC) maintenance, self-renewal and differentiation [6]. Epidermal growth factor receptor (EGFR) has been studied in many types of malignancies for its role in treatment radioresistance and radiation-induced EGFR signaling [7,8,9]. It has already been shown that MSCs exposed to simulated GCR/SEP radiation experience dramatic changes in their differentiation potential and induce DNA damage and mutations which lead to leukemic transformation within the hematopoietic system [10,11]. Better shielding and increase in the human body’s capacity to protect and heal itself after cosmic radiation exposure will increase the feasibility and safety of human space exploration.
In this study, human bone marrow-derived MSCs were transfected with EGFR mRNA and evaluated for radioresistance after exposure to various doses of x-ray. Based on widely accepted radiobiological literature, single-dose exposures in the range 0.1-1 Gy are considered relatively low while 1-5 Gy are referred to as moderate since they are high enough to induce measurable biological effects and below the threshold for immediate cell lethality, allowing for post-irradiation analysis. Dose range of 5-10 Gy are considered as high while 10-20 Gy are very high and can cause severe cellular damage [12,13,14]. Our study investigates the effects of moderate to very high single-dose ionizing radiation classification on MSCs. First, the feasibility of engineering MSCs by EGFR transfection (eMSCs-EGFR) and MSC functional characteristics were assessed. Then, an analysis of eMSC-EGFR following irradiation was performed. Our study has established for the first time the feasibility of efficiently generating EGFR overexpressing MSCs with enhanced radioresistance capacity irradiation compared to naïve MSCs while also exhibiting normal MSC behavior. Here, we provide a novel approach to protecting MSCs from the insults of radiation present during deep space travel, benefiting space travelers and the performance of biomedical experiments in deep space.

2. Materials and Methods

2.1. Synthesis of mRNA

The open reading frame sequence of human EGFR was acquired from National Center for Biotechnology Information website (Homo sapiens EGFR, mRNA (NM_005228.3)). EGFR mRNA was obtained from TriLink BioTechnologies (San Diego, CA, USA) and contained T7 promoter, 5’ untranslated regions (UTRs), 3’ UTRs and poly A-tail in the sequence. CleanCap® enhanced green fluorescent protein (EGFP) mRNA (TriLink BioTechnologies, Cat# L-7601) was used as a control to validate the transfection process.

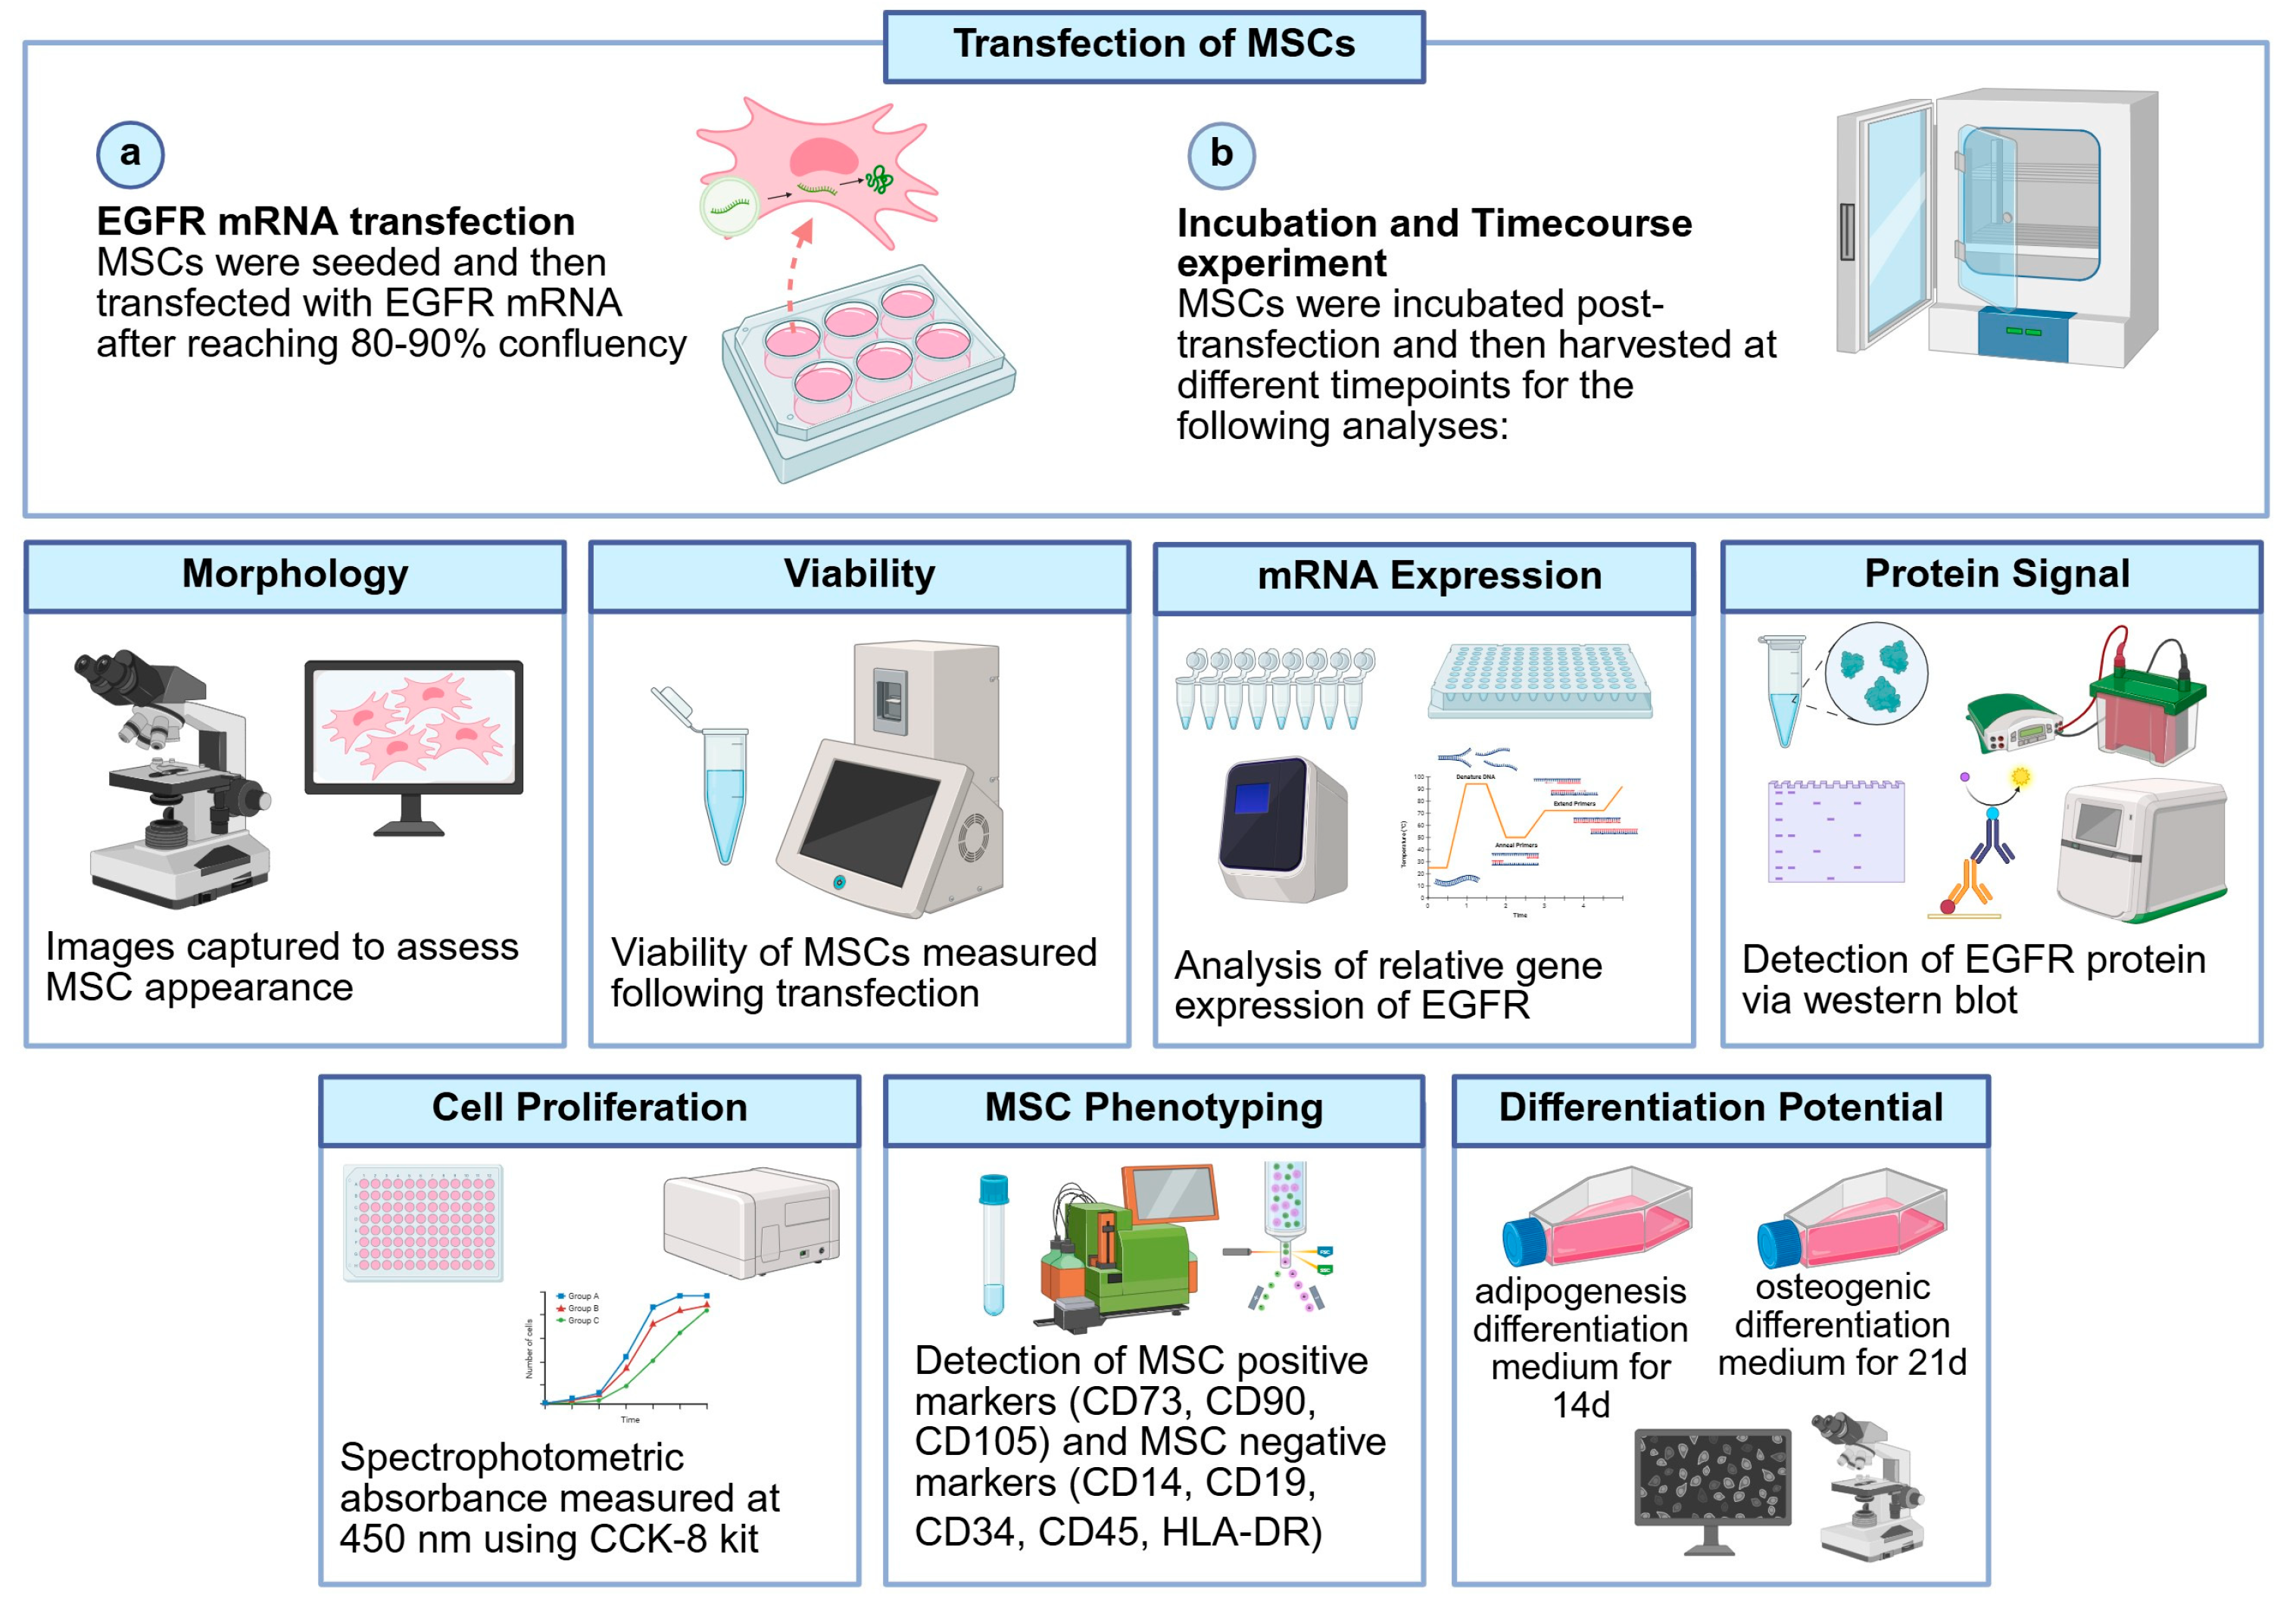
2.2. Cell Culture and mRNA Transfection

Human bone marrow-derived mesenchymal stem cells (BMSCs) were isolated from commercial de-identified bone marrow from a healthy 22-year-old male donor. BMSCs were cultured in Minimum Essential Mediumα (MEM α; Gibco, Cat# 12561072) supplemented with 16.5% FBS, 1% Glutamax and 1% Penicillin-Streptomycin in a 37°C, 5% CO2 humidified incubator. 0.05% Trypsin-EDTA (Gibco, Cat# 25300120) was used to perform the subculture.
At passage three, MSCs were plated with a seeding density of 1.30x10⁵ cells/well (1.30x10⁴ cells/cm2) into six-well plates and cultured for at least 24 hours until reaching 80-90% confluency. Transfection of MSCs was performed using 1.25 μg/mL EGFR mRNA or EGFP mRNA and 1.875 μL/mL Lipofectamine MessengerMAX Reagent (LMM; Invitrogen, Cat# LMRNA015) according to the manufacturer's instructions. A time course experiment was performed where images were taken, mRNA isolated and conditioned culture medium (CCM) was collected at 4-, 12-, 24- and 48-hours post-transfection along with 4 days and 7 days. Naïve MSCs were included which underwent the same procedure but without mRNA transfection. MSCs were harvested for analysis within passage 4 in the study.

2.3. Viability

Viability of naïve and engineered MSCs was evaluated using the Nexcelom Cellometer Auto 2000 Cell Viability Counter and ViaStain AOPI Staining Solution, following 24 hours, 48 hours, 4 days and 7 days of transfection.

2.4. MSC Phenotyping

MSC characterization was evaluated by flow cytometry (MACSQuant Analyzer 16) using the MSC Phenotyping Kit (Miltenyi Biotec, Cat# 130-125-285) to detect MSC positive markers (CD73, CD90, and CD105) and MSC negative markers (CD14, CD19, CD34, CD45, and human leukocyte antigen-DR isotype (HLA-DR)). Before each run, compensation was conducted using the MACS® Comp Bead Kit (Miltenyi Biotec Cat# 130-104-187).

2.5. Differentiation of MSCs

MSC differentiation potential was evaluated by culturing naïve and engineered MSCs in osteogenic and adipogenic differentiation assays. For adipogenic differentiation, MSCs were cultured using StemPro adipogenesis differentiation kit (Gibco, Cat# A1007001) and supplemented with 1% Penicillin-Streptomycin (Fischer Scientific). The differentiation medium was replaced every 3-4 days until day 14. Cells were then fixed using 10% formalin for 1 hour at room temperature and stained with oil-red-O working solution for 20 minutes at room temperature. This was prepared with three parts of 0.5% oil-red-O solution and two parts of Dulbeccor’s phosphate buffered saline. For osteogenic differentiation, StemPro osteogenesis differentiation kit (Gibco, Cat# A1007201) was used and supplemented with 1% Penicillin-Streptomycin. The differentiation medium was replaced every 3-4 days until Day 21. Cells were then fixed with 10% formalin and stained with alizarin red S staining. Adipogenic and osteogenic differentiation controls were included where MSCs were cultured in MEM α supplemented with 1% Penicillin-Streptomycin, 1% Glutamax and 16.5% FBS and stained with oil-red-O working solution or alizarin red S solution, respectively. Images were acquired by bright field microscope.

2.6. Quantitative Reverse Transcription Polymerase Chain Reaction (qRT-PCR)

RNA was isolated from cultured cells using RNeasy Plus Mini Kit (Qiagen, Cat# 74134) while reverse transcription was performed using QuantiNova Reverse Transcription Kit (Qiagen, Cat# 205411). The NanoDrop 2000 Spectrophotometer (Thermo scientific) was used to measure RNA concentration. For real-time PCR, TaqMan Fast Advanced Master Mix (Applied biosystems, Cat# 4444963), EGFR (Hs01076090_m1, Cat# 4331182), and glyceraldehyde 3-phosphate dehydrogenase (GAPDH) (Hs02758991_g1) Gene Expression Taqman Assays were used. GAPDH was used as an internal control. The 2−ΔΔCT method was used for the analysis of relative gene expression of EGFR. Samples were assessed in triplicate and the mean value was taken for analysis.

2.7. Western Blot Analysis

MSCs cultured in the six-well plate were collected for western blot detection of EGFR protein 24 hours post-transfection. Cultured cells were washed once with ice cold phosphate-buffered saline (PBS; 0.1 M phosphate, 0.15 M sodium chloride; pH 7.2) and then scraped off the plate using a cell scraper and a lysis buffer composed of RIPA Lysis and Extraction Buffer (Thermo Scientific™, Cat# 89900) and cOmplete™, Mini Protease Inhibitor Cocktail (Roche, Cat# 11836153001). Protein concentration was normalized via Pierce BCA Protein Assay (Thermo Fisher Scientific, Waltham, MA, USA). Protein lysates were denatured at 95°C for 5 minutes. Then, normalized lysates were separated on a NuPAGE 4-12% Bis-Tris Mini Protein Gel (Invitrogen, Thermo Fisher Scientific, Waltham, MA, USA) and subjected to electric transfer to an Immobilon-P polyvinylidene fluoride membrane (MilliporeSigma, Burlington, MA, USA). After blocking in 5% non-fat dry milk in Tris-buffered saline with 0.1% Tween 20, the membrane was incubated overnight at 4°C with continuous agitation with the following primary antibodies: human anti-EGFR at 1:500 (Santa Cruz Biotechnology, Cat# sc-373746) and anti-βactin at 1:100,000. The next day, the membrane was washed with Tris-buffered saline with 0.1% Tween 20 three times for 10 minutes each wash and then incubated with horseradish peroxidase-conjugated secondary antibodies at a 1:10,000 dilution for 1 hour at room temperature with rocking. The βactin loading control was used to calculate the relative EGFR expression. Protein expression was detected via chemiluminescence. The density of the immunoreactive bands were analyzed using ImageJ Software where background was subtracted followed by normalization to the loading control obtained from the same gel (βactin) and a percentage relative to the control cells (naive MSCs) was obtained.

2.8. Cell Proliferation Assay

MSCs were seeded into a 96-well plate at a sending density of 2500 cells/well and cultured for 24 hours in a humidified incubator. Cell Counting Kit-8 (CCK-8; Dojindo, Cat# CK04-13) was used to assess cell proliferation by measuring spectrophotometric absorbance at 450 nm according to manufacturer’s instructions. Optical density measurements were recorded on Day 1, 2, 3, 4 and 5 following seeding of cells, with Day 1 being the baseline measurement taken following the 24-hour incubation. Each group was assessed in triplicate.

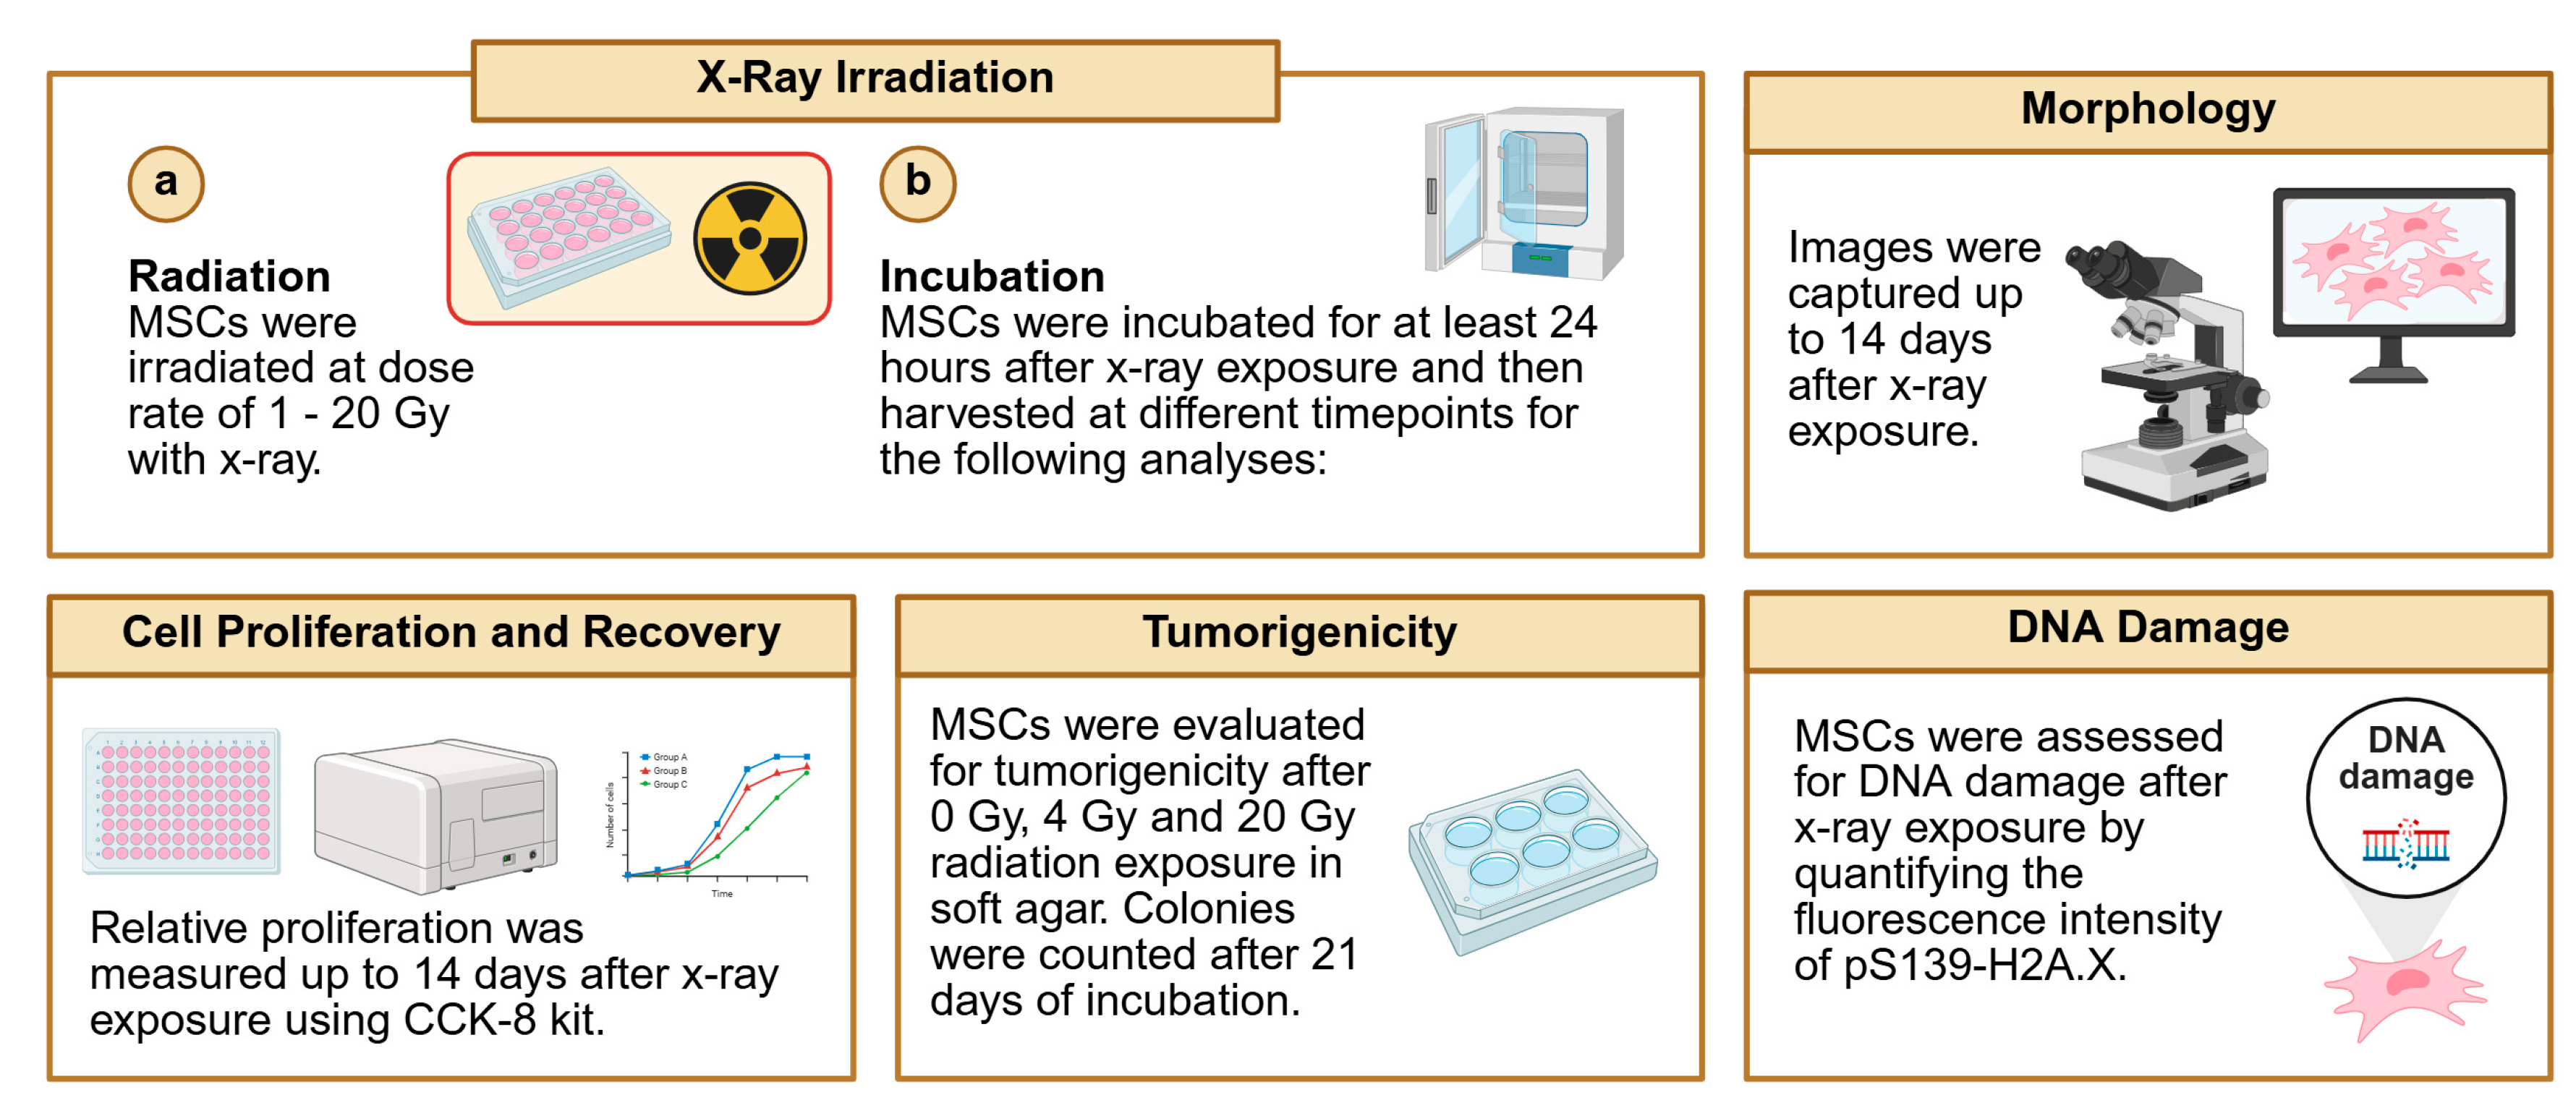
2.9. Cell Irradiation (X-Ray)

24 hours post-transfection with EGFR, MSCs were collected and seeded onto 24-well plates (3 × 104 cells/well) and left to attach in a humidified incubator. After an overnight culture, cell cultures were irradiated using the X-RAD 160 (Precision X-Ray Inc., North Branford, CT), a cabinet-based X-ray irradiator designed for high-throughput and precise dose delivery. Samples were placed on a motorized rotating shelf at a fixed source-to-sample distance (SSD) of 33 cm. To ensure uniform dose delivery, plates were centered using the system’s laser alignment and real-time imaging system. Irradiation was performed at 160 kV and 18.70 mA, delivering doses ranging from 0 to 20 Gy, depending on the experimental condition. All irradiation was conducted at room temperature, and plates were returned to the incubator immediately after exposure. For DNA damage analysis, MSCs were seeded to µ-Slide 8 Well (ibidi) at 5 × 103 cells/well and then irradiated.

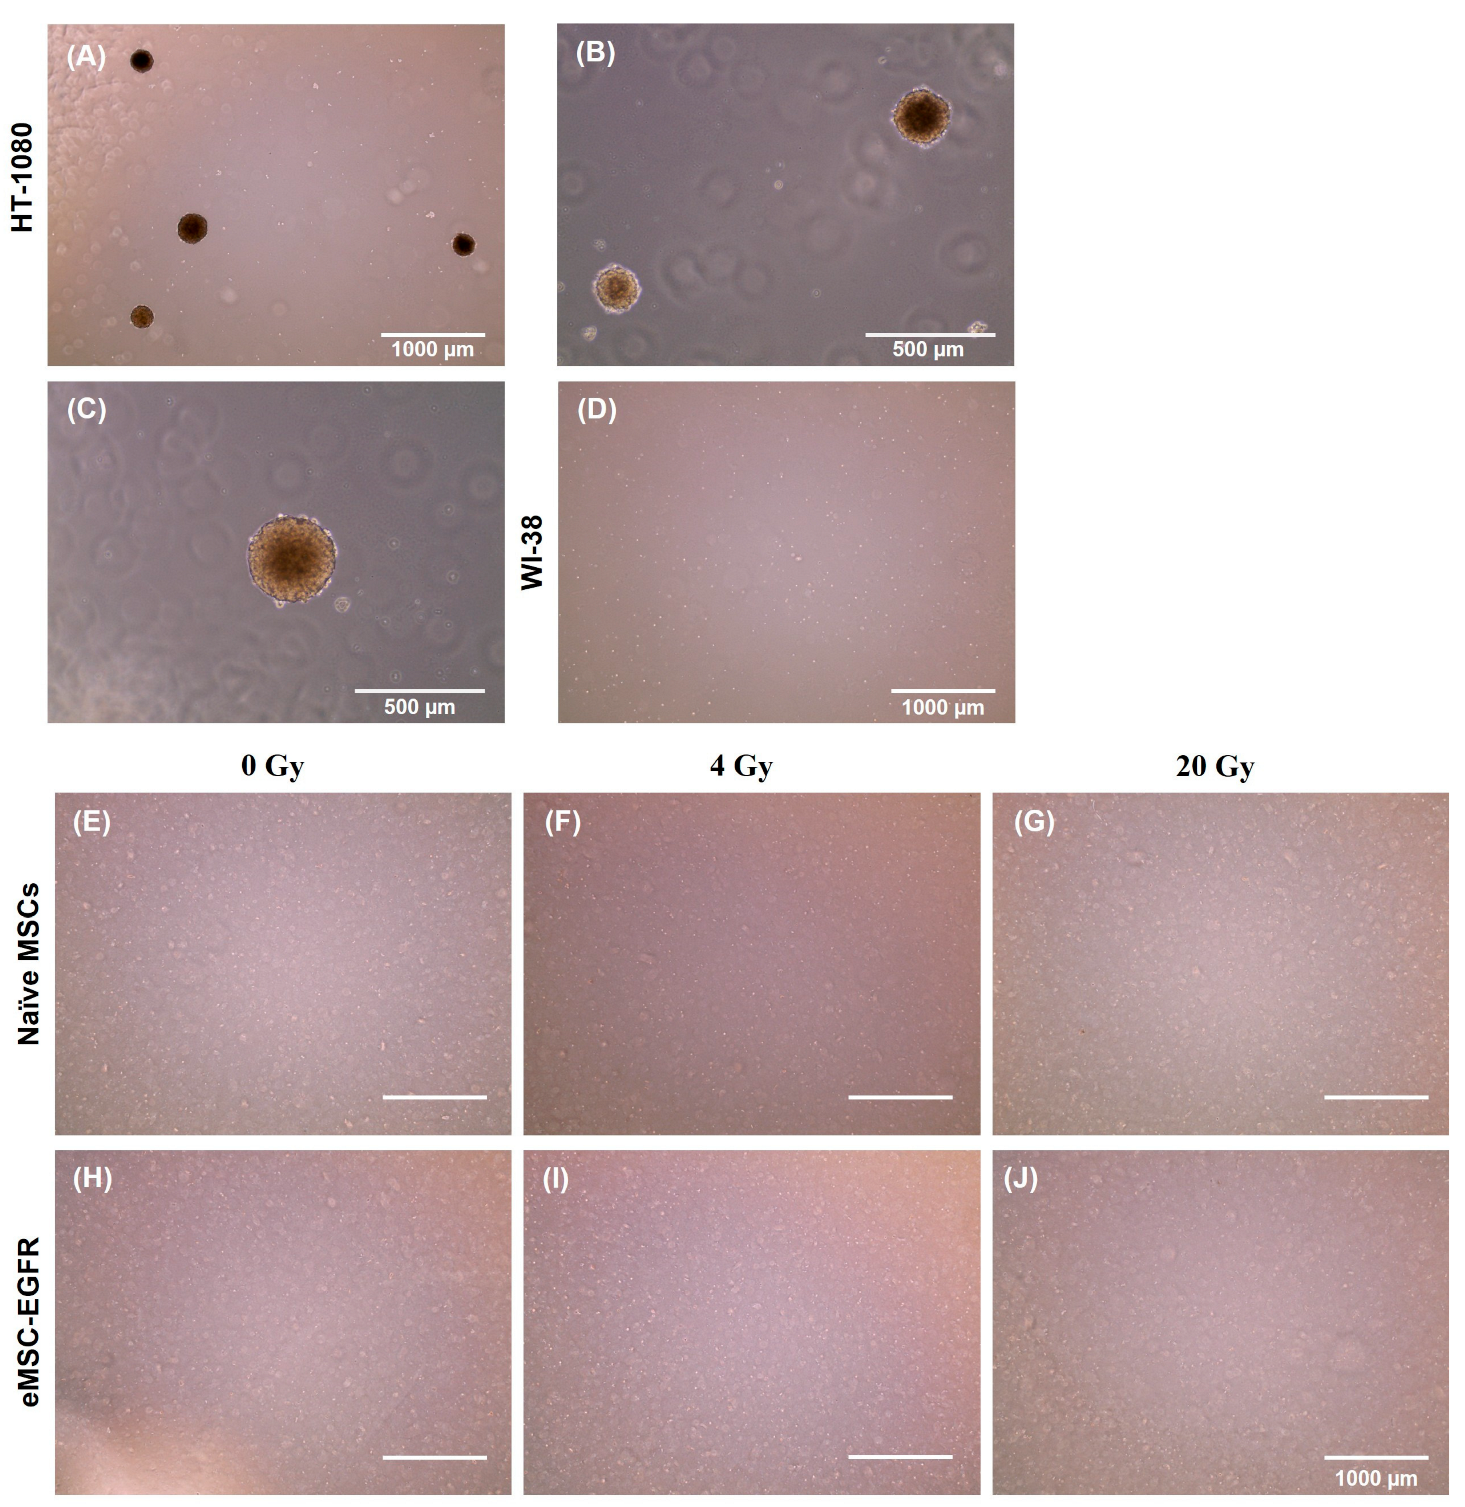
2.10. Tumorigenicity Assay

Soft agar assay was used to evaluate tumorigenicity of naïve MSCs and transfected MSCs after 4 Gy (low dose) and 20 Gy (high dose) x-ray exposure as well as no exposure (0 Gy). Human fibrosarcoma cell line HT- 1080 (ATCC, CCL-121) and fibroblast cell line WI-38 (ATCC, CCL-75) were used as positive and negative controls, respectively. Cells were suspended in 2mL of top agar (0.35% agar in α-minimum essential medium containing 20% FBS) and then plated on 3mL of bottom agar (0.5% agar in α-minimum essential medium containing 20% FBS) in a 6-well plate. Each sample was tested at two concentrations in triplicate: low concentration (5,000 cells/well) and high concentration (67,000 cells/well). Colonies were identified after a 21-day incubation and images captured using light microscopy.

2.11. DNA Damage

Bone marrow-derived MSCs (5 × 103 cells/well) were seeded to µ-Slide 8 Well (ibidi) and grown to ~90% confluency and then irradiated using X-RAD at 0 Gy (no radiation), 4 Gy, 8 Gy and 20 Gy. Cells were prepared for immunostaining 24 hours post-irradiation. Positive control wells were stimulated with 100 μM etoposide (Abcam) for 2 hours prior to staining to induce DNA damage. First, cells were washed three times with PBS and fixed with 4% PFA (37 °C, 15 min). After fixation, cells were washed three times with PBS, permeabilized with 0.1% Triton-X 100 in PBS for 4 min at room temperature and blocked with 3% bovine serum albumin and 0.05% Tween-20 in PBS (blocking solution) for 1 hour at room temperature. Samples were incubated with pS.139-H2A.X antibody (Cell Signaling Technology) in blocking solution at 1:250 for 24 hours at 4 °C, washed five times with PBS and further incubated with goat anti-rabbit secondary antibody, Alexa Fluor 488 (Fisher Scientific) at 1:750 and 4′,6-diamidino-2-phenylindole (Sigma-Aldrich) at 1:5000 in blocking solution for 2 hours at room temperature. Following this, cells were washed five times with PBS and mounting media (ibidi) was added to the wells. Images were captured using the EVOS FL Cell Imaging System (Fisher Scientific) and analysis was conducted using the ImageJ software. Since analysis was conducted on nuclei of the same cell type and assuming the nuclei are similar in size and shape (area is consistent across your regions of interest), mean gray value was used to reflect the average fluorescence intensity per pixel, to compare relative DNA damage levels across conditions. The mean fluorescence intensity within each cell was measured followed by background subtraction, averaging, then normalization against the average measured from the non-irradiated cells (0Gy) or etoposide-treated cells (positive control).

2.12. Statistical Analysis

GraphPad Prism software was used for statistical analysis. For groups with significantly different standard deviations as assessed by the Brown-Forsythe test, the Brown-Forsythe and Welch ANOVA tests with Dunnett T3 multiple comparisons test with individual variances computed for each comparison were performed. Ordinary one-way ANOVA with no pairing and matching with assumption of Gaussian distribution of residuals was conducted for the mean GFP fluorescence intensity, EGFR relative RNA expression and EGFR immunoblotting analyses. An ordinary two-way ANOVA was conducted for cell proliferation and EGFR relative RNA expression analyses without assuming sphericity (equal variability of differences) and using the Geisser-Greenhouse correction. For DNA damage analysis, two-way ANOVA with Tukey’s post-hoc test was conducted to assess differences between mean of etoposide-treated cells and non-treated cells, and between mean of naïve MSCs and eMSC-EGFR at each dose. Then, a comparison was made between naïve MSCs and eMSC-EGFR where each condition was compared to non-irradiated cells (normalized to 0 Gy) to allow for easier comparison of how fluorescence changes relative to radiation exposure. Parametric t-test (unpaired, two-tailed) with Welch’s correction was used to compare naïve vs. engineered MSCs at each dose independently. Error bars represent standard deviation (SD). Statistical significance was considered when p-value < 0.05.

3. Results

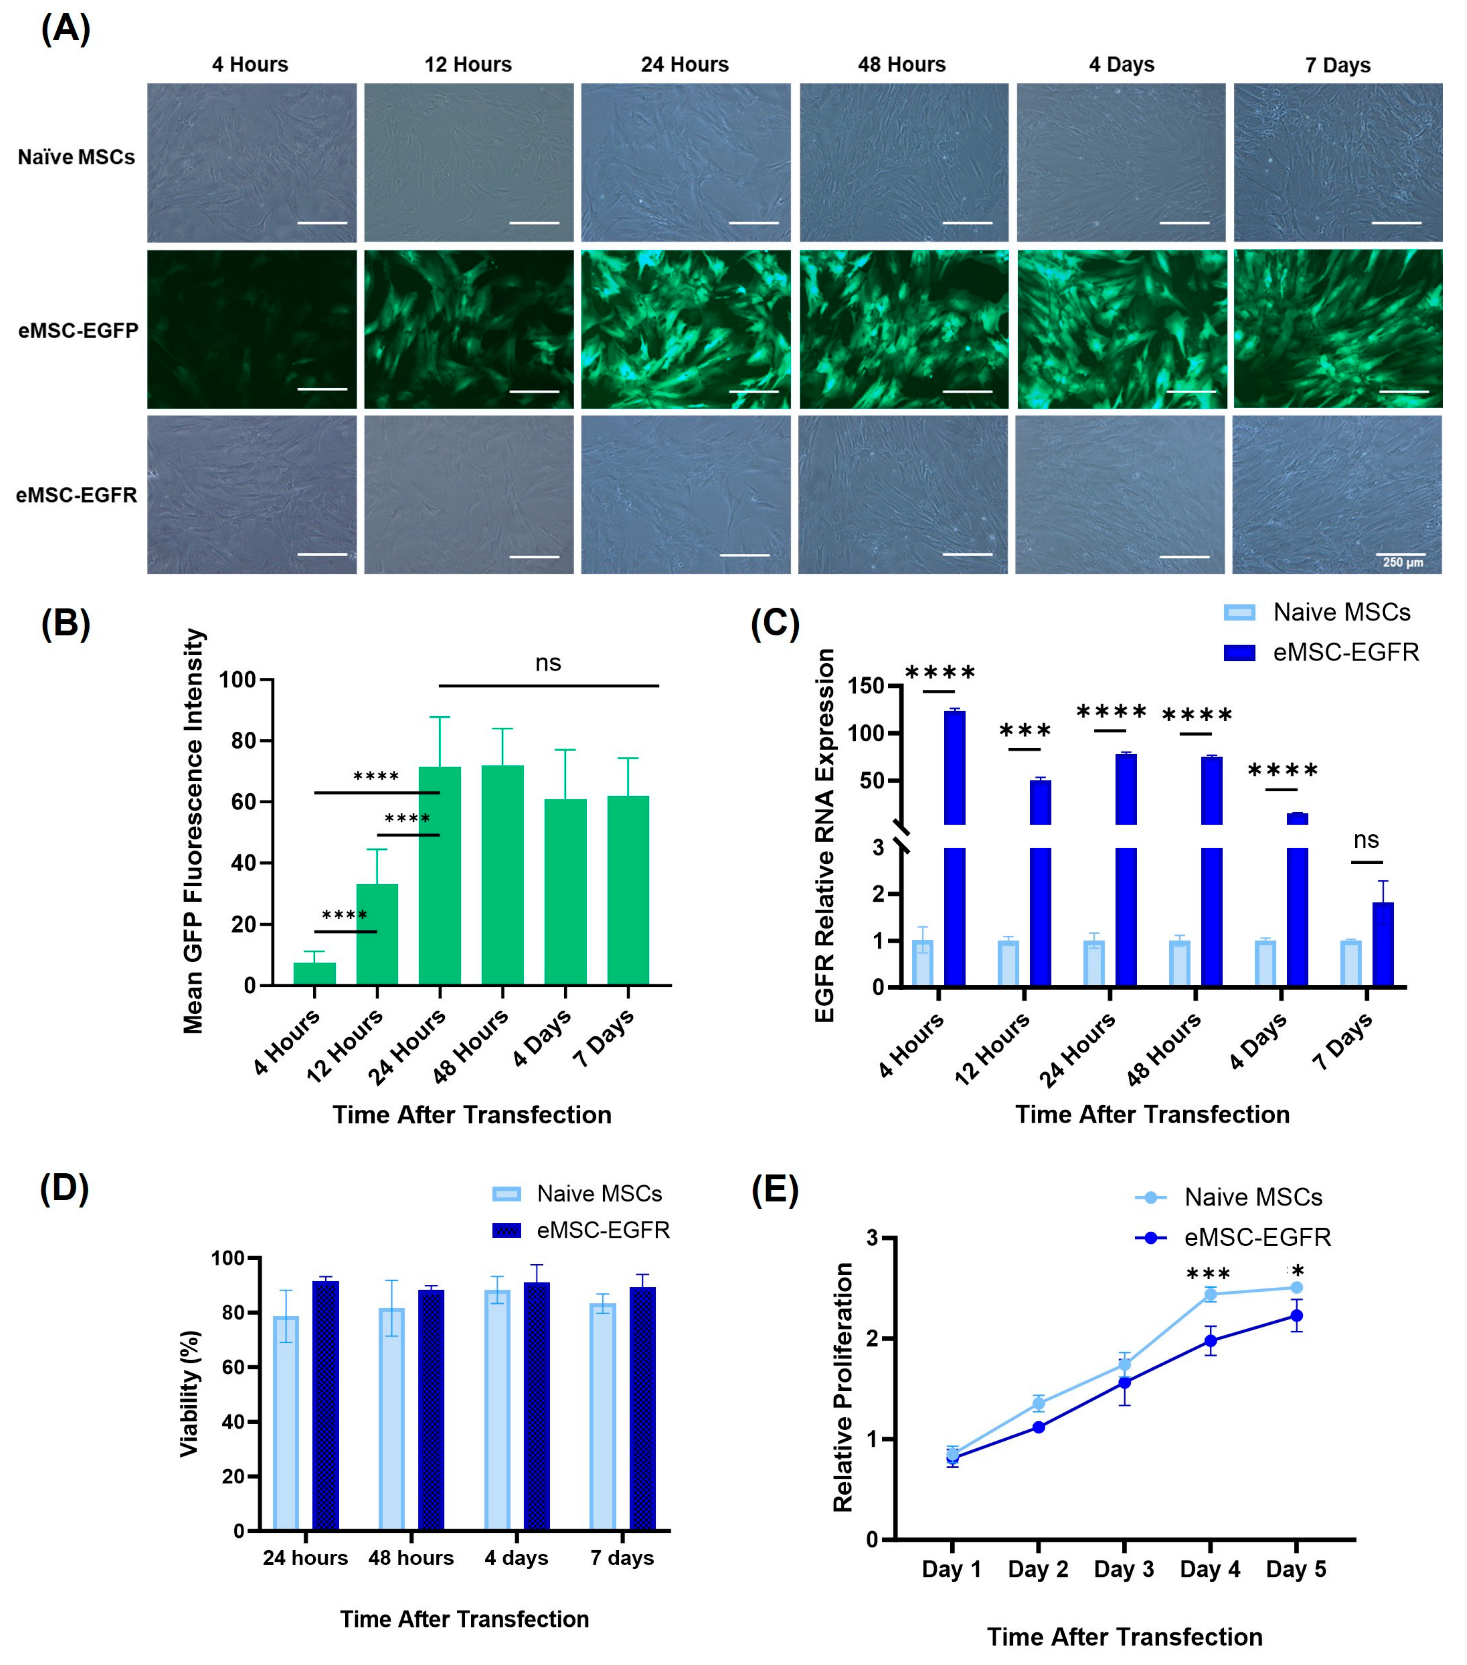
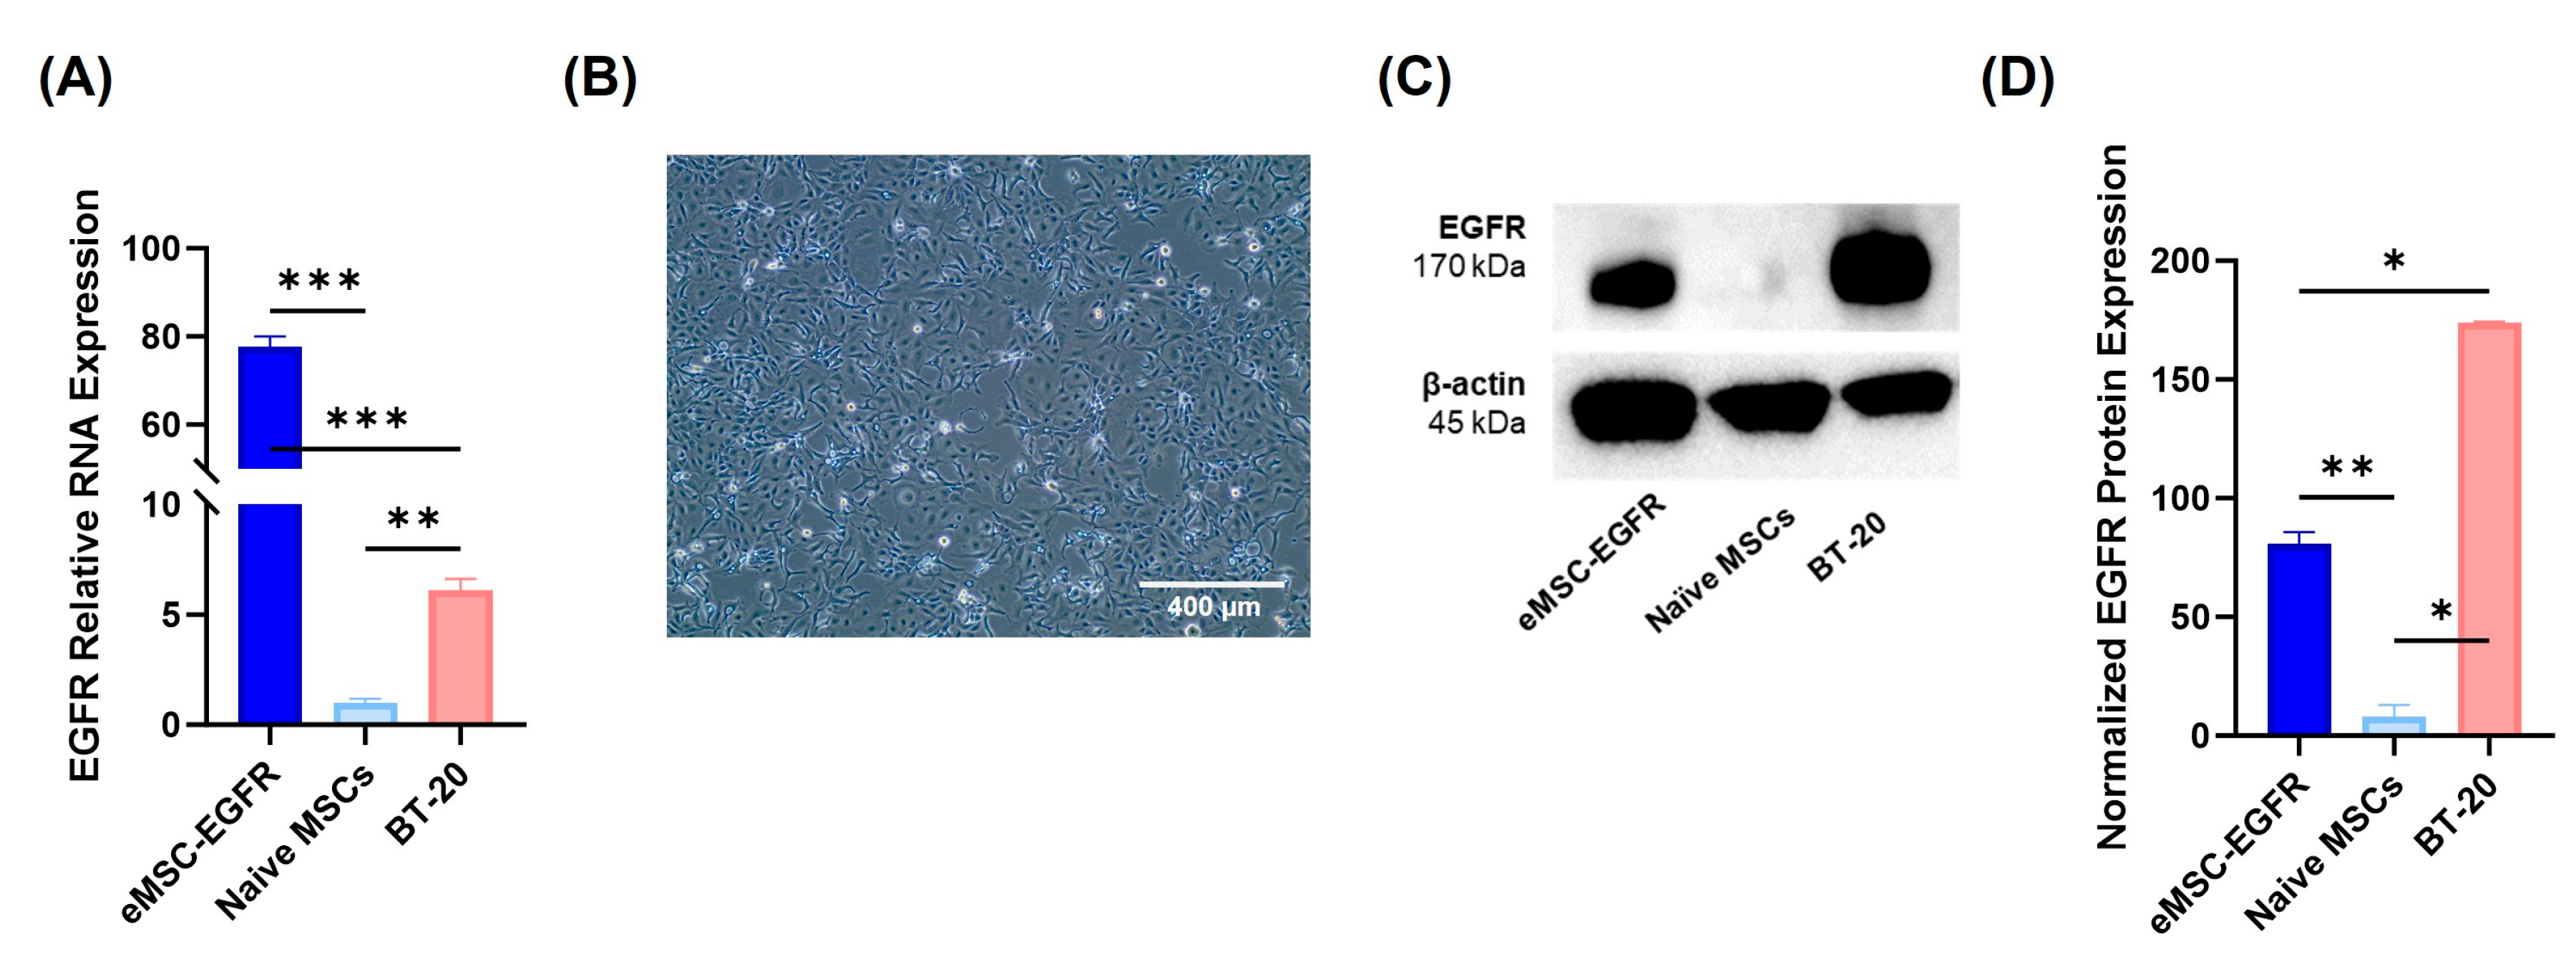
3.2. EGFR mRNA Transfection Efficiency and Protein Expression

To evaluate the feasibility, efficiency, and stability of EGFR mRNA transfection into MSCs, several analyses were performed (Figure 1).
A time course experiment was conducted using a 6-well plate culture system and monitoring expression of EGFP at 4 hours, 12 hours, 24 hours, 48 hours, 4 days, and 7 days post-transfection (Figure 2A-C). The majority of MSCs transfected with EGFP mRNA (eMSC-EGFP) showed EGFP expression throughout, indicating successful transfection. Microscope images for all samples show no evidence of toxicity with the concentration of Lipofectamine MessengerMAX (LMM) used in the experiment (Figure 2A). EGFP transfection reached an optimal level at 24 hours and stayed the same afterwards as indicated by the measurements of mean GFP fluorescence intensity (Figure 2B). Therefore, EGFP mRNA engineered MSCs are viable and show stable GFP expression with the majority of transfected MSCs showing GFP positivity.
As shown in Figure 2A, both eMSC-EGFP and EGFR mRNA engineered MSCs remained viable 7 days post-transfection. qRT-PCR was performed to determine the ability of EGFR mRNA transcripts to enter the MSCs. EGFR mRNA was detected at high levels in eMSC-EGFR, which was over 120 times more than in naïve MSCs at 4 hours post-transfection to more than 15 times at 4 days. However, there was no statistical difference in EGFR relative RNA expression between naïve MSCs and eMSC-EGFR at day 7 (Figure 2C). Viability remained high throughout the time-course experiment with naïve MSCs and eMSC-EGFR showing similar viability measures (Figure 2D). Additionally, the proliferative capacity of MSCs was assessed using the CCK-8 assay. The results demonstrated that while relative proliferation of both naïve MSCs and eMSC-EGFR continued to increase as time progressed, the relative proliferation of eMSC-EGFR was significantly less than that of naïve MSCs on days 4 and 5 after transfection (Figure 2E).
After monitoring the transfection of MSCs with GFP mRNA, EGFR engineered MSCs were compared with the known EGFR-expressing cell line BT-20 (Figure 3A). The relative EGFR mRNA level in eMSC-EGFR was 77 times greater than in naïve MSCs and about 14 times greater than in BT-20 cells. Additionally, western blots were performed to assess EGFR translation and protein expression (Figure 3C-D). Consistent with the qRT-PCR results, naïve MSC lysates produced almost undetectable levels of EGFR protein while both eMSC-EGFR and BT-20 cells strongly expressed EGFR. However, the BT-20 protein band was about two times more intense compared with eMSC-EGFR even though the qRT-PCR results indicated that more EGFR mRNA transcripts were present in eMSC-EGFR. This may suggest that not all the EGFR transcripts transfected into the MSCs were translated into protein. Altogether, these findings indicate that MSCs transfected with EGFR mRNA both uptake the transcripts and translate them into protein.

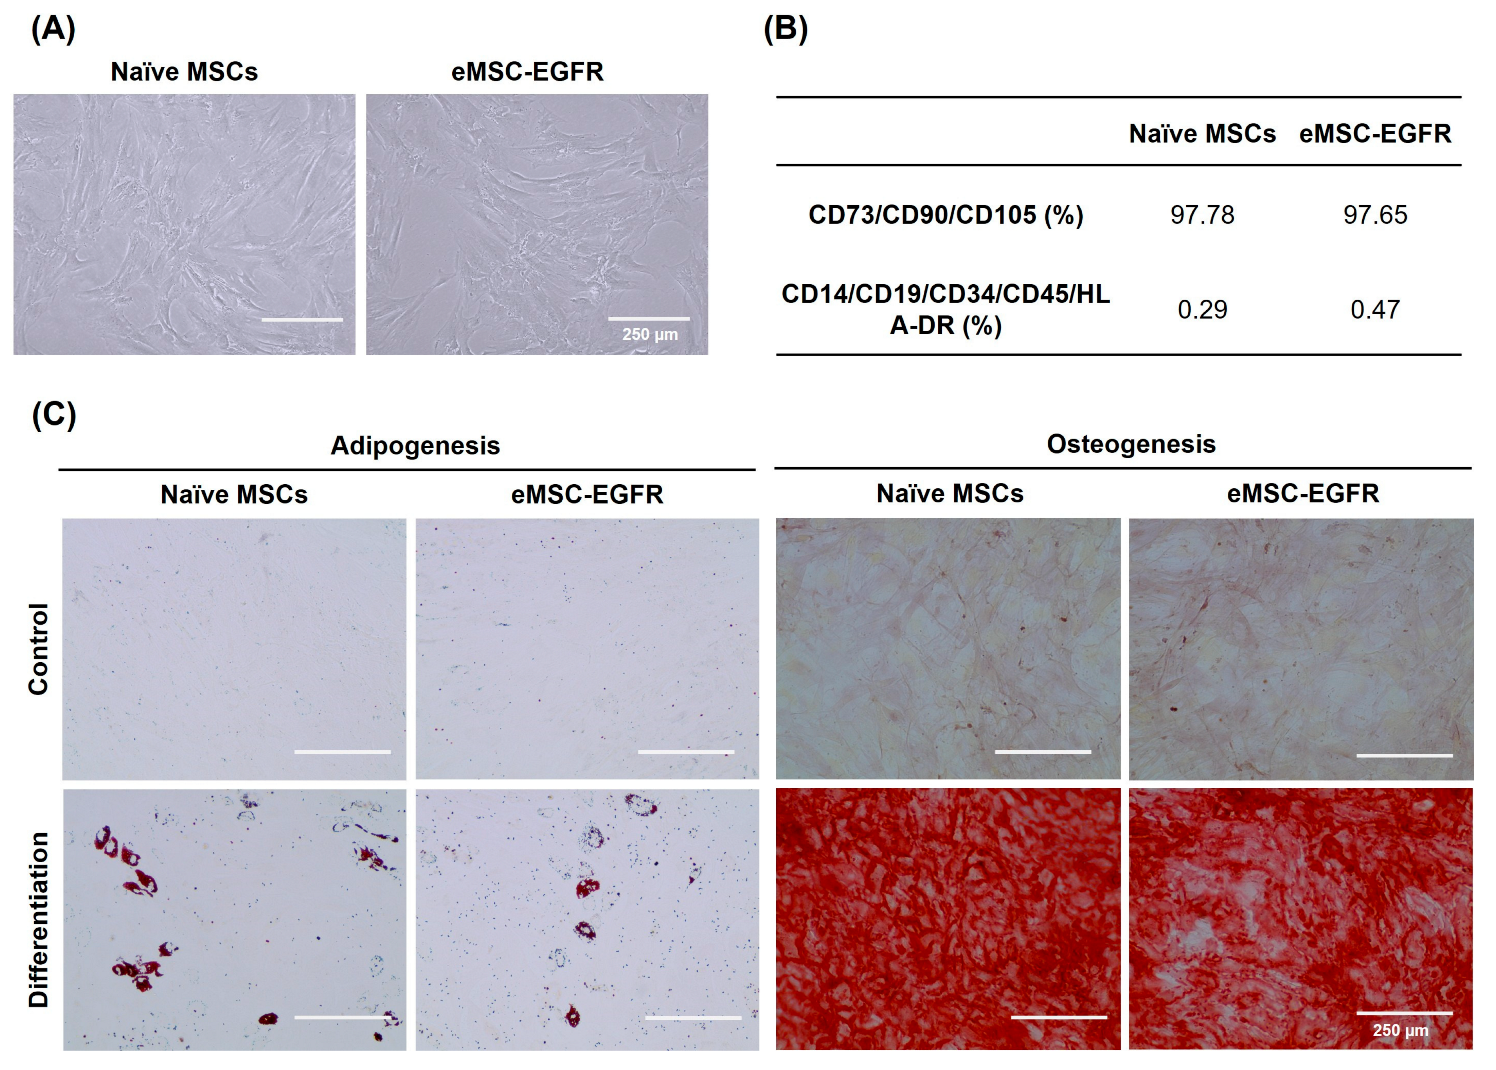
3.2. Characterization of EGFR mRNA-Engineered MSCs

To characterize eMSC-EGFR, their MSC identity was evaluated using morphological analysis, flow cytometry and adipogenic and osteogenic differentiation assays. Following the phenotypic guidelines established by the International Society for Cell & Gene Therapy (ISCT) [15], eMSC-EGFR preserved their spindle or fibroblast-like adherent cell characteristics when compared to naïve MSCs (Figure 4A). Flow cytometry was used to confirm the expression of CD105, CD73 and CD90 and absence of CD45, CD34, CD19, CD14 and HLA-DR in MSCs (Figure 43B). Additionally, eMSC-EGFR retained their ability to differentiate into adipogenic and osteogenic lineages (Figure 4C).

3.3. Cell Morphology and Proliferation Assessment of Irradiated MSCs

After confirming successful transfection of MSCs with EGFR and retaining their properties as MSCs, they were irradiated with a single dose of x-ray, using varying doses ranging from 1 to 20 Gy. Cells were then assessed after exposure (Figure 5).
A cell proliferation assay was performed, and the morphology of cells exposed to different doses of x-ray was observed to assess the radiation responses of naïve MSCs and eMSC-EGFR. Images were captured at different timepoints following radiation exposure with greater evidence of floating cells (dead cells) as time progressed and with higher radiation dose (Figure 6A).
A cell proliferation assay was performed with analysis assessing proliferation at each dose relative to proliferation at dose 0 Gy (no x-ray exposure). No difference in cell proliferation was observed between naïve MSCs and eMSC-EGFR at days 1, 4 and 14 following x-ray exposure. During days 1 and 4 after irradiation, there seem to be no differences between naïve MSCs and eMSC-EGFR at each dose tested, and similar relative proliferation across the different doses, indicating that there were no changes in total cell numbers between the samples at 0 Gy and irradiated ones. However, on day 14, although there are no differences between naïve MSCs and eMSC-EGFR, relative proliferation decreases as dose increases. This indicates that total cell numbers were dropped as time progressed after irradiation, with a correlation to dose. Moreover, significant differences were observed between naïve MSCs and eMSC-EGFR on day 7 following x-ray exposure, with eMSC-EGFR demonstrating greater relative proliferation than naïve MSCs at dose 1 – 8 Gy, and no differences above 8 Gy, indicating eMSC-EGFR showed radioresistance 7 days after irradiation at low doses. This observation had diminished when measured at day 14 (Figure 6B).

3.4. Assessment of Irradiated MSCs for Tumorigenic Potential

A tumorigenicity assay was performed to indicate whether there is any evidence of tumorigenic transformation in naïve MSCs and eMSC-EGFR after x-ray exposure. The presence of radiation may result in oncogenic mutations. Naïve and EGFR engineered MSCs showed no evidence of tumorigenic transformation after 4 Gy and 20 Gy x-ray exposure. We therefore performed a tumorigenicity assay to evaluate both naïve MSCs and eMSC-EGFR tumorigenic potential after 4 Gy (low dose) and 20 Gy (high dose) exposure. HT-1080 was used as a positive control cell line (Figure 7A-C) and showed the formation of colonies at both 5,000 cells/well and 67,000 cells/well. WI-38 was used as a negative control cell line (Figure 7D) and showed no formation of colonies. Neither naïve MSCs nor eMSC-EGFR showed evidence of tumor formation at 4 Gy or 20 Gy even after 3 weeks of cell culture in the assay (Figure 7E-J).

3.5. Genomic Integrity Analysis of Irradiated MSCs

Irradiation induces DNA double-strand breaks (DSBs) in MSCs. γ-H2AX foci, a common marker for DSBs, typically form within minutes after irradiation and peak within 30–60 minutes. In most cell types, these foci diminish within 6–24 hours as repair is completed. If no foci are observed at 24 hours, it may indicate that repair mechanisms like non-homologous end joining (NHEJ) or homologous recombination (HR) have resolved the damage [16]. Therefore, DNA damage evaluation was done by visualization and subsequent quantification of the phosphorylation of histone variant γH2A.X at serine 139, in the nuclear compartment of cells, while 4',6-diamidino-2-phenylindole (DAPI) was used to visualize nuclear DNA (Figure 8). Phosphorylation of H2A.X at S139 is one of the initial signaling events occurring in cells in response to DNA DSBs [17] and is therefore a well-established marker for DNA damage [18].
We chose to evaluate DNA damage 24 hours post-irradiation to determine the long-term effects of irradiation and the efficiency of DNA repair mechanisms (late response). So, immunofluorescence staining and microscopy were used to detect and measure γ-H2AX foci 24 hours after x-ray exposure to assess the ability of naïve MSCs and eMSC-EGFR to efficiently repair DNA DSBs. Persistent DNA damage markers at this stage may indicate more severe or irreparable damage. 2 hours prior to staining, a positive control was included in each group where cells were treated with 100µM etoposide, an inducer of DNA DSBs.
In cells exposed to 0 Gy and 4 Gy, immunostaining showed faint detection of pS.139-γH2A.X in the nuclei of cells (Figure 8A). The etoposide-treated cells for all groups showed high levels of DNA damage as indicated by strong detection of pS.139-γH2A.X, as expected (Figure 8A-B). At each x-ray exposure group, there was a significant difference in the nuclear content of pS.139-γH2A.X between cells treated with etoposide and untreated cells (Figure 8B).
When comparing the mean fluorescence intensity between naive MSCs and eMSC-EGFR when normalized to non-irradiated cells (0Gy) at each exposure group, an increase in relative fluorescence intensity was observed as x-ray dose increased (Figure 8C). Naive MSCs and eMSC-EGFR demonstrated approximately three times greater mean fluorescence intensity 24 hours after exposure to 20 Gy compared to non-irradiated cells. There were no differences between the response of native MSCs and eMSC-EGFR 24 hours after exposure to 8 Gy and 20 Gy. However, naive MSCs demonstrated a statistically greater relative fluorescence intensity, indicating higher DNA damage content, compared to eMSC-EGFR 24 hours after exposure to 4 Gy.

4. Discussion

The focus of this study was to evaluate the radioresistant potential of MSCs when engineered to overexpress EGFR for protection of MSCs from deep space cosmic radiation. Many studies have shown detrimental effects of ionizing radiation on Earth and in space on various parts of the human body, including the hematopoietic system [19]. Unfortunately, the hematopoietic system is one of the main target organs of irradiation injury [20]. Cosmic radiation in space is a serious health hazard and problem for travelers embarking on long-duration and deep space missions [21]. In this study, we first characterized the safety and feasibility of engineering MSCs to overexpress EGFR and then assessed their ability to protect MSCs from low-to-high dose radiation at several timepoints after exposure. MSCs were chosen because they are the most common type of stem/stromal cell used in clinical trials involving cell therapy, and because they play a vital role in the production of many other cell types. Also, MSCs have been used in both basic research and experimental regenerative medicine applications since they can be prepared from multiple sources in the body and are relatively easy to expand in the laboratory.

4.1. Summary of Findings and Suggested Mechanisms

The first step towards establishing successful and feasible transfection of MSCs with EGFR was ensuring the phenotypic identity of MSCs was not affected by EGFR overexpression via mRNA transfection. Successful transfection was confirmed via the qPCR analysis which showed significantly greater EGFR relative RNA expression in eMSC-EGFR compared to naïve MSCs, and significantly greater EGFR protein production via western blot (Figure 2 and Figure 3).
For almost two decades, mRNA transfection into mammalian cells has been studied [22,23]. Engineering stem cells using mRNA transfection is a method with many benefits. First, transfected mRNA is not required to enter the nucleus or integrate into the host genomic DNA which makes the risk of genetic modification highly unlikely [24]. Second, mRNA transfection via lipofectamine-based method does not provoke an immune response to viral antigens in vivo, unlike viral-based transfection [25]. Additionally, mature mRNA can be generated in a cell free environment, reducing the risk of contamination from other cellular components in the final engineered product [26]. Various kinds of nucleotide modifications including 5’ UTR and poly A-tail give high translation efficiency and RNA stability. Also, as shown in the results, this method of mRNA transfection allows high transfection efficiency into MSCs, consistent with previous reports [22,23,27]. As shown in Figure 2, EGFR mRNA level in eMSC-EGFR was nearly 50-100 times greater than naïve MSCs and eMSC-EGFR expressed around 75 times more EGFR proteins compared to naïve MSCs 1 day after EGFR mRNA transfection. Regardless, the significant overexpression of EGFR did not seem to change MSC basic characteristics. Therefore, overexpression of EGFR in MSCs in this study further develops the use of mRNA transfection as a method to enhance stem cells and engineer them to achieve certain biological or therapeutic outcomes. In this study, the aim is to enhance MSCs’ protection from radiation-induced injury.
Radiation is a critical determinant of cellular response, with effects ranging from transient stress to irreversible damage depending on the magnitude and duration of exposure. In general, low dose ionizing radiation (e.g., <1 Gy) may induce mild oxidative stress and DNA damage, often triggering repair mechanisms without significantly impairing proliferation. One study suggested that acute exposure to low-dose (0.1 Gy) radiation transiently affected functional characteristics of human bone marrow-derived MSCs with radiation-induced MSCs having recovered such that they were similar to non-irradiated cells [28]. Moderate to high doses, such as those used in this study (1–8 Gy), are known to cause DNA double-strand breaks, cell cycle arrest, apoptosis, and senescence, particularly in sensitive cell populations. While MSCs are relatively resistant compared to hematopoietic cells (HSCs), they still exhibit dose-dependent changes in proliferation, differentiation, and cytokine secretion following x-ray exposure [29].
In our study, both naïve MSCs and eMSC-EGFR exhibited a dose-dependent decrease in relative proliferation as time post-irradiation progressed. However, naïve MSCs showed a more pronounced reduction at day 7, following moderate-to-high radiation exposure 1-8 Gy, compared to eMSC-EGFR. This disparity may be explained by differences in EGFR expression and intrinsic proliferation rates. EGFR is a key regulator of cell survival and DNA repair, particularly following radiation-induced damage. Cells with higher EGFR expression, such as eMSC-EGFR, may activate more robust pro-survival and repair pathways, including the PI3K/AKT and DNA-PK-mediated mechanisms, thereby mitigating radiation-induced proliferation loss [30]. In contrast, naïve MSCs, which expressed significantly lower levels of EGFR, may lack sufficient signaling to counteract radiation stress, resulting in greater cell cycle arrest or senescence. Additionally, natural proliferation rate is a critical factor in radiation susceptibility, where rapidly dividing cells are more vulnerable to radiation due to increased DNA replication stress and exposure during mitosis [31]. Naïve MSCs showed more rapid proliferation under baseline conditions in the absence of irradiation (Figure 2), and this could further compound its sensitivity to radiation. These findings suggest that both EGFR expression and proliferation kinetics contribute to the differential radiation response observed at day 7, highlighting the importance of intrinsic cellular properties in modulating radiobiological outcomes. Furthermore, our findings show that differences were only evident at moderate dose rates and not higher ones (>8 Gy), which has been observed previously [29].
Notably, no differences were observed on days 1, 4, or 14 post-irradiation, suggesting that the 7-day timepoint captures a critical window where intrinsic differences in radiation sensitivity and repair capacity become functionally apparent. This supports the notion that radiation effects are not only dose-dependent but also temporally dynamic, with delayed cellular responses revealing deeper biological distinctions between naïve and engineered MSCs. MSCs typically exhibit a natural doubling time of approximately 24 to 72 hours under optimal conditions. Early time points (day 1 and 4) likely captured the immediate stress response, during which both cell types may have activated similar repair mechanisms or entered transient cell cycle arrest. By day 7, cells may have resumed proliferation, allowing intrinsic differences in repair efficiency, cell cycle regulation, or senescence induction to manifest as divergent growth rates. The absence of observed differences at day 14 suggests either a recovery or stabilization phase, where surviving cells have adapted to the radiation insult.
The emergence of differential proliferation between naïve MSCs and eMSC-EGFR at day 7 post-irradiation aligns with literature showing that radiation-induced senescence responses in MSCs typically manifest between days 5 and 10. A study investigating ionizing radiation induced cellular senescence in human MSCs over a 10-day period showed that senescence-related changes became prominent around day 6 post-irradiation using x-ray dose of 4 Gy. Also, the 4 Gy dose was sufficient to induce significant cytoskeletal reorganization and activation of senescence pathways including p53, p21 and p16 [32]. Thus, day 7 represents a biologically relevant window to detect early but sustained effects of radiation on stem cell behavior, particularly in relation to their regenerative potential and susceptibility to long-term damage.
Because cells were exposed to ionizing radiation, there is still concern of tumorigenic transformation due to the correlation between ionizing radiation and oncogenic mutation [33,34,35]. Also, since EGFR is reported as an oncogene, the overexpression of EGFR in MSCs may raise concerns of oncogenic susceptibilities [36]. Wild-type EGFR overexpression transformed cells in vitro and induced tumorigenesis in vivo in transgenic mouse models, with tumor maintenance dependent on continuous expression of EGFR [37]. Additionally, mutant EGFR were shown to transform fibroblasts and lung epithelial cells, leading to anchorage-dependent growth and tumor formation in immunocompromised mice [38]. EGFR overexpression and increased EGFR copy number were common events in esophageal squamous cell carcinoma and contributed to malignant biological behaviors [39]. In cancer, EGFR overexpression is mostly due to EGFR gene amplification or mutations. Previous studies have shown an association between EGFR alterations and aggressive biological characteristics in different human cancers of epithelial origin [40,41,42,43,44,45,46,47,48,49,50,51,52]. Nonetheless, our findings show that EGFR overexpression in MSCs and exposure to x-ray does not cause tumorigenic formation within the timeframe investigated in this study.
Furthermore, DNA damage assessment demonstrated cells exposed to 0 Gy and 4 Gy showed faint detection of and quantification of pS.139-γH2A.X in the nuclei of cells. The most likely explanation is that the cells successfully repaired the DNA DSBs induced by the x-ray exposure within 24 hours. However, when visualizing the cells exposed to x-ray dose above 8 Gy, greater detection of pS.139-γH2A.X was found in the nuclei of cells, especially at 20 Gy. Greater DNA damage was experienced following x-ray exposure to high doses and some DNA DSBs remain unrepaired. Therefore, naïve MSCs and eMSC-EGFR possessed a greater capacity for repairing radiation-induced DNA damage following exposure to low and moderate dose rates than high dose rates. The findings indicate that DNA damage caused by ionizing radiation in both naïve MSCs and eMSC-EGFR is dose-dependent, consistent with evidence reported in radiobiological studies [17,29].
Interestingly, the only difference in DNA damage response between naïve MSCs and eMSC-EGFR was detected 24 hours after exposure to 4 Gy. Naïve MSCs demonstrated a statistically greater relative fluorescence intensity, indicating higher DNA damage content, compared to eMSC-EGFR. This implies that engineered MSCs may have enhanced DNA repair mechanisms, protective modifications or resistance to moderate radiation-induced damage. This may also reflect a threshold in which repair mechanisms in naïve MSCs may begin to fail. These findings could model astronauts’ response to moderate acute responses. In our study, 4 Gy x-ray dose is acute and delivered within seconds, however, astronauts in deep space missions receive chronic exposure spread over weeks or months. For instance, astronauts are exposed to 0.15-0.53 mGy/day in low Earth orbit missions on the ISS. In deep space missions, radiation exposure during lunar missions is 0.3-1.0 mGy/day[53] while during a Mars mission it would be 0.7-2.0 mGy/day [5,53,54]. The daily GCR dose equivalent on the lunar surface is approximately 2.6 times greater than the dose inside the ISS [55]. However, there are instances where astronauts do receive acute doses up to 1-2 Gy such as during solar particle events (SPEs) with the absorbed dose being 10.48 mGy/day [56]. SPEs can exceed the annual GCR dose in a single event, especially on the lunar surface or during Mars interplanetary travel where natural shielding is minimal [53]. Therefore, the results of this experiment may closely reflect acute dose delivery in space rather than prolonged chronic exposure.
Transfection of EGFR into MSCs has had a functional impact on how cells respond to DNA damage with several biological mechanisms potentially explaining this. For instance, EGFR overexpression can activate downstream signaling pathways that promote DNA repair, such as PI3K/AKT pathway which enhances cell survival and activates DNA repair proteins [57,58], and MAPK/ERK pathway which can regulate cell cycle checkpoints and repair machinery [59]. EGFR may translocate to the nucleus and interact with DNA-PK, a key player in non-homologous end joining (NHEJ). Additionally, EGFR activation has been shown to suppress TNF-α-induced apoptosis by phosphorylating TNFR1 and modulating downstream signaling. This suppression involves AKT activation, which is known to stabilize Bcl-2 family proteins. This may allow cells to survive longer and repair damage rather than undergoing cell death [60]. Also, EGFR activation can alter the cell cycle, potentially causing cells to accumulate in phases (like G1 or G2) where DNA repair is more efficient, and reducing the accumulation of DNA damage markers at a given time point. The same study also found that EGFR signaling may reduce oxidative stress or enhance antioxidant responses, leading to less secondary DNA damage from reactive oxygen species (ROS) after radiation [61]. EGFR’s role in enhancing DNA repair and reducing ROS implies a potential reduction in γ-H2AX fluorescence intensity, as fewer unrepaired DSBs would be present at a given timepoint. One study showed that EGFR deletion in hematopoietic stem and progenitor cells led to increased DNA damage and impaired recovery after irradiation, and that EGF treatment (activating EGFR) enhanced DNA repair via DNA-PKcs in both murine and human HSCs [62]. Therefore, EGFR expression levels modulate cellular resilience to moderate radiation dose rates.
Furthermore, since our results showed differences in DNA damage between naïve MSCs and eMSC-EGFR at 4 Gy, this may reflect a threshold for repair where eMSC-EGFR
No differences in DNA damage between naïve MSCs and eMSC-EGFR were observed at 8 or 20 Gy. This may reflect a dose-dependent threshold beyond which cellular repair mechanisms become saturated [17]. At moderate doses like 4 Gy, EGFR-mediated DNA repair pathways, such as activation of DNA-PKcs involved in NHEJ, may still function effectively, allowing eMSC-EGFR to repair damage more efficiently than naïve MSCs. However, at higher doses, the extent of DNA damage likely overwhelms these repair systems in both cell types, leading to uniformly high levels of residual damage. Additionally, high-dose radiation may induce widespread apoptosis or necrosis, reducing the population of damaged cells and masking earlier differences [63]. The 24-hour post-irradiation time point may also capture a phase where repair is still ongoing at 4 Gy but largely ineffective at higher doses, further contributing to the convergence in DNA damage levels. These findings suggest that EGFR-associated protection is most evident at moderate radiation doses, where repair capacity is challenged but not yet exceeded.

4.2. Implications for Deep Space Travel

To our knowledge, this is the first study to report the use of EGFR as a target gene for overexpression in MSCs specifically aimed at enhancing protection against simulated cosmic radiation. EGFR has been shown to display resistance against ionizing radiation in the following cancers: non-small cell lung cancer [64,65,66,67], glioblastoma [68], breast cancer [69], head and neck squamous cell carcinoma [70] and colorectal cancer [71]. Understanding how EGFR contributes to radiation resistance in MSCs may offer valuable insights for space research, where radiation exposure poses significant risks to astronaut health and tissue regeneration. This type of research could specifically inform several strategies to support deep space missions. For instance, pharmacological agents that modulate EGFR signaling might be used to enhance cellular resilience against cosmic radiation. MSCs engineered to express protective EGFR pathways could serve as regenerative therapies for radiation-induced tissue damage. Additionally, EGFR could be explored as a biomarker to assess individual susceptibility to radiation, enabling personalized countermeasures. These insights could also guide the development of biological shielding or synthetic biology systems designed to maintain tissue integrity during prolonged exposure to space radiation, ultimately improving astronaut health and mission sustainability.
Our study has set the foundation for further exploration of other potential target radioprotective genes using multiple cell types as models for space radiation exposure. Our study shows that overexpression of MSCs with a gene that has shown radioresistant properties may offer radioprotective effects. MSCs possess a baseline radioresistance, primarily attributed to their efficient DNA damage response mechanisms [72,73]. Also, their quiescent nature often residing in the G0 phase, and ability to engage in autophagy as a protective mechanism to clear damaged organelles and proteins contribute to their radioresistance [74]. Hence, it is important to figure out how to make them even more radioresistant or if their radioresistant pathways can be enhanced in preparation for manned space travel into deep space. This knowledge can also be beneficial in their potential use in regenerative therapies following radiation injury. Taken together, we propose that eMSC-EGFR might be a promising start to enhancing MSCs and other stem cells to be protected from radiation. More studies are needed to fully evaluate the effectiveness of eMSC-EGFR as a therapeutic option for space travelers, and whether systemic overexpression of EGFR affects expression of other genes and their downstream effects.

4.3. Limitations

While no tumorigenic effects were observed in our study, EGFR is an oncogene that may interact with other genes to influence cancer risk, as oncogenic transformation typically involves multiple genetic and environmental factors. Hence, more studies are needed to fully evaluate the effectiveness and safety of overexpressing EGFR in MSCs and other cell types for radioresistant properties. Further studies can investigate radioprotection of EGFR in engineered MSCs when exposed to other radiation types like gamma rays and ultraviolet (UV). Additionally, other sources of MSCs should be investigated for their ability to protect from radiation with EGFR overexpression. One study showed that adipose tissue-derived MSCs exhibit stronger radioresistance compared to umbilical cord-derived MSCs and gingival tissue-derived MSCs due to their efficient repair of irradiation-induced DNA damage, corresponding to low levels of apoptosis and up-regulated expression of stemness-related genes.29 These findings improve our understanding of the radiation-induced responses of MSCs and may lead to the development of better strategies for irradiation-induced tissue damage.
Furthermore, x-ray radiation performed in the laboratory does not fully consider the complexity of cosmic radiation where low and high energy particles and various radiation species exist in space. Cosmic radiation is highly dynamic with various doses and exposures existing all at once. Also, the microgravity environment in space may impose confounding effects and change how cells respond to cosmic radiation. Nonetheless, very little is known about the effects of an actual cosmic radiation environment beyond low Earth orbit on biological systems since humans have yet to embark on such missions.

5. Conclusions

In summary, mRNA transfection of MSCs with EGFR is an effective way to enhance stem cells’ radioprotective abilities, especially at moderate x-ray doses. Our findings indicate that overexpressing EGFR preserves MSC identity and may increase their resistance to radiation, a promising step toward protecting cells during deep space travel. Continued research is needed to fully realize the potential of engineered MSCs as a countermeasure against cosmic radiation.

Author Contributions

F.G. and A.C.Z. conceptualized and wrote the manuscript. P.H. and C.Z. optimized the mRNA transfection protocol and provided experimental guidance while F.G. performed all experiments. A.C.Z. designed and oversaw the whole project and supervised the writing of the manuscript. All authors reviewed and contributed revisions to the manuscript. All authors have read and agreed to the published version of the manuscript.

Funding

This research received no external funding.

Institutional Review Board Statement

The human bone marrow-derived mesenchymal stem cells (BMSCs) used in this study were isolated from commercial de-identified bone marrow. All procedures complied with ethical standards, and donor consent and IRB approval were managed by the supplier.

Informed Consent Statement

Not applicable.

Data Availability Statement

The data of this study are available from the corresponding author on reasonable request.

Acknowledgments

Schematic diagrams were created with BioRender.com.

Conflicts of Interest

The authors declare no conflicts of interest.

References

  1. Li, Z.; Jella, K.K.; Jaafar, L.; Li, S.; Park, S.; Story, M.D.; Wang, H.; Wang, Y.; Dynan, W.S. Exposure to galactic cosmic radiation compromises DNA repair and increases the potential for oncogenic chromosomal rearrangement in bronchial epithelial cells. Sci Rep-Uk 2018, 8. [Google Scholar] [CrossRef]
  2. Chancellor, J.C.; Blue, R.S.; Cengel, K.A.; Auñón-Chancellor, S.M.; Rubins, K.H.; Katzgraber, H.G.; Kennedy, A.R. Limitations in predicting the space radiation health risk for exploration astronauts. Npj Microgravity 2018, 4. [Google Scholar] [CrossRef]
  3. Sridharan, D.M.; Asaithamby, A.; Bailey, S.M.; Costes, S.V.; Doetsch, P.W.; Dynan, W.S.; Kronenberg, A.; Rithidech, K.N.; Saha, J.; Snijders, A.M.; et al. Understanding Cancer Development Processes after HZE-Particle Exposure: Roles of ROS, DNA Damage Repair and Inflammation. Radiat Res 2015, 183, 1–26. [Google Scholar] [CrossRef]
  4. Cucinotta, F.A.; To, K.; Cacao, E. Predictions of space radiation fatality risk for exploration missions. Life Sci Space Res 2017, 13, 1–11. [Google Scholar] [CrossRef] [PubMed]
  5. Ghani, F.; Zubair, A.C. Possible impacts of cosmic radiation on leukemia development during human deep space exploration. Leukemia 2025, 39, 1578–1588. [Google Scholar] [CrossRef] [PubMed]
  6. Pontikoglou, C.; Deschaseaux, F.; Sensebe, L.; Papadaki, H.A. Bone marrow mesenchymal stem cells: biological properties and their role in hematopoiesis and hematopoietic stem cell transplantation. Stem Cell Rev Rep 2011, 7, 569–589. [Google Scholar] [CrossRef] [PubMed]
  7. Zhou, S.; Zhang, M.; Zhou, C.; Wang, W.; Yang, H.; Ye, W. The role of epithelial-mesenchymal transition in regulating radioresistance. Crit Rev Oncol Hematol 2020, 150, 102961. [Google Scholar] [CrossRef]
  8. Zhu, C.; Jiang, X.; Xiao, H.; Guan, J. Tumor-derived extracellular vesicles inhibit HGF/c-Met and EGF/EGFR pathways to accelerate the radiosensitivity of nasopharyngeal carcinoma cells via microRNA-142-5p delivery. Cell Death Discov 2022, 8, 17. [Google Scholar] [CrossRef]
  9. Cuneo, K.C.; Nyati, M.K.; Ray, D.; Lawrence, T.S. EGFR targeted therapies and radiation: Optimizing efficacy by appropriate drug scheduling and patient selection. Pharmacol Ther 2015, 154, 67–77. [Google Scholar] [CrossRef]
  10. Almeida-Porada, G.; Rodman, C.; Kuhlman, B.; Brudvik, E.; Moon, J.; George, S.; Guida, P.; Sajuthi, S.P.; Langefeld, C.D.; Walker, S.J.; et al. Exposure of the Bone Marrow Microenvironment to Simulated Solar and Galactic Cosmic Radiation Induces Biological Bystander Effects on Human Hematopoiesis. Stem Cells Dev 2018, 27, 1237–1256. [Google Scholar] [CrossRef]
  11. Giri, J.; Moll, G. MSCs in Space: Mesenchymal Stromal Cell Therapeutics as Enabling Technology for Long-Distance Manned Space Travel. Curr Stem Cell Rep 2022, 8, 1–13. [Google Scholar] [CrossRef]
  12. Hall, E.J.; Giaccia, A.J. Radiobiology for the Radiologist, 8th Edition ed.; Wolters Kluwer: Philadelphia, PA, 2019; p. 624. [Google Scholar]
  13. Greenberger, J.S.; Epperly, M.W. CNS (Ionizing Irradiation Effects on the Brain, Spinal Cord, and Peripheral Nervous System). In CMCRC Radiobiology Textbook, Greenberger, J.S., Ed.; National Institute of Allergy and Infectious Diseases (NIAID): Bethesda, MD.
  14. Hall, E.J.; Brenner, D.J. The dose-rate effect revisited: radiobiological considerations of importance in radiotherapy. Int J Radiat Oncol Biol Phys 1991, 21, 1403–1414. [Google Scholar] [CrossRef] [PubMed]
  15. Dominici, M.; Le Blanc, K.; Mueller, I.; Slaper-Cortenbach, I.; Marini, F.C.; Krause, D.S.; Deans, R.J.; Keating, A.; Prockop, D.J.; Horwitz, E.M. Minimal criteria for defining multipotent mesenchymal stromal cells. The International Society for Cellular Therapy position statement. Cytotherapy 2006, 8, 315–317. [Google Scholar] [CrossRef]
  16. Penninckx, S.; Pariset, E.; Cekanaviciute, E.; Costes, S.V. Quantification of radiation-induced DNA double strand break repair foci to evaluate and predict biological responses to ionizing radiation. NAR Cancer 2021, 3, zcab046. [Google Scholar] [CrossRef]
  17. Rogakou, E.P.; Pilch, D.R.; Orr, A.H.; Ivanova, V.S.; Bonner, W.M. DNA double-stranded breaks induce histone H2AX phosphorylation on serine 139. J Biol Chem 1998, 273, 5858–5868. [Google Scholar] [CrossRef]
  18. Yuan, J.; Adamski, R.; Chen, J. Focus on histone variant H2AX: to be or not to be. FEBS Lett 2010, 584, 3717–3724. [Google Scholar] [CrossRef]
  19. Talapko, J.; Talapko, D.; Katalinic, D.; Kotris, I.; Eric, I.; Belic, D.; Mihaljevic, M.V.; Vasilj, A.; Eric, S.; Flam, J.; et al. Health Effects of Ionizing Radiation on the Human Body. Medicina-Lithuania 2024, 60. [Google Scholar] [CrossRef]
  20. Shao, L.J.; Luo, Y.; Zhou, D.H. Hematopoietic Stem Cell Injury Induced by Ionizing Radiation. Antioxid Redox Sign 2014, 20, 1447–1462. [Google Scholar] [CrossRef] [PubMed]
  21. Chancellor, J.C.; Scott, G.B.; Sutton, J.P. Space Radiation: The Number One Risk to Astronaut Health beyond Low Earth Orbit. Life (Basel) 2014, 4, 491–510. [Google Scholar] [CrossRef]
  22. Smits, E.; Ponsaerts, P.; Lenjou, M.; Nijs, G.; Van Bockstaele, D.R.; Berneman, Z.N.; Van Tendeloo, V.F. RNA-based gene transfer for adult stem cells and T cells. Leukemia 2004, 18, 1898–1902. [Google Scholar] [CrossRef] [PubMed]
  23. Wiehe, J.M.; Ponsaerts, P.; Rojewski, M.T.; Homann, J.M.; Greiner, J.; Kronawitter, D.; Schrezenmeier, H.; Hombach, V.; Wiesneth, M.; Zimmermann, O.; et al. mRNA-mediated gene delivery into human progenitor cells promotes highly efficient protein expression. J Cell Mol Med 2007, 11, 521–530. [Google Scholar] [CrossRef]
  24. Sahin, U.; Kariko, K.; Tureci, O. mRNA-based therapeutics--developing a new class of drugs. Nat Rev Drug Discov 2014, 13, 759–780. [Google Scholar] [CrossRef]
  25. McLenachan, S.; Zhang, D.; Palomo, A.B.; Edel, M.J.; Chen, F.K. mRNA transfection of mouse and human neural stem cell cultures. PLoS One 2013, 8, e83596. [Google Scholar] [CrossRef]
  26. Kitada, T.; DiAndreth, B.; Teague, B.; Weiss, R. Programming gene and engineered-cell therapies with synthetic biology. Science 2018, 359. [Google Scholar] [CrossRef]
  27. Huang, P.; Zhang, C.; Delawary, M.; Korchak, J.A.; Suda, K.; Zubair, A.C. Development and evaluation of IL-6 overexpressing mesenchymal stem cells (MSCs). J Tissue Eng Regen Med 2022, 16, 244–253. [Google Scholar] [CrossRef] [PubMed]
  28. Fujishiro, A.; Miura, Y.; Iwasa, M.; Fujii, S.; Sugino, N.; Andoh, A.; Hirai, H.; Maekawa, T.; Ichinohe, T. Effects of acute exposure to low-dose radiation on the characteristics of human bone marrow mesenchymal stromal/stem cells. Inflamm Regen 2017, 37, 19. [Google Scholar] [CrossRef]
  29. He, N.; Xiao, C.; Sun, Y.; Wang, Y.; Du, L.; Feng, Y.; Liu, Y.; Wang, Q.; Ji, K.; Wang, J.; et al. Radiation Responses of Human Mesenchymal Stem Cells Derived From Different Sources. Dose Response 2019, 17, 1559325819893210. [Google Scholar] [CrossRef]
  30. Zhan, J.; Jucker, M. The Role of PI3K/AKT/mTOR Signaling in Tumor Radioresistance and Advances in Inhibitor Research. Int J Mol Sci 2025, 26. [Google Scholar] [CrossRef] [PubMed]
  31. McBride, W.H.; Schaue, D. Radiation-induced tissue damage and response. J Pathol 2020, 250, 647–655. [Google Scholar] [CrossRef]
  32. Wang, D.; Jang, D.J. Protein kinase CK2 regulates cytoskeletal reorganization during ionizing radiation-induced senescence of human mesenchymal stem cells. Cancer Res 2009, 69, 8200–8207. [Google Scholar] [CrossRef] [PubMed]
  33. Leuraud, K.; Richardson, D.B.; Cardis, E.; Daniels, R.D.; Gillies, M.; O'Hagan, J.A.; Hamra, G.B.; Haylock, R.; Laurier, D.; Moissonnier, M.; et al. Ionising radiation and risk of death from leukaemia and lymphoma in radiation-monitored workers (INWORKS): an international cohort study. Lancet Haematol 2015, 2, E276–E281. [Google Scholar] [CrossRef] [PubMed]
  34. Gosangi, B.; Davids, M.; Somarouthu, B.; Alessandrino, F.; Giardino, A.; Ramaiya, N.; Krajewski, K. Review of targeted therapy in chronic lymphocytic leukemia: what a radiologist needs to know about CT interpretation. Cancer Imaging 2018, 18. [Google Scholar] [CrossRef] [PubMed]
  35. Gilbert, E.S. Ionising radiation and cancer risks: what have we learned from epidemiology? Int J Radiat Biol 2009, 85, 467–482. [Google Scholar] [CrossRef] [PubMed]
  36. Zandi, R.; Larsen, A.B.; Andersen, P.; Stockhausen, M.T.; Poulsen, H.S. Mechanisms for oncogenic activation of the epidermal growth factor receptor. Cell Signal 2007, 19, 2013–2023. [Google Scholar] [CrossRef] [PubMed]
  37. Xu, N.Q.; Fang, W.F.; Mu, L.B.; Tang, Y.N.; Gao, L.; Ren, S.X.; Cao, D.F.; Zhou, L.X.; Zhang, A.Q.; Liu, D.R.; et al. Overexpression of wildtype EGFR is tumorigenic and denotes a therapeutic target in non-small cell lung cancer. Oncotarget 2016, 7, 3884–3896. [Google Scholar] [CrossRef]
  38. Greulich, H.; Chen, T.H.; Feng, W.; Jänne, P.A.; Alvarez, J.V.; Zappaterra, M.; Bulmer, S.E.; Frank, D.A.; Hahn, W.C.; Sellers, W.R.; et al. Oncogenic transformation by inhibitor-sensitive and -resistant EGFR mutants. Plos Med 2005, 2, 1167–1176. [Google Scholar] [CrossRef]
  39. Lin, G.; Sun, X.J.; Han, Q.B.; Wang, Z.; Xu, Y.P.; Gu, J.L.; Wu, W.; Zhang, G.; Hu, J.L.; Sun, W.Y.; et al. Epidermal growth factor receptor protein overexpression and gene amplification are associated with aggressive biological behaviors of esophageal squamous cell carcinoma. Oncol Lett 2015, 10, 901–906. [Google Scholar] [CrossRef]
  40. Takehana, T.; Kunitomo, K.; Suzuki, S.; Kono, K.; Fujii, H.; Matsumoto, Y.; Ooi, A. Expression of epidermal growth factor receptor in gastric carcinomas. Clin Gastroenterol Hepatol 2003, 1, 438–445. [Google Scholar] [CrossRef]
  41. Ooi, A.; Takehana, T.; Li, X.; Suzuki, S.; Kunitomo, K.; Iino, H.; Fujii, H.; Takeda, Y.; Dobashi, Y. Protein overexpression and gene amplification of HER-2 and EGFR in colorectal cancers: an immunohistochemical and fluorescent in situ hybridization study. Mod Pathol 2004, 17, 895–904. [Google Scholar] [CrossRef]
  42. Hanawa, M.; Suzuki, S.; Dobashi, Y.; Yamane, T.; Kono, K.; Enomoto, N.; Ooi, A. EGFR protein overexpression and gene amplification in squamous cell carcinomas of the esophagus. Int J Cancer 2006, 118, 1173–1180. [Google Scholar] [CrossRef]
  43. Normanno, N.; De Luca, A.; Bianco, C.; Strizzi, L.; Mancino, M.; Maiello, M.R.; Carotenuto, A.; De Feo, G.; Caponigro, F.; Salomon, D.S. Epidermal growth factor receptor (EGFR) signaling in cancer. Gene 2006, 366, 2–16. [Google Scholar] [CrossRef]
  44. Shepard, H.M.; Brdlik, C.M.; Schreiber, H. Signal integration: a framework for understanding the efficacy of therapeutics targeting the human EGFR family. J Clin Invest 2008, 118, 3574–3581. [Google Scholar] [CrossRef]
  45. Xu, Y.; Sheng, L.; Mao, W. Role of epidermal growth factor receptor tyrosine kinase inhibitors in the treatment of esophageal carcinoma and the suggested mechanisms of action. Oncol Lett 2013, 5, 19–24. [Google Scholar] [CrossRef]
  46. Suo, Z.H.; Su, W.; Holm, R.; Nesland, J.M. Lack of expression of c-erbB-2 oncoprotein in human esophageal squamous cell carcinomas. Anticancer Res 1995, 15, 2797–2798. [Google Scholar]
  47. Sunpaweravong, P.; Sunpaweravong, S.; Puttawibul, P.; Mitarnun, W.; Zeng, C.; Baron, A.E.; Franklin, W.; Said, S.; Varella-Garcia, M. Epidermal growth factor receptor and cyclin D1 are independently amplified and overexpressed in esophageal squamous cell carcinoma. J Cancer Res Clin Oncol 2005, 131, 111–119. [Google Scholar] [CrossRef]
  48. Sato-Kuwabara, Y.; Neves, J.I.; Fregnani, J.H.; Sallum, R.A.; Soares, F.A. Evaluation of gene amplification and protein expression of HER-2/neu in esophageal squamous cell carcinoma using Fluorescence in situ Hybridization (FISH) and immunohistochemistry. BMC Cancer 2009, 9, 6. [Google Scholar] [CrossRef]
  49. Akamatsu, M.; Matsumoto, T.; Oka, K.; Yamasaki, S.; Sonoue, H.; Kajiyama, Y.; Tsurumaru, M.; Sasai, K. c-erbB-2 oncoprotein expression related to chemoradioresistance in esophageal squamous cell carcinoma. Int J Radiat Oncol Biol Phys 2003, 57, 1323–1327. [Google Scholar] [CrossRef] [PubMed]
  50. Gotoh, M.; Takiuchi, H.; Kawabe, S.; Ohta, S.; Kii, T.; Kuwakado, S.; Katsu, K. Epidermal growth factor receptor is a possible predictor of sensitivity to chemoradiotherapy in the primary lesion of esophageal squamous cell carcinoma. Jpn J Clin Oncol 2007, 37, 652–657. [Google Scholar] [CrossRef] [PubMed]
  51. Delektorskaya, V.V.; Chemeris, G.Y.; Zavalishina, L.E.; Ryazantseva, A.A.; Grigorchuk, A.Y.; Kononets, P.V.; Davydov, M.I. Squamous cell carcinoma of the esophagus: evaluation of the status of epidermal growth factor receptors (EGFR and HER-2) by immunohistochemistry and in situ hybridization. Bull Exp Biol Med 2010, 149, 615–620. [Google Scholar] [CrossRef] [PubMed]
  52. Kitagawa, Y.; Ueda, M.; Ando, N.; Ozawa, S.; Shimizu, N.; Kitajima, M. Further evidence for prognostic significance of epidermal growth factor receptor gene amplification in patients with esophageal squamous cell carcinoma. Clinical Cancer Research 1996, 2, 909–914. [Google Scholar]
  53. Dobynde, M.; Guo, J.N. Guidelines for radiation-safe human activities on the Moon. Nat Astron 2024, 8, 991–999. [Google Scholar] [CrossRef]
  54. Zeitlin, C.; Hassler, D.M.; Cucinotta, F.A.; Ehresmann, B.; Wimmer-Schweingruber, R.F.; Brinza, D.E.; Kang, S.; Weigle, G.; Bottcher, S.; Bohm, E.; et al. Measurements of energetic particle radiation in transit to Mars on the Mars Science Laboratory. Science 2013, 340, 1080–1084. [Google Scholar] [CrossRef]
  55. Zhang, S.; Wimmer-Schweingruber, R.F.; Yu, J.; Wang, C.; Fu, Q.; Zou, Y.; Sun, Y.; Wang, C.; Hou, D.; Bottcher, S.I.; et al. First measurements of the radiation dose on the lunar surface. Sci Adv 2020, 6. [Google Scholar] [CrossRef]
  56. Dachev, T.P.; Tomov, B.T.; Matviichuk, Y.N.; Dimitrov, P.G.; Bankov, N.G. High dose rates obtained outside ISS in June 2015 during SEP event. Life Sci Space Res (Amst) 2016, 9, 84–92. [Google Scholar] [CrossRef]
  57. Terp, M.G.; Jacobsen, K.; Molina, M.A.; Karachaliou, N.; Beck, H.C.; Bertran-Alamillo, J.; Gimenez-Capitan, A.; Cardona, A.F.; Rosell, R.; Ditzel, H.J. Combined FGFR and Akt pathway inhibition abrogates growth of FGFR1 overexpressing EGFR-TKI-resistant NSCLC cells. NPJ Precis Oncol 2021, 5, 65. [Google Scholar] [CrossRef] [PubMed]
  58. He, Y.; Sun, M.M.; Zhang, G.G.; Yang, J.; Chen, K.S.; Xu, W.W.; Li, B. Targeting PI3K/Akt signal transduction for cancer therapy. Signal Transduct Target Ther 2021, 6, 425. [Google Scholar] [CrossRef] [PubMed]
  59. Chen, D.J.; Nirodi, C.S. The epidermal growth factor receptor: a role in repair of radiation-induced DNA damage. Clin Cancer Res 2007, 13, 6555–6560. [Google Scholar] [CrossRef] [PubMed]
  60. Nam, Y.W.; Shin, J.H.; Kim, S.; Hwang, C.H.; Lee, C.S.; Hwang, G.; Kim, H.R.; Roe, J.S.; Song, J. Correction: EGFR inhibits TNF-alpha-mediated pathway by phosphorylating TNFR1 at tyrosine 360 and 401. Cell Death Differ 2025, 32, 1180. [Google Scholar] [CrossRef]
  61. Serag, M.I.; Tawfik, S.S.; Badr, S.M.I.; Eisa, H.M. New oxadiazole and pyrazoline derivatives as anti-proliferative agents targeting EGFR-TK: design, synthesis, biological evaluation and molecular docking study. Sci Rep 2024, 14, 5474. [Google Scholar] [CrossRef] [PubMed]
  62. Fang, T.; Zhang, Y.; Chang, V.Y.; Roos, M.; Termini, C.M.; Signaevskaia, L.; Quarmyne, M.; Lin, P.K.; Pang, A.; Kan, J.; et al. Epidermal growth factor receptor-dependent DNA repair promotes murine and human hematopoietic regeneration. Blood 2020, 136, 441–454. [Google Scholar] [CrossRef]
  63. Jia, C.; Wang, Q.; Yao, X.; Yang, J. The Role of DNA Damage Induced by Low/High Dose Ionizing Radiation in Cell Carcinogenesis. Exploratory Research and Hypothesis in Medicine 2021, 6, 177–184. [Google Scholar] [CrossRef]
  64. Zhao, S.; Zhuang, W.; Han, B.; Song, Z.; Guo, W.; Luo, F.; Wu, L.; Hu, Y.; Wang, H.; Dong, X.; et al. Phase 1b trial of anti-EGFR antibody JMT101 and Osimertinib in EGFR exon 20 insertion-positive non-small-cell lung cancer. Nat Commun 2023, 14, 3468. [Google Scholar] [CrossRef] [PubMed]
  65. Tumbrink, H.L.; Heimsoeth, A.; Sos, M.L. The next tier of EGFR resistance mutations in lung cancer. Oncogene 2021, 40, 1–11. [Google Scholar] [CrossRef]
  66. Robichaux, J.P.; Le, X.; Vijayan, R.S.K.; Hicks, J.K.; Heeke, S.; Elamin, Y.Y.; Lin, H.Y.; Udagawa, H.; Skoulidis, F.; Tran, H.; et al. Structure-based classification predicts drug response in EGFR-mutant NSCLC. Nature 2021, 597, 732–737. [Google Scholar] [CrossRef]
  67. Zhou, F.; Guo, H.; Xia, Y.; Le, X.; Tan, D.S.W.; Ramalingam, S.S.; Zhou, C. The changing treatment landscape of EGFR-mutant non-small-cell lung cancer. Nat Rev Clin Oncol 2025, 22, 95–116. [Google Scholar] [CrossRef]
  68. An, Z.; Aksoy, O.; Zheng, T.; Fan, Q.W.; Weiss, W.A. Epidermal growth factor receptor and EGFRvIII in glioblastoma: signaling pathways and targeted therapies. Oncogene 2018, 37, 1561–1575. [Google Scholar] [CrossRef]
  69. Hsu, J.L.; Hung, M.C. The role of HER2, EGFR, and other receptor tyrosine kinases in breast cancer. Cancer Metastasis Rev 2016, 35, 575–588. [Google Scholar] [CrossRef]
  70. Nair, S.; Bonner, J.A.; Bredel, M. EGFR Mutations in Head and Neck Squamous Cell Carcinoma. Int J Mol Sci 2022, 23. [Google Scholar] [CrossRef]
  71. Janani, B.; Vijayakumar, M.; Priya, K.; Kim, J.H.; Prabakaran, D.S.; Shahid, M.; Al-Ghamdi, S.; Alsaidan, M.; Othman Bahakim, N.; Hassan Abdelzaher, M.; et al. EGFR-Based Targeted Therapy for Colorectal Cancer-Promises and Challenges. Vaccines (Basel) 2022, 10. [Google Scholar] [CrossRef]
  72. Nicolay, N.H.; Lopez Perez, R.; Saffrich, R.; Huber, P.E. Radio-resistant mesenchymal stem cells: mechanisms of resistance and potential implications for the clinic. Oncotarget 2015, 6, 19366–19380. [Google Scholar] [CrossRef] [PubMed]
  73. Chang, P.; Zhang, B.; Shao, L.; Song, W.; Shi, W.; Wang, L.; Xu, T.; Li, D.; Gao, X.; Qu, Y.; et al. Mesenchymal stem cells over-expressing cxcl12 enhance the radioresistance of the small intestine. Cell Death Dis 2018, 9, 154. [Google Scholar] [CrossRef] [PubMed]
  74. Fan, X.L.; Zhang, Y.L.; Li, X.; Fu, Q.L. Mechanisms underlying the protective effects of mesenchymal stem cell-based therapy. Cell Mol Life Sci 2020, 77, 2771–2794. [Google Scholar] [CrossRef] [PubMed]
Figure 1. Schematic workflow of transfection of MSCs with EGFR. MSCs were transfected with EGFR mRNA and then the feasibility, efficiency, and stability of EGFR mRNA transfection into MSCs were analyzed via microscopy, qRT-PCR, immunoblotting, flow cytometry, cell proliferation assays and differentiation assays. Created with BioRender.com.
Preprints 173855 g001
Figure 2. Feasibility and stability of transfecting EGFR mRNA into mesenchymal stem cells (MSCs) over time and expression of EGFR protein. (A) Representative images of naïve MSCs, eMSC-EGFP and eMSC-EGFR 4h, 12h, 24h, 48, 4d and 7d after transfection. Scale bar: 250 µm. (B) Fluorescent intensities were measured in thirteen randomly selected cells and fields for background per image for each timepoint after transfection in eMSCs-EGFP. Mean background signal was subtracted from each mean fluorescence value. Quantification of green fluorescence intensity was performed using ImageJ Software. Statistical analysis was performed using unpaired with unequal variance, two-tailed Student’s t-test. (C) Quantification of EGFR RNA in eMSC-EGFR (n=3). The EGFR mRNA level in naïve MSCs and eMSC-EGFR was detected after 4h, 12h, 24h, 48, 4d and 7d of transfection. EGFR mRNA in eMSC-EGFR declined as time progressed. (D) Viability measures (n=3). (E) Cell proliferation assay with data normalized to Day 1 at 450 nm. The proliferative capacity of MSCs was assessed by CCK-8 assay (n=3). Data are presented as mean ± SD (standard deviation). *p < 0.05, **p < 0.01, ***p < 0.001, ****p < 0.0001 and ns indicates not significant.
Preprints 173855 g002
Figure 3. EGFR protein production and BT-20 cell line. (A) Relative EGFR RNA levels in eMSC-EGFR (n=3), Naïve MSCs (n=3) and BT-20 cells (n=3). Values are normalized to naïve MSCs. Cells were lysed for RNA isolation 24 hours after transfection and subsequent wash steps. (B) Representative images of BT-20 cells 24 hours in culture. Scale bar: 400µm (C, D) Cells were lysed for western blot analysis 24 hours after transfection. (C) Western blot analysis of EGFR protein levels in eMSC-EGFR, naïve MSCs and BT-20 cells. β-actin served as a loading control. Two independent experiments were performed. Representative western blot data shown. (D) Western blot protein band quantification with EGFR protein normalized to β-actin loading control using ImageJ Software (n=2). Data are presented as mean ± SD. *p < 0.05, **p < 0.01, ***p < 0.001, ****p < 0.0001.
Preprints 173855 g003
Figure 4. Identification of MSCs. (A) Representative images of naïve MSCs and eMSC-EGFR after 24 hours of transfection. (B) Fluorescence-activated cell sorting (FACS) analysis of MSC surface marker expression after 24 hours of transfection. MSC surface markers CD73, CD90 and CD105 were expressed in both naïve MSCs and eMSC-EGFR indicating retention of MSC phenotype. (C) Representative images of MSC differentiation assays. MSCs were cultured in adipogenic differentiation medium for 14 days and stained with oil red-O. MSCs were maintained in osteogenic differentiation medium for 21 days and stained with alizarin red S. Scale bar: 250 µm.
Preprints 173855 g004
Figure 5. Schematic diagram of techniques used to assess MSCs following irradiation with x-ray. Naïve MSCs and eMSC-EGFR were irradiated with x-ray at various dose rates and then assessed for MSC characteristics including morphology, cell proliferation, tumorigenic potential and DNA damage. Created with BioRender.com.
Preprints 173855 g005
Figure 6. Naïve and engineered MSCs after single-dose x-ray exposure. (A) Representative Images of morphology of naïve MSCs and eMSC-EGFR up to 14 days after x-ray exposure at dose rates 0-20 Gy. Scale bar: 500µm. (B) Relative cell proliferation to control (0 Gy) after 14 days of x-ray exposure. Data are presented as mean ± SD. *p < 0.05, **p < 0.01, ***p < 0.001 and ****p < 0.0001.
Preprints 173855 g006
Figure 7. Tumorigenicity assay of naïve and engineered MSCs with EGFR after single-dose x-ray exposure. Cells were seeded on a soft agar to evaluate their tumorigenic potential. (A-C) 5,000 cells/well of positive control cell line HT-1080 and (D) 67,000 cells/well of WI-38 negative control cell line were used as controls to validate the procedure. 67,000 cells/well of MSCs were used for this assay. Naïve MSCs were cultured for three weeks to assess tumorigenic potential 24 hours following (E) no x-ray exposure (F) 4 Gy and (G) 20 Gy. eMSC-EGFR were cultured for three weeks to assess tumorigenic potential 24 hours following (H) no x-ray exposure (I) 4 Gy and (J) 20 Gy. (A, E-J) scale bar: 1000 µm (B-C) scale bar: 500 µm.
Preprints 173855 g007
Figure 8. Evaluation of irradiated MSCs for DNA damage. (A) Representative images of bone marrow-derived mesenchymal stem cells (5000 cells/well) seeded to ibidi µ-Slide 8 Well demonstrating naïve MSCs and engineered MSCs overexpressing EGFR. Cells were exposed to x-ray as indicated, fixed, and subjected to immunofluorescence analysis to visualize pS139-H2A.X. In each group, cells were stimulated with 100µM etoposide to serve as positive control of DNA damage. Scale bar: 10µm (B, C) Quantification of the fluorescence intensity of pS139-H2A.X (n = 40 cells). Analysis was conducted using the ImageJ Software. Data are presented as mean ± SD. (B) Fluorescence intensities were normalized to the etoposide-treated group for each experimental condition. ****p < 0.0001 determined by two-way ANOVA assessing differences between mean of etoposide-treated cells and non-treated cells at each exposure group. (C) Fluorescence intensities at each x-ray exposure group and MSC condition were normalized to non-irradiated cells (0Gy) within that same group. *p < 0.05 determined by parametric t-test (unpaired, two-tailed) with Welch’s correction while ns indicates not significant.
Preprints 173855 g008
Disclaimer/Publisher’s Note: The statements, opinions and data contained in all publications are solely those of the individual author(s) and contributor(s) and not of MDPI and/or the editor(s). MDPI and/or the editor(s) disclaim responsibility for any injury to people or property resulting from any ideas, methods, instructions or products referred to in the content.
Copyright: This open access article is published under a Creative Commons CC BY 4.0 license, which permit the free download, distribution, and reuse, provided that the author and preprint are cited in any reuse.
Prerpints.org logo

Preprints.org is a free preprint server supported by MDPI in Basel, Switzerland.

Subscribe

Disclaimer

Terms of Use

Privacy Policy

Privacy Settings

© 2025 MDPI (Basel, Switzerland) unless otherwise stated