
Submitted:
01 September 2025
Posted:
03 September 2025
You are already at the latest version
Abstract
The aim of this study was to investigate the effects of apple cider vinegar (ACV), vari-ous mouthwashes and bleaching on the color and surface roughness of fiber rib-bon-reinforced and unreinforced restorative materials. The materials were resin com-posite (RC), resin-nanoceramic (RNC), and polymer-infiltrated ceramic network (PICN); the mouthwashes were chlorhexidine with alcohol (CXA), chlorhexidine without alcohol (CX), herbal with alcohol (HRA), and herbal without alcohol (HR). Measurements were taken at T0 (baseline), T1 (1 day), T2 (2.5 days) and T3 (after bleaching). ANOVA and Bonferroni analyses revealed that roughness from T0–T3 was highest for RNC and lowest for PICN. Regarding the solutions, the highest increase was in ACV and lowest in artificial saliva (p < 0.001). At T0–T2, ΔE00 and ΔWID were highest in CXA and lowest in HR. At T2–T3, ΔE00 was highest in ACV, while ΔWID was highest in CXA (p < 0.001). Although the roughness exceeded the bacterial adhesion threshold, the effect of bleaching was not considerable. Color and whiteness changes generally did not exceed the acceptability threshold. Fiber ribbon position did not af-fect roughness. However, a ribbon in middle layer had higher impact on color and whiteness than one in the top layer.
Keywords:
color
; fiber reinforced composites
; hydrogen peroxide
; mouthwashes
; nanocomposites
; surface roughness
1. Introduction
Throughout history, resin composites (RCs) have been widely preferred materials for mimicking the natural appearance of teeth [1]. In 1962, bisphenol A glycidyl methacrylate (Bis-GMA) was developed. Subsequently, the addition of monomers such as triethylene glycol dimethacrylate (TEGDMA), urethane dimethacrylate (UDMA), and bisphenol A ethoxylate dimethacrylate (Bis-EMA) improved the flowability of the material, while the incorporation of micro-, nano-, and hybrid-sized filler particles significantly enhanced its mechanical and optical properties [2].
Currently, nano-filled restorative materials, known as ‘universal RC’, are widely used. Thanks to their optical matching with the surrounding tooth structure, these materials can reduce the visibility of restoration margins (blending effect) and reflect the color of the surrounding tissue (chameleon effect). It has been reported that globular-shaped nanoparticles scatter light in a controlled manner, thereby enhancing optical adaptation [3]. Regardless of the degree of optical adaptation, color stability can decrease rapidly due to acidity, chemical interactions, and the effect of coloring pigments in liquids. Nevertheless, the number of studies investigating the effects of various liquids on the physical properties of universal RC, such as roughness and color, is relatively limited [4].
Other resin-based materials that are widely used include resin-nanoceramic (RNC) and polymer-infiltrated ceramic network (PICN) materials. These are fabricated using computer-aided design/computer-aided manufacturing (CAD/CAM) technology. PICN consists of an inorganic phase (86 wt%) and an organic phase (14 wt%) and is produced by incorporating monomers such as UDMA, Bis-GMA, and TEGDMA into a ceramic network composed of feldspar, zirconia, and sodium aluminosilicate [5]. By contrast, RNCs consist of 71 wt% ceramic fillers and contain nanosilica and zirconia particles that are distributed homogeneously throughout the resin matrix [6].
Regardless of the material used, all dental restoration surfaces should be rendered as smooth as possible before cementation. This is because dental plaque accumulates more easily on rough surfaces, increasing the risk of gingival inflammation and secondary caries. Additionally, pigments in liquids can easily adhere to rough surfaces, causing color changes in restorations over time [7]. These changes can be categorized into two main groups: intrinsic and extrinsic. Internal factors include material structure, degree of polymerization, and water absorption, while external factors include contact with beverages, bleaching gel, or mouthwash. It has been well established that organic acids, such as citric and acetic acids, found in liquids, as well as coloring pigments, alcohols, and other chemical compounds, increase color changes [8]. Apple cider vinegar (ACV), which contains 4–8% acetic acid, has been reported to dissolve dental plaque and is suggested as a potential ingredient for mouthwash. However, studies investigating its effects on the physical properties of dental materials are limited [9,10,11].
Chlorhexidine mouthwash is one of the most commonly used solutions for preventing dental plaque formation. However, chlorhexidine may degrade into parachloraniline, which has been associated with color changes in dental restorations [12]. These mouthwashes are available in alcoholic and non-alcoholic forms; in the alcoholic forms, the softening effect of the alcohol on the surface can increase roughness and color change further [13,14]. Herbal mouthwashes, increasingly popular in recent years, have also been reported to potentially cause color changes in restorations due to natural pigments in their ingredients [15,16]. However, since studies on these mouthwashes are limited, further research is required to evaluate their effects on the color and physical properties of dental restorations [17].
Teeth bleaching systems may affect the physical properties of dental restorations due to the oxidative effects of ingredients such as carbamide peroxide (CP) and hydrogen peroxide (HP) [3]. New bleaching formulations are constantly being developed, and manufacturers assert their safety for clinical use. One such system is Hydrogen Peroxide Superior (HPS), which contains stabilized, encapsulated 25% HP, poloxamer, and various other components. This system is applied in clinical practice using a special dosing pen [18]. However, research on this formulation remains limited [19,20].
Recently, the reinforcement of RC materials with fibers to enhance their mechanical properties has become a popular area of research. It has been reported that fiber strips embedded in the resin matrix can increase the fracture resistance of restorations by absorbing occlusal forces [21,22]. The type of fiber (glass or polyethylene), its position, density, and adhesion to the resin matrix are recognized as key determinants in determining the extent of these mechanical effects [23]. It is thought that the surface morphology and water sorption characteristics of fiber strips may adversely affect the physical and optical properties of the material [24].
The color stability of dental materials is evaluated using various parameters. Currently, one of the methods that best reflects the sensitivity of the human eye to color differences is the CIEDE2000 color change formula (∆E00) [25]. Additionally, the whiteness index change (ΔWID) has gained importance as a complementary parameter for objectively evaluating results obtained with bleaching [26].
For these reasons, this study aims to evaluate the effects of ACV, various mouthwashes, and a bleaching agent on the surface roughness and color stability of RC, PICN, and RNC materials reinforced and non-reinforced with fiber strip. The null hypothesis of the study is that ACV, mouthwashes, and the bleaching agent would not affect the surface roughness, ∆E00, and ∆WID values of the tested materials.
2. Materials and Methods
2.1. Design of the Study
As this study was an in vitro study in which humans or animals were not used for experimental purposes, it did not require ethical approval. Five groups were formed based on the materials used. The materials were as follows: RNC (Cerasmart 250; GC Corporation, Tokyo, Japan [CS]), PICN (Vita Enamic; VITA Zahnfabrik, Bad Säckingen, Germany [VE]), and nanohybrid RC (Filtek Universal; 3M ESPE, St. Paul, Minnesota, USA [FU]). The group with a fiber strip in the middle layer of the FU material was named FUM, and the group with a fiber strip in the upper layer was named FUS. The fiber strip used (everStick NET; GC Corp., Tokyo, Japan [ES]) was a glass fiber-based strip material.
Each group was divided into six subgroups based on the immersion solutions. The solutions used were as follows: artificial saliva (Testonic Artificial Saliva; Colin Kimya, Istanbul, Turkey [AS]), ACV (Kühne Apple Vinegar; Carl Kühne KG, Hamburg, Germany), chlorhexidine-containing and alcohol-containing mouthwash (Andorex Mouthwash; Humanis Health, Istanbul, Turkey [CXA]), chlorhexidine-containing and alcohol-free mouthwash (Klorhex Plus Mouthwash; Drogsan GmbH, Ankara, Turkey [CX]), herbal and alcohol-containing mouthwash (One Drop Only; One Drop Only GmbH, Berlin, Germany [HRA]), herbal and alcohol-free mouthwash (Agarta Mouthwash; Agarta Cosmetics, Ankara, Turkey [HR]). The materials used in the study are presented in Table 1, and the study design is illustrated in Figure 1.
The sample size was determined using a power analysis program (G*Power v3.1.9.7; Heinrich-Heine-Universität, Düsseldorf, Germany). When the significance level was set at 0.05, the test power at 0.95, and the effect size at 0.25, the minimum required specimen size was found to be 279. To ensure an equal distribution of specimens across groups, the total sample size was set to 300 (n = 10 per subgroup) [20,27]. Two additional specimens were included in each subgroup for scanning Electron Microscopy (SEM) analysis. One of these specimens was planned to be examined after immersion in the solutions, while the other was to be examined after the bleaching process.
Specimens were randomly distributed into groups for standardization and randomization. Specimens to be selected for SEM were randomly selected from the groups. Specimen preparation, immersion in solutions, bleaching, surface roughness, and color measurements were performed sequentially. To enhance the reliability of the study, procedures were randomly assigned among researchers, and each procedure was carried out by a different researcher.
2.2. Preparation of Specimens
The materials used in the study and the test procedures applied are by the EN ISO 6872:2024 standard reported for dental restorations. CS and VE blocks were cut to a thickness of 2 mm using a water-cooled specimen cutting device (Micracut 201; Metkon Instruments, Bursa, Turkey). Since the width and length measurements of the blocks were standardized by the manufacturer, no further processing was performed on these dimensions. The specimens were polished using a ceramic polishing set (Diacomp Plus HP; EVE Ernst Vetter GmbH, Keltern, Germany).
The FU specimens were prepared by placing the RC material into a metal mold designed for making 2 mm thick specimens measuring 8 × 10 mm. For the FUM group, the RC material was applied to the mold at a thickness of approximately 1 mm. Depth standardization was checked using a periodontal probe. The ES material was cut to a length of 8 mm, placed on the RC material, and condensed using a hand tool. A second RC layer, 1 mm thick, was then placed on top and similarly condensed using the same instrument (Figure 2).
The only difference between the FUS group and the FUM group was that the ES was positioned 1.5 mm above the RC base. The prepared FU, FUM, and FUS specimens were compressed between two glass plates in the mold to obtain their final shape (Figure 3). Polymerization was performed using an LED curing unit (Elipar Deep Cure S10; 3M ESPE, MN, USA) for 20 seconds. The specimen surfaces were polished using a composite polishing set (Diacomp Plus HP; EVE Ernst Vetter, Keltern, Germany). All specimens were maintained in distilled water at 37°C for 24 hours in an incubator (UM 400; Memmert GmbH, Schwabach, Germany) to ensure standardization.
2.3. Immersion in Solutions and Bleaching
Roughness and color measurements were performed at four different time points: initial (T0), 1 day after addition to the solutions (T1), 2.5 days after addition to the solutions (T2), and after the bleaching process (T3). The specimens were maintained at 37°C in the same incubator throughout the entire experimental process to simulate clinical conditions.
Specimens were taken from distilled water, washed, and gently dried with a paper towel. Then, T0 measurements were taken. The solutions were left to stand in 15 ml glass jars labelled with specific codes. After placing the specimens in their respective solutions, surface measurements were taken in the T1 phase using the same procedure. The specimens were then returned to their containers, and measurements were taken in the T2 phase using the same method.
T1 simulated two years, while T2 simulated five years. This approach is consistent with the accelerated immersion model reported in recent studies, enabling the comparison of short- and medium-term effects of different formulations [28,29]. To prevent contamination and maintain a constant concentration, all solutions in which the specimens were stored were renewed daily.
The CXA, CX, and HR solutions were used directly, while the HRA solution was prepared by adding one drop to 15 ml of distilled water, as instructed by the manufacturer. To simulate the oral environment as accurately as possible, the pH value of the AS solution needed to be neutral. Therefore, an AS solution that complied with the ISO 7491:2000 standard was used.
A combined glass electrode pH meter (InoLab pH 720; WTW, Weilheim, Germany) was used to measure the pH values of the solutions [11]. The pH value of ACV was diluted to 4.1 with distilled water, in line with previous studies [30,31]. Before each test day, the device was calibrated using pH 4 and pH 7 buffer solutions (Certipur Buffer Solution; Merck KGaA, Darmstadt, Germany). During measurements, the glass electrode was placed in 15 mL of solution, and the values were recorded. After each measurement, the probe was rinsed with distilled water and dried.
In the T3 stage, 25% HPS gel (Cavex Bite&White In-Office; Cavex Holland BV, Haarlem, Netherlands) was applied to the specimens’ surfaces using the provided dosage pen, according to the manufacturer’s recommendations [18], and the specimens were bleached for 45 minutes. Afterward, the specimens were rinsed under water, gently wiped with a paper towel, and final measurements were taken (Figure 3).
2.4. Color and Surface Measurements
Surface roughness measurements were performed using a profilometer (Perthometer M2; Mahr GmbH, Göttingen, Germany). The measurement range was set to 5.6 mm, with a cut-off value of 0.25 mm. A scanning probe of the NHT-6 type with a measurement range of 100 µm was used. Measurements were taken at three points near the center of each specimen, and the average of the obtained values was recorded. The device was calibrated after each set of ten measurements, taking into account the number of subgroups.
Color measurements were performed in a specially prepared color booth to standardize environmental conditions and prevent errors caused by ambient light. The interior surfaces of the booth, designed with dimensions of 30 × 130 × 70 cm, were covered with neutral gray cardboard [32]. Measurements were performed using a spectrophotometer (Vita Easyshade V; VITA Zahnfabrik, Bad Säckingen, Germany) (Figure 3). The device was calibrated after each set of ten measurements. To ensure accuracy, each specimen was measured three times, and the average of these measurements was taken.
The interpretation of color change was performed for the T0–T1, T0–T2, and T2–T3 intervals. ∆E00 was calculated using the following formula [33]:
ΔL′, ΔC′, and ΔH′ represent changes in brightness, saturation, and hue, respectively. These parameters have been corrected using weighting (SL, SC, SH) and parametric (KL, KC, KH) factors. A rotation factor (RT) has been included in the formula to overcome deficiencies in the blue-violet spectrum. In this study, the parametric factors (KL, KC, and KH) were set to 1 [34].
The Whiteness Index formula (WID) was used to determine the direction of color change. The interpretation of changes in the T0–T1, T0–T2, and T2–T3 intervals was performed using the ∆WID formula. The formulas are as follows [33]:
The specimens reserved for SEM analysis were subjected to the same immersion and bleaching protocol as the specimens in the relevant solution groups. SEM analyses were performed at stages T2 and T3 to evaluate the effect of the solutions and the bleaching process on surface morphology. Specimens associated with solution groups having the highest average surface roughness (Ra) values were selected for SEM analysis [35]. One of the two reserved specimens was randomly selected and examined at stage T2. The other specimen was examined at stage T3. The reason why the same specimen cannot be used at both time points is that the surface was coated during the first analysis, making it unsuitable for the second measurement.
Analyses were performed using an SEM instrument (ZEISS EVO 40; Carl Zeiss AG, Oberkochen, Germany). All specimen surfaces were coated with gold before imaging. Each specimen was imaged at magnifications of 5000×, 10,000×, and 25,000×. Images were acquired with the center of the specimens as the reference point. The EHT value was set to 20 kV during the imaging process.
2.5. Statistical Analysis
Statistical analyses of roughness and color measurements were performed using a software program (IBM SPSS Statistics v28.0; IBM Corporation, Armonk, NY, USA). The main effects and interactions of the independent variables (material, solution, and time) were assessed using a three-way analysis of variance (ANOVA). The homogeneity of within-group variances was checked using the Levene test, and the conformity of the data to a normal distribution was checked using the Shapiro–Wilk test. Comparisons between significant variables were evaluated using the Bonferroni post-hoc test. In all statistical analyses, p < 0.05 was considered significant.
3. Results
3.1. Surface Roughness Analysis
The ANOVA results for Ra values are shown in Table 2. The results revealed statistically significant effects of material, solution, time, and solution-time on Ra (p < 0.001).
When the material was examined regardless of solution or time, the highest value was found in CS (0.30 µm) and the lowest in VE (0.22 µm). For the solution, the highest value was found in ACV (0.31 µm) and the lowest in AS (0.20 µm). For time, the highest value was found in T3 (0.33 µm) and the lowest in T0 (0.17 µm) (p < 0.001) (Table 3).
When the material-solution interaction was evaluated regardless of time, ACV generally caused the greatest change in Ra in all materials, while AS caused the lowest (p > 0.05). The highest value was found for CS–ACV (0.36 µm), while the lowest value was for VE–AS (0.18 µm) (p > 0.05).
When the material-time interaction was evaluated regardless of solution, T3 generally caused the greatest change in Ra in all materials, while T0 caused the lowest (p > 0.05). The highest value was found for CS–T3 (0.39 µm), while the lowest value was for FUM–T0 (0.16 µm) (p > 0.05) (Figure 4).
When the solution-time interaction was evaluated regardless of material, T3 generally caused the greatest change in Ra in all solutions, while T0 caused the lowest (p < 0.001). The highest value was found for ACV–T3 (0.43 µm), and the lowest was in ACV–T0 (0.16 µm) (p < 0.001).
When the material-solution-time interaction was evaluated, Ra generally increased from T0 to T3 for all materials in each solution. The highest value was found in the CS–ACV–T3 solution (0.47 µm), while the lowest value was found in the FU–ACV–T0 solution (0.13 µm) (p > 0.05).
3.2. ∆E00 Analysis
The ANOVA results for ∆E00 values are shown in Table 2. The results revealed statistically significant effects of material, solution, time, material-solution, material-time, and solution-time on ∆E00 (p < 0.001).
When the material was examined regardless of solution or time, the highest value was found in FU (ΔE00 = 1.57) and the lowest in VE (ΔE00 = 0.81). For the solutions, the highest value was found in ACV (ΔE00 = 1.66) and the lowest in HR (ΔE00 = 0.57). For time, the highest value was found in T0–T2 (ΔE00 = 1.53) and the lowest in T2–T3 (ΔE00 = 0.64) (p < 0.001) (Table 4).
When the material-solution interaction was evaluated regardless of time, ACV and CXA caused the greatest change in ∆E00, while AS and HR caused the lowest (p < 0.001). The highest value was in FU–ACV (ΔE₀₀ = 1.95), and the lowest was in VE–HR (ΔE₀₀ = 0.24) (p < 0.001).
When the material-time interaction was evaluated regardless of solution, T0–T2 generally caused the greatest change in ∆E00 in all materials, while T2–T3 caused the lowest (p < 0.001). The highest value was found in FU–T0–T2 (ΔE₀₀ = 2.15), and the lowest in VE–T2–T3 (ΔE₀₀ = 0.53) (p < 0.001) (Figure 4).
When the solution-time interaction was evaluated regardless of material, T0–T2 generally caused the greatest change in ∆E00 in all solutions, while T2–T3 caused the lowest (p < 0.001). The highest value was found in the CXA–T0–T2 solution (ΔE00 = 2.20), and the lowest was in the HR–T2–T3 solution (ΔE00 = 0.34) (p < 0.001).
When the material-solution-time interaction was evaluated, ∆E00 generally showed the highest values in T0–T2 and the lowest in T2–T3 for all materials in each solution (p > 0.05). The highest value was found in the FU–ACV–T0–T2 combination (ΔE00 = 2.68), while the lowest value was found in the VE–HR–T0–T1 combination (ΔE00 = 0.18) (p > 0.05).
3.3. ∆WID Analysis
The ANOVA results for ∆WID values are shown in Table 2. The results revealed statistically significant effects of material, solution, time, material-solution, material-time, and solution-time on ∆WID (p < 0.001).
When the material was examined regardless of solution or time, the highest change was found in FU (ΔWID = -0.68) and the lowest in VE (ΔWID = -0.40). For the solutions, the highest value was found in ACV (ΔWID = -0.90) and the lowest in HR (ΔWID = -0.06). For time, the highest value was found in T0–T2 (ΔWID = -1.20) and the lowest in T2–T3 (ΔWID = 0.43) (p < 0.001). (Table 5).
When the material-solution interaction was evaluated regardless of time, ACV generally caused the greatest change in ∆WID, while HR and HRA generally caused the lowest (p < 0.001). The highest value was in FU–ACV (ΔWID = -1.18), and the lowest in VE–HRA (ΔWID = -0.04) (p < 0.001).
When the material-time interaction was evaluated regardless of solution, T0–T2 caused the greatest change in ∆WID in all materials, while T2–T3 caused the lowest (p < 0.001). The highest change was found in FU–T0–T2 (ΔWID = -1.46), and the lowest in VE–T2–T3 (ΔWID = 0.32) (p < 0.001).
When the solution-time interaction was evaluated regardless of material, T0–T2 caused the greatest change in ∆WID in all solutions, while T2–T3 generally caused the lowest (p < 0.001). The largest change was found in CXA–T0–T2 (ΔWID = -1.87), and the lowest was in HR–T0–T1 (ΔWID = -0.19) (p < 0.001) (Figure 4).
When the material-solution-time interaction was evaluated, ∆WID generally showed the highest changes in T0–T2 for all materials and the lowest in T2–T3 (p < 0.001). The highest change was found in the FU–ACV–T0–T2 combination (ΔWID = -2.38), while the lowest change was found in the VE–AS–T0–T1 combination (ΔWID = 0.02) (p < 0.001).
3.4. SEM Analysis
Since the highest Ra value for FU was found in the ACV group at T2, the FU–ACV specimen was analyzed. At T2, deepened polishing lines, fine pitting, and filler protrusions were observed at 5000×; debonding at the matrix-particle interface and microcracks due to particle detachment were observed at 10000×; and nano debonding, fine microcracks, and matrix roughness were observed at 25000× (Figure 5). At T3, although the surface was found to be homogeneous at 5000×, numerous pitting and linear marks were observed; micropittings and debondings were identified at 10000×; and granular roughness, microcrack-like grooves, and nanopittings were observed at 25000× (Figure 6).
Since the highest Ra value for FUS was found in the ACV group at T2, the FUS–ACV specimen was analyzed. At T2, parallel lines and distinct grooves were observed on the surface at 5000×, while debondings and micropits were observed at the matrix-particle interface at 10000×, and nanocrack-like lines, granular roughness, and matrix erosion were observed at 25000× (Figure 5). At T3, large cracks, debondings, and sharp edges were visible at 5000×; cracked matrix pieces and voids were observed at 10,000×; and pittings, debondings, and sharp edges were observed at 25,000× (Figure 6).
As the highest Ra value for FUM was found in the CXA group at T2, the FUM–CXA specimen was analyzed. At T2, lineal marks and debonding were observed on the matrix surface at 5000×; fine irregularities and debonding were observed at 10,000×; and nano-irregularities, granular roughness, and slight pittings were observed at 25,000× magnification (Figure 5). At T3, scattered small pits and slight lineal marks were observed at 5,000×; fine grooves, distinct debondings, and erosions were observed at 10,000× magnification; and nanopittings, debonding, and granular roughness were observed at 25,000× (Figure 6).
Since the highest Ra value for CS was found in the ACV group at T2, the CS–ACV specimen was analyzed. At T2, the surface was rough and divided by lineal marks at 5000×; extensive micro-debonding and sharp edges were observed at 10000×; and granular roughness, nano-pits, and matrix erosion were observed at 25000× (Figure 5). At T3, rough topography and lineal marks were observed at 5000×, extensive micro-pits and micro-debonding at 10000×, and granular roughness and matrix erosion at 25000× (Figure 6).
Since the highest Ra value for VE was found in the ACV group at T2, the VE–ACV specimen was analyzed. At T2, irregular, sharp-edged ceramic network areas, crack lines, and areas detached from the polymer phase were observed at 5000×; voids due to polymer loss and gaps between ceramic plates were observed at 10000×; and microcracks, deep pitting, and fragmented edges were observed at 25000× (Figure 5). At T3, the ceramic network structure became more pronounced at 5000×, and deep voids formed. At 10000×, cracked and sharp-edged ceramic pieces and voids due to polymer loss were observed. Microcracks, sharp pittings, crack lines, and fractured edges were observed at 25,000× (Figure 6).
4. Discussion
Based on the statistical analysis results obtained in this study, the null hypothesis that ACV, mouthwashes, and bleaching agents would not affect the surface roughness, ∆E00, and ∆WID values of the tested materials was rejected. Previous studies have reported the Ra threshold at which bacterial adherence is inhibited as 0.2 µm and the threshold at which the tongue can perceive roughness as 0.5 µm [36,37]. This study indicated that, regardless of the solution type, Ra values were below 0.2 µm at T0 but exceeded this threshold at subsequent time points. However, no roughness value that the tongue could perceive was detected in any material. This suggests that the materials mostly retained their surface integrity despite the different solution and time conditions.
Roughness measurements are commonly performed using contact-type profilometers; however, the path followed by the device during measurement may influence the Ra value [38]. In this study, three measurements were taken on each specimen, and the means were calculated to enhance the reliability of the measurements. It has been reported that differences in polishing technique may affect the Ra value [39]. Therefore, to standardize the process, the specimens were polished using a method consistent with the manufacturer’s recommendations.
Vinegar contains 4–8% acetic acid, which can increase roughness by softening the matrix, displacing filler particles, and promoting water absorption [40,41]. However, vinegar has been reported to indirectly reduce the risk of gingival infection by inhibiting dental plaque formation [9,11]. Research has shown that the effects of vinegar on tooth enamel and dental restorations can be studied in vitro, but these effects cannot be directly applied to in vivo results because of various factors, including saliva, pellicle, feeding time, buffering, and brushing [42]. Therefore, ACV was tested in vitro in this study.
For ACV to be used as a mouthwash, its pH level needs to be above a certain threshold. According to the ISO 16408:2015 standard, the pH range for mouthwashes is 3.0–10.5 [30]. In studies on dental erosion, the pH is commonly kept within the range of 4.0–4.5 [31,43]. Furthermore, the pH range of most commercial mouthwashes has been reported to be 4.1–7.9 [30]. Therefore, in this study, the pH was adjusted to 4.1 to simulate the acidic effect of ACV.
In this study, AS with a pH of 6.8 was used, in accordance with ISO 7491:2000. This value was chosen to mimic the average pH of saliva at rest. When the solutions were examined, regardless of the material, the order of Ra in T2 was ACV > CXA > CX > HRA > HR > AS. Consistent with a previous study [44], roughness increased by only about 0.02 µm in the AS group. This negligible change is consistent with the acid-buffering effect of saliva.
The recommended pH threshold for preventing tooth or material erosion is 5.5 [45]. Of the mouthwashes used in this study, only CXA was below this threshold, with a pH level of 5.2. Consistent with a previous study [16], this study found that alcohol-based mouthwashes increased Ra more than alcohol-free mouthwashes. Furthermore, it was found that herbal mouthwashes increased Ra by less than mouthwashes with chlorhexidine. Although chlorhexidine is considered the gold standard for dental plaque control, prolonged use may cause deterioration and discoloration of restoration surfaces. Furthermore, alcohol may degrade polymer chains, resulting in surface wear [27].
In line with Aksoy Vaizoğlu’s study [46], the Ra values increased in the solutions kept in the mouthwashes. The increase was minimal in the HRA and HR groups, which may be due to the limited acidity and solubility of the herbal ingredients. This study found that CX, CXA, and ACV significantly increased the roughness of most materials compared to baseline. At T3, the Ra values in the ACV groups reached 0.43 µm for FU, 0.45 µm for FUS, 0.41 µm for FUM-ACV, 0.47 µm for CS, and 0.37 µm for VE. In contrast, the effect of HRA and HR remained lower in most combinations. The results suggest that mouthwashes may potentiate the roughness-increasing effect of bleaching, possibly due to the weakened matrix being more readily dissolved during bleaching. Furthermore, bleaching agents with viscous matrices may increase penetration by adhering to the surface longer, thus exacerbating deterioration [46].
It is well known that HP agents can influence the surface properties of dental restorative materials [3,40]. In this study, the Ra values remained minimal and below the clinical threshold after HPS application. This result indicates that HPS can preserve surface integrity due to its controlled radical release and thermogelation properties. In particular, the Poloxamer 407 it contains enhances the thermogelation capacity of the gel, improving stability during application and protecting the material surface from the excessive effects of radicals. From a clinical perspective, this is important for ensuring the color stability of restorations and their resistance to plaque accumulation. Furthermore, HPS’s unique application method and carrier agent content suggest that it may be a safer, more material-friendly alternative to conventional systems [18,19].
In this study, ∆E00 was evaluated according to the clinical perceptibility (PT = 0.8) and acceptability (AT = 1.8) thresholds [47]. A previous study reported that mouthwashes did not exceed the AT value in dental materials [48], and these results are consistent with those of the present study. The AT threshold was exceeded in the short and medium term for the following combinations: AS, ACV, CXA, CX, and HRA for FU; ACV and CXA for FU, FUS, and FUM; and CXA for VE.
Consistent with a previous study [45], color change was found above the AT value for all materials in contact with CXA at T0–T2. The color change caused by CXA may have been due to the binding of parachloroaniline, one of the degradation products of chlorhexidine, to the material surface, and the alcohol content facilitating pigment penetration by increasing polymer matrix solubility.
Turker et al. [28] evaluated VE, CS, and RC materials in both alcoholic and alcohol-free solutions. Similar to this study, the researchers reported significant time-dependent color changes and stated that high resin content, in particular, increases the susceptibility to color change. Currently available universal RCs provide optical compatibility with surrounding dental tissues by optimizing light scattering and transmission thanks to their nanofillers (3,4), and can be used in both anterior and posterior regions. The significant color change observed in the nanohybrid RC tested in our study is consistent with previous studies [2,49], which found that TEGDMA content is associated with increased water sorption and susceptibility to discoloration.
Although CS has a high content of inorganic filler, the matrix phase is sensitive to acids, alcohols, and oxidizing agents. This can result in dissolution-induced micropits. VE, on the other hand, is obtained by infiltrating the feldspathic ceramic phase with a low-viscosity polymer. This makes it more resistant than CS, as it has a strong ceramic network and a low polymer content. However, partial dissolution of the polymer phase may cause microporosity in the ceramic matrix. This effect is less pronounced than in materials with a high polymer content, such as FU [50].
The greater color change in CS compared to VS may be due to incompatibility between the polymer matrix and the refractive index. This is caused by the nanoceramic filler structure of CS, consisting of silica and barium particles, which results in greater light scattering. In FU, the presence of zirconia/silica particles (0.6–1.4 µm) and hydrophilic monomers such as Bis-GMA/TEGDMA within the matrix may cause higher ∆E00 values by increasing water absorption. Increasing the TEGDMA ratio from 0% to 1% in Bis-GMA-based RCs has been reported to increase water absorption from 3% to 6%. Water absorption is relatively lower in UDMA-based RC materials [51]. For these reasons, materials containing high levels of hydrophilic monomers, large fillers, and exhibiting poor refractive index compatibility can be expected to exhibit color changes that exceed the clinically acceptable limit in solutions with a low pH or containing alcohol.
The artificial or natural colorants contained in mouthwashes may cause color changes to dental restorations. Synthetic colorants, such as Patent Blue V and Tartrazine, which are found in CXA and CX, may have been adsorbed onto the surface of the material and caused the color change. The conversion of chlorophyll from green tea in HRA to pheophytin under acidic or oxidative conditions may also contribute to color change. Similarly, natural pigments from herbal ingredients such as mint, clove, sage, thyme, and tea tree in HR may cause color changes to restorative materials. Furthermore, the effect of natural pigments from apples in ACV should not be ignored [45]. Although no colorant was present in the AS group, the AT value was exceeded in the FU–T0–T2 combination. This may be related to prolonged water sorption and the plasticization of the polymer matrix, as reported in a previous study [48].
Savic-Stankovic et al. [3] reported that bleaching in RCs reduced the roughness to a level that could be eliminated through polishing, resulting in color changes that were clinically perceptible. Similar results were obtained in our study, with specimens immersed in CXA and ACV experiencing greater effects from bleaching than the others. This may be due to degradation of the resin matrix phase resulting from contact with acidic, alcoholic, or pigmented solutions before bleaching. Furthermore, the significant color whitening after bleaching in darker specimens compared to initial conditions may be explained by the oxidative elimination of pigments. However, it should be noted that this effect may vary depending on the material structure [52].
In this study, ∆WIDs were evaluated according to clinical perceptibility (WPT) and clinical acceptability (WAT) thresholds of 0.72 and 2.60, respectively [47]. ∆WID results were consistent with ∆E00 results. The WAT threshold was not exceeded in any combination. However, at T0–T2, the WPT threshold was exceeded in the AS, ACV, CXA, CS, and HRA groups for FU; in the ACV, CXA, and CX groups for FUS; in the AS, ACV, CXA, and CX groups for FUM; in all solution groups for CS; and in the ACV, CXA, and CX groups for VE.
In a study examining the effects of home bleaching, Erturk-Avunduk et al. [52] reported ∆WID values exceeding the WAT threshold, which is different from the results of this study. This suggests that home bleaching may be more effective than office bleaching at removing extrinsic stains. Geus et al. [53] noted that the effectiveness of bleaching depends on application time and product content. The controlled-release technology of HPS may have prevented the WAT threshold from being exceeded in our study.
In recent years, reinforcement using fiber strips has been widely developed to improve the mechanical performance of RCs. Polyethylene (PF)- or glass fiber (GF)-based strips absorb local stresses by regulating force distribution within the resin matrix and increasing fracture resistance [21,22]. The GF strip used in this study exhibited variations in roughness, color, and whiteness depending on its placement location. The pre-impregnated structure of ES provides better bonding, a lower void ratio, and limited water absorption compared to polyethylene fibers (PF) [54]. In contrast, resin penetration is insufficient in non-pre-impregnated fibers. Due to microvoids and high water absorption, color changes, decreased whiteness, and deterioration of surface integrity may be observed over time [53]. Furthermore, in PFs where the difference in refractive index between the fiber and matrix is significant, poor optical conformity may cause the fiber regions to appear matte [55].
In this study, the increase in roughness observed in the FUS group may be related to the positioning of the fiber strip on the surface, which was directly exposed to chemical and mechanical effects despite the pre-impregnated GF structure [54]. In contrast, since the fiber strip in the FUM group was embedded within the RC mass, an increase in Ra cannot be attributed to the fibers protruding to the surface.
When the cooler and whiteness values of FU, FUM, and FUS were examined at T0–T1 and T0–T2, the order of magnitude was FU > FUM > FUS. The close refractive indices of the fiber and matrix may affect light direction and scattering, resulting in optical masking. This factor may explain the lower color change observed in the groups with fiber strips compared to those without. This optical effect is reported to be an important factor in translucency and appearance integrity in fiber-reinforced RC systems [56,57].
In one study [58], it was reported that the color of fiber-reinforced RCs gradually changed with time due to microcracks resulting from water absorption. It has been stated that PFs have a higher color change potential than GFs and that the superiority of GFs is due to their hydrophobic inorganic structures. Furthermore, a six-year clinical follow-up revealed that long-term clinical performance may be affected by the quality of the fiber-matrix bond and fiber geometry [50].
The results of the SEM analysis indicated that, similar to a previous study [49], debonding, micropitting, and nanocracks were observed at the matrix-particle interface due to particle rupture in FU immersed in ACV. Similar surface deformations were observed in FUM stored in CXA. Additionally, granular roughness and protruding fiber tips were observed in FUS stored in ACV. These morphological changes support the idea that the fiber strip changes the way light is scattered, resulting in a loss of translucency and changes in optical parameters.
In the CS group, particle shrinkage and granular surface irregularities were observed in samples that were exposed to ACV. In the VE group, although limited, slight roughening of the matrix phase and wear of filler particle edges were observed. These findings suggest that matrix loss in an acidic environment may disrupt surface integrity by exposing particle edges [56,57].
Previous SEM studies have reported that peroxide penetration causes separation at the matrix-particle interface, thereby creating significant heterogeneity in surface topography. It has also been suggested that high-concentration HP applications may cause changes at the microscopic level, although they do not increase macroscopic roughness [19,59]. Moreover, it has been reported that acid causes greater wear to the matrix by attacking the fibers [60]. One study [61] reported that numerous filamentous glass fibers, longer than 50 µm and with a diameter of 20 µm, were exposed and that the fiber distribution was not homogeneous. This study found that the statistically significantly higher Ra values in the fiber strip-reinforced groups compared to those without fibers support this mechanism.
The same study [61] also reported that structural deterioration and discoloration in RCs reinforced with fiber strip usually occur within 3–6 years, making long-term studies necessary to assess the clinical success of restorative materials. The SEM findings obtained in this study demonstrate that long-term degradation mechanisms may be simulated in vitro in a short time and provide results consistent with clinical observations.
This study has some limitations. Although the study was conducted under in vitro conditions, which enabled the variables to be controlled, it did not simulate the multiple factors encountered in a clinical setting, such as thermal changes, mechanical masticatory forces, salivary flow, and biological interactions. Furthermore, the evaluation was limited to specific material groups and solution types; different manufacturer formulations, alternative solutions, and long-term environmental factors may affect these results differently. Therefore, further studies that include in vivo conditions would contribute to a more comprehensive understanding of the effects on the color stability, surface roughness, and structural integrity of restorative materials.
5. Conclusions
The results obtained within the limitations of this study are as follows:
Surface roughness: Initial Ra values for all materials were below the bacterial retention threshold of 0.2 µm. Values increased over time, with the greatest increases in ACV and CXA and the lowest in AS and HR solutions.
Color change: The highest ∆E00 values were observed in FU and FUM with ACV and CXA, whereas VE showed the lowest values. In most combinations, values remained below the acceptability threshold.
Whiteness index change: A similar pattern was observed. The highest values were found in FU, FUM, and CS, with ACV and CXA, while VE showed the lowest values. All combinations remained below the acceptability threshold.
Fiber strip: The location of the ES strip within the resin composite did not affect surface roughness but influenced color and whiteness changes. Short- and medium-term changes were greater in the FUM group compared with the FUS group.
Bleaching: The increase in Ra after HPS application was minimal and remained below the clinical perceptibility threshold. Changes in color and whiteness index also did not exceed the acceptability thresholds.
Author Contributions
Conceptualization, K.Y.; methodology, K.Y.; software, K.Y. and T.O.H.; validation.; T.O.H. and M.M.Ö.; formal analysis, K.Y. and G.Ö.A..; investigation, K.Y., T.O.H. and G.Ö.A.; resources, K.Y., T.O.H, G.Ö.A. and M.M.Ö.; data curation, K.Y., T.O.H, G.Ö.A. and M.M.Ö.; writing—original draft preparation, K.Y., T.O.H., G.Ö.A. and M.M.Ö.; writing—review and editing, K.Y. and T.O.H.; visualization.; G.Ö.A. and M.M.Ö; supervision, G.Ö.H. and M.M.Ö.; project administration, K.Y. and T.O.H.; funding acquisition, K.Y., T.O.H., G.Ö.A. and M.M.Ö. All authors have read and agreed to the published version of the manuscript.
Funding
This research received no external funding.
Institutional Review Board Statement
Not applicable.
Data Availability Statement
The original contributions presented in this study are included in the article. Further inquiries can be directed to the corresponding authors.
Acknowledgments
The author thanks the Institute of Nuclear Sciences, Ankara University, for their valuable contributions to the SEM analysis, and pharmacist Gülşah Akbülbül Yılmaz for her support.
Conflicts of Interest
The authors declare no conflicts of interest.
Abbreviations
The following abbreviations are used in this manuscript:
| RC | Resin composite |
| Bis-GMA | Bisphenol A glycidyl methacrylate |
| TEGDMA | Triethylene glycol dimethacrylate |
| UDMA | Urethane dimethacrylate |
| Bis-EMA | Bisphenol A ethoxylate dimethacrylate |
| CAD/CAM | Computer-aided design / computer-aided manufacturing |
| RNC | Resin nanoceramic |
| PICN | Polymer-infiltrated ceramic network |
| PMMA | Polymethyl methacrylate |
| ACV | Apple cider vinegar |
| CP | Carbamide peroxide |
| HP | Hydrogen peroxide |
| HPS | Hydrogen peroxide superior |
| ∆E00 | Color change |
| ∆WID | Whiteness index change |
| CS | Cerasmart 270 |
| VE | Vita Enamic |
| FU | Filtek Universal |
| FUM | Filtek Universal with mid-layer fiber strip |
| FUS | Filtek Universal with superficial fiber strip |
| GF | Glass fiber |
| ES | everStick NET |
| AS | Artificial saliva |
| CXA | Chlorhexidine- and alcohol-containing mouthwash |
| CX | Chlorhexidine- and alcohol-free mouthwash |
| HRA | Herbal and alcohol-containing mouthwash |
| HR | Herbal and alcohol-free mouthwash |
| SEM | Scanning electron microscopy |
| T | Time point |
| WID | Whiteness change index |
| Ra | Average surface roughness |
| ANOVA | Analysis of Variance |
| PT | Perceptibility threshold for color change |
| AT | Acceptability threshold for color change |
| WPT | Perceptibility threshold for whiteness index change |
| WAT | Acceptability threshold for whiteness index change |
| PF | Polyethylene fiber |
References
- Aydınoǧlu, A.; Erdem Hepşenoǧlu, Y.; Yalçın, C.Ö.; Saǧır, K.; Ölçer Us, Y.; Eroǧlu, Ş.E.; Hazar Yoruç, A.B. Assessing Toxicological Safety of EverX Posterior and Filtek Ultimate: An In-Depth Extractable and Leachable Study Under ISO 10993-17 and 10993-18 Standards. ACS Omega 2025, 10, 9903–9918. [Google Scholar] [CrossRef] [PubMed]
- Pratap, B.; Gupta, R.K.; Bhardwaj, B.; Nag, M. Resin based restorative dental materials: characteristics and future perspectives. Jpn. Dent. Sci. Rev. 2019, 55, 126–138. [Google Scholar] [CrossRef] [PubMed]
- Savic-Stankovic, T. , Karadzic, B.; Komlenic, V.; Stasic, J.; Petrovic, V.; Ilic, J.; Miletic, V. Effects of whitening gels on color and surface properties of a microhybrid and nanohybrid composite. Dent. Mater. J. 2021, 40, 1380–1387. [Google Scholar] [CrossRef]
- Aksoy Vaizoğlu, G.; Ulusoy, N.; Güleç Alagöz, L. Effect of Coffee and Polishing Systems on the Color Change of a Conventional Resin Composite Repaired by Universal Resin Composites: An In Vitro Study. Materials 2023, 16, 6066. [Google Scholar] [CrossRef]
- Zhi, L.; Bortolotto, T.; Krejci, I. Comparative in vitro wear resistance of CAD/CAM composite resin and ceramic materials. J. Prosthet. Dent. 2016, 115, 199–202. [Google Scholar] [CrossRef]
- Xu, Z.; Yu, P.; Arola, D.D.; Min, J.; Gao, S. A comparative study on the wear behavior of a polymer infiltrated ceramic network (PICN) material and tooth enamel. Dent Mater. 2017, 33, 1351–1361. [Google Scholar] [CrossRef] [PubMed]
- Bansal, S.; Gupta, S.; Gupta, S.; Bogra, P.; Bansal, R.; Grover, V.; Gupta, S. Comparative Evaluation of Color Stability and Surface Roughness of Bulk-Fill and Nanohybrid Composites Following Long-Term Mouthrinse Exposure: An In Vitro Study. Cureus 2025, 17, e84320. [Google Scholar] [CrossRef]
- ElEmbaby, A. El-S. The effects of mouth rinses on the color stability of resin-based restorative materials. J. Esthet. Restor. Dent. 2014, 26, 264–271. [Google Scholar] [CrossRef]
- Asaad, N.; Laflouf, M. Effectiveness of Apple Cider Vinegar and Mechanical Removal on Dental Plaque and Gingival Inflammation of Children With Cerebral Palsy. Cureus 2022, 14, e26874. [Google Scholar] [CrossRef]
- Yagnik, D.; Serafin, V.; J Shah, A. Antimicrobial activity of apple cider vinegar against Escherichia coli, Staphylococcus aureus and Candida albicans; downregulating cytokine and microbial protein expression. Sci. Rep. 2018, 8, 1732. [Google Scholar] [CrossRef]
- Liu, Y.; Hannig, M. Vinegar inhibits the formation of oral biofilm in situ. BMC Oral Health 2020, 20, 167. [Google Scholar] [CrossRef] [PubMed]
- Giti, R.; Jebal, R. How could mouthwashes affect the color stability and translucency of various types of monolithic zirconia? An in-vitro study. PloS One 2023, 18, e0295420. [Google Scholar] [CrossRef]
- Ayatollahi, S.; Davoudi, A.; Momtazi, H. In vitro comparative effects of alcohol-containing and alcohol-free mouthwashes on surface roughness of bulk-fill composite resins. BMC Res. Notes 2025, 18, 146. [Google Scholar] [CrossRef] [PubMed]
- Brookes, Z.L.S.; Bescos, R.; Belfield, L.A.; Ali, K.; Roberts, A. Current uses of chlorhexidine for management of oral disease: a narrative review. J. Dent. 2020, 103, 103497. [Google Scholar] [CrossRef] [PubMed]
- Yılmaz, K.; Özdemir, E.; Gönüldaş, F. Effect of immune-boosting beverage, energy beverage, hydrogen peroxide superior, polishing methods and fine-grained dental prophylaxis paste on color of CAD-CAM restorative materials. BMC Oral Health 2024, 24, 1104. [Google Scholar] [CrossRef]
- Rekha Mallick, R.; Sarangi, P.; Suman, S.; Sekhar Sahoo, S.; Bajoria, A.; Sharma, G. An In Vitro Analysis of the Effects of Mouthwashes on the Surface Properties of Composite Resin Restorative Material. Cureus 2024, 16, e65021. [Google Scholar] [CrossRef]
- Martinez-Ccahuana, L.; Álvarez-Vidigal, E.; Arriola-Guillén, E.; Aguilar-Gálvez, D. Effect of pediatric mouthwashes on the color stability of dental restorations with composite resins. In vitro comparative study. J. Clin. Exp. Dent. 2022, 14, e897–e902. [Google Scholar] [CrossRef]
- Cavex Bite&White In-Office System. Available online: https://www.cavex.nl/producten/whitening-and-oral-care-en/whitening-en/cavex-bitewhite-in-office-systeem/?lang=en (accessed on 25 August 2025).
- Yılmaz, K.; Özdemir, E.; Gönüldaş, F. Effects of immersion in various beverages, polishing and bleaching systems on surface roughness and microhardness of CAD/CAM restorative materials. BMC Oral Health 2024, 24, 1458. [Google Scholar] [CrossRef]
- Sasany, R.; Jamjoon, F. Z.; Kendirci, M. Y.; Yilmaz, B. Effect of Printing Layer Thickness on Optical Properties and Surface Roughness of 3D-Printed Resins: An In Vitro Study. Int. J. Prosthodont. 2024, 37, 165–173. [Google Scholar] [CrossRef]
- Mohammadipour, H.S.; Farajzadeh, M.; Toutouni, H.; Gazerani, A.; Sekandari, S. Fracture Resistance of Fiber-Reinforced vs. Conventional Resin Composite Restorations in Structurally Compromised Molars: An In Vitro Study. Int. J. Dent. 2025, 5169253. [Google Scholar] [CrossRef]
- Escobar, L.B.; Pereira da Silva, L.; Manarte-Monteiro, P. Fracture Resistance of Fiber-Reinforced Composite Restorations: A Systematic Review and Meta-Analysis. Polymers 2023, 15, 3802. [Google Scholar] [CrossRef]
- Ferrando Cascales, Á.; Andreu Murillo, A.; Ferrando Cascales, R.; Agustín-Panadero, R.; Sauro, S.; Carreras-Presas, C.M.; Hirata, R.; Lijnev, A. Revolutionizing Restorative Dentistry: The Role of Polyethylene Fiber in Biomimetic Dentin Reinforcement-Insights from In Vitro Research. J. Funct. Biomater. 2025, 16, 38. [Google Scholar] [CrossRef] [PubMed]
- Ozakar Ilday, N.; Celik, N.; Bayindir, Y.Z.; Seven, N. Effect of water storage on the translucency of silorane-based and dimethacrylate-based composite resins with fibres. J. Dent. 2014, 42, 746–752. [Google Scholar] [CrossRef]
- Pérez, M. del M.; Saleh, A.; Yebra, A.; Pulgar, R. Study of the variation between CIELAB delta E* and CIEDE2000 color-differences of resin composites. Dent. Mater. J. 2007, 26, 21–28. [Google Scholar] [CrossRef]
- Pérez, M. del M.; Ghinea, R.; Rivas, M.J.; Yebra, A.; Ionescu, A.M.; Paravina, R.D.; Herrera, L. J. Development of a customized whiteness index for dentistry based on CIELAB color space. Dent. Mater. 2016, 32, 461–467. [Google Scholar] [CrossRef]
- Alessa, N.A. Effect of mouthwashes on the microhardness of aesthetic composite restorative materials. An. Sist. Sanit. Navar. 2023, 46, e1049. [Google Scholar] [CrossRef]
- Turker Kader, I.; Yuzbasioglu, E.; Smail, F.S.; Ilhan, C. How do various mouth rinses influence the color stability of CAD-CAM resin-based restorative materials? J. Prosthet. Dent. 2025, 133, 1584.e1–1584.e8. [Google Scholar] [CrossRef]
- Ilie, N. Accelerated versus Slow In Vitro Aging Methods and Their Impact on Universal Chromatic, Urethane-Based Composites. Materials 2023, 16, 2143. [Google Scholar] [CrossRef] [PubMed]
- van Swaaij, B.W.M.; Slot, D.E.; Van der Weijden, G.A.; Timmerman, M.F.; Ruben, J. Fluoride, pH Value, and Titratable Acidity of Commercially Available Mouthwashes. Int. Dent. J. 2024, 74, 260–267. [Google Scholar] [CrossRef] [PubMed]
- Shellis, R.P.; Barbour, M.E.; Jones, S.B.; Addy, M. Effects of pH and acid concentration on erosive dissolution of enamel, dentine, and compressed hydroxyapatite. Eur. J. Oral Sci. 2010, 118, 475–482. [Google Scholar] [CrossRef]
- Luo, X.P.; Zhang, L. Effect of veneering techniques on color and translucency of Y-TZP. J. Prosthodont. 2010, 19, 465–470. [Google Scholar] [CrossRef]
- Peña, R.C.; Ramos, A.C.; Dos Santos Nunes Reis, J.M.; Dovigo, L.N.; Salomon, J.G.O.; Del Mar Pérez, M.; Fonseca, R.G. Effect of polishing and bleaching on color, whiteness, and translucency of CAD/CAM monolithic materials. J. Esthet. Restor. Dent. 2025, 37, 440–455. [Google Scholar] [CrossRef]
- Papathanasiou, I.; Zinelis, S.; Papavasiliou, G.; Kamposiora, P. Effect of aging on color, gloss and surface roughness of CAD/CAM composite materials. J. Dent. 2023, 130, 104423. [Google Scholar] [CrossRef]
- Chadha, V.; Miller, N.C.; Ding, R.; Beschorner, K. E.; Jacobs, T.D.B. Evaluating scanning electron microscopy for the measurement of small-scale topography. Surf. Topogr. Metrol. Prop. 2024, 12, 10.1088–2051. [Google Scholar] [CrossRef]
- Bollen, C.M.; Lambrechts, P.; Quirynen, M. Comparison of surface roughness of oral hard materials to the threshold surface roughness for bacterial plaque retention: a review of the literature. Dent. Mater. 1997, 13, 258–269. [Google Scholar] [CrossRef]
- Jones, C.S.; Billington, R.W.; Pearson, G.J. The in vivo perception of roughness of restorations. Br. Dent. J. 2004, 196, 42–31. [Google Scholar] [CrossRef] [PubMed]
- Heintze, S.D.; Forjanic, M.; Rousson, V. Surface roughness and gloss of dental materials as a function of force and polishing time in vitro. Dent. Mater. 2006, 22, 146–165. [Google Scholar] [CrossRef]
- Pala, K.; Tekçe, N.; Tuncer, S.; Serim, M. E.; Demirci, M. Evaluation of the surface hardness, roughness, gloss and color of composites after different finishing/polishing treatments and thermocycling using a multitechnique approach. Dent. Mater. J. 2016, 35, 278–289. [Google Scholar] [CrossRef]
- Teixeira, É.F.; Girundi, A.L.G.; Alexandrino, L.D.; Morel, L.L.; de Almeida, M.V.R.; Dos Santos, V.R.; Fraga, S.; da Silva, W.J.; Mengatto, C.M. Effects of disinfection with a vinegar-hydrogen peroxide mixture on the surface characteristics of denture acrylic resins. Clin. Oral Investig. 2023, 28, 45. [Google Scholar] [CrossRef] [PubMed]
- Ferracane, J.L. Hygroscopic and hydrolytic effects in dental polymer networks. Dent. Mater. 2006, 22, 211–222. [Google Scholar] [CrossRef] [PubMed]
- Willershausen, I.; Weyer, V.; Schulte, D.; Lampe, F.; Buhre, S.; Willershausen, B. In vitro study on dental erosion caused by different vinegar varieties using an electron microprobe. Clin. Lab. 2014, 60, 783–790. [Google Scholar] [CrossRef] [PubMed]
- Pontefract, H.; Hughes, J.; Kemp, K.; Yates, R.; Newcombe, R.G.; Addy, M. The erosive effects of some mouthrinses on enamel. A study in situ. J. Clin. Periodontol. 2001, 28, 319–324. [Google Scholar] [CrossRef]
- Özer, N.E. , Oğuz, E.İ. The Effect of Erosive Media on Color Stability, Gloss, and Surface Roughness of Monolithic CAD/CAM Materials Subjected to Different Polishing Methods. Sci. Rep. 2015, 15, 23774. [Google Scholar] [CrossRef]
- Hamdy, T.M.; Abdelnabi, A.; Othman, M.S.; Bayoumi, R.E.; Abdelraouf, R.M. Effect of Different Mouthwashes on the Surface Microhardness and Color Stability of Dental Nanohybrid Resin Composite. Polymers 2023, 15, 815. [Google Scholar] [CrossRef]
- Aksoy Vaizoğlu, G. Effect of Bleaching on Surface Roughness of Universal Composite Resins After Chlorhexidine-Induced Staining. Dent. J. 2025, 13, 277. [Google Scholar] [CrossRef]
- Paravina, R.D.; Pérez, M.M.; Ghinea, R. Acceptability and perceptibility thresholds in dentistry: A comprehensive review of clinical and research applications. J. Esthet. Restor. Dent. 2019, 31, 103–112. [Google Scholar] [CrossRef]
- Morais Sampaio, G.A.; Rangel Peixoto, L.; Vasconcelos Neves, G.; Nascimento Barbosa, D.D. Effect of mouthwashes on color stability of composite resins: A systematic review. J. Prosthet. Dent. 2021, 126, 386–392. [Google Scholar] [CrossRef]
- Gömleksiz, S.; Okumuş, Ö.F. The effect of whitening toothpastes on the color stability and surface roughness of stained resin composite. BMC Oral Health 2024, 24, 860. [Google Scholar] [CrossRef]
- Hazar, A.; Hazar, E. Effects of different antiviral mouthwashes on the surface roughness, hardness, and color stability of composite CAD/CAM materials. J. Appl. Biomater. Funct. Mater. 2024, 22, 22808000241248886. [Google Scholar] [CrossRef] [PubMed]
- Festuccia, M.S.; Garcia, L. da F.; Cruvinel, D.R.; Pires-De-Souza, F. de C. Color stability, surface roughness and microhardness of composites submitted to mouthrinsing action. J. Appl. Oral Sci. 2012, 20, 200–205. [Google Scholar] [CrossRef] [PubMed]
- Erturk-Avunduk, A.T.; Delikan, E.; Cengiz-Yanardag, E.; Karakaya, I. Effect of whitening concepts on surface roughness and optical characteristics of resin-based composites: An AFM study. Microsc. Res. Tech. 2024, 87, 214–228. [Google Scholar] [CrossRef]
- Mosharraf, R.; Torkan, S. Fracture Resistance of Composite Fixed Partial Dentures Reinforced with Pre-impregnated and Non-impregnated Fibers. J. Dent. Res. Dent. Clin. Dent. Prospect. 2012, 6, 12–16. [Google Scholar] [CrossRef]
- Tuncdemir, A.R.; Güven, M.E. Effects of Fibers on Color and Translucency Changes of Bulk-Fill and Anterior Composites after Accelerated Aging. Biomed. Res. Int. 2018, 2908696. [Google Scholar] [CrossRef]
- Caydamli, Y.; Heudorfer, K.; Take, J.; Podjaski, F.; Middendorf, P.; Buchmeiser, M. R. Transparent Fiber-Reinforced Composites Based on a Thermoset Resin Using Liquid Composite Molding (LCM) Techniques. Materials 2021, 14, 6087. [Google Scholar] [CrossRef]
- Koizumi, H.; Saiki, O.; Nogawa, H.; Hiraba, H.; Okazaki, T.; Matsumura, H. Surface roughness and gloss of current CAD/CAM resin composites before and after toothbrush abrasion. Dent. Mater. J. 2015, 34, 881–887. [Google Scholar] [CrossRef]
- Hassan, S.A.; Beleidy, M.; El-Din, Y.A. Biocompatibility and Surface Roughness of Different Sustainable Dental Composite Blocks: Comprehensive In Vitro Study. ACS Omega 2022, 7, 34258–34267. [Google Scholar] [CrossRef] [PubMed]
- Karatas, O.; Ilday, N.O.; Bayindir, F.; Celik, N.; Seven, N. Effect of fiber reinforcement on color stability of composite resins. J. Conserv. Dent. 2020, 23, 299–303. [Google Scholar] [CrossRef] [PubMed]
- Attin, T.; Hannig, C.; Wiegand, A.; Attin, R. Effect of bleaching on restorative materials and restorations--a systematic review. Dent. Mater. 2004, 20, 852–861. [Google Scholar] [CrossRef] [PubMed]
- Meniawi, M.; Şirinsükan, N.; Can, E. Color stability, surface roughness, and surface morphology of universal composites. Odontology Advance online publication. 2025. [Google Scholar] [CrossRef] [PubMed]
- van Dijken, J.W.; Sunnegårdh-Grönberg, K. Fiber-reinforced packable resin composites in Class II cavities. J. Dent. 2006, 34, 763–769. [Google Scholar] [CrossRef]
Figure 1.
Study design. FU: Filtek Universal; FUS: Filtek Universal with superficial fiber strip; FUM: Filtek Universal with mid-layer fiber strip; CS: Cerasmart 270; VE: Vita Enamic; AS: Artificial saliva; ACV: Apple cider vinegar; CXA: Chlorhexidine- and alcohol-containing mouthwash; CX: Chlorhexidine- and alcohol-free mouthwash: HRA: Herbal and alcohol-containing mouthwash; HR: Herbal and alcohol-free mouthwash; T0: Baseline; T3: After bleaching.
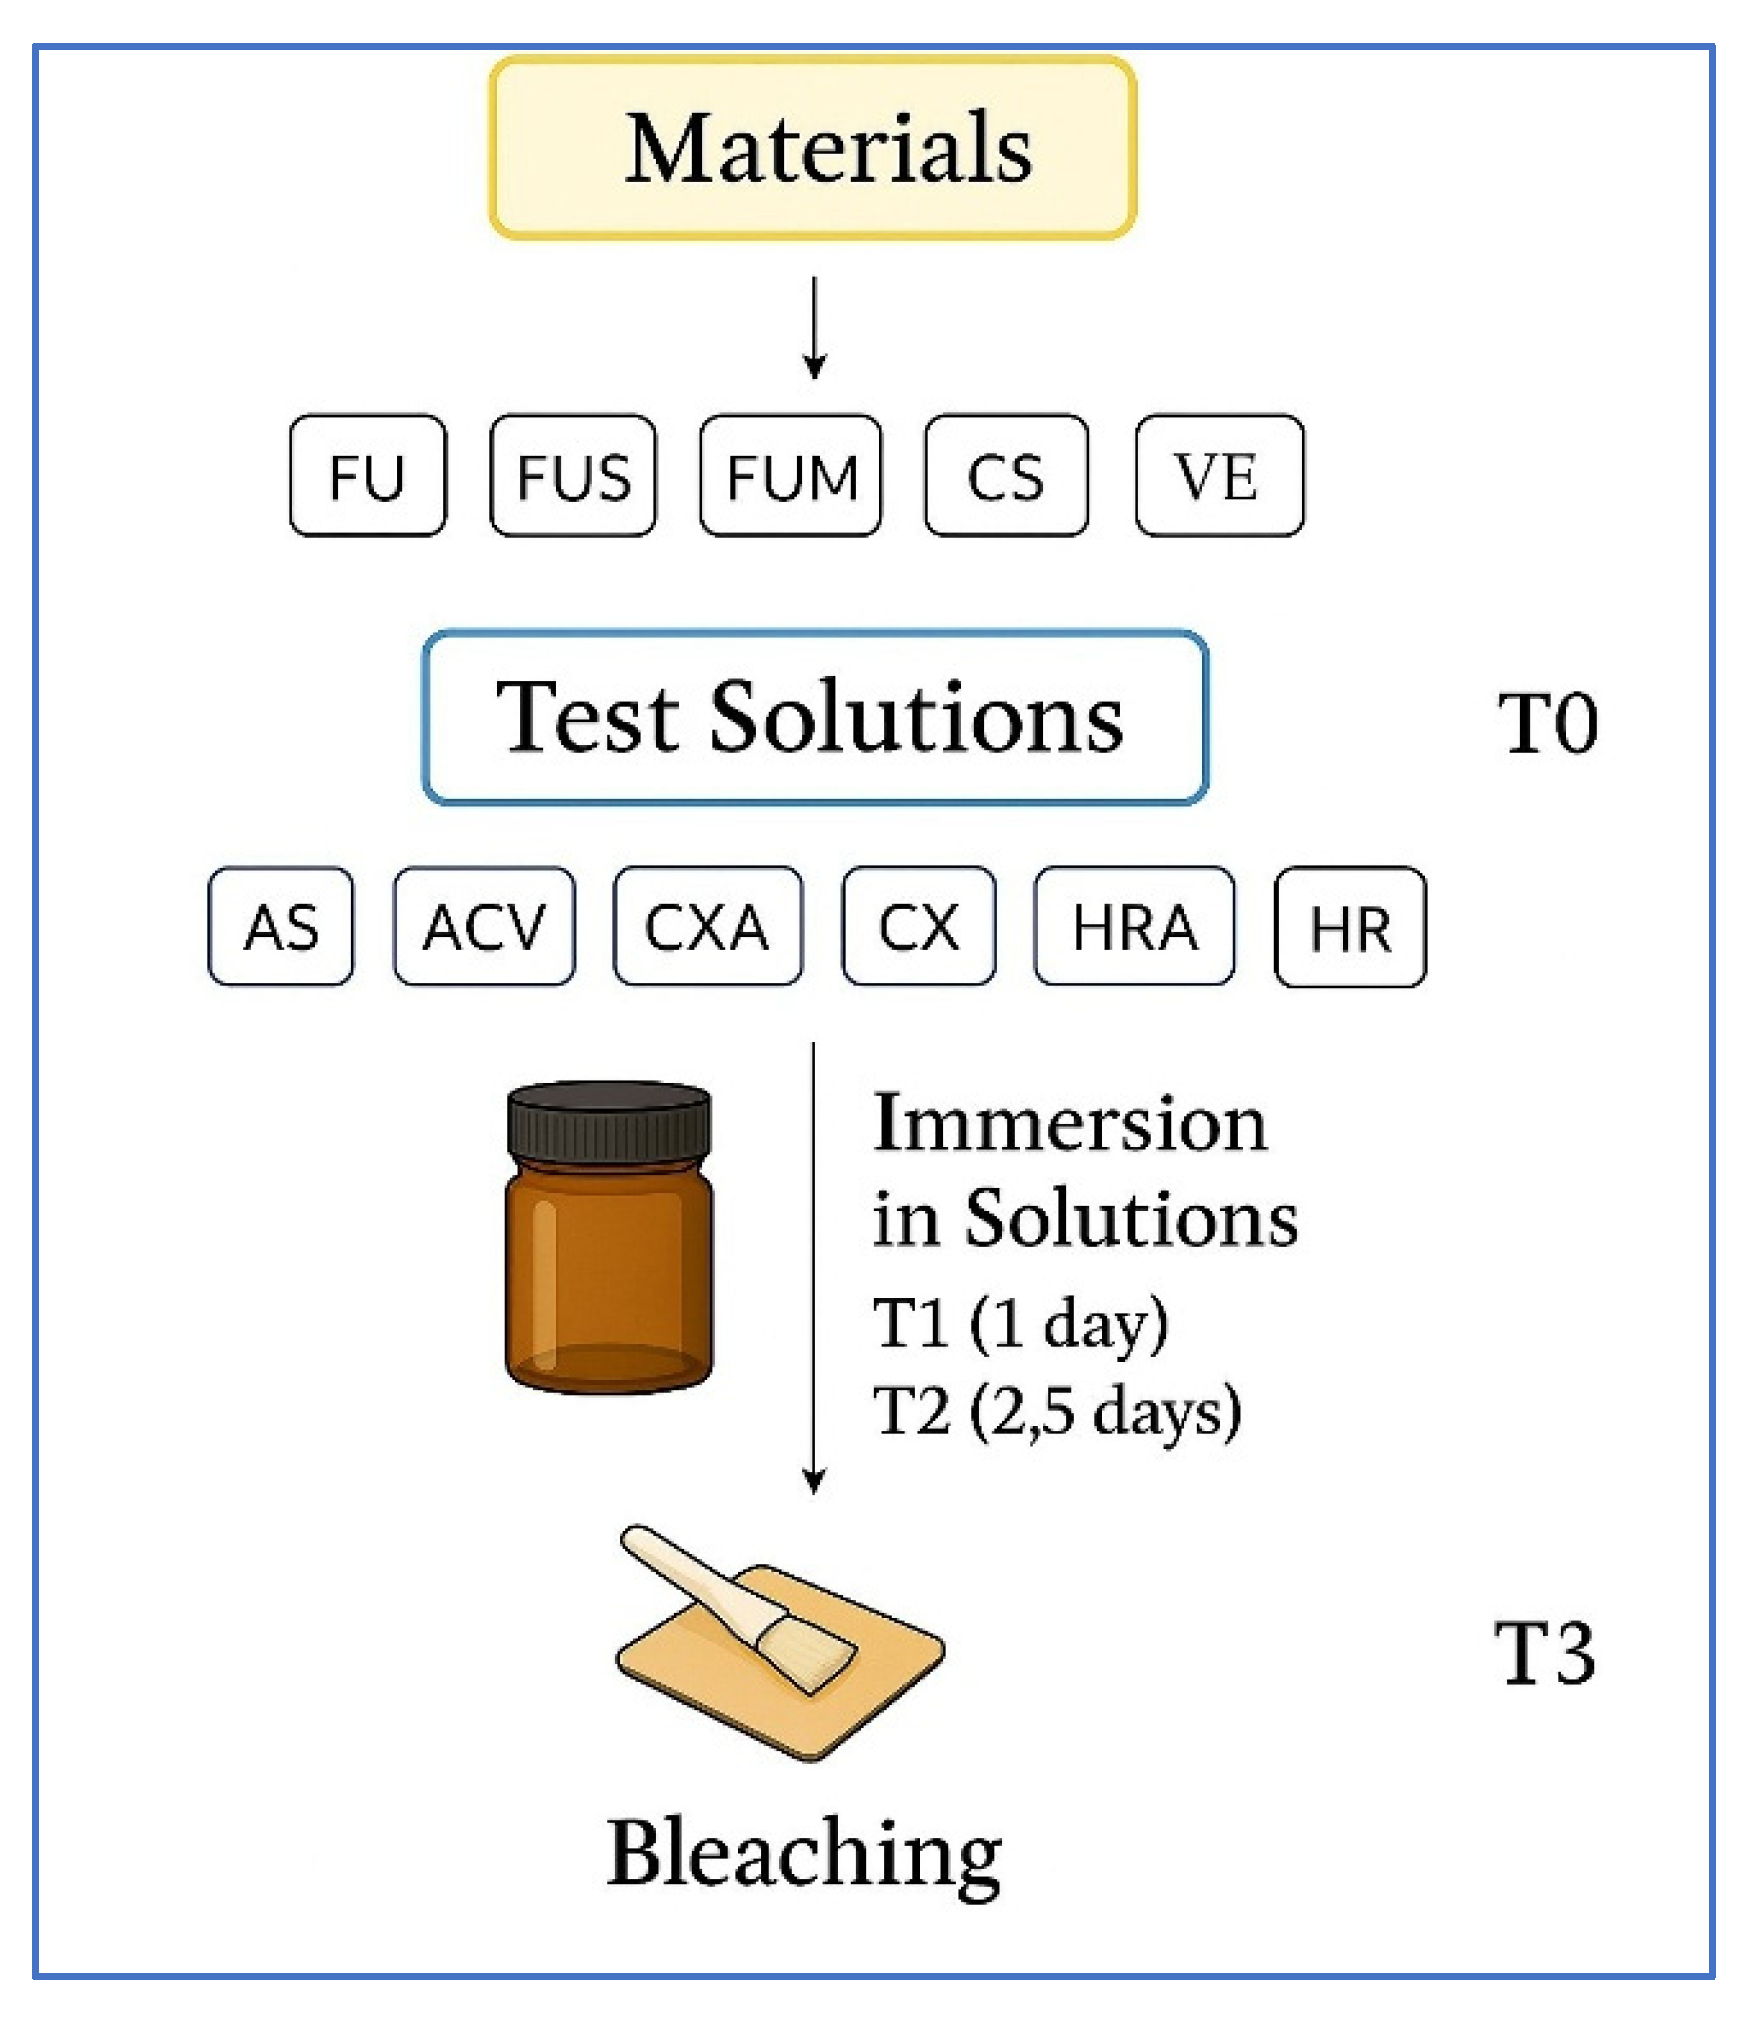
Figure 2.
Schematic illustration of fiber strip positions. FUM: nanohybrid RC with mid-layer fiber strip; FUS: nanohybrid RC with superficial fiber strip.
Figure 2.
Schematic illustration of fiber strip positions. FUM: nanohybrid RC with mid-layer fiber strip; FUS: nanohybrid RC with superficial fiber strip.
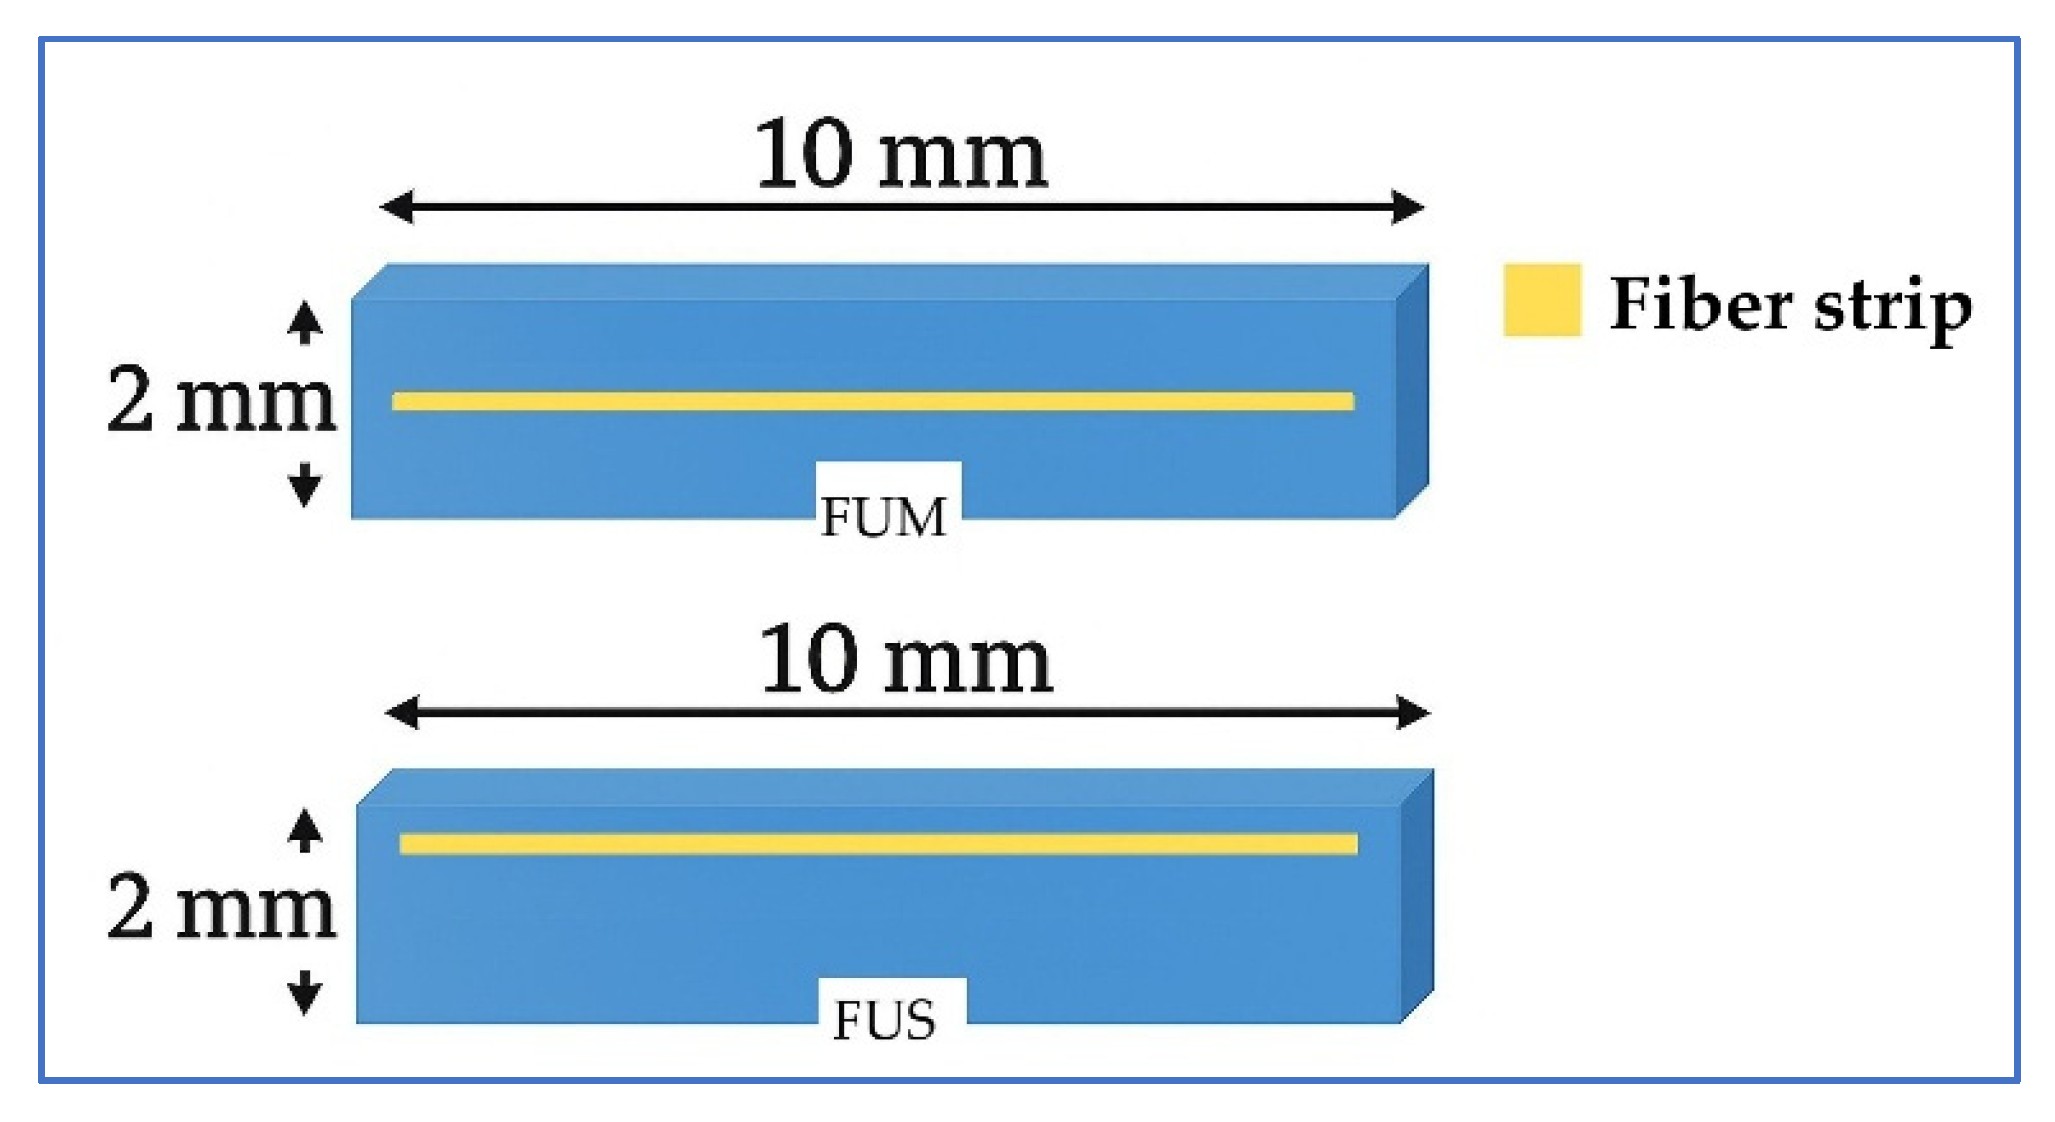
Figure 3.
Specimen preparation stages. (a) Preparation of the fiber strip for a FUS specimen; (b) A prepared FUS specimen; (c) Application of the bleaching agent on a nanohybrid RC specimen; (d) Color measurement of a CS specimen. FUS: Filtek Universal with superficial fiber strip; RC: resin composite; CS: Cerasmart 270.
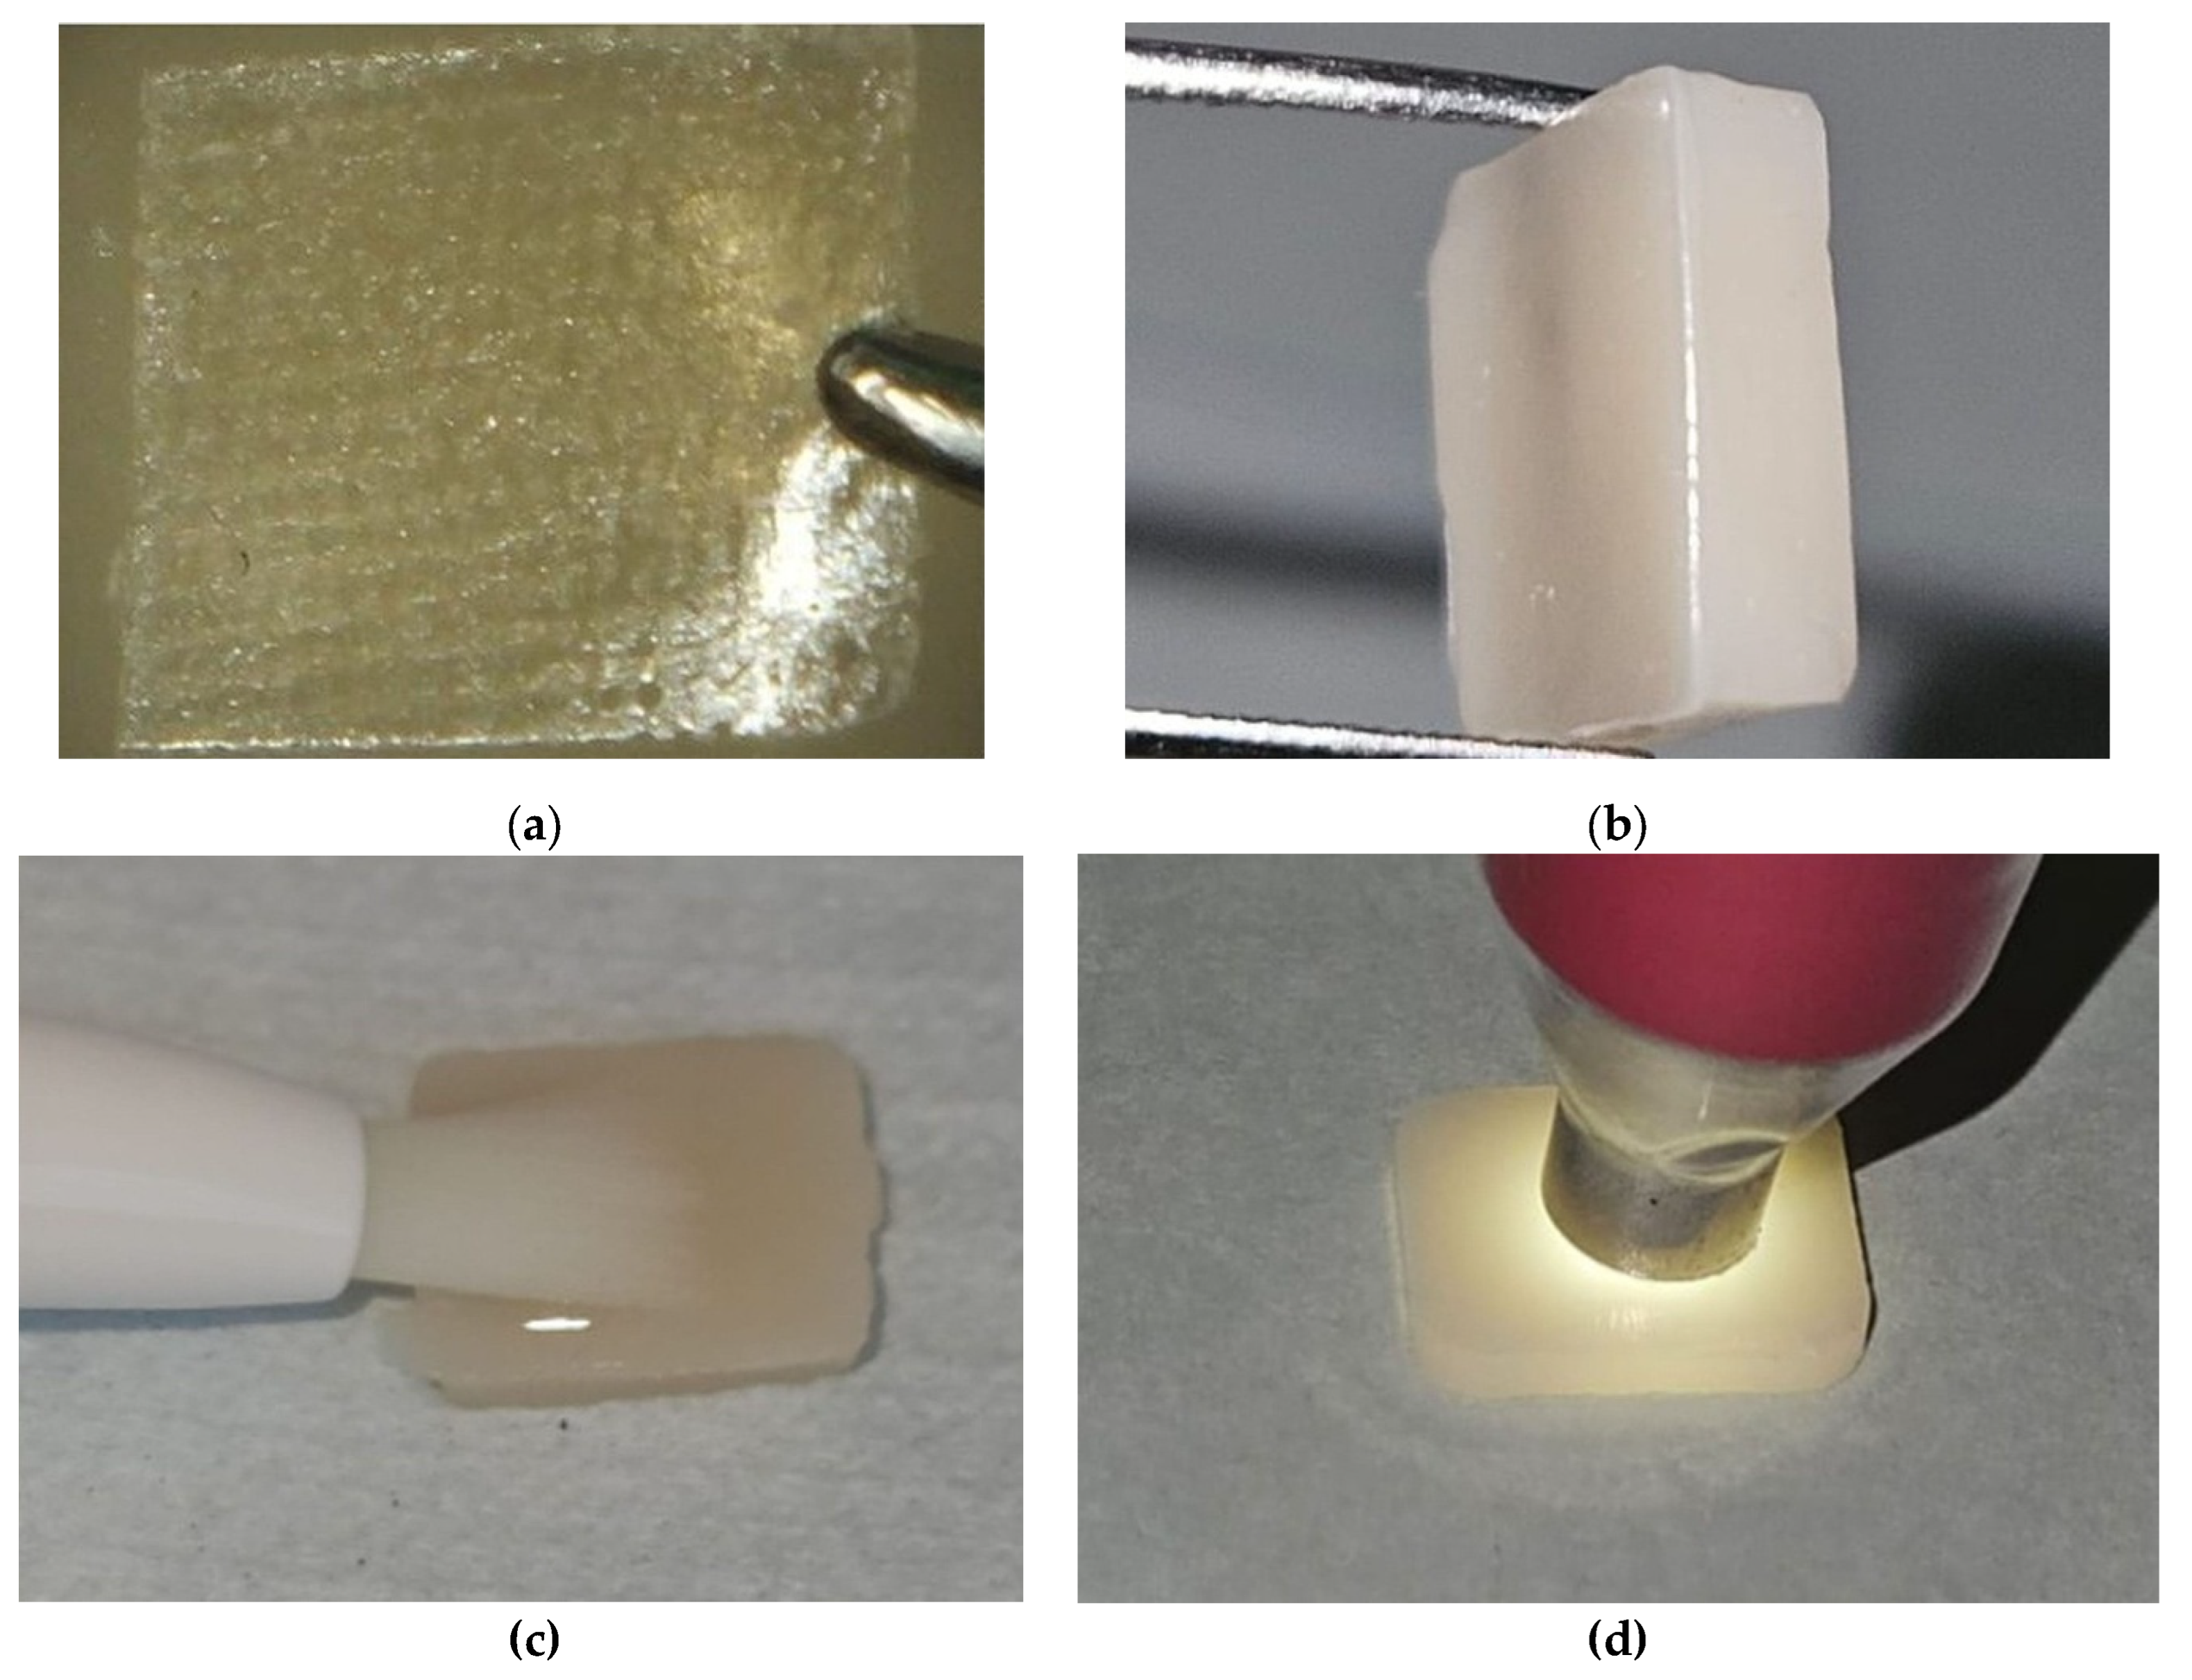
Figure 4.
Material–time and solution–time graphs. (a) Ra (µm) by material–time; (b) Ra by solution–time; (c) ΔE00 by material–time; (d) ΔE00 by solution–time; (e) ΔWID by material–time; (f) ΔWID by solution–time. FU: Filtek Universal; FUS: Filtek Universal with superficial fiber strip; FUM: Filtek Universal with mid-layer fiber strip; CS: Cerasmart 270; VE: Vita Enamic; AS: Artificial saliva; ACV: Apple cider vinegar; CXA: Chlorhexidine- and alcohol-containing mouthwash; CX: Chlorhexidine- and alcohol-free mouthwash: HRA: Herbal and alcohol-containing mouthwash; HR: Herbal and alcohol-free mouthwash; T0: Baseline; T3: After bleaching.
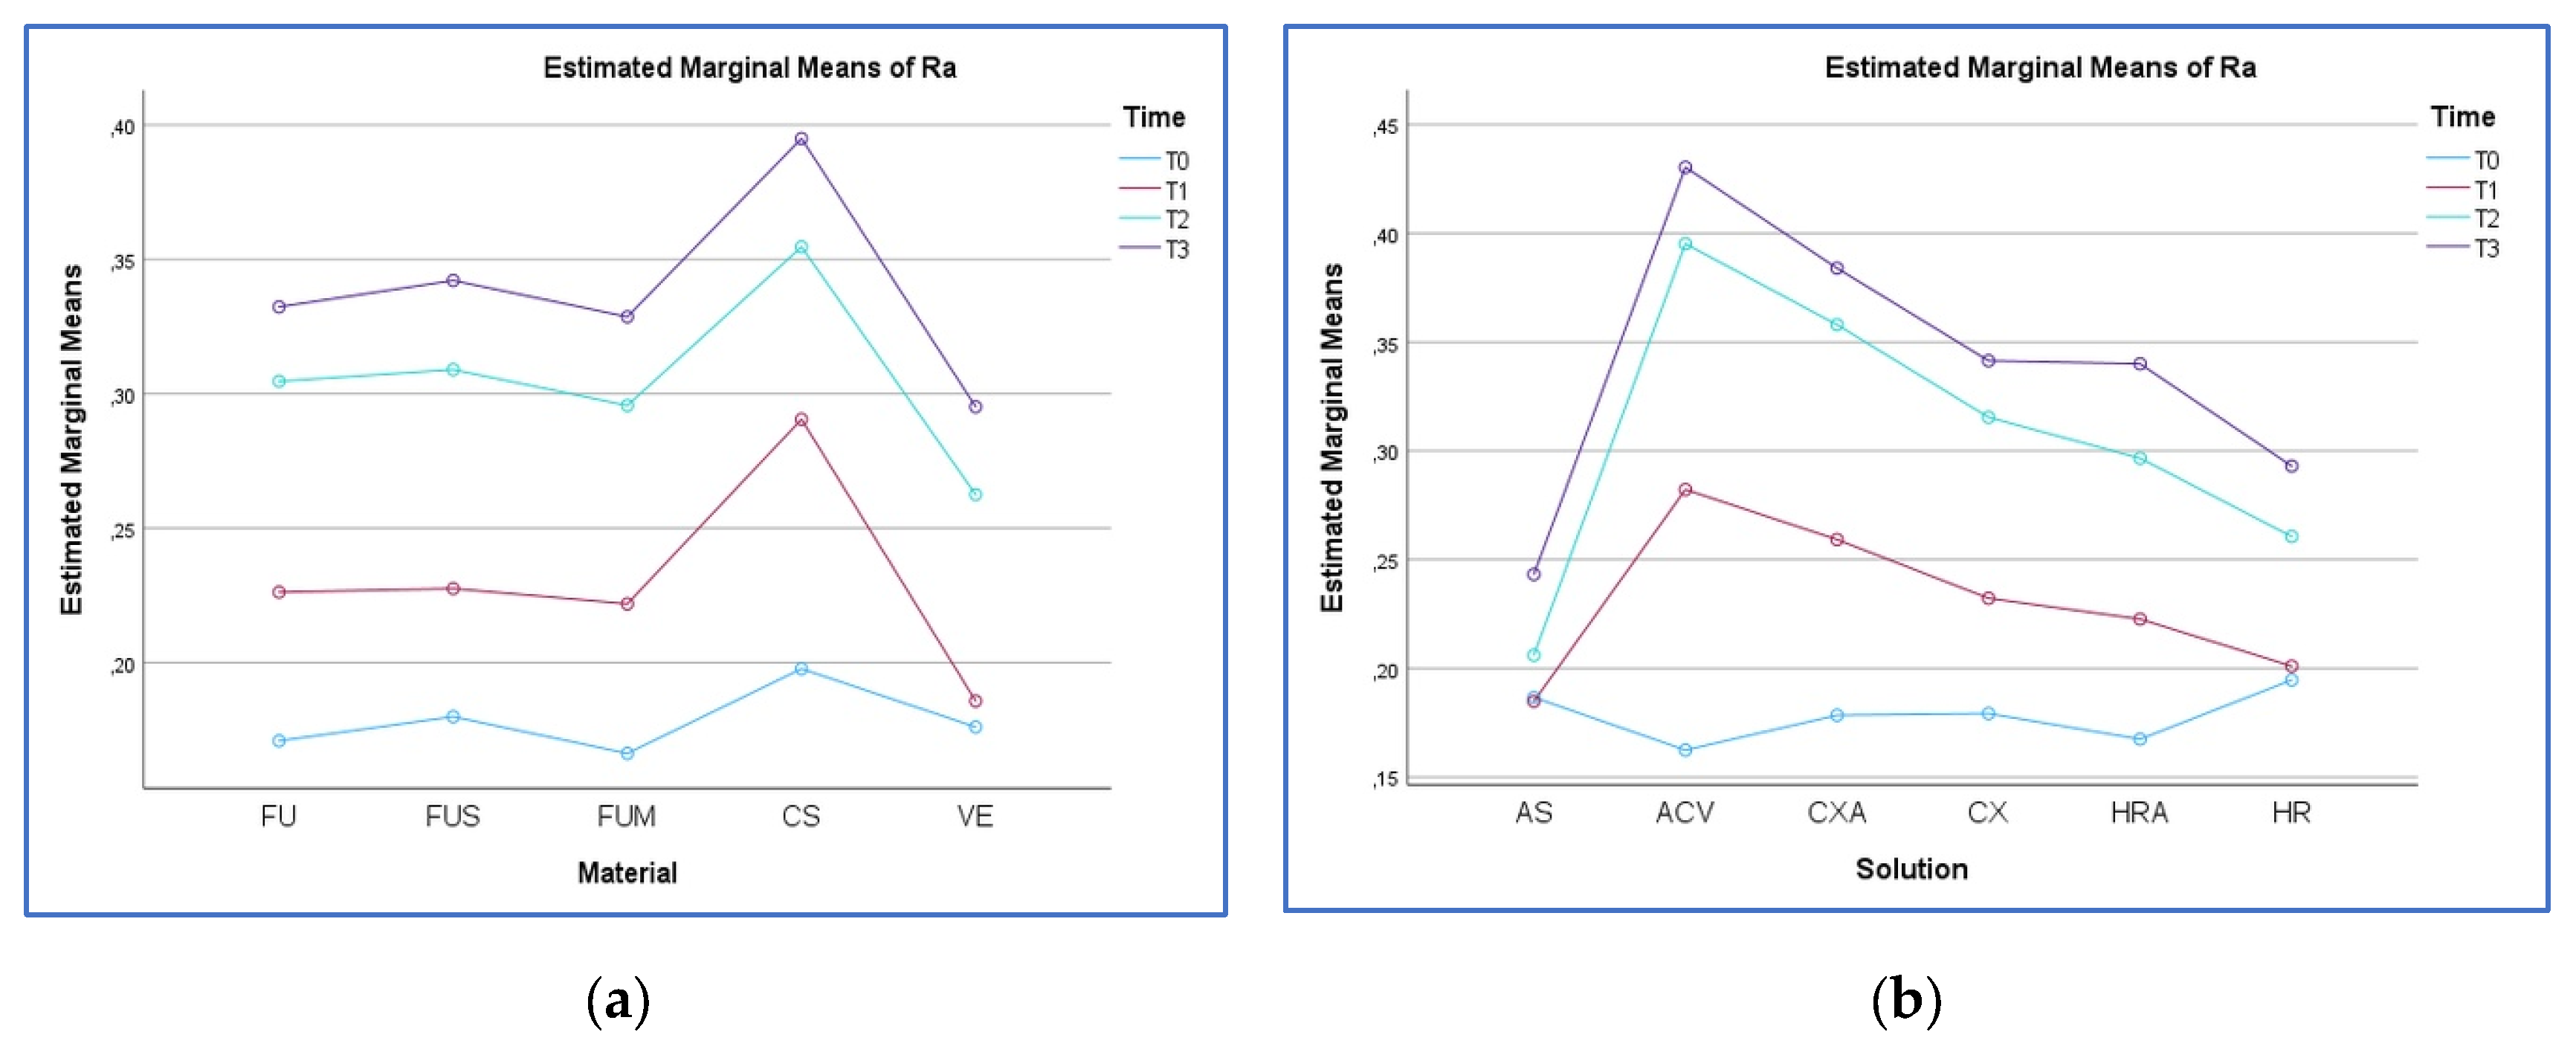
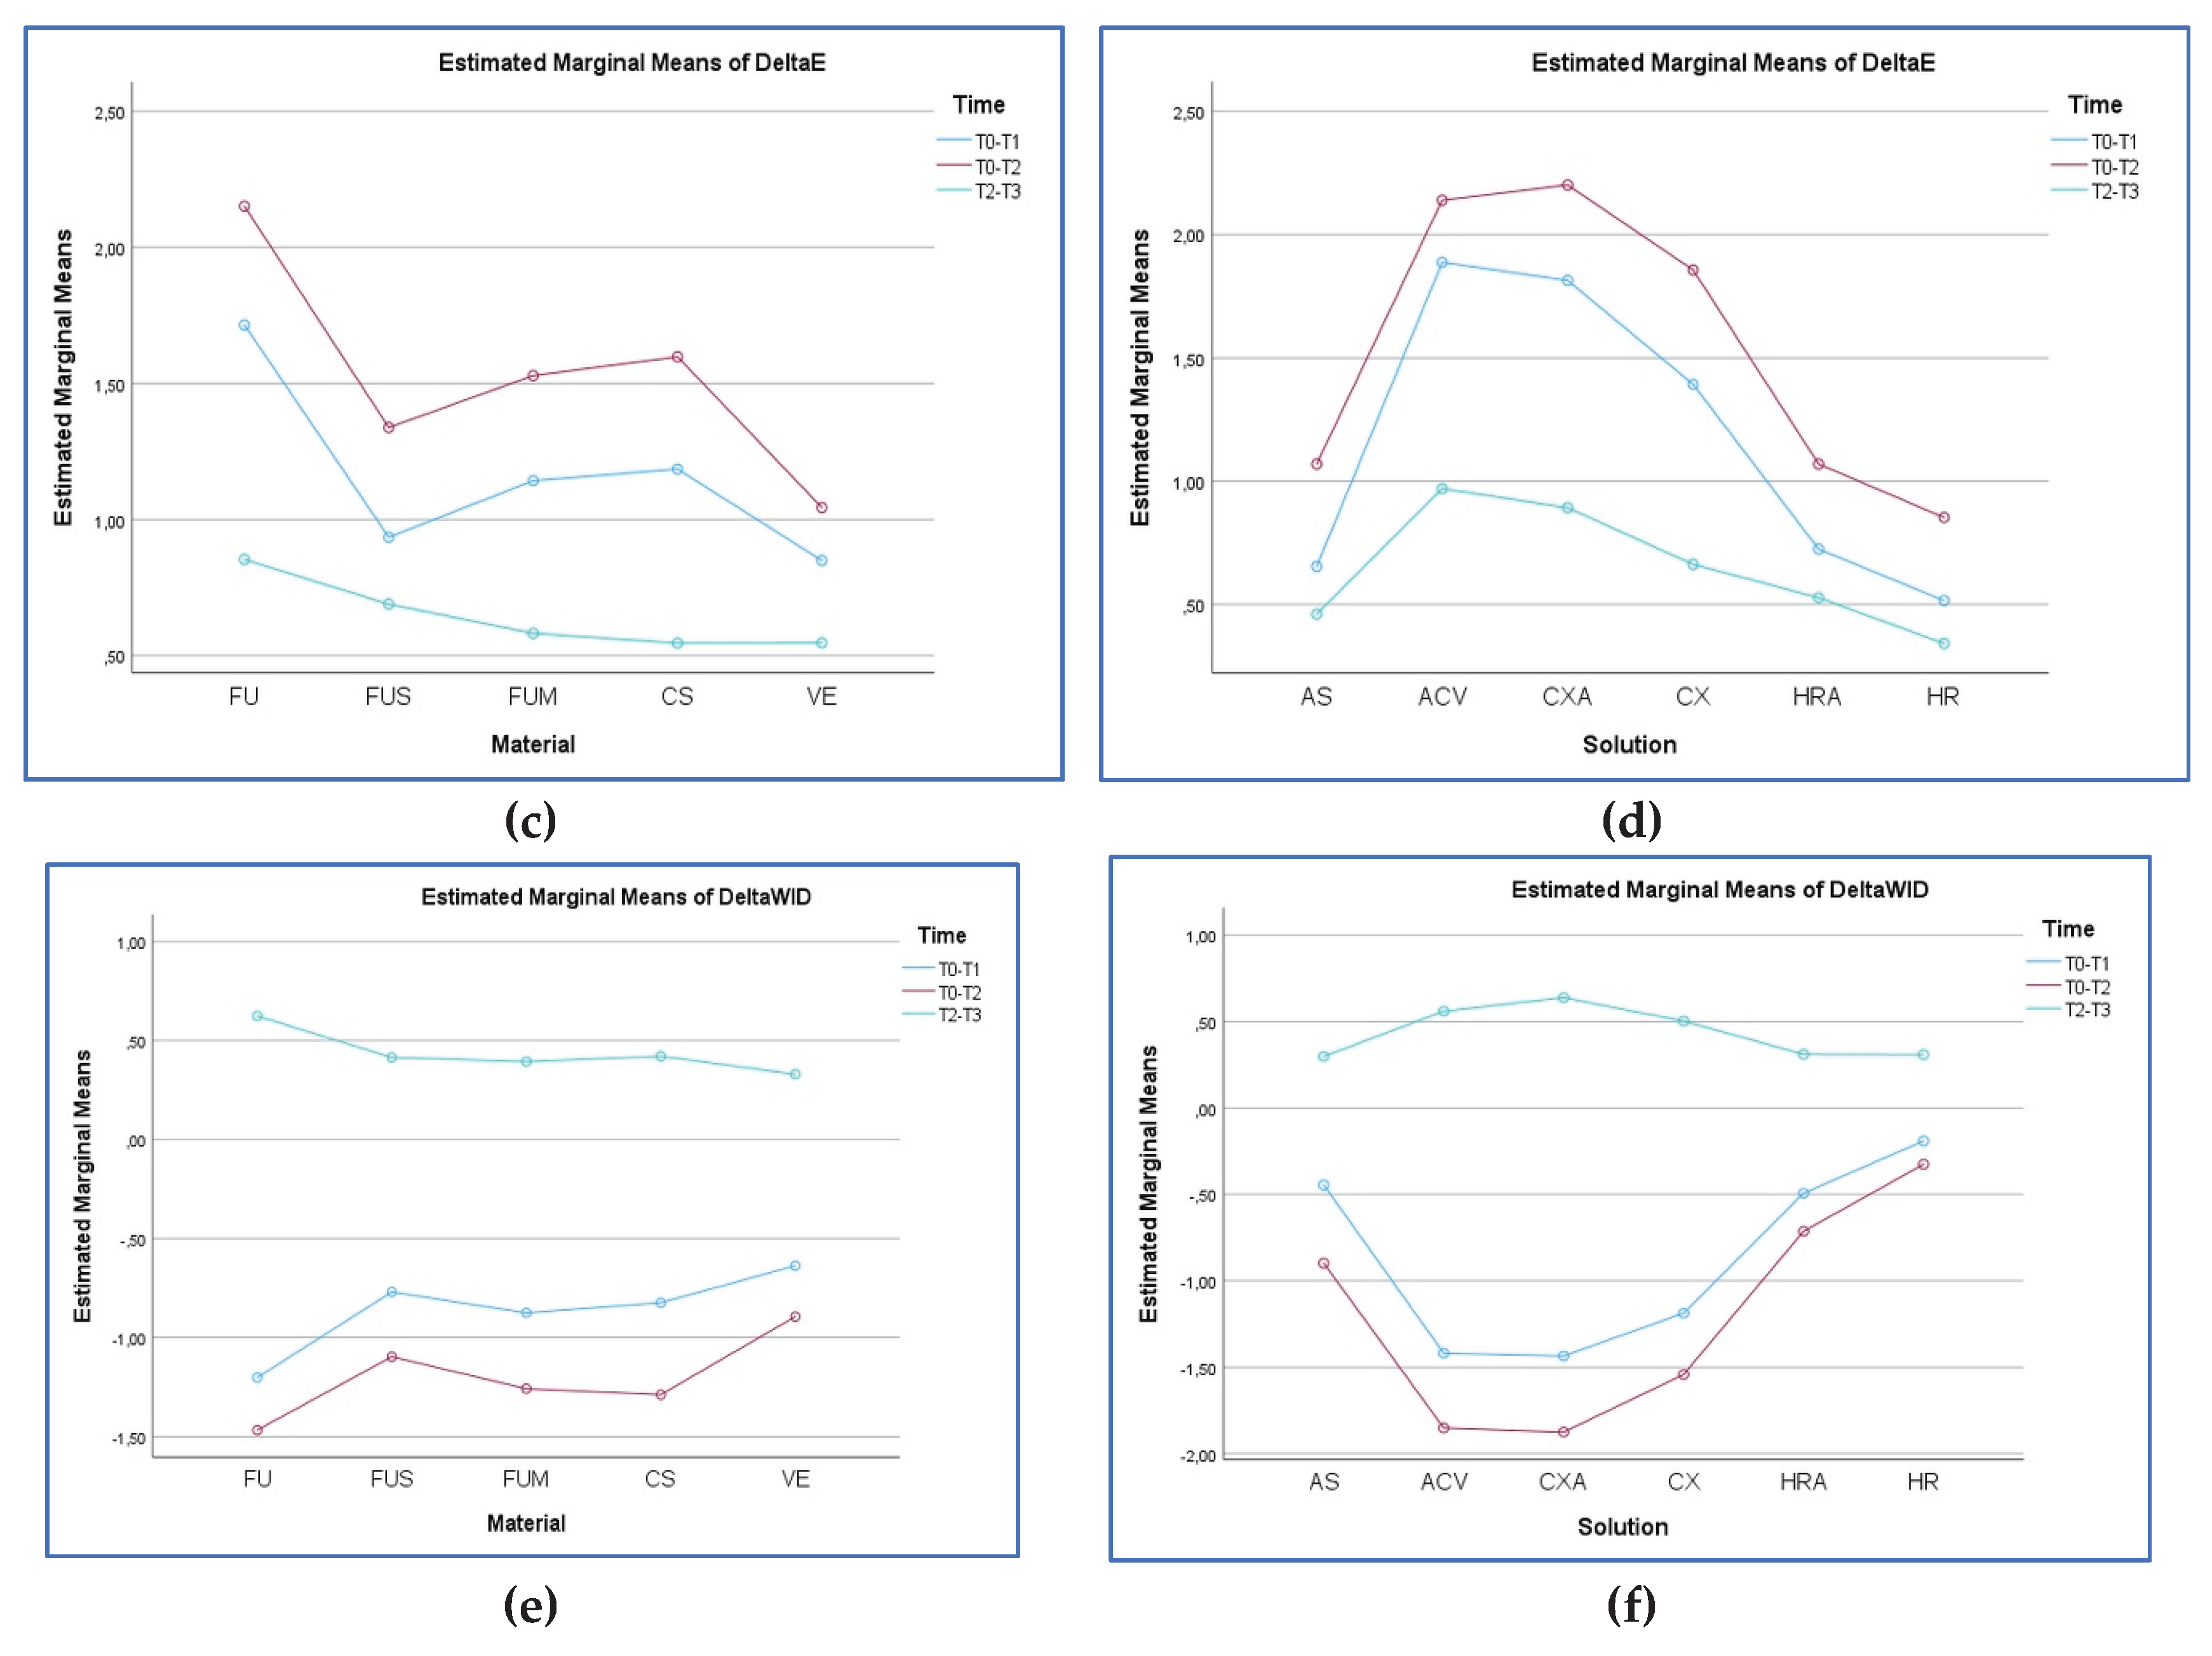
Figure 5.
SEM images of the specimens following solution immersion. (a–c) FU at 5000×, 10,000×, and 25,000×; (d–f) FUS at 5000×, 10,000×, and 25,000×; (g–i) FUM at 5000×, 10,000×, and 25,000×; (j–l) CS at 5000×, 10,000×, and 25,000×; (m–o) VE at 5000×, 10,000×, and 25,000×. Red circle: groove; blue arrow: linear marks; yellow circle: debonding; green circle: pitting; purple arrow: roughness; white circle: crack line; red arrow: sharp edge.
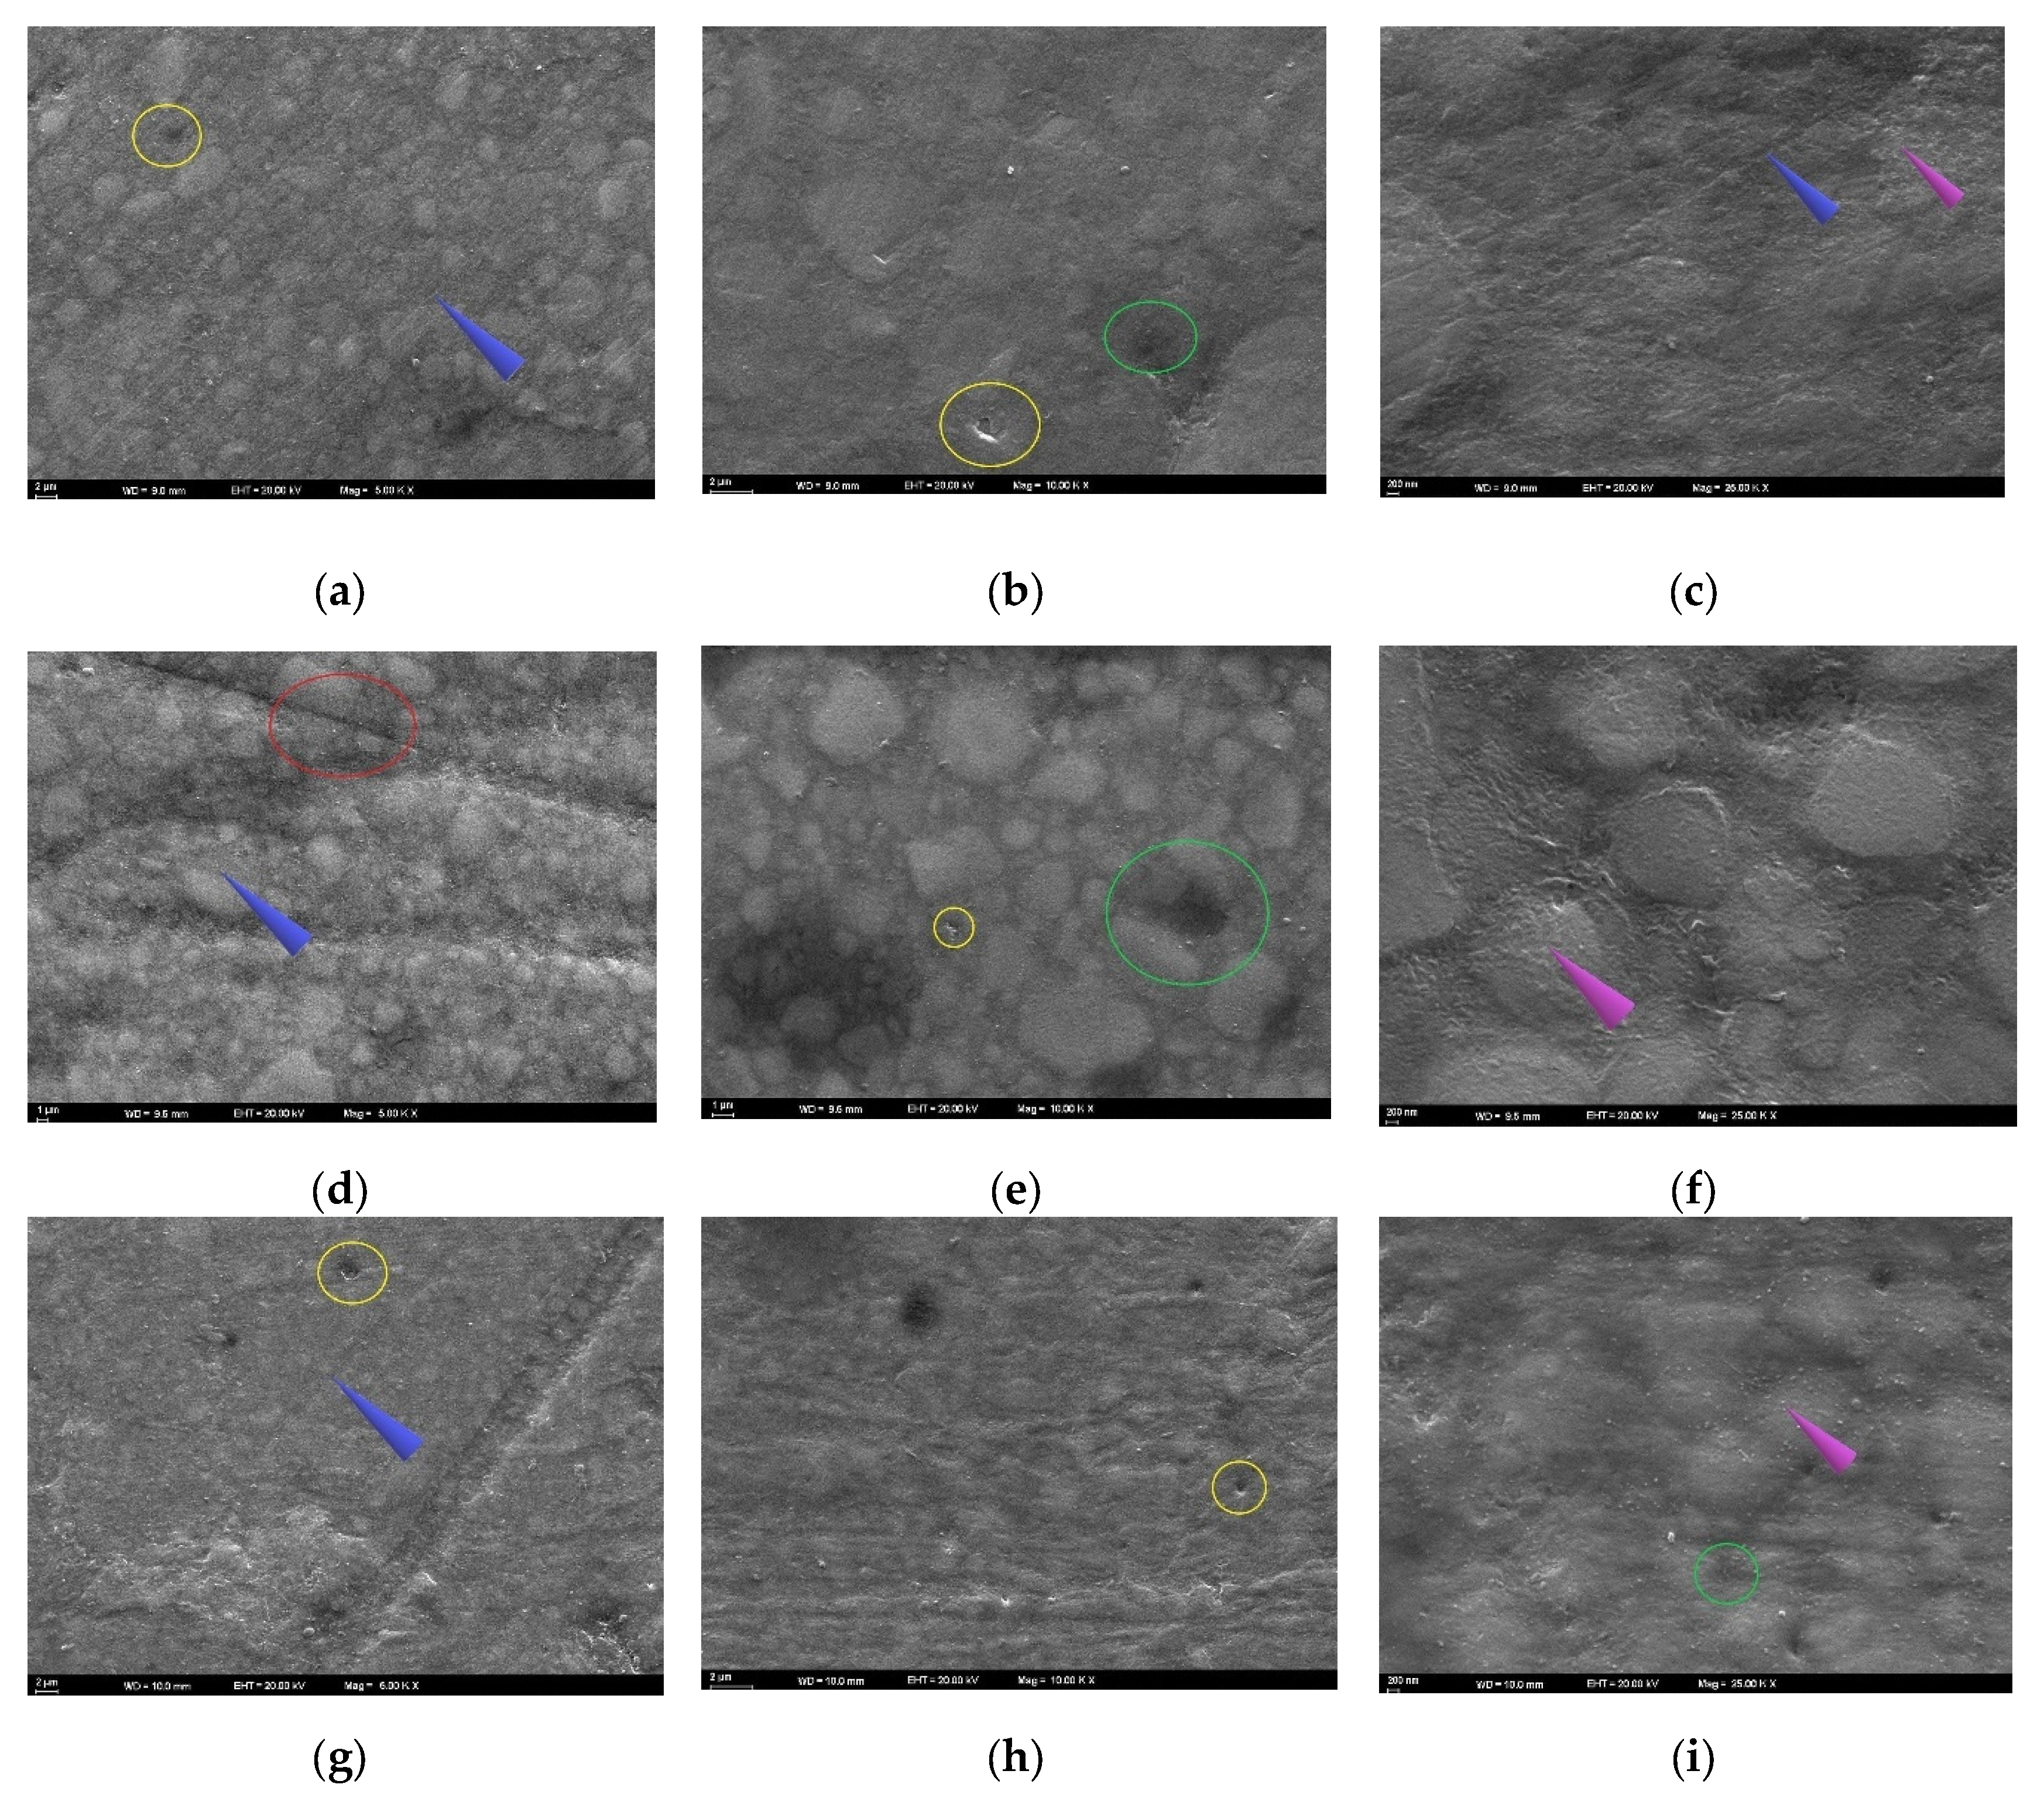
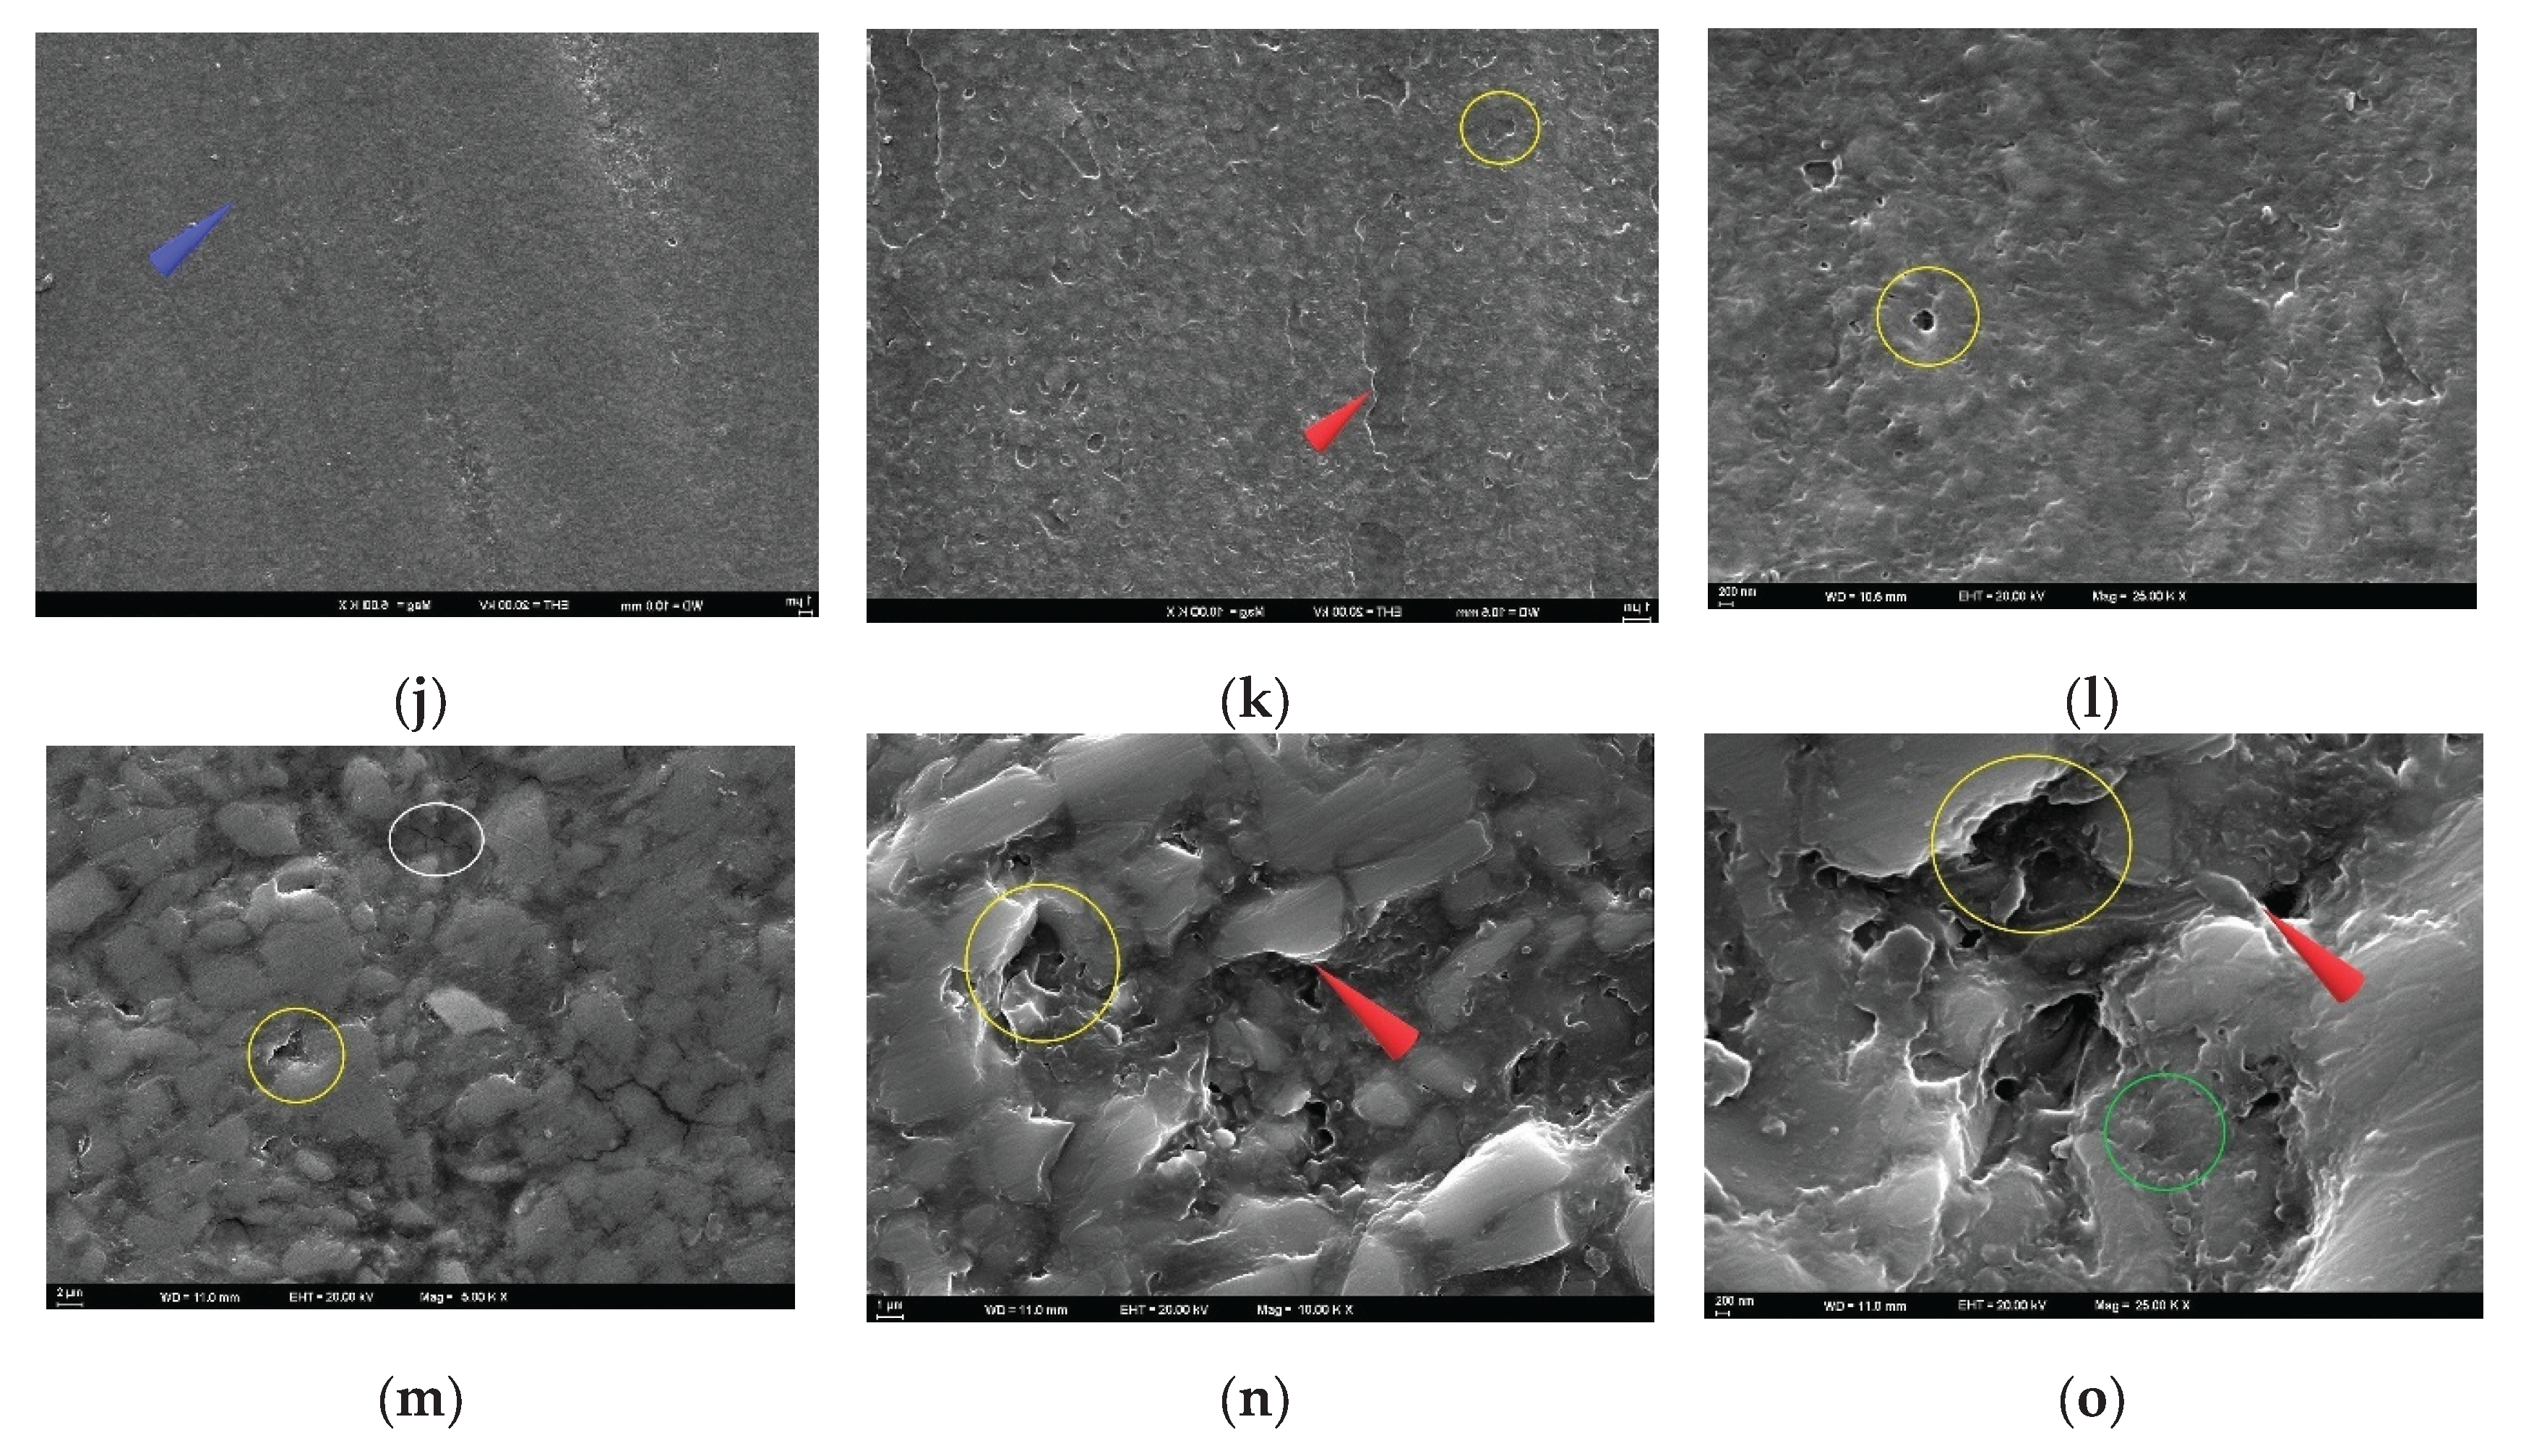
Figure 6.
SEM images of the specimens after bleaching. (a–c) FU at 5000×, 10,000×, and 25,000×; (d–f) FUS at 5000×, 10,000×, and 25,000×; (g–i) FUM at 5000×, 10,000×, and 25,000×; (j–l) CS at 5000×, 10,000×, and 25,000×; (m–o) VE at 5000×, 10,000×, and 25,000×. Red circle: groove; blue arrow: linear marks; yellow circle: debonding; green circle: pitting; purple arrow: roughness; white circle: crack line; red arrow: sharp edge.
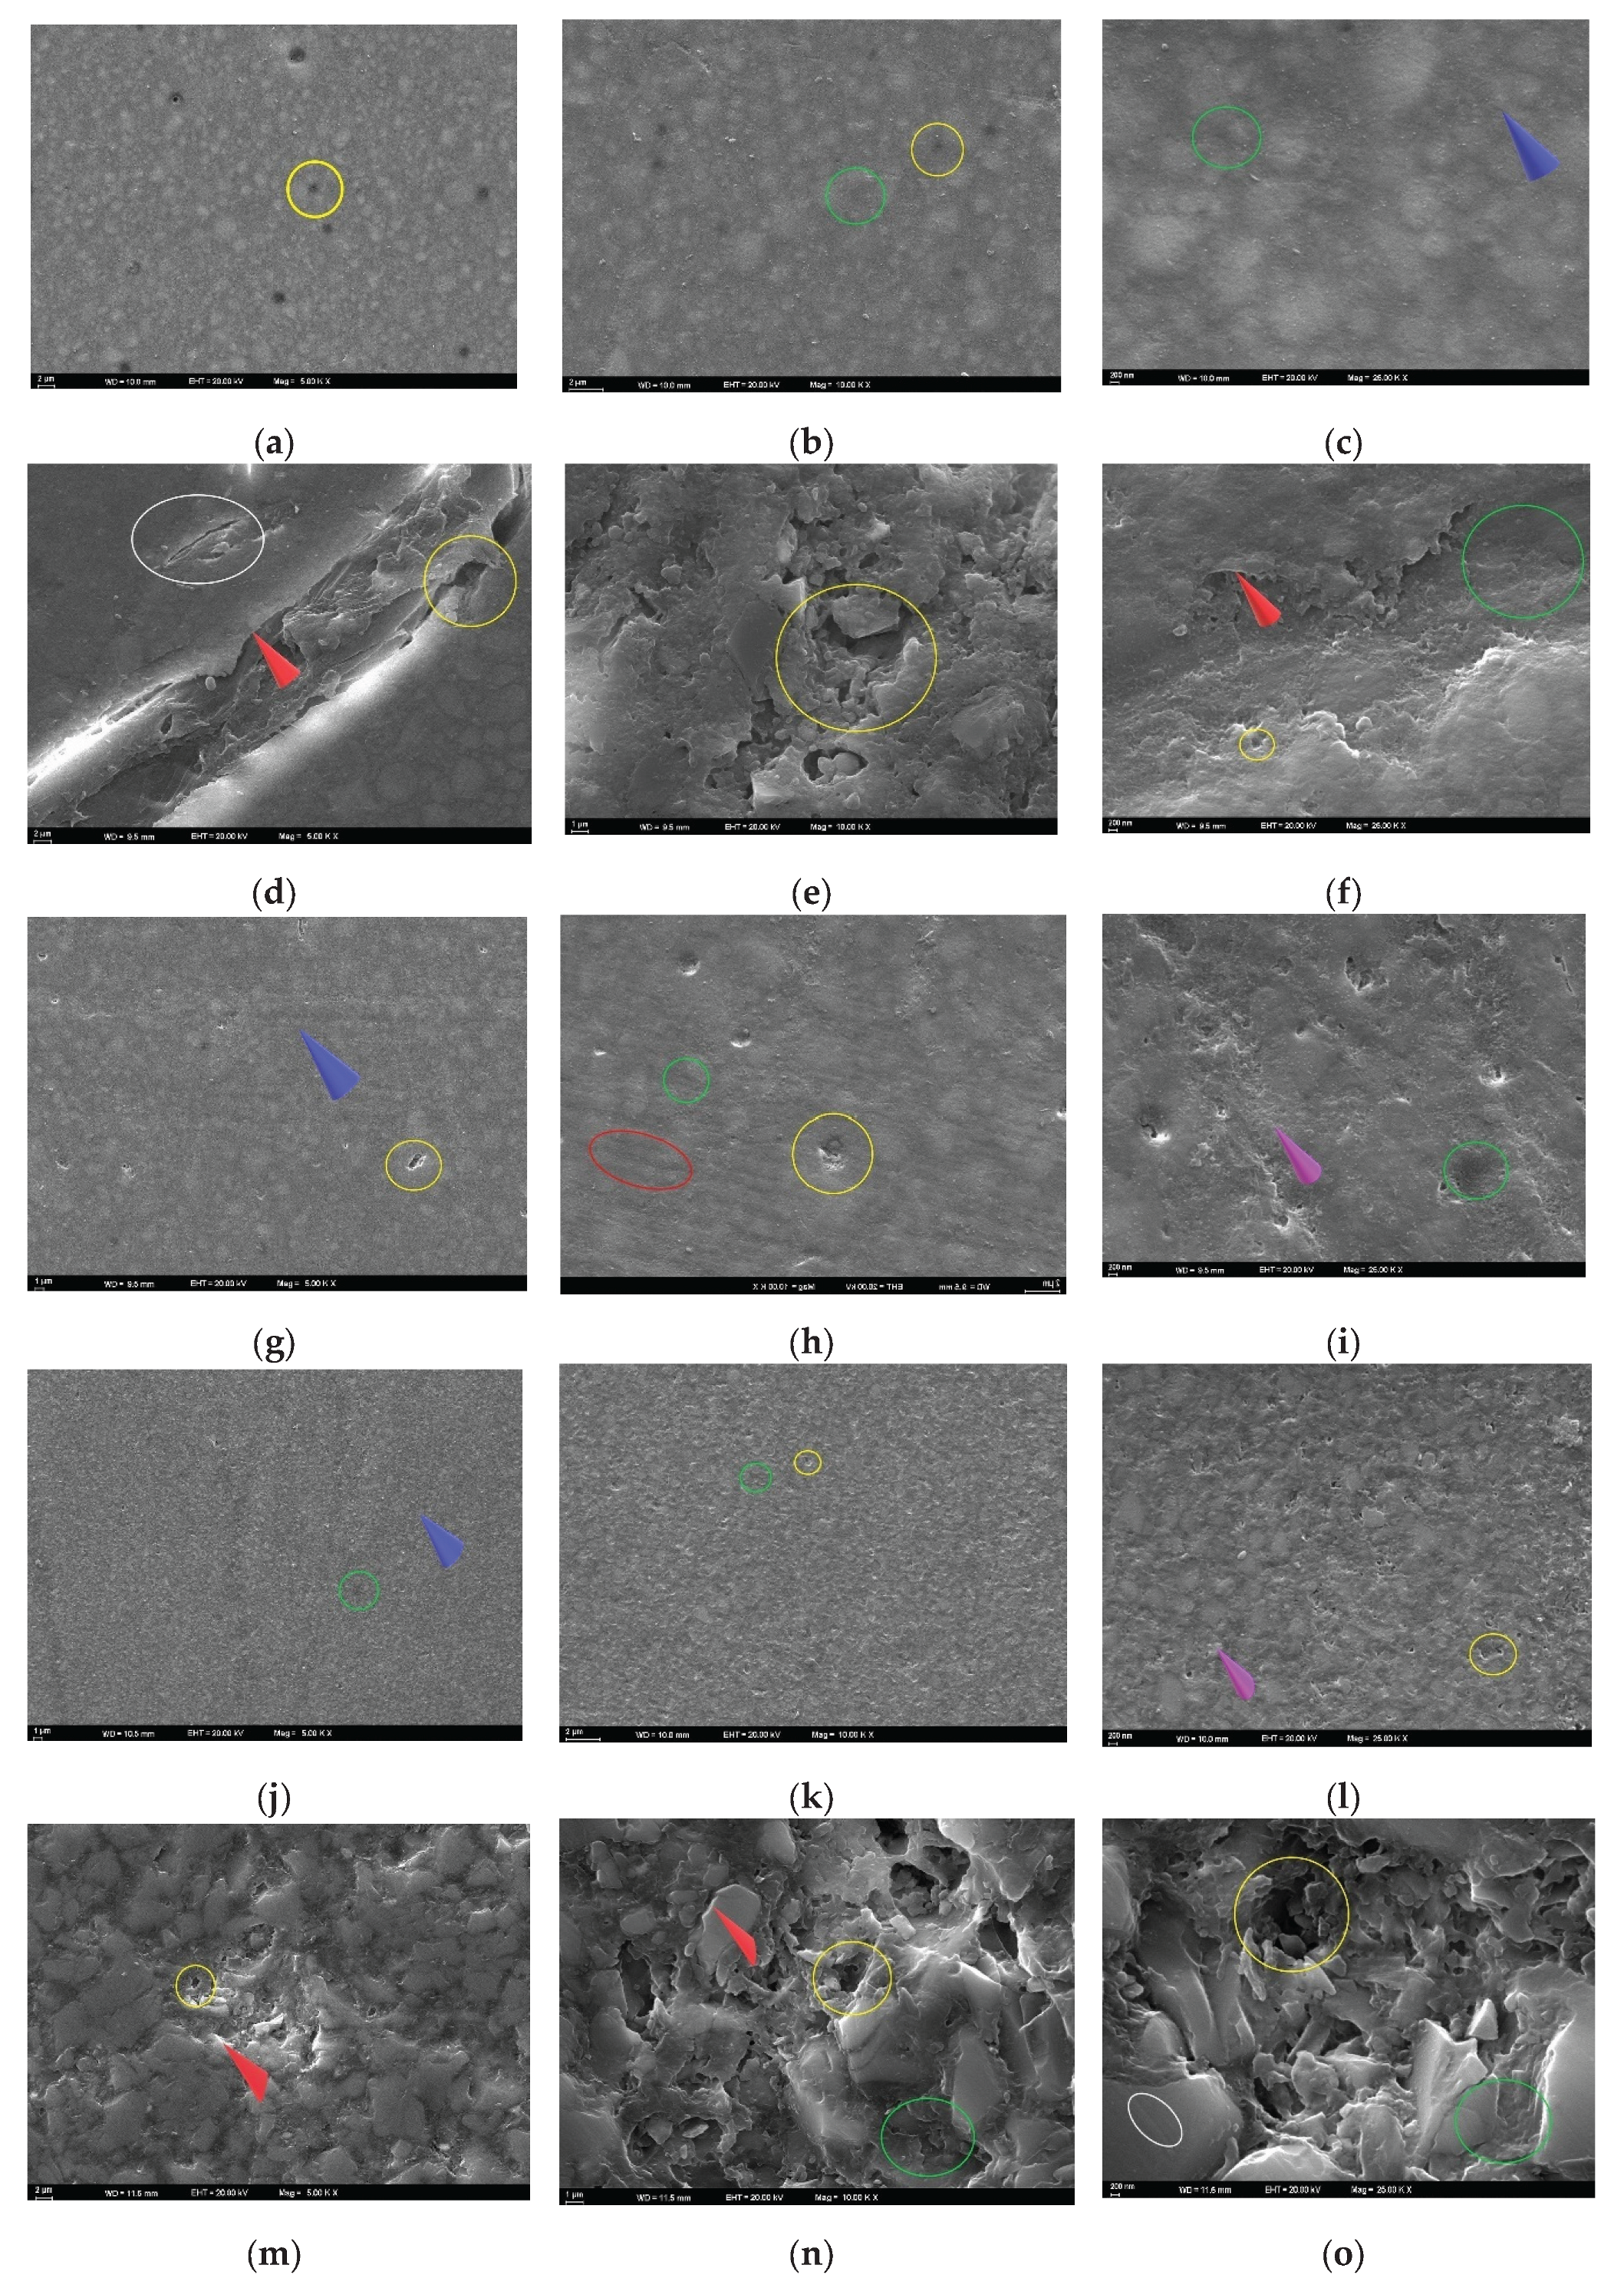

Table 1.
Materials used in the study.
| Type | Brand | Code | Description | Composition | pH | Manufacturer |
|---|---|---|---|---|---|---|
|
Material |
Cerasmart 270 |
CS |
Resin nanoceramic blocks |
Inorganic phase (71 wt%): Silica nanoparticles, barium glass ceramic particles, glass phase containing strontium and aluminum, nanoceramic filler. Organic phase (29 wt%): UDMA, Bis-MEPP, DMA, other auxiliary dimethacrylates | GC Corp., Tokyo, Japan | |
|
Vita Enamic |
VE |
Polymer-infiltrated ceramic network blocks | Inorganic phase (86 wt%): Feldspathic ceramic network (SiO₂, Al₂O₃, Na₂O, K₂O), zirconia, sodium aluminosilicate glass. Organic phase (14 wt%): UDMA, TEGDMA, Bis-GMA, PMMA, and other dimethacrylates | VITA Zahnfabrik, Bad Säckingen, Germany | ||
|
Filtek Universal |
FU |
Nanohybrid RC for universal use | Inorganic fillers (76.5 wt%): Zirconia/silica nanoparticles, spherical silica nanoparticles (~20 nm), aggregate structures (0.6–1.4 µm). Organic resin matrix (23.5 wt%): Bis-GMA, UDMA, TEGDMA, Bis-EMA | 3M ESPE, St. Paul, MN, USA | ||
| everStick NET | ES | PMMA-based glass fiber strip | Fiber phase (44–46 vol%): E-glass fiber (7–10 µm). Polymer matrix (54–56 vol%): Bis-GMA, PMMA | GC Corp., Tokyo, Japan | ||
|
Solution |
Testonic Artificial Saliva |
AS |
Artificial saliva (ISO 7491:2000) | Sodium, potassium, calcium, chloride, bicarbonate and phosphate ions, viscosity enhancers, preservatives |
6.8 |
Colin Kimya, Istanbul, Turkey |
| Kühne Apple Vinegar | ACV | Apple cider vinegar | Acetic acid, plant extract (apple), antioxidant | 4.1 | Carl Kühne KG, Hamburg, Germany | |
| Andorex Mouthwash |
CXA |
CHX/alcohol mouthwash | 0.12% chlorhexidine digluconate, benzydamine hydrochloride, Patent Blue V, glycerol, polysorbate 20, tartrazine (E102), ethanol, purified water | 5.2 | Humanis Health, Istanbul, Turkey | |
| Klorhex Plus Mouthwash |
CX |
CHX/no alcohol mouthwash | 0.12% chlorhexidine digluconate, flurbiprofen, Patent Blue V (E131), sorbitol, glycerol, purified water | 5.5 | Drogsan GmbH, Ankara, Turkey | |
| One Drop Only |
HRA |
CHX/alcohol mouthwash | Aqua, menthol, thymol, eugenol, benzyl benzoate, alcohol, menthol, peppermint oil, tree resin, sage oil, tea tree oil, limonene, linalool, citral, water | 6.8 | One Drop Only GmbH, Berlin, Germany | |
| Agarta Mouthwash |
HR |
CHX/no alcohol mouthwash | Bay leaf, licorice root, sage oil, laurel extract, chamomile flower extract, peppermint oil, green tea, propolis extract, menthol, glycerin, water | 6.8 | Agarta Cosmetics, Ankara, Turkey |
UDMA: Urethane dimethacrylate; Bis-MEPP: Bisphenol A-glycidyl methacrylate-phosphoric acid ester; DMA: Dimethylacrylamide; SiO₂: Silicon dioxide; Al₂O₃: Aluminum oxide; Na₂O: Sodium oxide; K₂O: Potassium oxide; TEGDMA: Triethylene glycol dimethacrylate; Bis-GMA: Bisphenol A glycidyl methacrylate; PMMA: Polymethyl methacrylate; Bis-EMA: Bisphenol A ethoxylate dimethacrylate.
Table 2.
Results of the ANOVA.
| Source | Sum of squares | df | F | p-value | Partial eta squared | |
|---|---|---|---|---|---|---|
| Ra | Material | 0.811 | 4 | 25.429 | <0.001 | 0.086 |
| Solution | 1.611 | 5 | 40.415 | <0.001 | 0.158 | |
| Time | 4.737 | 3 | 198.009 | <0.001 | 0.355 | |
| Material-solution | 0.053 | 20 | 0.333 | 0.998 | 0.006 | |
| Material-time | 0.142 | 12 | 1.488 | 0.122 | 0.016 | |
| Solution-time | 0.979 | 15 | 8.182 | <0.001 | 0.102 | |
| Material-solution-time | 0.170 | 60 | 0.354 | 1.000 | 0.019 | |
| ∆E00 | Material | 57.330 | 4 | 53.796 | <0.001 | 0.210 |
| Solution | 175.886 | 5 | 132.035 | <0.001 | 0.449 | |
| Time | 119.740 | 2 | 224.717 | <0.001 | 0.357 | |
| Material-solution | 18.050 | 20 | 3.387 | <0.001 | 0.077 | |
| Material-time | 14.037 | 8 | 6.586 | <0.001 | 0.061 | |
| Solution-time | 23.517 | 10 | 8.827 | <0.001 | 0.098 | |
| Material-solution-time | 8.441 | 40 | 0.792 | 0.819 | 0.038 | |
| ∆WID | Material | 8.067 | 4 | 6.505 | <0.001 | 0.031 |
| Solution | 91.938 | 5 | 59.304 | <0.001 | 0.268 | |
| Time | 448.372 | 2 | 723.042 | <0.001 | 0.641 | |
| Material-solution | 30.041 | 20 | 4.844 | <0.001 | 0.107 | |
| Material-time | 16.662 | 8 | 6.717 | <0.001 | 0.062 | |
| Solution-time | 93.496 | 10 | 30.154 | <0.001 | 0.271 | |
| Material-solution-time | 16.392 | 40 | 1.322 | 0.090 | 0.061 |
Significant association (p < 0.05) indicated in bold. Ra: Surface roughness; ∆E00: Color change; ∆WID: Whiteness index change.
Table 3.
Surface roughness means (µm) ± standard deviations.
| AS | ACV | CXA | CX | HRA | HR | Total | ||
|---|---|---|---|---|---|---|---|---|
|
FU |
T0 | 0.18 ± 0.11 | 0.13 ± 0.05a | 0.18 ± 0.11a | 0.17 ± 0.07a | 0.15 ± 0.03 | 0.19 ± 0.06 | 0.17 ± 0.08a |
| T1 | 0.17 ± 0.04A | 0.27 ± 0.10Ba | 0.25 ± 0.23Bb | 0.22 ± 0.04ABa | 0.22 ± 0.09AB | 0.20 ± 0.08AB | 0.22 ± 0.12b | |
| T2 | 0.20 ± 0.05A | 0.40 ± 0.10Bb | 0.34 ± 0.15Bc | 0.32 ± 0.09Cb | 0.30 ± 0.07C | 0.24 ± 0.05A | 0.30 ± 0.11c | |
| T3 | 0.24 ± 0.06A | 0.43 ± 0.08Bc | 0.38 ± 0.17Bc | 0.33 ± 0.10Cb | 0.33 ± 0.08C | 0.26 ± 0.06A | 0.33 ± 0.11d | |
| Total | 0.20 ± 0.07A | 0.31 ± 0.14B | 0.29 ± 0.18C | 0.26 ± 0.10C | 0.25 ± 0.10D | 0.22 ± 0.07E | 0.25 ± 0.12 | |
|
FUS |
T0 | 0.18 ± 0.06 | 0.18 ± 0.05a | 0.16 ± 0.10a | 0.17 ± 0.06a | 0.18 ± 0.05a | 0.18 ± 0.06a | 0.17 ± 0.06a |
| T1 | 0.18 ± 0.06A | 0.28 ± 0.02Bb | 0.25 ± 0.11Ab | 0.22 ± 0.04Ab | 0.23 ± 0.02Aa | 0.19 ± 0.07Aa | 0.22 ± 0.07b | |
| T2 | 0.21 ± 0.03A | 0.40 ± 0.11Bc | 0.35 ± 0.09Bc | 0.32 ± 0.10Bc | 0.28 ± 0.05Ab | 0.26 ± 0.05Ab | 0.30 ± 0.10c | |
| T3 | 0.24 ± 0.04A | 0.45 ± 0.09Bd | 0.37 ± 0.06Cd | 0.36 ± 0.08Cd | 0.31 ± 0.06Ac | 0.29 ± 0.09Ac | 0.34 ± 0.10d | |
| Total | 0.20 ± 0.05A | 0.33 ± 0.13B | 0.28 ± 0.12C | 0.27 ± 0.10C | 0.25 ± 0.07D | 0.23 ± 0.08E | 0.26 ± 0.10 | |
|
FUM |
T0 | 0.18 ± 0.08 | 0.14 ± 0.04a | 0.16 ± 0.04a | 0.17 ± 0.04a | 0.16 ± 0.06a | 0.16 ± 0.09a | 0.16 ± 0.06a |
| T1 | 0.17 ± 0.03A | 0.28 ± 0.04Bb | 0.25 ± 0.09Ab | 0.22 ± 0.04Aa | 0.20 ± 0.06Aa | 0.18 ± 0.06Aa | 0.22 ± 0.06b | |
| T2 | 0.20 ± 0.06A | 0.36 ± 0.11Bc | 0.37 ± 0.09Bc | 0.29 ± 0.07Bb | 0.28 ± 0.16Ab | 0.26 ± 0.13Ab | 0.29 ± 0.12c | |
| T3 | 0.23 ± 0.03A | 0.41 ± 0.07Bd | 0.36 ± 0.07Bc | 0.30 ± 0.11Ac | 0.33 ± 0.13Bc | 0.32 ± 0.12Cc | 0.32 ± 0.11d | |
| Total | 0.19 ± 0.06A | 0.30 ± 0.12B | 0.28 ± 0.11C | 0.25 ± 0.09C | 0.24 ± 0.12D | 0.23 ± 0.12E | 0.25 ± 0.11 | |
|
CS |
T0 | 0.21 ± 0.14 | 0.18 ± 0.11a | 0.18 ± 0.05a | 0.18 ± 0.06a | 0.15 ± 0.03a | 0.27 ± 0.39a | 0.19 ± 0.17a |
| T1 | 0.22 ± 0.05A | 0.35 ± 0.03Bb | 0.32 ± 0.04Bb | 0.30 ± 0.01Ab | 0.27 ± 0.05Ab | 0.26 ± 0.02Aa | 0.29 ± 0.05b | |
| T2 | 0.23 ± 0.03A | 0.44 ± 0.08Bc | 0.40 ± 0.09Bc | 0.37 ± 0.04Bc | 0.35 ± 0.10Cc | 0.31 ± 0.08Ca | 0.35 ± 0.10c | |
| T3 | 0.28 ± 0.05A | 0.47 ± 0.06Bd | 0.44 ± 0.10Bd | 0.39 ± 0.05Cd | 0.42 ± 0.14Bd | 0.35 ± 0.08Ab | 0.39 ± 0.10d | |
| Total | 0.23 ± 0.08A | 0.36 ± 0.13B | 0.33 ± 0.12C | 0.31 ± 0.09C | 0.30 ± 0.13C | 0.30 ± 0.20D | 0.30 ± 0.14 | |
|
VE |
T0 | 0.16 ± 0.01 | 0.16 ± 0.05a | 0.19 ± 0.12a | 0.19 ± 0.13a | 0.18 ± 0.03a | 0.15 ± 0.01 | 0.17 ± 0.07a |
| T1 | 0.16 ± 0.04 | 0.21 ± 0.04a | 0.21 ± 0.06a | 0.19 ± 0.06a | 0.17 ± 0.02a | 0.16 ± 0.02 | 0.18 ± 0.04a | |
| T2 | 0.17 ± 0.06A | 0.35 ± 0.04Bb | 0.31 ± 0.05Bb | 0.26 ± 0.03Ba | 0.25 ± 0.06Bb | 0.21 ± 0.02C | 0.26 ± 0.07b | |
| T3 | 0.22 ± 0.06A | 0.37 ± 0.03Bb | 0.34 ± 0.07Bc | 0.30 ± 0.05Bb | 0.29 ± 0.09Cc | 0.23 ± 0.06D | 0.29 ± 0.08c | |
| Total | 0.18 ± 0.05A | 0.27 ± 0.10B | 0.26 ± 0.10C | 0.23 ± 0.09C | 0.22 ± 0.07D | 0.19 ± 0.05E | 0.22 ± 0.08 | |
|
Total |
T0 | 0.18 ± 0.09a | 0.16 ± 0.07 | 0.17 ± 0.09a | 0.17 ± 0.08 | 0.17 ± 0.04 | 0.19 ± 0.18a | 0.17 ± 0.10a |
| T1 | 0.18 ± 0.05Ab | 0.28 ± 0.07B | 0.25 ± 0.12Ba | 0.23 ± 0.05B | 0.22 ± 0.06C | 0.20 ± 0.06Bb | 0.23 ± 0.08b | |
| T2 | 0.20 ± 0.05Ac | 0.39 ± 0.09B | 0.35 ± 0.10Bb | 0.31 ± 0.08B | 0.29 ± 0.10C | 0.26 ± 0.08Da | 0.30 ± 0.10c | |
| T3 | 0.24 ± 0.05Ab | 0.43 ± 0.07B | 0.38 ± 0.10Ba | 0.34 ± 0.09B | 0.34 ± 0.11C | 0.29 ± 0.09Da | 0.33 ± 0.10d | |
| Total | 0.20 ± 0.06A | 0.31 ± 0.13B | 0.29 ± 0.13B | 0.26 ± 0.10B | 0.25 ± 0.10C | 0.23 ± 0.12C | 0.26 ± 0.11 |
ANOVA p-value: Same superscript lowercase letters represent no significant difference in columns, and same superscript capital letters indicate no significant difference in rows. FU: Filtek Universal; FUS: Filtek Universal with superficial fiber strip; FUM: Filtek Universal with mid-layer fiber strip; CS: Cerasmart 270; VE: Vita Enamic.
Table 4.
Color change means ± standard deviations.
| AS | ACV | CXA | CX | HRA | HR | Total | ||
|---|---|---|---|---|---|---|---|---|
| FU | T0–T1 | 1.47 ± 0.26Aa | 2.19 ± 0.83Ba | 2.01 ± 0.49Ba | 1.71 ± 0.55Aa | 1.70 ± 0.53Aa | 1.19 ± 0.65Aa | 1.71 ± 0,64a |
| T0–T2 | 1.95 ± 0.34Ab | 2.68 ± 0.79Bb | 2.51 ± 0.46ABb | 2.19 ± 0.42Bb | 1.99 ± 0.63ABa | 1.56 ± 0.35Ca | 2.15 ± 0.63b | |
| T2–T3 | 0.75 ± 0.38Ac | 0.98 ± 0.23ABc | 0.88 ± 0.55ABc | 1.08 ± 0.15ABc | 1.01 ± 0.21ABb | 0.41 ± 0.14Bb | 0.85 ± 0.37c | |
| Total | 1.39 ± 0.59A | 1.95 ± 0.98B | 1.79 ± 0.84BC | 1.66 ± 0.61C | 1.56 ± 0.63AC | 1.06 ± 0.64D | 1.57 ± 0.78 | |
| FUS | T0–T1 | 0.37 ± 0.22A | 1.69 ± 0.88Ba | 1.73 ± 0.68Ba | 1.23 ± 0.95C | 0.32 ± 0.37A | 0.25 ± 0.15A | 0.93 ± 0.88a |
| T0–T2 | 0.78 ± 0.47A | 2.18 ± 1.02Bb | 2.08 ± 0.66Bb | 1.60 ± 0.65C | 0.75 ± 0.38A | 0.61 ± 0.36A | 1.33 ± 089b | |
| T2–T3 | 0.37 ± 0.35A | 1.05 ± 0.49Bc | 1.15 ± 0.18Bc | 0.92 ± 0.62B | 0.33 ± 0.26A | 0.28 ± 0.17A | 0.68 ± 052c | |
| Total | 0.51 ± 0.40A | 1.64 ± 0.92B | 1.65 ± 0.66B | 1.25 ± 0.78C | 0.47 ± 0.39A | 0.38 ± 0.29A | 0.98 ± 0.8 | |
| FUM | T0–T1 | 0.57 ± 0.31Aa | 2.08 ± 0.93Ba | 1.97 ± 0.66Ba | 1.33 ± 0.60Ca | 0.61 ± 0.46Aa | 0.27 ± 0.14A | 1.14 ± 0.9a |
| T0–T2 | 1.06 ± 0.40Ab | 2.40 ± 0.49Ba | 2.34 ± 0.69Ba | 1.79 ± 0.36Cb | 0.91 ± 0.60Ab | 0.64 ± 0.46A | 1.52 ± 085b | |
| T2–T3 | 0.57 ± 0.43Aa | 0.96 ± 0.32Bb | 0.91 ± 0.67Bb | 0.40 ± 0.14Bc | 0.36 ± 0.17Ba | 0.27 ± 0.10B | 0.58 ± 0.44c | |
| Total | 0.73 ± 0.44A | 1.81 ± 0.88B | 1.74 ± 0.89B | 1.17 ± 0.71C | 0.63 ± 0.49A | 0.39 ± 0.33A | 1.08 ± 0.85 | |
| CS | T0–T1 | 0.65 ± 0.31Aa | 1.82 ± 0.57Ba | 1.74 ± 0.96Ba | 1.45 ± 1.16Ca | 0.75 ± 0.32Aa | 0.67 ± 0.40Aa | 1.18 ± 0.84a |
| T0–T2 | 1.10 ± 0.31Aa | 2.16 ± 0.54Ba | 2.06 ± 0.65Ba | 1.89 ± 1.48Cb | 1.19 ± 0.28Ab | 1.16 ± 0.91Ab | 1.59 ± 090b | |
| T2–T3 | 0.40 ± 0.18Ab | 0.90 ± 0.24Bb | 0.69 ± 0.59Ab | 0.40 ± 0.32Bc | 0.40 ± 0.19Ba | 0.46 ± 0.40Ab | 0.54 ± 0.38c | |
| Total | 0.72 ± 0.39A | 1.63 ± 0.71B | 1.49 ± 0.9B | 1.25 ± 1.24C | 0.78 ± 0.42A | 0.76 ± 0.67A | 1.10 ± 0.86 | |
| VE | T0–T1 | 0.19 ± 0.11A | 1.63 ± 0.42Ba | 0.61 ± 0.54Ba | 1.23 ± 0.36Ca | 0.22 ± 0.12A | 0.18 ± 0.10A | 0.84 ± 073a |
| T0–T2 | 0.44 ± 0.23A | 1.25 ± 0.43Ba | 2.01 ± 0.29Cb | 1.79 ± 0.39Db | 0.49 ± 0.42A | 0.27 ± 0.24A | 1.04 ± 0.76b | |
| T2–T3 | 0.20 ± 0.11A | 0.94 ± 0.33Bb | 0.81 ± 0.31Bc | 0.50 ± 0.26Ac | 0.54 ± 0.29A | 0.26 ± 0.12B | 0.53 ± 036c | |
| Total | 0.27 ± 0.19A | 1.27 ± 0.48B | 1.47 ± 0.63C | 1.17 ± 0.63C | 0.42 ± 0.32A | 0.24 ± 0.17A | 0.81 ± 0.67 | |
| Total | T0–T1 | 0.65 ± 0.51A | 1.88 ± 0.75B | 1.81 ± 0.68B | 1.39 ± 0.77C | 0.72 ± 0.65A | 0.51 ± 0.31A | 1.16 ± 085a |
| T0–T2 | 1.07 ± 0.61A | 2.13 ± 0.82B | 2.20 ± 0.58B | 1.85 ± 0.78C | 1.06 ± 0.69A | 0.85 ± 0.68A | 1.53 ± 0.88b | |
| T2–T3 | 0.46 ± 0.35A | 0.97 ± 0.32B | 0.89 ± 0.50B | 0.66 ± 0.43B | 0.52 ± 0.33B | 0.34 ± 0.22B | 0.64 ± 0.43c | |
| Total | 0.72 ± 0.56A | 1.66 ± 0.83B | 1.63 ± 0.80B | 1.30 ± 0.83C | 0.77 ± 0.62D | 0.57 ± 035E | 1.11 ± 0.83 |
ANOVA p-value: Same superscript lowercase letters represent no significant difference in columns, and same superscript capital letters indicate no significant difference in rows. FU: Filtek Universal; FUS: Filtek Universal with superficial fiber strip; FUM: Filtek Universal with mid-layer fiber strip; CS: Cerasmart 270; VE: Vita Enamic.
Table 5.
Whiteness index change means ± standard deviations.
| AS | ACV | CXA | CX | HRA | HR | Total | ||
|---|---|---|---|---|---|---|---|---|
| FU | T0–T1 | -1.24 ± 0.28Aa | -1.8 ± 0.66Ba | -1.62 ± 0.57Ba | -1.45 ± 0.69Ba | -1.31 ± 0.67Ba | 0.26 ± 0.14C | -1.20 ± 0.86a |
| T0–T2 | -1.60 ± 0.53Aa | -2.38 ± 1.02Bb | -2.17 ± 0.83Cb | -1.82 ± 0.80Da | -1.33 ± 0.58Ea | 0.51 ± 0.28E | -1.46 ± 1.18b | |
| T2–T3 | 0.51 ± 0.28b | 0.69 ± 0.27c | 0.56 ± 0.37c | 0.72 ± 0.23b | 0.55 ± 0.32b | 0.69 ± 0.27 | 0.62 ± 0.29c | |
| Total | -0.77 ± 1.01A | -1.18 ± 1.53AB | -1.07 ± 1.34AB | -0.85 ± 1.29BC | -0.69 ± 1.04BC | 0.48 ± 0.29C | -0.68 ± 1.26 | |
| FUS | T0–T1 | -0.31 ± 0.27Aa | -1.31 ± 0.94Ba | -1.44 ± 0.47Ca | -1.08 ± 0.84Aa | -0.25 ± 0.40Aa | -0.21 ± 0.23Aa | -0.77 ± 0.77a |
| T0–T2 | -0.67 ± 0.53Aa | -1.85 ± 0.82Bb | -1.79 ± 0.96Ba | -1.22 ± 0.75Aa | -0.47 ± 0.42Aa | -0.54 ± 0.51Aa | -1.09 ± 0.87b | |
| T2–T3 | 0.24 ± 0.20Ab | 0.44 ± 0.26Ac | 0.79 ± 0.30Bb | 0.60 ± 0.46Ab | 0.22 ± 0.24Bb | 0.17 ± 0.13Bb | 0.41 ± 0.36c | |
| Total | -0.24 ± 0.52A | -0.90 ± 1.22B | -0.81 ± 1.32B | -0.56 ± 1.08B | -0.17 ± 0.46C | -0.19 ± 0.44C | -0.48 ± 0.95 | |
| FUM | T0–T1 | -0.33 ± 0.42Aa | -1.59 ± 1.01Ba | -1.59 ± 0.63Ba | -1.15 ± 0.71Ba | -0.47 ± 0.41Aa | -0.10 ± 0.14Aa | -0.87 ± 0.74a |
| T0–T2 | -0.92 ± 0.37Ab | -2.11 ± 0.38Bb | -2.05 ± 0.84Ba | -1.51 ± 0.44Ca | -0.51 ± 0.45Aa | -0.42 ± 0.34Aa | -1.25 ± 0.84b | |
| T2–T3 | 0.29 ± 0.25Ac | 0.66 ± 0.31Ac | 0.62 ± 0.31Ab | 0.41 ± 0.30Ab | 0.13 ± 0.09Bb | 0.23 ± 0.12Ab | 0.39 ± 0.31c | |
| Total | -0.31 ± 0.61A | -1.02 ± 1.37B | -1.01 ± 1.33B | -0.75 ± 0.98B | -0.28 ± 0.47C | -0.09 ± 0.35C | -0.58 ± 1.01 | |
| CS | T0–T1 | -0.36 ± 0.32Aa | -1.29 ± 1.01Ba | -1.21 ± 1.68Ba | -1.14 ± 0.77Ba | -0.34 ± 0.33Aa | -0.59 ± 0.56Aa | -0.82 ± 0.96a |
| T0–T2 | -0.88 ± 0.28Ab | -1.75 ± 0.54Ba | -1.88 ± 0.79Cb | -1.59 ± 1.43Ba | -0.78 ± 0.43Aa | -0.83 ± 0.77Aa | -1.28 ± 0.88b | |
| T2–T3 | 0.25 ± 0.11c | 0.52 ± 0.26b | 0.60 ± 0.47c | 0.52 ± 0.32b | 0.23 ± 0.16b | 0.36 ± 0.31b | 0.42 ± 0.32c | |
| Total | -0.33 ± 0.53A | -0.83 ± 1.19B | -0.82 ± 1.49B | -0.73 ± 1.31B | -0.29 ± 0.52C | -0.35 ± 077C | -0.56 ± 1.05 | |
| VE | T0–T1 | 0.02 ± 0.12Aa | -1.04 ± 0.47Ba | -1.30 ± 0.80Ca | -1.10 ± 0.72Ba | -0.08 ± 0.12Aa | -0.30 ± 0.35A | -0.63 ± 0.72a |
| T0–T2 | -0.40 ± 0.17Aa | -1.15 ± 0.42Ba | -1.47 ± 0.63Ca | -1.54 ± 0.62Ca | -0.45 ± 0.33Aa | -0.33 ± 0.54A | -0.89 ± 0.69b | |
| T2–T3 | 0.18 ± 0.11b | 0.47 ± 0.32b | 0.59 ± 0.31b | 0.24 ± 0.22b | 0.40 ± 0.33b | 0.08 ± 0.17 | 0.32 ± 0.27c | |
| Total | -0.06 ± 0.28A | -0.57 ± 0.85B | -0.72 ± 1.12B | -0.84 ± 0.94B | -0.04 ± 0.44C | -0.18 ± 0.41C | -0.40 ± 0.80 | |
| Total | T0–T1 | -0.44 ± 0.51Aa | -1.41 ± 0.86Ba | -1.43 ± 0.91Ba | -1.18 ± 0.73Ca | -0.49 ± 0.59Aa | -0.19 ± 0.42Da | -0.86 ± 0.75a |
| T0–T2 | -0.89 ± 0.55Ab | -1.85 ± 0.77Bb | -1.87 ± 0.80Cb | -1.54 ± 0.86Cb | -0.71 ± 0.55Ab | -0.32 ± 0.67Da | -1.20 ± 0.92b | |
| T2–T3 | 0.29 ± 0.23Ac | 0.56 ± 0.29Ac | 0.63 ± 0.35Bc | 0.50 ± 0.35Ac | 0.31 ± 0.28Ac | 0.30 ± 0.29Bb | 0.43 ± 0.33c | |
| Total | -0.34 ± 0.67A | -0.90 ± 1.25B | -0.89 ± 1.32B | -0.74 ± 1.12C | -0.29 ± 0.66A | -0.06 ± 0.56D | -0.54 ± 1.03 |
ANOVA p-value: Same superscript lowercase letters represent no significant difference in columns, and same superscript capital letters indicate no significant difference in rows. FU: Filtek Universal; FUS: Filtek Universal with superficial fiber strip; FUM: Filtek Universal with mid-layer fiber strip; CS: Cerasmart 270; VE: Vita Enamic.
Disclaimer/Publisher’s Note: The statements, opinions and data contained in all publications are solely those of the individual author(s) and contributor(s) and not of MDPI and/or the editor(s). MDPI and/or the editor(s) disclaim responsibility for any injury to people or property resulting from any ideas, methods, instructions or products referred to in the content. |
© 2025 by the authors. Licensee MDPI, Basel, Switzerland. This article is an open access article distributed under the terms and conditions of the Creative Commons Attribution (CC BY) license (http://creativecommons.org/licenses/by/4.0/).
Copyright: This open access article is published under a Creative Commons CC BY 4.0 license, which permit the free download, distribution, and reuse, provided that the author and preprint are cited in any reuse.


