
Submitted:
31 August 2025
Posted:
01 September 2025
You are already at the latest version
Abstract
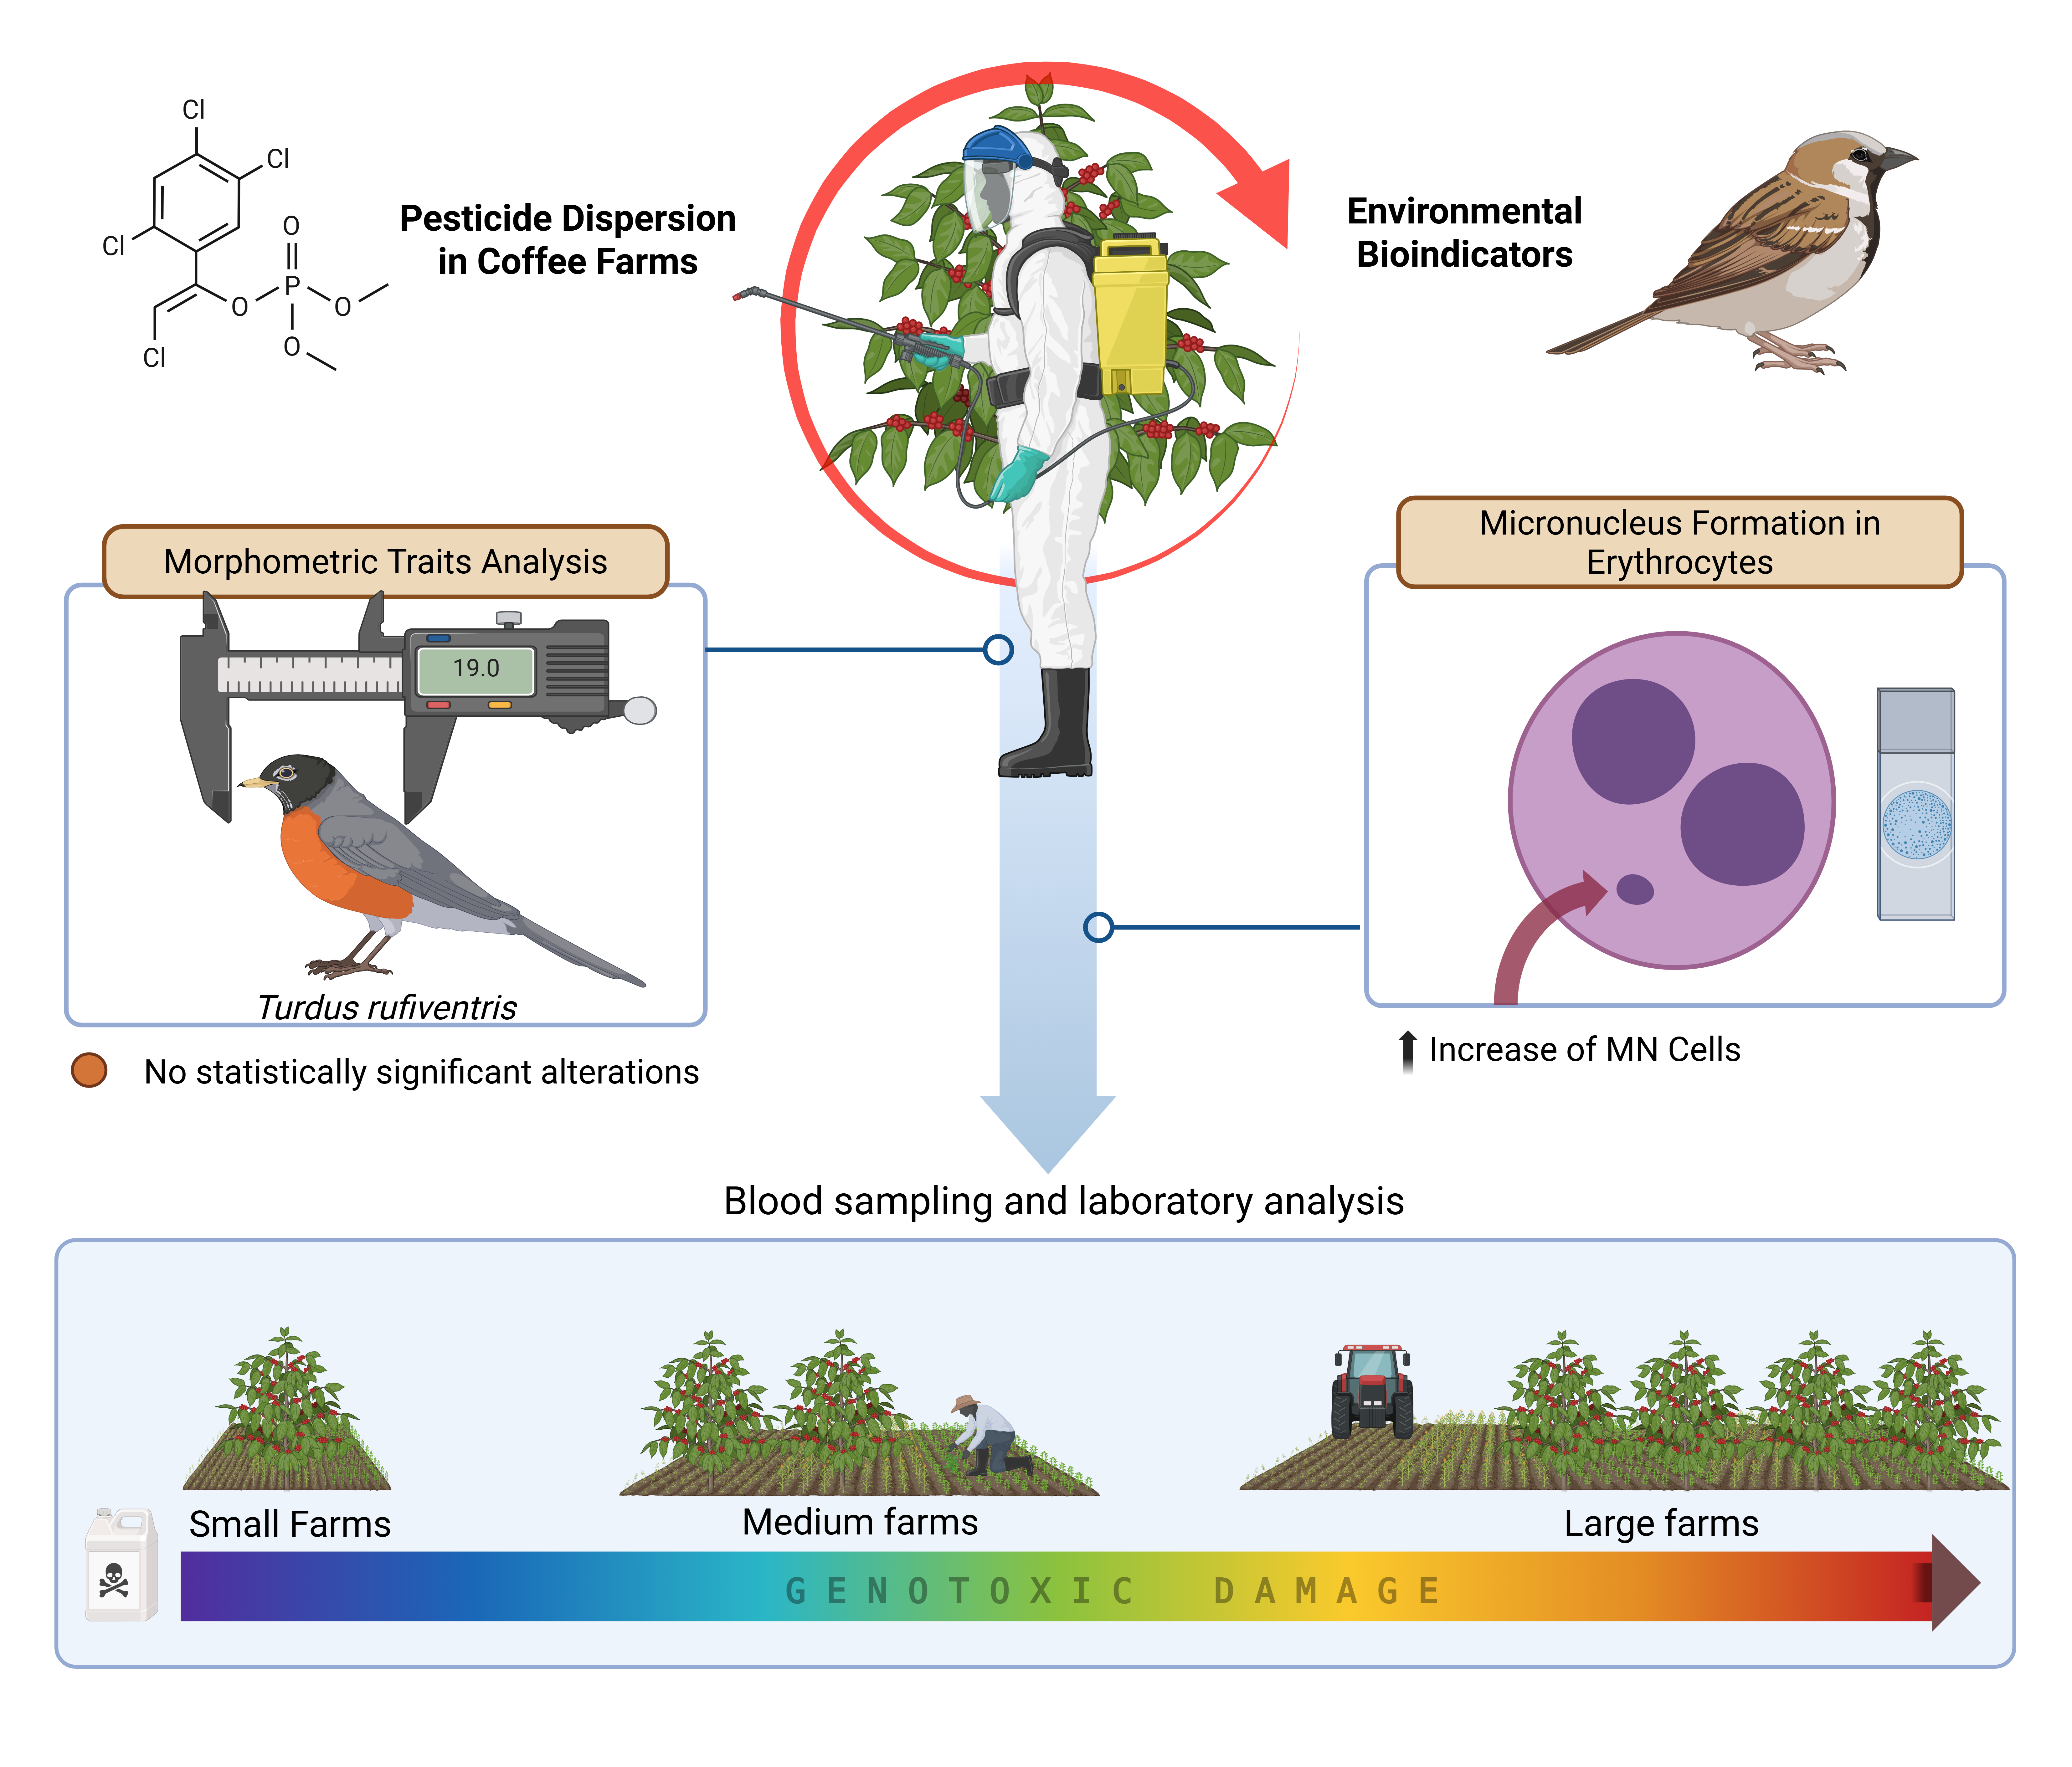
Birds have played a crucial role as environmental monitors through-out history, ranging from the use of canaries to detect methane and carbon monoxide in mines to the decline of raptors and seabirds dur-ing the DDT era due to widespread organochlorine pesticide contami-nation. Owing to their high diversity and capacity for bioaccumulation, birds are widely recognized as effective indicators of environmental change and pollutant exposure. Cytogenetic techniques have been in-creasingly applied over the past two decades to assess micronuclei formation resulting from interactions with clastogenic and aneugenic chemical compounds. The main goals of this study were: (a) to evalu-ate a subset of the bird community in the southeastern Brazilian Cer-rado as potential environmental indicators of pesticide exposure using the erythrocyte micronucleus test; and (b) to investigate possible asso-ciations between bird morphometric traits and micronuclei frequency. Birds were sampled from three groups of coffee farms in the Brazilian Cerrado. Blood samples were collected from 122 individuals via the brachial vein, followed by slide preparation for micronucleus analysis. The species Leptotila rufaxilla, Volatinia jacarina, Galbula ruficauda, Gnorimopsar chopi, Molothrus bonariensis, Passer domesticus, Turdus leu-comelas, and Turdus rufiventris exhibited six or more micronuclei per 1,000 erythrocytes, indicating the highest potential as bioindicators of environmental contamination. Micronuclei frequency in erythrocytes was positively correlated with the use of mixed pesticides, with varia-tion depending on the size of the coffee farms. Although a slight nega-tive biological trend was observed between micronuclei frequency and certain morphometric traits, particularly bill length, no statistically significant correlations were found. Similarly, birds from large farms exhibited a slight reduction in certain morphometric features, though these differences were also not statistically significant. These results highlight the utility of selected bird species as early-warning bioindi-cators for pesticide exposure in tropical agroecosystems.
Keywords:
cytogenetic biomarkers
; micronucleus
; organochlorine pesticides
; sentinel birds
1. Introduction
Bioindicators are widely employed to assess environmental conditions in various fields, including ecology, toxicology, pollution control, agriculture, forestry, and wildlife management [1]. The primary advantages of using organisms as indicator species include their relative ease of identification, straightforward measurement procedures, and low associated costs [2].
Birds have long been recognized as effective environmental bioindicators due to their high sensitivity to ecological disturbances and their ability to reflect contamination levels across multiple biological scales, from cellular alterations to population-level effects [3,4,5,6,7]. This has been demonstrated in multiple contexts, such as the clastogenic effects of food storage in poultry [8], detection of urban pollutants [9], monitoring of Cerrado fragments [10,11], pesticide-related pollution [12], and evaluation of ecotoxicological endpoints [13].
The integration of cytogenetic tools into environmental monitoring has significantly enhanced the utility of birds as bioindicators. Techniques such as the erythrocyte micronucleus test, evaluation of nuclear abnormalities (e.g., binucleated cells, nuclear buds, and nucleoplasmic bridges), and other biomarkers of cellular stress enable the detection of chromosomal damage and genetic instability caused by environmental pollutants [14]. These cytogenetic biomarkers provide valuable insights into the health and genetic integrity of sentinel species [15,16].
The micronucleus test (MNT), a cytogenetic assay developed by [17,18], has been widely applied to evaluate clastogenic and aneugenic effects, initially in mammals. However, recent studies have successfully employed this assay to assess the genotoxic effects of environmental contaminants in birds, particularly heavy metals [10,19,20,21,22].
Combining cytogenetic tools with traditional bioindicator approaches — such as population and community surveys, physiological and behavioral assessments, biotic indices, chemical tissue analyses, and bioassays — improves the accuracy and reliability of environmental monitoring, especially in detecting pesticide-related effects in avian fauna [23].
Pesticides are synthetic chemical compounds broadly used to control disease vectors, agricultural pests, weeds, and other organisms considered harmful to human activity [24]. Their widespread use in rural and urban areas results in chronic exposure and potential health risks. In humans, pesticide exposure typically occurs through ingestion of contaminated food, inhalation, or dermal contact [25].
In birds, exposure to pesticides may be accidental — when birds are not the intended targets — or intentional, such as when poisoned baits are used to eliminate predators [26]. Carbamate pesticides, for instance, have been associated with mortality in birds [26]. Additionally, pesticides can induce a variety of sublethal effects, including cellular damage, metabolic disruption, reproductive and morphological abnormalities, and genotoxicity [27]. These effects may include alterations to eggshell structure [28], DNA damage, and increased micronucleus frequency in erythrocytes [12,29].
The Brazilian Cerrado is recognized as a global biodiversity hotspot, but faces growing threats from agricultural expansion and pesticide-intensive monocultures, particularly in coffee plantations [30]. Despite the advantages of avian bioindicators, field-based monitoring in tropical regions such as the Cerrado remains limited due to logistical challenges and a lack of standardized cytogenetic baselines for wild bird species [31]. By integrating morphometric assessments with cytogenetic biomarkers, this study offers a comprehensive and integrative approach to understanding the sublethal impacts of pesticide exposure on avian communities within tropical agroecosystems.
Accordingly, the objectives of this study were: (1) to assess selected bird communities in the Southeastern Brazilian Cerrado as environmental indicators of pesticide exposure through erythrocyte micronucleus testing; and (2) to explore possible associations between bird morphometric traits and micronucleus frequency.
2. Materials and Methods
2.1. Study Areas
Monte Carmelo, in the state of Minas Gerais, Brazil, was selected as the study site because of its regional economic importance in coffee production and its representativeness of pesticide-intensive agricultural practices in the Brazilian Cerrado. The municipality combines a long-standing tradition of conventional coffee farming with patches of relatively well-preserved native vegetation [32]. This landscape mosaic enables the simultaneous investigation of anthropogenic impacts and baseline ecological conditions within the same ecoregion, making it a strategic location for ecotoxicological studies using avian bioindicators.
The study was conducted on nine coffee farms (Figure 1), located in the surroundings of Monte Carmelo (18°47’56.98”S; 47°19’3.64”W). Farms were classified by productive area as small (≤20 ha), medium (20–50 ha), and large (>50 ha). The average coffee yield across all farms was approximately 50 sacks per hectare (sacks/ha), regardless of total productive area. The farms were distributed across distances ranging from 3 to 30 km from one another, ensuring that each location served as an independent sampling unit with distinct exposure conditions.
All sampled farms maintained a mosaic of native Cerrado and pasture areas, adopting conventional cultivation techniques for Coffea arabica, including chemical fertilization, regular pesticide application, and either mechanized or manual harvesting [33]. All farms hold Rainforest Alliance certification, indicating compliance with standardized environmental practices and pesticide protocols. Despite this certification, a variety of pesticides are applied to coffee crops, following a gradient pattern: larger farms apply greater volumes and a broader diversity of chemical compounds.
The same classes of agrochemicals are used across all farms, with minor variation in active ingredients, concentrations, and application frequencies. Pesticides are applied either manually or mechanically; large farms typically rely on mechanized spraying, which may increase airborne pesticide dispersion. The total volume of pesticide syrup applied—standardized in liters per hectare (L/ha)—was 959.5 L/ha on small farms, 1,209.5 L/ha on medium farms, and 2,210 L/ha on large farms. A detailed breakdown of active ingredients, concentrations, and total volumes per farm category is provided in Table 1.
Additionally, four sampling points (U1 to U4) located at the edge of urban areas were selected to monitor bird movements between agricultural and urban environments. However, none of the 122 birds marked on farms were observed in these urban-edge zones, suggesting limited displacement during the study period.
A negative control area, located within the same ecoregion, was included as a baseline for cytogenetic comparisons. This reference site comprises 130 hectares of well-preserved native Cerrado fragments. A prior survey by [10], conducted in four Cerrado fragments, recorded 93 bird species — approximately four times the species richness observed, on average, on individual study farms —underscoring the high ecological integrity of the control area. Although the reference site shares the same biome, differences in ecological composition and levels of anthropogenic disturbance justify its use as a comparative control.
The climate in Monte Carmelo is classified as tropical savanna (Aw), according to the Köppen-Geiger system, with a rainy season from October to April and a dry season from May to September [34]. Field sampling was conducted in both seasons to account for seasonal variability in bird activity and pesticide use, which typically follows agricultural cycles in the region.
2.2. Data Collection (Birds)
Authorization was obtained from the Brazilian Institute of Environment and Renewable Natural Resources (IBAMA, protocol no. 50528-1) and approval was granted by the Ethics Committee on the Use of Animals in Research (CEUA/UFU, protocol no. 120/15), wild birds were sampled using mist nets measuring 12 m × 3 m. The nets were deployed from 6:00 a.m. to 5:00 p.m., from January to the end of October 2021. Sampling was systematic, with up to seven individuals collected per species among those most frequently captured. All birds were identified to the species level following the taxonomic classification proposed by [35].
Each captured individual was marked with non-toxic paint using a colour scheme to indicate farm type: green for small farms, yellow for medium farms, and red for large farms. This marking method followed the technique proposed by [36] to assess site fidelity and local residence. Additionally, 40 hours of visual observations were conducted across all sampling points to detect marked individuals. No bird marked at a given site was observed at any other site during the study period was observed in any other site, indicating strong site fidelity and limited movement across the sampled landscape, likely influenced by the high local availability of food resources. Species nomenclature followed the standards of the Brazilian Committee of Ornithological Records) [37].
2.3. Blood Samples, Micronuclei Tests, and Staining
A total of 122 birds captured on farms had blood samples collected by puncturing the metatarsal vein with a sterile needle. One to two drops of blood were immediately smeared on microscope slides. At the reference site, an additional 30 individuals were sampled. These individuals belonged to the same species recorded on farms, including Columbina talpacoti, Crotophaga ani, Guira guira, Dacnis cayana, Volatinia jacarina, Elaenia flavogaster, Myiozetetes similis, Tyrannus melancholicus, Galbula ruficauda, Gnorimopsar chopi, Molothrus bonariensis, Mimus saturninus, Passer domesticus, Thamnophilus doliatus, Thamnophilus torquatus, Turdus leucomelas, Turdus rufiventris and Zonotrichia capensis. One slide per bird was prepared directly in the field.
All slides were transported to the Cytogenetics Laboratory of the Federal University of Uberlândia (UFU), Minas Gerais, Brazil, for processing. Slides were fixed with absolute methanol for 10 minutes, followed by staining with 5% aqueous Giemsa solution for 10 minutes, and rinsed with distilled water, following the protocol described by [38].
2.4. Evaluation of Micronuclei
Micronucleus (MN) analysis was conducted on peripheral blood smears prepared from nucleated erythrocytes using a binocular light microscope (Olympus®) equipped with a 100× oil immersion objective. For each bird, two duplicate slides were prepared, and 10,000 intact erythrocytes were examined per individual under standardized optical and staining conditions.
The identification of MN followed the criteria established by [39], whereby a structure was classified as a micronucleus only if: (a) it was clearly separated from the main nucleus without any chromatin connection; (b) it was located in the same focal plane and exhibited similar staining intensity and texture to the primary nucleus; and (c) its diameter ranged between one-tenth and one-third of the main nucleus.
To ensure consistency and minimize bias, all readings were performed blindly by a single trained observer, without knowledge of sample origin. No re-readings were performed, but the use of duplicate slides per bird provided internal consistency to the evaluation. The frequency of micronucleated erythrocytes was expressed as the number of MN per 10,000 cells, allowing direct comparisons across sites and groups.
2.5. Statistical Analysis
Statistical analyses were performed using GraphPad Prism 7.0 (GraphPad Software Inc., San Diego, CA, USA). Data normality was assessed with the Shapiro–Wilk test. As the MN frequency data did not conform to a normal distribution, non-parametric statistical tests were applied.
Differences in MN frequencies among bird groups from small, medium, and large farms, as well as the reference site, were evaluated using the Kruskal–Wallis test, followed by Dunn’s post hoc test for pairwise comparisons. To examine the association between MN frequency and pesticide application intensity (L/ha), Spearman’s rank correlation coefficient was calculated.
Statistical significance was set at p < 0.05. Results are presented as medians with interquartile ranges (IQR), which is appropriate for non-parametric datasets.
3. Results
Photographs of four representative bird species commonly observed in the study areas — Galbula ruficauda, Leptotila rufaxilla, Volatinia jacarina, and Turdus rufiventris — are shown in Figure 2.
A total of 82 individuals from 21 bird species were sampled across coffee farms, with an additional 30 individuals sampled from a reference area. Micronucleus (MN) frequency in erythrocytes ranged between 0 and 8 per 10,000 cells. All birds sampled from the control area showed zero MN. In contrast, birds captured on farms exhibited variable frequencies, with MN detected in 32 of the 82 sampled individuals (39%). Among these, 14 individuals (17%) showed high frequencies (≥5 MN per 10,000 cells), predominantly in medium and large farms.
Median MN frequencies were 0 for the control area, 1 for small farms, 3 for medium farms, and 5 for large farms. Kruskal–Wallis analysis confirmed significant differences among groups (H = 70.87; p < 0.0001), with post hoc tests revealing that birds from medium and large farms differed significantly from the control group (p < 0.05).
A significant positive correlation was also observed between the volume of pesticides applied (L/ha) and MN frequency across farms (Spearman’s r = 0.71; p = 0.03) (Figure 3).
Several species showed notably elevated MN frequencies, including Leptotila rufaxilla (granivore-frugivore, ground forager), Volatinia jacarina (granivore-insectivore), Galbula ruficauda (insectivore), Gnorimopsar chopi (omnivore), Molothrus bonariensis (granivore-insectivore), Passer domesticus (omnivore), Turdus leucomelas (frugivore-insectivore), and Turdus rufiventris (frugivore-insectivore), which presented six or more MN per 10,000 cells in one or more individuals (Table 2). Although individual variation was present, these species tended to be more affected than others.
Notably, most of the individuals with high MN values belonged to insectivorous or omnivorous guilds, suggesting potential differences in dietary exposure to contaminants, either directly via contaminated food items or indirectly via trophic accumulation. Granivorous birds such as Volatinia jacarina and Leptotila rufaxilla also showed elevated MN frequencies, possibly due to ingestion of pesticide-contaminated seeds. These ecological guild assignments, along with morphometric traits such as bill length, are detailed in Table 3.
Although a slight negative biological trend was observed between MN frequency and certain morphometric traits — particularly bill length — no statistically significant correlations were found. This was confirmed by Spearman correlation analyses across morphometric parameters, which showed weak or non-significant relationships with MN frequency (Figure 4).
Similarly, birds from large farms exhibited a slight reduction in some morphometric features, such as bill length and weight, though once again, these differences were not statistically significant. Comparative analysis of these traits across farm size categories is illustrated in Figure 5.
4. Discussion
The results of this study indicate that various bird species can potentially serve as effective bioindicators of environmental genotoxicity. While some individuals presented zero micronuclei (MN), this may reflect an efficient physiological system for removing altered erythrocytes rather than a true absence of genotoxic effects [40]. Species with higher MN frequencies, such as Galbula ruficauda, Leptotila rufaxilla, Volatinia jacarina, and Turdus rufiventris, demonstrated particular promise as biomonitoring candidates due to their consistent presence across sites and elevated cytogenetic responses [41,42].
Surprisingly, we found no significant correlation between MN frequency and bird morphometric traits such as body mass, wing length, or tail length. Although not statistically significant, variations in bill length may suggest high MN levels. This suggests a possible link between dietary habits and genotoxic exposure, particularly in birds that forage on small grains or insects, which are more likely to accumulate pesticide residues [12]. These findings align with ecotoxicological studies across vertebrate classes, including fish [43], amphibians [44], reptiles [42], and even humans [45,46], reinforcing the sensitivity and applicability of the micronucleus test in environmental assessments.
The vulnerability of feeding guilds was further confirmed in this study. Insectivorous and granivorous species appear more susceptible to genotoxic agents, likely due to trophic-level pesticide exposure, either by consuming contaminated insects or grains or by foraging in soils treated with agrochemicals. This trophic exposure pathway highlights the importance of integrating feeding ecology into biomonitoring frameworks and helps explain interspecific variability in MN frequency observed even within the same habitat type [12].
Although birds from large farms showed significantly higher MN frequencies than those from smaller farms and the control site, these cytogenetic effects did not result in statistically significant morphometric alterations. One hypothesis is that energy demands associated with the removal of damaged cells may compete with developmental processes, leading to subtle anatomical changes over time [47]. However, these effects may require chronic exposure over longer periods to become detectable. It is also worth noting that the baseline frequency of MN in avian erythrocytes is typically lower than in mammals or fish, which requires species-specific thresholds for accurate genotoxic assessments [48,49].
This study contributes to a growing body of literature emphasizing the utility of wild birds in environmental biomonitoring. Earlier works focused on single-species models, such as gulls or parrots [8,48,49,50], whereas recent studies have expanded this approach to encompass avian communities [10,11,12]. Our findings support the argument that bird diversity enhances biomonitoring robustness by capturing interspecific differences in exposure and sensitivity to environmental stressors.
Additionally, the results of this study reinforce the need for caution in interpreting cytogenetic responses as direct reflections of health risks across species. Baseline MN values may vary due to physiological or ecological traits, and sample sizes are often insufficient to draw species-specific conclusions. Moreover, field studies like ours are inherently limited by the unpredictable nature of species capture, which may lead to uneven representation across habitats. As such, proposals for bioindicator species must be evaluated for feasibility and consistency across monitoring efforts. The need for large sampling efforts and the possibility of species absence at a given site can compromise indicator reliability as bioindicators in long-term monitoring frameworks.
Finally, this work aligns with global efforts to assess and mitigate the impacts of intensive agricultural practices on biodiversity. The strong correlation between MN frequency and pesticide use highlights the cytogenetic burden imposed by large-scale monocultures and reinforces the relevance of Sustainable Development Goals (SDGs), especially SDG 15 (Life on Land) and SDG 12 (Responsible Consumption and Production). As recently emphasized by [13,23], integrating biomonitoring indicators into national biodiversity strategies is essential for mitigating the silent erosion of ecosystem services caused by pollution and habitat simplification.
5. Conclusions
The frequency of micronuclei in erythrocytes was positively correlated with a mixture of pesticides used on coffee farms, in a manner dependent on farm size. Although there was a slight negative biological trend between MN frequency and certain morphometric traits, particularly bill length, these associations were not statistically significant. Similarly, birds from larger farms exhibited a subtle reduction in some morphometric measurements, but again, no statistically significant differences were detected. These findings support the integration of cytogenetic biomarkers into environmental monitoring protocols within coffee-producing landscapes.
Author Contributions
Author Contributions: HNS: Conceptualization, Investigation, Data curation, Methodology, Software, Writing – original draft preparation. EOCJ: Conceptualization, Methodology, Investigation, Software, Data curation, Writing – original draft preparation, Writing – review and editing, Resources, Visualization. MVBMS: Writing – review and editing, Funding acquisition. CFC: Writing – review and editing. CRM: Writing – review and editing. BBP: Validation, Writing – review and editing, Formal analysis. SM: Project administration, Supervision. All authors have read and agreed to the published version of the manuscript.
Funding
The financial support for publication was provided by the Minas Gerais State University (Edital PROPPG Nº 02/2025—PROPUBLIC/UEMG).
Data Availability Statement
We encourage all authors of articles published in MDPI journals to share their research data. In this section, please provide details regarding where data supporting reported results can be found, including links to publicly archived datasets analyzed or generated during the study. Where no new data were created, or where data is unavailable due to privacy or ethical restrictions, a statement is still required. Suggested Data Availability Statements are available in section “MDPI Research Data Policies” at https://www.mdpi.com/ethics.
Conflicts of Interest
The authors declare no conflicts of interest.
References
- Rattner, B. A.; Bean, T. G.; Beasley, V. R.; Berny, P.; Eisenreich, K. M.; Elliott, J. E.; Eng, M. L.; Fuchsman, P. C.; King, M. D.; Mateo Soria, R.; Meyer, C. B.; O’Brien, J. M.; Salice, C. J. Wildlife ecological risk assessment in the 21st century: promising technologies to assess toxicological effects. Integr. Environ. Assess. Manag. 2023, 20, 725-748. [CrossRef]
- Kessler, M.; Abrahamczyk, S.; Bos, M.; Buchori, D.; Putra, D.; Gradstein, S.; Höhn, P.; Kluge, J.; Orend, F.; Pitopang, R.; Saleh, S.; Schulze, C.; Sporn, S. G.; Steffan-Dewenter, I.; Tjitrosoedirdjo, S.; Tscharntke, T. Cost-effectiveness of plant and animal biodiversity indicators in tropical forest and agroforest habitats. J. Appl. Ecol. 2010, 48(2), 330-339. [CrossRef]
- Temple, S.A. Can Birds be indicators of Environmental Hazards? The Passenger Pigeon 1988 50 (4), 311-313.
- Koskimies, P. Birds as a tool in environmental monitoring. Ann. Zool. Fennici. 1989 26, 153-166.
- Burger, J.; Gochfeld, M. Marine birds as sentinels of environmental pollution. Ecohealth 2004, 1. [CrossRef]
- Fa, E.; Po, E.; Edet, D. Paramount roles of wild birds as bioindicators of contamination. Int. J. Avian Wildl. Biol. 2017, 2(6). [CrossRef]
- Mansfield, I.; Reynolds, S. J.; Lynch, I.; Matthews, T. J.; Sadler, J. P. Birds as bioindicators of plastic pollution in terrestrial and freshwater environments. Environ. Pollut. 2024, 330, p. 123790. [CrossRef]
- Saleh, K.; Sarhan, M. Clastogenic analysis of chicken farms using micronucleus test in peripheral blood. J. Applied Sci. Res. 2007, 3 (12), 646-1649.
- Sheta, B.; El-Qenawy, I.; El-Gammal, H. Utilization of birds of different mating system behavior and feeding habits as a bioindicator for urbanization lead pollution. Catrina Int. J. Environ. Sci. 2022, 26, 67-73. [CrossRef]
- Baesse C.Q.;Tolentino V.C.M.; Silva-Marcos A.; Silva-Andrade A.; Ferreira G.A.; Paniago L.P.M.; Nepomuceno J.C.; Melo C. Micronucleus as biomarker of genotoxicity in birds from Brazilian Cerrado. Ecotoxicol. Environ. Saf. 2015, 115, 223–228.
- Baesse, C.Q.; Tolentino, V.C.; Morelli, S.; Melo, C. Effect of urbanization on the micronucleus frequency in birds from forest fragments. Ecotoxicol. Environ. Saf. 2019, 171, 631–637. [CrossRef]
- Souto, H.N.; Campos Júnior, E.O.; Campos, C.F.; Rodrigues, T.S.; Pereira, B.B.; Morelli, S. Bioindicatoring birds: the use of a micronuclei test as a tool to assess environmental pollutants on coffee farms in southeast Brazil. Environ. Sci. Pollut. Res. 2018, 25, 24084-24092.
- Cao, X.; Zheng, X.; Bai, F.; Wu, Y.; Lei, W.; Zhang, Z.; Chen, L.; Huang, W.; Li, X.; Wang, H.; Zhang, Y.; Hu, G.; Mai, B. Pollutant exposure for Chinese wetland birds: ecotoxicological endpoints and biovectors. ACS ES&T Water, 2024, 4, 2076-2087. [CrossRef]
- Ribeiro, P. V. A.; Baesse, C. Q.; Cury, M. C.; Melo, C. D. Leukocyte profile of the helmeted manakin, antilophia galeata (passeriformes: pipridae) in a cerrado forest fragment. Zoologia 2020, 37, 1-9. [CrossRef]
- Tomazelli, J.; Rodrigues, G. Z. P.; Franco, D.; de Souza, M. S.; Burghausen, J. H.; Panizzon, J.; Kayser, J. M.; Loiko, M. R.; Schneider, A.; Linden, R.; Gehlen, G. Potential use of distinct biomarkers (trace metals, micronuclei, and nuclear abnormalities) in a heterogeneous sample of birds in southern Brazil. Environ. Sci. Pollut. Res. Int. 2021, 29, 14791–14805. [CrossRef]
- Silveira, E. D. R.; Benvindo Souza, M.; Assis, R. A.; Santos, C. G. A.; Amorim, N. P. L.; Borges, R. E.; de Melo, C.; de Souza Santos, L. R. Micronucleus and different nuclear abnormalities in wild birds in the Cerrado, Brazil. Environ. Sci. Pollut. Res. Int. 2022, 29, 14279–14287. [CrossRef]
- Heddle, J.A. A rapid in vivo test for chromosomal damage. Mutat. Res. 1973 18, 187–190.
- Schmid, W. The micronucleus test. Mutat. Res. 1975, 31, 9-5.
- Cid, F. D.; Gatica-Sosa, C.; Antón, R.; Caviedes-Vidal, E. Contamination of heavy metals in birds from embalse la florida (San Luis, Argentina). J. Environ. Monit. 2009, 11, 2044. [CrossRef]
- Markowski, M.; Kaliński, A.; Skwarska, J.; Wawrzyniak, J.; Bańbura, M.; Markowski, J.; Zieliński, P.; Bańbura, J. Avian feathers as bioindicators of the exposure to heavy metal contamination of food. Bull. Environ. Contam. Toxicol. 2013, 91, 302-305.
- Olayemi, O. A.; Taiwo, A. A.; Jagun, J. A. Micronucleus as a biomarker of genotoxicity in village weaver bird (Ploceus cucullatus). World’s Vet. J 2014, 4, 48–53.
- Vargiya, D.; Jethva, B.; Pandya, D. J. Feather heavy metal contamination in various species of waterbirds from Asia: a review. Environ. Monit. Assess. 2021, 194. [CrossRef]
- Peris, A.; Baos, R.; Martínez, A.; Sergio, F.; Hiraldo, F.; Eljarrat, E. Pesticide contamination of bird species from Doñana National Park (southwestern Spain): temporal trends (1999–2021) and reproductive impacts.SSRN Electron. J. 2022, 323, 121240. [CrossRef]
- Zhou, W.; Li, M.; Achal, V. A comprehensive review on environmental and human health impacts of chemical pesticide usage. Emerg. Contam. 2025, 11. [CrossRef]
- Ghisari, M.; Long, M.; Tabbo, A.; Bonefeld-Jorgensen, E. C. Effects of currently used pesticides and their mixtures on the function of thyroid hormone and aryl hydrocarbon receptor in cell culture. Toxicol. Appl. Pharmacol. 2015, 284, 292-303.
- Ogada, D.L. The power of poison: pesticide poisoning of Africa’s wildlife. Ann. N. Y. Acad. Sci. 2014, 1322(1), 1–20.
- Katagi, T.; Fujisawa, T. Acute toxicity and metabolism of pesticides in birds. J. Pestic. Sci. 2021, 46, 305–321. [CrossRef]
- Jayakumar, S.; Muralidharan, S.; Dhananjayan, V. Organochlorine Pesticide Residues Among Colonial Nesting Birds in Tamil Nadu, India: A Maiden Assessment from Their Breeding Grounds. Arch. Environ. Con. Tox. 2020, 78, 555–567. [CrossRef]
- Humann-Guilleminot, S.; Clément, S.; Desprat, J.; Binkowski, L. J.; Glauser, G.; Helfenstein, F. Large-scale survey of house sparrows feathers reveals ubiquitous presence of neonicotinoids in farmlands. Sci. Total Environ. 2019, 660, 1091-1097.
- Pompeu, J.; Assis, T. O.; Ometto, J. P. Landscape changes in the Cerrado: Challenges of land clearing, fragmentation and land tenure for biological conservation. Sci. Total Environ. 2024, 906, 167581. [CrossRef]
- Borges-Almeida, K.; Benvindo-Souza, M.; Martello, F.; Mathias, L.; de Melo e Silva, D.; Collevatti, R. G. Habitat fragmentation mediates the frequency of cytogenetic endpoints in small non-flying mammals in agriculture landscapes in Cerrado. Environ. Sci. Pollut. Res. Int. 2025, 32, 16432–16445. [CrossRef]
- Zampiroli, J. A.; Ferraudo, A. S.; Oliveira, R. B.; Ferreira, M. C. Application technology for chemically controlling coffee leaf miner in the Cerrado of Minas Gerais State. Rev. Bras. Ciênc. Agrár. 2017, 12, 97–103. [CrossRef]
- Silva, F. C.; Pereira, A. A.; Reis, P. R.; Carvalho, G. R.; Silva, E. A. A.; Oliveira, A. C. B.; Souza, J. M. Genetic diversity and agronomic performance of Coffea arabica accessions in the Cerrado Mineiro. Agronomy 2025, 15, 222. [CrossRef]
- Rosa, R.; Lima, S.C.; Assunção, L.W. Abordagem preliminar das condições climáticas de Uberlândia (MG). Socied. Nat. 1991, 3, 91-108.
- Sigrist, T. Guia de campo Avis Brasilis: Avifauna brasileira, 1st ed. São Paulo: Avis Brasilis. 2005.
- Rudkin C.; Sewart G.D. Behaviour of hens in cages: a pilot study using video tapes. A report for the Rural Industries Research and Development Corporation (RIRDC). Queensland 2003, 40, 102.
- 37. CBRO – Comitê Brasileiro de Registros Ornitológicos, 2015. http://www.cbro.org.br/Piacentini%20et%20al%202015%20RBO.pdf.
- Palhares, D; Grisolia, CK. Comparison between the micronuclei frequencies of kidney and gill erythrocytes in tilapia fish, following mitomycin C treatment. Gen. Mol. Biol. 2002, 25, 281-284.
- Fenech, M. The in vitro micronucleus technique. Mutat. Res. 2000, 455, 81-95.
- Ramírez-Muñoz, M.P.; Zuñiga, G.; Bugarín, O.T.; Portilla, E.; García-Martinez, D.; Ramos, A.; Cantú, J.M.; Sánchez-Corona, J. Evaluation of the Micronucleus Test in Peripheral Blood Erythrocytes by Use of the Splenectomized Model. Labor. Ann. Sci. 1999, 49, 418-420.
- Zúñiga-González, G.; Torres-Bugarín, O.; Zamora-Pérez, A.; Gomez-Meda, B. C.; Ramos-Ibarra, M. L.; Martínez-González, S.; González-Rodriguez, A.; Luna-Aguirre, J.; Ramos-Mora, A.; Ontiveros-Lira, D.; Gallegos-Arreola, M. P. Differences on the number of micronucleated erythrocytes among young and adult animals including humans. Spontaneous micronuclei in 43 species. Mutat. Res. 2001, 494, 161-167.
- Polleta, G. L.; Larriera, A.; Kleinsorge, E.; Mudry, M. D. Caiman latirostris (broad-snouted caiman) as a sentinel organism for genotoxic monitoring: Basal values determination of micronucleus and comet assay. Mutat. Res. Mol. Mech. Mutagen. 2008, 650(2), 202-209.
- Ismail, M.; Khan, Q. M.; Ali, R.; Ali, T.; Mobeen, A. Genotoxicity of chlorpyrifos in freshwater fish Labeo rohita using Alkaline Single-Cell Gel Electrophoresis (Comet) assay. Drug. Chem. Toxicol. 2014, 37, 466-471.
- Cruz-Esquivel, A.; Viloria-Rivas, J.; Marrugo-Negrete, J. Genetic damage in Rhinella marina populations in habitats affected by agriculture in the middle region of the Sina River, Colombia. Environ. Sci. Pollut. Res. 2017, 24, 27392-27401.
- Dutta, S.; Bahadur, M. Cytogenetic analysis of micronuclei and cell death parameters in epithelial cells of pesticide exposed tea garden workers. Toxicol. Mech. Methods. 2016, 26, 627-634.
- Jacobsen-Pereira, C.H.; Santos, C.R.; Maraslis, F.T.; Pimental, L.; Feijó, A.J.L., Silva-Ioara, C., Medeiros, G.S., Zeferino, R.C., Pedrosa, R.C., Maluf. S.W. Markers of genotoxicity and oxidative stress in farmers exposed to pesticides. Ecotoxiol. Environ. Saf. 2018, 148, 177-183.
- Begon, M.C.R.; Townsend E.; Harper L. Ecologia de Indivíduos a Ecossistemas. 4ªed, Artmed, Porto Alegre, 2007.
- Stoncius, D. Spontaneus micronuclei in enbryos of the Black-headed Gull (Larus ridibundus, L.) populations. Ekol. 2003, 1, p.63-66.
- Gómez-Meda, B. C.; Zamora-Perez, A. L.; Luna-Aguirre, J.; González-Rodríguez, A.; Luisa Ramos-Ibarra, M.; Torres-Bugarín, O.; Zúñiga-González, G. M. Nuclear abnormalities in erythrocytes of parrots (Aratinga canicularis) related to genotoxic damage. Avian Pathology. 2006, 35(3), 206–210. [CrossRef]
- Kursa, M; Bezrukov, V. Health status of an Antartic top predator: micronuclei frequency and White blood cell differentials in the South Polar Skua (Catharacta maccorminck). Polarforschung. 2007, 37, 1-5.
Figure 1.
Geographic location of study sites near Monte Carmelo, Minas Gerais, Brazil. Nine coffee farms were selected based on productive capacity and classified into three categories: small (S1–S3), medium (M1–M3), and large (L1–L3). Four urban observation points (U1–U4) were established at the edges of the urban zone to monitor bird movement across rural–urban boundaries. The Negative Control Area represents a preserved Cerrado fragment used as a reference site for comparative cytogenetic analysis. Insets show the location within Brazil and the State of Minas Gerais.
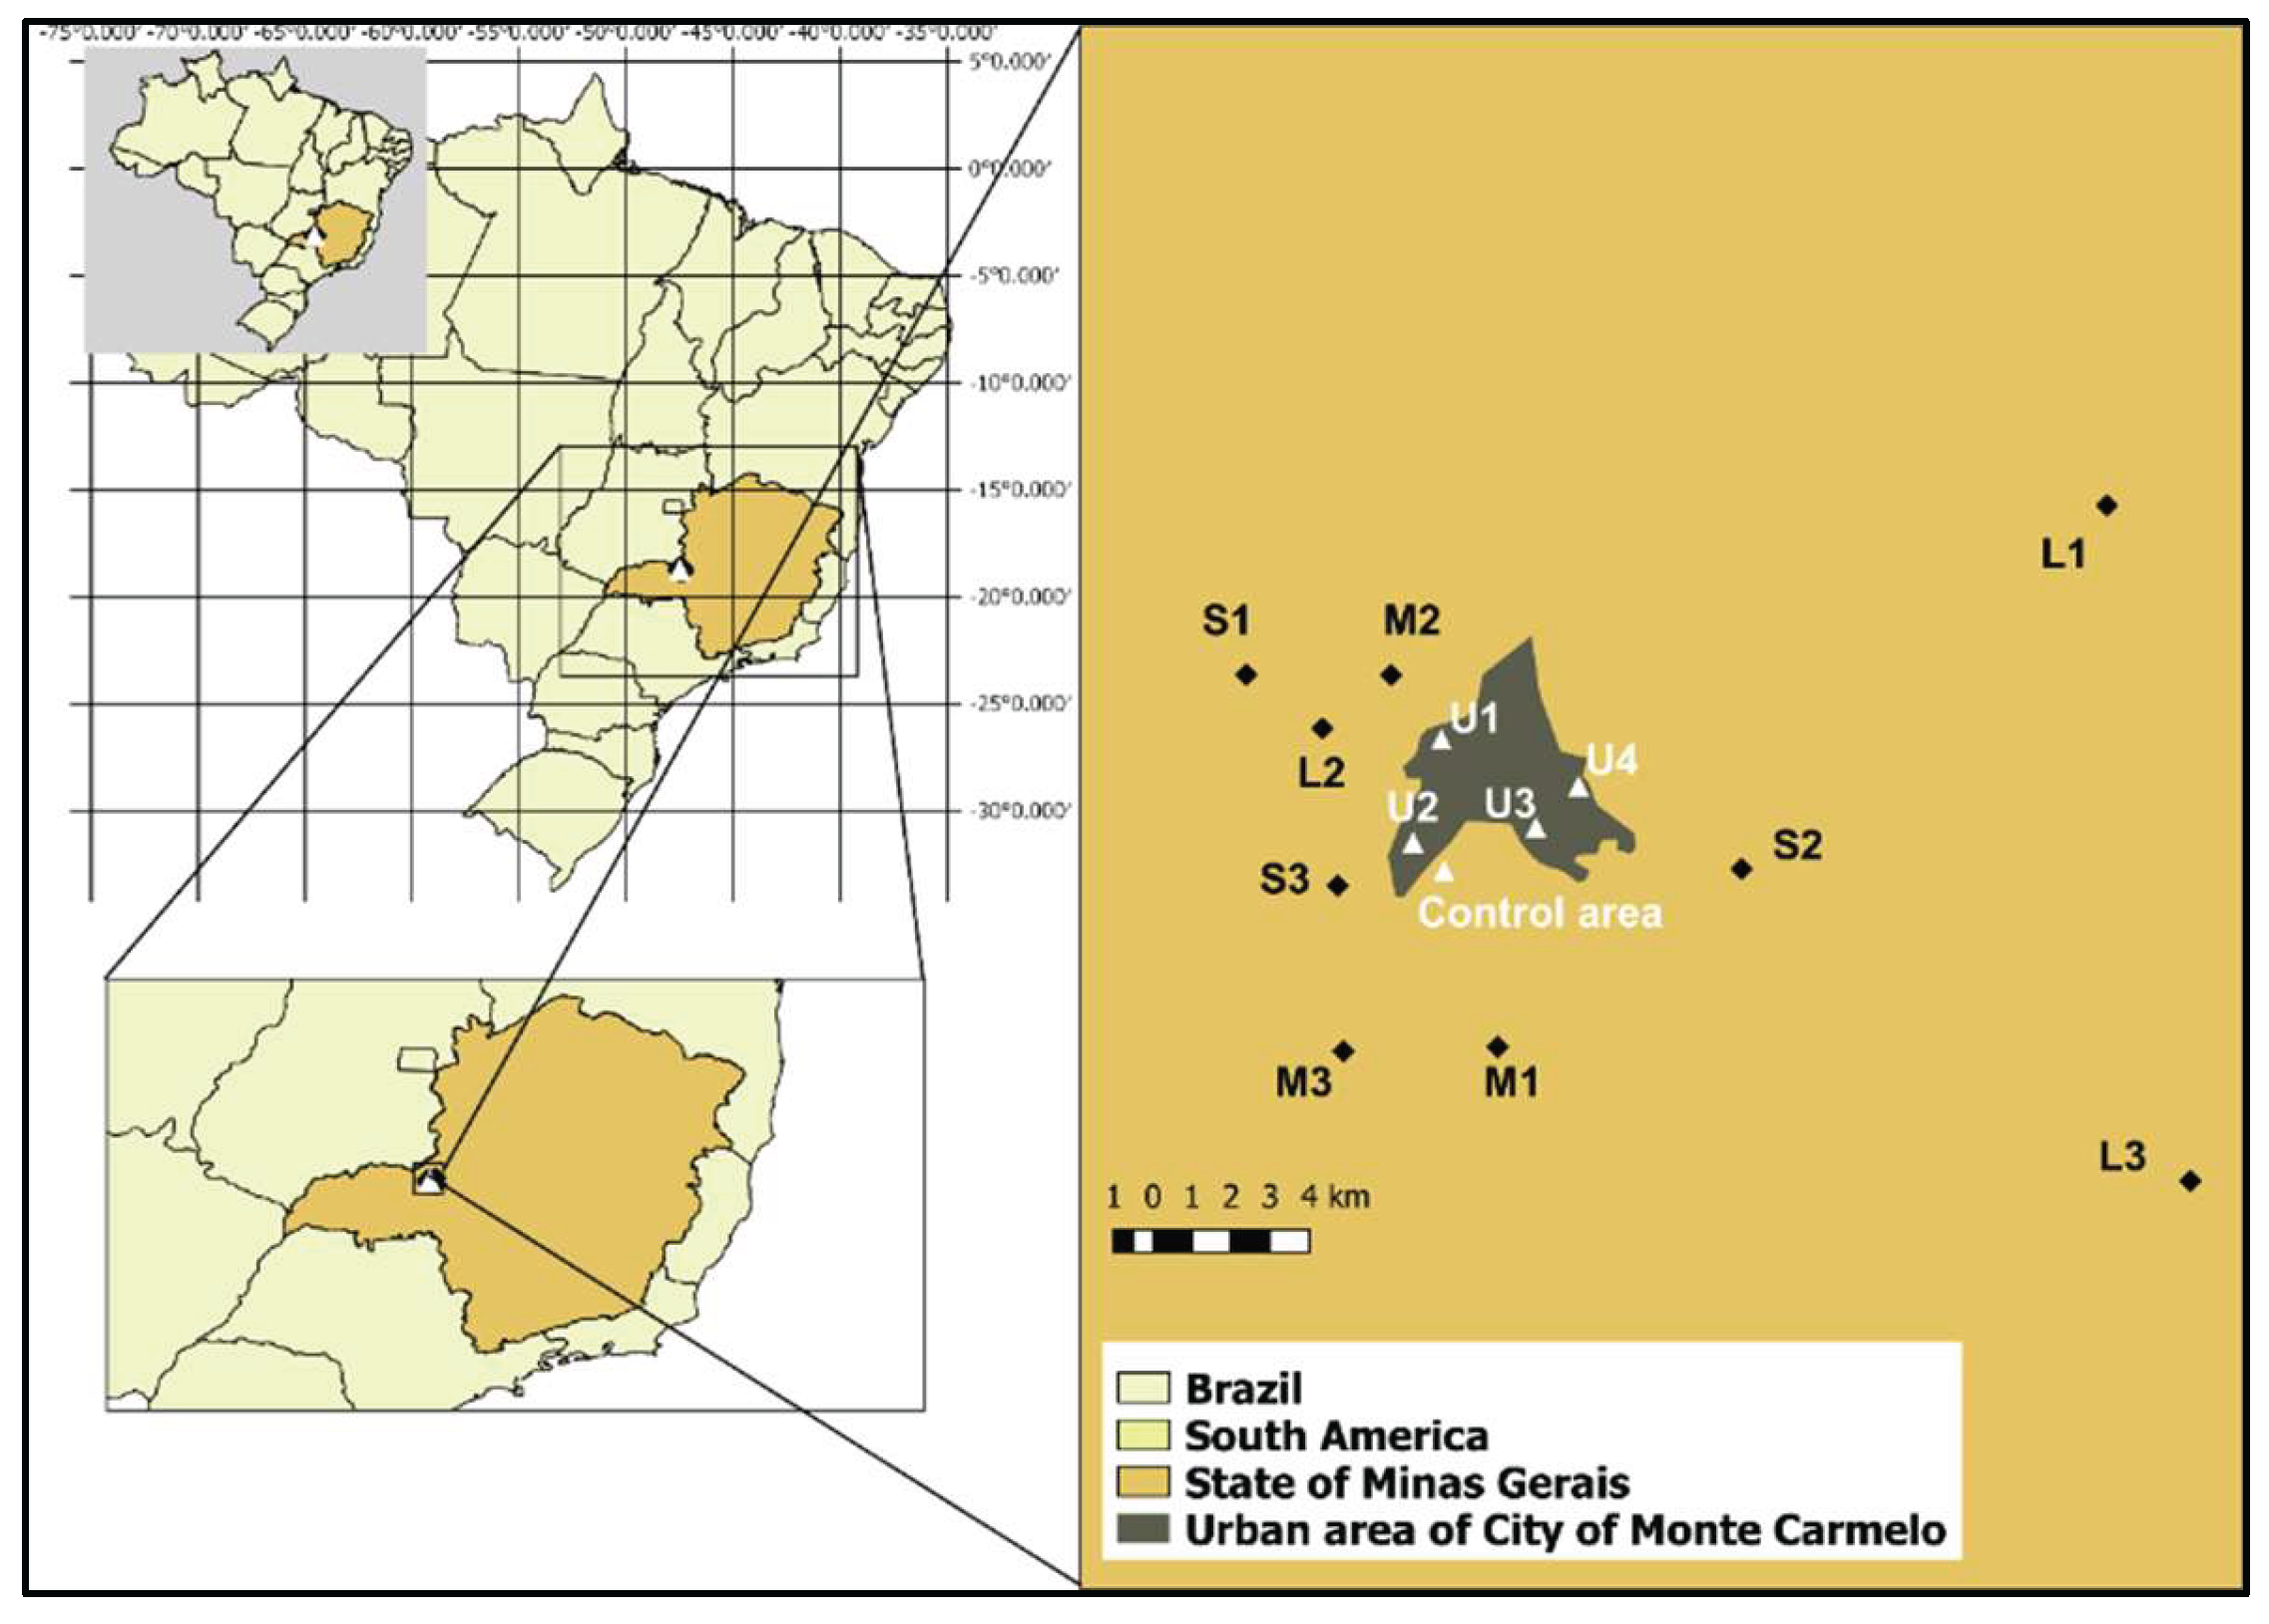
Figure 2.
Photographs of four species (A. G. ruficauda, B. L. rufaxilla, C. V. jacarina, D. T. rufiventris) found in the farms (Monte Carmelo, Minas Gerais, Brazil), very frequently.
Figure 2.
Photographs of four species (A. G. ruficauda, B. L. rufaxilla, C. V. jacarina, D. T. rufiventris) found in the farms (Monte Carmelo, Minas Gerais, Brazil), very frequently.
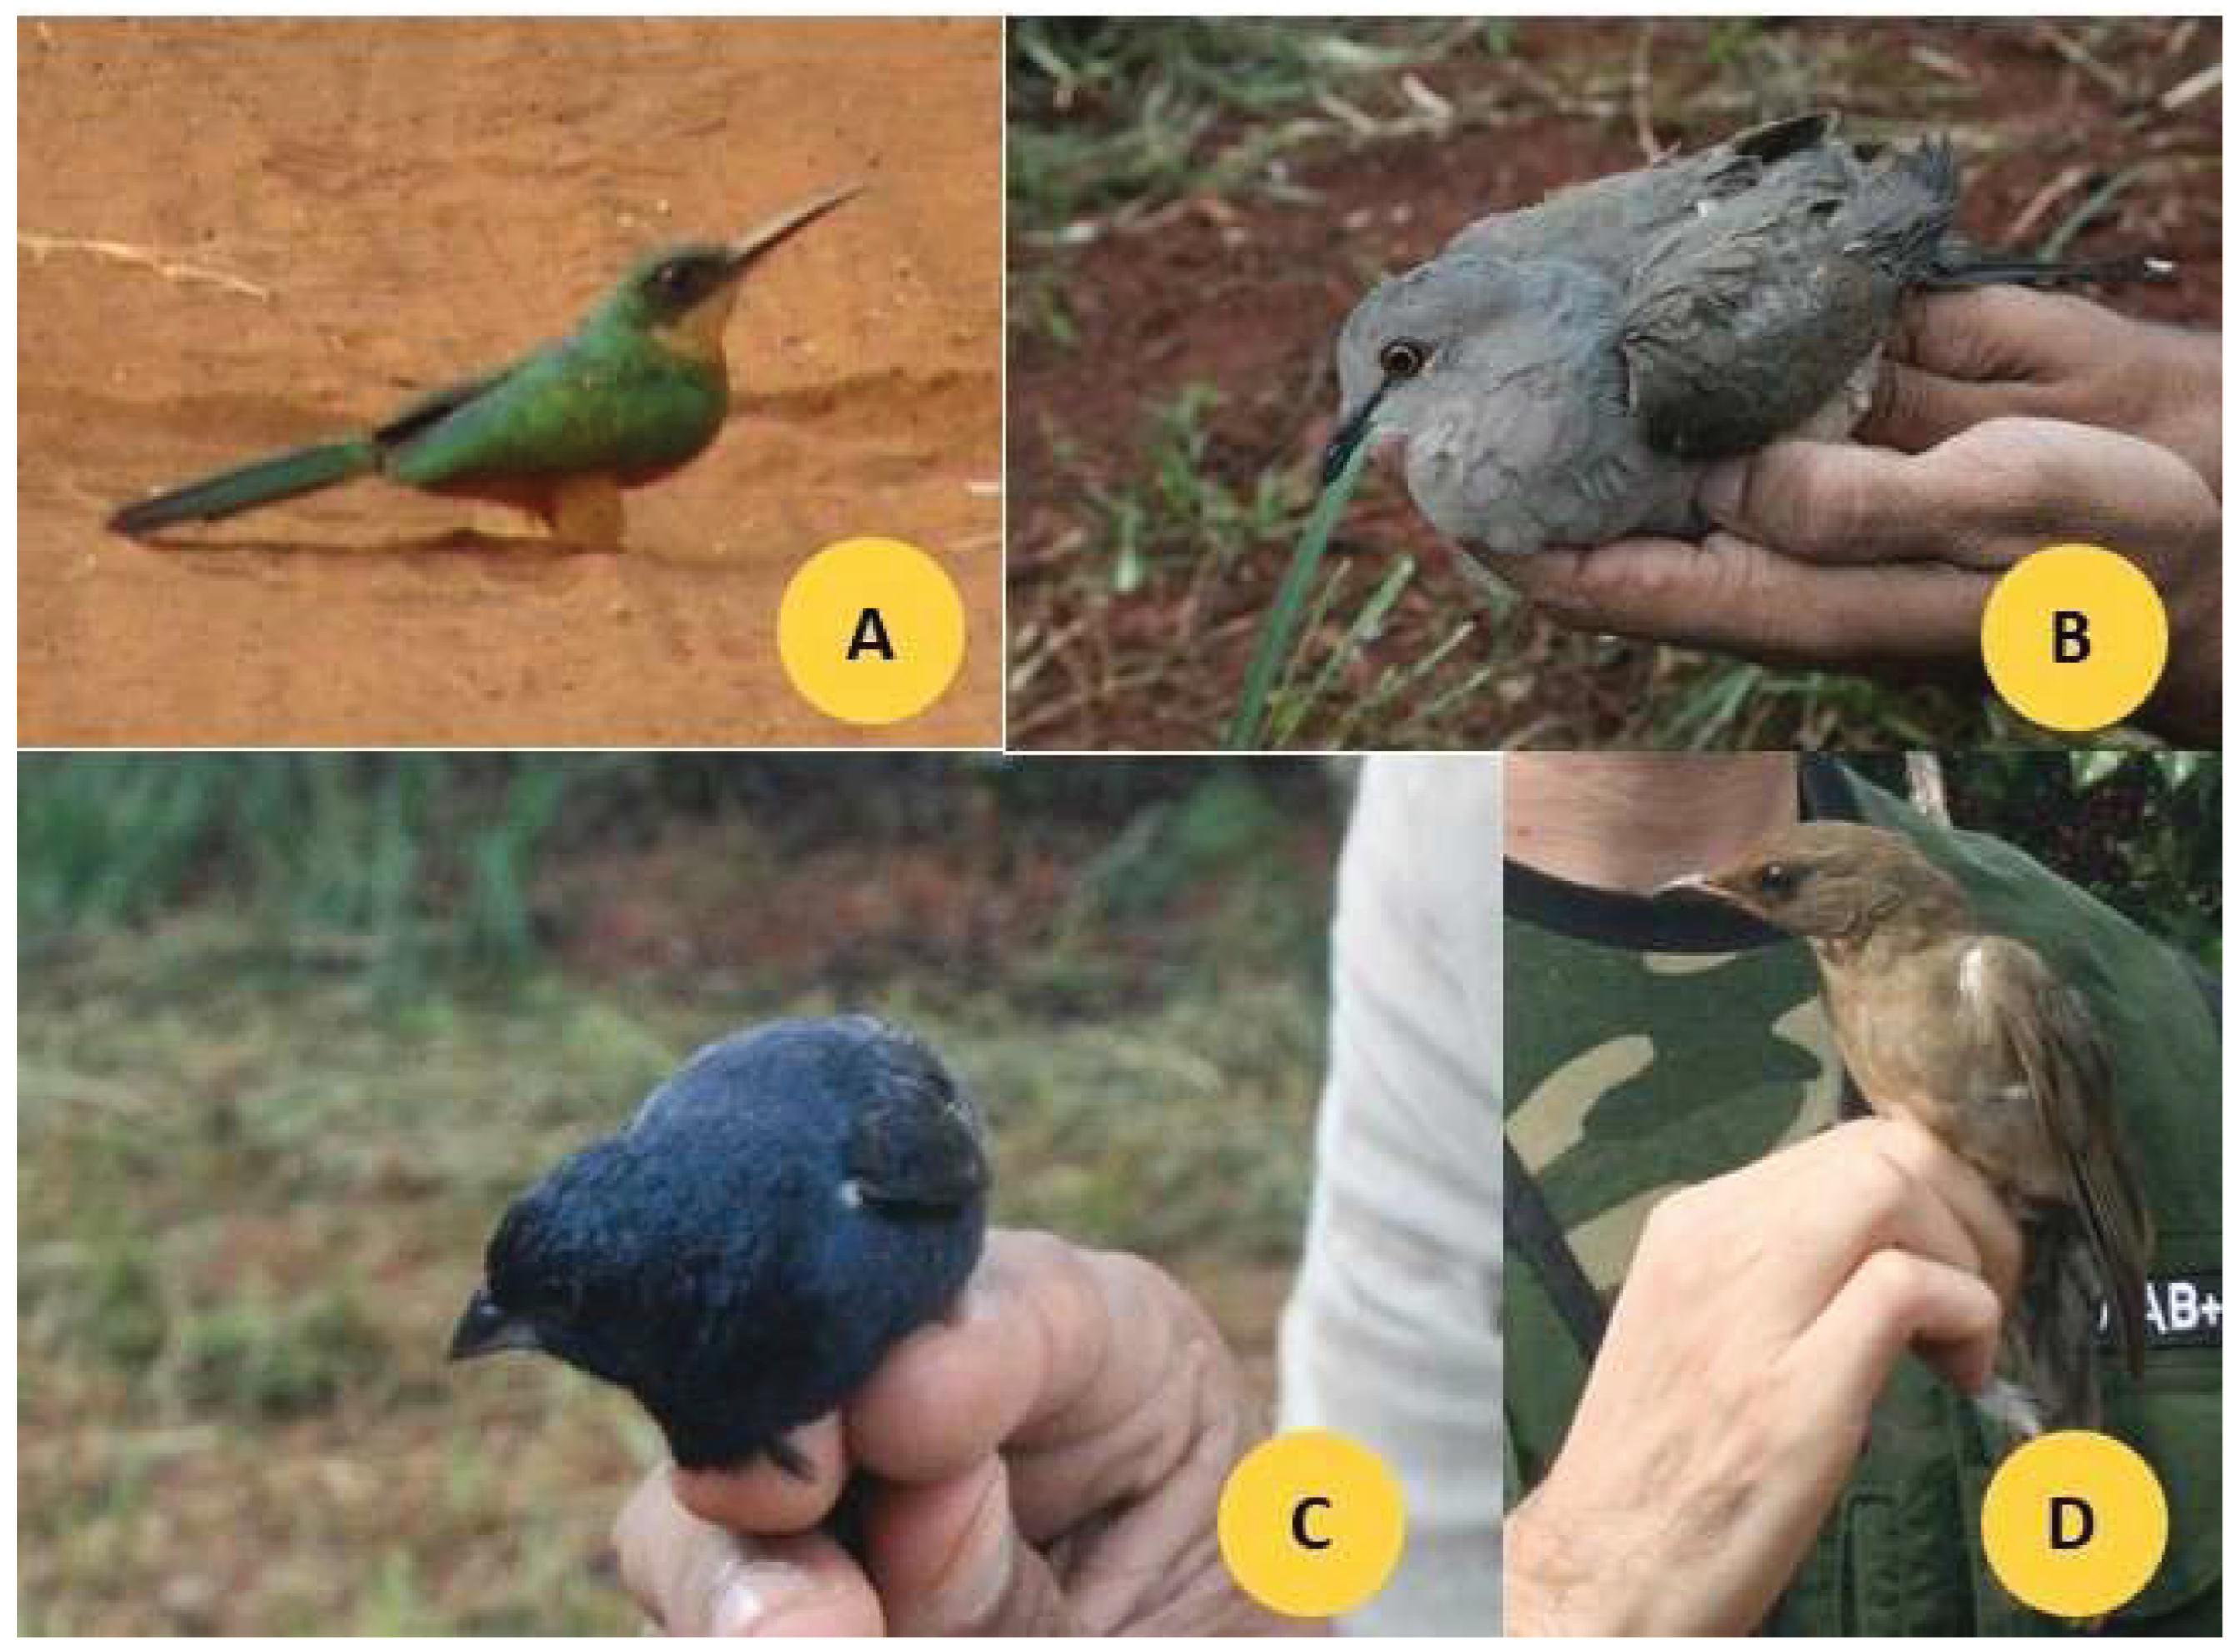
Figure 3.
Spearman Correlation between Log10 of Mix of Pesticides Concentration and MN Frequency (r = 0.71; p = 0.03). These calculations were performed after first computing the mean of side-by-side replicates, and then analyzing those means. Bars represent the standard deviation of MN Frequency.
Figure 3.
Spearman Correlation between Log10 of Mix of Pesticides Concentration and MN Frequency (r = 0.71; p = 0.03). These calculations were performed after first computing the mean of side-by-side replicates, and then analyzing those means. Bars represent the standard deviation of MN Frequency.
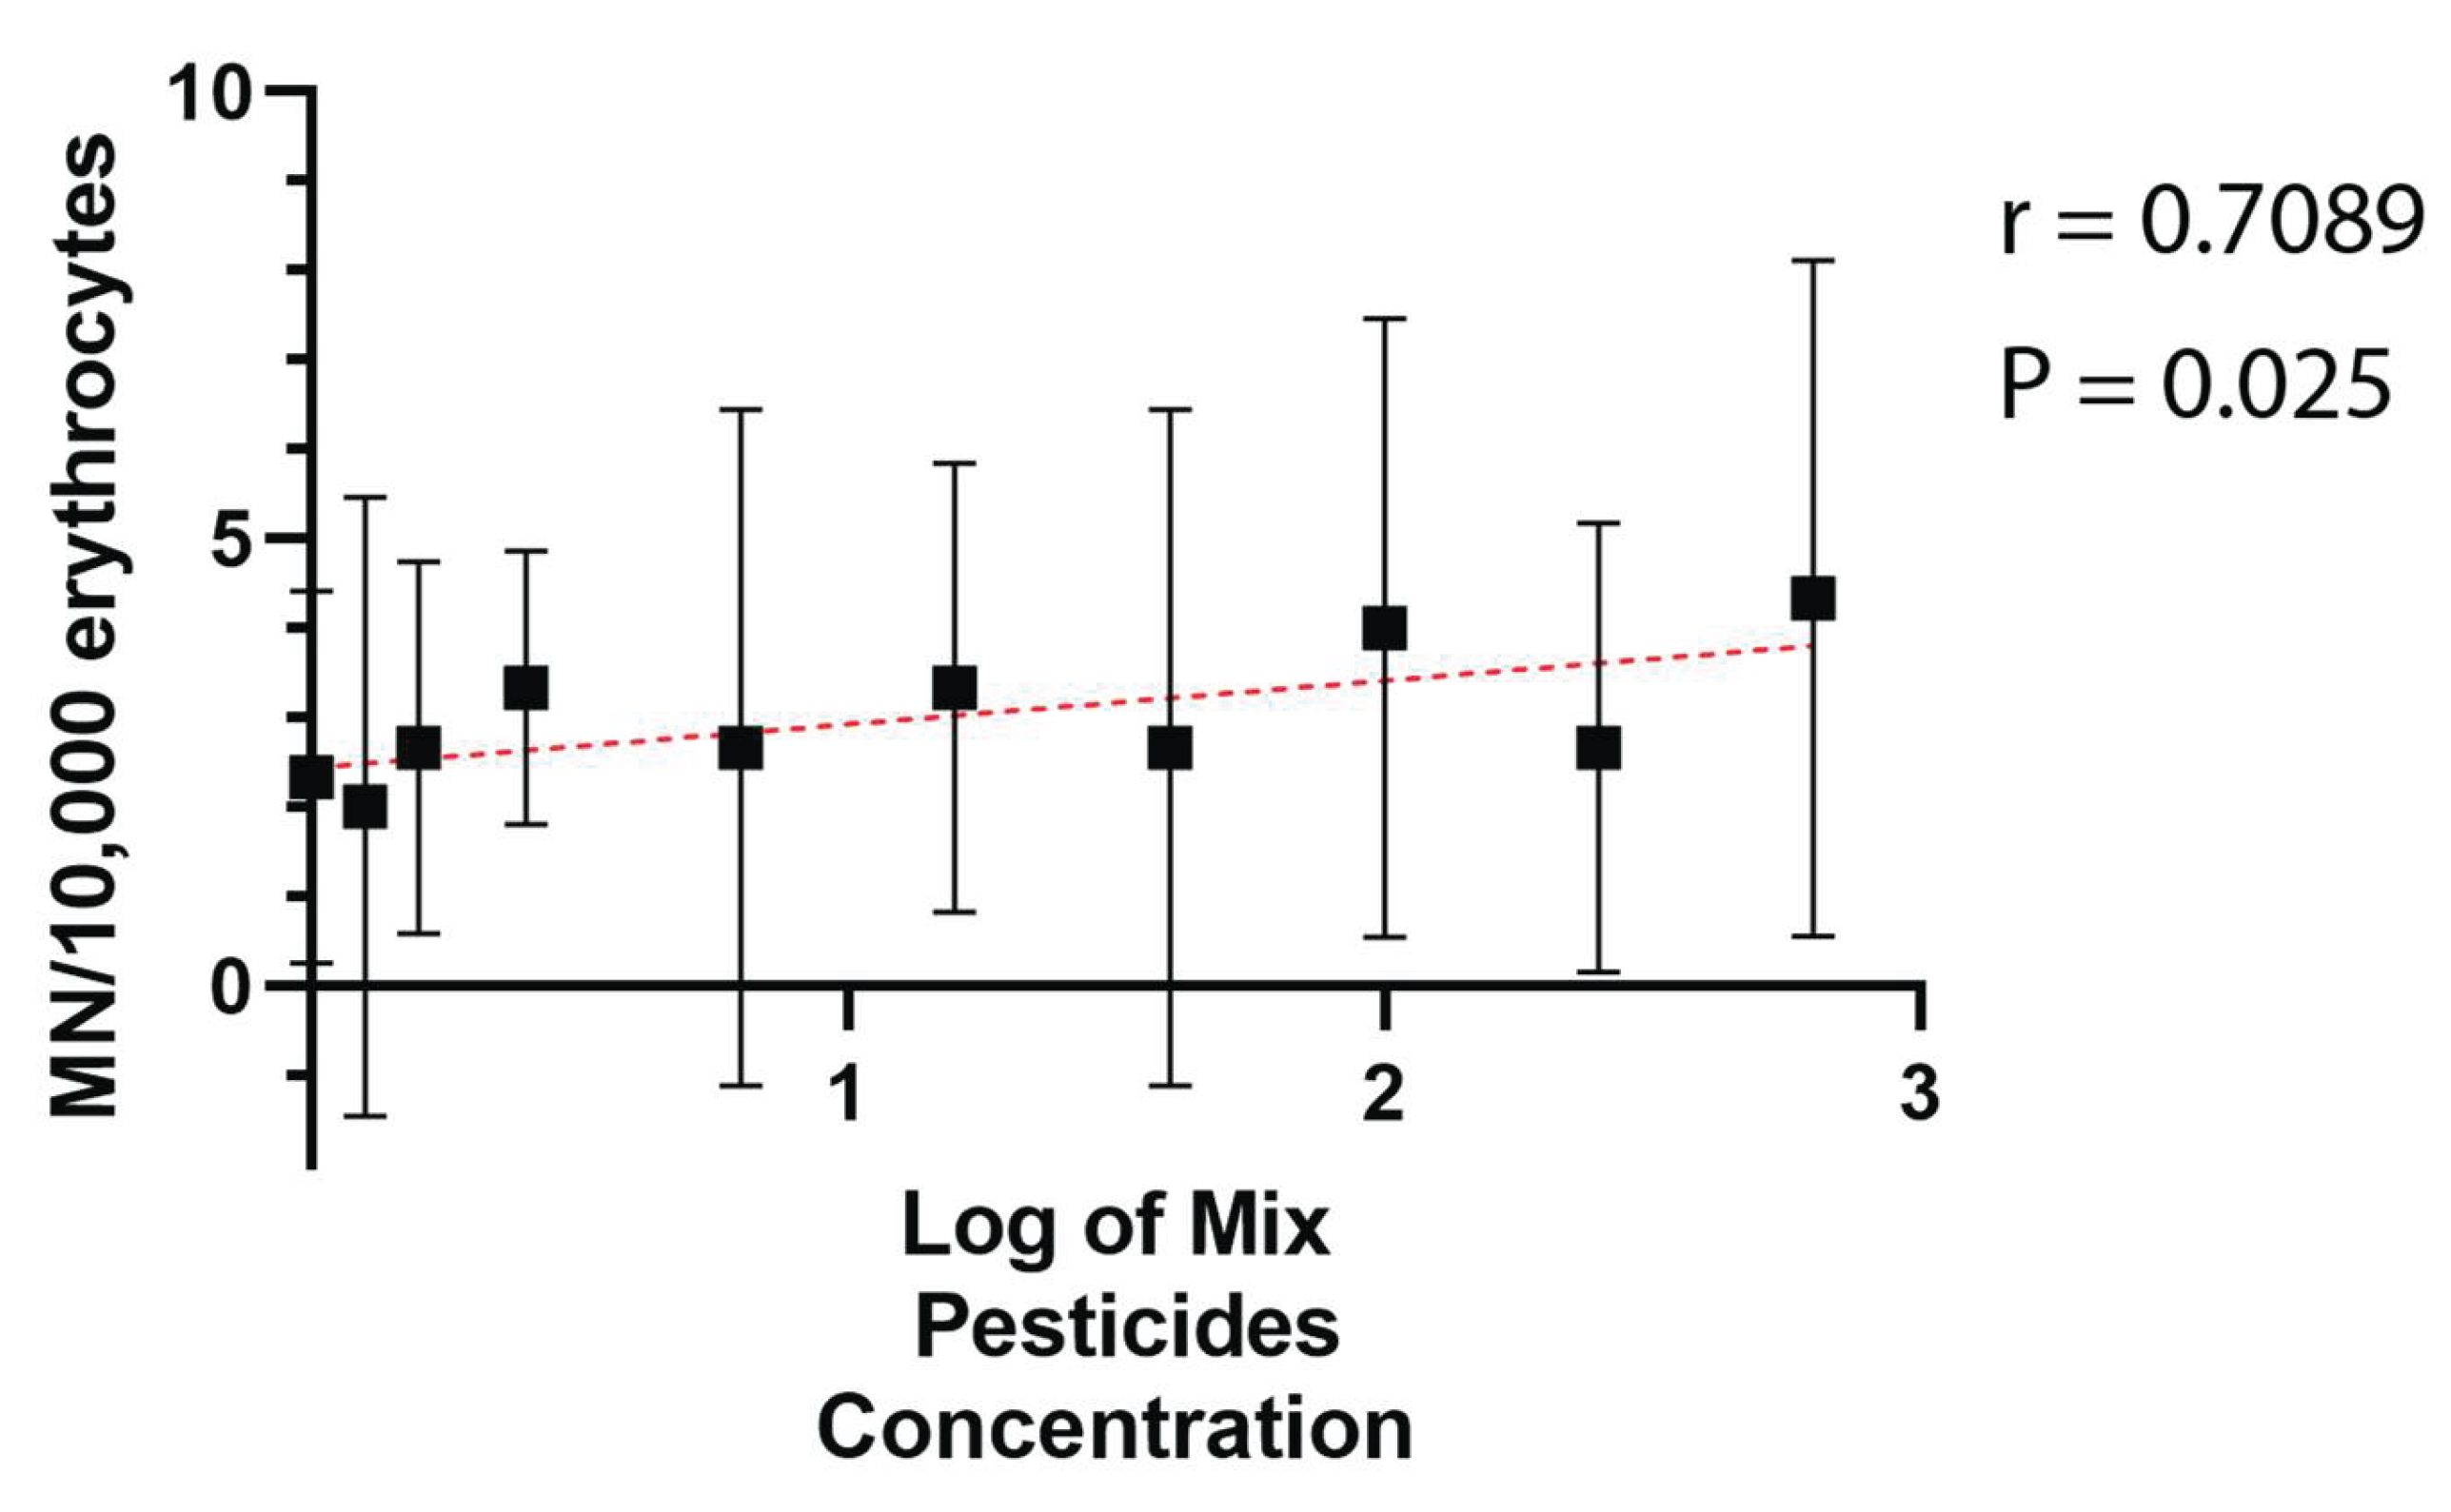
Figure 4.
Spearman correlation between morphometric data of birds (length of birds, weight of birds, length of wings, length of bill, and length of tail) related to MN Frequency collected from birds of farms at Monte Carmelo, Minas Gerais, Brazil.
Figure 4.
Spearman correlation between morphometric data of birds (length of birds, weight of birds, length of wings, length of bill, and length of tail) related to MN Frequency collected from birds of farms at Monte Carmelo, Minas Gerais, Brazil.
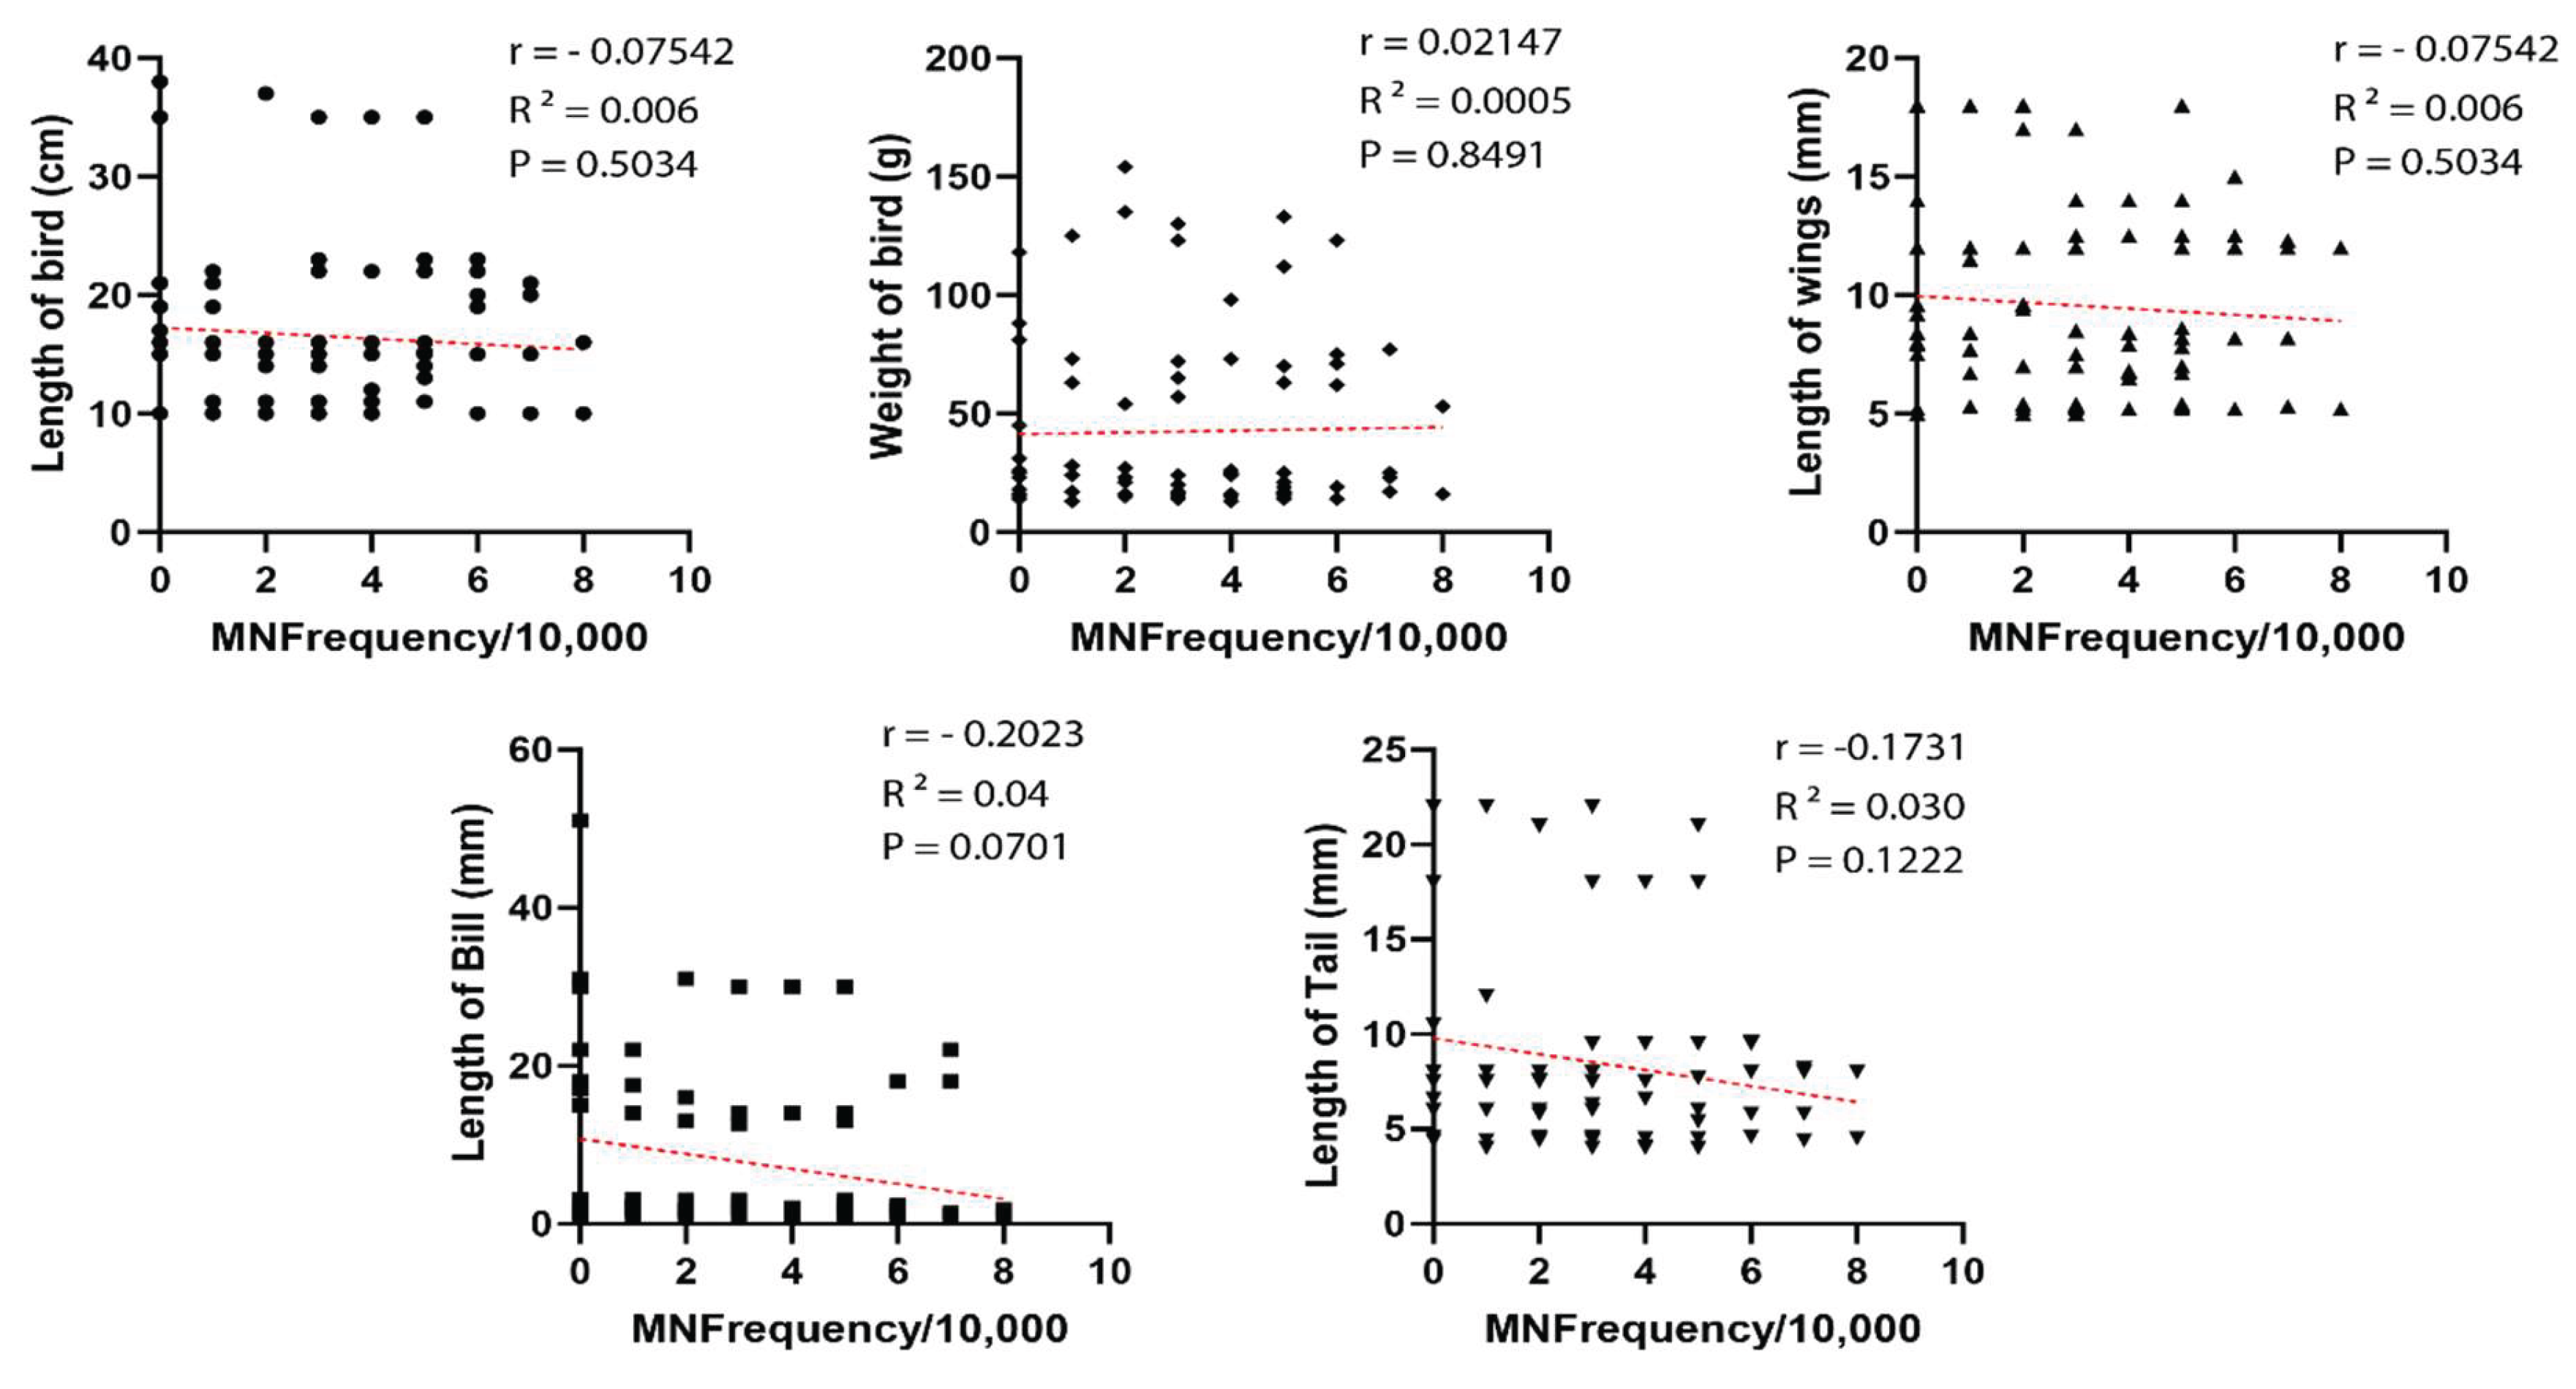
Figure 5.
Differences in anatomical measurements for bird species collected in the farms of different sizes at Monte Carmelo, Minas Gerais, Brazil. After the Kruskal-Wallis test Birds length, Bill, Wings, Tail, and Weight were ranked. The results of each test are given above in each graph.
Figure 5.
Differences in anatomical measurements for bird species collected in the farms of different sizes at Monte Carmelo, Minas Gerais, Brazil. After the Kruskal-Wallis test Birds length, Bill, Wings, Tail, and Weight were ranked. The results of each test are given above in each graph.
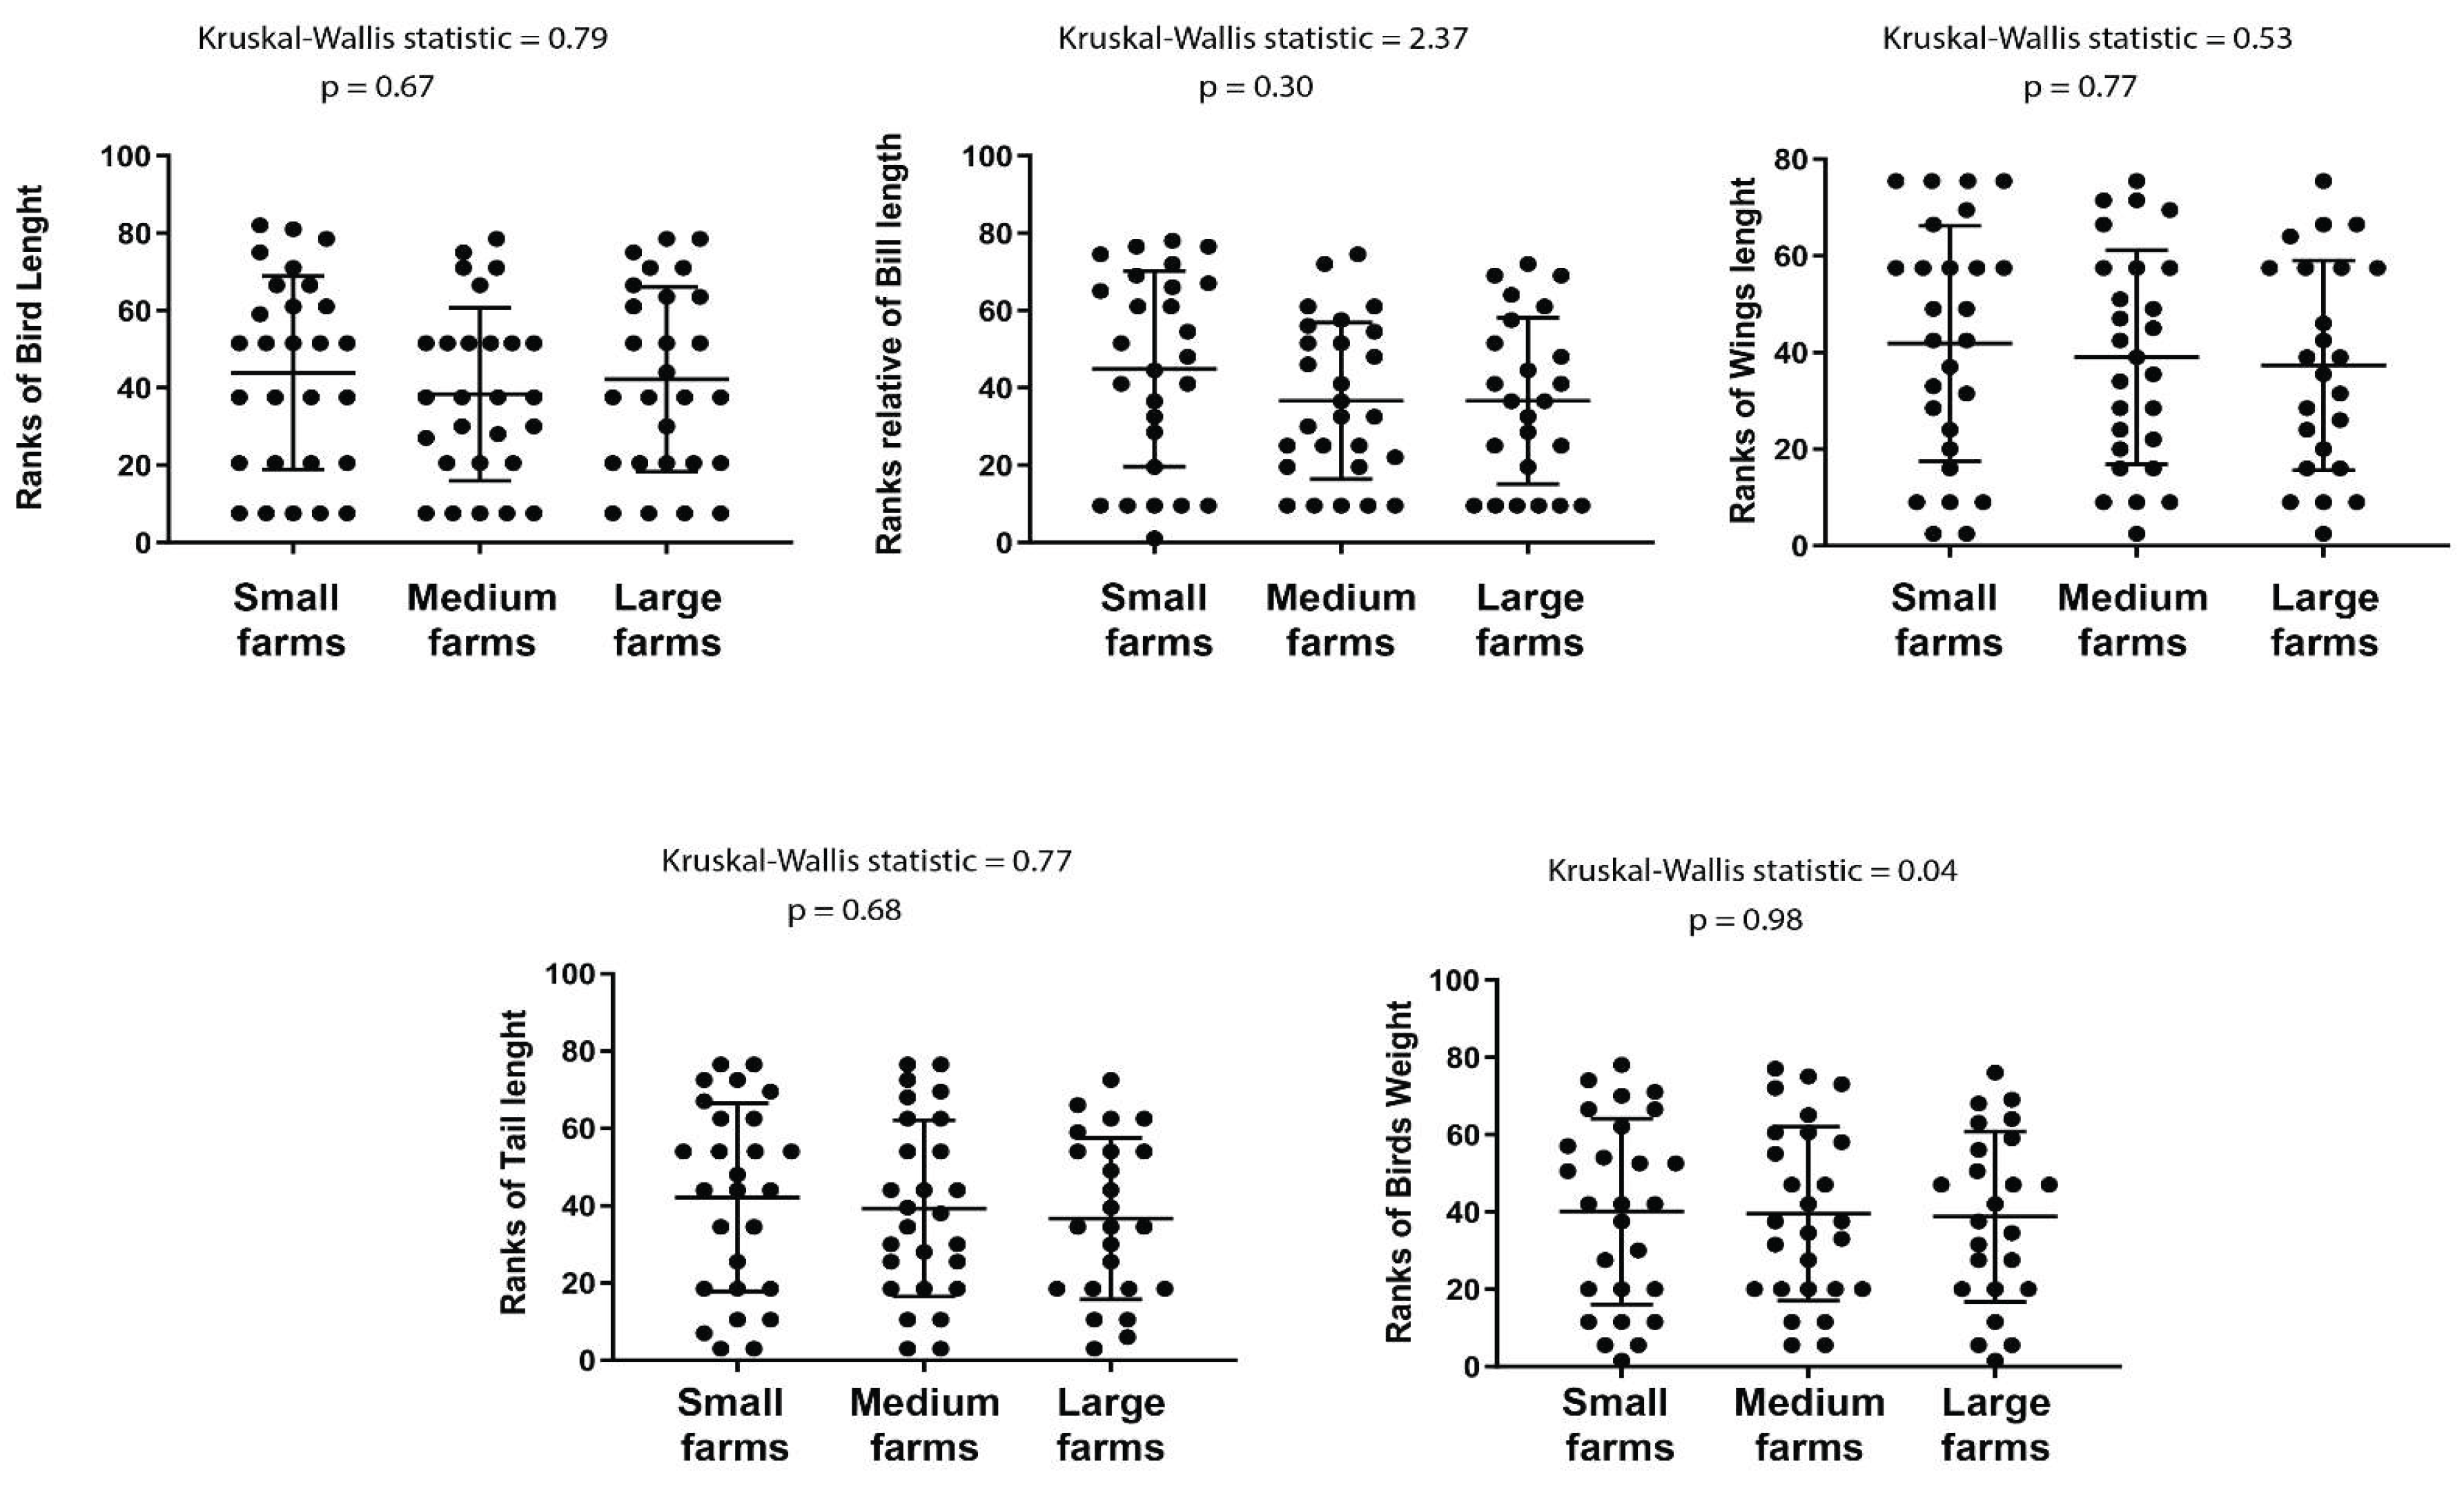

Table 1.
Active ingredient and its units of concentration applied in the farms at Monte Carmelo, Minas Gerais, Brazil .
Table 1.
Active ingredient and its units of concentration applied in the farms at Monte Carmelo, Minas Gerais, Brazil .
|
Active ingredient |
Concentration (g/L) |
Class of pesticide |
Pesticide concentration in syrup (L/h.a) | ||
| Small farms | Medium farms | Large farms | |||
| Copper hydroxyde | 691 | Fungicide | 0.5 | 0.5 | 1 |
| Carbamate | 250 | Fungicide | 5 | 5 | 5 |
| Piraclostrombin | 133 | Fungicide | 500 | 500 | 500 |
| Imidacloprid | 700 | Insecticide | 50 | 100 | 100 |
| Espiromesifen | 240 | Insecticide/Acaricide | 400 | 600 | 1600 |
| Clorantraniliprole | 350 | Insecticide | 4 | 4 | 4 |
| Total | 959.5 | 1,209.5 | 2,210 | ||
Table 2.
Frequency of MN in the birds collected in farms with different sizes at Monte Carmelo, Minas Gerais, Brazil.
Table 2.
Frequency of MN in the birds collected in farms with different sizes at Monte Carmelo, Minas Gerais, Brazil.
| Family | Scientific name | Common name | n | MN (mean ± SD) | |||
| Small farms | Medium farms | Large farms | |||||
| Columbidae | Columbina talpacoti | Ruddy Ground-Dove | 1 | 0 | - | - | |
| Leptotila rufaxilla | Grey-fronted Dove | 9 | - | - | 6 ±0 | ||
| Cuculidae | Crotophaga ani | Smooth-billed Ani | 3 | 0 | 3 ±0 | 4,5 ±0,7 | |
| Guira guira | Guira Cuckoo | 3 | 1,5 ±0,7 | 1,67 ±1,52 | 5 ±0 | ||
| Thraupidae | Dacnis cayana | Blue Dacnis | 2 | 1 ±1,41 | 5 ±0 | - | |
| Tangara sayaca | Sayaca Tanager | 3 | 2 ±0 | 0 | - | ||
| Tersina viridis | Swallow Tanager | 1 | - | 2 ±0 | - | ||
| Volatinia jacarina | Blue-black Grassquit | 18** | 1,86 ±1,07 | 2,43 ±1,27 | 5,57 ±1,62 | ||
| Tyrannidae | Elaenia flavogaster | Yellow-bellied Elaenia | 1 | 0 | 0 | 4 ±0 | |
| Myiozetetes similis | Social Flycatcher | 4 | 2 ±1 | 4 ±0 | 4,5 ±0,7 | ||
| Tyrannus melancholicus | Suiriri Flycatcher | 3 | 1 ±0 | 3,5 ±0,7 | 4,5 ±0,7 | ||
| Galbulidae | Galbula ruficauda | Rufous-tailed Jacamar | 17** | 1 ±0 | 0 | 7 ±0 | |
| Icteridae | Gnorimopsar chopi | Chopi Blackbird | 9 | 0, 1 | - | 6,5 ±0,7 | |
| Molothrus bonariensis | Shiny Cowbird | 15** | 2 ±0 | 3 ±0 | 8 ±0 | ||
| Mimidae | Mimus saturninus | Chalk Mockingbird | 1 | - | 1 ±0 | - | |
| Passeridae | Passer domesticus | House Sparrow | 5 | - | 6 ±0 | 6 ±1,41 | |
| Thamnophilidae | Thamnophilus doliatus | Barred Antshrike | 3 | 0 | - | 3 ±0 | |
| Thamnophilus torquatus | Rufous Antshrike | 1 | 1 ±0 | - | - | ||
| Turdidae | Turdus leucomelas | Pale-breasted Thrush | 4 | 3 ±0 | 5 ±0 | 6 ±0 | |
| Turdus rufiventris | Rufous-bellied Thrush | 16** | 4 ±0 | 3 ±0 | 4,5 ±0,7 | ||
| Passerellidae | Zonotrichia capensis | Rufous-collared Sparrow | 3 | 0 | 2,5 ±0,7 | 5 ±0 | |
| TOTAL | 122 | 1,38 ±1.20 | 2,59 ±1.65* | 5,31 ±5.40* | |||
| Reference site (multiple species) | 30 | 0,26 ±0,52 | |||||
| *Statistical difference of the groups when compared to the reference site **Viable species for potential biomonitors (with at least 5 individuals per point) |
|||||||
Table 3.
Trophic guild of bird species and bird bill lengths collected in the farms at Monte Carmelo, Minas Gerais, Brazil.
Table 3.
Trophic guild of bird species and bird bill lengths collected in the farms at Monte Carmelo, Minas Gerais, Brazil.
| Family | Scientific name | Common name | Guild | Bill length (mm) | ||
| Small farms | Medium farms | Large farms | ||||
| Columbidae | Columbina talpacoti | Ruddy Ground-Dove | Granivorous | 15.0 | - | |
| Leptotila rufaxilla | Grey-fronted Dove | Granivorous | - | - | 24.0 | |
| Cuculidae | Crotophaga ani | Smooth-billed Ani | Omnivorous | 35.0 | 34.0 | 35.0 |
| Guira guira | Guira Cuckoo | Omnivorous | 36.5 | 36.0 | 36.0 | |
| Thraupidae | Dacnis cayana | Blue Dacnis | Omnivorous | 31.0 | 13.0 | - |
| Tangara sayaca | Sayaca Tanager | Frugivorous | 21.0 | - | ||
| Tersina viridis | Swallow Tanager | Omnivorous | 15.0 | |||
| Volatinia jacarina | Blue-black Grassquit | Granivorous | 10.3 | 10.3 | 10.1 | |
| Tyrannidae | Elaenia flavogaster | Yellow-bellied Elaenia | Omnivorous | 18.0 | 17.0 | 16.0 |
| Myiozetetes similis | Social Flycatcher | Insectivorous | 17.3 | 16.5 | ||
| Tyrannus melancholicus | Suiriri Flycatcher | Omnivorous | 21.5 | 21.0 | 19.5 | |
| Galbulidae | Galbula ruficauda | Rufous-tailed Jacamar | Insectivorous | 22.0 | 20.0 | 19.0 |
|
Icteridae |
Gnorimopsar chopi |
Chopi Blackbird |
Omnivorous | 17.8 | 23.5 | |
| Molothrus bonariensis | Shiny Cowbird | Omnivorous | 18.0 | 16.0 | 16.0 | |
| Mimidae | Mimus saturninus | Chalk-browed Mockingbird | Omnivorous | - | 26.0 | - |
| Passeridae | Passer domesticus | House Sparrow | Omnivorous | - | 14.0 | 14.5 |
| Thamnophilidae | Thamnophilus doliatus | Barred Antshrike | Insectivorous | 20.0 | - | 17.0 |
| Thamnophilus torquatus | Rufous-winged Antshrike | Insectivorous | - | 21.0 | - | |
| Turdidae | Turdus leucomelas | Pale-breasted Thrush | Omnivorous | 23.0 | 22.0 | 22.0 |
| Turdus rufiventris | Rufous-bellied Thrush | Omnivorous | 25.0 | 21.0 | 21.0 | |
| Passerellidae | Zonotrichia capensis | Rufous-collared Sparrow | Granivorous | 17.0 | 14.0 | 13.0 |
Disclaimer/Publisher’s Note: The statements, opinions and data contained in all publications are solely those of the individual author(s) and contributor(s) and not of MDPI and/or the editor(s). MDPI and/or the editor(s) disclaim responsibility for any injury to people or property resulting from any ideas, methods, instructions or products referred to in the content. |
© 2025 by the authors. Licensee MDPI, Basel, Switzerland. This article is an open access article distributed under the terms and conditions of the Creative Commons Attribution (CC BY) license (http://creativecommons.org/licenses/by/4.0/).
Copyright: This open access article is published under a Creative Commons CC BY 4.0 license, which permit the free download, distribution, and reuse, provided that the author and preprint are cited in any reuse.


