
Submitted:
14 September 2025
Posted:
15 September 2025
You are already at the latest version
Abstract
Background: The routine use of high inspired oxygen fractions (FiO₂) during mechanical ventilation in anesthesia and critical care is traditionally aimed at preventing hypoxemia. However, liberal oxygen administration often exceeds physiological requirements, potentially masking early signs of underlying pathology such as inadvertent endobronchial intubation, pulmonary congestion and edema, acute respiratory distress syndrome (ARDS), and other conditions associated with impaired gas exchange. This practice may delay recognition of ventilation-perfusion (V/Q) mismatch and latent hypoxemia, while also increasing the risks of oxygen toxicity and absorption atelectasis.Content: This narrative review revisits the foundational principles of Nunn’s iso-shunt diagrams as a physiological framework for understanding the interplay between FiO₂, arterial oxygenation (PaO₂), and shunt fraction. We analyze the historical development, mathematical basis, and modifications of these diagrams, highlighting their diagnostic value, especially at lower FiO₂ levels. By integrating classical physiology with contemporary monitoring and clinical evidence, we advocate for a paradigm shift away from routine hyperoxygenation toward precise, patient-specific FiO₂ titration.Conclusions: We propose that maintaining minimal FiO₂, typically less than 0.3, not only reduces hyperoxia-related harm but also unmasks subtle gas exchange impairments that remain hidden under high FiO₂ conditions. This individualized, physiologically informed approach to oxygen therapy in anesthesia promotes patient safety by earlier detection of pathological gas exchange, challenging traditional assumptions and supporting a more nuanced, evidence-based practice.
Keywords:
hypoxemia
; hyperoxia
; oximetry
; pulmonary gas exchange
; oxygen inhalation therapy
; anesthesia
Introduction
The selection of the appropriate fraction of inspired oxygen (FiO2) during mechanical ventilation in anesthesia is far from arbitrary; it is a decision grounded in fundamental respiratory physiology. The use of high FiO2 during anesthesia has traditionally been favored due to the belief that it prevents hypoxemia by increasing the so called “margin of safety”. However, emerging evidence suggests that this practice may obscure critical events, such as V/Q mismatch or shunt and ultimately compromise patient safety.
The optimal FiO2 during anesthesia remains a controversial subject of significant debate. Some studies have suggested that high FiO2 (0.8) may reduce surgical site infections (SSI) and improve immune function [1],whereas others have found no significant difference in SSI rates between high and low FiO2 strategies [2,3]. Concerns have also been raised about potential adverse effects of high FiO2 (such as atelectasis and respiratory complications)[4], although a systematic review reported no definitive evidence of harm associated with 80% FiO2 [2]. The World Health Organization has recommended 80% FiO2 to reduce SSI, but this recommendation has also been questioned [5]. Overall, the evidence remains inconclusive, with some studies suggesting insufficient evidence to support routine use of high FiO2 [6]. Further high quality research is needed to determine the optimal FiO2 during anesthesia [7,8]
This narrative review discusses the physiological rationale of intraoperative oxygen management, emphasizing the use of FiO2 < 0.3 as a sensitive method for early detection of acute hypoxemia that develops during anesthesia. We integrate evidence from Nunn’s iso-shunt analysis, contemporary clinical studies, and recent systematic reviews to highlight the clinically significant yet often underestimated drawbacks of high FiO2 use in daily practice. We aim to explore the hypothesis that using a lower FiO2 (<0.3) during anesthesia for elective patients without chronic respiratory disorders can serve as an effective strategy for the early detection of inadvertent endobronchial intubation and other shunt mediated hypoxemia. Our objective is to provide an overview of physiological insights, experimental data, and clinical recommendations that can help anesthesiologists in making informed decisions regarding intraoperative oxygen management.
History of Oxygen Use in Anesthesia Practice
In the 19th century, the use of oxygen during anesthesia was minimal, as early anesthetics like chloroform and ether often led to hypoventilation and resultant hypoxia in the absence of supplemental oxygen. By the early 20th century, as the fundamental role of oxygen in cellular respiration became clear, oxygen was increasingly incorporated into anesthesia delivery systems. The invention of the Boyle anesthetic machine in 1917 marked a turning point, allowing for controlled delivery of oxygen during anesthesia [9].
With the advent of pulse oximetry and arterial blood gas analysis in the late 20th century, the emphasis on maintaining adequate oxygenation during anesthesia grew. Routine practice shifted toward using oxygen-enriched gas mixtures (FiO2 ~0.3–1.0) as a safety measure, particularly for patients with high oxygen demand or impaired gas exchange [10,11]. Historically, intraoperative hypoventilation was identified as a major cause of anesthesia-related hypoxemia [12,13], and a landmark analysis of critical incidents found that unrecognized hypoventilation was the most common cause of serious anesthesia mishaps [14]. The widespread adoption of pulse oximetry and capnography in the 1980s dramatically improved the early detection and prevention of hypoxemia during surgery [15,16].
Today, we have the ability to provide precise control over tidal volumes, respiratory rates, and pressures, and so effectively eliminate hypoventilation. While the routine use of oxygen-enriched mixtures adds to the “safety margin”, it is not always necessary for patients with normal oxygen demands and healthy lungs. This shifts the perspective from historical reliance on high FiO2 to a more tailored approach based on patient physiology and surgical needs.
Physiological Foundations
Safety Considerations of Low FiO2
The rationale for using high FiO2(FiO2 >0.3) in anesthesia practice is partially explained by the need for increased “safety margin” for anesthetized patients. Nonetheless, mechanical ventilation with room air (FiO2 =0.21) is technically feasible and may be used routinely in specific situations, such as laser airway surgeries utilizing in otolaryngology [17].
With low flows and FiO2 of less than 0.25 in semi-closed (rebreathing) circuits, O2 consumed by the patient leads to a drop in the concentration of expired O2 (EtO2) and this is further aggravated by the return breath to the circuit containing less O2 that in turn dilutes the next inspired gas. This recycling leads to a decreasing FiO2 with each cycle, with the danger of a hypoxic gas mixture and patient hypoxemia. An FiO2 of at least 0.25 must be set to correct for this dilution so that the inspired oxygen concentration is in the safe range. FiO2 of 0.21 (room air) on ventilator settings is possible only in case the circuit is non rebreathing (semi-open).
Pulmonary Shunt
Pulmonary shunt refers to blood that flows through the lungs without participating in gas exchange, leading to arterial hypoxemia. This can occur due to anatomical shunts (e.g., congenital heart defects) or physiological shunts where alveoli are perfused but not
ventilated, such as in atelectasis or pneumonia. The alveolar PO2 (PAO2) remains normal because ventilation occurs in unaffected alveoli. However, arterial PO2 (PaO2) decreases due to the mixing of oxygenated and non-oxygenated blood. This creates a widened Alveolar-Arterial Gradient (A-a Gradient), and decreased PO2/FiO2 ratio, the hallmark indices of shunt physiology.
Ventilation-Perfusion Mismatch
Ventilation-perfusion (V/Q) mismatch describes an imbalance between alveolar ventilation (V) and pulmonary capillary perfusion (Q). Low V/Q Ratio (approaching shunt like states) occurs when areas of the lung are perfused but are not adequately ventilated, resulting in hypoxemia. Common causes include atelectasis, pneumonia, pulmonary edema, and chronic obstructive pulmonary disease (COPD). High V/Q Ratio (dead space ventilation) occurs when areas of the lung are ventilated but not perfused, leading to wasted ventilation. Pulmonary embolism is a typical example.
PaO2/FiO2 Ratio and Shunt Fraction
The PaO2/FiO2 ratio is a key indicator of oxygenation efficiency, commonly used to assess the severity of conditions such as acute respiratory distress syndrome (ARDS). It is calculated by dividing PaO2 by the fraction of inspired oxygen (FiO2). The shunt fraction represents the portion of cardiac output that bypasses ventilated alveoli, leading to hypoxemia. As the shunt fraction increases, the PaO2/FiO2 ratio typically decreases, indicating worsening oxygenation. A PaO2/FiO2 ratio of less than 300 mmHg suggests impaired gas exchange, with lower values indicating more severe dysfunction. A PaO2/FiO2 ratio below 60 mmHg is critically low and reflects significant respiratory compromise.
Theoretically, with a PaO2/FiO2 ratio less than 60, administering an FiO2 of 1.0 (100% oxygen) would achieve a PaO2 of approximately 60 mmHg, corresponding to an SaO2 around 90%. To reduce SaO2 below 90%, FiO2 would need to be decreased accordingly, considering individual patient factors and the non-linear PaO2-SaO2 relationship.
At FiO2 levels ≤ 0.3, the PaO2 drops earlier in response to worsening oxygenation, leading to desaturation at an earlier stage of hypoxemia.
Use of high FiO2 (> 0.3) may mask hypoxemia until PaO2 falls below critical thresholds, leading to delayed recognition and treatment. Consequently, maintaining lower FiO2 levels (≤ 0.3) during routine monitoring or elective surgeries can enhance the sensitivity of SaO2 for detecting early hypoxemia.
Nunn’s Iso-Shunt Diagrams and Masking Hypoxemia
Historical Development
The iso-shunt diagram was first developed in 1973 by J.F. Nunn and colleagues, with the foundational work published in the British Journal of Anaesthesia [18].
These diagrams were proposed to simplify the selection of the optimal inspired oxygen concentration in patients undergoing intensive therapy and to provide a practical means for determining appropriate oxygen therapy in patients with hypoxemia due to pulmonary venous admixture [18,19]. At the core of these diagrams lies the concept of the “virtual shunt”, a theoretical model allowing clinicians to estimate pulmonary venous admixture without complex calculation.
Subsequent studies have shown that the diagram’s accuracy varied across different FiO2 ranges, leading to a modified version incorporating ventilation/perfusion mismatch for low FiO2 values (<0.35)in order to improve accuracy [20].
The diagrams addressed two practical challenges in intensive care. First, they were intended to minimize the frequent arterial blood gas (ABG) sampling and iatrogenic anemia risk, and to prevent hyperoxia by enabling titration to minimum FiO2 while maintaining PaO2 >60 mmHg [18]. Second, it mitigated oxygen toxicity risks (e.g., reduced incidence of absorptive atelectasis) [21].
PaO2–FiO2 Isoshunt Curves at Varying Shunt Fractions
PaO2 vs. FiO2 curves: traditional isoshunt curves illustrating the relationship between inspired oxygen fraction (FiO2) and arterial oxygen tension (PaO2) at different shunt fractions. (see Figure 1) These iso-shunt plots show arterial oxygen tension as a function of FiO2 for various fixed shunt fractions (e.g., 0%, 10%, 20%, 30%, 50%). In normal lungs with minimal shunt, PaO2 rises almost linearly with FiO2. As the shunt fraction increases, however, the PaO2–FiO2 curve progressively flattens : even 100% FiO2 may not raise PaO2 above ~100 mmHg when shunt exceeds ~30%.
SaO2–FiO2 Isoshunt Curves at Varying Shunt Fractions
SaO2 vs. FiO2 curves show that hemoglobin saturation is less sensitive than PaO2 to alterations in FiO2, with this effect becoming more evident at higher FiO2 values (see Figure 2). This figure was created by the authors, adapting the classic PaO2–FiO2 isoshunt curves described by Nunn, and the oxygen-hemoglobin dissociation curve to illustrate the relationship between inspired oxygen fraction (FiO2) and arterial oxygen saturation (SaO2) at varying shunt fractions.
The diagram illustrates the relationship between arterial oxygen saturation (SpO2) and the fraction of inspired oxygen (FiO2) across varying shunt fractions.
When isoshunt curves are plotted using arterial oxygen saturation (SpO2) instead of PaO2, the impact of increasing shunt fraction appears attenuated. Even with substantial shunt, SaO2 remains high across most FiO2 values, because the oxyhemoglobin dissociation curve is relatively flat once saturation exceeds ~90%. As a result, increasing FiO2 produces only small, clinically indistinct changes in SaO2, even though PaO2 is falling markedly. This illustrates why SpO2 is a less sensitive measure of gas exchange impairment than PaO2 in the presence of significant shunt.
PaO2: The partial pressure of oxygen in arterial blood (PaO2) is directly influenced by changes in the fraction of inspired oxygen (FiO2) and shunt fraction. As FiO2 increases, PaO2 rises proportionally, reflecting the amount of oxygen dissolved in the blood. This relationship makes PaO2 a sensitive indicator of gas exchange efficiency and lung function.
SaO2: Arterial oxygen saturation (SaO2) represents the percentage of hemoglobin binding sites occupied by oxygen. Due to the sigmoidal shape of the oxygen-hemoglobin dissociation curve, SaO2 is less responsive to changes in FiO2, especially at higher FiO2 levels. At elevated PaO2 values, significant increases in PaO2 result in only minor changes in SaO2, indicating a plateau phase where hemoglobin is nearly fully saturated. (see hemoglobin dissociation curve).
Taken together, the iso-shunt diagrams vividly demonstrate that using FiO2 above ~0.3 can mask even a significant shunt: the PaO2–FiO2 relationship plateaus and SpO2 remains near 100% until the shunt is quite severe. By contrast, at FiO2 in the 0.21–0.30 range, the presence of a shunt or V/Q mismatch produces an earlier and more obvious drop in PaO2 (and hence in SaO2). Experimental evidence confirms that FiO2 around 0.25–0.30 will unmask subtle gas exchange abnormalities that remain concealed when FiO2 is higher [22].
The authors of this paper aim to highlight that high FiO2 makes pulse oximetry insensitive to progressive hypoxemia until a critical phase is reached:when PaO2 falls below 60 mmHg and SaO2 drops below 90%, leading to severe hypoxia. Consequently, in routine anesthesia practice, where oxygenation monitoring relies solely on pulse oximetry without frequent arterial blood gas analysis, high FiO2 can mask the progression of hypoxemia.
Contemporary Relevance
With the advent of continuous pulse oximetry in the 1980s, the clinical use of iso-shunt diagrams rapidly waned. The ability to monitor SpO2 noninvasively and in real time largely replaced the need to estimate shunt via static graphs and intermittent blood gases [23].Pulse oximetry became standard of care in anesthesia, intensive care, and emergency medicine within a few years, rendering routine iso-shunt charts obsolete [23,24].Nonetheless, the physiological principles illustrated by the iso-shunt diagrams , linking shunt fraction, FiO2, and arterial oxygenation ,remain foundational knowledge. The concept of the virtual shunt continues to inform our understanding of oxygenation abnormalities and guides therapy in modern contexts. Applications extend beyond FiO2 selection to monitoring disease progression, evaluating responses to interventions, and predicting readiness for ventilator weaning. In essence, while the iso-shunt graph itself is now mostly of historical interest, the underlying relationships it depicts are still vital in clinical reasoning and education [25,26].
Critical Threshed of FiO2 < 0.3 in Shunt Physiology
Iso-shunt diagrams provide a critical framework for understanding how oxygen partial pressure (PaO2) precipitously declines below 60 mmHg when inspired oxygen fraction (FiO2) falls under 0.3 in patients with significant pulmonary shunting. Under physiological conditions, pulmonary gas exchange ensures near-complete oxygenation of blood traversing ventilated alveoli. However, in true shunt physiology a portion of cardiac output bypasses ventilated lung regions entirely, mixing unoxygenated blood with oxygenated blood from functional alveoli [26]. The iso-shunt diagram models this phenomenon by plotting PaO2 against FiO2 for fixed shunt fractions, demonstrating how:
- High shunt fractions flatten the PaO2-FiO2 curve: As the shunt fraction increase, PaO2 becomes relatively unresponsive to additional FiO2 (diminishing returns with high FiO2).
- Low FiO2 ranges amplify hypoxemic effects: at low FiO2, even a moderate shunt causes a drop in PaO2 into the critically low range.
For example, with a 30% shunt, the iso-shunt line shows PaO2 decreasing from 100 mmHg at FiO2=1.0 to <60 mmHg at FiO2=0.3 . This occurs because shunted blood dilutes oxygenated blood, with the dilution effect becoming more pronounced as FiO2 decreases. Table 1 provides approximate PaO2 and SaO2 values at several FiO2 levels for a 30% intrapulmonary shunt.
The iso-shunt diagram illustrates how FiO2=0.3 represents a critical inflection point:
The oxygen-hemoglobin dissociation curve dictates that PaO2 values below 60 mmHg correspond to rapid declines in arterial oxygen saturation (SaO2). At PaO2=60 mmHg, SaO2 is approximately 90%, but decreases to 75% at PaO2=40 mmHg due to the curve’s steep slope in this range [27].Iso-shunt diagrams visually demonstrate how FiO2 reductions below 0.3 push PaO2 into this critical zone.
Low inspired oxygen fraction (below 0.3 ) can help detect latent hypoxemia at its early stages by unmasking subtle oxygenation deficits that might otherwise be hidden when higher FiO2 is administered. This approach is based on the physiological principle that mild ventilation-perfusion (V/Q) mismatch or early shunt becomes more evident as FiO2 reduced.
The concept that high FiO2 may mask early signs of pulmonary pathology and delay appropriate care was also articulated in detail by Downs et al, who argued that routine supplemental oxygen can obscure the clinical significance of underlying ventilation-perfusion mismatch and shunt [28].
At higher FiO2, the alveoli are saturated with oxygen, and even severe pulmonary dysfunction may not result in significant arterial hypoxemia. Lowering FiO2 to <0.3 reduces the oxygen reserve, making the system more sensitive to small defects in gas exchange. Early or minor V/Q mismatch or shunt, which might not cause hypoxemia at FiO2 0.4–1.0, will now lead to measurable drops in arterial oxygen tension (PaO2) and saturation (SaO2 or SpO2) [29].
Furthermore, in clinical practice, brief trials of lower FiO2 (e.g., titrating down to room air or just above) can reveal subclinical hypoxemia before it becomes severe, allowing earlier intervention [29]. This is particularly important in patients at risk for respiratory complications, such as postoperative or critically ill patients.
Despite clear recognition of hyperoxia’s risks, perioperative oxygen administration remains liberal. Pulse oximetry, our primary monitor, tracks saturation rather than PaO2, and above ~94–96% it gives no indication of further rises in FiO2 or PaO2, often concealing marked over-oxygenation. Traditional practices, such as routine preoxygenation with 100% FiO2 and the historical promotion of high FiO2 to reduce surgical site infection, have reinforced this habit. Guidelines are inconsistent, seldom define upper limits for FiO2 or PaO2, and do not require PaO2 monitoring. The result is that high FiO2 not only persists but also obscures shunt and V/Q mismatch, while simultaneously worsening atelectasis—an ironic paradox in the pursuit of safety [30,31].
One-Lung Ventilation (OLV)
During an elective OLV (lateral position): a true shunt exists through the non-ventilated lung, but gravity shifts most perfusion to the dependent ventilated lung, and HPV together with surgical/hilar compression further divert flow, leaving a residual shunt ≈20–25%. High FiO2 (standard practice) cannot oxygenate shunted blood, yet it maximizes O2 in ventilated units (full Hb saturation + dissolved O2), raising PaO2 and usually maintaining SaO2; the benefit wanes as shunt grows. Importantly, a ~20–25% shunt does not inevitably cause hypoxemia when FiO2 is sufficiently high as the ventilated lung can preserve near-normal SaO2, as shown on Nunn’s iso-shunt diagrams.
Despite this, prolonged exposure to high oxygen concentrations during one lung ventilation can lead to oxygen toxicity and absorption atelectasis. Breathing 100% oxygen promotes atelectasis formation in anesthetized patients , which can impair lung function and oxygenation [32]. High FiO2 also causes inflammatory responses and oxidative lung injury [33]. The severity of hyperoxic acute lung injury is directly proportional to PO2 and exposure duration, becoming significant when FiO2 exceeds 0.8 for extended periods [34].
Role of Hypoxic Pulmonary Vasoconstriction (HPV)
The body’s natural response to one-lung ventilation includes hypoxic pulmonary vasoconstriction, where blood flow to the non-ventilated lung is reduced. High FiO2 helps optimize oxygenation in the ventilated lung while HPV minimizes blood flow through the shunted area, reducing the overall shunt fraction. This strategy balances the physiological limitations imposed by a true shunt with the need to maintain adequate oxygen delivery during OLV.
In elective thoracotomy, hypoxic pulmonary vasoconstriction (HPV) is a crucial mechanism that redirects blood flow from hypoxic to well-oxygenated lung areas, optimizing ventilation-perfusion matching [35]. During one-lung ventilation, HPV helps mitigate intrapulmonary shunting and maintain oxygenation [36]. The HPV response can reduce shunt fraction by up to 20% of cardiac output under maximal conditions [37,38]. The blood diverted from the non-ventilated lung due to HPV is redirected to the ventilated lung. This improves ventilation- perfusion matching and optimizes oxygenation [39].
The HPV response is biphasic: early phase peaks at 20 minutes and a late phase that develops gradually, peaking at 60-120 minutes. Overall HPV along with gravity dependent blood flow shift reduces the estimated venous admixture from 50% to about 20-25% of total cardiac output during OLV [36]. This mechanism helps maintain oxygenation during OLV, with PaO2 typically around 150-200 mm Hg when FiO2 is 1.0.
Accidental Endobronchial Intubation
Unintended endobronchial intubation (EBI) is a significant concern in anesthesia and intensive care, occurring in 1.6-12.9% of intubated patients [40,41]. While routine chest X- rays (CXRs) are commonly performed after intubation in emergency departments and intensive care units, they are not typically performed following each intubation for general anesthesia in the operating room due to increased costs and procedural delays. It is often detected during maintenance of anesthesia through unexplained oxygen desaturation, while capnography typically remains normal. Risk factors include head and neck surgery, use of RAE tubes, pediatric patients and female gender [40,42]. Contributing factors are primarily anesthesia-related, including inexperience, lack of knowledge, and haste. EBI can lead to serious complications such as lung collapse or pneumothorax. Implementing a sentinel event policy for EBI complications can encourage finding permanent solutions to this preventable problem [43].
Current prevention strategies include additional training, improved supervision, and established guidelines [40]. Regular checking of the tube position and raising awareness are crucial [43]. However, studies have shown that clinical examination alone is unreliable for assessing ETT placement, with up to 14% of patients requiring repositioning based on x-ray findings [44].In pediatric patients, 25% of ETTs remained mispositioned even after attempted correction [45]. Women are at higher risk for ETT mispositioning than men [46].
In the case of accidental right endobronchial intubation in the supine position, the situation differs from the intentional one-lung ventilation (OLV) used in thoracic surgery. The physiological responses and shunt fraction can vary significantly. In the supine position, before the onset of hypoxic pulmonary vasoconstriction (HPV), the shunt fraction can be quite high due to the complete collapse of one lung. Without the gravitational redistribution of blood flow that occurs in the lateral decubitus position, the shunt fraction could be even higher than the 20-25% typically seen in one-lung ventilation. It is reasonable to estimate the entire 45% of cardiac output to the left lung would contribute to shunt, although precise values can vary based on individual patient factors and lung physiology.
The supine position can also reduce FRC due to cephalad displacement of abdominal contents. This reduction can exacerbate atelectasis and increase shunting [47]. In the initial period after events like accidental endobronchial intubation, HPV cannot immediately compensate for the lack of ventilation. Overall, the supine position can lead to less effective ventilation-perfusion matching compared to positions that utilize gravity to optimize blood flow distribution, such as the lateral decubitus position.
At low FiO2 levels, this results in immediate desaturation and hypoxia. However, at FiO2 levels greater than 0.3, the arterial oxygen saturation may remain stable, preventing hypoxemia detection by pulse oximetry. This underscores the importance of vigilant monitoring and the limitations of pulse oximetry in detecting shunts at higher FiO2 levels. Nunn’s Isoshunt diagrams and Barker’s et al.[22] experiment provide strong evidence supporting these conclusions. With high FiO2 increase in the shunt fraction result in drop of PaO2 but not necessarily in oxygen saturation. Alternatively, on FiO2 <0.3 accidental endobronchial intubation will inevitably manifest itself with immediate desaturation.
Current Practice & Puidlines
There is no universal consensus on the ideal intraoperative FiO2 for patients with normal respiratory function. In practice, many anesthesiologists historically target an FiO2 in the range of 0.3–0.5 during maintenance, providing adequate oxygenation while avoiding the potential harms of hyperoxia [48]. In 2016, however, the World Health Organization (WHO) issued a recommendation to use FiO2 0.8 during abdominal surgeries to reduce surgical site infection risk.This high-FiO2 strategy remains contentious: some data suggest 80% FiO2 may indeed lower SSI rates without clearly increasing pulmonary complications, while other findings raise concerns about atelectasis or oxygen toxicity at such high oxygen levels [49].
A 2022 survey of European anesthesiologists found that most respondents use FiO2 ≥ 0.8 during induction and emergence, but typically < 0.6 during the maintenance phase. Notably, 42% of anesthesiologists were unaware of the WHO high-FiO2 guideline, and an additional 14% knew of it but chose not to follow it [50] .An analysis of practice in 29 UK hospitals (published 2018) reported intraoperative FiO2 settings ranging from 0.25 up to 1.0, with a median of about 0.5 – suggesting that 50% oxygen was a common default in those centers [51].More recently, a 2024 multi-center cohort study in the United States observed that most anesthesiologists there administer FiO2 in the 0.4–0.5 range during surgery, despite the WHO’s 0.8 recommendation. The authors noted substantial variability in oxygen practice, influenced by patient factors, provider preference, and institutional culture [52].
Emerging evidence is also informing this debate. For example, Park et al. (2018) found that reducing FiO2 from 1.0 to 0.3 at induction (and from 0.5 to 0.3 during maintenance) led to improved postoperative gas exchange in neurosurgical patients, without increasing adverse events [53].Additionally, a 2019 meta-analysis concluded that higher intraoperative FiO2 was associated with worse postoperative pulmonary outcomes (such as more atelectasis or impaired lung function) compared to lower FiO2 strategie [54].
Discussion
The considerations outlined above reinforce the idea that intraoperative oxygen administration should be more judicious. The classical iso-shunt curves illustrate that beyond a certain point, raising FiO2 yields minimal benefit in PaO2 when significant shunt is present. In clinical terms, a high FiO2 can preserve near-normal arterial hemoglobin saturation despite a developing intrapulmonary shunt, effectively concealing the problem. By contrast, deliberately using a lower FiO2 (around 0.21–0.3) means that even a modest V/Q mismatch or shunt will produce a noticeable drop in SpO2, serving as an early and reliable indicator of gas exchange deterioration.
As discussed, an inadvertent one-lung intubation may not cause any immediate desaturation if the patient is on a high FiO2, delaying its recognition. Barker et al. demonstrated in a comparative study that detection of endobronchial intubation via pulse oximetry was significantly delayed when FiO2 exceeded roughly 0.4[22]. In contrast, if FiO2 is kept below ~0.3, even partial lung ventilation issues will cause a prompt fall in SpO2, prompting immediate investigation and correction.
Furthermore, the purported benefits of routine high FiO2 (for example, to prevent infections) have not been consistently borne out by recent evidence. Several systematic reviews have found little support for the notion that supraphysiologic oxygen levels improve surgical outcomes, calling into question the practice of routine intraoperative hyperoxygenation [2,3,54]. It is worth noting that not all individual studies agree: one trial reported no increase in postoperative respiratory complications with an FiO2 of 0.8 throughout surgery [55], whereas another randomized trial found that using 60% FiO2 (versus 30%) led to a higher incidence of postoperative atelectasis [56]. Additionally, a large observational analysis linked intraoperative FiO2 levels above 0.8 with higher rates of major respiratory complications [57].On balance, however, the physiological rationale and cumulative evidence favor a conservative oxygen strategy in most cases.
Beyond the well-known hazards of excessive oxygen (oxygen toxicity and even fire risk in laser airway cases), our review highlights anoth[2,3,54er rationale for minimizing FiO2: the detection of hidden respiratory problems. High FiO2 can mask issues such as developing atelectasis, unrecognized ARDS, small pneumothoraces, or hypoventilation. By contrast, an FiO2 of 0.25–0.30 acts as a built-in “stress test” for the respiratory system by revealing a latent shunt by inducing a drop in saturation before the situation becomes critical. For example, an endotracheal tube advanced into a mainstem bronchus in an adult (thereby creating an ~40–50% shunt fraction in the supine position) will inevitably cause hypoxemia at FiO2 ~0.3, whereas at FiO2 1.0 the patient might remain well-oxygenated for a period. We therefore advocate adopting the lowest FiO2 that safely maintains SpO2 in the mid-90s (typically FiO2 ~0.21–0.3) as a default for patients without severe lung disease. Continuous pulse oximetry under this regimen provides a simple, noninvasive, and cost-free method to detect the earliest signs of hypoxemia. Of course, FiO2 should be individualized as needed for each patient, but starting with a low baseline FiO2 leverages fundamental physiology to enhance safety. This approach allows hypoxemia to be recognized and corrected before progressing to a severe event.
Conclusions
The routine practice of hyperoxygenation during general anesthesia warrants reconsideration. In patients with normal lungs (and no chronic respiratory disease), initiating and maintaining mechanical ventilation with FiO2 < 0.3 can enhance intraoperative safety by unmasking critical events like inadvertent endobronchial intubation or early pulmonary shunt. We recommend that future anesthesia protocols and guidelines encourage using the lowest FiO2 that maintains arterial saturation in an acceptable range (for example, SpO2 ~94–98%) as a default strategy for suitable patients. This approach is more physiologically sound and would likely reduce the incidence of oxygen-related complications (e.g., oxygen toxicity and absorption atelectasis), while also aligning intraoperative practice with contemporary critical care trends that favor conservative oxygen therapy. Ultimately, this paradigm shift prioritizes patient safety and diagnostic sensitivity, enabling earlier detection of gas exchange problems. Prospective clinical studies are needed to further validate the benefits of low-FiO2 strategies across diverse patient populations and surgical settings.
References
- Kabon, B.; Kurz, A. Optimal perioperative oxygen administration. Curr. Opin. Anaesthesiol. 2006, 19, 11–18. [Google Scholar] [CrossRef] [PubMed]
- Mattishent, K.; Thavarajah, M.; Sinha, A.; Peel, A.; Egger, M.; Solomkin, J.; de Jonge, S.; Latif, A.; Berenholtz, S.; Allegranzi, B.; et al. Safety of 80% vs 30–35% fraction of inspired oxygen in patients undergoing surgery: a systematic review and meta-analysis. Br. J. Anaesth. 2019, 122, 311–324. [Google Scholar] [CrossRef] [PubMed]
- Fasquel, C.; Huet, O.; Ozier, Y.; Quesnel, C.; Garnier, M. Effects of intraoperative high versus low inspiratory oxygen fraction (FiO2) on patient's outcome: A systematic review of evidence from the last 20 years. Anaesth. Crit. Care Pain Med. 2020, 39, 847–858. [Google Scholar] [CrossRef]
- de Jonge, S.W. and M.W. Hollmann, Perioperative Use of High Fraction of Inspired Oxygen: Another Null Result? Anesth Analg, 2019. 128(6): p. 1071-1073.
- Mellado Artigas Ricard, S.M. , Ferrando Carlos, Setting intraoperative fraction of inspired oxygen. Journal of Emergency and Critical Care Medicine, 2019. 3: p. 52.
- Wetterslev, J., et al., The effects of high perioperative inspiratory oxygen fraction for adult surgical patients. Cochrane Database Syst Rev 2015, 2015, CD008884. [CrossRef]
- Agrawal, J. Intraoperative Fraction of Inspired Oxygen: An Enigma to be Unravelled. Anaesth. Crit. Care Med. J. 2019, 4. [Google Scholar] [CrossRef]
- Høybye, M.; Lind, P.C.; Holmberg, M.J.; Bolther, M.; Jessen, M.K.; Vallentin, M.F.; Hansen, F.B.; Holst, J.M.; Magnussen, A.; Hansen, N.S.; et al. Fraction of inspired oxygen during general anesthesia for non-cardiac surgery: Systematic review and meta-analysis. Acta Anaesthesiol. Scand. 2022, 66, 923–933. [Google Scholar] [CrossRef]
- Romero-Ávila, P.; Márquez-Espinós, C.; Afonso, J.R.C. Historical development of the anesthetic machine: from Morton to the integration of the mechanical ventilator. Braz. J. Anesthesiol. (English Ed. 2021, 71, 148–161. [Google Scholar] [CrossRef]
- Dennis, D.; Torre, L.; Baker, S.; Hebden-Todd, T. A Snapshot of the Oxygenation of Mechanically Ventilated Patients in One Australian Intensive Care Unit. Anaesth. Intensiv. Care 2017, 45, 359–364. [Google Scholar] [CrossRef]
- Ghoshal, A.G. Hypoxemia and oxygen therapy. J. Assoc. Chest Physicians 2020, 8, 42. [Google Scholar] [CrossRef]
- Samson, H.H. Hypoventilation: its dangers in general anaesthesia. . 1956, 30, 470–4. [Google Scholar]
- Bendixen, H.H. and M.B. Laver, Hypoxia in Anesthesia: A Review. Clin Pharmacol Ther, 1965. 6: p. 510-39.
- Eichhorn, J.H. Prevention of Intraoperative Anesthesia Accidents and Related Severe Injury through Safety Monitoring. Anesthesiology 1989, 70, 572–577. [Google Scholar] [CrossRef]
- Hare, G.M.T.; Kavanagh, B.P. Hypoxemia during surgery: learning from history, science, and current practice. Can. J. Anaesth. 2010, 57, 877–881. [Google Scholar] [CrossRef]
- Eichhorn, J.H. and J.B. Eisenkraft, Expired oxygen as the unappreciated issue in preventing airway fires: getting to “never”. Anesth Analg, 2013. 117(5): p. 1042-4.
- Nicelli, E.; Gemma, M.; De Vitis, A.; Foti, G.; Beretta, L. Feasibility of standard mechanical ventilation with low FiO2 and small endotracheal tubes during laser microlaryngeal surgery. Head Neck 2009, 32, 204–209. [Google Scholar] [CrossRef]
- Benatar, S.R.; Hewlett, A.M.; Nunn, J.F. THE USE OF ISO-SHUNT LINES FOR CONTROL OF OXYGEN THERAPY. Br. J. Anaesth. 1973, 45, 711–718. [Google Scholar] [CrossRef]
- Lawler, P.G.P.; Nunn, J.F. A REASSESSMENT OF THE VALIDITY OF THE ISO-SHUNT GRAPH. Br. J. Anaesth. 1984, 56, 1325–1335. [Google Scholar] [CrossRef]
- Petros, A.J., C. J. Dore, and J.F. Nunn, Modification of the iso-shunt lines for low inspired oxygen concentrations. Br J Anaesth, 1994. 72(5): p. 515-22.
- Kallet, R.H.; Branson, R.D. Should Oxygen Therapy Be Tightly Regulated to Minimize Hyperoxia in Critically Ill Patients? Respir. Care 2016, 61, 801–817. [Google Scholar] [CrossRef] [PubMed]
- Barker, S.J.; Tremper, K.K.; Hyatt, J.; Heitzmann, H. Comparison of three oxygen monitors in detecting endobronchial intubation. J. Clin. Monit. Comput. 1988, 4, 240–243. [Google Scholar] [CrossRef]
- Zhou, G.; Karlen, W.; Brant, R.; Wiens, M.; Kissoon, N.; Ansermino, J.M. A transformation of oxygen saturation (the saturation virtual shunt) to improve clinical prediction model calibration and interpretation. Pediatr. Res. 2019, 86, 732–737. [Google Scholar] [CrossRef]
- PE., B. PE., B., Models of venous admixture. Advances in physiology education, 2001. 25(1-4): p. 159-166.
- Lumb, A.B. Nunn's Applied Respiratory Physiology; Elsevier: Amsterdam, NX, Netherlands, 2017. [Google Scholar]
- West, J.B. , Respiratory Physiology: The Essentials. 9 ed. 2011, Philadelphia: Lippincott Williams & Wilkins.
- Petersson, J.; Glenny, R.W. Gas exchange and ventilation–perfusion relationships in the lung. Eur. Respir. J. 2014, 44, 1023–1041. [Google Scholar] [CrossRef] [PubMed]
- Downs, J.B. , Has oxygen administration delayed appropriate respiratory care? Fallacies regarding oxygen therapy. Respir Care, 2003. 48(6): p. 611-20.
- Tobin, M.J.; Laghi, F.; Jubran, A. Why COVID-19 Silent Hypoxemia Is Baffling to Physicians. Am. J. Respir. Crit. Care Med. 2020, 202, 356–360. [Google Scholar] [CrossRef] [PubMed]
- Hedenstierna, G.; Meyhoff, C.S. Oxygen toxicity in major emergency surgery—anything new? Intensiv. Care Med. 2019, 45, 1802–1805. [Google Scholar] [CrossRef]
- Wang, H.; Wang, Z.; Wu, Q.; Yang, Y.; Liu, S.; Bian, J.; Bo, L. Perioperative oxygen administration for adults undergoing major noncardiac surgery: a narrative review. Med Gas Res. 2024, 15, 73–84. [Google Scholar] [CrossRef]
- Benoît, Z.; Wicky, S.; Fischer, J.-F.; Frascarolo, P.; Chapuis, C.; Spahn, D.R.; Magnusson, L. The Effect of Increased Fio2 Before Tracheal Extubation on Postoperative Atelectasis. Anesthesia Analg. 2002, 95, 1777–1781. [Google Scholar] [CrossRef]
- Fisher, A.O.; Husain, K.; Wolfson, M.R.; Hubert, T.L.; Rodriguez, E.; Shaffer, T.H.; Theroux, M.C. Hyperoxia during one lung ventilation: Inflammatory and oxidative responses. Pediatr. Pulmonol. 2012, 47, 979–986. [Google Scholar] [CrossRef]
- Kallet, R.H.; Zhuo, H.; Liu, K.D.; Calfee, C.S.; A Matthay, M. The Association Between Physiologic Dead-Space Fraction and Mortality in Subjects With ARDS Enrolled in a Prospective Multi-Center Clinical Trial. Respir. Care 2014, 59, 1611–1618. [Google Scholar] [CrossRef]
- Licker, M. , et al., The hypoxic pulmonary vasoconstriction: From physiology to clinical application in thoracic surgery. Saudi J Anaesth, 2021. 15(3): p. 250-263.
- Campos, J.H.; Feider, A. Hypoxia During One-Lung Ventilation—A Review and Update. J. Cardiothorac. Vasc. Anesthesia 2018, 32, 2330–2338. [Google Scholar] [CrossRef]
- Smith, G., F. W. Cheney, Jr., and P.M. Winter, The effect of change in cardiac output on intrapulmonary shunting. Br J Anaesth, 1974. 46(5): p. 337-42.
- Brunston, R.L., Jr. , et al., Organ blood flow during arteriovenous carbon dioxide removal. ASAIO J, 1997. 43(5): p. M821-4.
- Johnson, D.W.; Roy, T.K.; Secomb, T.W. Analysis of flow resistance in the pulmonary arterial circulation: implications for hypoxic pulmonary vasoconstriction. J. Appl. Physiol. 2021, 131, 1211–1218. [Google Scholar] [CrossRef]
- Sintavanuruk, K.; Rodanant, O.; Kositanurit, I.; Akavipat, P.; Pulnitiporn, A.; Sriraj, W. The Thai Anesthesia Incident Monitoring Study (Thai AIMS) of endobronchial intubation: an analysis of 1996 incident reports. . 2008, 91, 1854–60. [Google Scholar] [PubMed]
- Hernandez Padilla, A.C.; Trampont, T.; Lafon, T.; Daix, T.; Cailloce, D.; Barraud, O.; Dalmay, F.; Vignon, P.; François, B. Is prehospital endobronchial intubation a risk factor for subsequent ventilator associated pneumonia? A retrospective analysis. PLOS ONE 2019, 14, e0217466. [Google Scholar] [CrossRef] [PubMed]
- McCoy, E.P., W. J. Russell, and R.K. Webb, Accidental bronchial intubation. An analysis of AIMS incident reports from 1988 to 1994 inclusive. Anaesthesia, 1997. 52(1): p. 24-31.
- Al-Qahtani, A.S.; Messahel, F.M.; Ouda, W.O.A. Inadvertent endobronchial intubation: A sentinel event. Saudi J. Anaesth. 2012, 6, 259–62. [Google Scholar] [CrossRef] [PubMed]
- Brunel, W.; Coleman, D.L.; Schwartz, D.E.; Peper, E.; Cohen, N.H. Assessment of Routine Chest Roentgenograms and the Physical Examination to Confirm Endotracheal Tube Position. Chest 1989, 96, 1043–1045. [Google Scholar] [CrossRef]
- Levy, F.H.; Bratton, S.L.; Jardine, D.S. Routine Chest Radiographs Following Repositioning of Endotracheal Tubes Are Necessary to Assess Correct Position in Pediatric Patients. Chest 1994, 106, 1508–1510. [Google Scholar] [CrossRef] [PubMed]
- Schwartz, D.E.; Lieberman, J.A.; Cohen, N.H. Women are at greater risk than men for malpositioning of the endotracheal tube after emergent intubation. Crit. Care Med. 1994, 22, 1127–1131. [Google Scholar] [CrossRef]
- Hedenstierna, G.; Brismar, B.; Strandberg, Å.; Lundquist, H.; Tokics, L. NEW ASPECTS ON ATELECTASIS DURING ANAESTHESIA. Clin. Physiol. Funct. Imaging 1985, 5, 127–131. [Google Scholar] [CrossRef]
- Suzuki, S. , et al., Current Ventilator and Oxygen Management during General Anesthesia: A Multicenter, Cross-sectional Observational Study. Anesthesiology, 2018. 129(1): p. 67-76.
- Allegranzi, B. , et al., New WHO recommendations on intraoperative and postoperative measures for surgical site infection prevention: an evidence-based global perspective. Lancet Infect Dis, 2016. 16(12): p. e288-e303.
- Scharffenberg, M.; Weiss, T.; Wittenstein, J.; Krenn, K.; Fleming, M.; Biro, P.; De Hert, S.; Hendrickx, J.F.A.; Ionescu, D.; de Abreu, M.G.; et al. Practice of oxygen use in anesthesiology – a survey of the European Society of Anaesthesiology and Intensive Care. BMC Anesthesiol. 2022, 22, 1–11. [Google Scholar] [CrossRef]
- Morkane, C.M.; McKenna, H.; Cumpstey, A.F.; Oldman, A.H.; Grocott, M.P.W.; Martin, D.S. Correction to: Intraoperative oxygenation in adult patients undergoing surgery (iOPS): a retrospective observational study across 29 UK hospitals. Perioper. Med. 2018, 7, 26. [Google Scholar] [CrossRef]
- Billings, F.T.t. , et al., Determinants and Practice Variability of Oxygen Administration during Surgery in the United States: A Retrospective Cohort Study. Anesthesiology, 2024. 141(3): p. 511-523.
- Park, J.; Min, J.J.; Kim, S.J.; Ahn, J.H.; Kim, K.; Lee, J.-H.; Park, K.; Chung, I.S. Effects of lowering inspiratory oxygen fraction during microvascular decompression on postoperative gas exchange: A pre–post study. PLOS ONE 2018, 13, e0206371. [Google Scholar] [CrossRef]
- Koo, C.-H.; Park, E.Y.; Lee, S.Y.; Ryu, J.-H. The Effects of Intraoperative Inspired Oxygen Fraction on Postoperative Pulmonary Parameters in Patients with General Anesthesia: A Systemic Review and Meta-Analysis. J. Clin. Med. 2019, 8, 583. [Google Scholar] [CrossRef]
- Cohen, B. , et al., Intra-operative high inspired oxygen fraction does not increase the risk of postoperative respiratory complications: Alternating intervention clinical trial. Eur J Anaesthesiol, 2019. 36(5): p. 320-326.
- Jiang, Z.; Liu, S.; Wang, L.; Li, W.; Li, C.; Lang, F.; Li, R.; Zhou, Y.; Wu, J.; Cai, Y.; et al. Effects of 30% vs. 60% inspired oxygen fraction during mechanical ventilation on postoperative atelectasis: a randomised controlled trial. BMC Anesthesiol. 2023, 23, 1–10. [Google Scholar] [CrossRef] [PubMed]
- Staehr-Rye, A.K.; Meyhoff, C.S.; Scheffenbichler, F.T.; Melo, M.F.V.; Gätke, M.R.; Walsh, J.L.; Ladha, K.S.; Grabitz, S.D.; Nikolov, M.I.; Kurth, T.; et al. High intraoperative inspiratory oxygen fraction and risk of major respiratory complications. Br. J. Anaesth. 2017, 119, 140–149. [Google Scholar] [CrossRef] [PubMed]
Figure 1.
Isoshunt Diagram: PaO2 vs. FiO2 (50%,30%,20%,10%,0%) Curves: each curve corresponds to a fixed percentage of shunted blood. Iso-shunt curves depict the relationship between inspired oxygen fraction (FiO2) and arterial oxygen tension (PaO2) at different constant shunt fractions. In normal lungs with minimal shunt, PaO, increases almost linearly with FiO2. As shunt fraction rises, the PaO2 response progressively flattens, so that even FiO2 = 1.0 may not achieve PaO2 > 100 mmHg when shunt exceeds ~30%.
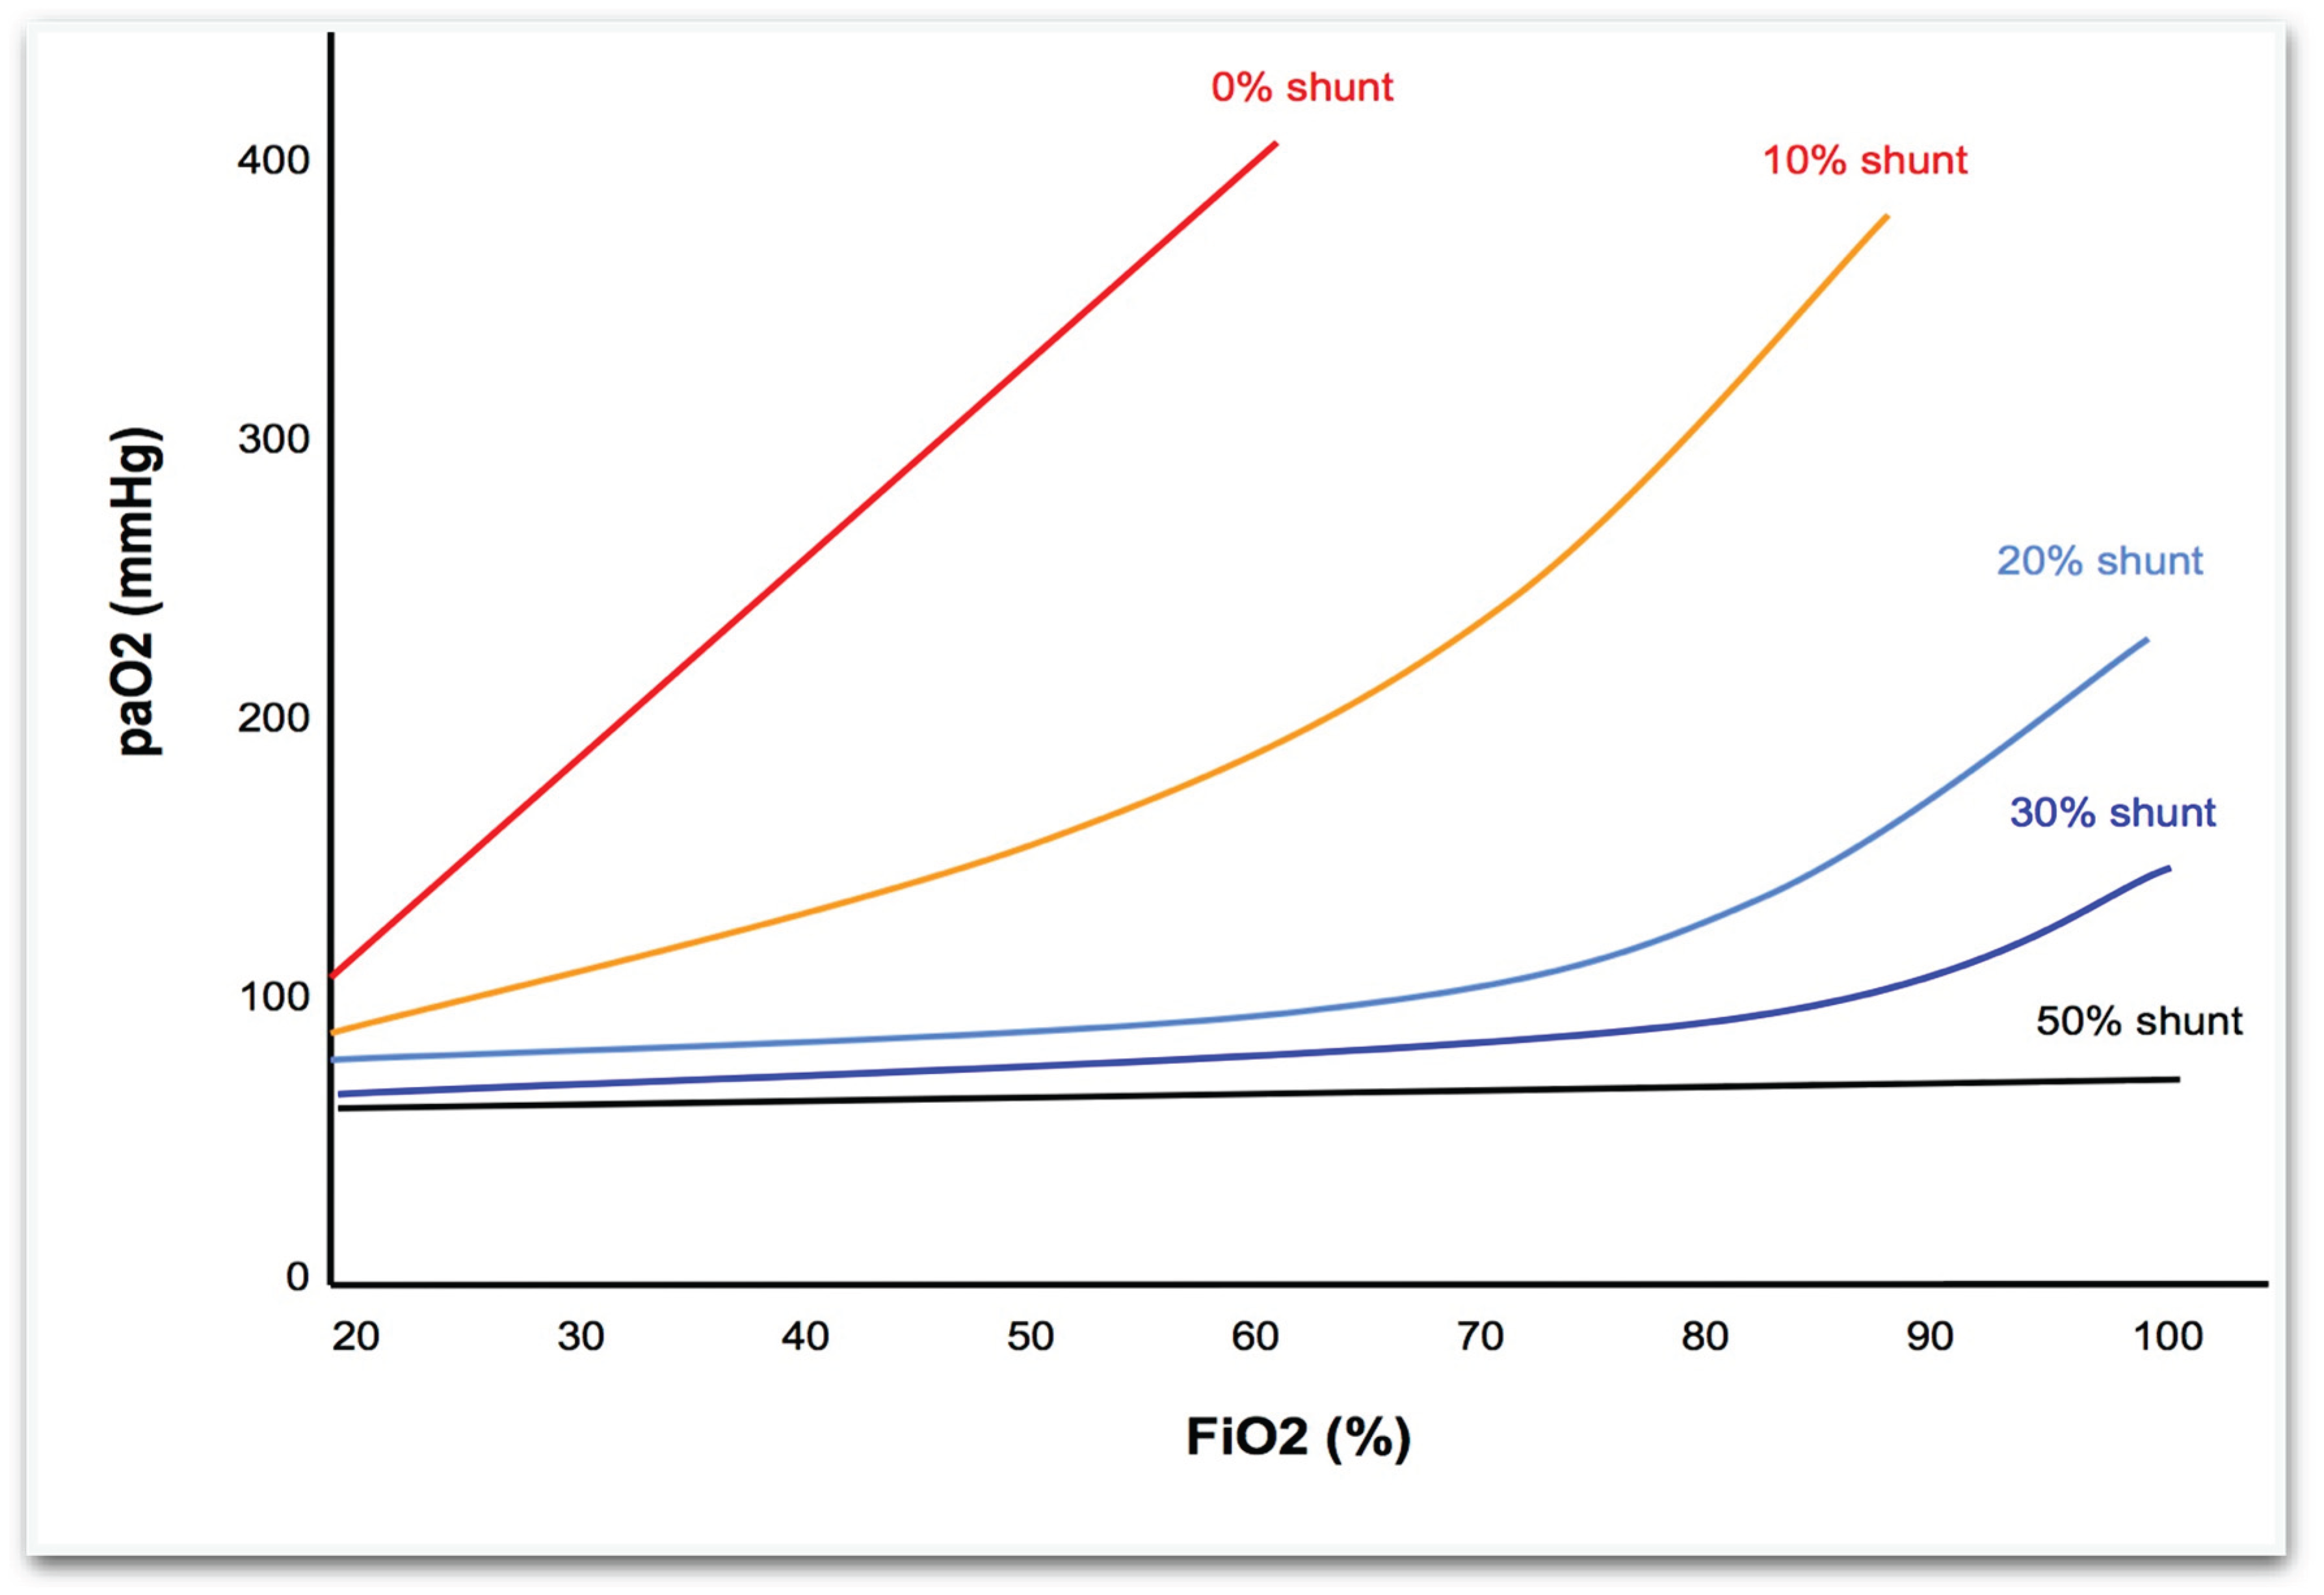
Figure 2.
Isoshunt Diagram: SaO2 vs. FiO2 (50%,40%,30%,20%, 10%,5%,0%) :each curve corresponds to a fixed percentage of shunted blood.
Figure 2.
Isoshunt Diagram: SaO2 vs. FiO2 (50%,40%,30%,20%, 10%,5%,0%) :each curve corresponds to a fixed percentage of shunted blood.
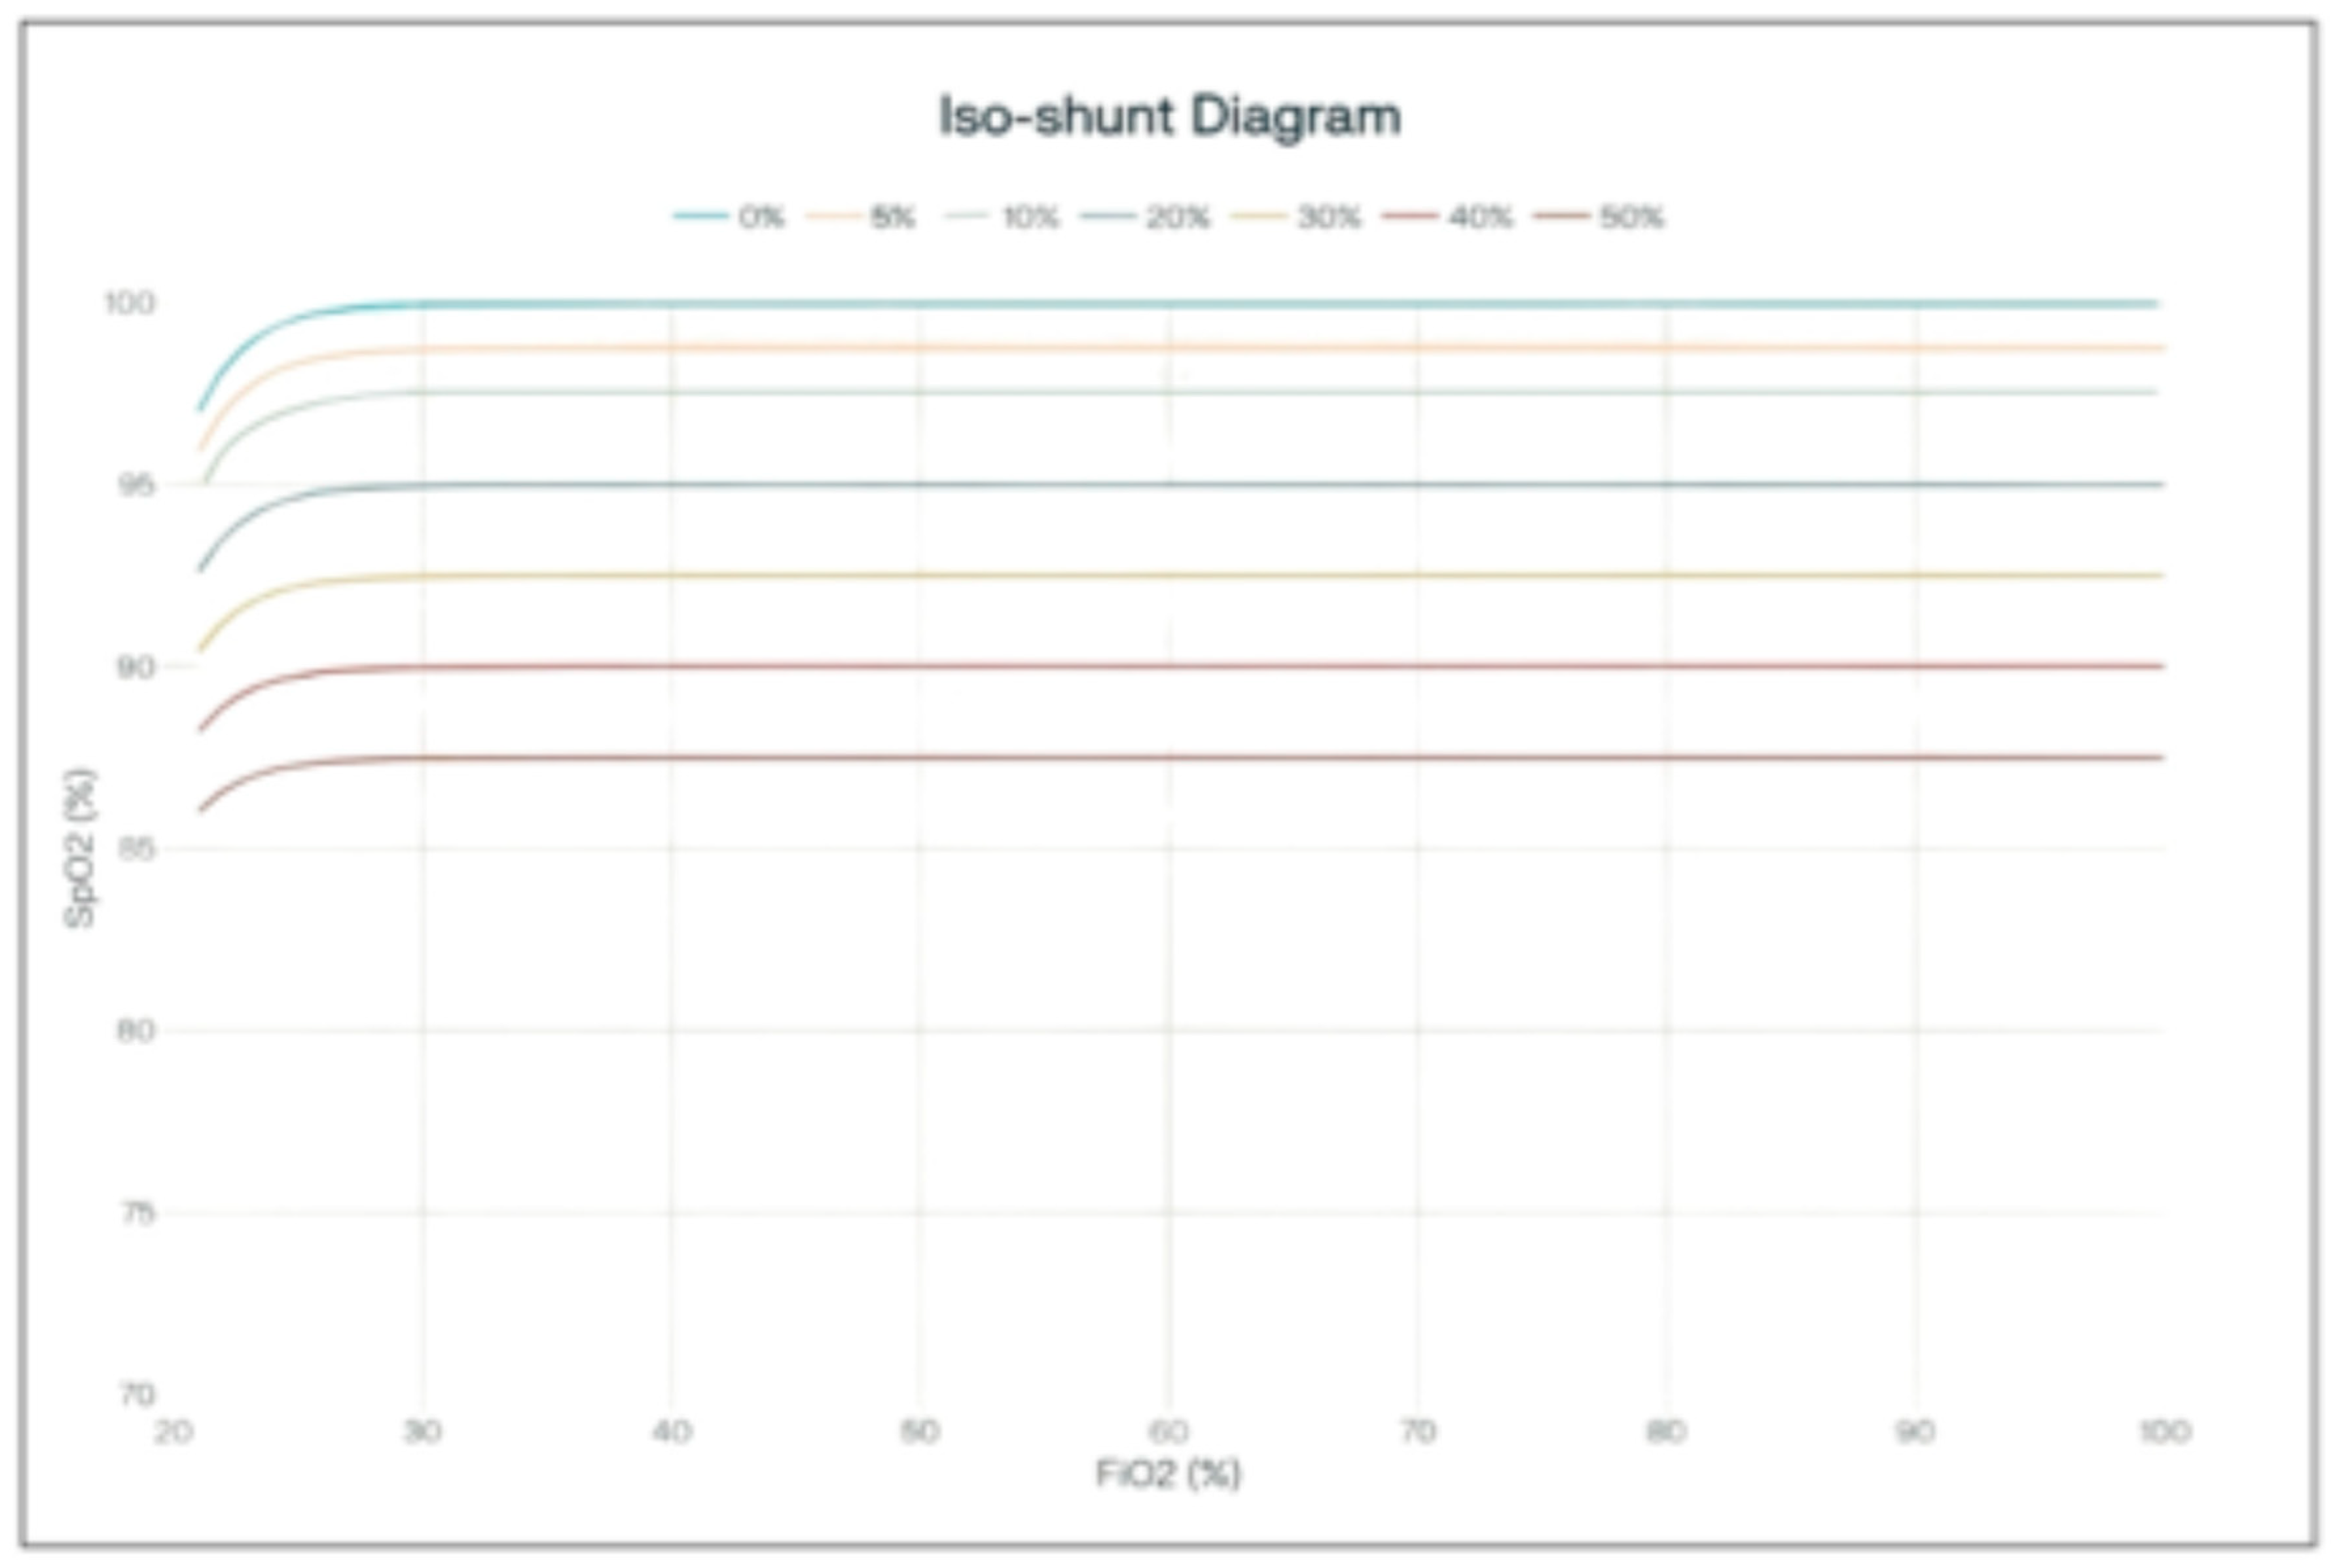

Table 1.
Relationship between FiO2 and oxygenation in the presence of a 30% shunt (Data adapted from Petros AJ et al., Br J Anaesth, 1994).
Table 1.
Relationship between FiO2 and oxygenation in the presence of a 30% shunt (Data adapted from Petros AJ et al., Br J Anaesth, 1994).
| FiO2 | PaO2 (30% Shunt) | SaO2 (%) |
| 1.0 | 100 mmHg | 98% |
| 0.5 | 75 mmHg | 94% |
| 0.3 | 58 mmHg | 89% |
| 0.21 | 45 mmHg | 80% |
Disclaimer/Publisher’s Note: The statements, opinions and data contained in all publications are solely those of the individual author(s) and contributor(s) and not of MDPI and/or the editor(s). MDPI and/or the editor(s) disclaim responsibility for any injury to people or property resulting from any ideas, methods, instructions or products referred to in the content. |
© 2025 by the authors. Licensee MDPI, Basel, Switzerland. This article is an open access article distributed under the terms and conditions of the Creative Commons Attribution (CC BY) license (http://creativecommons.org/licenses/by/4.0/).
Copyright: This open access article is published under a Creative Commons CC BY 4.0 license, which permit the free download, distribution, and reuse, provided that the author and preprint are cited in any reuse.


