
Submitted:
29 August 2025
Posted:
29 August 2025
You are already at the latest version
Abstract
Pulse Wave Velocity (PWV) is a useful biomarker in the monitoring and risk stratification of various cardiovascular diseases including hypertension. The current gold standard for non-invasive is carotid-femoral PWV (cfPWV) measurement via direct tonometry. However, cfPWV is limited as it can only provide global and not local PWV measurement, hence an alternative local PWV measure is needed. One alternative is ultrasound whose good penetration depth, accessibility, low-cost nature makes it an ideal measurement mode for non-invasive, real-time acquisition of hemodynamic parameters to determine PWV. This paper will discuss the use of ultrasound imaging in vessel data acquisition, cover the different ultrasound-based imaging modalities for acquiring area and velocity data, and compare between simultaneous and non-simultaneous data acquisition for PWV estimation.
Keywords:
ultrasound imaging
; doppler measurement
; continuous blood vessel measurements
; pulse wave velocity
1. Introduction
The Pulse Wave Velocity (PWV) is the rate at which pressure waves propagate through the arterial system [1]. Clinically, PWV has been established as a reliable, non-invasive measure of arterial stiffness [2] and an independent risk predictor of adverse cardiovascular events including hypertension [3,4]. Further explorations into PWV utility have led to the study of PWV as a possible parameter in the non-invasive monitoring of key cardiovascular measurements such as arterial blood pressure (ABP) [5]. In particular, the use of PWV in ABP measurement presents as a possible improvement to the current non-invasive clinical method of sphygmomanometry in allowing for more continuous monitoring of ABP and therefore facilitating investigations into the dynamic behaviour of the arterial system.
The current gold standard for non-invasive PWV measurement is the carotid-femoral PWV (cfPWV) measurement via direct tonometry [6,7] which involves measuring the transit time of the arterial waveform from one point on the carotid to a second point on the femoral artery [7,8]. However, the global nature of cfPWV in measurement over a long arterial segment limits the effectiveness of the method. Firstly, the distance measurement in cfPWV does not account for the path of blood from the aortic arch to the carotid artery, hence assumptions are made to appropriately adjust the measured time taken which limits the accuracy of the method [8,9]. Secondly, global cfPWV measurement conceals variations in arterial stiffness and mechanical properties of vessels [7,10] that may cause differences in local PWV. Additionally, previous studies have concluded that global PWV is less useful in providing significant clinical information than local PWV, taken in a specific arterial segment, in assessing arterial properties [11,12,13]. Hence, the utility of cfPWV method is limited.
Considering the value of PWV measurements in the monitoring of cardiovascular health and the limitations of global cfPWV, further research has investigated non-invasive alternatives for local PWV determination including magnetic resonance imaging (MRI) [14,15], plethysmography [4,16], and ultrasound [16]. Of particular interest among these methods is ultrasound which leverages on presence of and frequency shifts [17] in reflected high frequency sound waves for measurements at specific locations on the arterial tree. Ultrasound-based local PWV methods are indirect and require intermediate measurands for calculation and determination of PWV. These measurands include the diameter or lumen area of the artery and the velocity of blood flow in the measured region [5,16,18,19,20,21,22,23].
This review will discuss use of ultrasound imaging in vessel data acquisition, cover the different ultrasound-based imaging modalities for acquiring area and velocity data, and compare between simultaneous and non-simultaneous data acquisition for PWV estimation.
2. Background of Ultrasound Measurement for PWV Estimation
2.1. Loop-Based Estimation for PW
Imaging-based methods determine the pulsatile wave from haemodynamic variables including blood velocity, flow, wall velocity or acceleration [5,16,18,19,20,21,22,23,24], and vessel lumen diameter or cross-sectional area. In many imaging-based methods, the waveforms for a pair of haemodynamic variables are acquired over the cardiac cycle and plotted together to give a haemodynamic loop such as the lnDiameter-velocity (lnDU) loop (Figure 1) [20,21] or the flow rate-area (QA) loop (Figure 2) [19]. From the loops, the PWV is determined based on the gradient of the linear portion of the curve.
To ensure high accuracy of measurement and owing to precise measurement needed over each cardiac cycle, the techniques used in imaging-based PWV measurement require high framerates to provide adequately high temporal resolution [16].
2.2. Functioning Principles Behind Ultrasound Measurement
Non-invasive ultrasound-based PWV measurement has continued to be of great interest in PWV research given the various advantages of ultrasound such as its good penetration depth [25], the ability to conduct real-time imaging [26,27], and existing use in cardiovascular monitoring [28]. In ultrasound measurement, transducers containing piezoelectric elements emit and receive high frequency sounds typically in the diagnostic range of 2 – 15 MHz [29] for measurement with different modes available in the ultrasound system to capture different variables.
Area or diameter measurement using ultrasound takes advantage of the phenomenon wherein the naturally differing acoustic impedances of tissues cause partial reflections and hence variations in the return time of ultrasound echoes [30]. Meanwhile, velocity or acceleration measurement, utilises the Doppler effect to perform measurement [31].
One area of development in using ultrasound to obtain PWV is in the methodology used. The exact methodology of ultrasound-based PWV measurement varies from using incremental lumen area displacements across an arterial segment [24] to measurement of velocity and area at one point on the arterial segment [5,19,21]. Variations in methodology also involve simultaneous or non-simultaneous data acquisition, number of transducers used [32], and data processing techniques of measured variables such as the use of the QA [5,19] or ln-DU loop [21,33,34]. Advances in ultrasound measurement have also focused on upgrades in the electronics and computation of the ultrasound system. These improvements involve better scanning capabilities such as plane wave insonification, coherent spatial compounding, multiline transmission, and motion matching technique that serve to improve framerates and therefore temporal resolution [16].
2.3. Advantages of Ultrasound Imaging
As an imaging modality, ultrasound is relatively low-cost compared to the other imaging methods used clinically such as computed tomography (CT) and MRI [35]. Additionally, current ultrasound machines allow not only for real-time imaging of the arterial segment of interest but the variety of transducers available also allow for imaging and data acquisition from both shallower arteries like the common carotid arteries [36,37] and deeper central arteries like the abdominal aorta [38].
There are also several factors that make ultrasound more favourable than MRI, which is considered as another non-invasive alternative in routine PWV measurement. Apart from the cost, a limiting factor of MRI utility compared to ultrasound is the long duration [39,40,41] and the need for breath-hold to minimise noise during acquisition [15]. Breath-hold usually occurs over a period of 10-20s and may not be possible in some patients including individuals with shortness of breath or cardiac failure [15]. Moreover, in comparison to the large, generally immovable machinery used in MRI, ultrasound machines are more compact and portable [42] with ultrasound being used regularly in hospitals and clinics for in cardiology and obstetrics [43]. Furthermore, improvements in ultrasound transducer technology have also led to the creation of handheld transducers that can be connected directly to smartphones [44], thereby further increasing accessibility of ultrasound.
These advantages make ultrasound favourable for clinical applications in routine measurement of PWV and monitoring of cardiovascular health.
3. Key Challenges and Considerations in Ultrasound Imaging for PWV Measurement
Given the advantages ultrasound imaging has over other methods, the use of ultrasound imaging in PWV measurement warrants continued research and development. This thereby involves the management of challenges and awareness of key considerations in the ultrasound imaging measurement process.
3.1. Challenges in Ultrasound Imaging
3.1.1. Wave Reflections
A key challenge faced by all imaging-based methods, particularly in the use of the haemodynamic loops is the presence of reflected waves. Wave reflections occur due to impedance mismatches in the arterial tree such as at sites of bifurcation and tapering as vessel size decreases in the periphery [45,46]. The presence of backward reflected waves complicates PWV calculations based on forward blood flow and cause an undesired divergence in the pressure and flow waveforms [46,47]. To circumvent the issue, the gradient of most linear portion of the loop is used which corresponds to the reflection-free period of the cardiac cycle. However, this solution is not foolproof as while this period is typically found during early systole [5], the presence and duration of the reflection free period may vary depending on the imaged vessel [48,49]. Moreover, this may put a further limitation on the measurement location as peripheral vessels have significantly shorter reflection-free periods than more central arteries [5]. Yet while wave reflection may still cause wrong estimates for PWV [50], it is argued that high sampling rate and knowledge of wave speed can help to separate forward from backward flow [5].
3.1.2. Operator Skill Issue
A challenge that is more specific to ultrasound measurement is operator skill as this measurement modality is highly operator dependent during both image acquisition and data interpretation [51]. This operator dependence presents a risk in accuracy reduction and in impacting the intra- and inter-operator repeatability of measurements [52]. Given the prevalence of ultrasound in clinical use [53], several studies have examined methods to tackle reliance on operator skill.
For vessel image acquisition, automatic wall tracking methods assist in attaining more accurate, precise and consistent measurements of vessel diameter changes over the cardiac cycle [54,55,56,57]. In Doppler ultrasound for velocity or volumetric flow measurements, a study suggested that greater operator independence may be achieved using 3D Doppler ultrasound that captures volumetric data rather than the velocity data in a specific plane, thereby reducing the need precisely transducer alignment [58]. However, despite these purported improvements, the method still relies on doppler angle correction by the operator wherein inaccuracies in angle estimation can introduce velocity measurement errors [59]. Moreover, 3D Doppler reduces but does not eliminate precise probe alignment as a poorly positioned transducer relative to vessel can cause signal degradation and measurement errors. While these methods help to assist in reducing issues due to operator skill, they do not yet sufficiently mitigate possible issues arising from poor positioning and angling of transducers or sub-optimal selection of the region of interest in ultrasound technology.
A future approach to tackling operator skill reliance is the use of machine learning to assist in data acquisition. Machine learning systems may be able to provide real-time feedback or guidance to operators during image acquisition itself along with image quality control and automatic rather than manual selection of the vessel region of interest [27].
3.2. Considerations in Ultrasound Imaging
Considerations in the use of ultrasound for PWV measurement involve accounting for limitations in current ultrasound technology to optimise data acquisition.
3.2.1. Key Software-Based Imaging Parameters in Ultrasound Data Acquisition
In ultrasound measurement, there are several key parameters that need to be considered and, where needed, adjusted for optimal measurement. These are summarised in Table 1. Several of the key imaging parameters such as pulse repetition frequency, frame rate, gain, and sampling frequency can be adjusted for on the ultrasound machines and consideration of these parameters is crucial as it affects the choice of measurement location and choice of transducer. For instance, PWV measurement in the abdominal aorta may require a 3.5MHz transducer that provides sufficient tissue penetration (>15cm) for imaging at the cost of lower image resolution [29] whereas it is likely more appropriate to use a higher 7.5MHz frequency transducer [60] that provides a lower penetration depth but higher image resolution for measurement in the more superficial common carotid artery (CCA).
3.2.2. Other Relevant Considerations for Optimising Data Acquisition
An important consideration for ultrasound imaging that is not software-based is the use of gel or water mediums during imaging. For the signals to be optimally transmitted through the tissue layers to arrive at the organ of interest, the transducer head must be in full contact with the skin surface. Given that large differences in acoustic impedances cause reflection of the sound waves, the presence of air pockets between the transducer head and the skin surface will prevent transmission of sound for imaging. Hence, a medium is used to decrease the difference in acoustic impedance [61]. There are several medium options used. For clinical imaging, a liquid gel is typically spread over the measurement location which is fast and convenient. However, a limitation is that the gel spreads inconsistently, particularly for irregular surface anatomy and reapplication might be needed for wider area measurement.
An alternative to liquid gels is the gel pad which is more suited for irregular surfaces such as the neck. These pads are laid over the area of interest or attached to the transducer head and provide a consistent and wide region for scanning [62]. Water baths are another alternative to gel mediums and involves submersion of the whole patient or a body part of the patient into water [63,64]. The water bath method has been shown to provide superior imaging quality when compared to gel-based imaging, particularly in peripheral vessels, and removes the need for direct skin contact. However, water immersion for imaging may be less convenient for imaging central arteries such as the CCA and abdominal aorta whose measurement locations are at the neck and back respectively.
Another consideration is the significant differences in acoustic impedances within the human body. Given that reflections in ultrasound are generated at tissue boundaries where the acoustic impedances differ, significant differences in acoustic impedance such as between tissue, bone, and gas can cause unwanted artifacts [65] like shadowing that prevent imaging of deeper tissue structures. This has implications on the feasibility of ultrasound imaging at different arteries. For instance, the thoracic aorta, which is surrounded by the rib bones, and gas in the lungs is typically not imaged by non-invasive ultrasound methods [66,67]. Meanwhile, while ultrasound imaging of the abdominal aorta is feasible, bowel gas may cause undesired artifacts that affect imaging [38,68]. The effect of bowel gas on abdominal aorta imaging may be mitigated with fasting prior to imaging [69].
4. Ultrasound Imaging Modes for Vessel Area Acquisition
4.1. Imaging Modalities
In area or diameter measurement, sound waves emitted by the transducer are partially reflected and transmitted at tissue boundaries with different acoustic impedances in the beam path which cause differences in echo return time and facilitates detection of different tissues at different depths [29]. There are three main imaging modes available on ultrasound machines, namely Amplitude (A-mode), Brightness (B-mode), and Motion (M-mode). However, owing to the lack of use of A-mode for vessel are acquisition and in clinical practice, only B-mode and M-mode (Figure 3) ultrasound will be discussed and are summarised in Table 2.
In both modes, transducer placement depends on the desired region of interest. In PWV measurement, the transducer is typically placed longitudinally, with the transducer head parallel to the vessel [5,33,34]. This is likely because subsequent velocity measurements need to be taken for calculations which requires longitudinal measurement either for Doppler ultrasound or flow profile analysis. Non-loop methods for PWV measurement such as pulse wave-based ultrasound manometry (PWUM) may also require longitudinal placement for observation of incremental vessel distension along the vessel [24].
4.2. Automatic Wall Distension Tracking Methods
In the measurement of vessel diameter, inbuilt digital callipers can be used to manually mark the desired region of interest for measurement. However, such manual tracking of wall distension in either B-mode or M-mode can be problematic due to its time-consuming and subjective manner, wherein, small deviations in placement from the measured region of interest due to visual identification can cause large errors in area measurement. Hence, developments of more objective and automatic wall tracking methods are crucial.
Owing to its necessity, wall tracking for ultrasound-based methods have been studied in detail from the use of threshold detectors to study echoes from the arterial wall [79] which is limited due to distance dependence to arterial wall that varies through the arterial cycle, to methods that use phase-locking devices which tracked a specific vessel wall echo [80,81]. Further developments also investigated combining the tracking system to B-mode imaging [82] and pressure recordings [83]. Alternatives to these phase-locking methods were also studied with the use of conventional autocorrelation, which is independent of radiofrequency (RF) centre frequency [84,85] but requires lower sampling rates, and subsequently RF cross-correlation [86,87]. Cross-correlation techniques, however, have an estimator bias that depends nonlinearly on actual displacement [54]. To address this, a modification was made to the autocorrelation method to estimate of mean Doppler frequency and RF centre frequency for wall tracking [88,89]. In this modified method, wall tracking is conducted by integrating wall velocities as estimated by Doppler techniques. This method was found to track wall vessel motion with lower bias and variance than previous cross-correlation methods which improves tissue tracking accuracy [54].
Another type of algorithm developed to measure vessel diameter using B-mode image utilises the differences in pixel intensity values or brightness within a user defined region of interest the determine wall location and hence measure diameter [55,57]. To accurately determine wall location, the transducer is placed longitudinally to the vessel. During acquisition, resolution of the images must be sufficiently high to observe the vessel wall layers. Additionally, electrocardiogram (ECG) gating may be employed to capture images over the cardiac cycle wherein the R signal is used as a reference point. An advantage of this algorithm is its purported simplicity that facilitates possible integration into current clinical machines while being robust to differences in image quality [55].
In automatic wall tracking, algorithms also exist for diameter measurement using transducer placed transverse to the vessel [56]. However, as aforementioned, transverse transducer placement is not optimal for subsequent velocity measurement and movement of the transducer may cause changes in measured region, hence such wall tracking methods are less useful in PWV acquisition.
5. Doppler Ultrasound Imaging Modes for Velocity Acquisition
In velocity or acceleration measurement, the Doppler ultrasound mode used leverages on the change in frequency of sound wave, or Doppler shift, due to reflectors such as blood elements, moving towards or away from the transducer to perform measurement (Figure 4) [90]. This frequency shift is proportional to velocity [90]. In Doppler imaging, the magnitude and presence of the Doppler shift is affected by the Doppler angle which is the angle between the ultrasound beam and the direction of blood flow [90]. As mentioned in Table 1, the Nyquist limit is crucial in image for the accurate measurement of velocity via Doppler ultrasound. Beyond the Nyquist limit, undesirable aliasing occurs which can appear as incomplete peaks in the velocity curve trace for spectral Doppler or as a colourful mixture of colours in the imaged vessel under colour Doppler mode [91].
There are four main Doppler modes that can conduct velocity measurement which are summarised in Table 2.
6. Non-Simultaneous Versus Simultaneous Area and Velocity Acquisition
This section focuses on the comparison and evaluation of ultrasound-based data acquisition for PWV calculations via the haemodynamic loop methods. As aforementioned, the loop methods namely, QA and lnDU, both require the acquisition of velocity and diameter from the artery of interest. However, there are differences in how data is acquired, whether simultaneously or non-simultaneously. Hence, this section aims to describe, compare, and evaluate these acquisition methods.
6.1. Non-Simultaneous Acquisition Methods
Non-simultaneous acquisition methods involve the use of one ultrasound transducer for both velocity and area measurements. The transducer is adjusted perpendicularly for area measurements and subsequent tilting and angle corrections are done for Doppler velocity imaging.
One non-simultaneous acquisition method utilises B-mode imaging for diameter acquisition and PW Doppler for velocity acquisition before using the lnDU loop for PWV measurement [60]. The method involves obtaining B mode images with the region of interest in the focal zone and the images must clearly capture anterior and posterior walls for optimal diameter curve measurement with little noise. Subsequently, using the same scan projection, PW Doppler is conducted with as small an angle correction as possible to prevent shifts in the scan location [60]. Angle correction is needed as Doppler imaging requires the Doppler angle for frequency shifts and velocity measurement. To prevent a mismatch in features of both diameter and velocity curves over each cardiac cycle, high frame rate electrocardiogram (ECG) gating is used during acquisition [95].
Another non-simultaneous acquisition method utilised M-mode imaging to record ultrasound data over 3 to 5 cardiac cycles for diameter acquisition. Akin to the previous method, after diameter acquisition, PW Doppler was used to extract maximum velocities across the vessel before using the QA loop for PWV measurement. To ensure proper alignment, the intima layers for both anterior and posterior walls had to be clearly visible. With the non-simultaneous acquisition, the transducer could be adjusted for optimal data collection and the diameter distension measurements were shown to be of high accuracy and precision [19].
6.2. Simultaneous Acquisition Methods
Simultaneous acquisition of diameter and velocity data is generally more complex than non-simultaneous acquisition owing to the need for acquisition of both velocity and diameter at the same transducer angle.
One simultaneous acquisition method tested on the CCA utilised M-mode for diameter measurement and PW Doppler for velocity measurement. Prior to data acquisition, the transducer was positioned longitudinally in B-mode, ensuring that the vessel walls were clearly delineated. The Doppler angle used was near optimal at 58 to 60 degrees and the Doppler gating was adjusted in B-mode as well. Subsequently, during measurement, a split screen was used to obtain both diameter and velocity data at a sampling frequency of 1000Hz. While PWV could be obtained in this method with simultaneous measurement of diameter and velocity, the gates and angles still needed to be adjusted manually which may affect the signals, particularly in the derivative calculations to obtain PWV from the lnDU loop [33,34]. This method was also used in separate research for testing on a position near the aortic arch wherein 10-beat cine loops were used in M-mode and PW Doppler imaging. A particular addition of note to the methodology is the use of a fluid filled phantom between probe and vessel which acts as an intermediate medium and prevents external pressure from the transducer from distorting the aortic wall motion [96].
Simultaneous acquisition may also be conducted with constant perpendicular placement of the ultrasound transducer via the perpendicular ultrasound velocimetry (PUV) technique. In this technique, velocity is not obtained via Doppler ultrasound but rather via cross-correlation techniques. The principle for measurement is like particle imaging velocimetry (PIV) [97] and PUV uses 2D cross-correlation in the time domain on raw RF data to determine the axial velocity distribution of the flow. In PUV, the ultrasound system is operated in fast B-mode or multiple M-line mode. A significant advantage of the perpendicular placement is the ability to measure diameter simultaneously without needing to account for angle correction [5].
Another simultaneous acquisition method akin to PUV similarly obtained measurements of diameter and velocity from B-mode images rather than M-mode and PW doppler. In this method, one dimensional (1D) cross-correlation techniques were employed to track wall motion and blood element speckle motion in the successive B-mode images [98]. For diameter measurement, 1D cross-correlation of successive frames was conducted separately for anterior and posterior walls and the wall motion waveform for each wall was given by the cumulative summation of displacements over time. Thereafter, diameter change waveform is obtained by the difference in wall displacement for anterior and posterior wall motion waveforms. The absolute diameter waveform can subsequently be obtained with knowledge of initial vessel diameter without distension. Meanwhile, velocity is determined by tracking and cross correlating the movement of the blood speckle pattern between frames wherein the highest correlation indicates the mostly likely location of blood element movement [98]. With knowledge of the displacement and imaging frame rate, velocity can be obtained. For accurate measurement, an ultrafast scanner is needed to adequately resolve the rapid acceleration and deceleration of blood during systole [98]. Akin to previous methods, ECG gating is used for time alignment while singular value decomposition (SVD) was used to separate weak blood and strong tissue signals [98].
Apart from the use of singular ultrasound beams as with the abovementioned methods, simultaneous acquisition can also be achieved with the use of multiple ultrasound beams. In multiple beam acquisition, colour Doppler is used blood flow velocity while diameter changes were measured using M-mode. The system consists of both the colour Doppler system and an echo-tracking subsystem that can use different ultrasound beams for velocity and diameter change respectively. These beams can be independently manipulated with an intersection between the beams at the range gate for both diameter and velocity measurement as shown in Figure 5 [99]. This method was found to have low variabilities in the maximum velocity and arterial diameter measurements despite the need to manipulate different beams, thereby supporting its reproducibility [100].
6.3. Comparison and Evaluation of Methods
Table 3 summarises the comparison of non-simultaneous and simultaneous methods in PWV parameter acquisition. In the acquisition of parameters for PWV measurement, non-simultaneous acquisition methods present as simpler and less computationally demanding options. However, a key limitation of non-simultaneous acquisition is the fact that velocity and diameter waveforms are not obtained at the same time [19,60]. This lack of simultaneity is a source of error in PWV assessment due to an inaccurate time alignment between the two curves despite methods to ensure as close an alignment as possible. Additionally, the possibility of inter-cycle variations between diameter and velocity acquisition implies that even with accurate time alignment [101], the measured diameter at each instance may not correspond to the velocity measured at the same timepoints. This issue may be overcome by estimating velocity and diameter from the same data or with the use of one transducer angled oblique to the vessel and another perpendicular to the vessel for respective velocity and diameter measurement at the same region of interest [32,99].
In general, while simultaneous acquisition was more computationally complex, the advantage and limitations of each method varied. Of the discussed methods, the cross-correlation-based methods have a unique advantage in the ability to perform measurements with the use of B-mode imaging, meaning that the transducer is kept in one position throughout acquisition. This ensures that the imaged region is constant, thereby preventing errors that may arise from Doppler angle adjustment. However, this method is computationally intense and may not be use in regions of excessively high velocities due to the limitations on the ultrasound system, which can be problematic for clinical use [5]. In contrast, while the dual ultrasound beam method required positioning of two beams, the results had good reproducibility [99,100]. Additionally, the ability to independently manipulate the beams may allow for flexibility in conducting measurement.
In all, while no one method is currently optimal, simultaneous acquisition methods have a distinct advantage in preventing errors due to delays or possible physiological differences between cardiac cycles. Each discussed method has advantages that can be leveraged for improving acquisition, hence, apart from comparisons between the methods, for future work, it is crucial to note the various means by which acquisition can be further improved. For instance, the use of ECG gating allows for consistent measurements over each cardiac cycle which improves repeatability of measurement. Meanwhile, the use of filters such as singular value decomposition to separate tissue signals can improve signal to noise ratio in data acquisition, particularly in Doppler ultrasound wherein noise can result in aliasing and affect velocity measurement.
7. Conclusions
This paper has summarised the use of ultrasound imaging in vessel data acquisition, covered the different ultrasound-based imaging modalities for acquiring area and velocity data, and compared between simultaneous and non-simultaneous data acquisition for PWV estimation. Based on the reviewed literature, despite its challenges and considerations, ultrasound remains a promising means by which PWV can be obtained non-invasively. It is key, therefore, to carefully adjust the key parameters when using the various imaging modalities for measurement, particularly in the use of Doppler ultrasound for velocity measurement. In the comparison of simultaneous and non-simultaneous acquisition, it is evident that there is currently no optimal method for data acquisition, however, simultaneous acquisition, once optimised, would allow for the acquisition of both diameter and velocity waveforms that prevents errors arising due to physiological differences between two cardiac cycles.
Future developments in the use of ultrasound for PWV measurement will likely focus on improvements to be made in the acquisition phase as well as improvements in processing the ultrasound data post-acquisition. Firstly, experimental investigations between non-simultaneous and simultaneous methods can be conducted to better compare the accuracy and feasibility of each method and to improve upon the best-performing method. For other improvements in haemodynamic variable acquisition via ultrasound, the discussed challenges present possible avenues of work. Given that wave reflections can greatly affect data acquisition, further research into wave analysis methods to effectively separate forward and backward flow is warranted. Additionally, operator reliance is another key limitation that significantly affects data quality wherein further study into machine learning may reduce operator-based errors by automating part of the acquisition process or providing feedback to operators during acquisition. Apart from addressing challenges, working around the limitations of ultrasound imaging is another area of improvement such as considering the use of mediums, the design of the ultrasound transducer, or developing a standardised method to limit the effect of motion or differences in acoustic impedance and ensure consistently high data quality. Another area for development includes improvements in processing of ultrasound data after acquisition. These include determining the most accurate models for PWV estimation and subsequent applications of PWV such as in pressure estimation.
Overall, ultrasound is a promising non-invasive alternative to the current non-invasive gold standard of carotid-femoral PWV (cfPWV) measurement via direct tonometry and further research needs to be conducted to overcome current constraints and ensure accuracy, reliability, and repeatability for clinical use.
Conflicts of Interest statement
We have no conflicts of interest to disclose.
Author Contributions
V.C. drafted the initial manuscript, and all authors contributed to revisions. H.L. and Y.R. critically reviewed and provided feedback on the manuscript, ensuring its accuracy and clarity.
Funding
The authors received no financial support for the research, authorship, and/or publication of this article.
Glossary
| ABP | Arterial Blood Pressure |
| CCA | Common Carotid Artery |
| cfPWV | Carotid-Femoral Pulse Wave Velocity |
| CT | Computed Tomography |
| ECG | Electrocardiography |
| lnDU | lnDiameter-Velocity |
| MRI | Magnetic Resonance Imaging |
| PIV | Particle Image Velocimetry |
| PRF | Pulse Repetition Frequency |
| PUV | Perpendicular Ultrasound Velocimetry |
| PWUM | Pulse Wave-Based Ultrasound Manometry |
| PWV | Pulse Wave Velocity |
| QA | Flow-Area |
| SVD | Singular Value Decomposition |
| TGC | Time Gain Compensation |
References
- F. J. Callaghan, C. F. Babbs, J. D. Bourland, and L. A. Geddes. The relationship between arterial pulse-wave velocity and pulse frequency at different pressures. J. Med. Eng. Technol. 1984, 8, 15–18. [Google Scholar] [CrossRef]
- A. P. Avolio, T. Kuznetsova, G. R. Heyndrickx, P. L. M. Kerkhof, and J. K.-J. Li. Arterial Flow, Pulse Pressure and Pulse Wave Velocity in Men and Women at Various Ages. in Sex-Specific Analysis of Cardiovascular Function, Springer, Cham 2018, 153–168. [CrossRef]
- Y. Lu et al.. Global distributions of age- and sex-related arterial stiffness: systematic review and meta-analysis of 167 studies with 509,743 participants. eBioMedicine 2023, 92, 104619. [Google Scholar] [CrossRef]
- N. Pilz, V. Heinz, T. Ax, L. Fesseler, A. Patzak, and T. L. Bothe. Pulse Wave Velocity: Methodology, Clinical Applications, and Interplay with Heart Rate Variability. Rev. Cardiovasc. Med. 2024, 25, 266. [Google Scholar] [CrossRef] [PubMed]
- B. W. A. M. M. Beulen, N. Bijnens, G. G. Koutsouridis, P. J. Brands, M. C. M. Rutten, and F. N. van de Vosse. Toward noninvasive blood pressure assessment in arteries by using ultrasound. Ultrasound Med. Biol. 2011, 37, 788–797. [Google Scholar] [CrossRef]
- S. Badhwar et al.. Clinical Validation of Carotid-Femoral Pulse Wave Velocity Measurement Using a Multi-Beam Laser Vibrometer: The CARDIS Study. Hypertension 2024, 81, 1986–1995. [Google Scholar] [CrossRef]
- C. -J. Tang, P.-Y. Lee, Y.-H. Chuang, and C.-C. Huang. Measurement of local pulse wave velocity for carotid artery by using an ultrasound-based method. Ultrasonics 2020, 102, 106064. [Google Scholar] [CrossRef]
- L. STONER et al.. Associations Between Carotid-Femoral and Heart-Femoral Pulse Wave Velocity in Older Adults: The Atherosclerosis Risk in Communities (ARIC) Study. J. Hypertens. 2020, 38, 1786–1793. [Google Scholar] [CrossRef]
- K. Hirata, M. Kawakami, and M. F. O’Rourke. Pulse Wave Analysis and Pulse Wave Velocity. Circ. J. 2006, 70, 1231–1239. [Google Scholar] [CrossRef]
- M. A. Darwich. Local Pulse Wave Velocity Estimation in the Carotids Using Dynamic MR Sequences.” Accessed: Apr. 15, 2025. [Online]. Available: https://www.scirp.org/journal/paperinformation?paperid=55379.
- J. Vappou, J. Luo, K. Okajima, M. Di Tullio, and E. Konofagou. Aortic pulse wave velocity measured by pulse wave imaging (PWI): A comparison with applanation tonometry. Artery Res. 2011, 5, 65–71. [Google Scholar] [CrossRef]
- R. Williams et al.. Noninvasive Ultrasonic Measurement of Regional and Local Pulse-Wave Velocity in Mice. Ultrasound Med. Biol. 2007, 33, 1368–1375. [Google Scholar] [CrossRef]
- T. Pereira, C. Correia, and J. Cardoso. Novel Methods for Pulse Wave Velocity Measurement. J. Med. Biol. Eng. 2015, 35, 555–565. [Google Scholar] [CrossRef]
- A. L. Wentland, T. M. Grist, and O. Wieben. Review of MRI-based measurements of pulse wave velocity: a biomarker of arterial stiffness. Cardiovasc. Diagn. Ther. 2014, 4, 193–206. [Google Scholar] [CrossRef]
- Z. Stankovic, B. D. Allen, J. Garcia, K. B. Jarvis, and M. Markl. 4D flow imaging with MRI. Cardiovasc. Diagn. Ther. 2014, 4, 173–192. [Google Scholar] [CrossRef]
- P. M. Nabeel, V. R. Kiran, J. Joseph, V. V. Abhidev, and M. Sivaprakasam. Local Pulse Wave Velocity: Theory, Methods, Advancements, and Clinical Applications. IEEE Rev. Biomed. Eng. 2020, 13, 74–112. [Google Scholar] [CrossRef] [PubMed]
- V. Katsi, I. Felekos, and I. Kallikazaros. Christian Andreas Doppler: A legendary man inspired by the dazzling light of the stars. Hippokratia 2013, 17, 113–114. [Google Scholar]
- J. C. Bramwell. The velocity of pulse wave in man. Proc. R. Soc. Lond. Ser. B Contain. Pap. Biol. Character 1922, 93, 298–306. [Google Scholar] [CrossRef]
- S. I. Rabben et al.. An ultrasound-based method for determining pulse wave velocity in superficial arteries. J. Biomech. 2004, 37, 1615–1622. [Google Scholar] [CrossRef]
- J. Feng and A. W. Khir. Determination of wave speed and wave separation in the arteries using diameter and velocity. J. Biomech. 2010, 43, 455–462. [Google Scholar] [CrossRef]
- A. Giudici et al.. Transfer-function-free technique for the noninvasive determination of the human arterial pressure waveform. Physiol. Rep. 2021, 9, e15040. [Google Scholar] [CrossRef]
- M. Meusel et al.. Measurement of Blood Pressure by Ultrasound-The Applicability of Devices, Algorithms and a View in Local Hemodynamics. Diagn. Basel Switz. 2021, 11, 2255. [Google Scholar] [CrossRef]
- A. C. Gonçalves Seabra, A. F. da Silva, T. Stieglitz, and A. B. Amado-Rey. In Silico Blood Pressure Models Comparison. IEEE Sens. J. 2022, 22, 23486–23493. [Google Scholar] [CrossRef]
- J. Vappou, J. Luo, K. Okajima, M. Di Tullio, and E. E. Konofagou. Non-invasive measurement of local pulse pressure by pulse wave-based ultrasound manometry (PWUM). Physiol. Meas. 2011, 32, 1653–1662. [Google Scholar] [CrossRef] [PubMed]
- D. Neumann and E. Kollorz. Ultrasound. in Medical Imaging Systems: An Introductory Guide, A. Maier, S. Steidl, V. Christlein, and J. Hornegger, Eds., Cham (CH): Springer, 2018. Accessed: Apr. 15, 2025. [Online]. Available: http://www.ncbi.nlm.nih.gov/books/NBK546144/.
- L. Løvstakken. Signal processing in diagnostic ultrasound: Algorithms for real-time estimation and visualization of blood flow velocity. 2007.
- L. J. Brattain, B. A. Telfer, M. Dhyani, J. R. Grajo, and A. E. Samir. Machine Learning for Medical Ultrasound: Status, Methods, and Future Opportunities. Abdom. Radiol. N. Y. 2018, 43, 786–799. [Google Scholar] [CrossRef] [PubMed]
- B. Nazer, E. P. Gerstenfeld, A. Hata, L. A. Crum, and T. J. Matula. Cardiovascular applications of therapeutic ultrasound. J. Interv. Card. Electrophysiol. Int. J. Arrhythm. Pacing 2014, 39, 287–294. [Google Scholar] [CrossRef]
- C. Poggi and M. Palavecino. Ultrasound principles and instrumentation. Surg. Open Sci. 2024, 18, 123–128. [Google Scholar] [CrossRef]
- B. Beulen, N. Bijnens, M. Rutten, P. Brands, and F. van de Vosse. Perpendicular ultrasound velocity measurement by 2D cross correlation of RF data. Part A: validation in a straight tube. Exp. Fluids 2010, 49, 1177–1186. [Google Scholar] [CrossRef]
- M. Meola, J. Ibeas, G. Lasalle, and I. Petrucci. Basics for performing a high-quality color Doppler sonography of the vascular access. J. Vasc. Access 2021, 22. [CrossRef]
- P. Tortoli, T. Morganti, G. Bambi, C. Palombo, and K. V. Ramnarine. Noninvasive simultaneous assessment of wall shear rate and wall distension in carotid arteries. Ultrasound Med. Biol. 2006, 32, 1661–1670. [Google Scholar] [CrossRef]
- N. Pomella, E. N. Wilhelm, C. Kolyva, J. González-Alonso, M. Rakobowchuk, and A. W. Khir. Common Carotid Artery Diameter, Blood Flow Velocity and Wave Intensity Responses at Rest and during Exercise in Young Healthy Humans: A Reproducibility Study. Ultrasound Med. Biol. 2017, 43, 943–957. [Google Scholar] [CrossRef]
- N. Pomella, E. N. Wilhelm, C. Kolyva, J. González-Alonso, M. Rakobowchuk, and A. W. Khir. Noninvasive assessment of the common carotid artery hemodynamics with increasing exercise work rate using wave intensity analysis. Am. J. Physiol. Heart Circ. Physiol. 2018, 315, H233–H241. [Google Scholar] [CrossRef]
- S. M. Bierig and A. Jones. Accuracy and Cost Comparison of Ultrasound Versus Alternative Imaging Modalities, Including CT, MR, PET, and Angiography. J. Diagn. Med. Sonogr. 2009, 25, 138–144. [Google Scholar] [CrossRef]
- G. -H. Kim and H.-J. Youn. Is Carotid Artery Ultrasound Still Useful Method for Evaluation of Atherosclerosis? Korean Circ. J. 2017, 47, 1–8. [Google Scholar] [CrossRef] [PubMed]
- Q. Tate, S.-E. Kim, G. Treiman, D. L. Parker, and J. R. Hadley. Increased Vessel Depiction of the Carotid Bifurcation with a Specialized 16-Channel Phased Array Coil at 3T. Magn. Reson. Med. Off. J. Soc. Magn. Reson. Med. Soc. Magn. Reson. Med. 2013, 69, 1486–1493. [Google Scholar] [CrossRef] [PubMed]
- B. M. Fadel et al.. Ultrasound Imaging of the Abdominal Aorta: A Comprehensive Review. J. Am. Soc. Echocardiogr. Off. Publ. Am. Soc. Echocardiogr. 2021, 34, 1119–1136. [Google Scholar] [CrossRef]
- M. Manso Jimeno, J. T. Vaughan, and S. Geethanath. Geethanath. Superconducting magnet designs and MRI accessibility: A review. NMR Biomed. 2023, e4921. [Google Scholar] [CrossRef]
- M. Jalloul et al.. MRI scarcity in low- and middle-income countries. NMR Biomed. 2023, 36, e5022. [Google Scholar] [CrossRef]
- W. G. Bradley. Comparing costs and efficacy of MRI. AJR Am. J. Roentgenol. 1986, 146, 1307–1310. [Google Scholar] [CrossRef]
- R. Nagaoka, G. Masuno, K. Kobayashi, S. Yoshizawa, S. Umemura, and Y. Saijo. Measurement of regional pulse-wave velocity using spatial compound imaging of the common carotid artery in vivo. Ultrasonics 2015, 55, 92–103. [Google Scholar] [CrossRef]
- “Ultrasound. National Institute of Biomedical Imaging and Bioengineering. Accessed: Apr. 15, 2025. [Online]. Available: https://www.nibib.nih.gov/science-education/science-topics/ultrasound.
- J. L. Díaz-Gómez, P. H. Mayo, and S. J. Koenig. Point-of-Care Ultrasonography. N. Engl. J. Med. 2021, 385. [CrossRef]
- R. T. Hoctor, A. M. Dentinger, and K. E. Thomenius. Array signal processing approaches to ultrasound-based arterial pulse wave velocity estimation. in Proceedings. (ICASSP ’05). IEEE International Conference on Acoustics, Speech, and Signal Processing, 2005, 5, v/985–v/988. [CrossRef]
- J. P. Mynard and A. Kondiboyina. Chapter 11 - Wave reflection in the arterial tree. in Textbook of Arterial Stiffness and Pulsatile Hemodynamics in Health and Disease, J. A. Chirinos, Ed., Academic Press, 2022, 169–194. [CrossRef]
- R. Manoj, K. V. Raj, P. M. Nabeel, M. Sivaprakasam, and J. Joseph. Measurement of pressure dependent variations in local pulse wave velocity within a cardiac cycle from forward travelling pulse waves. Sci. Rep. 2025, 15, 3066. [Google Scholar] [CrossRef]
- J. Alastruey, A. A. E. Hunt, and P. D. Weinberg. Novel wave intensity analysis of arterial pulse wave propagation accounting for peripheral reflections. Int. J. Numer. Methods Biomed. Eng. 2014, 30, 249–279. [Google Scholar] [CrossRef]
- E. Hermeling, K. D. Reesink, R. S. Reneman, and A. P. G. Hoeks. Confluence of incident and reflected waves interferes with systolic foot detection of the carotid artery distension waveform. J. Hypertens. 2008, 26, 2374–2380. [Google Scholar] [CrossRef] [PubMed]
- P. Segers, A. Swillens, L. Taelman, and J. Vierendeels. Wave reflection leads to over- and underestimation of local wave speed by the PU- and QA-loop methods: theoretical basis and solution to the problem. Physiol. Meas. 2014, 35, 847. [Google Scholar] [CrossRef] [PubMed]
- Y. Wang, Q. Yang, L. Drukker, A. Papageorghiou, Y. Hu, and J. A. Noble. Task model-specific operator skill assessment in routine fetal ultrasound scanning. Int. J. Comput. Assist. Radiol. Surg. 2022, 17, 1437–1444. [Google Scholar] [CrossRef]
- G. E. Mead, S. C. Lewis, and J. M. Wardlaw. Variability in Doppler ultrasound influences referral of patients for carotid surgery. Eur. J. Ultrasound Off. J. Eur. Fed. Soc. Ultrasound Med. Biol. 2000, 12, 137–143. [Google Scholar] [CrossRef]
- G. S. Rozycki. Surgeon-Performed Ultrasound: Its Use in Clinical Practice. Ann. Surg. 1998, 228, 16. [Google Scholar] [CrossRef]
- S. I. Rabben, S. Baerum, V. Sørhus, and H. Torp. Ultrasound-based vessel wall tracking: an auto-correlation technique with RF center frequency estimation. Ultrasound Med. Biol. 2002, 28, 507–517. [Google Scholar] [CrossRef]
- B. E. Hunt, D. C. Flavin, E. Bauschatz, and H. M. Whitney. Accuracy and robustness of a simple algorithm to measure vessel diameter from B-mode ultrasound images. J. Appl. Physiol. 2016, 120, 1374–1379. [Google Scholar] [CrossRef]
- D. V. Pasynkov, A. A. Kolchev, I. A. Egoshin, I. V. Klyushkin, and O. O. Pasynkova. A Method for Automatic Calculation of the Diameter of a Pulsating Blood Vessel on Ultrasound Images in Video Stream Mode. Biomed. Eng. 2023, 57, 23–27. [Google Scholar] [CrossRef]
- S. Graf et al.. Experimental and clinical validation of arterial diameter waveform and intimal media thickness obtained from B-mode ultrasound image processing. Ultrasound Med. Biol. 1999, 25, 1353–1363. [Google Scholar] [CrossRef] [PubMed]
- B. Lee. Signal processing techniques for operator independent Doppler ultrasound : potential for use in transcranial Doppler ultrasound.” Accessed: Apr. 16, 2025. [Online]. Available: https://rshare.library.torontomu.ca/articles/thesis/Signal_processing_techniques_for_operator_independent_Doppler_ultrasound_potential_for_use_in_transcranial_Doppler_ultrasound/14664744/1?file=28151097.
- M. Yamamoto, J. Carrillo, A. Insunza, G. Mari, and Y. Ville. Error introduced into velocity measurements by inappropriate Doppler angle assignment. Ultrasound Obstet. Gynecol. 2006, 28, 853–854. [Google Scholar] [CrossRef] [PubMed]
- N. Di Lascio, C. Kusmic, F. Stea, and F. Faita. Ultrasound-based Pulse Wave Velocity Evaluation in Mice. J. Vis. Exp. JoVE 2017, 54362. [CrossRef]
- S. Afzal et al. Preparation and Evaluation of Polymer-Based Ultrasound Gel and Its Application in Ultrasonography. Gels 2022, 8. [Google Scholar] [CrossRef]
- C. -H. Tsui and J. Tsui. A flexible gel pad as an effective medium for scanning irregular surface anatomy. Can. J. Anaesth. J. Can. Anesth. 2011, 59, 226–7. [Google Scholar] [CrossRef]
- R. Krishnamurthy, J. H. Yoo, M. Thapa, and M. J. Callahan. Water-bath method for sonographic evaluation of superficial structures of the extremities in children. Pediatr. Radiol. 2013, 43. [CrossRef]
- P. Shrimal et al.. Sensitivity and specificity of waterbath ultrasound technique in comparison to the conventional methods in diagnosing extremity fractures. Am. J. Emerg. Med. 2022, 53, 118–121. [Google Scholar] [CrossRef]
- J. H. Hwang. 1 - Principles of Ultrasound. in Endosonography (Fourth Edition), R. H. Hawes, P. Fockens, and S. Varadarajulu, Eds., Philadelphia: Elsevier 2019, 2-14.e1. [CrossRef]
- T. Barbry, B. Bouhemad, K. Leleu, V. de Castro, F. Rémérand, and J.-J. Rouby. Transthoracic ultrasound approach of thoracic aorta in critically ill patients with lung consolidation. J. Crit. Care 2006, 21, 203–208. [Google Scholar] [CrossRef]
- H. Sawada et al.. Ultrasound Monitoring of Descending Aortic Aneurysms and Dissections in Mice. Arterioscler. Thromb. Vasc. Biol. 2020, 40, 2557–2559. [Google Scholar] [CrossRef]
- C. Rosenberry and V. Ball. False Positive Aortic Dissection on Abdominal Ultrasound. West. J. Emerg. Med. 2010, 11, 110–111. [Google Scholar]
- E. Goldschmidt et al.. The Effect of Patient Oral Intake Status on Abdominal Aortic Ultrasound Visualization. Ann. Vasc. Surg. 2021, 74, 204–208. [Google Scholar] [CrossRef]
- A. Ng and J. Swanevelder. Resolution in ultrasound imaging. Contin. Educ. Anaesth. Crit. Care Pain 2011, 11. [CrossRef]
- D. Carroll. Attenuation (ultrasound) | Radiology Reference Article | Radiopaedia.org. Radiopaedia. Accessed: Apr. 16, 2025. [Online]. Available: https://radiopaedia.org/articles/attenuation-ultrasound?embed_domain=hackmd.io%252f%2540yipuafecsl2jsu8smr5njq%252fbnjhjgjghjghjgh&lang=us.
- S. Hong and G. Coté. Arterial Pulse Wave Velocity Signal Reconstruction Using Low Sampling Rates. Biosensors 2024, 14, 92. [Google Scholar] [CrossRef]
- J. Alastruey. Numerical assessment of time-domain methods for the estimation of local arterial pulse wave speed. J. Biomech. 2011, 44, 885–891. [Google Scholar] [CrossRef]
- J. A. Jensen and J. Mathorne. Sampling system for in vivo ultrasound images. presented at the Medical Imaging ’91, San Jose, CA, Y. Kim, Ed., San Jose, CA, May 1991, 221–231. [CrossRef]
- W. D. O’Brien, L. A. Frizzell, D. J. Schaeffer, and J. F. Zachary. Superthreshold behavior of ultrasound-induced lung hemorrhage in adult mice and rats: role of pulse repetition frequency and exposure duration. Ultrasound Med. Biol. 2001, 27, 267–277. [Google Scholar] [CrossRef]
- C. Huang, T. Ren, and J. Luo. Effects of key parameters on the accuracy and precision of local pulse wave velocity measurement by ultrasound imaging. in 2014 36th Annual International Conference of the IEEE Engineering in Medicine and Biology Society 2014, 2877–2880. [CrossRef]
- H. Hasegawa. Very high frame rate ultrasound for medical diagnostic imaging. presented at the ADVANCES IN ELECTRICAL AND ELECTRONIC ENGINEERING: FROM THEORY TO APPLICATIONS (SERIES 2): Proceedings of the International Conference of Electrical and Electronic Engineering (ICon3E 2019), Putrajaya, Malaysia 2019, 020015. [CrossRef]
- G. Baltgaile. Arterial wall dynamics. Perspect. Med. 2012, 1, 146–151. [Google Scholar] [CrossRef]
- J. O. Arndt, J. Klauske, and F. Mersch. The diameter of the intact carotid artery in man and its change with pulse pressure. Pflugers Arch. Gesamte Physiol. Menschen Tiere 1968, 301, 230–240. [Google Scholar] [CrossRef] [PubMed]
- D. E. Hokanson, D. J. Mozersky, D. S. Sumner, and D. E. Strandness. A phase-locked echo tracking system for recording arterial diameter changes in vivo. J. Appl. Physiol. 1972, 32, 728–733. [Google Scholar] [CrossRef] [PubMed]
- D. H. Groves, T. Powalowski, and D. N. White. A digital technique for tracking moving interfaces. Ultrasound Med. Biol. 1982, 8, 185–190. [Google Scholar] [CrossRef] [PubMed]
- T. Imura, K. Yamamoto, K. Kanamori, T. Mikami, and H. Yasuda. Non-invasive ultrasonic measurement of the elastic properties of the human abdominal aorta. Cardiovasc. Res. 1986, 20, 208–214. [Google Scholar] [CrossRef] [PubMed]
- Y. Tardy, J. J. Meister, F. Perret, H. R. Brunner, and M. Arditi. Non-invasive estimate of the mechanical properties of peripheral arteries from ultrasonic and photoplethysmographic measurements. Clin. Phys. Physiol. Meas. Off. J. Hosp. Phys. Assoc. Dtsch. Ges. Med. Phys. Eur. Fed. Organ. Med. Phys. 1991, 12, 39–54. [Google Scholar] [CrossRef]
- A. P. Hoeks, C. J. Ruissen, P. Hick, and R. S. Reneman. Transcutaneous detection of relative changes in artery diameter. Ultrasound Med. Biol. 1985, 11, 51–59. [Google Scholar] [CrossRef] [PubMed]
- P. Hoeks, P. J. Brands, F. A. Smeets, and R. S. Reneman. Assessment of the distensibility of superficial arteries. Ultrasound Med. Biol. 1990, 16, 121–128. [Google Scholar] [CrossRef]
- R. Moddemeijer. On the determination of the position of extrema of sampled correlators. IEEE Trans. Signal Process. 1991, 39, 216–219. [Google Scholar] [CrossRef]
- P. G. M. de Jong, T. Arts, A. P. G. Hoeks, and R. S. Reneman. Determination of tissue motion velocity by correlation interpolation of pulsed ultrasonic echo signals. Ultrason. Imaging 1990, 12, 84–98. [Google Scholar] [CrossRef]
- T. Loupas, J. T. Powers, and R. W. Gill. An axial velocity estimator for ultrasound blood flow imaging, based on a full evaluation of the Doppler equation by means of a two-dimensional autocorrelation approach. IEEE Trans. Ultrason. Ferroelectr. Freq. Control 1995, 42, 672–688. [Google Scholar] [CrossRef]
- X. Lai, H. Torp, and K. Kristoffersen. An extended autocorrelation method for estimation of blood velocity. IEEE Trans. Ultrason. Ferroelectr. Freq. Control 1997, 44, 1332–1342. [Google Scholar] [CrossRef]
- P. Schober, S. A. Loer, and L. A. Schwarte. Transesophageal Doppler devices: A technical review. J. Clin. Monit. Comput. 2009, 23, 391–401. [Google Scholar] [CrossRef]
- B. Botz. Aliasing phenomenon (ultrasound) | Radiology Reference Article | Radiopaedia.org. Radiopaedia. Accessed: Feb. 07, 2024. [Online]. Available: https://radiopaedia.org/articles/aliasing-phenomenon-ultrasound?lang=gb.
- K. Martin. 1 Introduction to B-mode imaging. Camb. Univ. Press.
- E. A. Ashley and J. Niebauer. Understanding the echocardiogram. in Cardiology Explained, Remedica, 2004. Accessed: Apr. 16, 2025. [Online]. Available: https://www.ncbi.nlm.nih.gov/books/NBK2215/.
- R. Moorthy. DOPPLER ULTRASOUND. Med. J. Armed Forces India 2002, 58, 1–2. [Google Scholar] [CrossRef]
- E. Chérin et al.. Ultrahigh frame rate retrospective ultrasound microimaging and blood flow visualization in mice in vivo. Ultrasound Med. Biol. 2006, 32, 683–691. [Google Scholar] [CrossRef]
- R. Kowalski, J. P. Mynard, J. J. Smolich, and M. M. H. Cheung. Comparison of invasive and non-invasive aortic wave intensity and wave power analyses in sheep. Physiol. Meas. 2019, 40, 015005. [Google Scholar] [CrossRef] [PubMed]
- R. J. Adrian. Twenty years of particle image velocimetry. Exp. Fluids 2005, 39, 159–169. [Google Scholar] [CrossRef]
- E. M. Rowland, K. Riemer, K. Lichtenstein, M.-X. Tang, and P. D. Weinberg. Non-invasive Assessment by B-Mode Ultrasound of Arterial Pulse Wave Intensity and Its Reduction During Ventricular Dysfunction. Ultrasound Med. Biol. 2023, 49, 473–488. [Google Scholar] [CrossRef] [PubMed]
- M. Sugawara, K. Niki, N. Ohte, T. Okada, and A. Harada. Clinical usefulness of wave intensity analysis. Med. Biol. Eng. Comput. 2009, 47, 197–206. [Google Scholar] [CrossRef] [PubMed]
- K. Niki et al.. A new noninvasive measurement system for wave intensity: evaluation of carotid arterial wave intensity and reproducibility. Heart Vessels 2002, 17, 12–21. [Google Scholar] [CrossRef]
- R. Manoj, R. K. V, N. P. M, M. Sivaprakasam, and J. Joseph. Measurement of Inter and Intra-cycle Variations in Local Pulse Wave Velocity from Forward Travelling Pulse Waves. in 2024 IEEE International Symposium on Medical Measurements and Applications (MeMeA), Jun. 2024, 1–6. [CrossRef]
Figure 1.
lnDiameter-Velocity (lnDU) loop where PWV is determined from the gradient of the loop at the linear portion of the loop (---) [21].
Figure 1.
lnDiameter-Velocity (lnDU) loop where PWV is determined from the gradient of the loop at the linear portion of the loop (---) [21].
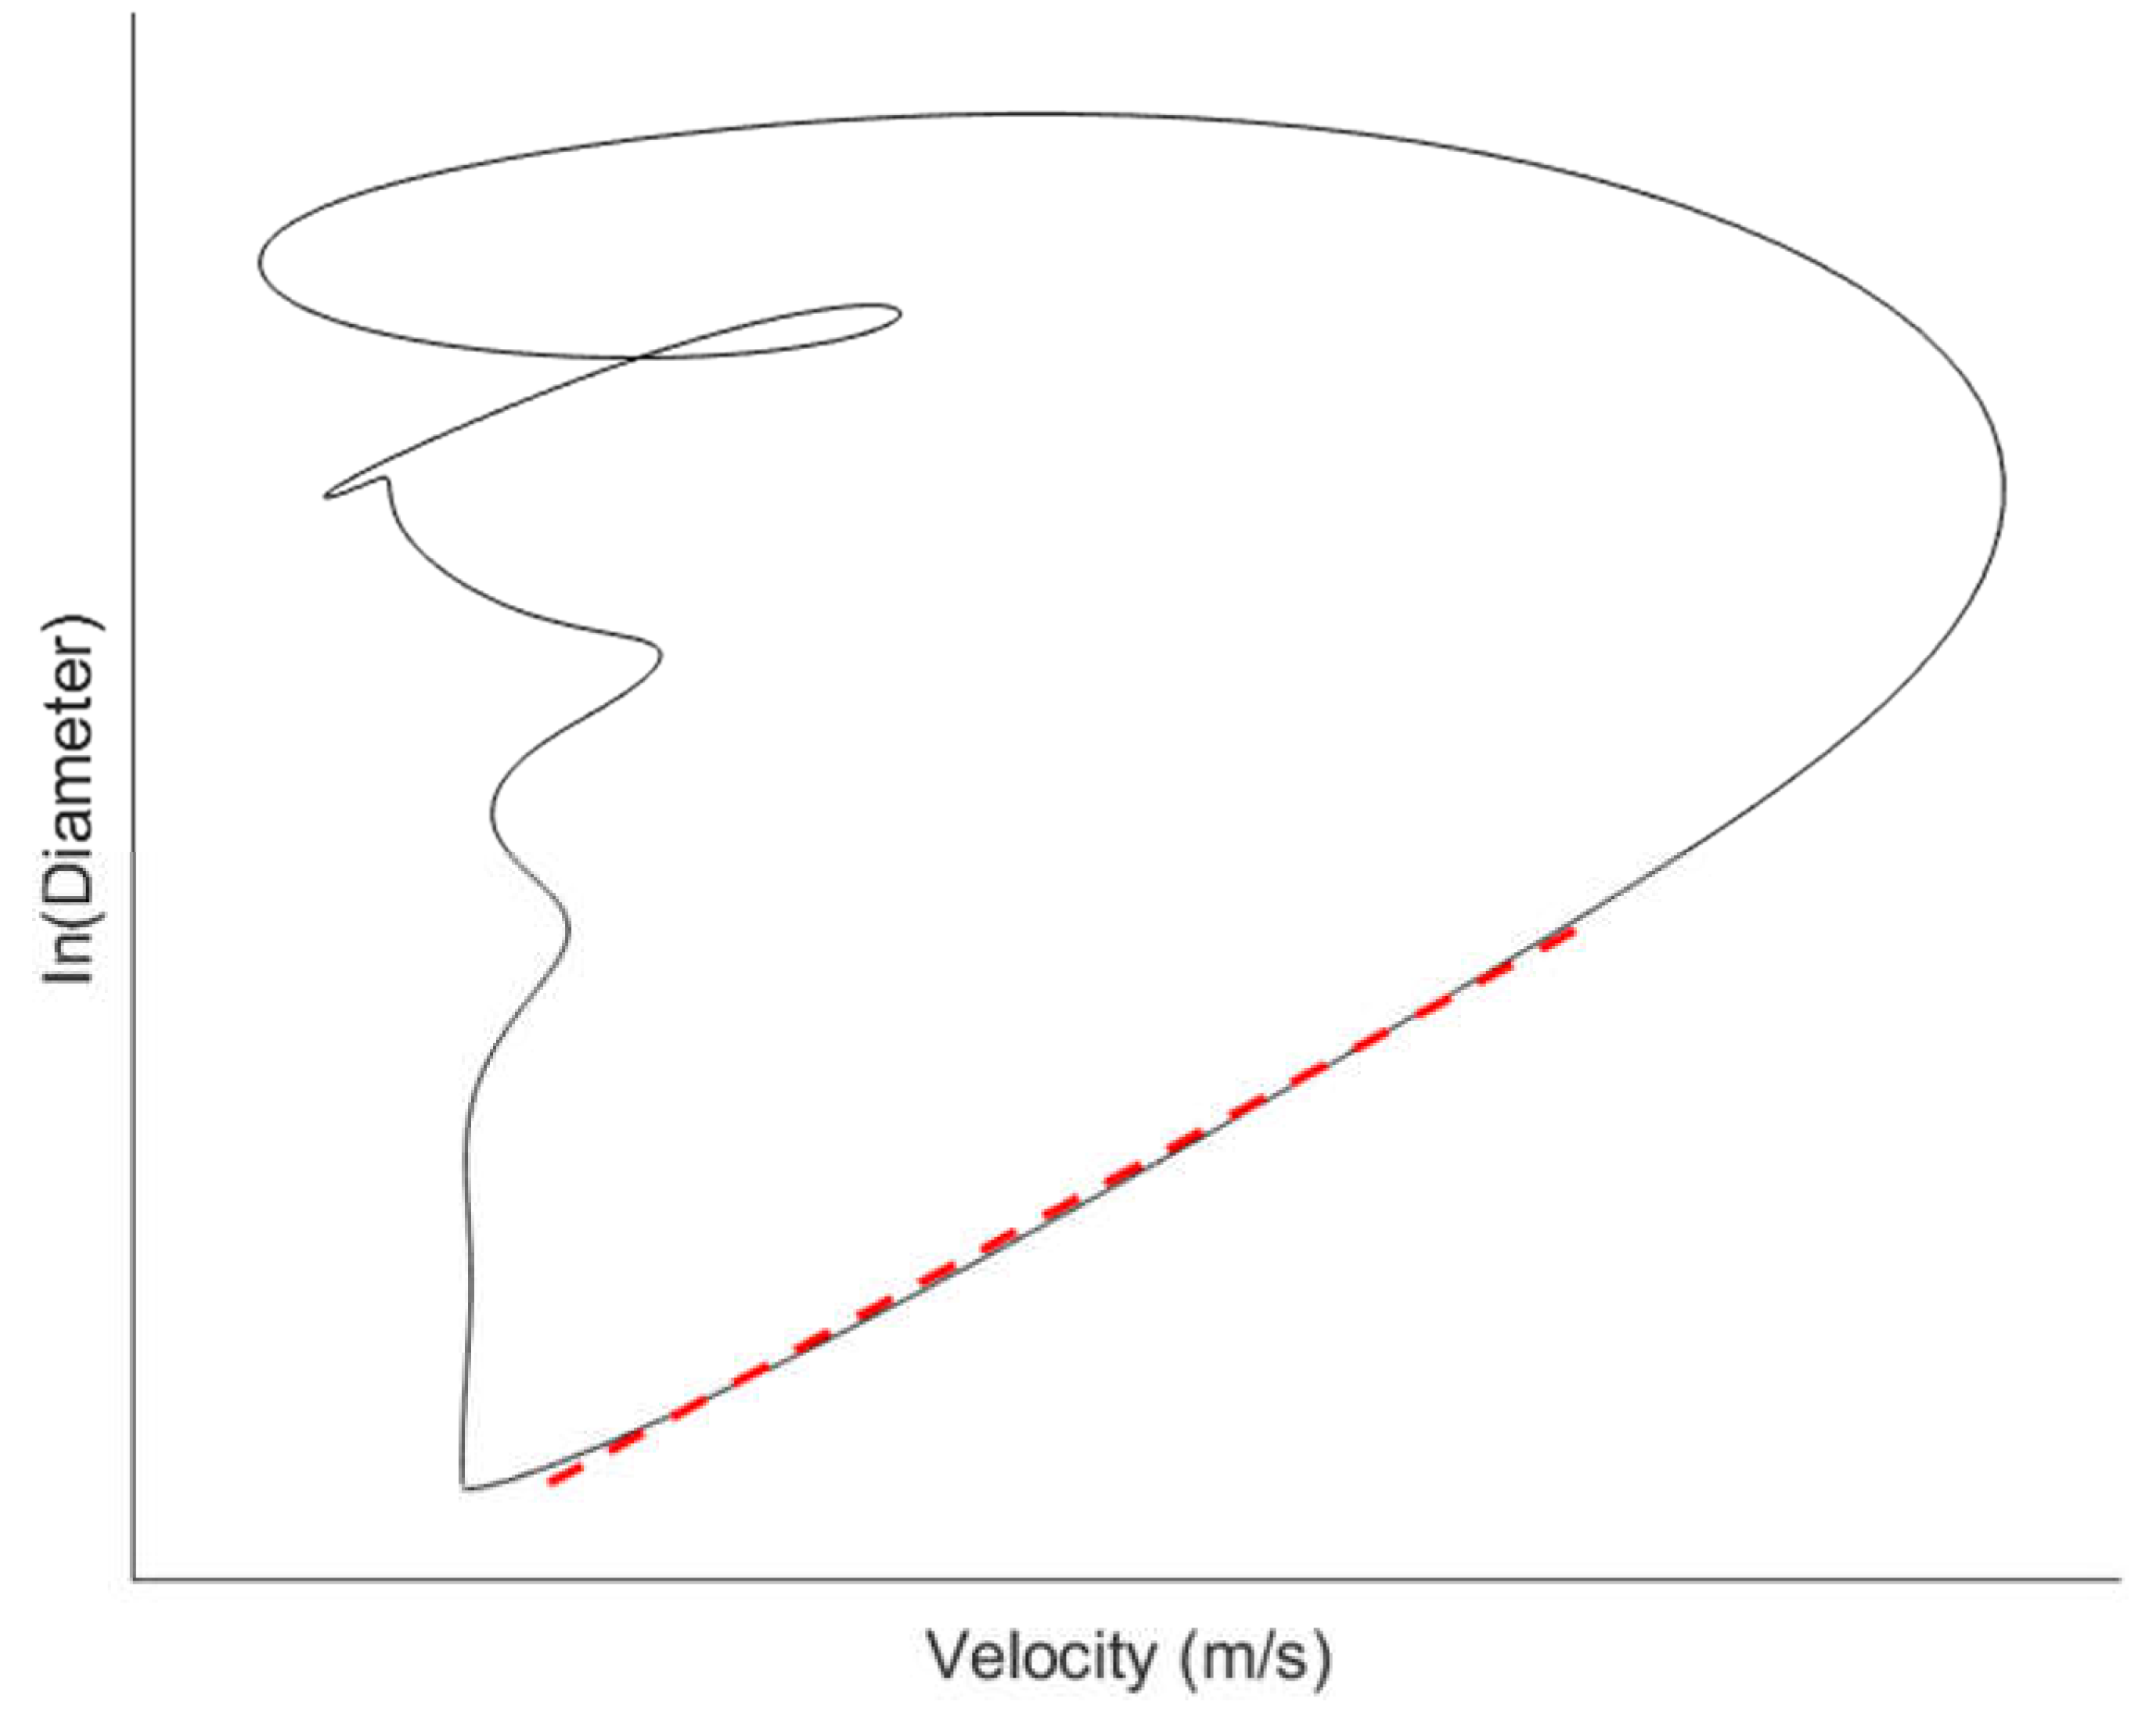
Figure 2.
Flow-Area (QA) loop where PWV is determined from the gradient of the loop at the linear portion of the loop (---) [19].
Figure 2.
Flow-Area (QA) loop where PWV is determined from the gradient of the loop at the linear portion of the loop (---) [19].
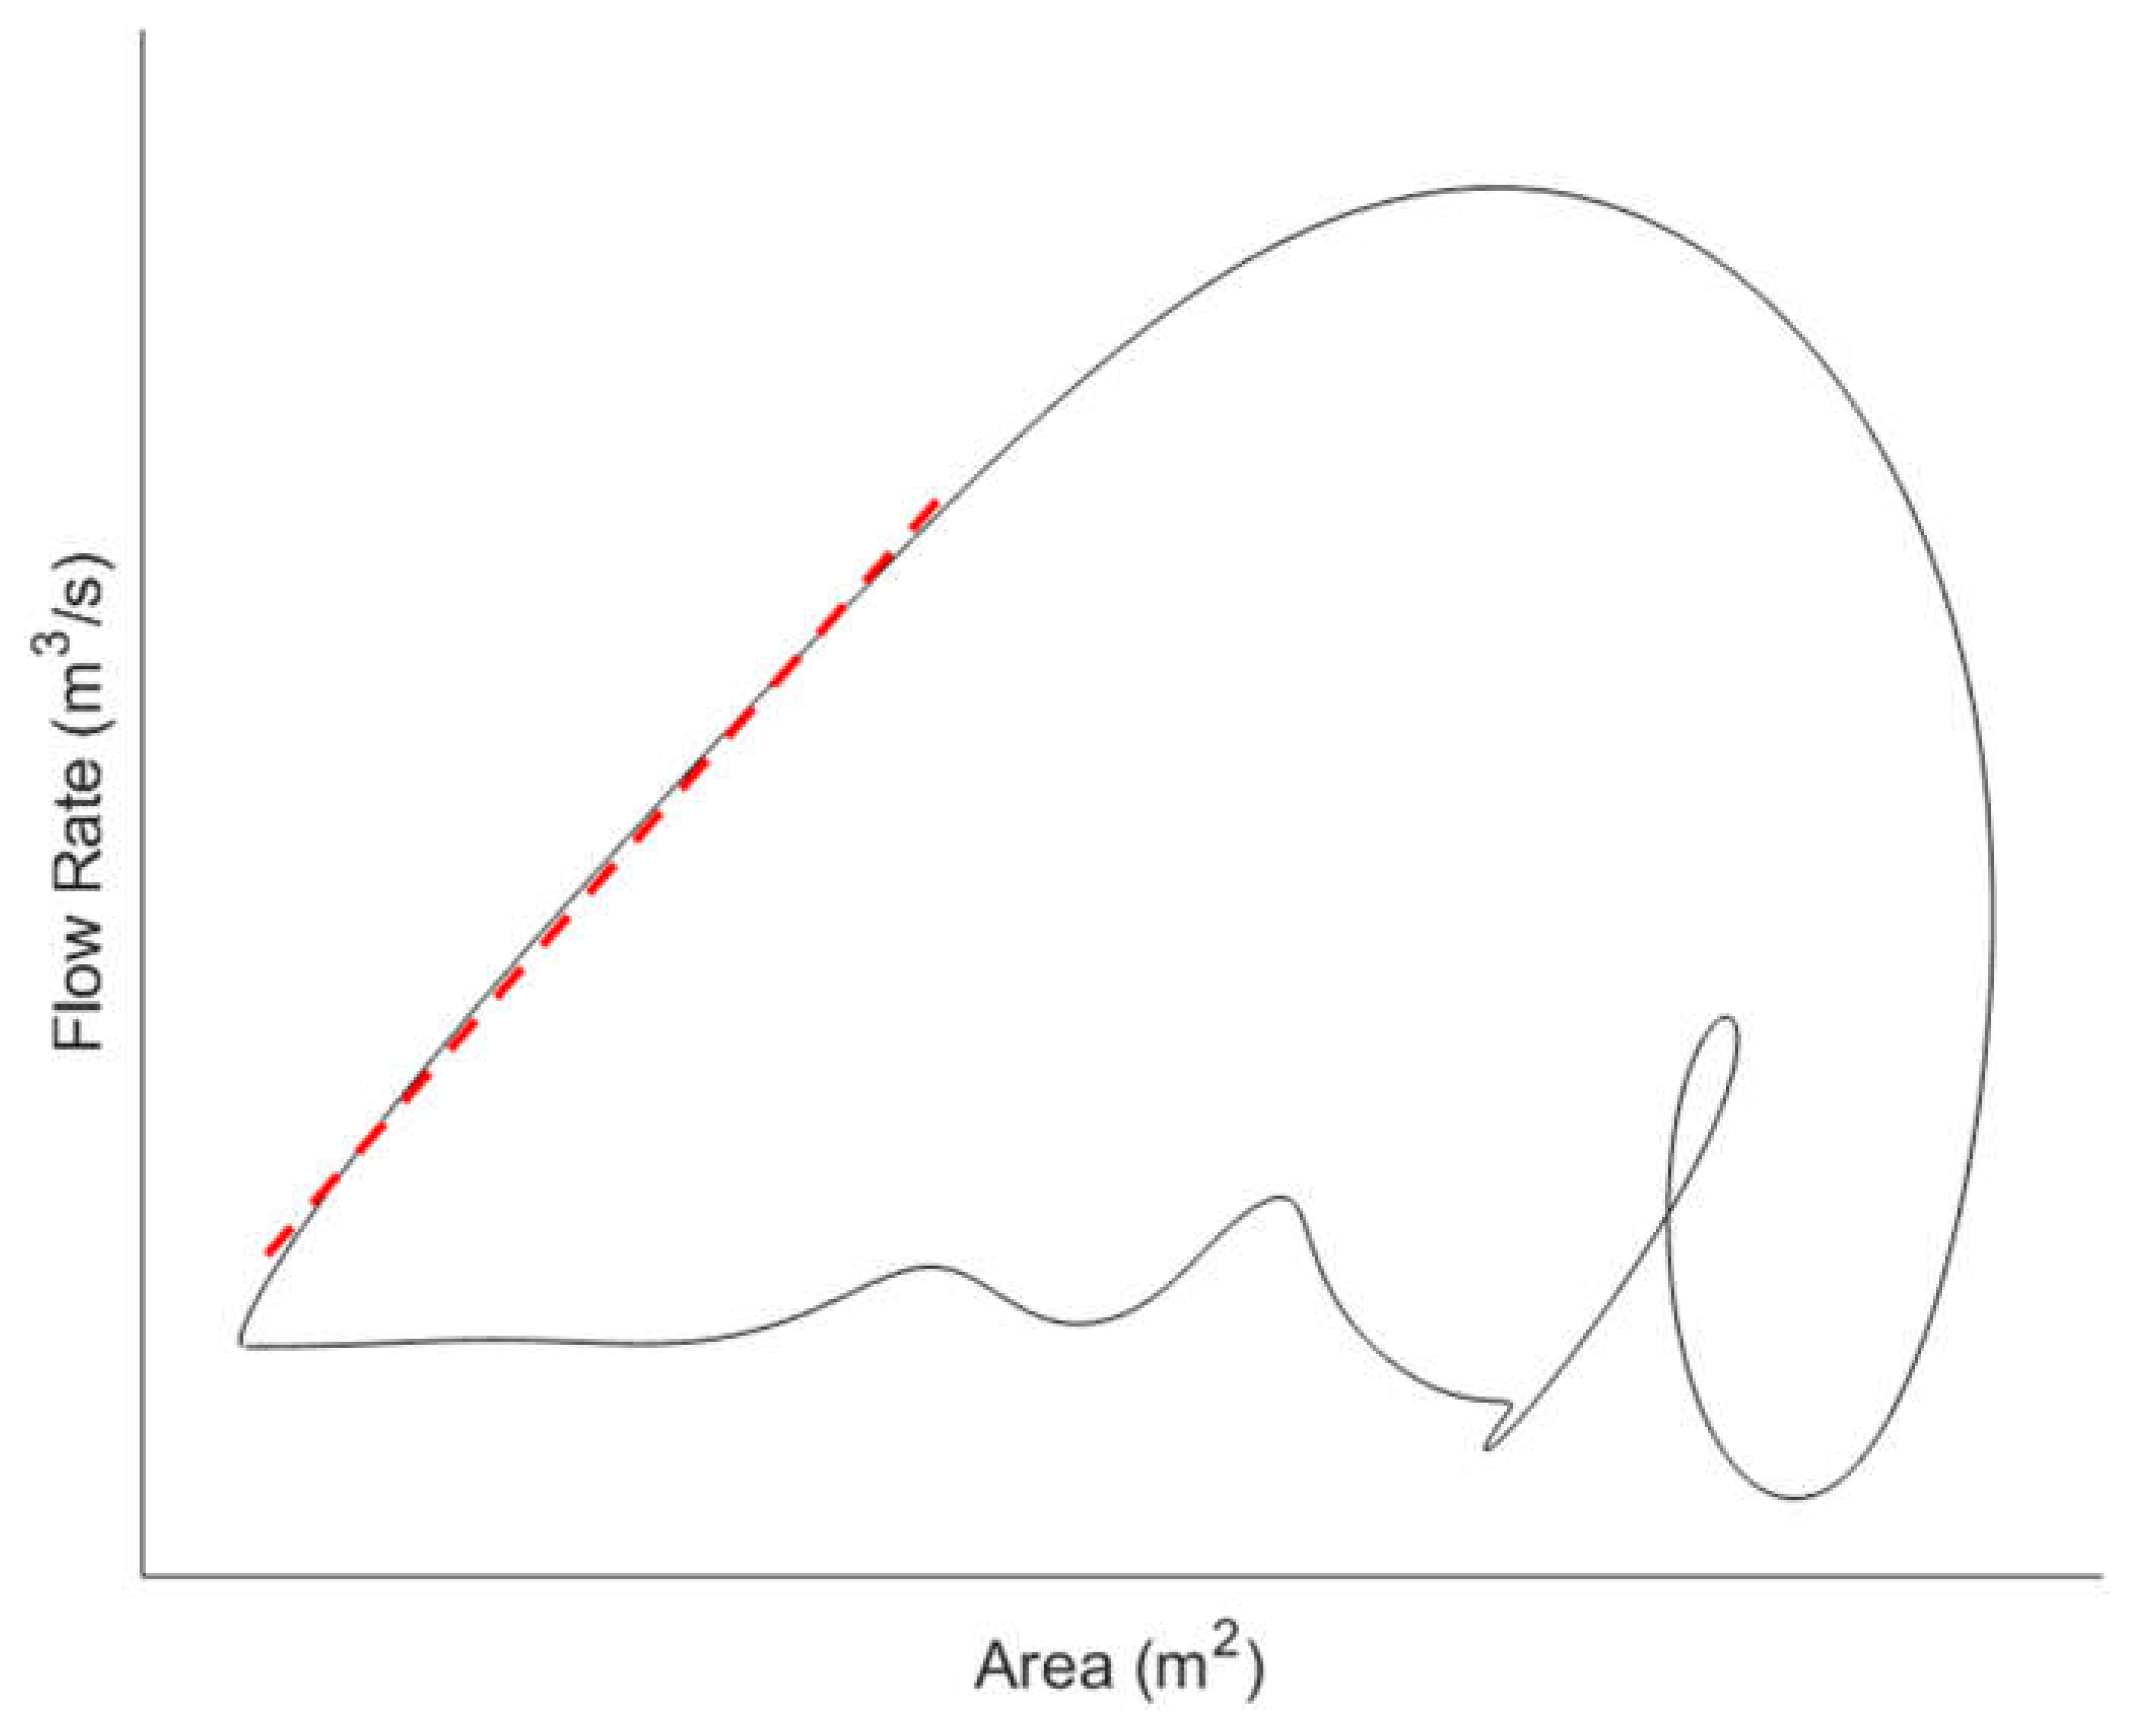
Figure 3.
M-mode imaging of CCA with graphical trace of diameter changes below the B-mode image [78]. Reprinted from Perspectives in Medicine, Volume 1, Issues 1-12, Galinda Baltgaile, Arterial wall dynamics, Pages 146-151., Copyright (2012), with permission from Elsevier.
Figure 3.
M-mode imaging of CCA with graphical trace of diameter changes below the B-mode image [78]. Reprinted from Perspectives in Medicine, Volume 1, Issues 1-12, Galinda Baltgaile, Arterial wall dynamics, Pages 146-151., Copyright (2012), with permission from Elsevier.
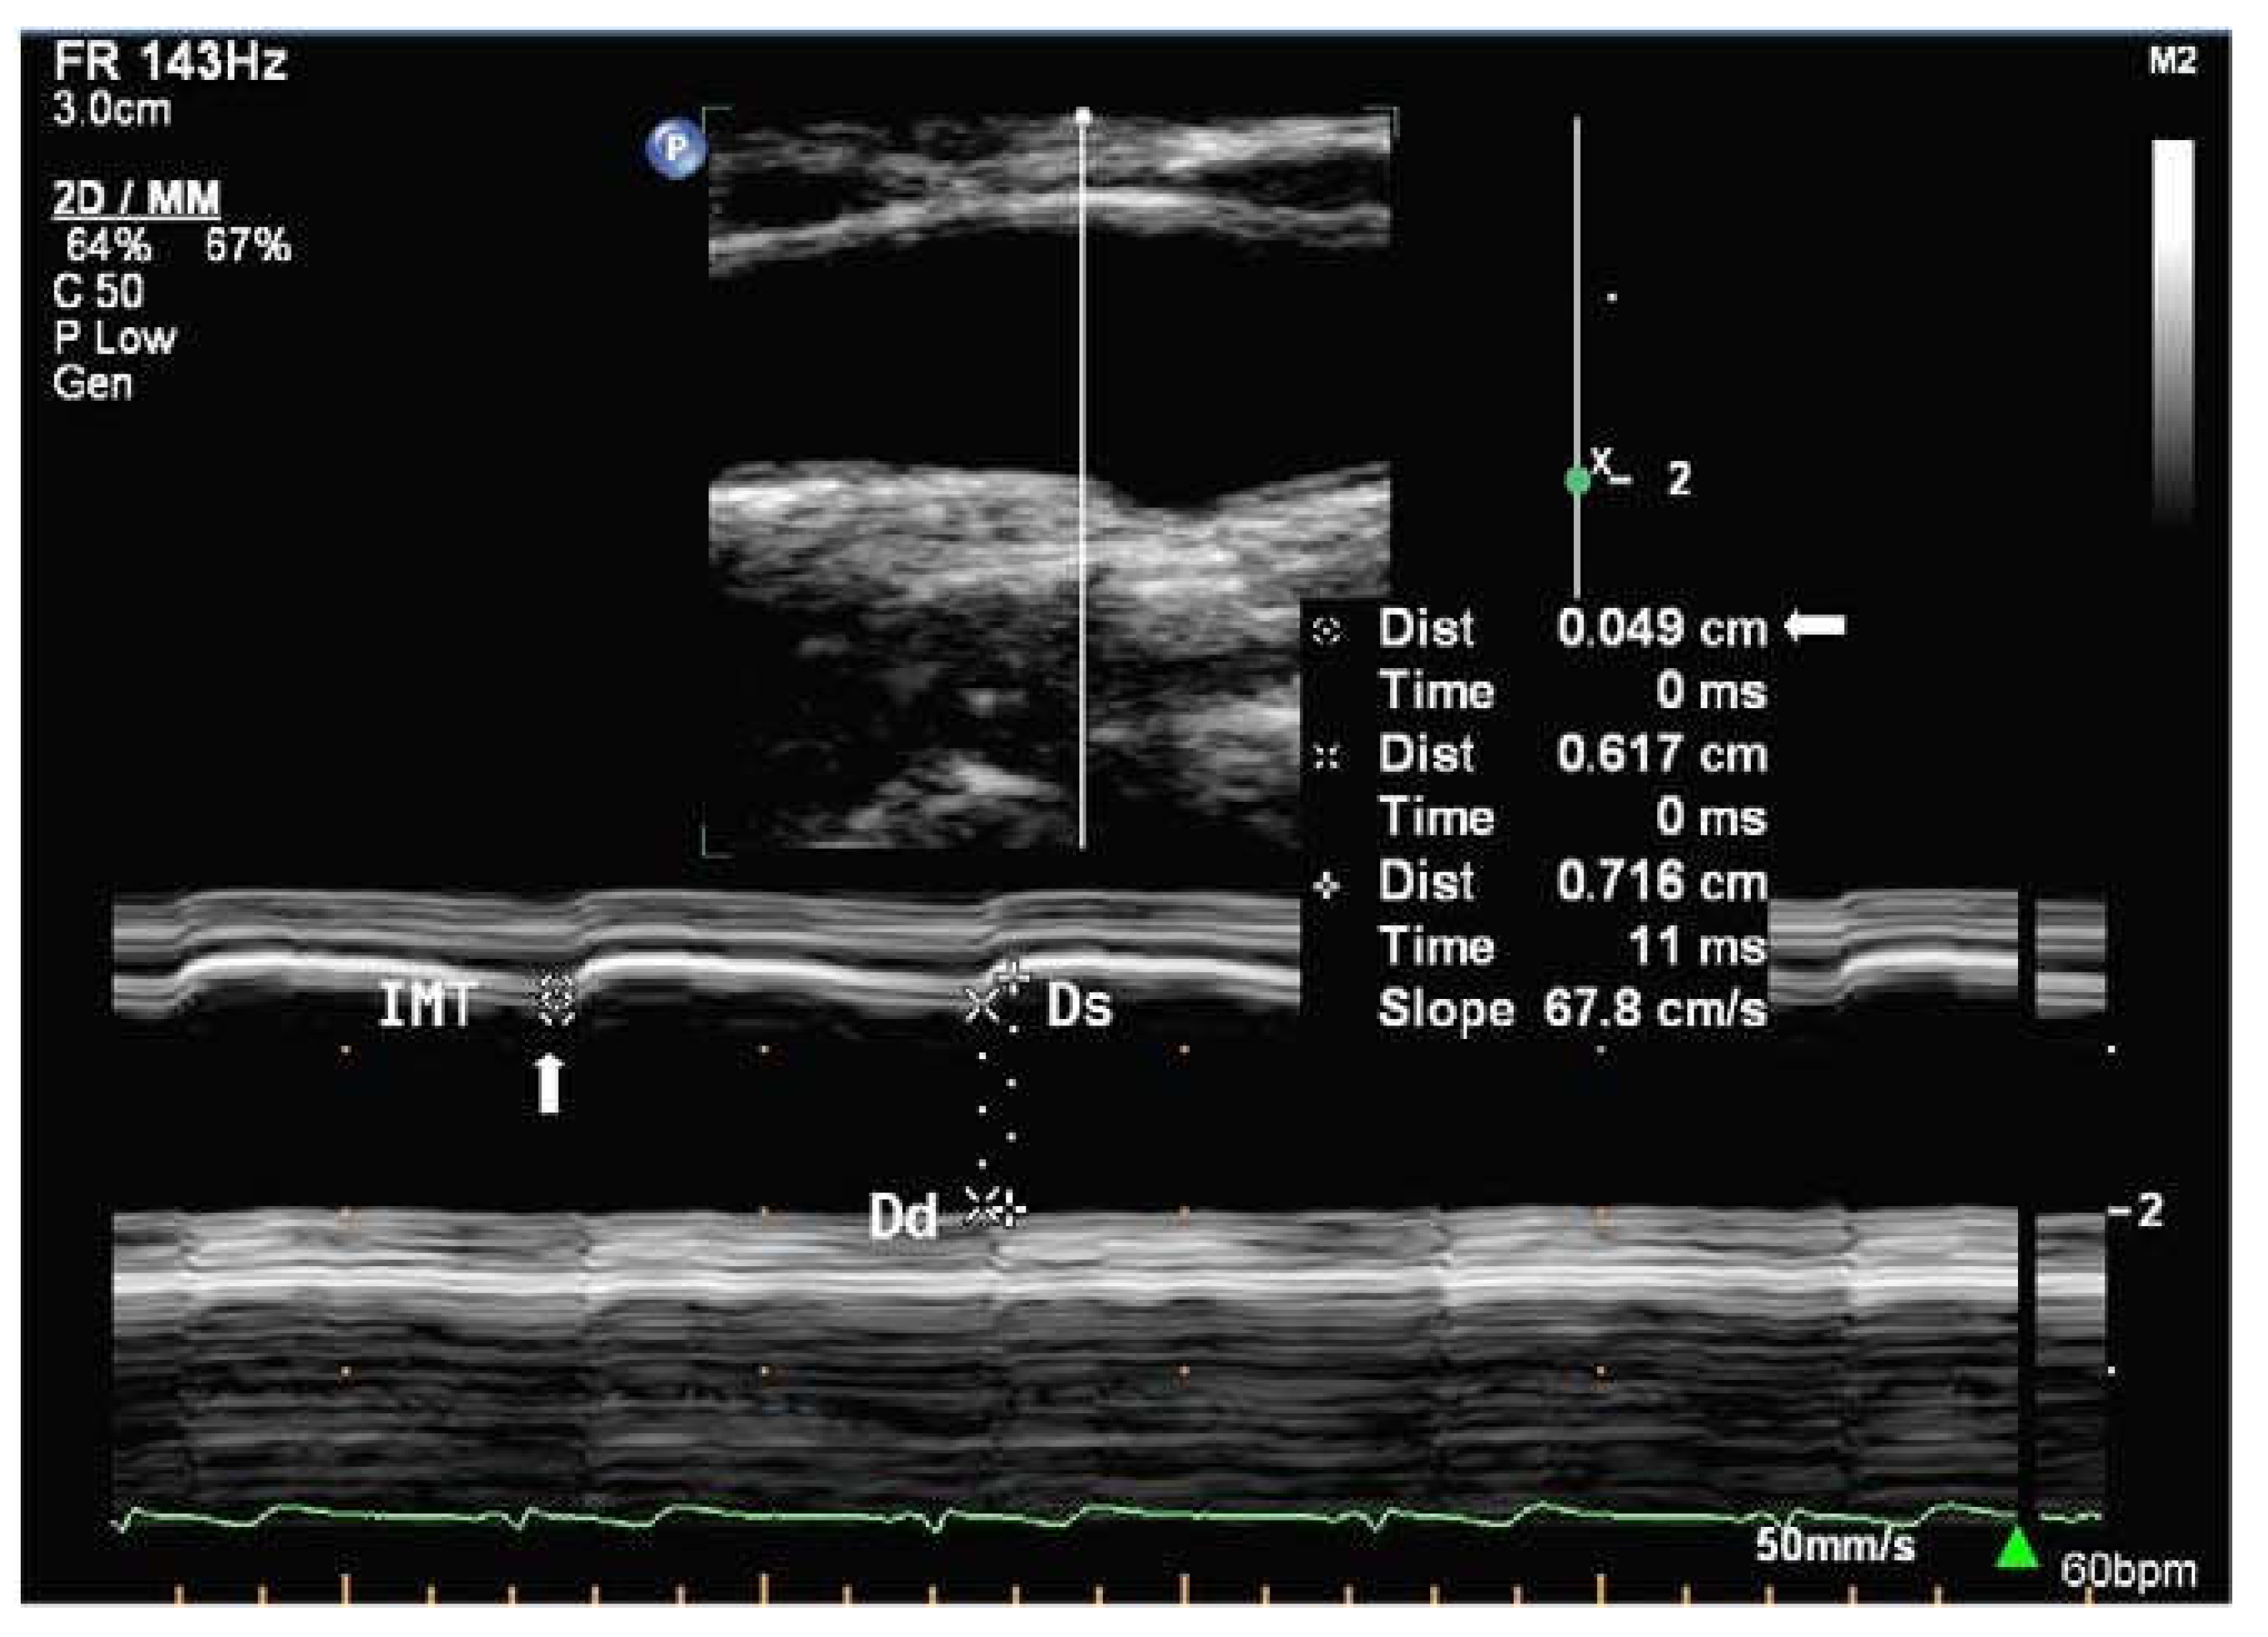
Figure 4.
Doppler shifts with transducers at different angles. Frequency increases when blood flows toward transducer (A) and decreases with flow away from the transducer (C). There is no change in frequency when the transducer is perpendicular (B) to the vessel.
Figure 4.
Doppler shifts with transducers at different angles. Frequency increases when blood flows toward transducer (A) and decreases with flow away from the transducer (C). There is no change in frequency when the transducer is perpendicular (B) to the vessel.
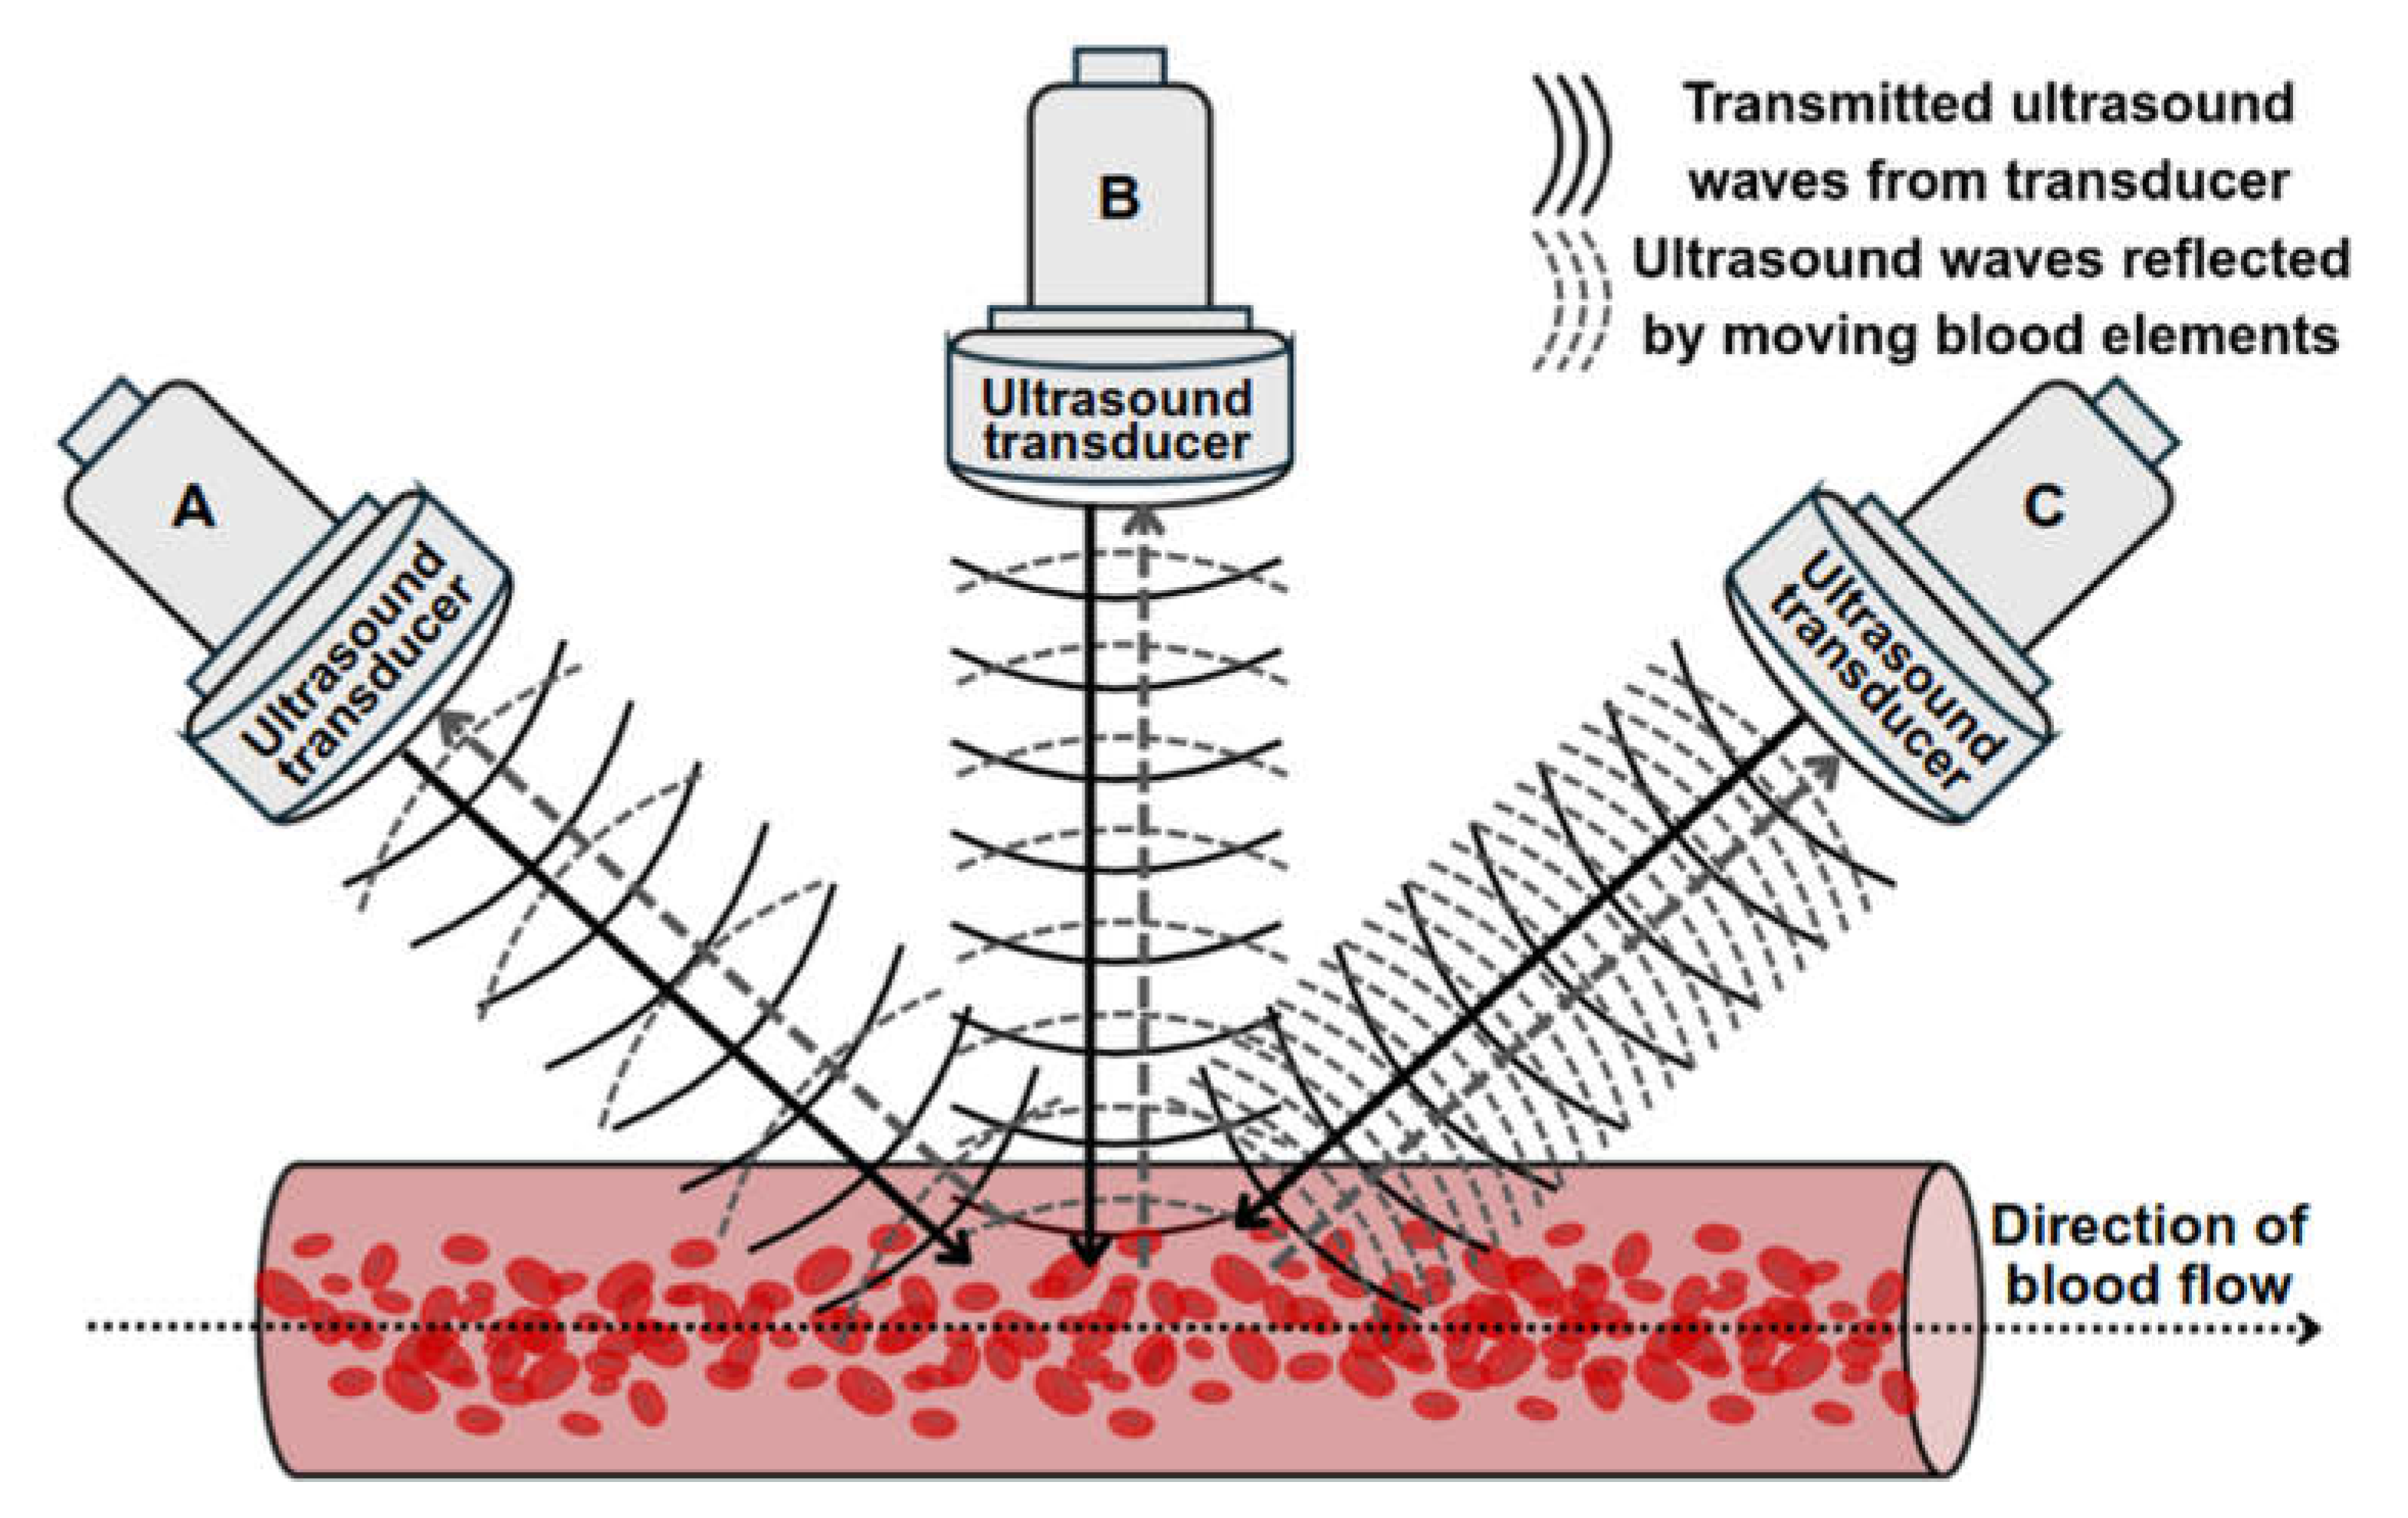
Figure 5.
Simultaneous acquisition with two ultrasound beams (A and B) with overlap at the range gate region (from [99] with permission).
Figure 5.
Simultaneous acquisition with two ultrasound beams (A and B) with overlap at the range gate region (from [99] with permission).


Table 1.
Summary of key software-based imaging parameters in ultrasound data acquisition.
| Parameter | Definition | Details on parameter | Ref. |
|---|---|---|---|
| Frequency of transducer | Number of sound wave oscillations per second emitted by transducer |
|
[25,29] |
| Axial resolution | Ability to distinguish between two structures parallel to the beam |
|
[25] |
| Lateral resolution | Ability to distinguish between two structures perpendicular to beam direction |
|
[25] |
| Temporal resolution | Ability to capture fast-moving structures for analysis |
|
[70] |
| Attenuation | Decrease in ultrasound intensity due to absorption, scattering, and reflection. |
|
[71] |
| Depth of Focus | Depth where image remains sufficiently focused |
|
[29] |
| Beam width | Physical width of the ultrasound beam |
|
[29] |
| Sampling frequency | The rate at which the ultrasound system digitizes returning echo signals. |
|
[72,73,74] |
| Pulse repetition frequency (PRF) | Number of ultrasound pulse emitted over time |
|
[75] |
| Frame rate | Number of image frames per second |
|
[76,77] |
| Gain/ Time Gain Compensation (TGC) | Controls brightness of image |
|
[29] |
Table 2.
Summary of ultrasound imaging modes for data acquisition.
| Ultrasound imaging mode for vessel area acquisition | |||
|---|---|---|---|
| Imaging modality | Functioning principle | Use of modality | Ref. |
| B-mode (Brightness mode) |
|
|
[55,92] |
| M-mode (Motion mode) |
|
|
[93] |
| Doppler ultrasound imaging modes for velocity acquisition | |||
| Imaging modality | Functioning principle | Use of modality | Ref. |
| Spectral Doppler |
|
|
[94] |
| Colour Doppler |
|
|
[93] |
| Pulsed wave (PW) Doppler |
|
|
[93,94] |
| Continuous wave (CW) Doppler |
|
|
[94] |
Table 3.
Comparison of non-simultaneous and simultaneous acquisition methods for diameter and velocity.
Table 3.
Comparison of non-simultaneous and simultaneous acquisition methods for diameter and velocity.
| Acquisition type | Imaging method and key acquisition details | Advantages | Limitations | Ref. |
|---|---|---|---|---|
| Non-simultaneous |
|
|
|
[60] |
|
|
[19] | ||
| Simultaneous |
|
|
|
[33,34,96] |
|
|
|
[5,98] | |
|
|
|
[99,100] |
Disclaimer/Publisher’s Note: The statements, opinions and data contained in all publications are solely those of the individual author(s) and contributor(s) and not of MDPI and/or the editor(s). MDPI and/or the editor(s) disclaim responsibility for any injury to people or property resulting from any ideas, methods, instructions or products referred to in the content. |
© 2025 by the authors. Licensee MDPI, Basel, Switzerland. This article is an open access article distributed under the terms and conditions of the Creative Commons Attribution (CC BY) license (http://creativecommons.org/licenses/by/4.0/).
Copyright: This open access article is published under a Creative Commons CC BY 4.0 license, which permit the free download, distribution, and reuse, provided that the author and preprint are cited in any reuse.


