
Submitted:
16 April 2025
Posted:
17 April 2025
You are already at the latest version
Abstract
Monitoring of peripheral electrical bioimpedance (EBI) variations is a promising method that has potential to replace invasive or burdensome techniques for cardiovascular measurements. Segmental or continuous peripheral pulse recording can be substrate for calculating prognostic markers as pulse wave velocity (PWV) or can contain substrates as pulse transit time (PTT) or pulse arrival time (PAT) for undisturbing BP calculation or even new cardiovascular risk markers. Still several technical, analytical, and interpretative aspects need to be resolved before the EBI method can be adopted in clinical practice. Our goal was to investigate and improve application of the EBI, executing its comparison with other cardiovascular assessment methods in patients hospitalized for coronary catheterization procedure; Methods: We analyzed data from 44 non-acute patients aged 45-74 years hospitalized for coronary catheterization in East-Tallinn Central Hospital in 2020-2021. The radial EBI and ECG were measured simultaneously with contralateral radial and central pressure curves. The Savitzky–Golay filter was used for signal smoothing. The Hankel matrix decomposer for extraction of cardiac waveforms from the multi-component signals was applied. After extracting the cardiac component, a period detection algorithm was applied to EBI and blood pressure curves; Results: We were able to detect seven points on the pressure and EBI curves, five with good representativeness were selected for further analysis. Spearman correlation coefficient was low for all but the central and distal pressure curve systolic upstroke time points. High positive correlation was found between PWV measured both invasively and with EBI. High positive correlation was found between invasive and noninvasive PWV calculations. Median CPWV was significantly lower in patients with normal coronaries compared to patients with any stage of coronary disease; Conclusions: With regard to wearable devices, the EBI derived PAT can serve as a substrate to PWV calculations and cardiovascular risk assessment, although these data require further confirmation.
Keywords:
electrical bioimpedance
; blood pressure
; cardiovascular risk
; wearables
; pulse arrival time
; pulse wave velocity
; complementary pulse wave velocity
1. Introduction
Detection, measurement, and treatment of high blood pressure (BP) or as a ’silent killer’, the leading risk factor for death and disability globally plays an essential role in the prevention and control of cardiovascular diseases (CV) [1,2,3,4,5,6,7,8]. In clinical practice, measurements of systolic and diastolic BP are performed with the conventional brachial cuff sphygmomanometer [9] to represent the pressure load in the large conduit arteries that connect to the peripheral vascular beds and organs. However, this method may have variable accuracy [10] and due to anatomical proximity, pulsatile stress on organs such as the heart, brain, and kidney is determined more closely by central aortic pulse pressure than by the peripheral pulse pressure [11]. There is increasing evidence that central, more than peripheral, BP is associated with target organ damage and potentially CV risk [12,13]. Arterial stiffness and the mechanics of arterial pulse wave propagation, reflection and pulse pressure [14,15] are key parts of the complex and not only mechanical but also neurohumoral [8,16] vascular pressure system. Various technological and computational technologies are increasingly being introduced into the field of cardiovascular disease management [17,18,19]. Hence, the indirect measurement of brachial arterial BP is first and most simple step of describing cardiovascular risk, but the addition of information derived from the peripheral arterial pressure curves could result in improved assessment of CV function in relation to treatment and management not only values of high BP but arterial stiffness and vascular dysfunction. One approach involves calculating pulse wave velocity (PWV) based on pulse transit time (PTT) using photoplethysmography (PPG) from finger or toe with simultaneous electrocardiography (ECG), as increasing arterial stiffness and BP level decreases PTT values and increases the PWV [3,20,21,22]. Another option is to measure peripheral arterial pulsatile volume curves with EBI to obtain continuous data with diagnostic and prognostic significance [23,24,25].
The present study aimed to achieve non-invasive monitoring of central aortic BP using EBI sensing. Electronic circuitry with an embedded data acquisition and signal processing approach is described. The appropriate placement of electrodes is proposed and the results of modeling concerning the best sensitivity and stability of the measurement procedures are discussed.
2. Materials and Methods
2.1. Selection and Characteristics of Patients
In this prospective single-center study, we enrolled 66 consecutive patients aged 45-75 years, of whom 44 were applicable for further analysis. All patients were referred for a scheduled coronary angiography evaluation at East-Tallinn Central Hospital between years 2020-2021.
All enrolled patients were hemodynamically stable and in sinus rhythm before the procedure, presented palpable pulses in both radial arteries and had a contralateral variance of non-invasive brachial BP measurements of less than 20 mmHg. This study was approved by the Estonian Research Ethics Committee of the National Institute of Health Development and the study was carried out according to the Declaration of Helsinki. Written informed consent was obtained from all participants after a complete explanation of the protocol and possible risks.
Exclusion criteria comprised an ongoing acute coronary syndrome, previous myocardial infarction, previous coronary revascularization (percutaneous coronary intervention or coronary artery bypass grafting, PCI/CABG), persistent atrial fibrillation (AF), significant and/or corrected valvular disease, cardiomyopathy with left ventricular ejection fraction (LVEF) <30%, pericardial effusion, renal insufficiency with estimated glomerular filtration rate (eGFR) <30 mL/min/1,73m2, other significant and / or life-shortening vascular diseases (vasculitis, aortic disease including endovascular thoracic endovascular aortic repair (TEVAR), or chemotherapy).
Hypertension was defined as >140 mmHg for systolic and/or >90 mmHg for diastolic BP in repeated measurements or permanent treatment with antihypertensive drugs. Diabetes mellitus was defined as fasting blood glucose concentration >7 mmol L−1 or antihyperglycemic drug treatment. Dyslipidaemia was defined as LDL cholesterol >3mmol L−1 or antidyslipidemic drug treatment. Body mass index (BMI) was calculated by dividing a patient’s weight at current hospitalization in kilograms by their height in meters squared. Vascular disease was defined by the previous diagnosis of lower extremity arterial disease, aortic aneurysm, or atherosclerosis, and a history of ischemic or hemorrhagic stroke.
2.2. Catheterization and Measurement of the Invasive Hemodynamic Data and EBI
Noninvasive brachial BP measurements were performed on the cardiology ward upon arrival, selective coronary angiography with invasive blood pressure and bioimpedance measurements was performed on the same day or the next day as scheduled. Electrodes placing and measuring points in cath lab are shown in Figure 1.
Hemodynamic measurements were conducted while the patient was in a supine position. For premedication, midazolam 3.5 mg p.o. was administered in the ward. In the Cathlab, electrodes for electrical bioimpedance (EBI) were placed to the left radial palpable pulse longitudinally (Figure 1), and three ECG electrodes were placed on shoulders and left leg. The pressure was calibrated to normal atmospheric pressure prior to inserting the catheters. The right radial artery was cannulated, and coronary angiograms performed as standard procedure. BP measurements were performed via cannula of radial artery and the central BP was obtained via 6F Pigtail catheter positioned above aortic annulus.
All direct invasive BP measurements were achieved via saline (NaCl 0.9%) flushed line (ACIST CVI AngioTouch Kit) which was connected to ACIST CVi™ Contrast Delivery System (Standard) and were registered with the PHILIPS Xper PM5 hemodynamic system. Measurements of EBI were carried out simultaneously for every invasive measurement of BP (i.e., left radial EBI-right radial BP; left radial EBI – ascending aorta (patient nr.3 shown in Figure 3). All registered curves (EBI, ECG, BP) were recorded with MFLI Lock-in Amplifier of Zurich Instruments, Zürich, Switzerland and saved digitally.
Coronary artery anatomy was assessed visually by performing physician fluoroscopic images during the standard procedure performed with the Allura Xper FD20 Clarity angiograph. Direct coronary angiography was performed via 6 F diagnostic catheters with Visipaque 320 mg Iodine mL−1. The narrowing of the coronary arteries were categorized as follows:
- 0 - Normal coronaries
- 1 - Minimal (≤25)% decrease in vessel diameter
- 2 - Moderate (26–50)% decrease in vessel diameter
- 3 - Medium (51–75)% decrease in vessel diameter
- 4 - Severe (76–90)% decrease in vessel diameter
- 5 - Preocclusion (91–99)%
- 6 - Occlusion (100)%
The patient’s numeric information was stored in the Red Cap database.
2.3. Data Analysis
The following risk factor groups were formed based on patient’ baseline clinical charcateristics: body mass index (BMI) greater than 35, diabetes mellitus, hypertension, dyslipidemia without medical treatment, current or previous smoking, arterial vascular disease in locations other than the coronary arteries. Based on coronary lesions, the groups were formed as follows (see Table 1):
- Normal coronaries,
- Minimal/Moderate (≤50)% decrease in vessel diameter,
- Medium (51–75)% decrease in vessel diameter,
- Significant (51–100)% decrease in vessel diameter.
2.4. Signals Preprocessing
The acquired data was smoothed with the Savitzky-Golay filter (with window duration 0.1 and polynomial order of 3). Secondly, the data were resampled at a new sample rate equal to 150 sample s−1. In this study, instead of subtracting the mean value (high-pass filter), baseline compensation (subtraction) was used to extract the cardiac component. By the baseline of both the cardiac impedance signal and the pulse wave of blood pressure, we mean the curve that passes the minima or base of the waveforms of the signals (point B in Figure 2). These minima were related to the end of the diastolic and beginning of the systolic processes. For this task, the Hankel matrix-based signal decomposer was used [26].
2.5. Fiducial Points Overview
In the current work, we used alphabetical sequence of Latin letters from B to H, which corresponds to fiducial points of the EBI/RAP and CAP waveforms. We started from B as base point, corresponding to a baseline of the curve. In Figure 2 are shown illustrative typical waveforms of the EBI and CAP periods with fiducial points, time, and amplitude intervals of our interest.
Several points on the CAP and EBI/RAP curves were identified, but only five (B, C, D, F, G) met the criteria for acceptable accuracy across all patients. Consequently, only these points were included for further analysis in this study.
The estimation of fiducial points varies between EBI/RAP waveforms and the CAP waveform. Detailed procedures for each are provided in the subsections that follow.
2.5.1. EBI/RAP Fiducial Points Estimation
The following text describes the algorithms used to identify points on the EBI and RAP signal waveforms. Although the text refers specifically to impedance signals, the same principles apply to the RAP signals and their corresponding points.
-
B point:In cardiac impedance waveform analysis, the B point marks the beginning of the peripheral impedance curve initiated by cardiac systolic ejection. The B point detection algorithm uses a straightforward approach by identifying the first point of the signal. This initial point represents the onset of the arterial systolic curve before the rapid upstroke phase of the impedance curve. Unlike more complex feature detection methods, B point identification is based on temporal positioning rather than derivative analysis or peak detection.
-
C point:The C point detection algorithm identifies the maximum slope in the cardiac impedance waveform, representing the rapid ventricular ejection phase. This critical point is mathematically determined by finding the maximum value of the first derivative using equation . The C point occurs as a result of ventricular systole, usually appearing between the B point (cycle onset) and the D point (peak impedance) and serves as a clinically significant marker for the assessment of contractility.
-
D point:The D point detection algorithm identifies the peak amplitude in the cardiac EBI waveform, representing the maximum blood flow during ventricular ejection. This critical cardiac feature is computationally determined by finding the global maximum value within the signal.
-
F point:The F point detection algorithm identifies a critical inflection point in the descending phase of the cardiac impedance waveform, marking the beginning of reduced ejection velocity after peak systolic function. This point is computationally determined by analyzing the third derivative of the impedance signal, specifically at the first transition from positive to negative slope after point D, which represents the equation . Point F serves as a significant marker for the onset of the cardiac relaxation phase, located between the peak ejection (point D) and the beginning of diastole.
-
G point:The G point detection algorithm identifies the onset of the dicrotic notch in the cardiac impedance waveform, marking the beginning of isovolumic relaxation. This inflection point is determined by analyzing the third derivative of the impedance signal, specifically finding the most significant negative excursion after the F point according to where and is a limiting factor. The G point serves as a critical marker for the onset of the ventricular relaxation phase, positioned during the early descending limb of the impedance curve after peak ejection.
2.5.2. CAP Fiducial Points Estimation
The upcoming text explains the techniques applied to detect the corresponding points on the CAP signal waveforms.
-
B point:Estimates the location of point B in the CAP waveform. Point B represents the onset of the systolic upstroke in the CAP signal, corresponding to the opening of the aortic valve and the beginning of ventricular ejection. This implementation simply identifies the first point in the signal as point B, which serves as a reference point for subsequent cardiac cycle analysis.
-
C point:Estimates the C point in the CAP waveform, which represents the maximum rate of pressure increase during systole. The C point is identified as the maximum of the first derivative of the pressure signal, corresponding to the steepest ascending slope of the pressure curve. Physiologically, this point reflects the rapid ejection phase and provides information about ventricular-arterial coupling. The time of occurrence and the amplitude of the C point are important markers for assessing left ventricular contractility and arterial compliance.
-
D point:Estimates the D point in the Central Aortic Pressure (CAP) waveform, which represents the completion of the deceleration of the ventricular ejection. The method analyzes the third derivative of pressure to identify the first positive segment after point C, locating D in the first quarter of this segment. Mathematically, the location of the D point (time instance) is defined as: in the interval . Where is the time at point C, and is the time at point F. This approach captures the maximum rate of change in pressure acceleration during late ventricular ejection, with the search window limited between points C and F to ensure physiological relevance.
-
F point:Estimates the F point in the CAP waveform. The point F represents the maximum systolic pressure in the CAP signal, occurring during the ventricular ejection phase. This method identifies F by locating the maximum amplitude value in the CAP signal .
-
G point:Estimates the G point in the CAP waveform, which represents the onset of left ventricular ejection. The algorithm identifies G by locating the minimum of the first derivative and then finding the beginning of the first negative segment in the third derivative within a defined interval. This interval spans from the minimum of the first derivative to halfway between this minimum and the end of the signal, providing a focused search region for detecting inflection changes. This approach exploits the inflection characteristics in which the third derivative becomes negative, indicating the acceleration change at the onset of the systolic ejection phase in the CAP signal.
2.6. Periods Ensemble Processing
This section introduces the methodology for processing cardiac signal periods within a synchronized ensemble framework. By selecting and aligning periods from various signals, such as EBI, CAP, and ECG, we ensure that only valid and simultaneous cardiac periods are analyzed. Subsequent steps, including outlier detection and normalization, refine the data further to create representative and averaged period ensembles. Detailed descriptions of each processing step are provided in the subsections that follow.
2.6.1. Periods Ensemble Synchronization
When all periods were found, we synchronized these periods, by storing only simultaneous periods found in all the signals, EBI RAP and CAP. All cardiac periods, which were presented only in one signal, were ignored and excluded from further analysis.
2.6.2. EBI and CAP Periods Selection
After extracting the cardiac component, the periods detection algorithm was applied to the impedance and BP cardiac signals.
2.6.3. ECG Periods Selection
ECG signal periods were selected using the time frame of the impedance corresponding to the periods shifted back in time by 300 ms (to obtain the whole ECG period). The starting points of the periods (the B point in Figure 2 and in Figure 3) were obtained from the first-order derivatives of the corresponding signals (EBI, CAP and RAP). The location of the B point is defined as the time instance when the value of the signal’s first derivative increases above the threshold level , with as the maximum value of the signal’s first-order derivative.
Figure 3.
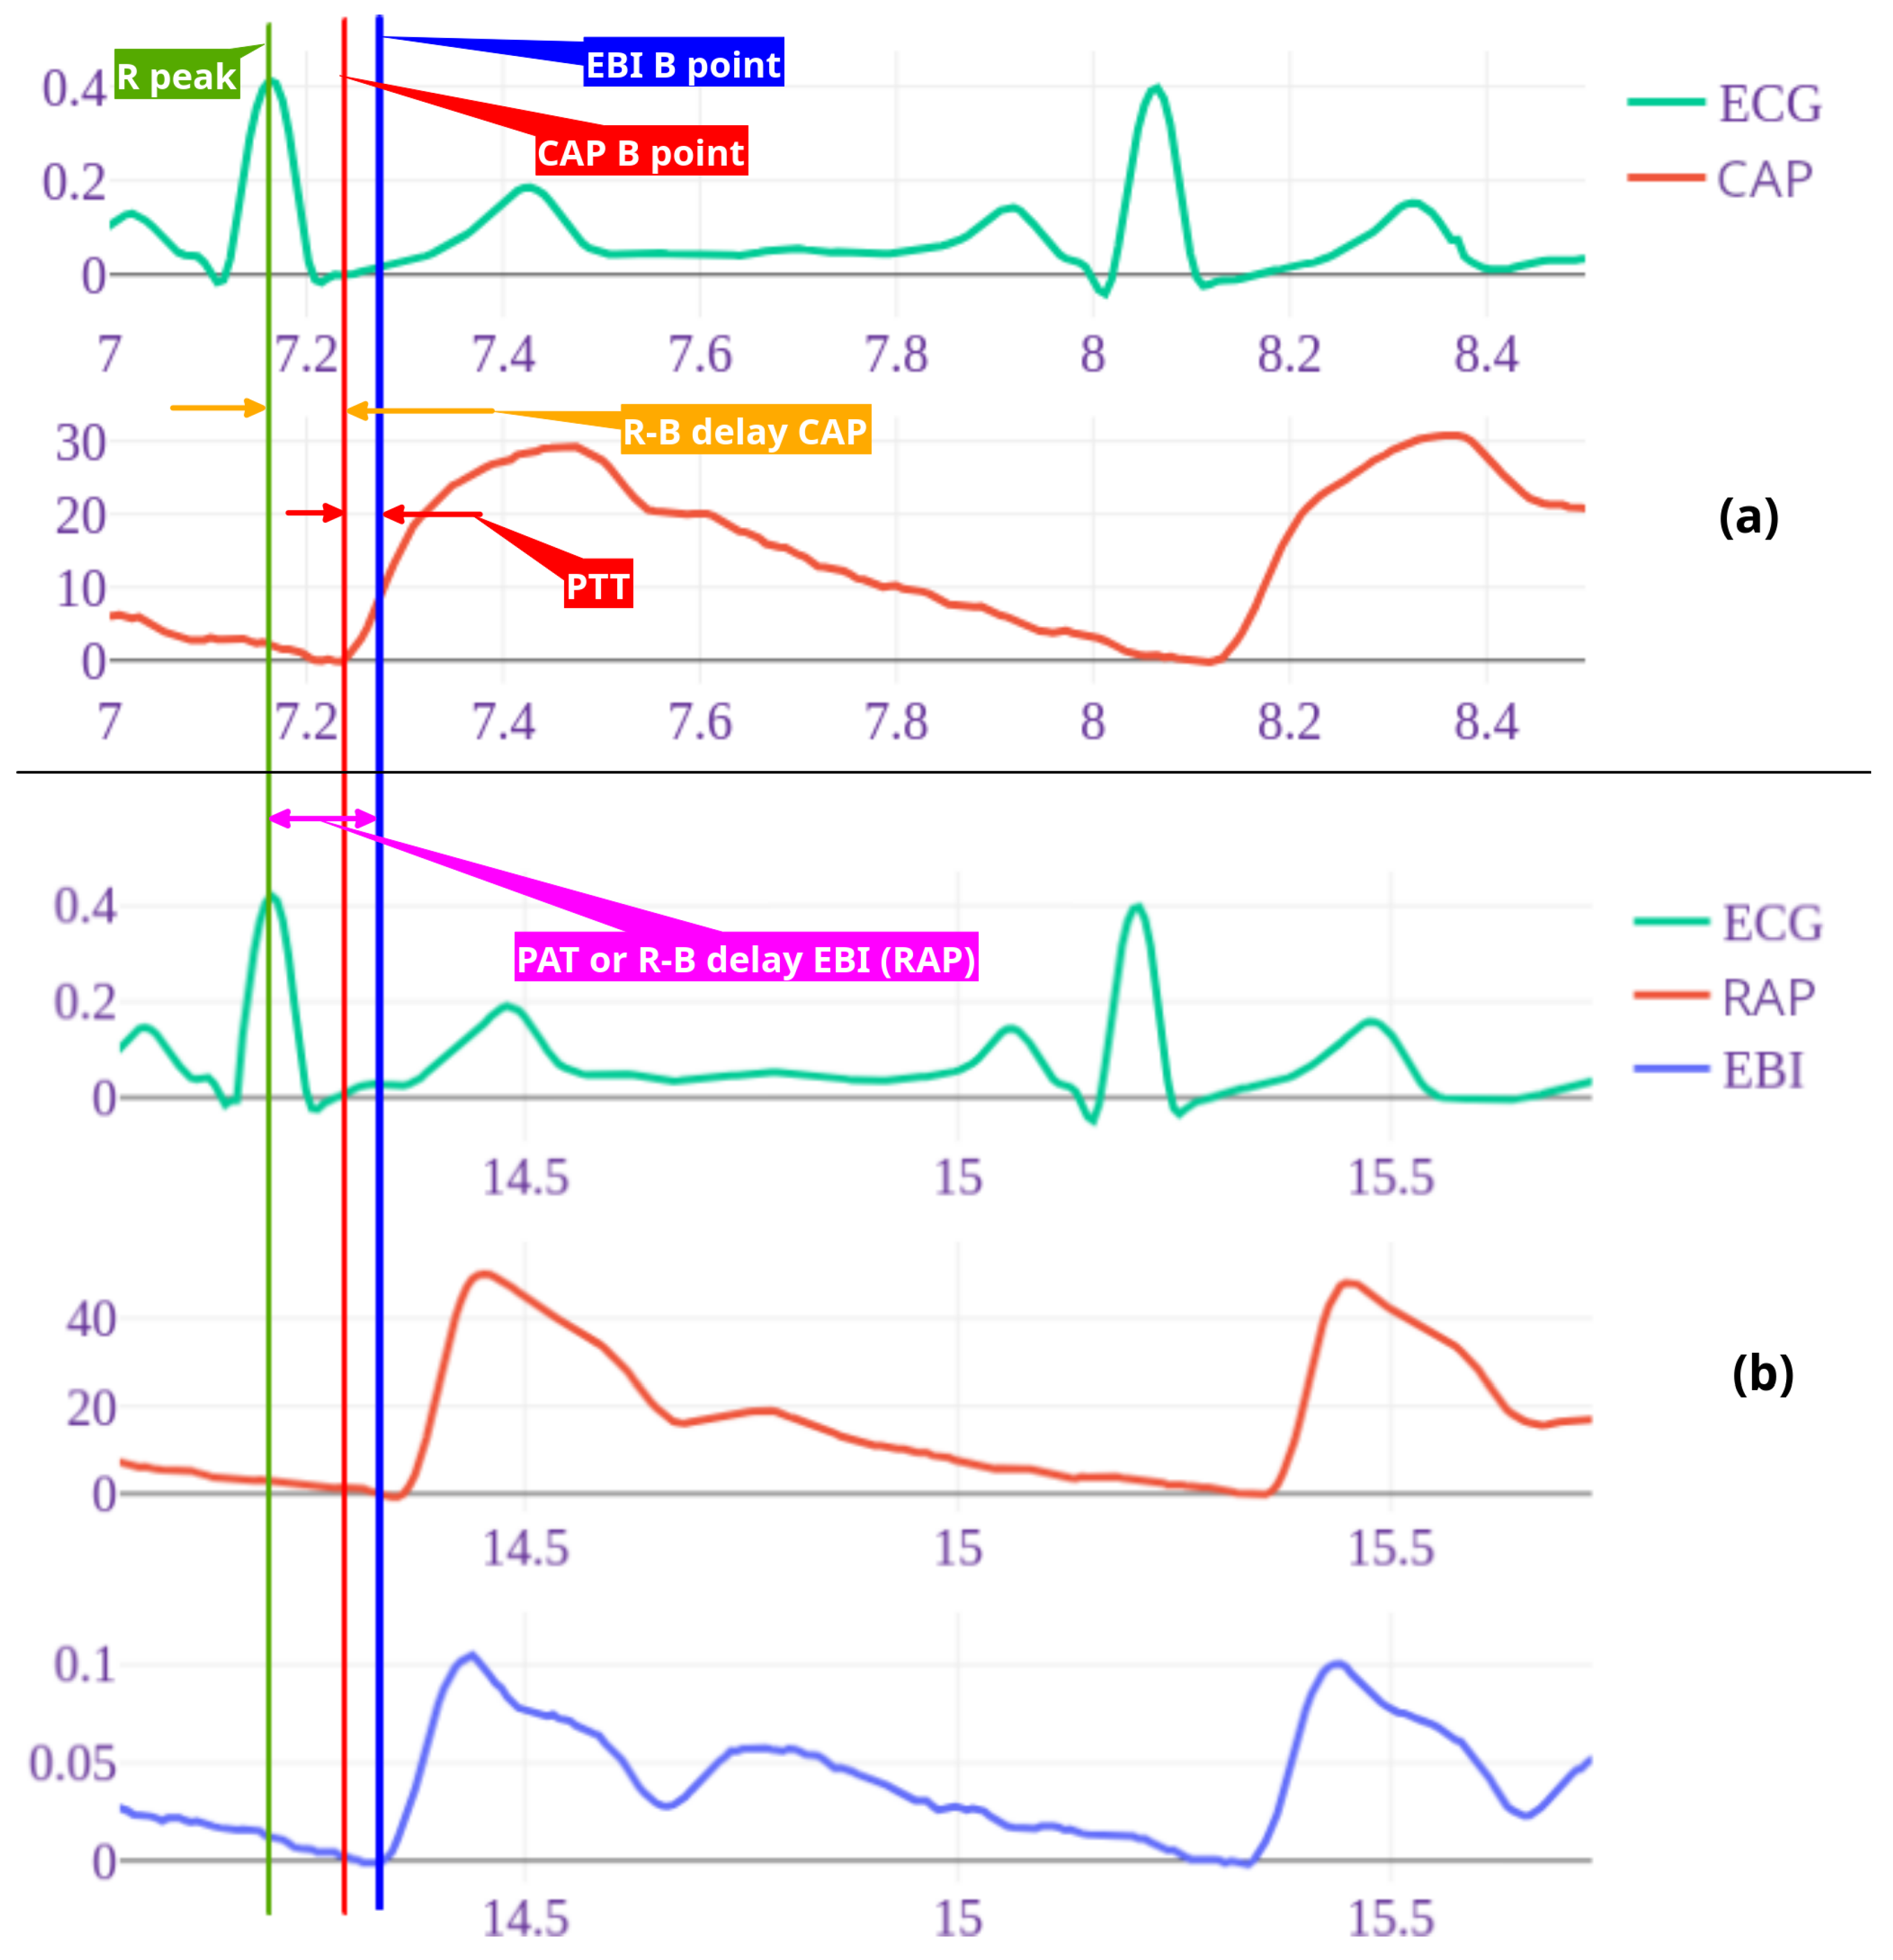
Example of wave recordings and time points for patient nr 3. ECG and central pressure recording (a) followed by Radial artery pressure and EBI recordings taken simultaneously with ECG (b). Timelines are shown with vertical lines as follows: green – ECG R peak, blue – radial arterial pressure (RAP) and EBI B point, red – central arterial pressure B point. R-B delay radial (RAP/EBI) interval, also pulse arrival time (PAT) with purple arrow and central (CAP) R-B delay with orange arrow. Pulse arrival time (PAT) is time from R peak to peripheral (RAP B point) and pulse transit time (PTT) is time between central and distal pressure wave B points (red arrow). Note: here shown 2 cycle recordings, for calculations 7-10 cycles were used.
Figure 3.
Example of wave recordings and time points for patient nr 3. ECG and central pressure recording (a) followed by Radial artery pressure and EBI recordings taken simultaneously with ECG (b). Timelines are shown with vertical lines as follows: green – ECG R peak, blue – radial arterial pressure (RAP) and EBI B point, red – central arterial pressure B point. R-B delay radial (RAP/EBI) interval, also pulse arrival time (PAT) with purple arrow and central (CAP) R-B delay with orange arrow. Pulse arrival time (PAT) is time from R peak to peripheral (RAP B point) and pulse transit time (PTT) is time between central and distal pressure wave B points (red arrow). Note: here shown 2 cycle recordings, for calculations 7-10 cycles were used.
2.6.4. Periods Outliers Sifting
Thereafter, all saved periods were filtered from outliers by the period signal waveform. Consequently, all the periods of the selected signals (EBI, CAP, RAP and ECG) were put into corresponding ensembles. For each ensemble, a three-step procedure for outlier detection was introduced:
- filtering of periods by their lengths, with very long and very short periods excluded;
- PCA based outlier detector from the pyOD Python library was used [27];
All three steps were applied sequentially. When some period after outlier detection was presented only in one collection, it was excluded from further analysis.
2.6.5. Periods Normalization
After the collection of accepted periods, they all were normalized in time by resampling (for each ensemble individually) to the same duration. The duration of the normalized period was estimated as the median duration of all periods in the set. Then, the ensemble averaged periods were obtained from the normalized period ensembles.
2.7. Features Selection
In this section, we outline the key features considered for the simplified noninvasive heart-to-arm pulse-wave velocity (PWV) analysis. Each feature is carefully selected to improve the accuracy and reliability of the proposed methodology. The features include fiducial points, time intervals, pulse arrival time (PAT), pulse transit time (PTT), and the newly proposed complementary pulse wave velocity (CPWV). These features form the foundation of the analytical framework discussed in subsequent subsections.
2.7.1. Fiducial Points Features
The selected fiducial points (described in Section 2.5.1, and shown in Figure 2) B, C, F, G and D were estimated for EBI and AP signals, and R and Q were estimated for ECG, respectively. For further analysis, time instances and values for the B, C, F, G and D points were scaled back to the original time scale, after ensemble averaging, and stored into the table. The time instances of the detected points were related to the beginning of the period, presented as point B.
2.7.2. Time Intervals as Features
Furthermore, delays from the R peak to the B points of the EBI/RAP and CAP signals (Figure 3) were estimated and used in the following analysis. For each simultaneous period, these delays were individually estimated. For the final analysis, the median delay was used for all ensemble periods.
2.7.3. PAT and PTT as Features
The invasive pressure-based and non-invasive volume-based pulse arrival time (PAT) was calculated. For invasive pulse arrival time () to distal radial artery we measured time in seconds from R-peak in ECG to beginning point of the radial pressure () and for noninvasive pulse arrival time () beginning point of radial bioimpedance (), point B in Figure 2 (see also Figure 3). For pulse transit time (PTT) we measured time from ECG R peak to B point on CAP and thereby calculated time between and points ( delay minus delay in Figure 3).
2.7.4. PWV as Features
For direct PWV calculations from the aortic valve to the distal radial artery, the distance with the Pigtail catheter was measured and the pressure curves above the aortic valve (CAP) and in distal radial artery were recorded as described in the Methods section. The pulse transit time (PTT) was calculated (1) by subtracting from :
where is the velocity of the pulse wave, is the distance between the aortic valve and the distal radial artery, in meters. is pulse arrival time for radial artery pressure and the pulse arrival time for central aortic pressure
2.7.5. CPWV as Features
For the non-invasive PWV calculation we used the fixed distance value 0.8 as the median radial aortic length of our investigated patients and the value in seconds. For this simplified noninvasive heart-to-arm PWV, we propose new term Complimentary Pulse Wave Velocity (CPWV).
For direct pulse-wave velocity calculations both time instances for the B point of the wave should be registered at the beginning of the wave propagation and at the end of the wave propagation process (e.g., close to the heart and on the radial artery). However, using the non-invasive EBI measurement in the radial artery, we can only register the wave propagation at the end point of the vasculature of interest. Consequently, for the proposed approach we assume that the time interval from the ECG R peak to the EBI B point does not change significantly as the measurements are performed in relatively healthy subjects without cardiac arrhythmia or high pulse rate situations such as exercise, fewer, or cardiac emergencies.
Therefore, we propose to use the time interval and the median arm length of the researched patients as a basis for the proposed estimate of CPWV (2), and the results for CPWV together with PWV are shown in Figure 11.
3. Results
In this study, data from 44 subjects were analyzed. The baseline demographic and clinical characteristics of the study patients are presented in Table 1. Pulse wave velocities between the aortic valve and the distal radial artery were calculated as described in the section on methods. For the statistical analysis in the paper, Spearman rank correlation coefficient is used due to the small number of patients. The correlations between the D, F and G time points on the pressure and bioimpedance curves are presented in Figure 4 and in Table 2, where a strong correlation is found between the times of the RAP and CAP G points.
Strong positive correlation (0.844) was found between R-B delay of RAP and EBI curves. R-B delay defined as time from R-point of ECG and B point of RAP and EBI curves (Figure 6, study patients are presented with numbers).
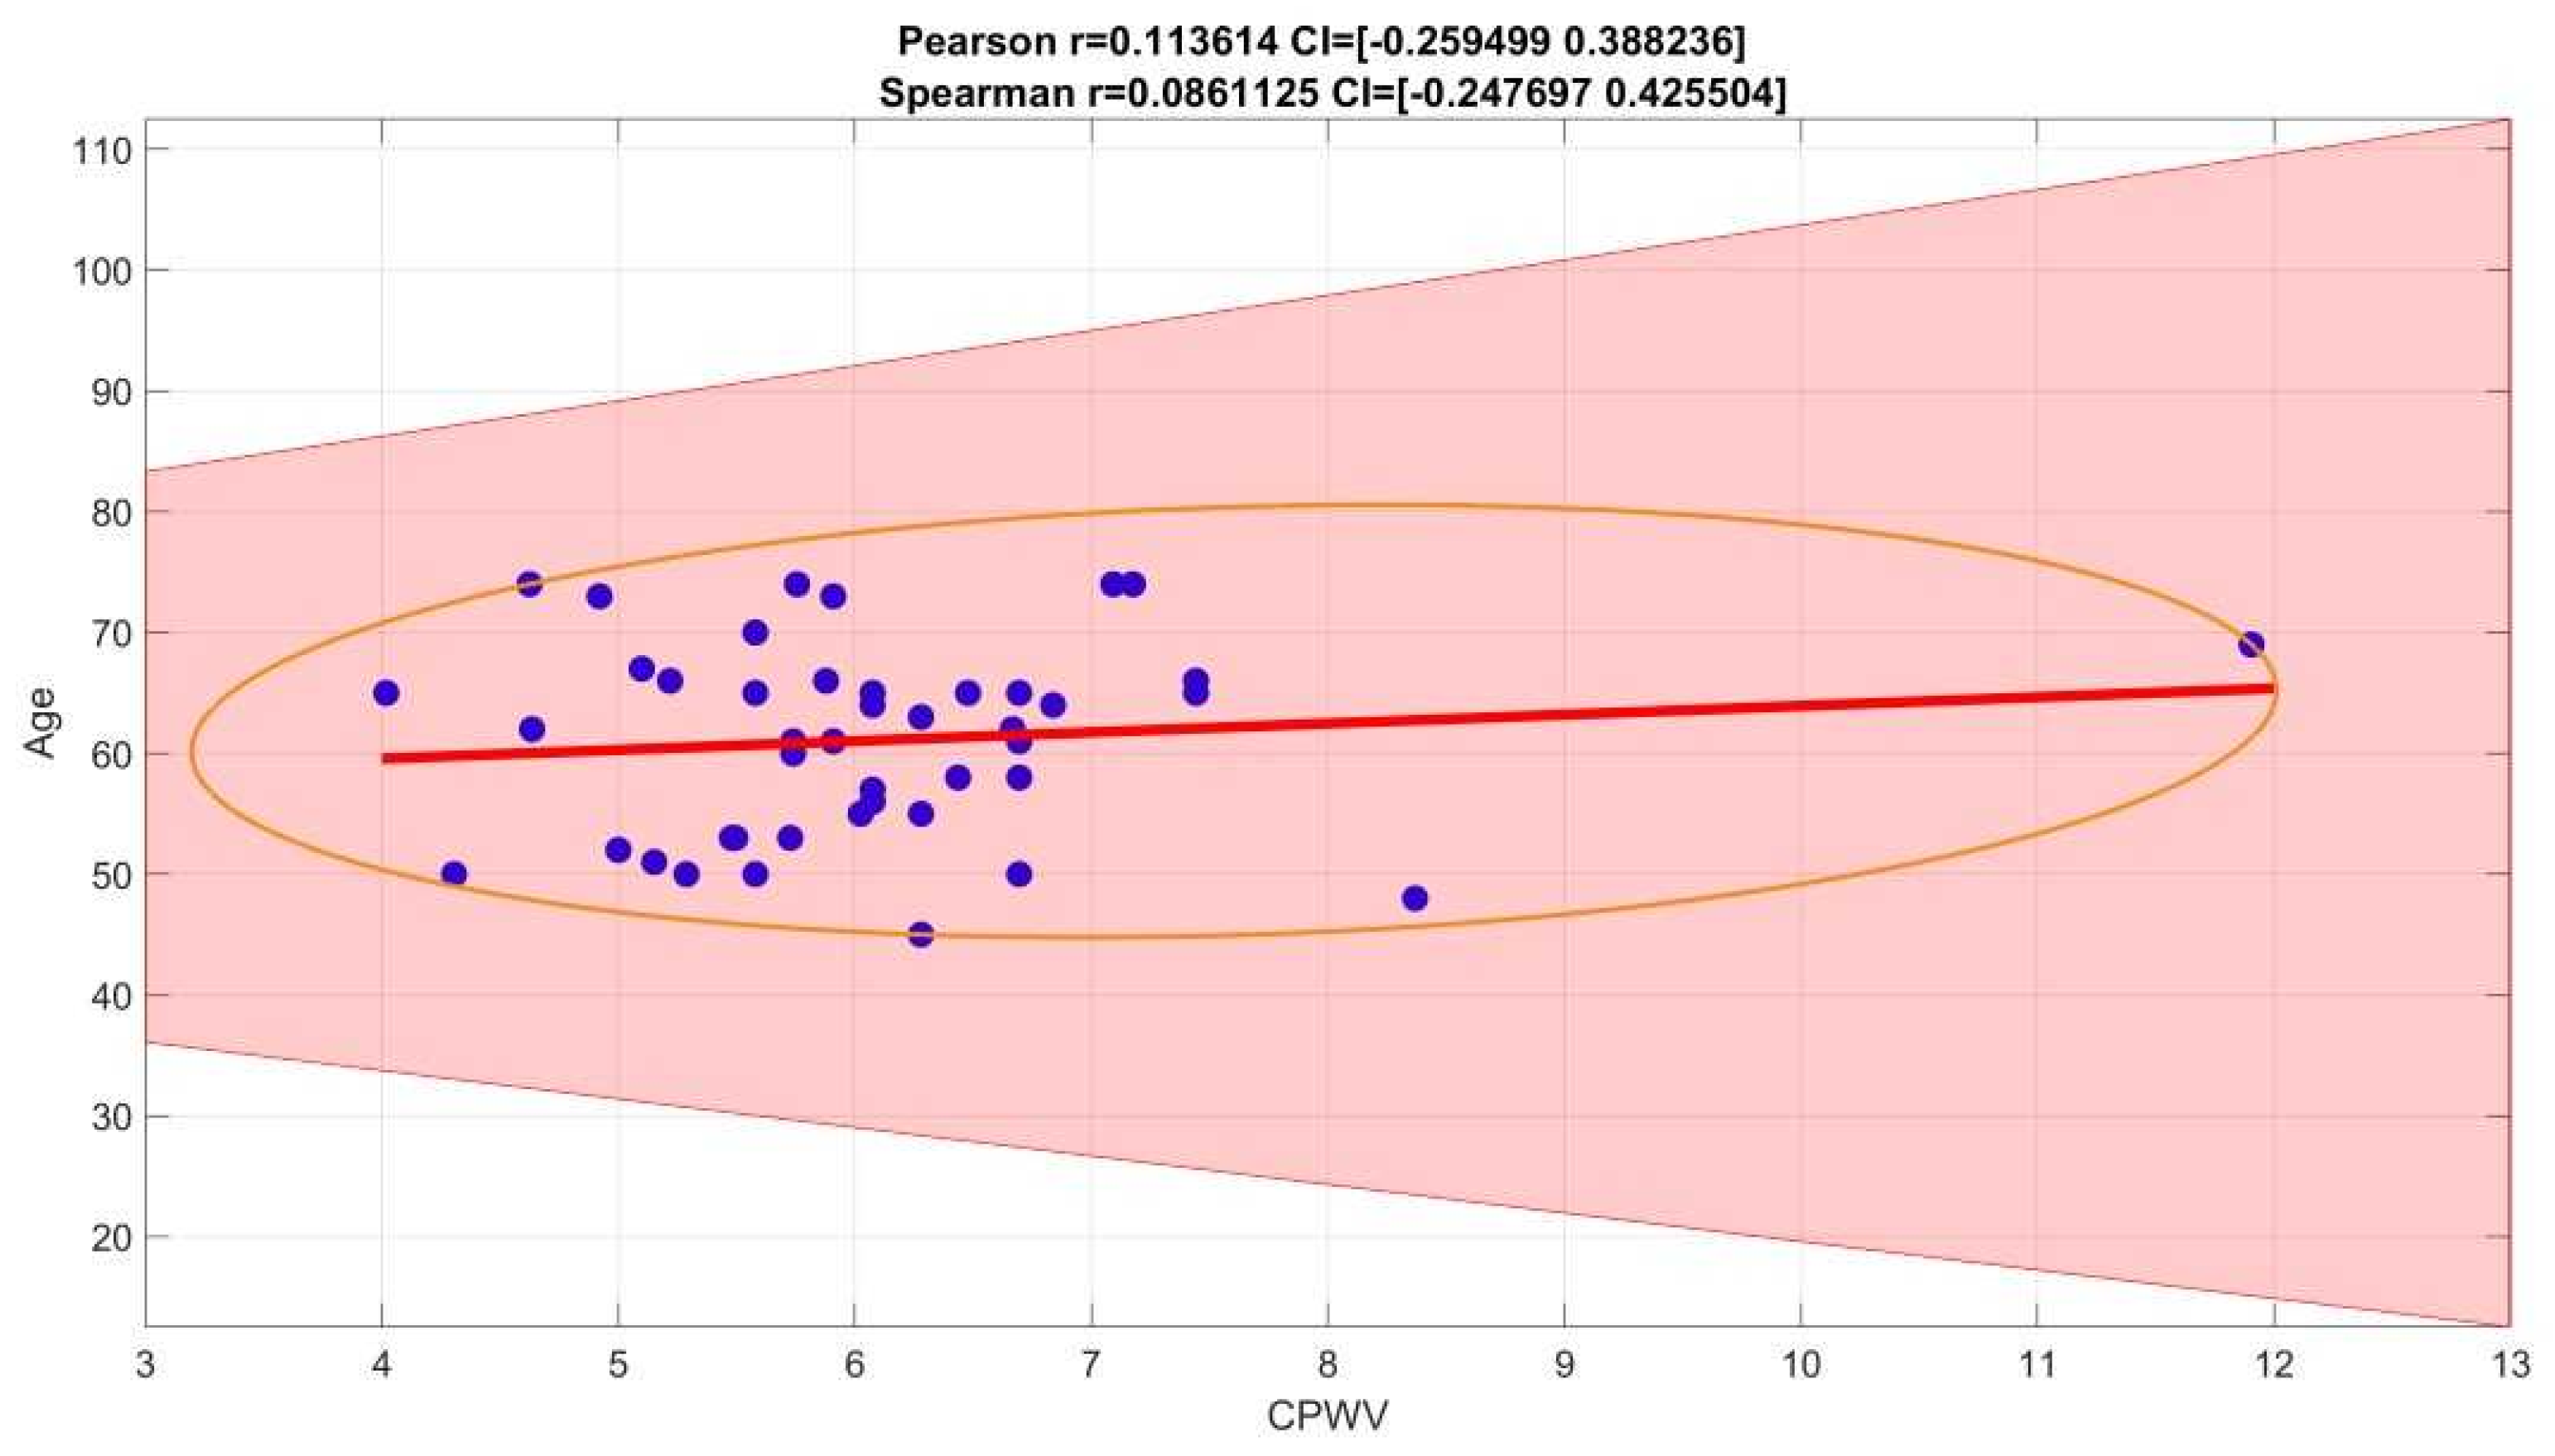
PWV calculations based on invasive (radial artery pressure, RAP) and non-invasive (radial electrical bioimpedance, EBI) R-B delay showed a moderate positive correlation with Spearman correlation coefficient 0.3255, confidence interval (0.0160, 0.5904) (Figure 7), similar correlation is shown in male gender group while female group is too small to make suggestions (Figure 9). In our group of patients (aged 45-74 years, moderate to high cardiovascular risk) PWV is not affected by age (Figure 8).
We pre described six groups of common cardiovascular risk factors such as hypertension, smoking, diabetes mellitus, overweight with BMI > 35, atherosclerosis in other vascular territories (stroke, peripheral arterial disease, etc.). Hypercholesterolemia was considered as risk factor if not treated, because of vasoprotective effect of statins when used in hyperlipidemia treatment. In our group only 2 patients had none of these risk factors as well only 2 had four risk factors, there were no patients with 5 or 6 risk factors (Table 1) . Correlation between risk factors and CPWV in our patient groups, shown in Figure 10, was weak, Spearman correlation coefficient 0.2688, confidence interval (0.0121, 0.4926).
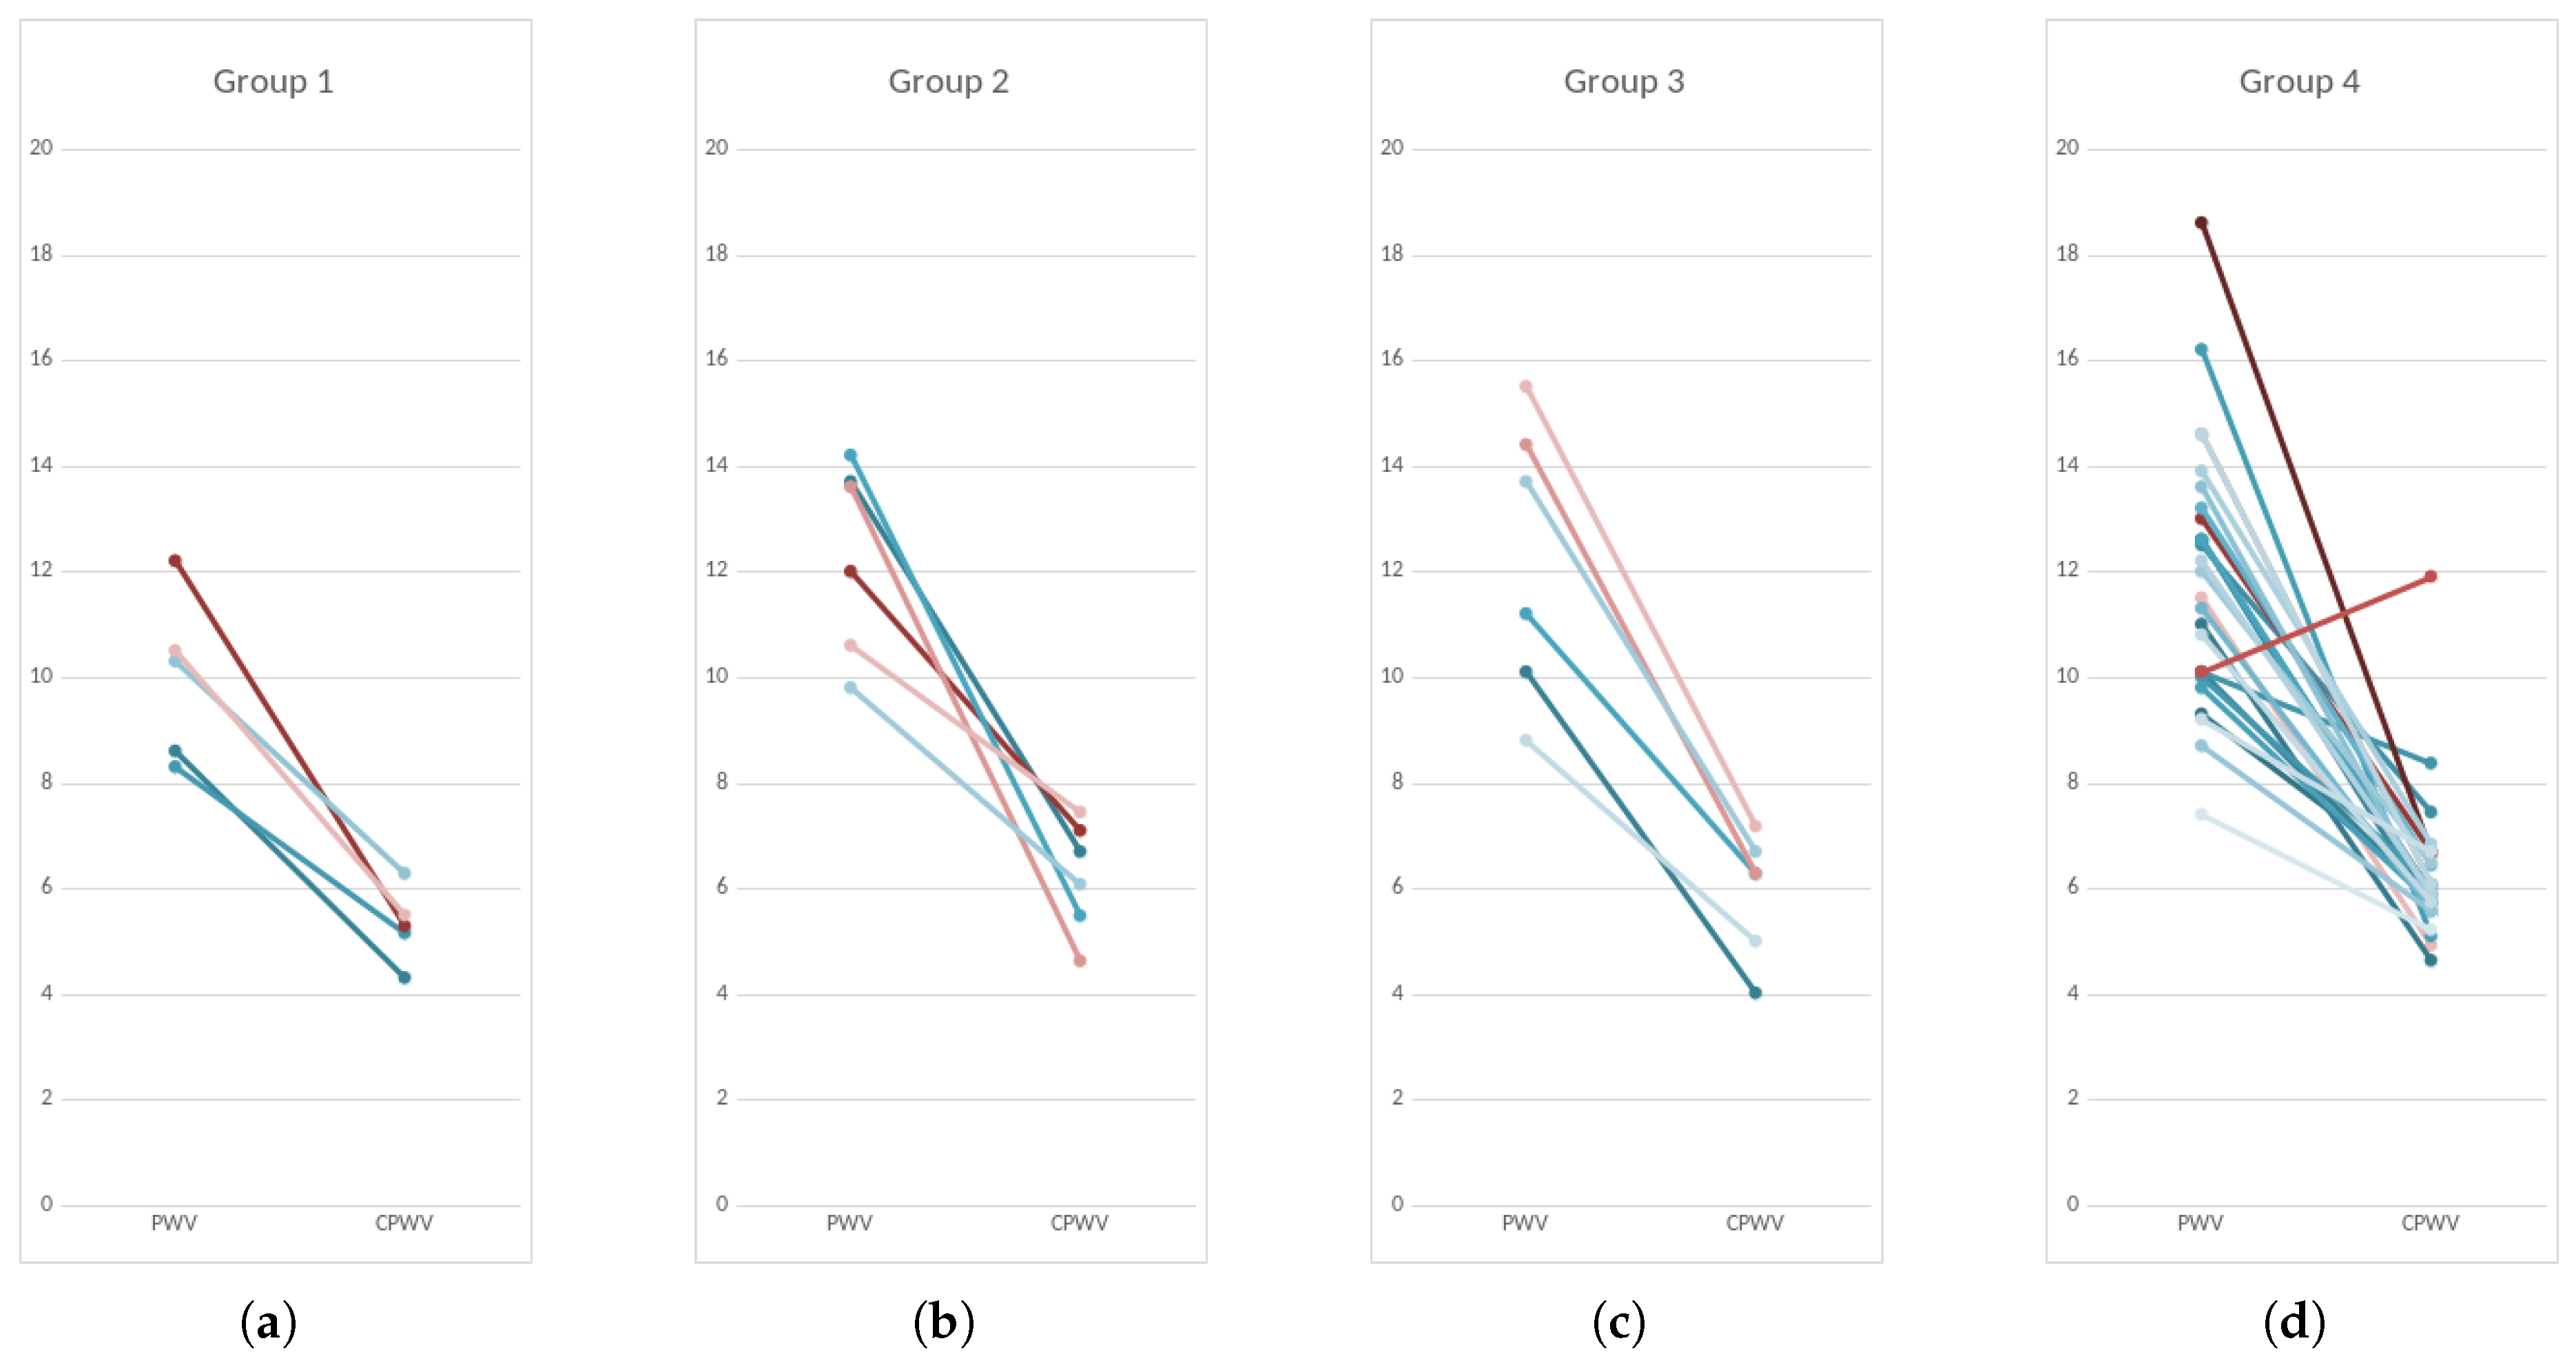
Based on coronary lesions we formed four groups of patients – first group with normal coronaries, second group with minimal/moderate changes (≤50)% stenoses, third group with moderately significant coronary lesions (51–75)% stenoses, non-revascularization objects, 1-2 vessel disease) and fourth group with significant (51–100)% stenoses that are objects of revascularization and three-vessel disease (Figure 11 and Figure 5).
Figure 5.
CPWV range and median in patient groups with different stages of coronary disease. Patients with coronary lesions present with higher CPWV values compared to patients with normal coronaries. There is moderate difference between median values of group 1 and groups 2-4, p-value is 0,0404; CPWV- complimentary pulse wave velocity; Patient groups: Group 1 – normal coronaries; Group 2 – with coronary stenoses ≤50%; Group 3 – with coronary stenoses (51–75)%, non-revascularization objects, 1-2 vessel disease; Group 4 – with coronary stenoses (51–100)% that are objects of revascularization and three-vessel disease.
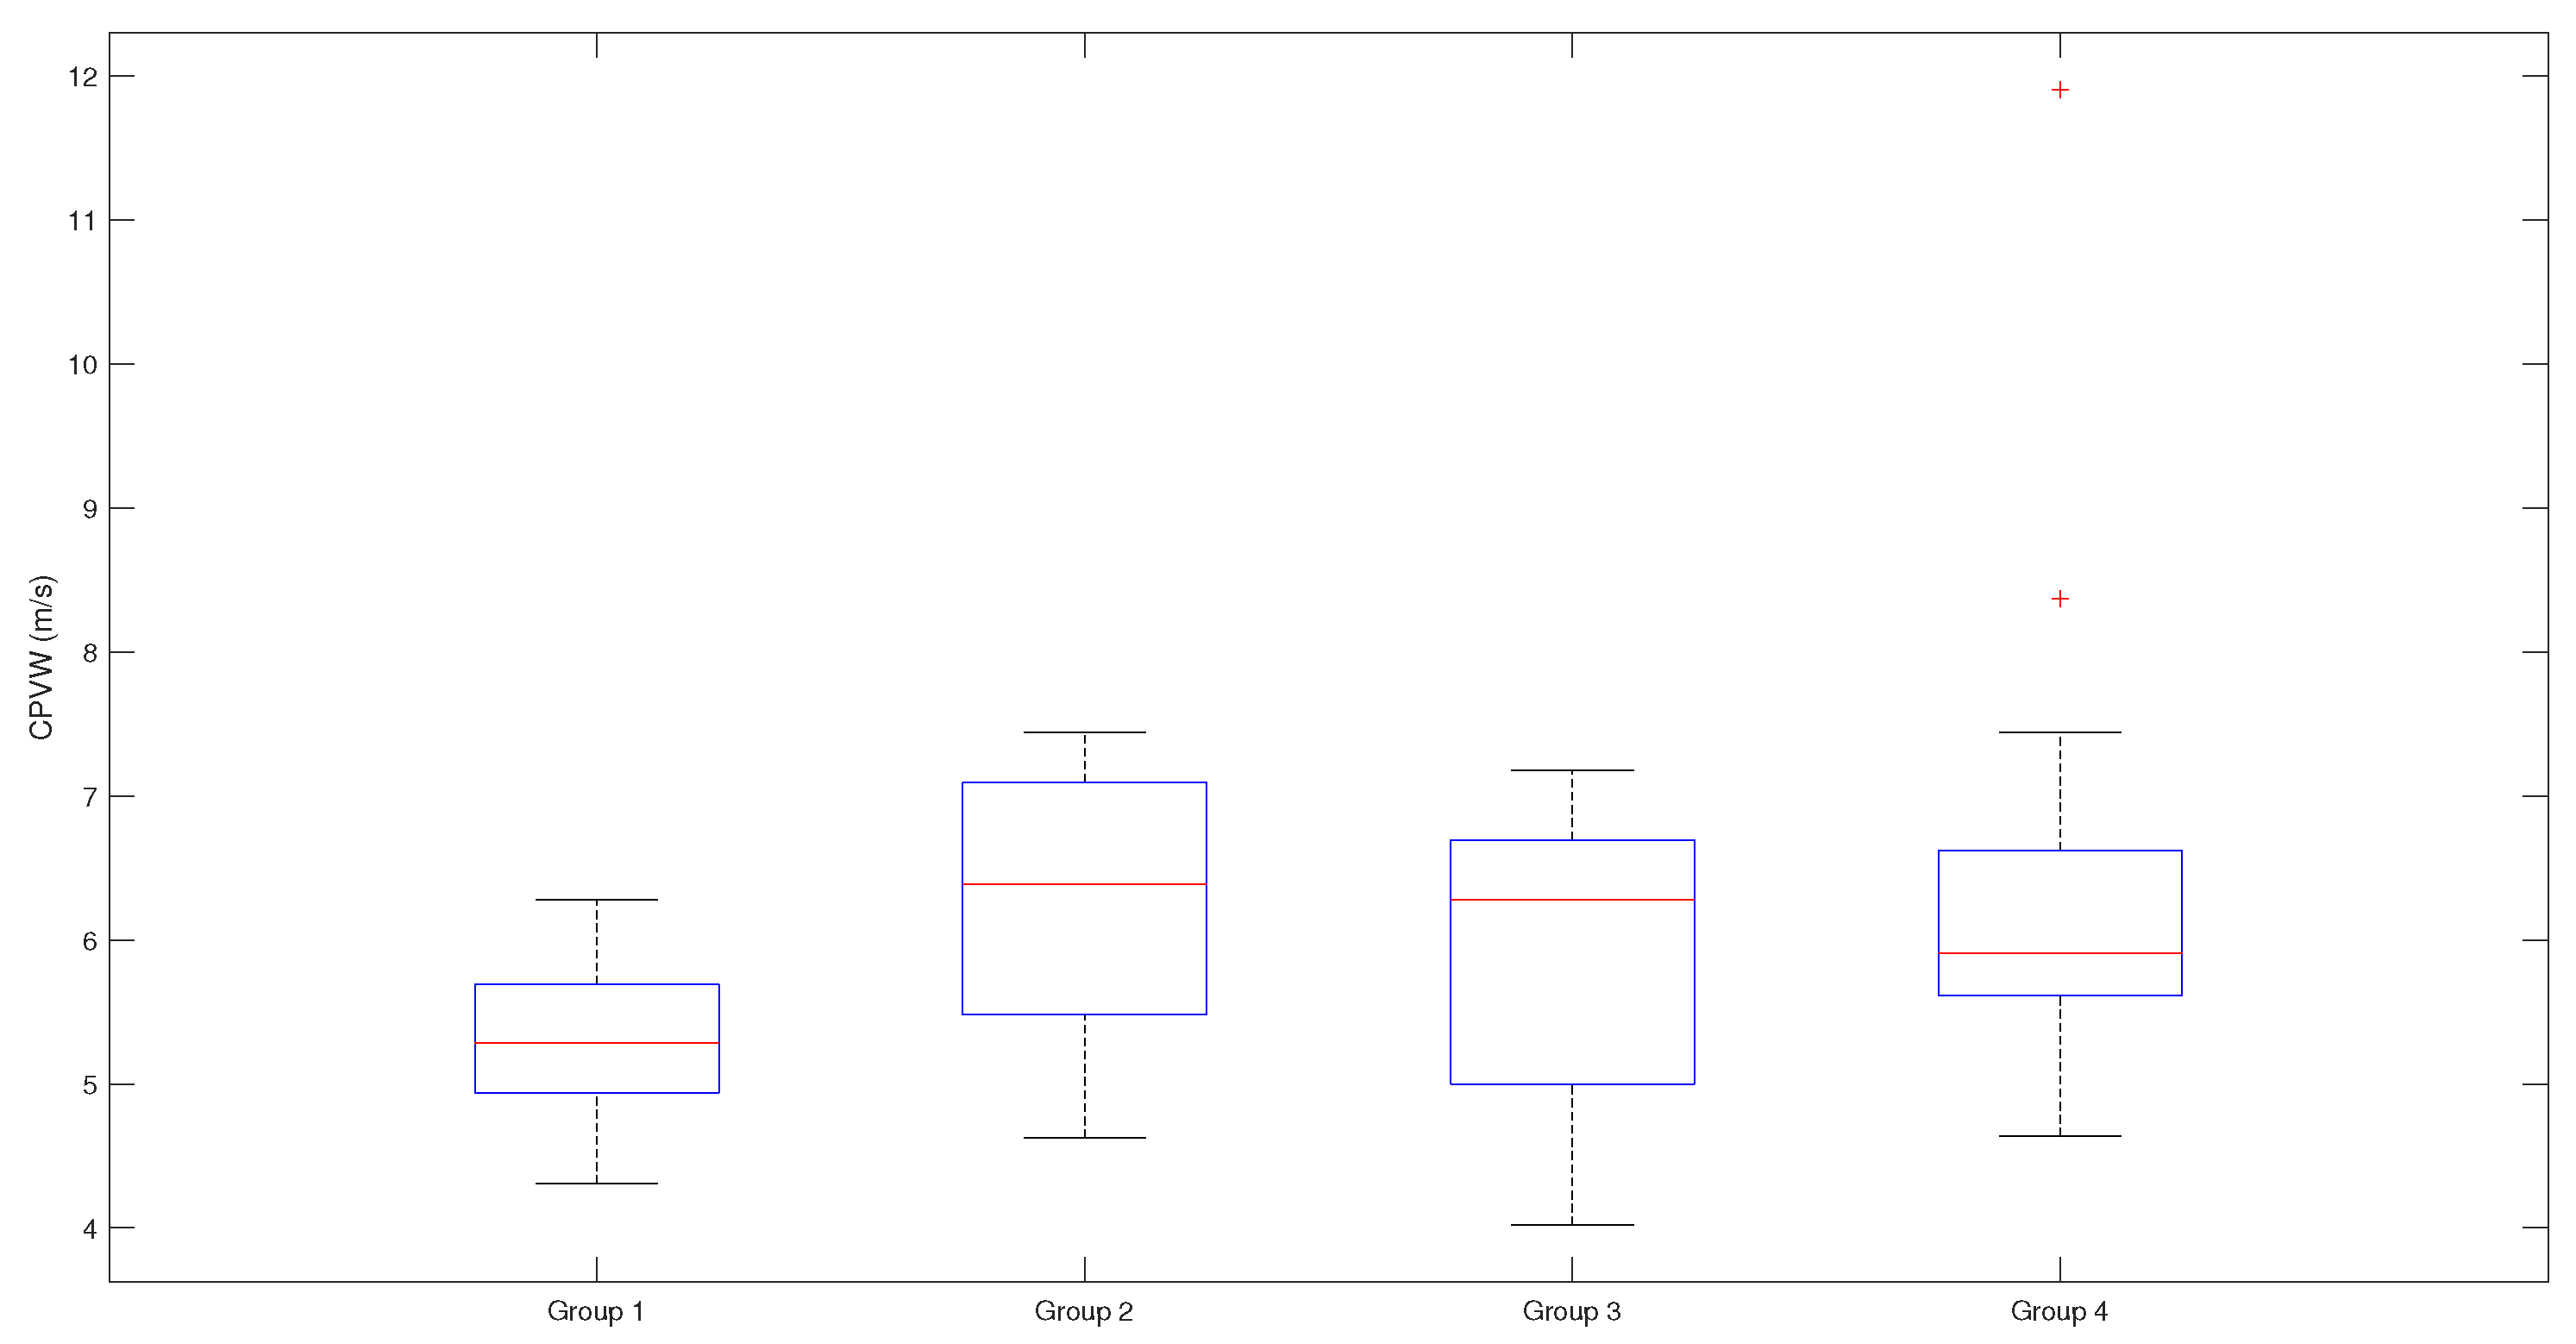
Figure 6.
Scatterplots and Spearman rank correlation coefficients for R-B delays. 0.844 for R-B delay , 0.573 for and 0.581 for ; Studied patients are presented with numbers; (0.7–0.9) is high positive correlation (0.5–0.7) is a moderate positive correlation; rap – radial artery pressure, ebi – electrical bioimpedance, cap – central aortic pressure, R – electrocardiogram R peak, B – start point of pressure/ebi curve.
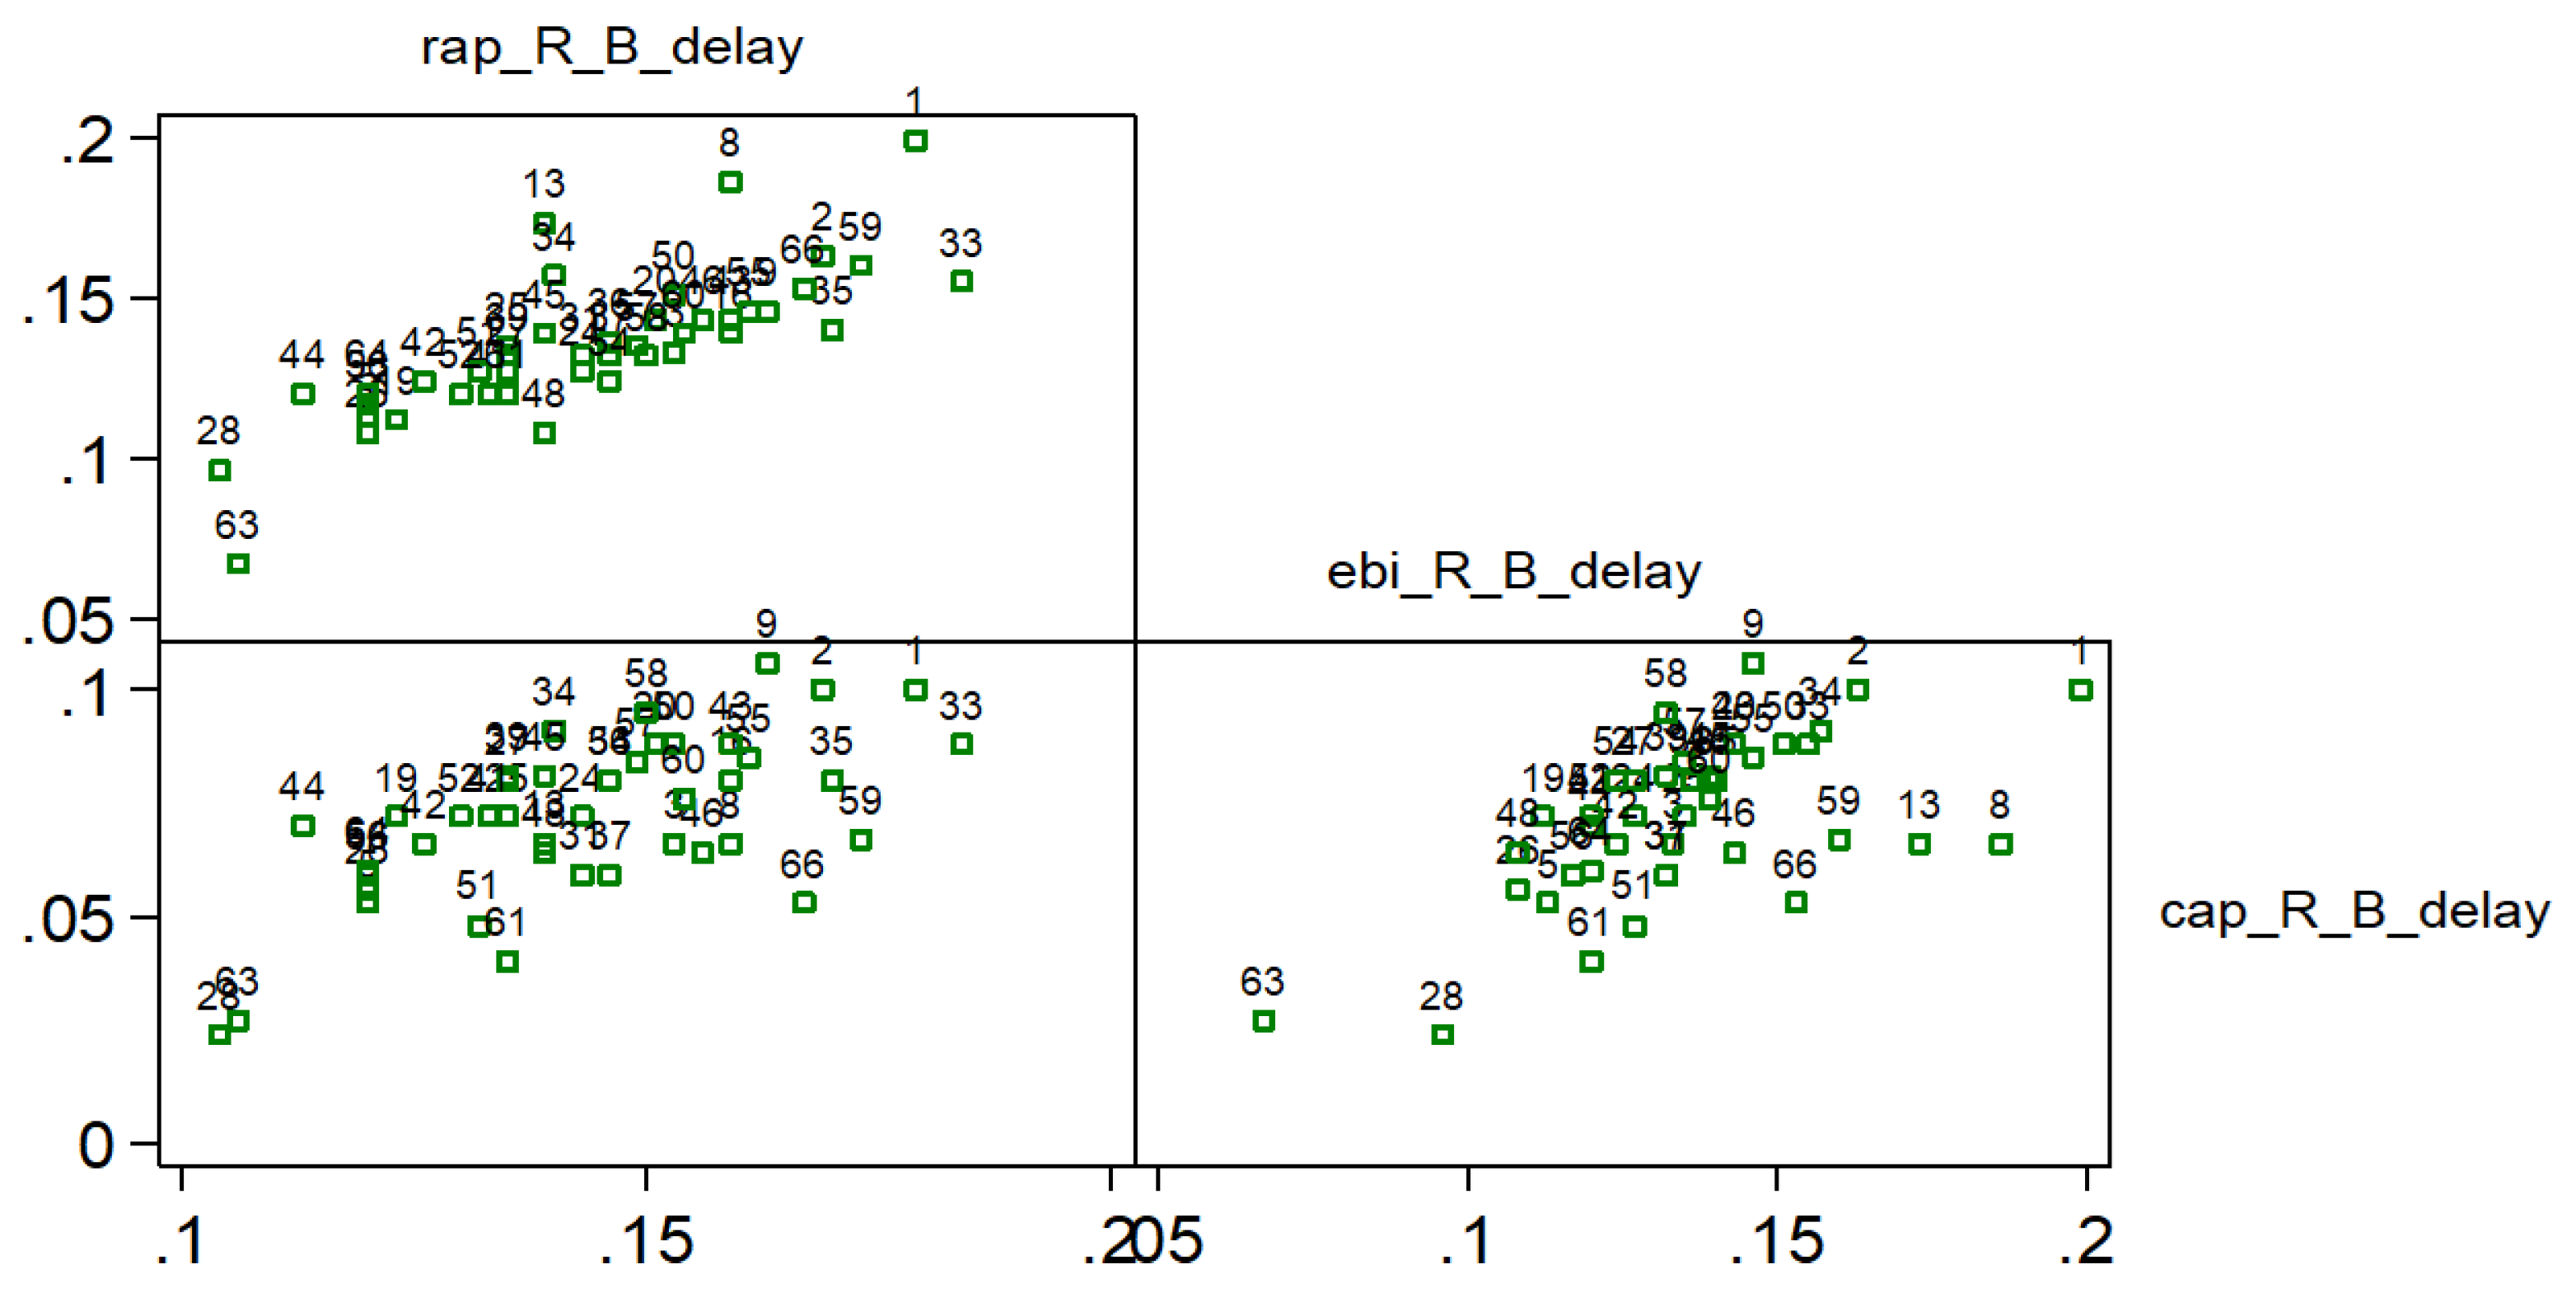
Figure 7.
Spearman rank correlation coefficients for PWV calculations based on direct blood pressure curves and EBI curves. Spearman correlation coefficient 0,2650 with confidence interval (−0.0327, 0.5305) indicates a weak positive correlation (with outliers (red points) removed, Spearman correlation coefficient is 0.3255, with confidence interval (0.0160, 0.5904), and indicates stronger positive correlation.
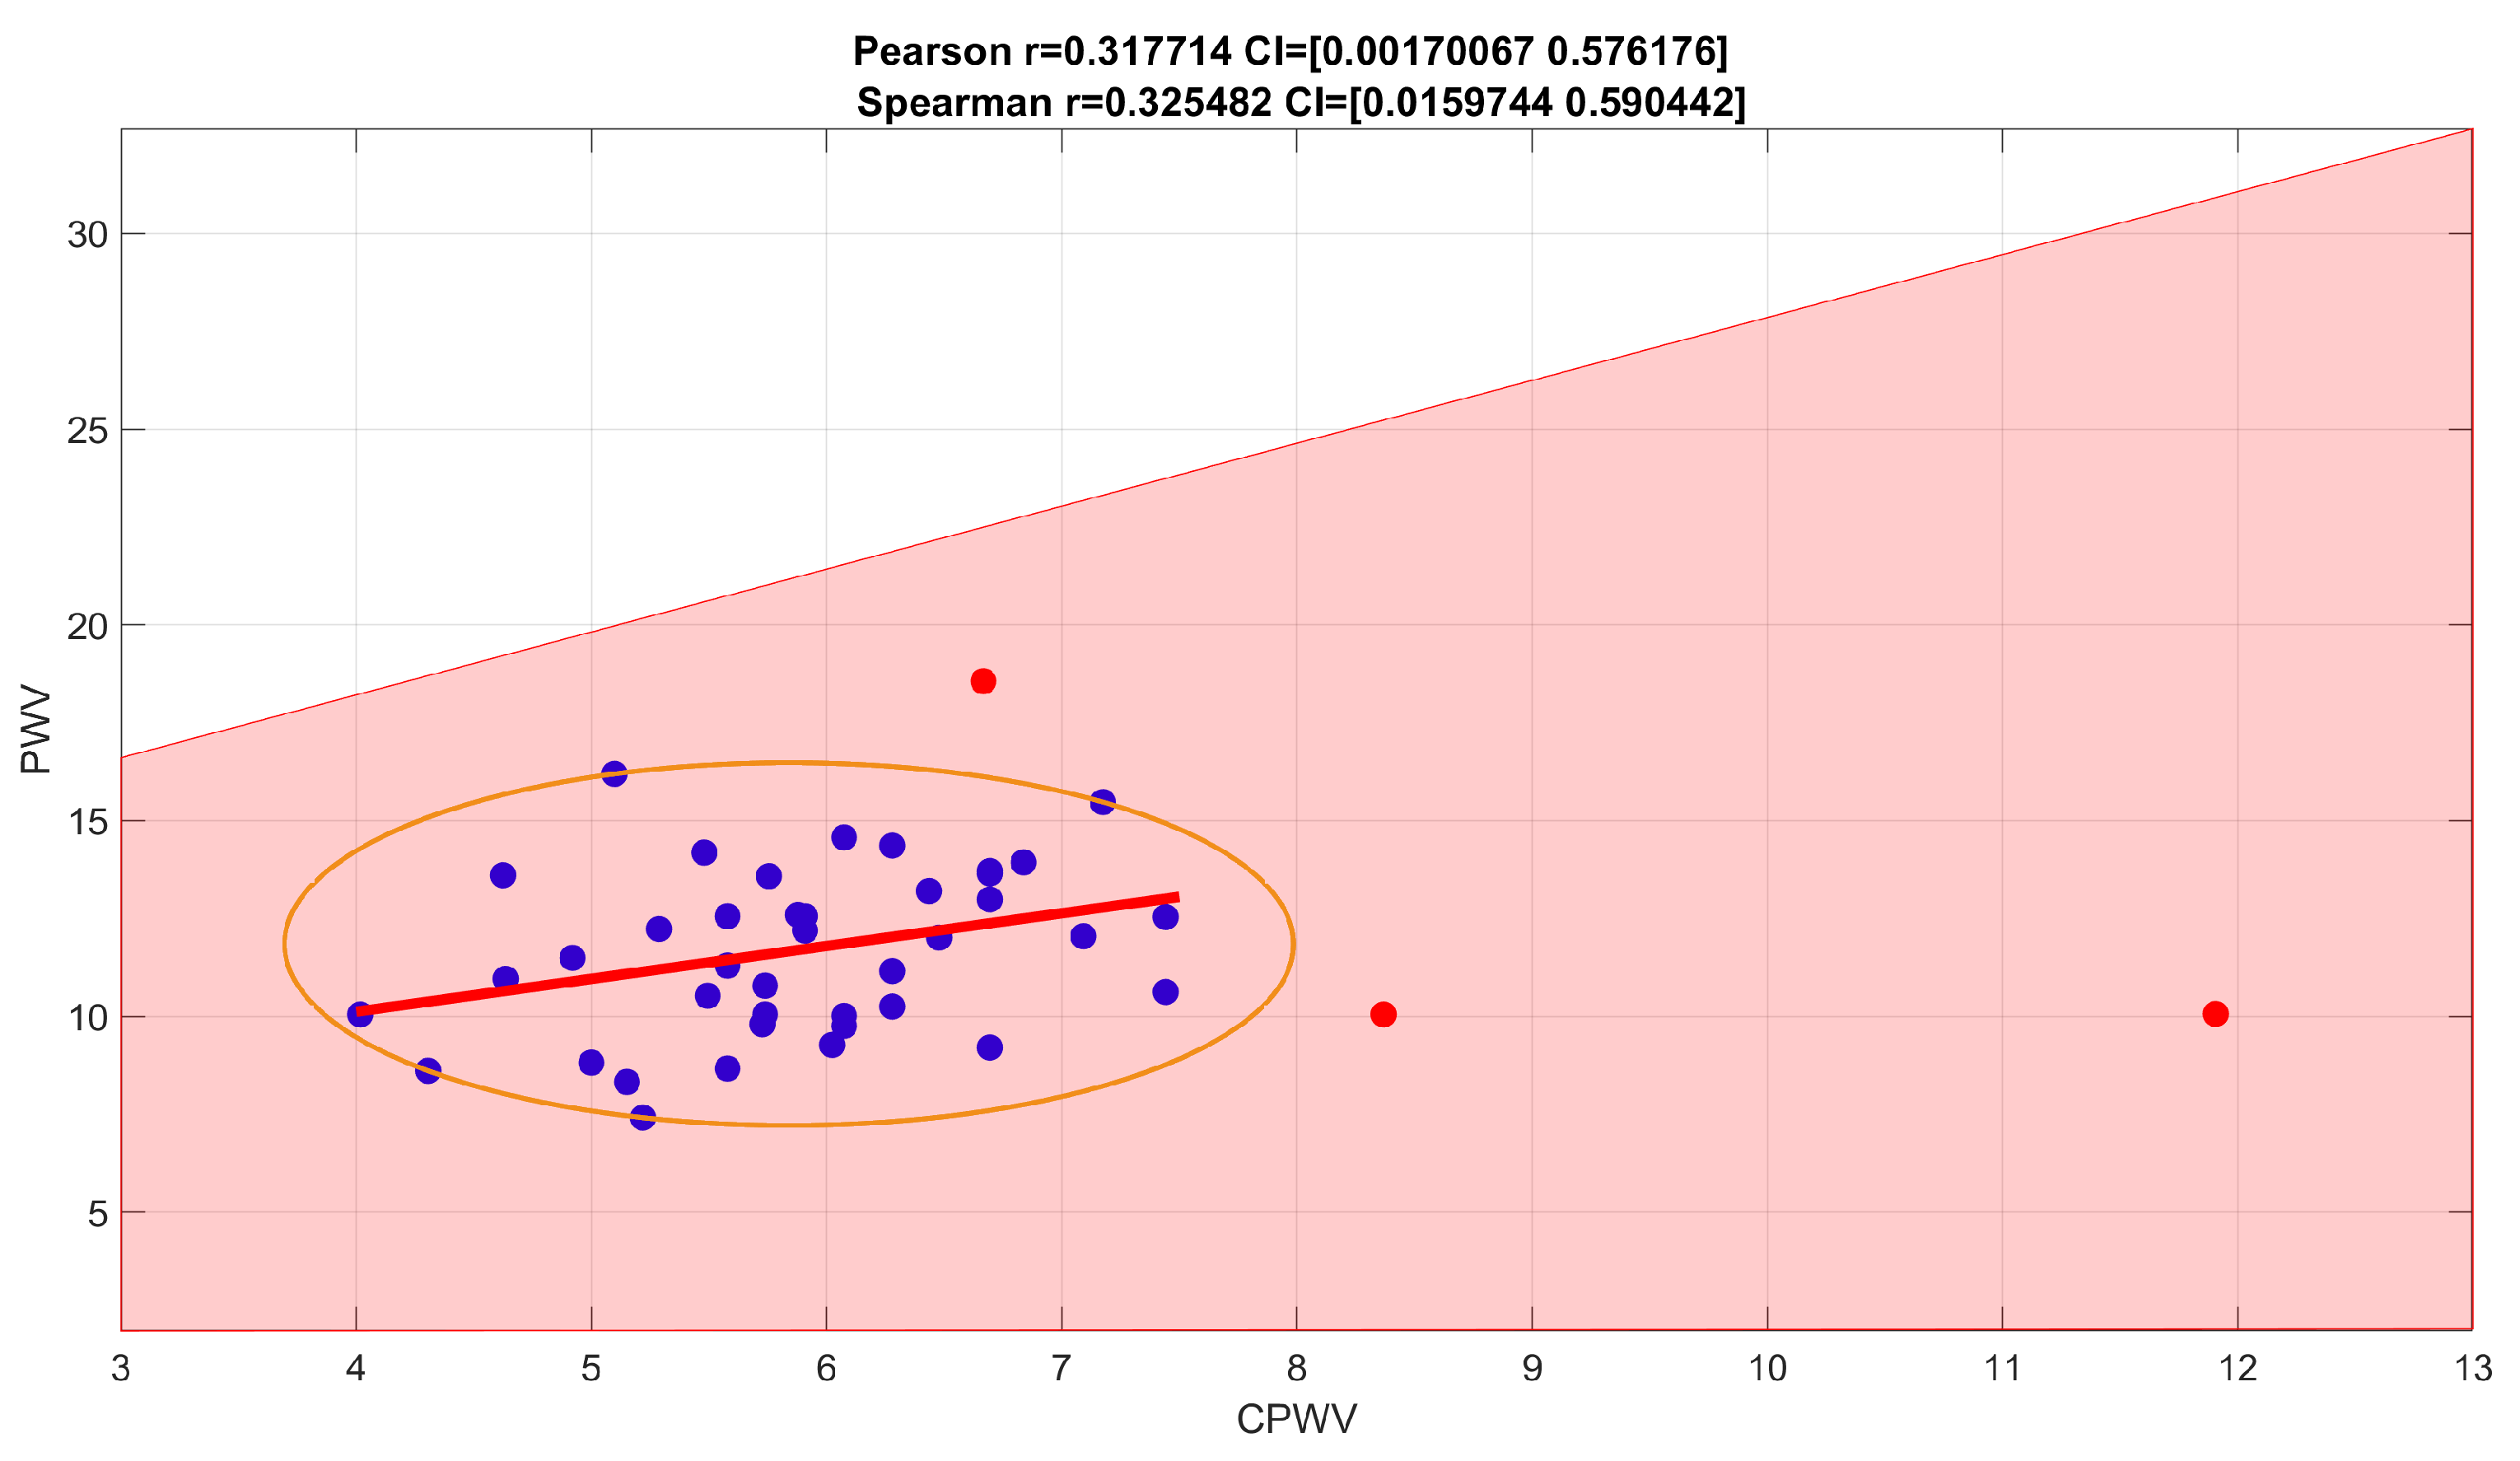
Figure 8.
Spearman correlation coefficient for age and CPWV is 0,0861125, confidence interval (−0.2476970, 425504)
Figure 8.
Spearman correlation coefficient for age and CPWV is 0,0861125, confidence interval (−0.2476970, 425504)
Patients with mild to significant coronary lesions, shown in Figure 11, present with higher PWV values compared to patients with normal coronaries (median values 12 m s−1 and 10 m s−1 accordingly, ). The same pattern but with lower velocities can be observed with CPWV, (median values for patients with coronary disease (6–6.4) m s−1 and 5.3 m s−1 for patients with normal coronaries. The difference of CPWV means is statistically significant with p-value 0.0448, Bayes factor BF10: 288, that there is very weak evidence that means of group 1 with normal coronaries and and other groups with any level of coronary disease are different (Figure 5 ).
Therefore, we propose to use the time interval and the median arm length of the researched patients as a basis for the proposed CPWV estimate (2), and the results for CPWV together with PWV are shown in Figure 11 and in Figure 11.
Figure 9.
PWV and CPWV correlations for male (a) or female (b) gender. Spearman correlation coefficient for male group is 0.3124, confidence interval (−0.0785, 0.6151) – weak (with outliers removed, moderate) correlation. Female (b) gender group is too small to make suggestions.
Figure 9.
PWV and CPWV correlations for male (a) or female (b) gender. Spearman correlation coefficient for male group is 0.3124, confidence interval (−0.0785, 0.6151) – weak (with outliers removed, moderate) correlation. Female (b) gender group is too small to make suggestions.
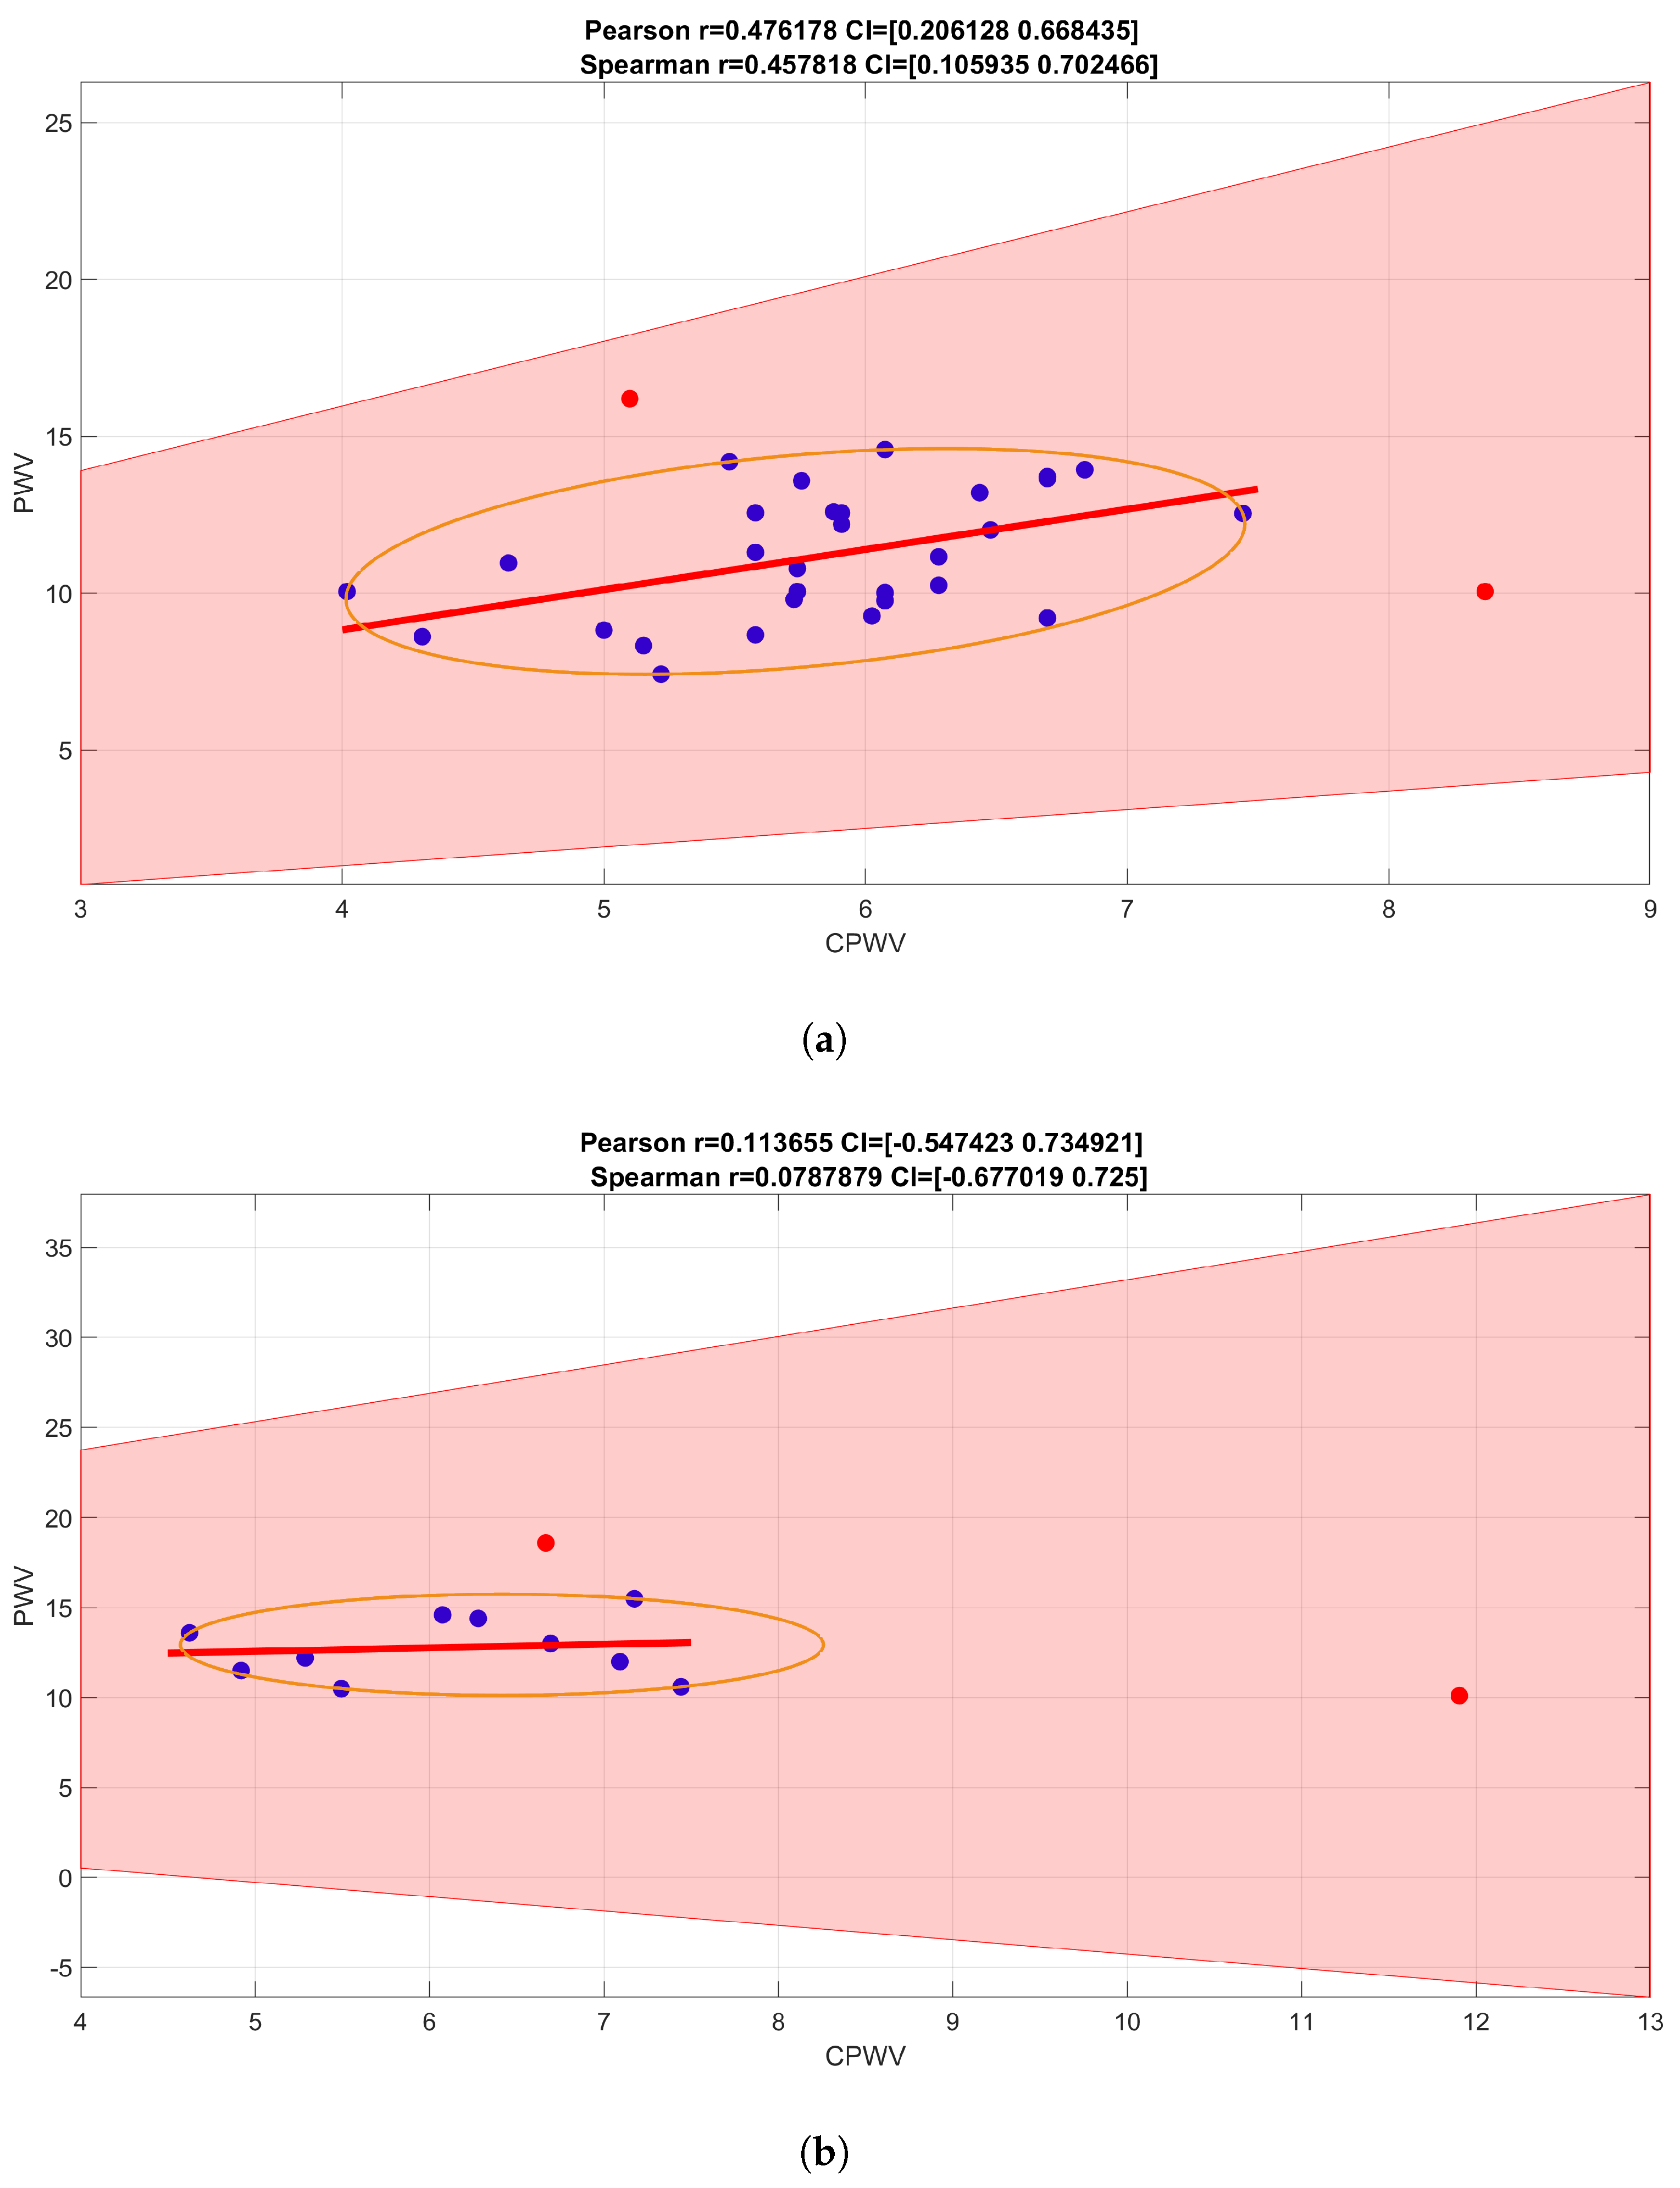
Figure 10.
Spearman correlation coefficient for number of risk factors. For a number of risk factors (0-4 coexistent risks for this patient group) and CPWV correlation coefficient is 0.2688, confidence interval (0.0121, 0.4926) which indicates a weak positive correlation.
Figure 10.
Spearman correlation coefficient for number of risk factors. For a number of risk factors (0-4 coexistent risks for this patient group) and CPWV correlation coefficient is 0.2688, confidence interval (0.0121, 0.4926) which indicates a weak positive correlation.
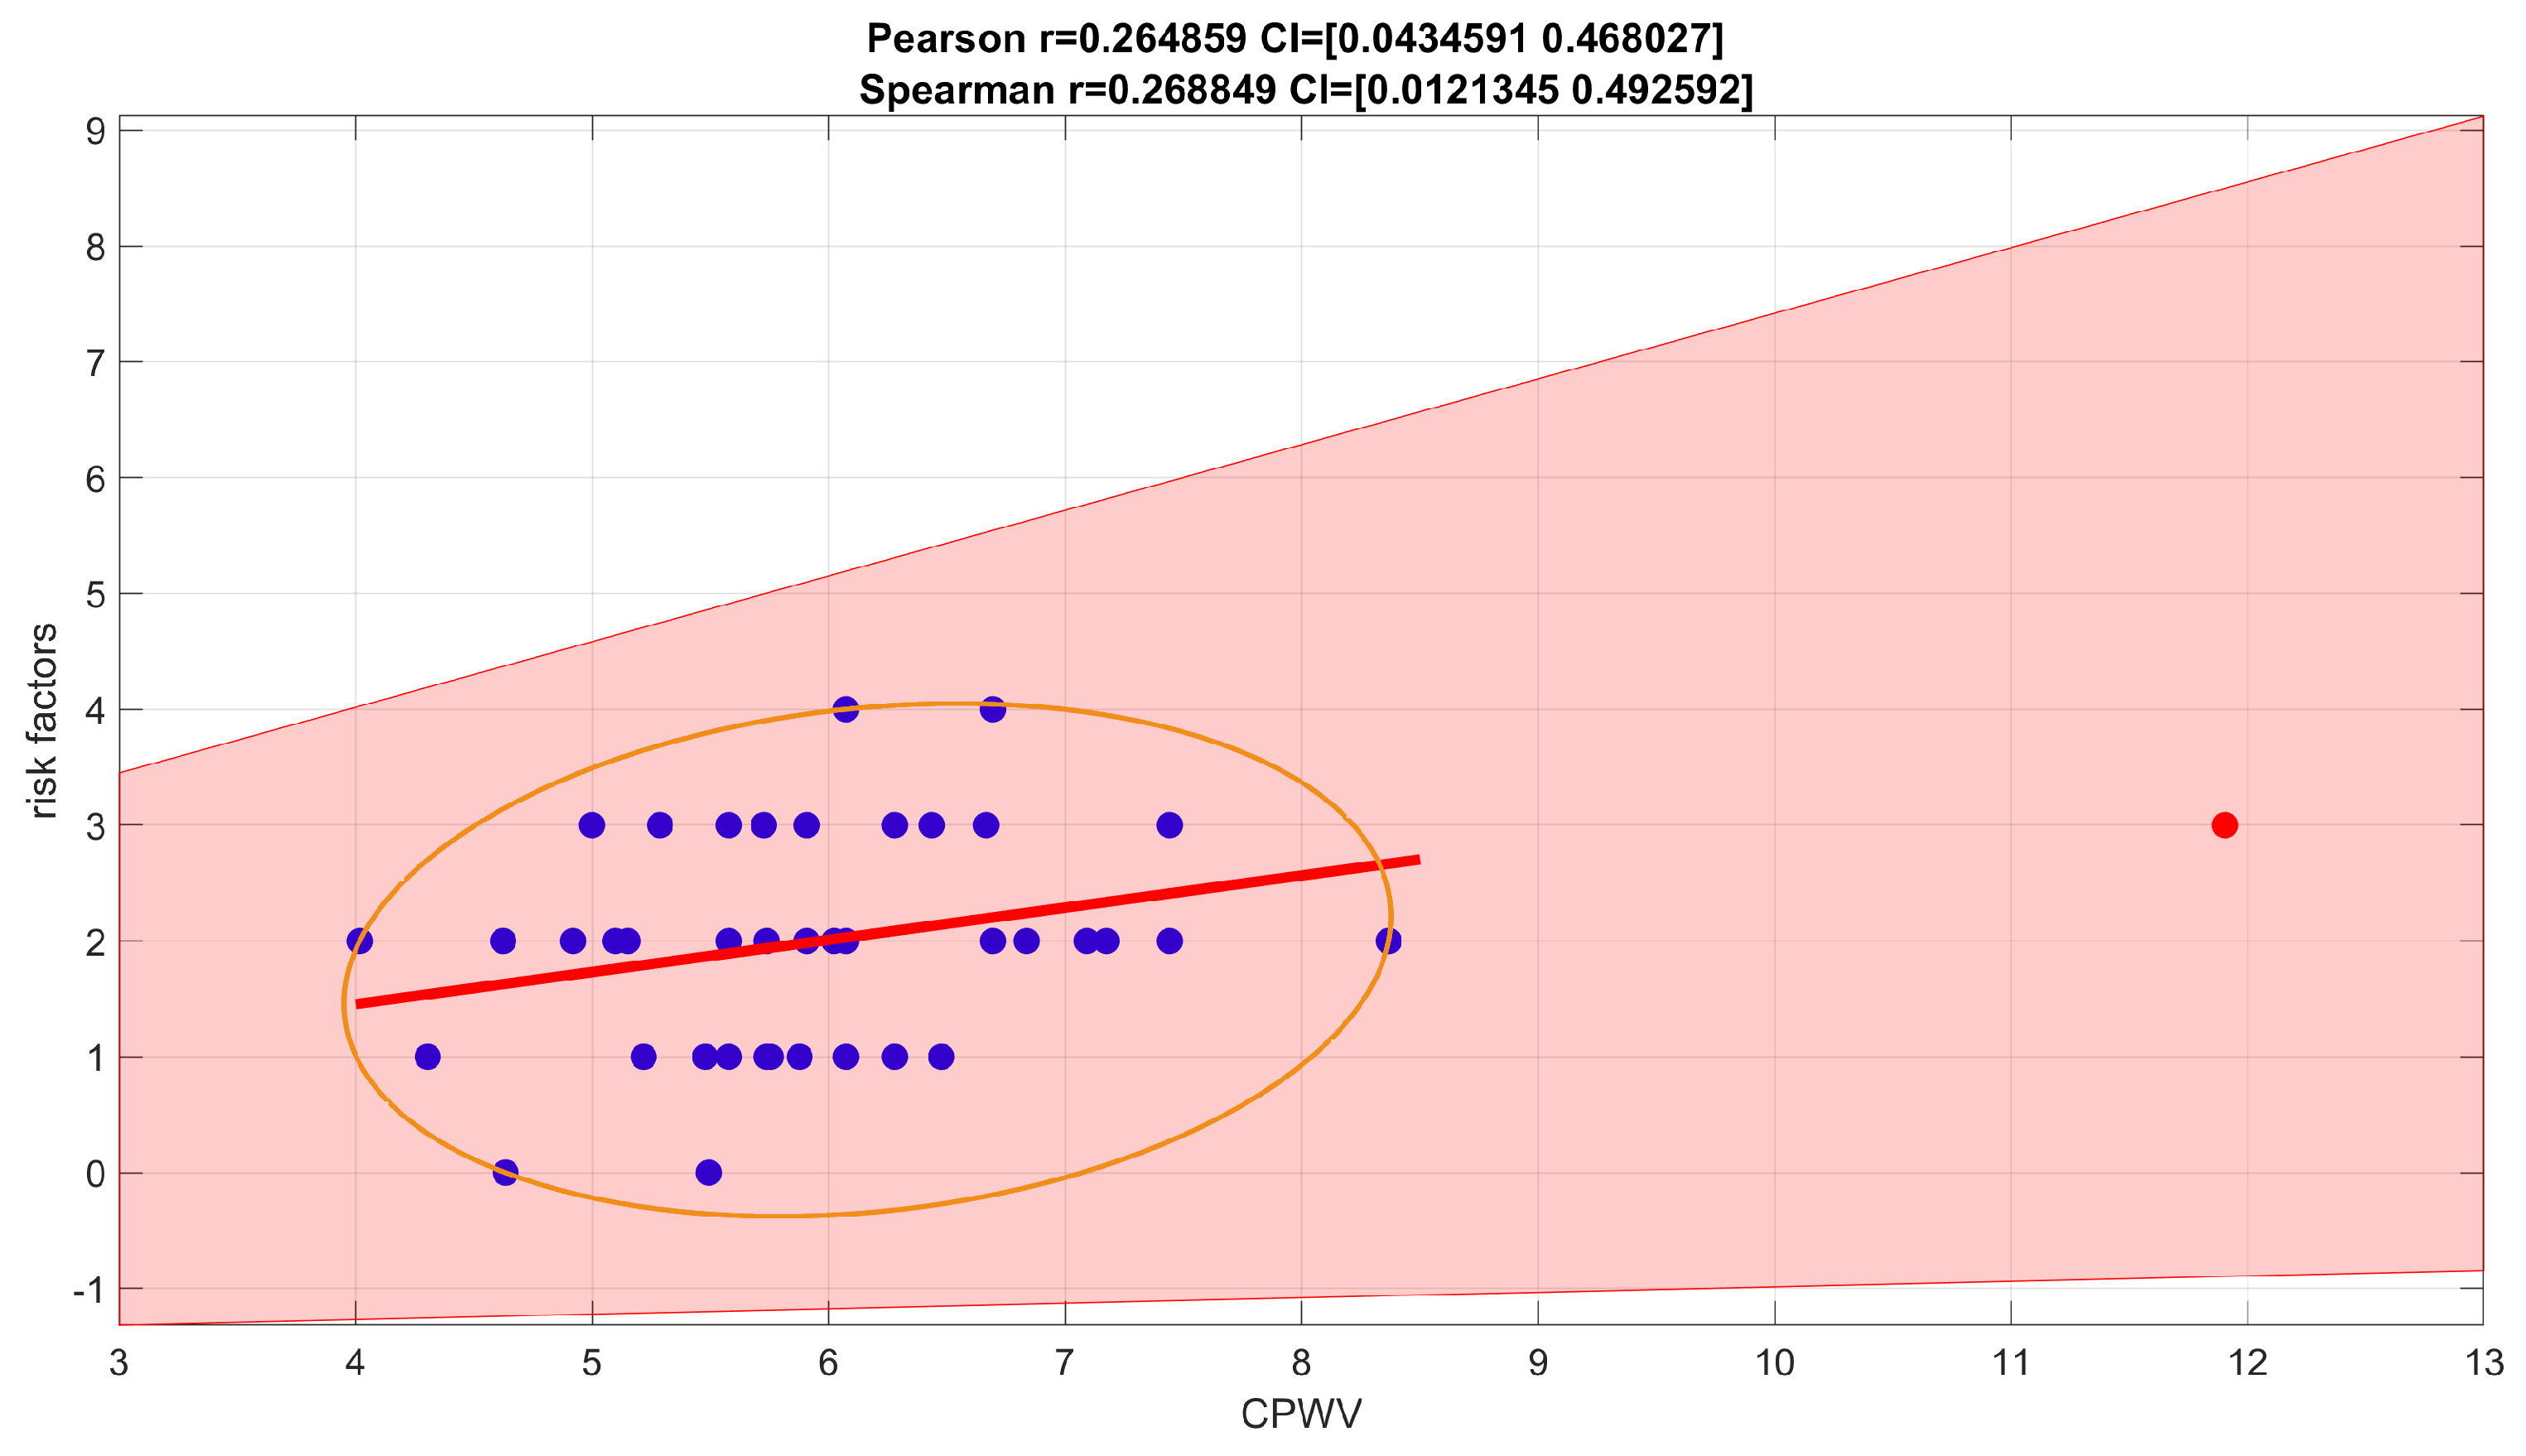
Figure 11.
PWV and CPWV (EBI derived PWV) in different patient groups according to coronary disease. Every line represents one patient. Left dots – PWV calculated from invasive arterial pressure ( PWV rap) and right dots CPWV calculated from EBI curve (PWV ebi); Group 1 – normal coronaries; Group 2 – with coronary stenoses ≤50%; Group 3 – with coronary stenoses (51–75)%, non-revascularization objects, 1-2 vessel disease; Group 4 – with coronary stenoses (51–100)% that are objects of revascularization and three-vessel disease.
4. Discussion
Blood pressure values and its pressure curve characteristics is not a constant value through arterial tree, it becomes modified as it travels away from the heart towards the periphery, whereas the changes between central and peripheral pulse pressure depends not only propagation characteristics of arteries [3,15] but also microvasculature [29,30] and cardiac rate [31]. This back-and forth influences generate circulus vitiosus, also called ‘amplifier hypothesis’ [32]. Understanding physiological mechanisms and the difference between central and peripheral systolic pressure and pulse contour is significant in relating the conventional cuff measurements on the arm to CV function. In order to determine vascular parameters to complement the conventional BP measurement by the cuff sphygmomanometer, various methods of pulse detection have been developed that utilize waveform features for the estimation of arterial elastic properties [3]. Noninvasive assessment of central BP has become widely available and officially recognized in recent years [12]. Although the available techniques have limitations, it has been accepted that they may provide further complementary data to peripheral BP, regarding the management of arterial hypertension and CV risk [14]. In the transmission of blood, arterial BP, ECG and pulse wave signals reflect the different functions of the cardiovascular system and blood flow information [33]. According to the arterial wave propagation theory, the start point and the end point signals of the arterial path are extracted, and PTT can be calculated and used to determine CV functional status, such as BP, arterial stiffness, and arterial compliance [33]. The present study focused on a correlation analysis which was conducted to estimate arterial wave propagation theory by using the EBI method and explore its effectiveness in monitoring vascular tone. Technical aspects of bioimpedance curve calculations are described previously in our work [26], PWV is a gold standard to measure vascular stiffness and estimate cardiovascular risk [21]. Traditionally assessments are made on carotid-femoral axis which is costly, inconvenient for routine ambulatory measurements, and may cause the complications if performed invasively. Additionally, this measurement becomes fused in the presence of lower-extremity arterial disease [34]. For these reasons, we chose aortic valve to arm axis to exclude most of the aorta and lower limb arteries and compared invasive pulse wave measurements with noninvasive ones delivered from EBI recordings. Invasive methods are still considered gold standard, so we used for reference common cardiac catheterization pathway that begins with right distal radial artery and follows the vasculature back to aortic valve. EBI method provides more comfortable cuffless measurement that is more suitable for continuous monitoring, both important factors of patient comfort and activation affecting the overall recovery process [35] and safety [36].
For invasive PWV calculation the true distance could be used as pressure recording catheter is inserted from the distal measurement point and placed just above aortic valve, so the internal catheter length can be defined. For noninvasive calculations we performed EBI measurements on contralateral wrist corresponding to radial artery puncture places and ECG recordings from chest, the distance was calculated as mean invasive distance. We succeeded to demonstrate strong correlations between radial CAP and EBI R-B delays (that can also be defined as PAT). Our method faced multiple technical tasks, as EBI signal is very movement sensitive and needs filtering, direct distance measuring during invasive procedure may not be the most precise, single-channel ECG recorded waves can be poorly detectable for computational analysis and even healthy subjects may not have laterally uniform pulse wave propagation. Some of these problems are discussed in further text.
For signals filtering we used the Savitzky-Golay filter for the signals smoothing and Hankel matrix-based signal decomposer for extracting the cardiac component from the raw signals.
Distance measurement techniques and their accuracy for PWV calculation are at great variability [37]. We chose aortic-arm axis as carotid-femoral axis may be more affected of subject’s height [38] and vessel elongation. For direct measuring we considered possible error ± 2 cm acceptable if otherwise standardized method for measurement is used including catheter distal end placement verification by fluoroscopy. The anatomical differences between arteries of the arms could result in different BP [39], but not PAT [40]. Pitfall of measuring BP or PAT in one arm is missed arterial occlusion or significant stenosis and thereby erroneous reading. This can be easily overcome by first measuring BP on both arms, as suggest guidelines [41] and was done in our study. Not only that every 5 mmHg difference identifies higher cardiovascular risk [42] but over 30 mmHg may indicate subclavian arterial occlusion [43], if in this situation pulsatile radial flow is present and measured, it would be collateral flow, including subclavian steal syndrome through intracranial circulation [44] and measuring PWV may be misleading. Thereby, patients with significant inter-arm pressure should be managed differently and are not subjects of screening methods as PWV measurement.
For distal arterial waveform analysis, we recorded EBI on left wrist as investigation method and for right radial invasive pressure curve for reference, both with ECG recordings. For additional information central pressure curves above aortic valve were recorded. Different arterial and pressure curve characteristic points were identified according to previous authors [3,45,46,47] and named in alphabetical order from B to H, to differentiate our own computational analysis points from classical points as similar practice from other authors [23,45]. In this stage of study, we used these fiducial points only for describing the pressure curves and verifying the EBI curves, the further analysis will be subject of following studies.
Computational analysis of recorded hemodynamic curves bases on automatic recognition of certain points and time intervals of clinical significance of pressure or volume curves. We were able to show correlations between the D, F, and G time points on the pressure and bioimpedance curves and a strong correlation between the RAP and CAP G point. We also could show strong positive correlation between R-B delay of RAP and EBI curves, thereby confirming in our study that the radial invasive pressure curve could be replaced by bioimpedance-based curve measurement to generate noninvasive measurement.
There is considerable heterogeneity of measurement sites and techniques to obtain the waveform for PWV calculations [48]. For defining PAT, we used the most definable and also the most used ECG R peak [49] instead of R onset and volume wave (EBI) curve beginning/onset (EBI-B) as PAT (onset) is preferred over PAT (peak) due to its higher physiological correlation [49]. PAT is not only a good surrogate marker for PTT but contains more information such as the time delay between the electrical depolarization of the left ventricle of the heart and the opening of the aortic valve, known as the pre-ejection period (PEP) [50]. For these reasons we used PTT for invasive PWV calculations and PAT for EBI derived PWV calculations, and to distinguishing proposed the term CPWV for PAT derived noninvasive PWV.
PWV increases normally with age; its mean values are less than 6 m s−1 in the twenties and more than 8 m s−1 in subjects over 60 years old [51]. For increased cardiovascular risk, common threshold values for arterial stiffness are > 10 m s−1 for carotid–femoral PWV and > 14 m s−1 for brachial–ankle PWV [2]. The presence of an isolated PWV >13 m/s is strong predictor of cardiovascular mortality [52]. As PTT is shorter than PAT, the values of CPWV are considerably shorter than PWV values and thereby the new cutoff values for different risk groups are needed.
We could show only moderate difference between CPWV in different groups of patients, one reason may be the absence of a truly healthy group and a relatively homogeneous cardiovascular risk group, since all patients were considered high risk and scheduled for coronarography. Some of the common cardiovascular risk factors were for technical reasons exclusions in our study, like atrial fibrillation, heart failure, aortic valve and aortic diseases. It is also known that vascular atherosclerosis begins with soft plaque formation and positive remodeling far before visual changes appear on coronarography [53] and not all stenoses cause cardiac events, a situation called visual-functional mismatch [54]. For the same reason our 3-rd and 4-th groups start with 51% lesions and are differentiated by operators opininon whether they are objects of revascularization or not. Therefore, more sophisticated methods for intravascular diagnostics, for example, intravascular ultrasound (IVUS) with lipid core detection by near-infrared spectroscopy (NIRS) [55] and FFR with IMR [56] could be used to describe vascular damage and regroup patients. By grouping individuals according to the true stages of atherosclerotics, CPWV and other characteristics of the bioimpedance arterial curve can be more precisely calibrated, which can offer significant value in preventive medicine.
5. Conclusions
Measurement of PAT and calculation of PWV is the first step in analyzing the EBI waveform, with better quality and artifact-free recordings, more time and slope analyses of single waveform and also detection of changes during follow-up. Complementary quantifiable information on the arterial pulse waveform can provide a markedly improved means of non-invasive characterization of CV function and better stratification of CV risk [3] and could lead to innovative clinical applications, developed in collaboration with the medical device industry, and used in various cardiovascular fields, including ambulatory and patient self-management settings, as well as in hospital and acute care environments.
Monitoring peripheral EBI variations is a promising method that has the potential to replace invasive or burdensome techniques for cardiovascular measurements. With regard to wearable devices, the EBI-derived PAT can serve as a substrate to blood pressure calculations or cardiovascular risk assessment, although these data require further confirmation.
However, the study had some limitations. First, the study was conducted in a relatively small number of patients. Second, the control group with normal coronaries can not be defined as reference or healthy group because visual estimation of coronaries can significantly over- and underestimate real vascular pathology. Third, several aspects of data acquisition and signal processing need further refinement. Investigation is needed for optimal placement of the electrodes, more efficient suppression of different measurement artifacts, optimal selection of measurement time points and sequence lengths, to name a few.
Author Contributions
Conceptualization, methodology, investigation, K.L., T.U., A.K, M.Min, M.R. and P.A.; software, A.K.; validation, K.L. and T.U.; formal analysis, K.L, A.K. and G.T.; resources, K.L. and S.M.; data curation, K.L., T.U.; writing—original draft preparation, K.L., T.U., A.K and P.A.; writing—review and editing, M.Mets., G.T. and M.R.; visualization, A.K, K.L. and G.T.; project administration, supervision, K.L., M.Min and S.M; funding acquisition, M.Min, K.L, T.U. and S.M. All authors have read and agreed to the published version of the manuscript.
Funding
This research was funded by Estonian Research Council (ETAG) grant PRG1483 and grant PRG737, by Enterprise Estonia through the Competence Center ELIKO, and by the cooperative initiative LIEEE20036 “Non-Invasive Measurement of the Cardiovascular System in a Clinical Environment” of East Tallinn Central Hospital, Competence Center ELIKO and Tallinn University of Technology.
Institutional Review Board Statement
The studies approved by Estonian Research Ethics Committee of the National Institute for Health Development, study nr 2142, permission nr 395 (03.07.2020), permission review nr 687, 23.03.2021 (change in investigator-in-charge), and nr 869, 07.09.2021 (study protocol change regarding data preservation extension to 10 years and according patient consent). The patients/participants provided their written informed consent to participate in this study.
Informed Consent Statement
Written informed consent was obtained from all participants after a complete explanation of the protocol and possible risks
Data Availability Statement
The datasets generated and/or analyzed during the current study are not publicly available due to protection of personal data.
Acknowledgments
Authors express their gratitude to Dr. med. Marika Tammaru, Science Department of East Tallinn Central Hospital, for her crucial help in statistical analysis, and to Ms. Helje Talivee-Toom for her administrative support.
Conflicts of Interest
The authors declare no conflict of interest. The authors declare that they have no known competing financial interests or personal relationships that could have appeared to influence the work reported in this paper.
Abbreviations
The following abbreviations are used in this manuscript:
| AF | Atrial Fibrillation |
| AP | Arterial Pressure |
| BMI | Body Mass Index |
| BP | Blood Pressure (non-invasive) |
| CABG | Coronary Artery Bypass Grafting |
| CAD | Coronary Artery Disease |
| CAP | Central Aortic Pressure (invasive) |
| CFR | Coronary Flow Reserve |
| COPOD | Copula-Based Outlier Detection |
| CPWV | Complimentary Pulse Wave Velocity |
| CV | Cardiovascular |
| EBI | Electrical Bio-Impedance |
| ECG | Electrocardiogram |
| ED | Ejection Duration |
| FFR | Fractional Flow Reserve |
| IBP | Invasive Blood Pressure |
| IMR | Index of Microvascular Resistance |
| IVUS | Intravascular Ultrasound |
| LDL | Low-Density Lipoprotein (cholesterol) |
| LVEF | Left Ventricular Ejection Fraction |
| MFLI | Multi Frequency Lock-In |
| NIRS | Near-Infrared Spectroscopy |
| NaCl | chemical formula of Sodium chloride |
| PAT | Pulse Arrival Time |
| PCA | Principal Component Analysis |
| PCI | Percutaneous Coronary Intervention |
| PEP | Pre-Ejection Period |
| PPG | Photoplethysmography |
| PTT | Pulse Transit Time |
| PWV | Pulse Wave Velocity |
| RAP | Radial Artery Pressure (invasive) |
| TEVAR | Thoracic Endovascular Aortic Repair |
| eGFR | estimated Glomerular Filtration Rate |
| pyOD | Python Outlier Detection (Python language library) |
References
- Volpe, M.; Gallo, G.; Tocci, G. Is Early and Fast Blood Pressure Control Important in Hypertension Management? International Journal of Cardiology, 254, 328–332. [CrossRef]
- McEvoy, J.W.; McCarthy, C.P.; Bruno, R.M.; Brouwers, S.; Canavan, M.D.; Ceconi, C.; Christodorescu, R.M.; Daskalopoulou, S.S.; Ferro, C.J.; Gerdts, E.; et al. 2024 ESC Guidelines for the Management of Elevated Blood Pressure and Hypertension. European Heart Journal, 45, 3912–4018. [CrossRef]
- Avolio, A.P.; Butlin, M.; Walsh, A. Arterial Blood Pressure Measurement and Pulse Wave Analysis—Their Role in Enhancing Cardiovascular Assessment. Physiological Measurement, 31, R1. [CrossRef]
- Fuchs, F.D.; Whelton, P.K. High Blood Pressure and Cardiovascular Disease. Hypertension, 75, 285–292. [CrossRef]
- Silva, B.V.; Sousa, C.; Caldeira, D.; Abreu, A.; Pinto, F.J. Management of Arterial Hypertension: Challenges and Opportunities. Clinical Cardiology, 45, 1094–1099. [CrossRef]
- Carey, R.M.; Muntner, P.; Bosworth, H.B.; Whelton, P.K. Prevention and Control of Hypertension: JACC Health Promotion Series. Journal of the American College of Cardiology, 72, 1278–1293. [CrossRef]
- GBD 2019 Risk Factors Collaborators. Global Burden of 87 Risk Factors in 204 Countries and Territories, 1990-2019: A Systematic Analysis for the Global Burden of Disease Study 2019. Lancet (London, England), 396, 1223–1249, [33069327]. [CrossRef]
- O’Shea, P.; Griffin, T.; Fitzgibbon, M. Hypertension: The Role of Biochemistry in the Diagnosis and Management. Clinica Chimica Acta, 465, 131–143. [CrossRef]
- Ogedegbe, G.; Pickering, T. Principles and Techniques of Blood Pressure Measurement. Cardiology Clinics, 28, 571–586. [CrossRef]
- Picone, D.S.; Schultz, M.G.; Otahal, P.; Aakhus, S.; Al, J.A.M.; Black, J.A.; Bos, W.J.; Chambers, J.B.; Chen, C.H.; Cheng, H.M.; et al. Accuracy of Cuff-Measured Blood Pressure. Journal of the American College of Cardiology, 70, 572–586. [CrossRef]
- O’Rourke, M.F.; Safar, M.E. Relationship between Aortic Stiffening and Microvascular Disease in Brain and Kidney: Cause and Logic of Therapy. Hypertension (Dallas, Tex.: 1979), 46, 200–204, [15911742]. [CrossRef]
- Avolio, A.P.; Van Bortel, L.M.; Boutouyrie, P.; Cockcroft, J.R.; McEniery, C.M.; Protogerou, A.D.; Roman, M.J.; Safar, M.E.; Segers, P.; Smulyan, H. Role of Pulse Pressure Amplification in Arterial Hypertension: Experts’ Opinion and Review of the Data. Hypertension (Dallas, Tex.: 1979), 54, 375–383, [19564542]. [CrossRef]
- McEniery, C.M.; Cockcroft, J.R.; Roman, M.J.; Franklin, S.S.; Wilkinson, I.B. Central Blood Pressure: Current Evidence and Clinical Importance. European Heart Journal, 35, 1719–1725, [24459197]. [CrossRef]
- Dart, A.M.; Kingwell, B.A. Pulse Pressure—a Review of Mechanisms and Clinical Relevance. Journal of the American College of Cardiology, 37, 975–984. [CrossRef]
- Chirinos, J.A.; Segers, P.; Hughes, T.; Townsend, R. Large-Artery Stiffness in Health and Disease: JACC State-of-the-Art Review. Journal of the American College of Cardiology, 74, 1237–1263, [31466622]. [CrossRef]
- Safar, M.E.; Levy, B.I.; Struijker-Boudier, H. Current Perspectives on Arterial Stiffness and Pulse Pressure in Hypertension and Cardiovascular Diseases. Circulation, 107, 2864–2869. [CrossRef]
- Karunathilake, S.P.; Ganegoda, G.U. Secondary Prevention of Cardiovascular Diseases and Application of Technology for Early Diagnosis. BioMed Research International, 2018, 5767864, [29854766]. [CrossRef]
- Javaid, A.; Zghyer, F.; Kim, C.; Spaulding, E.M.; Isakadze, N.; Ding, J.; Kargillis, D.; Gao, Y.; Rahman, F.; Brown, D.E.; et al. Medicine 2032: The Future of Cardiovascular Disease Prevention with Machine Learning and Digital Health Technology. American Journal of Preventive Cardiology, 12, 100379, [36090536]. [CrossRef]
- Williams, G.J.; Al-Baraikan, A.; Rademakers, F.E.; Ciravegna, F.; van de Vosse, F.N.; Lawrie, A.; Rothman, A.; Ashley, E.A.; Wilkins, M.R.; Lawford, P.V.; et al. Wearable Technology and the Cardiovascular System: The Future of Patient Assessment. The Lancet. Digital Health, 5, e467–e476, [37391266]. [CrossRef]
- Park, J.B.; Sharman, J.E.; Li, Y.; Munakata, M.; Shirai, K.; Chen, C.H.; Jae, S.Y.; Tomiyama, H.; Kosuge, H.; Bruno, R.M.; et al. Expert Consensus on the Clinical Use of Pulse Wave Velocity in Asia. Pulse (Basel, Switzerland), 10, 1–18, [36660436]. [CrossRef]
- Van Bortel, L.M.; Laurent, S.; Boutouyrie, P.; Chowienczyk, P.; Cruickshank, J.K.; De Backer, T.; Filipovsky, J.; Huybrechts, S.; Mattace-Raso, F.U.S.; Protogerou, A.D.; et al. Expert Consensus Document on the Measurement of Aortic Stiffness in Daily Practice Using Carotid-Femoral Pulse Wave Velocity. Journal of Hypertension, 30, 445–448, [22278144]. [CrossRef]
- Spronck, B.; Terentes-Printzios, D.; Avolio, A.P.; Boutouyrie, P.; Guala, A.; Jerončić, A.; Laurent, S.; Barbosa, E.C.; Baulmann, J.; Chen, C.H.; et al. 2024 Recommendations for Validation of Noninvasive Arterial Pulse Wave Velocity Measurement Devices. Hypertension, 81, 183–192. [CrossRef]
- Sel, K.; Mohammadi, A.; Pettigrew, R.I.; Jafari, R. Physics-Informed Neural Networks for Modeling Physiological Time Series for Cuffless Blood Pressure Estimation. NPJ digital medicine, 6, 110, [37296218]. [CrossRef]
- Mansouri, S.; Alharbi, Y.; Alshrouf, A.; Alqahtani, A. Cardiovascular Diseases Diagnosis by Impedance Cardiography. Journal of Electrical Bioimpedance, 13, 88–95, [36694881]. [CrossRef]
- Mansouri, S. Determination of Arterial Compliance Using Electrical Peripheral Bioimpedance. IEEJ Transactions on Electrical and Electronic Engineering, 18, 436–441. [CrossRef]
- Krivošei, A.; Min, M.; Annus, P.; Märtens, O.; Metshein, M.; Lotamõis, K.; Rist, M. Hankel Matrix Based Algorithm for Cardiac Pulse Wave Base and Peak Lines Correction. In Proceedings of the 2022 IEEE International Symposium on Medical Measurements and Applications (MeMeA), 2022, pp. 1–6. [CrossRef]
- Zhao, Y.; Nasrullah, Z.; Li, Z. PyOD: A Python Toolbox for Scalable Outlier Detection, [1901.01588].
- Li, Z.; Zhao, Y.; Botta, N.; Ionescu, C.; Hu, X. COPOD: Copula-Based Outlier Detection. In Proceedings of the 2020 IEEE International Conference on Data Mining (ICDM), 2020, pp. 1118–1123. [CrossRef]
- Lona, G.; Hauser, C.; Köchli, S.; Infanger, D.; Endes, K.; Faude, O.; Hanssen, H. Blood Pressure Increase and Microvascular Dysfunction Accelerate Arterial Stiffening in Children: Modulation by Physical Activity. Frontiers in Physiology, 11, 613003, [33391029]. [CrossRef]
- Rizzoni, D.; Agabiti-Rosei, C. Relationships between Blood Pressure Variability and Indices of Large Artery Stiffness: Does the Microvasculature Play a Role? Hypertension Research, 40, 348–350. [CrossRef]
- Lantelme, P.; Mestre, C.; Lievre, M.; Gressard, A.; Milon, H. Heart Rate. Hypertension, 39, 1083–1087. [CrossRef]
- Izzard, A.S.; Heagerty, A.M.; Leenen, F.H.H. The Amplifier Hypothesis: Permission to Dissent? Journal of Hypertension, 17, 1667.
- Liang, Y.; Abbott, D.; Howard, N.; Lim, K.; Ward, R.; Elgendi, M. How Effective Is Pulse Arrival Time for Evaluating Blood Pressure? Challenges and Recommendations from a Study Using the MIMIC Database. Journal of Clinical Medicine, 8, 337. [CrossRef]
- Kamieńska, A.; Danieluk, A.; Niwińska, M.M.; Chlabicz, S. Arterial Stiffness and Ankle-Brachial Index - Cross-Sectional Study of 259 Primary Care Patients ge50 Year-Old. Medical Science Monitor: International Medical Journal of Experimental and Clinical Research, 30, e942718, [38317385]. [CrossRef]
- Lee, M.; Defall, B.; John, A. Enhanced Patient Comfort: A Wireless Monitoring System.
- Pavithra L S.; Sheen Khurdi.; Priyanka T. G.; Patrisia Mary S. Impact of Remote Patient Monitoring Systems on Nursing Time, Healthcare Providers, and Patient Satisfaction in General Wards. 16. [CrossRef]
- Weir-McCall, J.R.; Brown, L.; Summersgill, J.; Talarczyk, P.; Bonnici-Mallia, M.; Chin, S.C.; Khan, F.; Struthers, A.D.; Sullivan, F.; Colhoun, H.M.; et al. Development and Validation of a Path Length Calculation for Carotid–Femoral Pulse Wave Velocity Measurement. Hypertension, 71, 937–945. [CrossRef]
- Muñoz-Torrero, J.F.S.; Calderón-García, J.F.; Nicolás-Jiménez, J.M.D.; García-Ortiz, L.; Rodilla-Salas, E.; Gómez-Marcos, M.A.; Suárez-Fernandez, C.; Cordovilla-Guardia, S.; Rico-Martín, S. Automatic or Manual Arterial Path for the Ankle-Brachial Differences Pulse Wave Velocity. PLOS ONE, 13, e0206434. [CrossRef]
- Fred, H.L. Accurate Blood Pressure Measurements and the Other Arm. Texas Heart Institute Journal, 40, 217–219, [23914007].
- Kortekaas, M.C.; Niehof, S.P.; van Velzen, M.H.N.; Galvin, E.M.; Stolker, R.J.; Huygen, F.J.P.M. Comparison of Bilateral Pulse Arrival Time before and after Induced Vasodilation by Axillary Block. Physiological Measurement, 33, 1993. [CrossRef]
- Mazzolai, L.; Teixido-Tura, G.; Lanzi, S.; Boc, V.; Bossone, E.; Brodmann, M.; Bura-Rivière, A.; De Backer, J.; Deglise, S.; Della Corte, A.; et al. 2024 ESC Guidelines for the Management of Peripheral Arterial and Aortic Diseases. European Heart Journal, 45, 3538–3700. [CrossRef]
- Sharafi, M.; Amiri, Z.; Haghjoo, E.; Afrashteh, S.; Dastmanesh, S.; Moghaddam, M.T.; Dehghan, A.; Tabibzadeh, H.A.S.; Mouseli, A. Association between Inter-Arm Blood Pressure Difference and Cardiovascular Disease: Result from Baseline Fasa Adults Cohort Study. Scientific Reports, 13, 9648. [CrossRef]
- Vanreusel, I.; De Wolf, D.; Van der Zijden, T.; Van Berendoncks, A. Interarm Blood Pressure Difference Revealing a Right-Sided Aortic Arch and Occluded Aberrant Left Subclavian Artery. JACC: Case Reports, 29, 102246. [CrossRef]
- Shankar Kikkeri, N.; Nagalli, S. Subclavian Steal Syndrome. In StatPearls; StatPearls Publishing; [32119486].
- Vennin, S.; Mayer, A.; Li, Y.; Fok, H.; Clapp, B.; Alastruey, J.; Chowienczyk, P. Noninvasive Calculation of the Aortic Blood Pressure Waveform from the Flow Velocity Waveform: A Proof of Concept. American Journal of Physiology-Heart and Circulatory Physiology, 309, H969–H976. [CrossRef]
- Kim, H.L.; Seo, J.B.; Chung, W.Y.; Kim, S.H.; Kim, M.A.; Zo, J.H. Association Between Invasively Measured Central Aortic Pressure and Left Ventricular Diastolic Function in Patients Undergoing Coronary Angiography. American Journal of Hypertension, 28, 393–400. [CrossRef]
- Nichols, W.W.; O’Rourke, M.; Vlachopoulos, C.; Edelman, E.R. McDonald’s Blood Flow in Arteries: Theoretical, Experimental and Clinical Principles, 7 ed.; CRC Press. [CrossRef]
- Pereira, T.; Correia, C.; Cardoso, J. Novel Methods for Pulse Wave Velocity Measurement. Journal of Medical and Biological Engineering, 35, 555–565, [26500469]. [CrossRef]
- Deshmukh, C.A.; Jindal, G.D.; Bagal, U.R.; Nagare, G.D. Pulse Arrival Time: Measurement and Clinical Applications. MGM Journal of Medical Sciences, 9, 103. [CrossRef]
- Finnegan, E.; Davidson, S.; Harford, M.; Jorge, J.; Watkinson, P.; Young, D.; Tarassenko, L.; Villarroel, M. Pulse Arrival Time as a Surrogate of Blood Pressure. Scientific Reports, 11, 22767, [34815419]. [CrossRef]
- Díaz, A.; Galli, C.; Tringler, M.; Ramírez, A.; Cabrera Fischer, E.I. Reference Values of Pulse Wave Velocity in Healthy People from an Urban and Rural Argentinean Population. International Journal of Hypertension, 2014, 653239. [CrossRef]
- Blacher, J.; Asmar, R.; Djane, S.; London, G.M.; Safar, M.E. Aortic Pulse Wave Velocity as a Marker of Cardiovascular Risk in Hypertensive Patients. Hypertension, 33, 1111–1117. [CrossRef]
- Naghavi, M.; Libby, P.; Falk, E.; Casscells, S.W.; Litovsky, S.; Rumberger, J.; Badimon, J.J.; Stefanadis, C.; Moreno, P.; Pasterkamp, G.; et al. From Vulnerable Plaque to Vulnerable Patient. Circulation, 108, 1664–1672. [CrossRef]
- Park, S.J.; Kang, S.J.; Ahn, J.M.; Shim, E.B.; Kim, Y.T.; Yun, S.C.; Song, H.; Lee, J.Y.; Kim, W.J.; Park, D.W.; et al. Visual-Functional Mismatch Between Coronary Angiography and Fractional Flow Reserve. JACC: Cardiovascular Interventions, 5, 1029–1036. [CrossRef]
- Brugaletta, S.; Garcia-Garcia, H.M.; Serruys, P.W.; de Boer, S.; Ligthart, J.; Gomez-Lara, J.; Witberg, K.; Diletti, R.; Wykrzykowska, J.; van Geuns, R.J.; et al. NIRS and IVUS for Characterization of Atherosclerosis in Patients Undergoing Coronary Angiography. JACC: Cardiovascular Imaging, 4, 647–655. [CrossRef]
- Lee, J.M.; Jung, J.H.; Hwang, D.; Park, J.; Fan, Y.; Na, S.H.; Doh, J.H.; Nam, C.W.; Shin, E.S.; Koo, B.K. Coronary Flow Reserve and Microcirculatory Resistance in Patients With Intermediate Coronary Stenosis. JACC, 67, 1158–1169. [CrossRef]
Figure 1.
Electrodes placing and measuring points in cath lab. IBP – invasive (arterial) blood pressure; IBP measuring points: b1- distal radial, b2 - proximal radial/brachial (not discussed in the paper), b3 - central supravalvular; ECG – electrocardiogram; ECG measure points: c - points of registration; EBI – Electrical bioimpedance; EBI measure points: a - registration points; d - position of cuff for BP measurement.
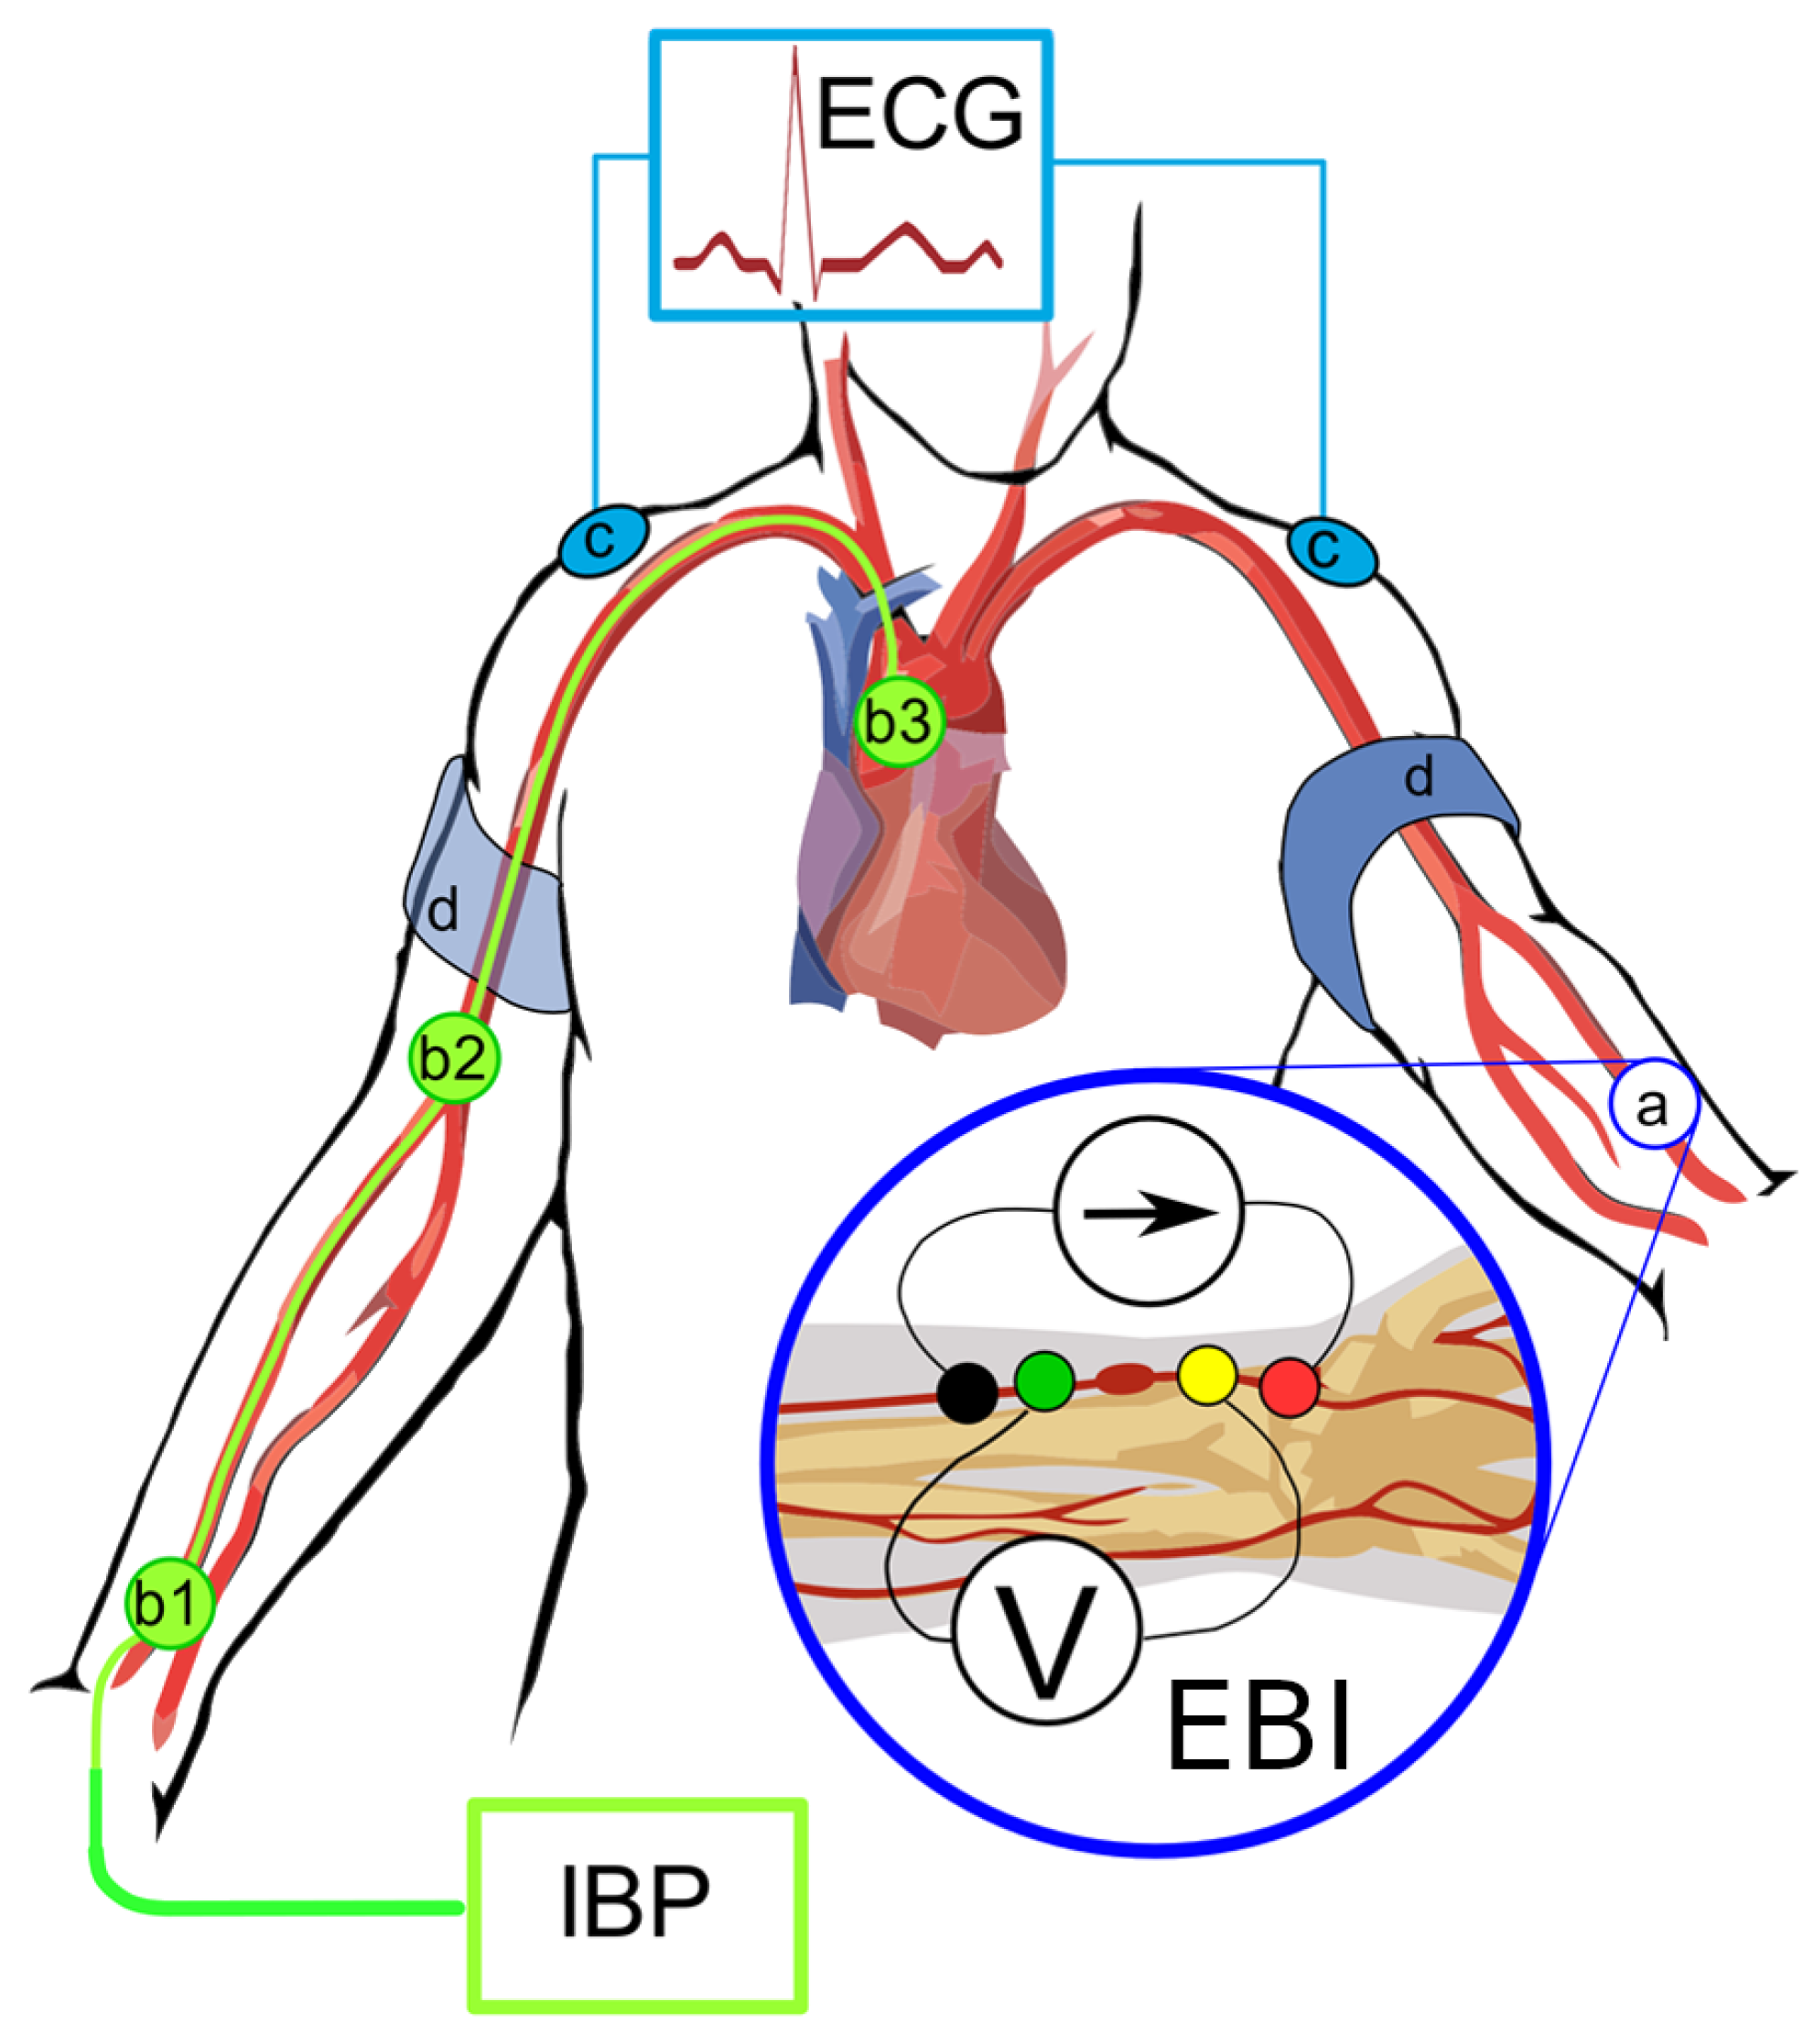
Figure 2.
Illustrative CAP and EBI/RAP typical curves with fiducial points. CAP – central arterial pressure curve; B – start of curve, D – inflection point, D-E – inflection curve, F – pressure maximum, G – end systolic pressure / dicrotic notch / closure of aortic valve. EBI – electrical bioimpedance curve and RAP – radial artery pressure; B – start of curve / systole, C – 50% time of upstroke, D – pressure maximum, E-F – inflection curve, F – inflection point, G – dicrotic notch; Time intervals: – inflection time, indicating the time () between the onset of the distally traveling (forward ejected) wave and the arrival of the proximally traveling (backward reflected) wave, – systolic upstroke time, – time to end-systole, () inflection time, – systolic duration of the reflected aortic pressure wave, – ejection duration.
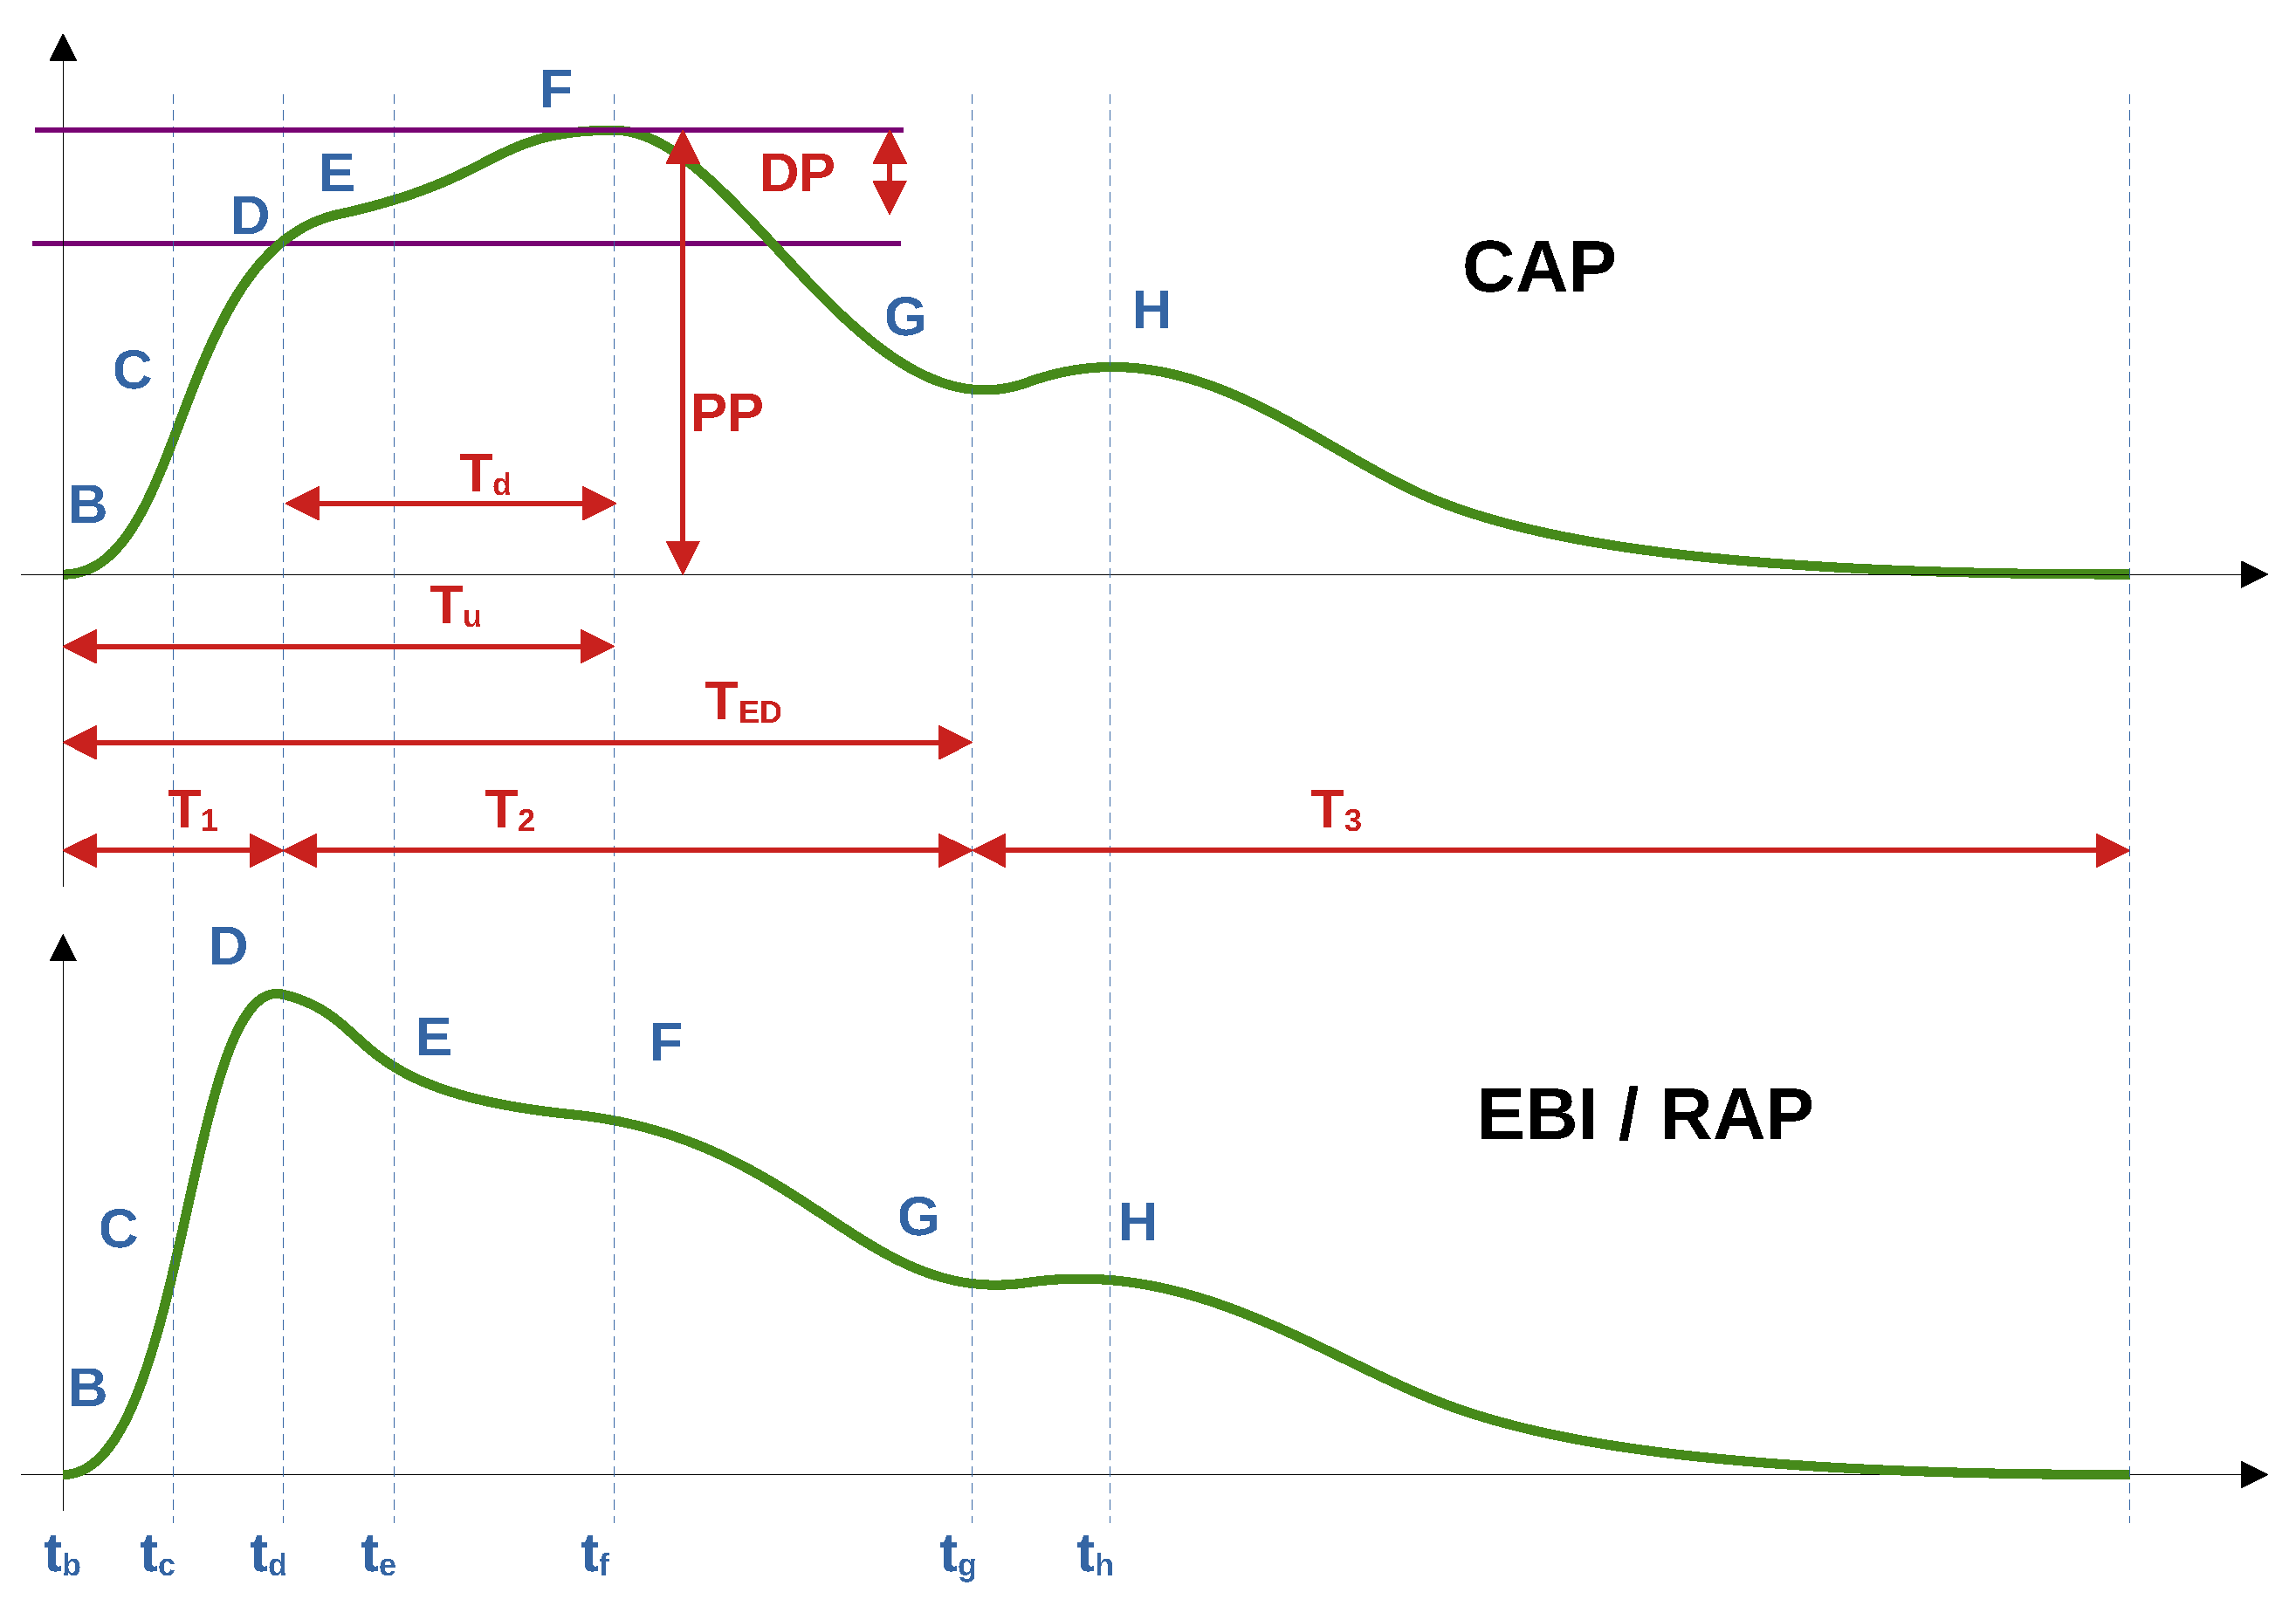
Figure 4.
Scatterplots between time points on radial and central pressures and bioimpedance curves. Corresponding Spearman correlation values are shown in Table 2; High positive correlation is shown between rap and cap G times. rap – radial artery pressure, cap – central aortic pressure, ebi – electrical bioimpedance time points as follows: D – EBI pressure max/Aortic inflection point, F – aortic pressure maximum, G – end-systole.
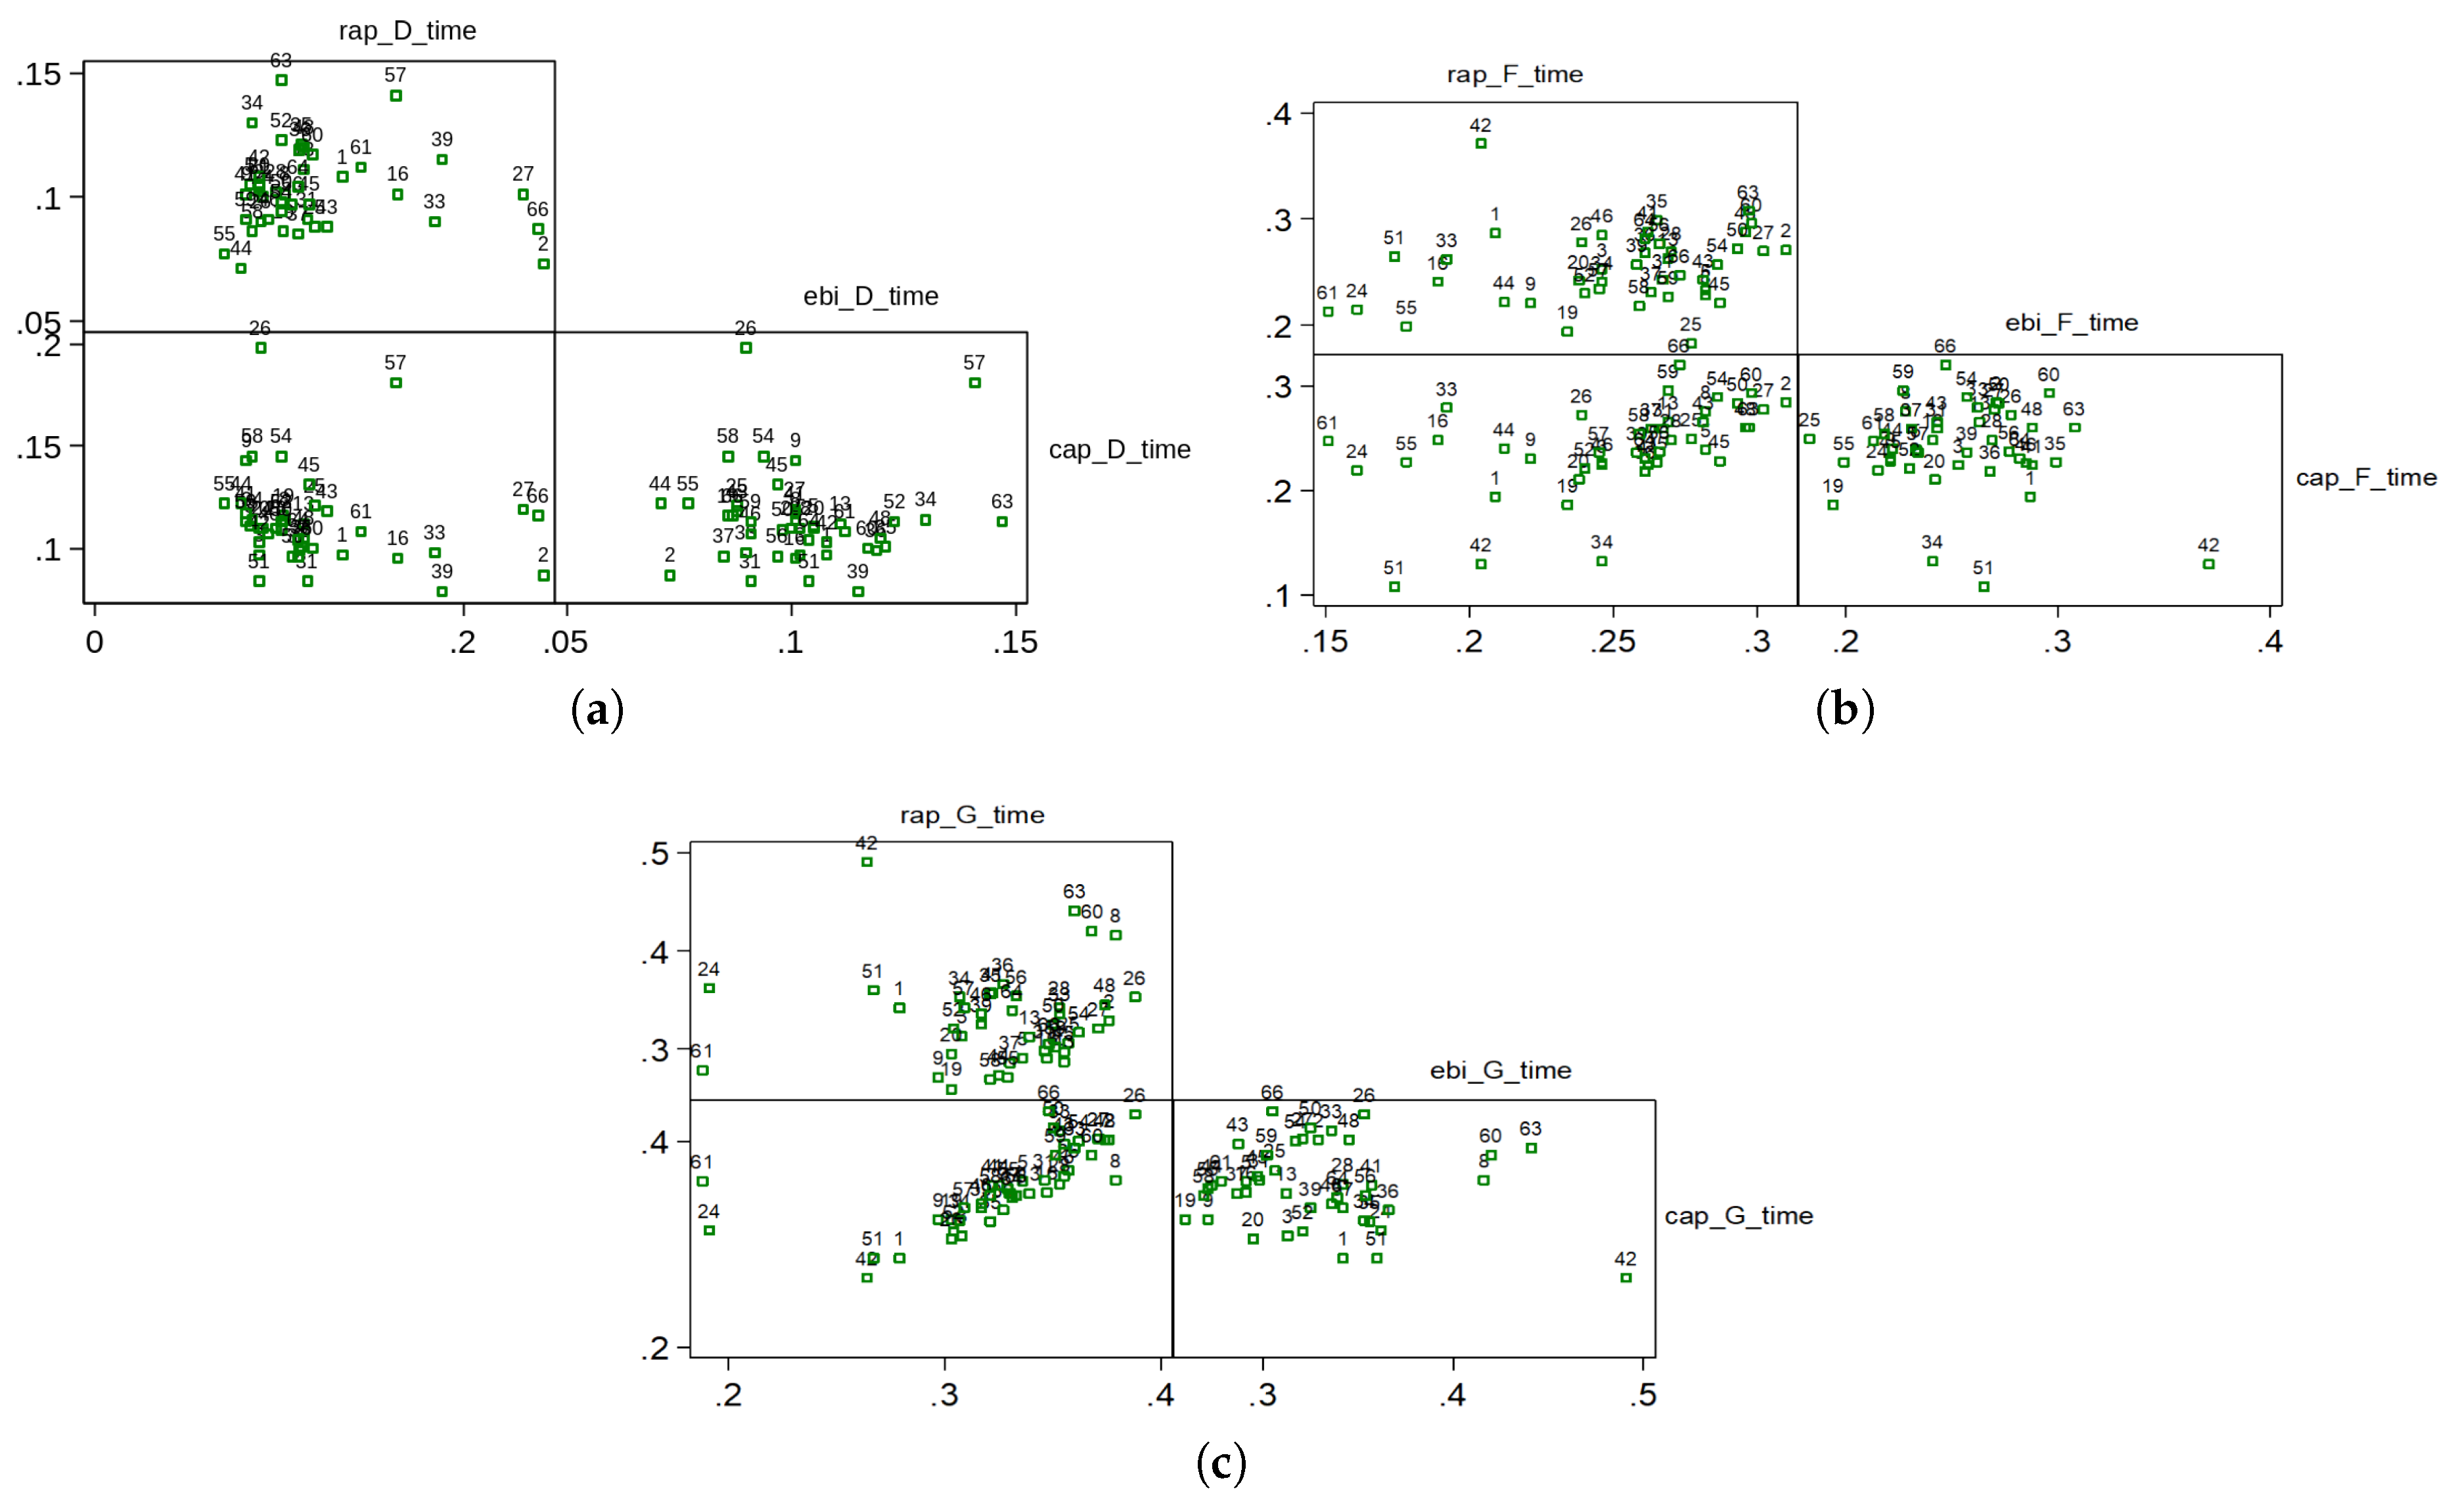

Table 1.
Demographic and clinical data of the patients. Total number of studied patients is 44 with mean age 61 years and median age 63 years. Risk factors: body mass index (BMI) greater than 35, diabetes mellitus, hypertension, dyslipidemia without medical treatment, current or previous smoking, vascular disease in locations other than the coronary arteries. Notes: (1) – not revascularization objects, (2) – revascularization objects, CAD – coronary artery disease.
| Number | % | |
|---|---|---|
| Gender: | ||
| male | 32 | 72,7 |
| female | 12 | 27,3 |
| Age: | ||
| 45-54 | 11 | 25,0 |
| 55-64 | 15 | 34,1 |
| 65-74 | 18 | 40,9 |
| Risk factors: | ||
| hypertension | 41 | 93,2 |
| dyslipidemia with NO treatment | 8 | 18,2 |
| BMI | 4 | 9,1 |
| current/former smoking | 27 | 61,4 |
| diabetes | 8 | 18,2 |
| vascular pathology | 4 | 9,1 |
| Risks levels: | ||
| 0 risk factors | 2 | 4,5 |
| 1 risk factor | 10 | 22,7 |
| 2 risk factors | 19 | 43,2 |
| 3 risk factors | 11 | 25,0 |
| 4 risk factors | 2 | 4,5 |
| 5 risk factors | 0 | 0,0 |
| 6 risk factors | 0 | 0,0 |
| CAD stages: | ||
| 1 – normal coronaries | 5 | 11,4 |
| 2 – minimal/moderate (≤50%) decrease in vessel diameter | 6 | 13,6 |
| 3 – medium (51–75)% decrease in vessel diameter1 | 6 | 13,6 |
| 4 – significant (51–100)% decrease in vessel diameter2 | 27 | 61,4 |
Table 2.
Spearman correlations between selected time points on radial and central pressures and bioimpedance curves.
Table 2.
Spearman correlations between selected time points on radial and central pressures and bioimpedance curves.
| rap_d_time | ebi_d_time | |
|---|---|---|
| rap_d_time | ||
| ebi_d_time | 0,078 | |
| cap_d_time | -0,3128 | -0,2191 |
| rap_f_time | ebi_f_time | |
| rap_f_time | ||
| ebi_f_time | 0,3002 | |
| cap_f_time | 0,6249 | 0,0701 |
| rap_g_time | ebi_g_time | |
| rap_g_time | ||
| ebi_g_time | 0,10223 | |
| cap_g_time | 0,8587 | 0,0981 |
Disclaimer/Publisher’s Note: The statements, opinions and data contained in all publications are solely those of the individual author(s) and contributor(s) and not of MDPI and/or the editor(s). MDPI and/or the editor(s) disclaim responsibility for any injury to people or property resulting from any ideas, methods, instructions or products referred to in the content. |
© 2025 by the authors. Licensee MDPI, Basel, Switzerland. This article is an open access article distributed under the terms and conditions of the Creative Commons Attribution (CC BY) license (http://creativecommons.org/licenses/by/4.0/).
Copyright: This open access article is published under a Creative Commons CC BY 4.0 license, which permit the free download, distribution, and reuse, provided that the author and preprint are cited in any reuse.


