
Submitted:
28 August 2025
Posted:
01 September 2025
You are already at the latest version
Abstract
To reduce emissions in the existing transportation system and lower CO2 output, battery electric vehicles (BEVs) offer a promising approach due to their higher energy efficiency. However, their driving range still falls short compared to conventional vehicles. Optimizing the heating, ventilation, and air conditioning (HVAC) system helps to save energy and improve passenger comfort. This work investigates an advanced thermal management system for an electric truck cabin, equipped with heat panels and additional insulation. First, a 1D model of the thermal management system was developed to investigate and properly size the thermal measures. The simulations enabled initial sizing and provided a first evaluation of the concept truck cabin. Subsequently, the prototype truck cabin was tested in different configurations and under varying ambient conditions in a climatic chamber and laboratory. Using the experimental data, the 1D model was optimized and validated, making it possible to simulate real-world scenarios. In the future, further research and new approaches will be necessary to identify even more efficient subsystems and cost-effective solutions.
Keywords:
electric vehicle
; truck
; cabin
; air conditioning
; insulation
; heat panel
; 1D model
; Dymola
; validation
; measurement
1. Introduction
The electrification of the transport system helps achieve zero local emissions and contributes to the reduction of global CO2 emissions, which are currently very high on busy roads around the world [1]. This transition is also required by the European Union as part of the Green Deal [2], where greenhouse gas reduction targets for the transportation sector have been formulated.
In recent years, interest in the electrification of vehicles has expanded beyond passenger cars to include heavy-duty vehicles such as trucks and buses [3,4,5,6,7].
Evaluating the economic feasibility of battery electric trucks (BETs) using total cost of ownership (TCO) and levelized cost of driving (LCOD) models, the study [6] determines that BETs are already cost-competitive for short distances. However, for long-haul applications and vehicles over 40t gross weight, especially in colder climates, BETs are more challenging in both technical and financial aspects. The solution for this includes technological improvement, fast-charging infrastructure, and more supportive policy measures. Other studies investigate regional opportunities of BEVs. Following [5], BETs in China currently outperform fuel cell trucks (FCTs) economically, though the cost gap narrows with longer ranges and future cell improvements. Investigated in [4] is the technical feasibility of BETs for short and long deliveries in Germany based on real data. The results show high potential for electrification, especially for rigid solo trucks. It recommends optimizing battery sizing of trucks, overnight depot charging, and tour routes. It also recommends immediate planning for fleet electrification. The study [7] investigates the usability of BETs in regions like Switzerland and Finland, with potential improvements in BEV technology and charging infrastructure. However, in these cases, the benefits of electrification for long-haul transport are not high. This study also suggests further research on truck charging, grid impacts, and international comparisons to optimize electrification strategies.
However, in BEVs, conditioning the cabin uses energy from the battery, which reduces the maximum driving range at both low and high temperatures. Therefore, optimizing the HVAC system of BEVs is one of the main research focuses in this field. [8,9]
According to [8], which analyzes the factors influencing the driving range of BEVs, the main factors identified were high driving speed and low ambient temperature, which lead to increased energy demand from the HVAC system. Therefore, the study recommends that the certification of the maximum range of BEVs should include heating scenarios at low temperatures in the testing procedures.
Reference [9] outlines the main technologies of distributed thermal management systems and presents the heating and cooling demands of each subsystem. Different thermal management approaches are also compared, highlighting their limitations and strengths. Additionally, this study examines various heating and cooling methods, showing that integrated thermal management systems combine functions to improve efficiency—especially using heat pump air conditioning and system coupling.
1.1. Previous Research in the Field
In order to maximize the range of an electric vehicle, efficient thermal management is essential. Numerous strategies have been proposed in the literature. The authors of [10] review recent integrated thermal management systems for BEVs, investigating energy efficiency and system performance. The main conclusion is that using two thermal systems can reduce energy usage by approximately 10%, while full integration of HVAC, battery, and motor systems can save up to approximately 20%. The study also highlights that more intelligent control strategies are necessary; instead of a PID controller, approaches such as model predictive control (MPC) and neural networks are more effective. It also stresses the importance of having common evaluation methods and flexible, modular system designs.
As shown in [11], an integrated thermal management topology for range-extended electric vehicles can effectively recover waste heat from the range extender and electric drive system to heat both the battery and cabin, thereby improving overall energy utilization. A heating power control method based on model predictive control is proposed, and the feasibility and superiority of the strategy are verified by the co-simulation of Simulink and AMEsim. Compared with the independent thermal management strategy, the integrated approach shortens battery heating time by 39.1%, saves 2.04 kWh of electricity, and maintains cabin comfort. Furthermore, the model predictive control strategy reduces heating energy consumption by 20.95% and lowers total energy consumption for propulsion and thermal management by 2.84%.
Reference [12] presents a predictive thermal management model for battery electric vehicle cabins that minimizes energy use while maintaining passenger comfort. The model has several innovations: it uses a linear-quadratic model predictive control framework and integrates thermal comfort evaluation via the Predicted Mean Vote (PMV) model. This enables accurate modeling of comfort, eliminating the need for fixed temperature setpoints. Additionally, the model accounts for CO2 levels, humidity, HVAC dynamics, and system constraints, making real-time implementation possible.
In [14], the authors present a numerical analysis of the thermal performance of a truck cabin. The preliminary numerical analysis indicates the energy saving potential of around 30% for this innovative cabin thermal concept, as compared to the original energy demand for the traditional cabin heating configuration. The energy efficiency measure that was analysed here for the heating case is the use of infrared (IR) heating panels, which act directly on the occupants’ body surface and reduce the needed cabin temperature for sensing neutral indoor comfort. Depending on the operating conditions and the cabin configuration, the estimated energy saving potential is between 15% and 36% of the thermal energy demand for heating (winter case) and between 6% and 14% for cooling (summer case).
Improving HVAC and cabin efficiency in BEVs is a key research area. Some studies have presented model-based control strategies, integrated thermal systems, and energy-efficient heating methods. The work of Cvok et al. [15] presents a multi-objective optimization framework for a BEV cabin heating system that balances thermal comfort and energy efficiency. NSGA-II and a Dymola[16]–MATLAB–ModeFrontier simulation setup were used to optimize the blower and infrared heating panels, achieving up to 30% energy savings. In this work, PMV-based comfort modeling and control-oriented simulation were applied. HVAC power demand was reduced without compromising user comfort by using an effective thermal management strategy.
1.2. Current Study Novelty and Focus
Previous research aimed to improve the efficiency and modeling accuracy of thermal systems. Thermal measures such as heating panels and insulation were typically investigated separately, rather than as part of an integrated system where all components interact.
In contrast, this study introduces an advanced electric truck cabin in which new components—such as surface heating panels, and enhanced insulation—are integrated and evaluated together. A 1D model of the cabin is developed, where all components interact with one another to represent the full thermal system.
The 1D simulation approach offers several advantages: it reduces computational load compared to 3D CFD models, allows for fast concept evaluation, and supports system-level integration. Despite the growing interest in electric vehicle thermal management, no publicly available study to date has presented a validated 1D model that incorporates all these measures in a unified framework—particularly for commercial electric trucks.
In addition to simulation, the model was validated against experimental data from climatic chamber and laboratory tests. Furthermore, the 1D model has been structured to support FMU (Functional Mock-up Unit) export, enabling its integration into higher-level control system simulations or vehicle co-simulation environments—a critical step toward real-world application and development efficiency.
Key Novel Contributions:
- Integrated System-Level Modeling: The study introduces a 1D model that brings together multiple thermal measures, like insulation and heating panels. It offers a complete understanding of the system.
- Comfort Measurement and Validation: Linear comfort simulation is implemented within the 1D simulation, providing a robust assessment of passenger comfort.
- Validation with Experimental Performance Test: An electric truck cabin with these types of measures was investigated and validated with real measurement data. The measurements made it possible to build an accurate 1D model and support further development.
- Electric Truck Focus: The study highlights the thermal aspects of electric truck cabins and fills a key gap in current research.
- FMU Compatibility: The model is ready to be exported as a Functional Mock-up Unit (FMU), making it easy to integrate into larger system simulations or real-time applications—an important step toward practical deployment.
In Figure 1, an overview of the workflow for the simulation and validation of the electric cabin is presented. There are two main workflows. The first is simulation and data processing, which begins with vehicle specification. Following that, the simulation models are established, alternative thermal measures are analyzed, the concept is identified, concept cabin simulations are conducted, and finally, a Functional Mock-up Unit (FMU) is created.
The second workflow is focused on measurements and supports the simulation process. Laboratory measurements of the original cabin help to establish the simulation models. Additional laboratory measurements with different thermal measures assist in analyzing these alternatives. Finally, climatic chamber measurements of both the original and the selected thermal measures are used to validate the simulation.
In summary, this work offers a meaningful and practical contribution to the field of EV thermal management by bridging the gap between individual components and full-system implementation, especially in the underexplored area of electric trucks.
2. Physical Background
For the thermal management analysis, an electric truck cabin equipped with heat panels and insulation was used. This truck cabin served as the basis for developing and parameterizing the 1D Dymola[16] model. In Section 2.1, the experimental truck cabin and its thermal measurements are introduced. In Section 2.2, the thermal 1D model developed in Dymola is explained.
2.1. Measurement of the Prototype Cabin
The one-dimensional (1D) thermal model of the truck cabin was validated against experimental data to assess its accuracy in predicting power consumption, interior cabin temperature, and comfort value. Validation of power consumption and cabin temperature was performed using two controlled test environments: a laboratory and a climatic chamber. The comfort value validation was conducted only in the climatic chamber.
Two experimental setups were used for validating the simulation model:
- Laboratory measurements: The cabin was placed in a room-temperature environment and actively heated.
- Climatic chamber measurements: The cabin interior was held at room temperature while the external environment was cooled.
For this study, a conventional truck cabin was used, whose thermal management system was developed and equipped with various energy-saving thermal measures. The cabin is approximately 2.5 m × 3 m × 1.5 m in size and is designed as a two-seat configuration.
Heat from the cabin’s interior tends to escape to the outside through gaps and by conduction through the walls. To tackle this issue, insulation material can be added to the inner surfaces of the cabin. In our experiments, we used 25 mm thick Armaflex ACE insulation mats, which were applied to the sides, bottom, and top of the interior, as well as to the front exterior of the vehicle. Figure 2 provides a visual representation of how these insulation measures were implemented.
The truck cabin is equipped with heating panels, as shown in Figure 3 using a thermal camera, where the bright yellow areas correspond to panels reaching their maximum temperature. The functional seat heating is also visible, providing full comfort to the driver. Heating is provided around both the driver and the passenger seat. Because of the heating panels, the driver’s comfort can be achieved more quickly, and the overall cabin temperature can be kept lower, which helps saving energy [14].
Comfort tests were conducted to assess the effectiveness of heating panels at maintaining occupant comfort in a colder cabin environment. The cabin was held at 16 °C instead of the typical 22 °C, while the heating panels reached surface temperatures of approximately 50–70 °C, as observed with a thermal camera. Because of the soft layer covering the panels, no burning sensation was reported despite the high surface temperature.
The participants were asked to rate the level of comfort in the head, body, and leg areas after spending ten minutes in the cabin. A comfort survey was used to document the findings.
The cabin, with and without thermal measures, was evaluated in both a room-temperature laboratory and a climatic chamber. In the laboratory, the cabin interior was heated to generate a temperature gradient between the inside and outside, and the corresponding energy requirements were assessed.
In the climatic chamber, a lower ambient temperature was maintained while the cabin was held at room temperature. This configuration enabled the assessment of passenger comfort and the performance of the heating panels.
Environmental parameters were monitored using the following instruments: 22 temperature sensors, 2 humidity sensors, 1 pressure difference sensor, 2 carbon dioxide (CO2) sensors, and 1 global radiation sensor. The complete measurement setup, including all thermal sensors and control units, is shown in Figure 4.
2.2. 1D model
The authors of [14] describe the thermal analysis of this truck. The thermal behavior of the cabin can be investigated through the temporal variation of the average cabin temperature . This dynamic behavior is modeled by establishing a heat balance between the input heat power (delivered via convection or radiation) and the heat losses :
where m and represent the mass and specific heat capacity of the air inside the cabin, respectively.
The heat power input is provided by the HVAC system and consists of the heated air inflow (), the fan power (), the radiative power from the heat panels (), and solar radiation ().
The total heat loss comprises four components. The first is the transmission loss , which depends on the cabin geometry and the insulation properties of the cabin walls. This is characterized by the heat transfer coefficient G, which is a function of the insulation thickness . The second component is the outlet air loss (). The third is the pre-conditioning power (), which involves heating and cooling the thermal masses within the cabin. The fourth is the dehumidification power (), which is part of the HVAC model for cabin cooling. Additionally, there is ventilation heat loss, which can be reduced by using a heat exchanger with efficiency [13].
Here, and refer to the air temperatures before and after the evaporator and heater core, respectively. is the ambient temperature, and is the output air temperature from the cabin. and are the volumetric flow rate and the density of the incoming air, respectively.
The 1D model of the advanced electric truck cabin was established in Dymola using TIL Library[17]. The model consists of two main parts that effectively simulate the entire thermal management of the cabin. The cabin air, fans, evaporator and heater core, air channels and heat panels, along with a comfort model, were included.
The second part involves measurement data. Many input values were taken from real measurements, such as ambient temperature, radiation, and blower percentage. During the validation process, modifications were applied to better simulate real-life behavior. The heater core and cabin air were thermally connected not only by the inlet air, and this effect is not negligible. Since the heater core is placed under the dashboard, the cabin is also heated through conduction.
The separation of the model into two parts makes it possible to export or create Functional Mock-Up Units (FMUs) that can be connected with other truck models. This can be seen in Figure 5, where the Dymola model is connected with the validation setup.
As illustrated on Figure 5, the measurement data used as input for the model include ambient temperature and humidity; the set temperature, represented by the average measured cabin temperature; blower request in percentage; coolant temperature and flow rate; recirculation and mix flap positions; heating panel power level (in percentage) and the insulation rate.
The main cabin characteristics used in the simulations are summarized in Table 1. The simulations could capture the full complexity of truck operation; for example by imposing realistic driving and environmental condition profiles, however here they were assumed to be constant.
Two different heat exchanger configurations were used in the simulation model to represent the thermal exchange between air and fluid streams in the cabin climate control system.
The first component is a moist air–liquid crossflow heat exchanger, modeled using TIL.HeatExchangers.MPET.MoistAirLiquid.CrossFlowHX. This exchanger is used on the glycol-water side and the moist air side. The model is configured with a fin side heat transfer coefficient of W/m²K and a tube side heat transfer coefficient of W/m²K. The geometry of the exchanger is used to calculate wall conductance, and tube-side pressure drop is taken to be zero.
These models are essential for capturing steady-state heat transfer behaviour and provide the basis for representing thermal interactions within the system in the absence of more detailed transient dynamics.
In the simulation, a one-dimensional (1D) comfort model was used. As described in Ref. [14], and shown in Figure 6, the passenger’s comfort was calculated using a linear mapping which can be expressed as:
Here, the surface temperature (), the cabin air temperature (), the comfort point temperature ()—defined as the temperature at which both air and surface temperatures result in PMV = 0—and the step value (), which determines the sensitivity of the PMV value, all influence the comfort result.
For example, if the comfort point is 22 °C and either the cabin air or surface temperature increases by 4 °C, the PMV rises from 0 to 1.
The surface temperature was calculated based on the assumption that approximately 25% of the passenger’s surroundings are covered by heat panels, whose temperature is known and time-dependent. The remaining 75% corresponds to cabin surfaces, which follow the thermal behavior of the interior materials, modeled via their heat capacity.
This approach provides an approximate yet computationally efficient estimation of passenger thermal comfort, allowing for fast execution within the overall system simulation.
3. Results
The measurement results and simulation data are presented in this section.
Section 3.1 presents the simulation and measurement data and compares them. Section 3.2 presents the evaluation of energy-saving thermal measures, such as additional insulation and heating panels with reduced interior temperature. Section 3.3 presents a comparison between the simulation results and comfort survey data. Section 3.4 presents a comparison of laboratory and climatic chamber measurement data, demonstrating the comparability of these two test environments.
3.1. Model Validation
The Dymola 1D model was validated using measurement data. Three main aspects were validated: the power consumption of the cabin, the interior cabin temperature, and the PMV (Predicted Mean Vote) comfort values. In this section, the validation of power consumption and temperature is presented.
Figure 7 presents four diagrams comparing the measurement data and simulation results. The model deviates from the measurement data at the beginning of the experiment. These transient phases occur because the system’s initial conditions and complexities are not fully captured in the simulation. However, by the end of the initial period, the simulation closely matches the measured values, which is most important when evaluating the effectiveness of thermal measures.
In diagrams C and D of Figure 7, there are fluctuations in both the measurement and simulation results. These fluctuations correspond to the comfort assessment phase, during which the door was opened and closed several times. The blower power input was also used as an input for the simulation (see Figure 5); therefore, the simulation was partly able to reproduce these fluctuations in temperature and power.
3.2. Evaluation of Thermal Measures
In the climatic chamber, the cabin’s thermal performance was assessed using three different configurations:
- Original cabin with 22 °C cabin air temperature,
- Cabin with additional insulation and 22 °C air temperature,
- Cabin with additional insulation and heating panels, with a lowered air temperature of 16 °C.
These thermal measures are compared during the steady-state phase, where no transient processes occur and the thermal capacitances are in equilibrium.
The climatic chamber test results, comparing the three cabin configurations, are shown in Figure 8. These results represent 1–2 hour average values during the steady-state phase. This phase occurs approximately 2–3 hours after the start of the measurement, when the system reaches thermal equilibrium. The baseline (original) configuration consumed the most energy, requiring at and at . The configuration with additional insulation reduced energy consumption to at , representing an 18 % reduction, and to at , a 27 % reduction. With only at (a 37 % reduction) and at (a 50 % reduction), the heating panel setup achieved the highest energy efficiency while maintaining the cabin temperature at .
These findings show that while both thermal strategies result in notable energy savings, heating panels offer the greatest improvement, particularly during colder conditions.
3.3. Comfort Analysis
The comfort of the cabin was measured using the PMV (Predicted Mean Vote) value. The PMV values obtained from occupant feedback during climatic chamber measurements are compared with the results of a linear PMV model simulation. The main purpose of this comparison is to ensure that the cabin provides the same level of comfort at C with heating panels as it does at C without heating panels.
Figure 9 shows the PMV values for individual body parts based on user feedback, the whole-body average PMV, and the PMV results from the thermal simulation at C. The three cases described in the previous chapter are compared.
The PMV scale ranges from to , where indicates very uncomfortably cold and indicates very uncomfortably hot. Participants were asked to rate the comfort of different body regions, including the head and neck, upper body, thighs, lower legs and feet, left arm, and right arm. The diagram shows the average values of the participants’ responses.
Comfort perception depends on a person’s thermal sensation, clothing and the distance from the panels, but general observations can still be made based on the results. The left arm, which was oriented toward the door window, consistently felt colder than other body parts because windows are typically the coldest surfaces in the cabin. The head and neck regions were generally warmer and more comfortable due to the horizontal layering of warm air within the cabin.
The whole-body PMV averages in each case fell between and 0, indicating a generally comfortable environment for most participants. For the original cabin case, the reported average value and the simulation result was nearly identical. However, the simulated comfort was marginally lower in the insulated case, likely because the interior included a mattress and insulation foam, which enhanced thermal comfort compared to the original metal and plastic surfaces. The insulation foam has a much higher emissivity value, making it feel warmer than raw plastic or metal surfaces. This difference can be observed in the subjective comfort feedback, where the test passenger felt more comfortable in the insulated cabin than in the original cabin, even at the same measured temperature. This effect was not captured by the linear thermal model.
In the third case, using the heating panels, the simulated and the average reported PMV values also closely matched. This suggests that the simulation effectively reflects the measured results.
Both the participants’ reports and the simulations prove, that the use of heating panels make it possible to maintain comfort levels with lower cabin air temperature.
3.4. Comparison of Laboratory and Climatic Chamber Measurements
Heating energy consumption measurements were conducted both in the laboratory and in the climatic chamber. The laboratory measurements offer a significantly more energy efficient solution compared to the climatic chamber, since the latter requires a considerable amount of energy to be conditioned. In this section, it is investigated, whether measurements without conditioned ambient environment can provide HVAC consumption estimation.
Both the original and the insulated cases are depicted in Figure 10.
The measurement results are represented by the data points, some of which were obtained in the climatic chamber and others in the lab. The diagram shows the heating energy consumption as a function of the temperature difference between the ambient and average cabin temperature.
For both the insulated and uninsulated case, the results follow a similar trend regardless of the environment. This is indicated by the points falling mainly on the same line. In conclusion, heating the cabin in an environment without temperature control can provide a good estimation of energy consumption in a real life (climatic chamber) scenario. Therefore, the effect of insulation can also be approximated without using the climatic chamber.
The energy consumption changes exponentially with the temperature difference, and the difference between the original and insulated cases also increases with increasing temperature difference. At , the original cabin needed approximately , while the insulated cabin required just approximately of heating energy. The effect of insulation on the consumption is negligible under a temperature difference.
However, to investigate other effects, such as humidity and solar radiation, or assess the comfort with different thermal measures, the climatic chamber has to be used. Therefore, the laboratory measurements can only reduce the number of experiments in the climatic chamber. Still, it is a viable option to reduce the cost of development.
4. Discussion
This study shows that insulation and heating panels can improve the thermal efficiency of a cabin in an electric truck. Simulation and measurement results also demonstrate that they are effective thermal measures to decrease the energy demand of a cabin while maintaining the same thermal comfort for the passengers.
The validated 1D Dymola thermal model could predict the cabin’s average temperature and the energy demand of the cabin HVAC system in both laboratory and climatic chamber environments, despite its limitations and simplifications. It can be used for initial system evaluation, rapid simulation, and as an FMU in system-level co-simulation and control development, due to its low computational requirements.
The application of additional insulation represents a relatively simple thermal measure to implement, as most OEMs already incorporate insulation within the cabin structure. Therefore, its extended use is recommended. Simulation and measurement data indicate that the energy-saving potential of additional insulation is approximately 20% at 0°C and nearly 30% at -10°C.
The heating panels demonstrated the highest energy-saving potential in this study. The main advantage of using heating panels is their ability to maintain passenger comfort even when the cabin air temperature is lower than usual. The study shows that a cabin air temperature of 16°C can be maintained without a loss of thermal comfort for the passengers. This results in significant energy savings: at 0°C, energy demand was reduced by approximately 50%, and at -10°C, by around 37%, compared to the original setup. Heating panels are not yet widely used by OEMs, mainly because, compared to insulation, they represent a more complex system. However, their implementation is worth considering due to their high energy-saving potential.
The comfort assessment, specifically the determination of the PMV (Predicted Mean Vote) value, was an important part of this study due to the use of heating panels. While the comfort study involving participants provided relatively good evaluations of comfort across different body regions, the simulation was limited to a simplified method. Despite this simplicity, after an iterative validation process, the model could be used to approximate the actual comfort values. However, the simulation could not capture variations in comfort across different body regions, nor the vertical temperature differences within the cabin.
To prepare for the climatic chamber measurements and conserve resources, most of the measurements were conducted in a laboratory environment. Analyzing the data showed that the laboratory and climatic chamber measurements were comparable in terms of energy consumption and temperature differences between the cabin and the environment. This confirms that heating tests conducted in a laboratory can provide reliable and comparable results, especially for steady-state energy evaluation. However, for comfort measurements and the determination of the influence of other conditions—such as radiant heat, humidity, and external airflow—the laboratory setup was not sufficient and lacked the necessary capabilities.
Notwithstanding the positive results, it’s critical to acknowledge some limitations. The model and experimental setup assumed a steady-state ambient temperature and a stationary vehicle, and therefore did not simulate real driving conditions with fluctuating ambient temperatures, solar radiation, different driving speeds, and the transient behavior of the HVAC system. Idealized boundary conditions were used, primarily to evaluate the effectiveness of the applied thermal measures. On the other hand, the comfort model and measurements were also idealized, as feedback was collected from a small group of participants under controlled environmental conditions. Human thermal perception, however, varies with activity level, clothing, and physiology.
The results and prototype setup are limited to a specific truck cabin design; therefore, generalizing these results to other vehicle types or configurations should be done cautiously.
5. Conclusion and Outlook
In conclusion, this paper presents a measurement series and a validated 1D simulation approach for an electric truck cabin. The effects of additional thermal insulation and the use of heating panels with reduced cabin interior temperatures were investigated and compared to the original setup. Comfort evaluation was also introduced during both measurement and simulation, as it was important to ensure the same level of comfort for the passenger. By applying thermal measures, the HVAC system’s power consumption was reduced by up to 50%, which can contribute to extending the maximum driving range of battery electric vehicles (BEVs).
In future work, the setup should be tested under variable environmental conditions and dynamic driving cycles. The simulation should increase spatial resolution within the cabin, and comfort evaluation should be conducted with a broader participant base.
To further support the use of these thermal measures, a cost-benefit analysis is needed to evaluate their economic feasibility. However, the results show that even simple thermal strategies can improve the efficiency of HVAC systems. This is particularly relevant for BEVs, as the HVAC system draws energy directly from the battery, reducing the available driving range.
Further research is required to improve the overall energy efficiency of BEVs, making them more sustainable and attractive to a wider range of customers.
Author Contributions
Conceptualization, I.G. and M.K.; methodology, I.G. and M.K.; validation, I.G.; formal analysis, I.G. and M.K.; investigation, I.G. and M.K.; writing—original draft preparation, I.G. and M.K.; writing—review and editing, I.G., M.K. and M.P.; visualization, I.G. and M.K.; supervision, M.P.; project administration, M.P. and D.Š.; funding acquisition, M.P. and D.Š. All authors have read and agreed to the published version of the manuscript.
Funding
This research was funded by European Union’s Horizon research and innovation program under grant number 101056740, and project name “NextETRUCK”. The content of this publication is the sole responsibility of the consortium partners listed herein and does not necessarily represent the view of the European Commission or its services. 
Data Availability Statement
The data presented in this study are available upon request from the corresponding author due to legal reasons.
Acknowledgments
We would like to express our sincere appreciation to Ford Otosan for their close collaboration and for providing the truck cabin used as a demonstrator in this study. Their support was essential, and this investigation would not have been possible without it. Additionally, AI-based tools (such as ChatGPT) were used to assist with sentence refinement and language clarity during the preparation of this manuscript. All scientific content and conclusions are the work of the authors.
Conflicts of Interest
Imre Gellai, Milan Kardos, Mirza Popovac, Dragan Šimić are employees of AIT Austrian Institute of Technology GmbH. The authors declare that the research was conducted in the absence of any commercial or financial relationships that could be construed as a potential conflict of interest.
Abbreviations
The following abbreviations are used in this manuscript:
| BEV | Battery Electric Vehicle |
| BET | Battery Electric Truck |
| CFD | Computational Fluid Dynamics |
| CO2 | Carbon Dioxide |
| EU | European Union |
| FMU | Functional Mock-up Unit |
| HVAC | Heating, Ventilation, and Air Conditioning |
| HX | Heat Exchanger |
| LCOD | Levelized Cost of Driving |
| MPC | Model Predictive Control |
| OEM | Original Equipment Manufacturer |
| PID | Proportional-Integral-Derivative |
| PMV | Predicted Mean Vote |
| Ref. | Reference |
| TCO | Total Cost of Ownership |
| 1D | One-Dimensional |
| 3D | Three-Dimensional |
References
- IEA. Global EV Outlook 2024; IEA: Paris, France, 2024; Available online: https://www.iea.org/reports/global-ev-outlook-2024 (accessed on 5 May 2025).
- European Union. The European Green Deal. Available online: https://commission.europa.eu/strategy-and-policy/priorities-2019-2024/european-green-deal_en (accessed on 5 November 2024).
- Bhardwaj, S.; Mostofi, H. Technical and Business Aspects of Battery Electric Trucks—A Systematic Review. Future Transp. 2022, 2, 382–401. [Google Scholar] [CrossRef]
- Link, S.; Plötz, P. Technical Feasibility of Heavy-Duty Battery-Electric Trucks for Urban and Regional Delivery in Germany—A Real-World Case Study. World Electr. Veh. J. 2022, 13, 161. [Google Scholar] [CrossRef]
- Mu, Z.; Zhao, F.; Bai, F.; Liu, Z.; Hao, H. Evaluating Fuel Cell vs. Battery Electric Trucks: Economic Perspectives in Alignment with China’s Carbon Neutrality Target. Sustainability 2024, 16, 2427. [Google Scholar] [CrossRef]
- Samet, M. J.; Liimatainen, H.; Pihlatie, M.; van Vliet, O. P. R. Levelized Cost of Driving for Medium and Heavy-Duty Battery Electric Trucks. Appl. Energy 2024, 361, 122976. [Google Scholar] [CrossRef]
- Liimatainen, H.; van Vliet, O.; Aplyn, D. The Potential of Electric Trucks—An International Commodity-Level Analysis. Appl. Energy 2019, 236, 804–814. [Google Scholar] [CrossRef]
- Haiyan, Z.; Dawei, C.; Yu, L. Research on Key Influencing Factors of Endurance Mileage of Battery Electric Vehicle. In Proceedings of the 2022 7th Asia Conference on Power and Electrical Engineering (ACPEE), Hangzhou, China, 15–17 April 2022; pp. 235–239. [Google Scholar] [CrossRef]
- Li, X.; Wang, R. Towards Integrated Thermal Management Systems in Battery Electric Vehicles: A Review. eTransportation 2025, 24, 100396. [Google Scholar] [CrossRef]
- Zhu, Z.; Zhang, Y.; Chen, A.; Chen, J.; Wu, Y.; Wang, X.; Fei, T. Review of Integrated Thermal Management System Research for Battery Electrical Vehicles. J. Energy Storage 2025, 106, 114662. [Google Scholar] [CrossRef]
- Guo, R.; Li, L.; Sun, Z.; Xue, X. An Integrated Thermal Management Strategy for Cabin and Battery Heating in Range-Extended Electric Vehicles under Low-Temperature Conditions. Appl. Therm. Eng. 2023, 228, 120502. [Google Scholar] [CrossRef]
- Schaut, S.; Sawodny, O. Thermal Management for the Cabin of a Battery Electric Vehicle Considering Passengers’ Comfort. IEEE Trans. Control Syst. Technol. 2020, 28, 1476–1492. [Google Scholar] [CrossRef]
- Dvorak, D.; Kardos, M.; Gellai, I.; Šimić, D. Experimental Performance Investigation of an Air–Air Heat Exchanger and Improved Insulation for Electric Truck Cabins. World Electr. Veh. J. 2025, 16, 129. [Google Scholar] [CrossRef]
- Gellai, I.; Popovac, M.; Kardos, M.; Simic, D. Numerical Analysis of the Energy Efficiency Measures for Improving the Truck Cabin Thermal Performance. Eng. Model. Anal. Simul. 2024, 2. [Google Scholar] [CrossRef]
- Cvok, I.; Ratković, I.; Deur, J. Multi-Objective Optimisation-Based Design of an Electric Vehicle Cabin Heating Control System for Improved Thermal Comfort and Driving Range. Energies 2021, 14, 1203. [Google Scholar] [CrossRef]
- Modelica Association. Modelica Standard Library. Available online: https://www.modelica.org/libraries (accessed on 20 August 2025).
- TLK-Thermo GmbH. TIL Suite. Available online: https://www.tlk-thermo.com/de/software/til-suite (accessed on 20 August 2025).
Figure 1.
Workflow of the simulation and validation of the electric truck cabin.
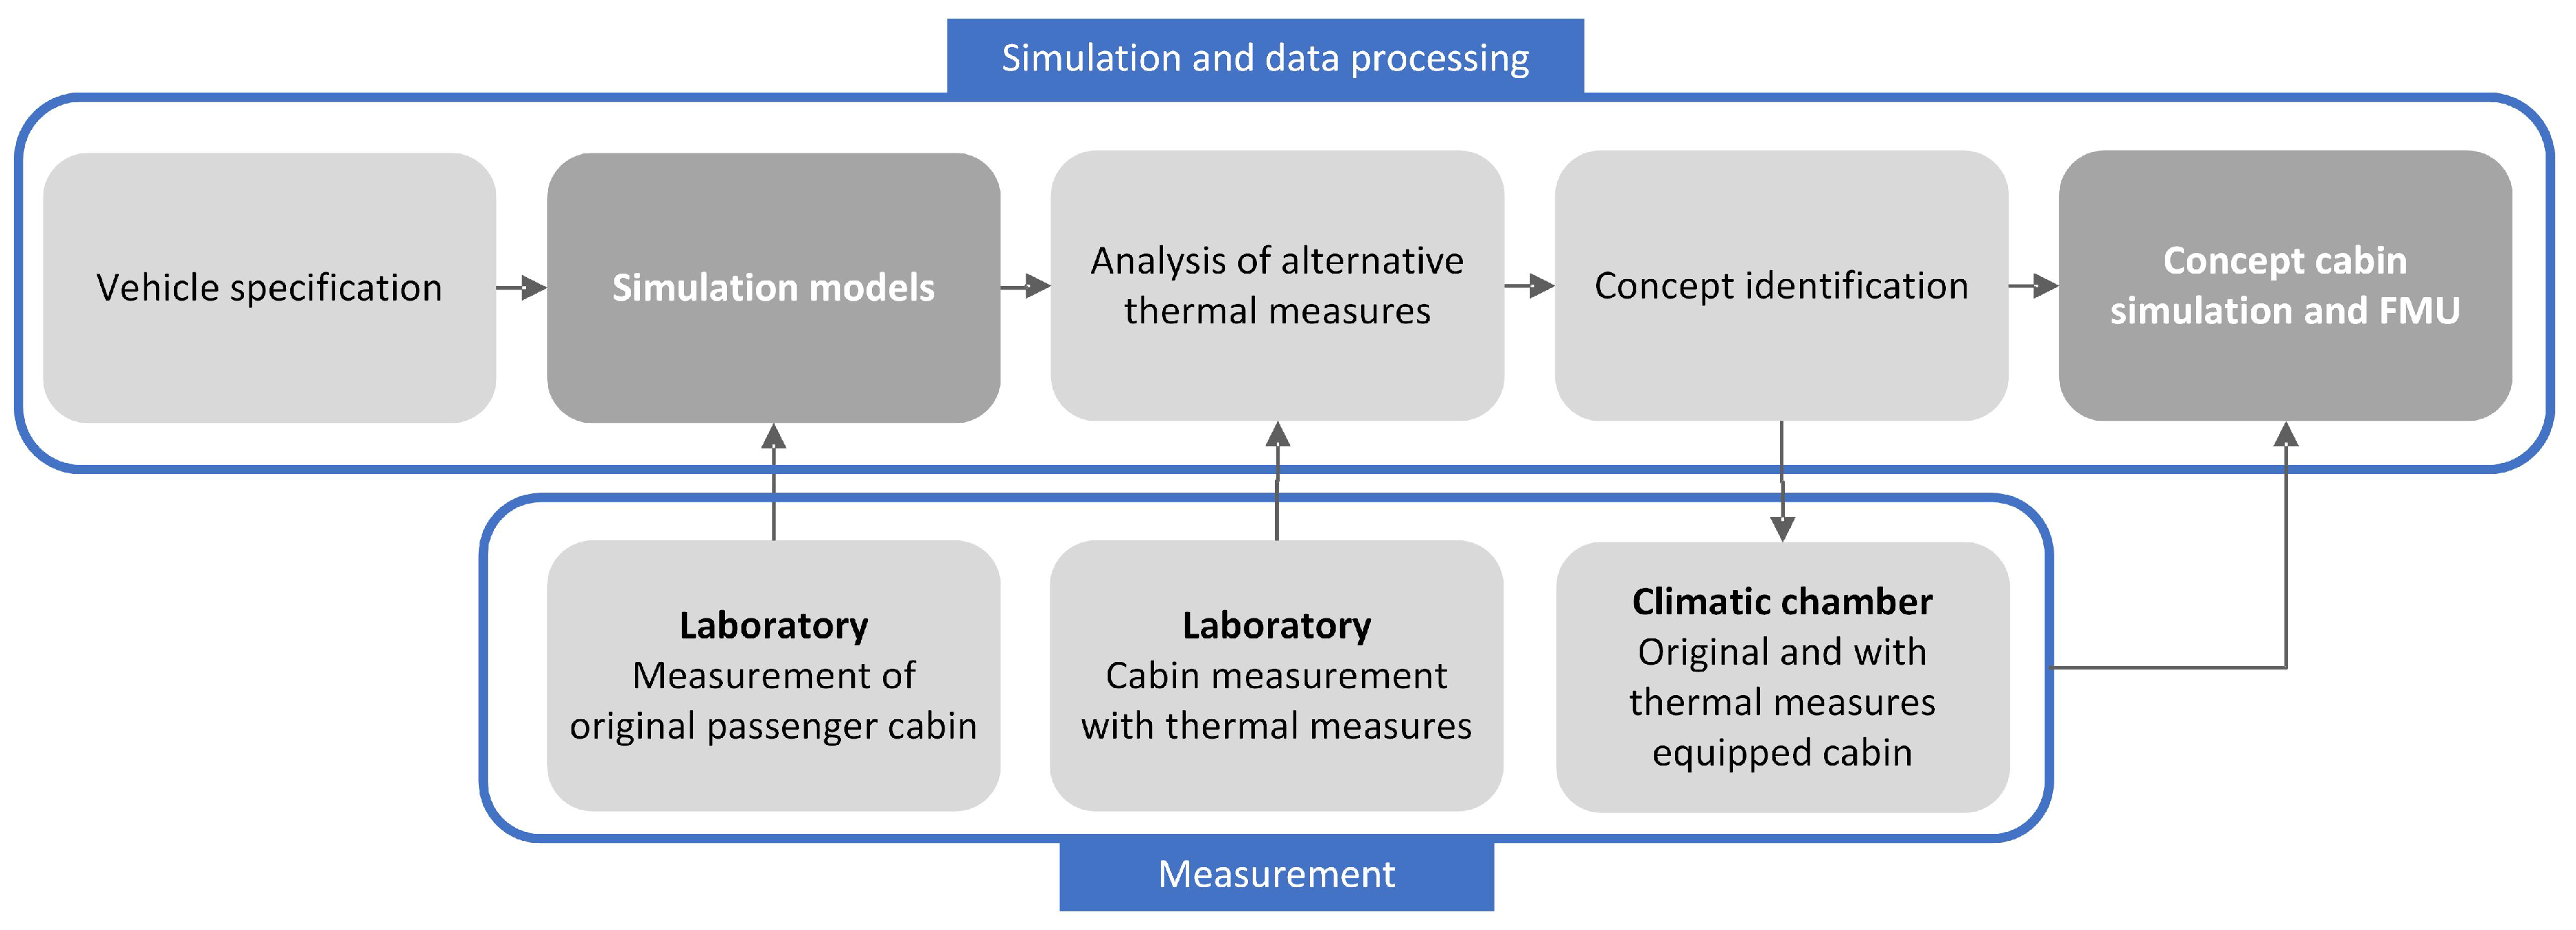
Figure 2.
Interior view of the cabin with Armaflex ACE insulation applied to walls, ceiling, and floor.
Figure 2.
Interior view of the cabin with Armaflex ACE insulation applied to walls, ceiling, and floor.
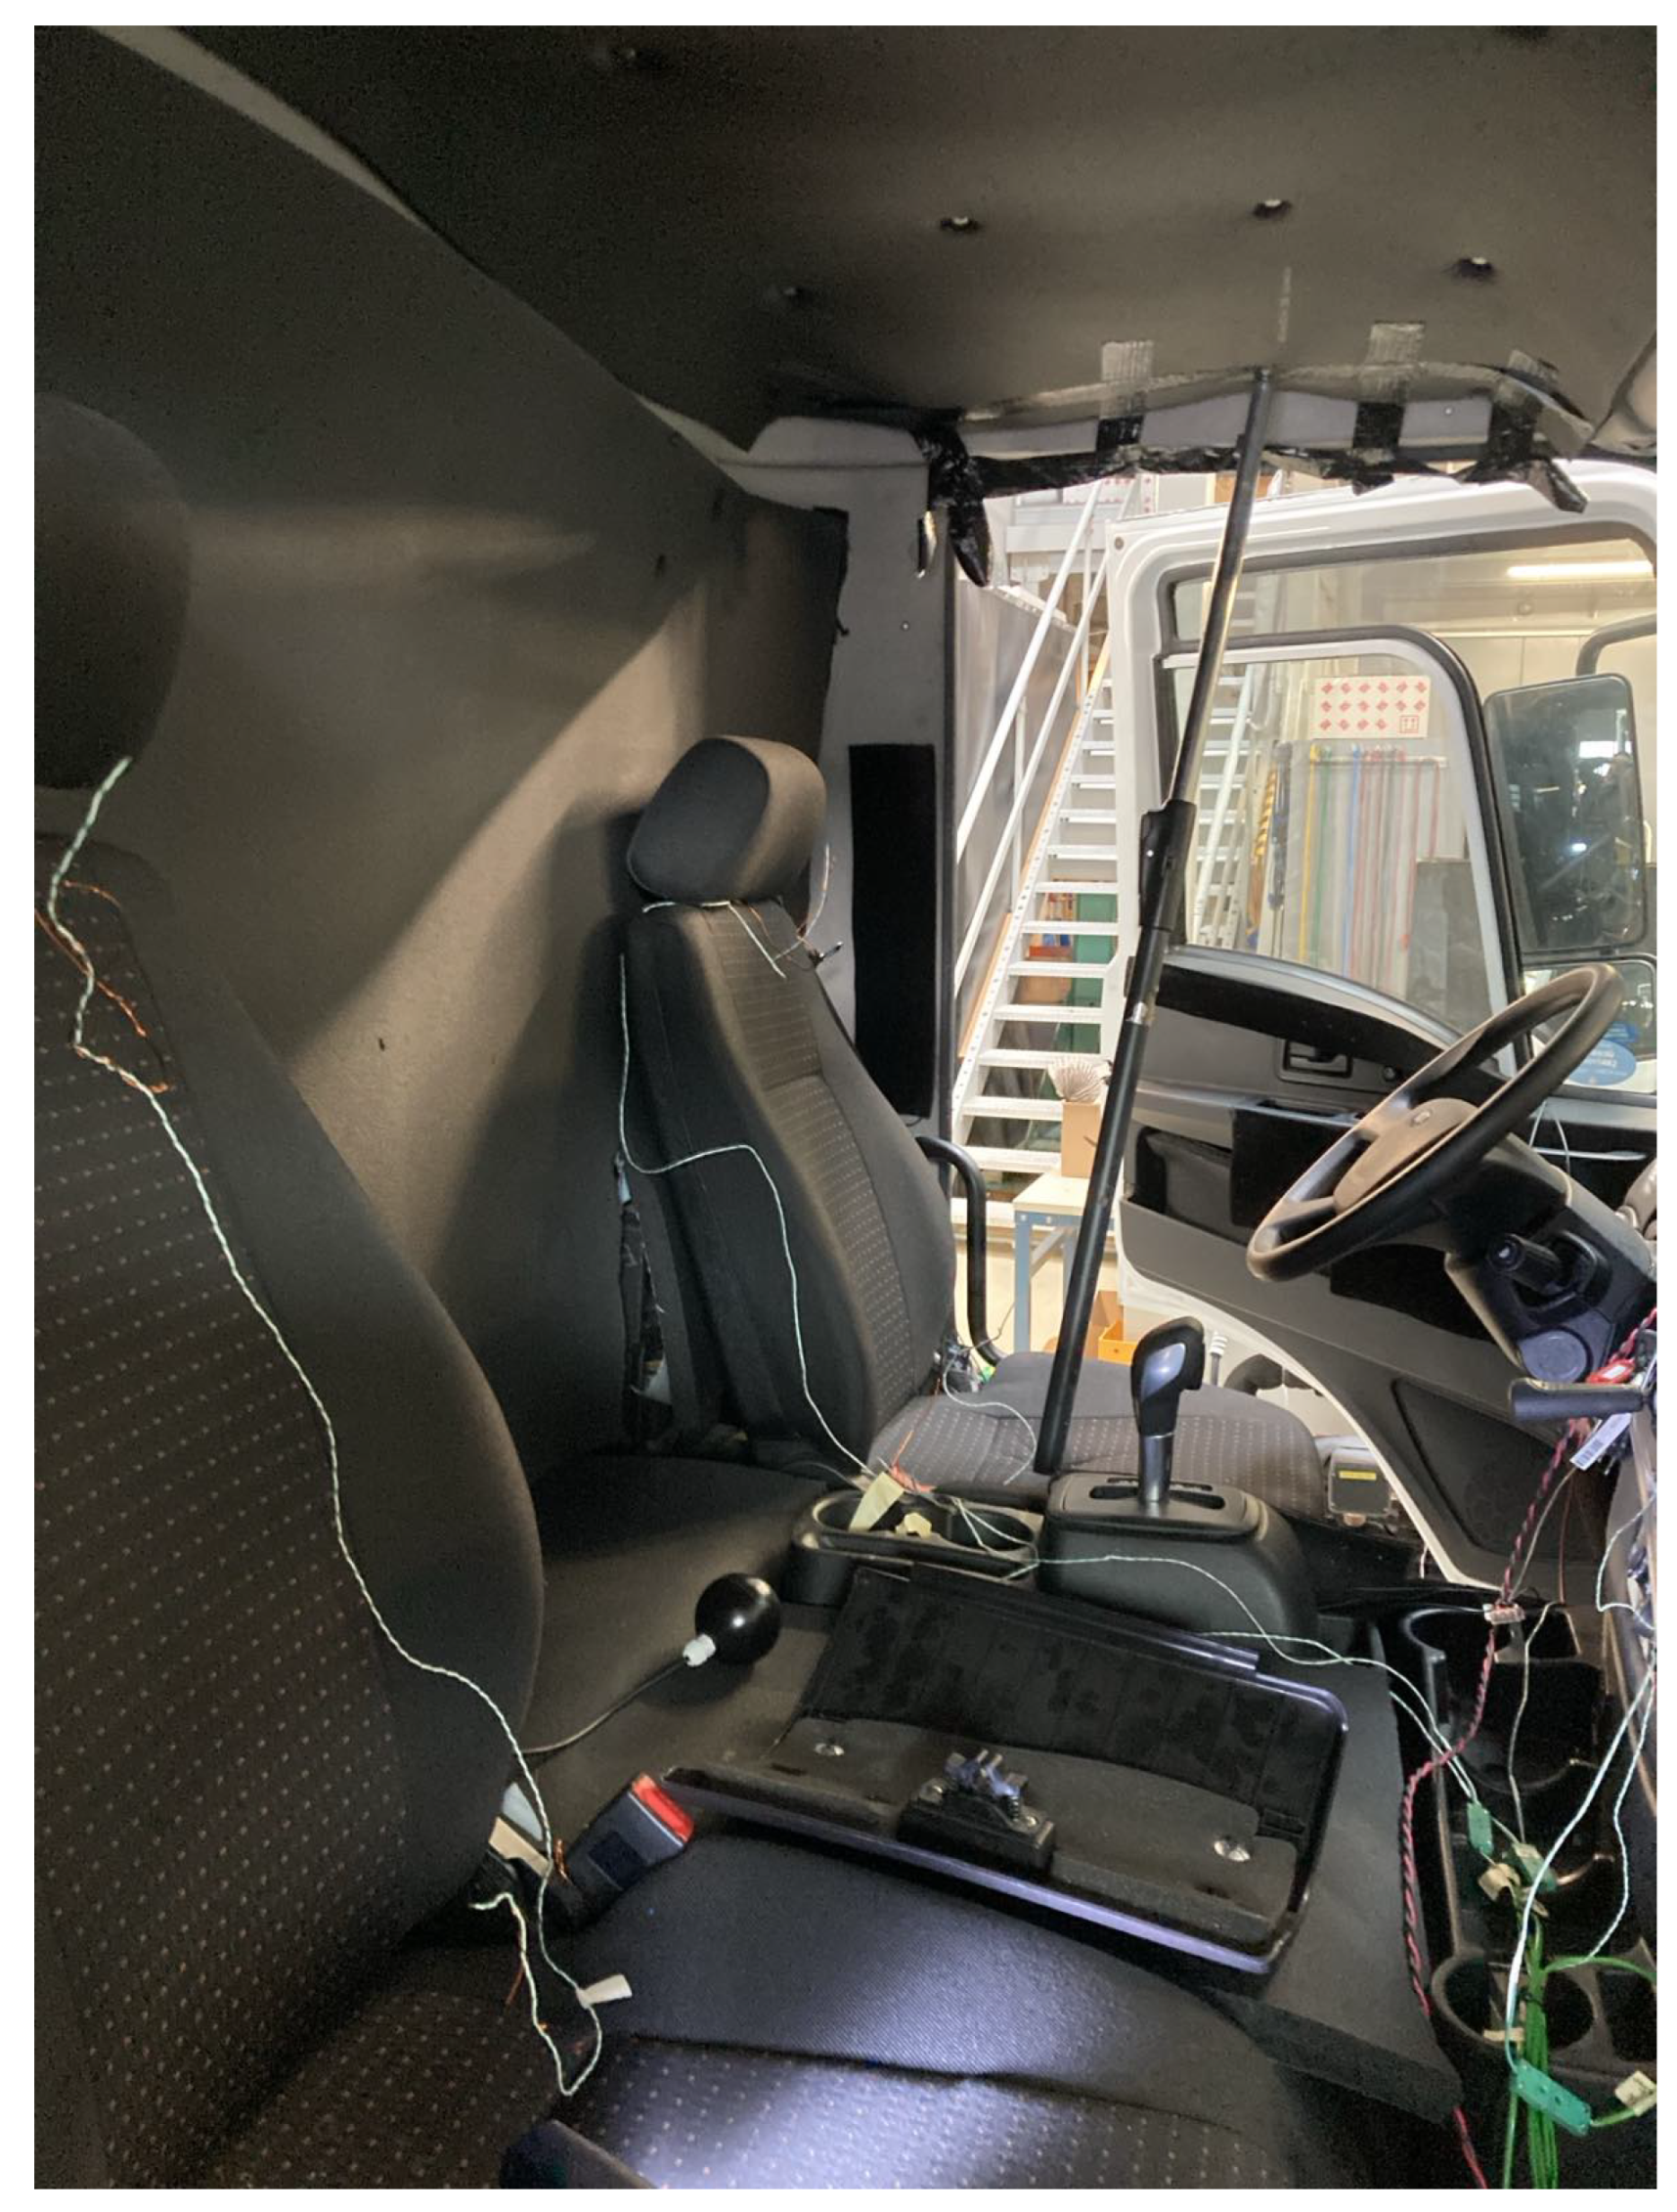
Figure 3.
Thermal camera image showing localized heating around the driver and seat, enabled by integrated heating panels.
Figure 3.
Thermal camera image showing localized heating around the driver and seat, enabled by integrated heating panels.
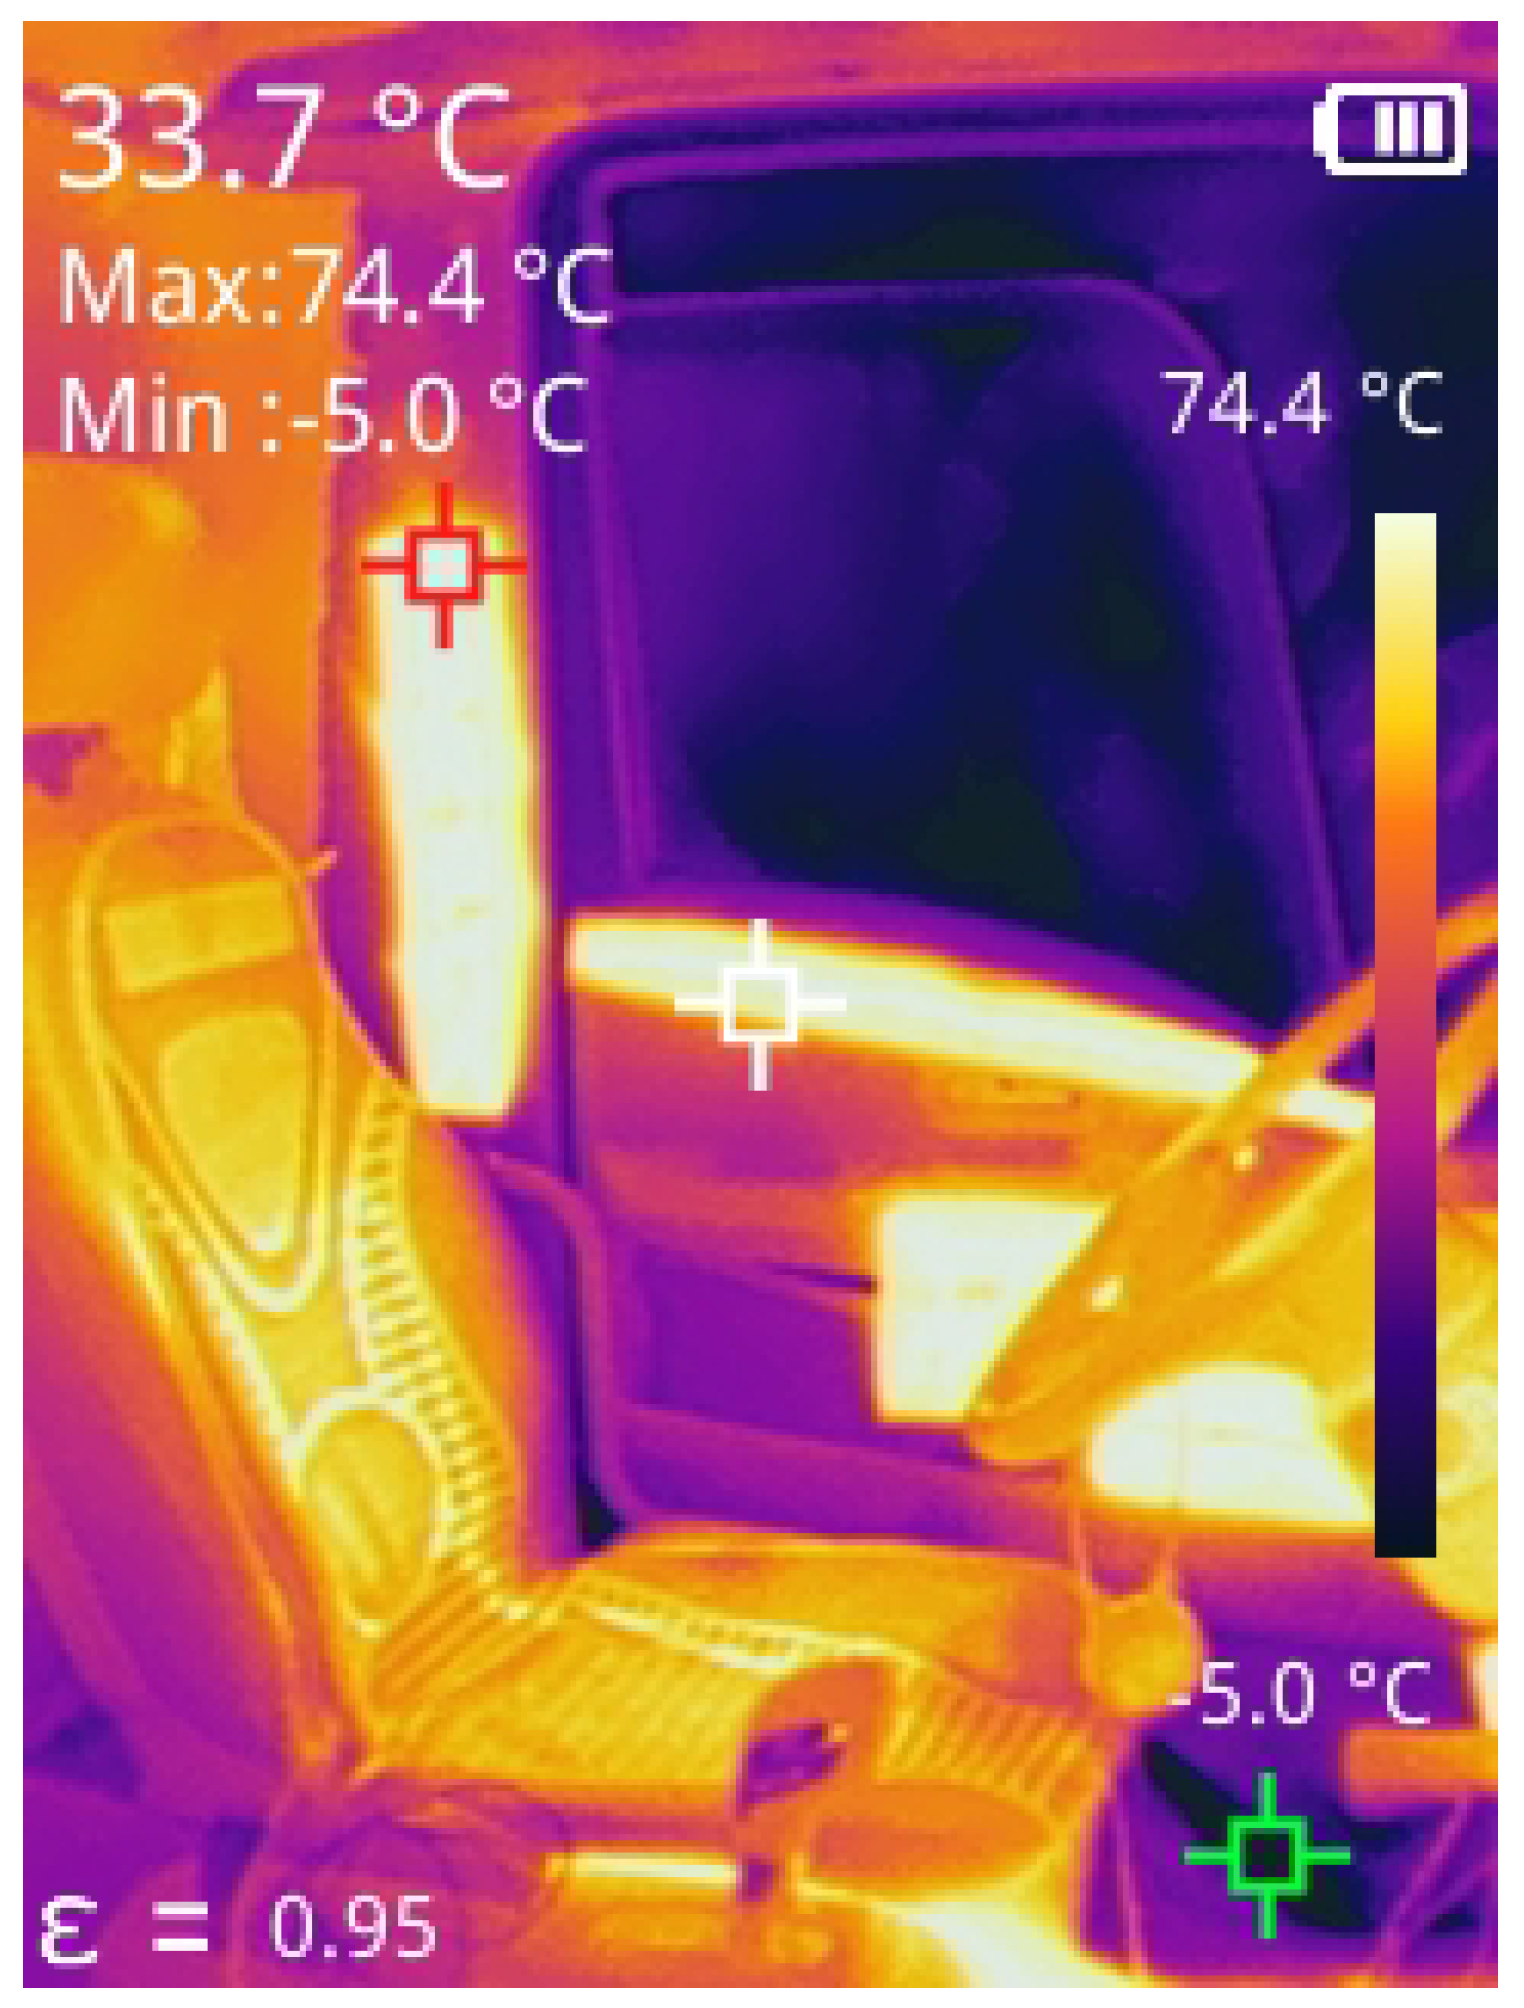
Figure 4.
Measurement setup used in the laboratory and climatic chamber, showing thermal sensors, control units, and environmental instrumentation.
Figure 4.
Measurement setup used in the laboratory and climatic chamber, showing thermal sensors, control units, and environmental instrumentation.
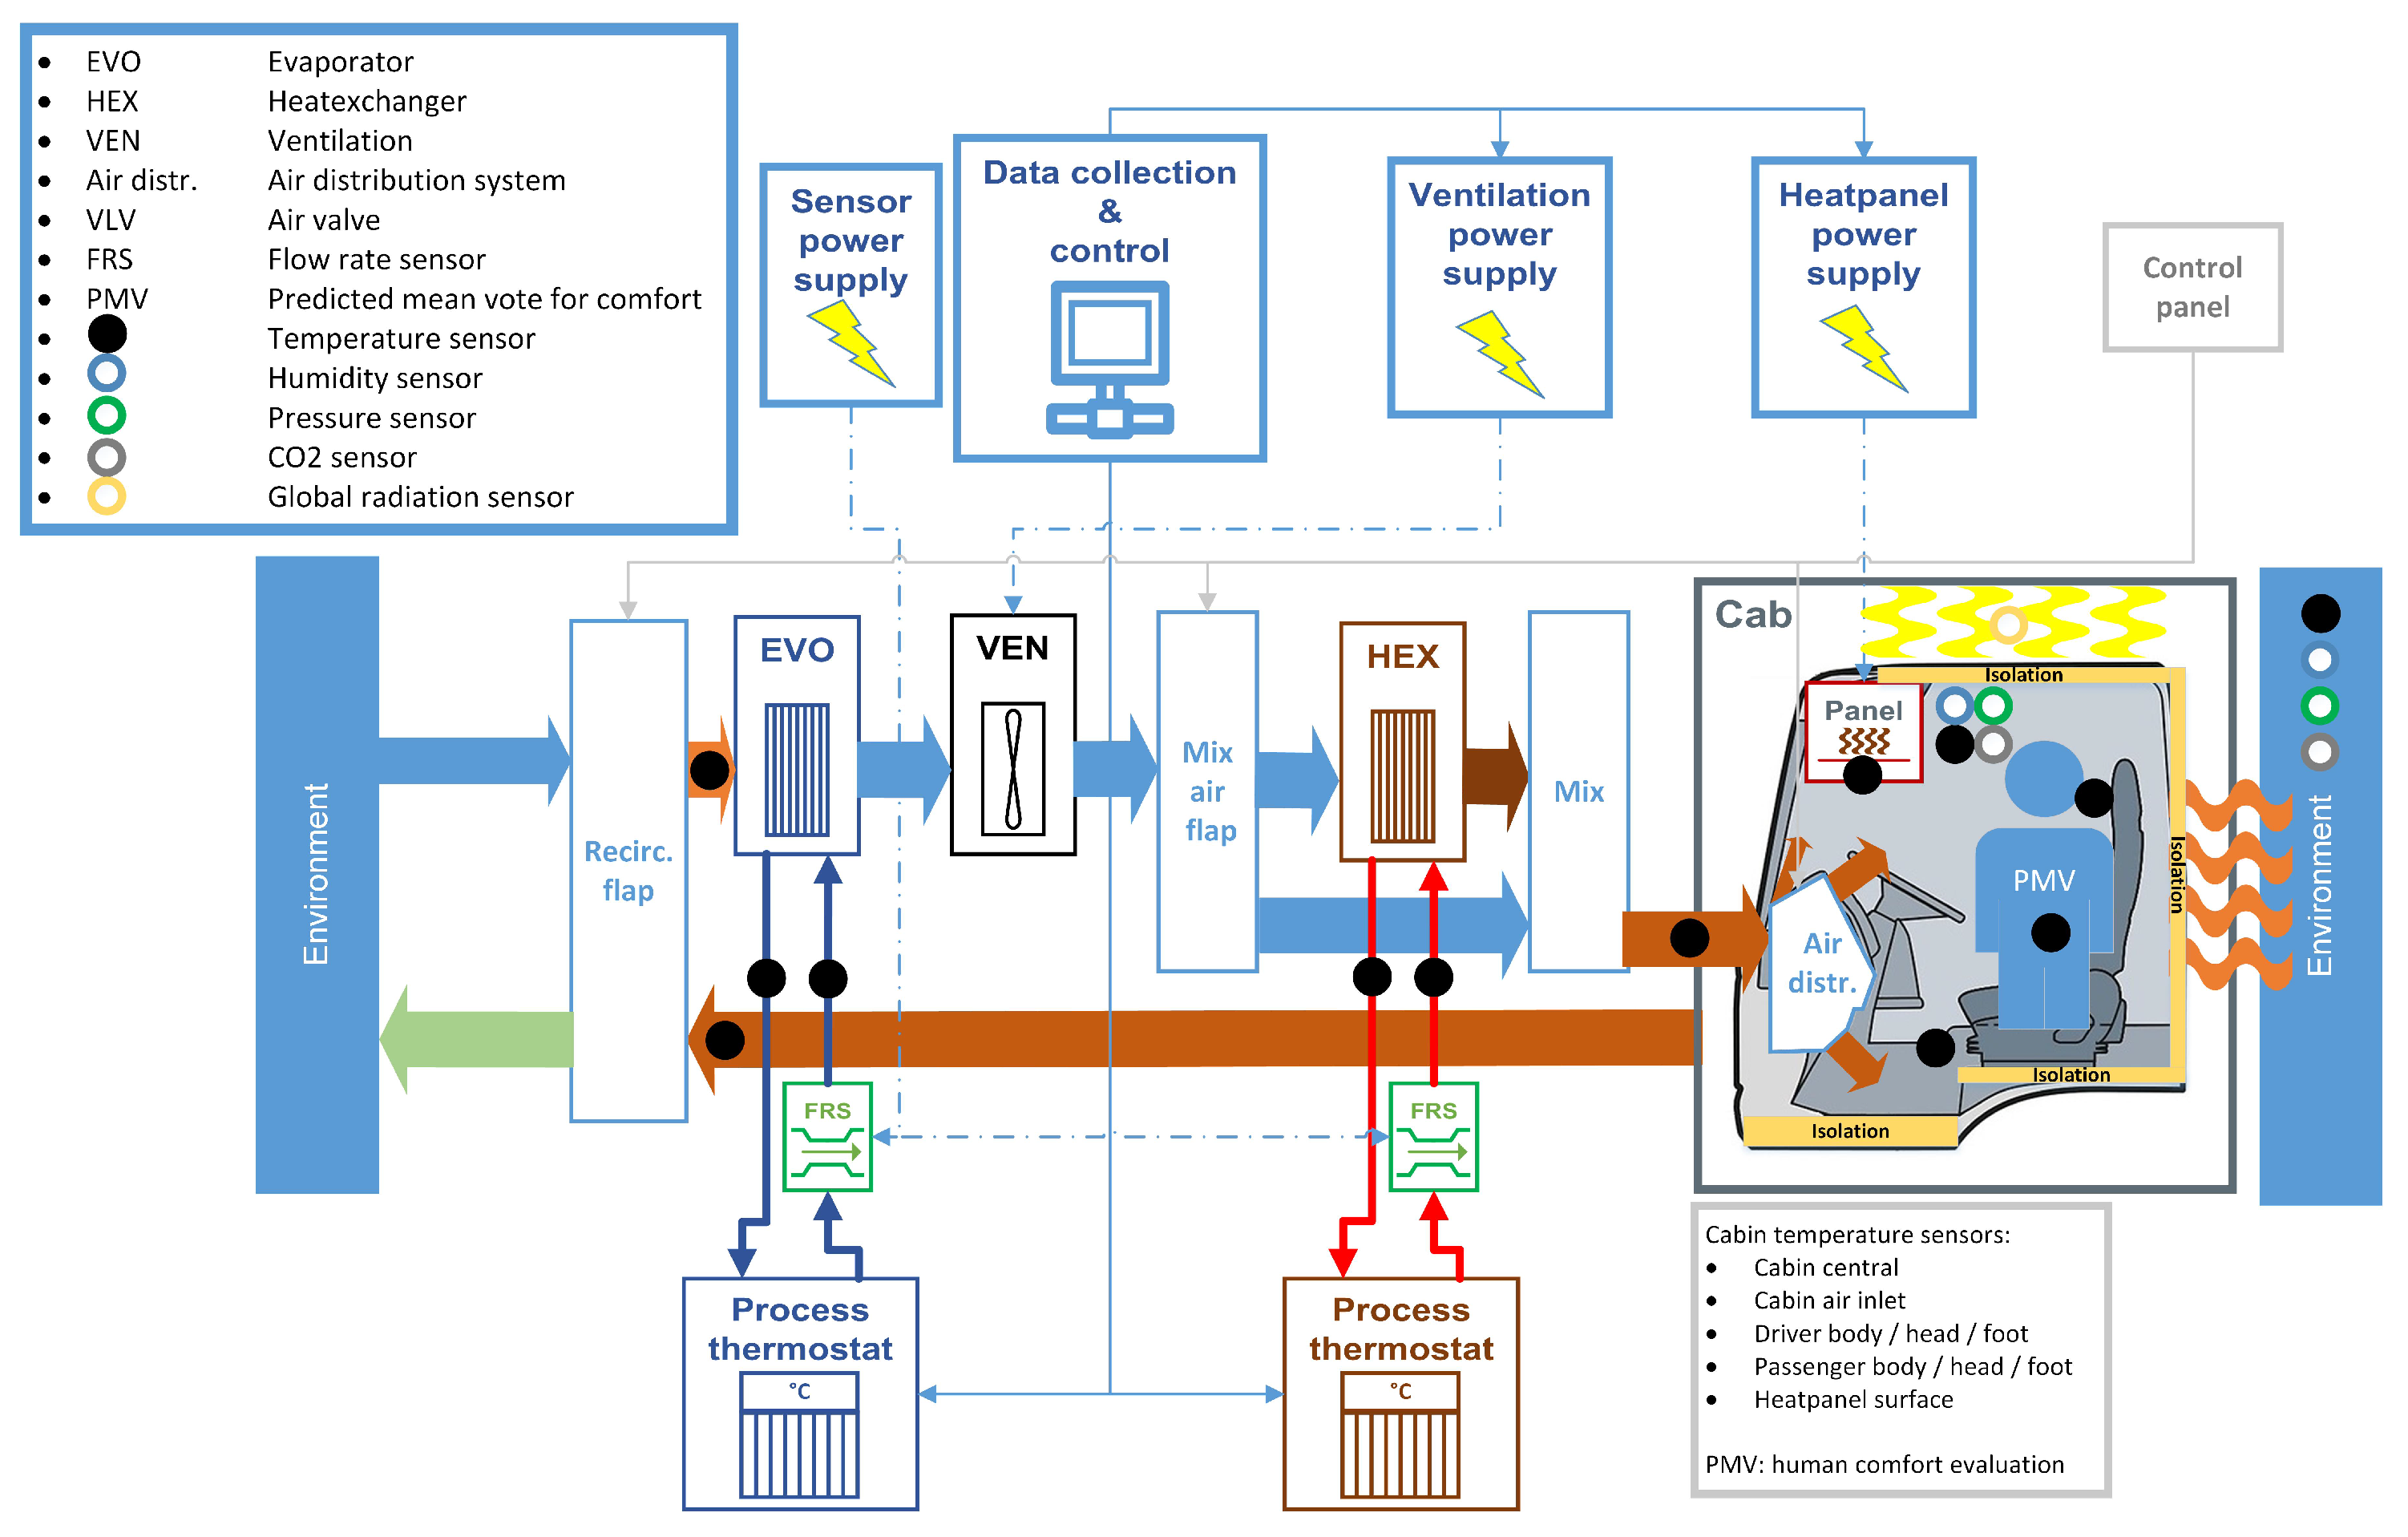
Figure 5.
Simulation model created in Dymola, illustrating system components and interconnections used for thermal system evaluation.
Figure 5.
Simulation model created in Dymola, illustrating system components and interconnections used for thermal system evaluation.
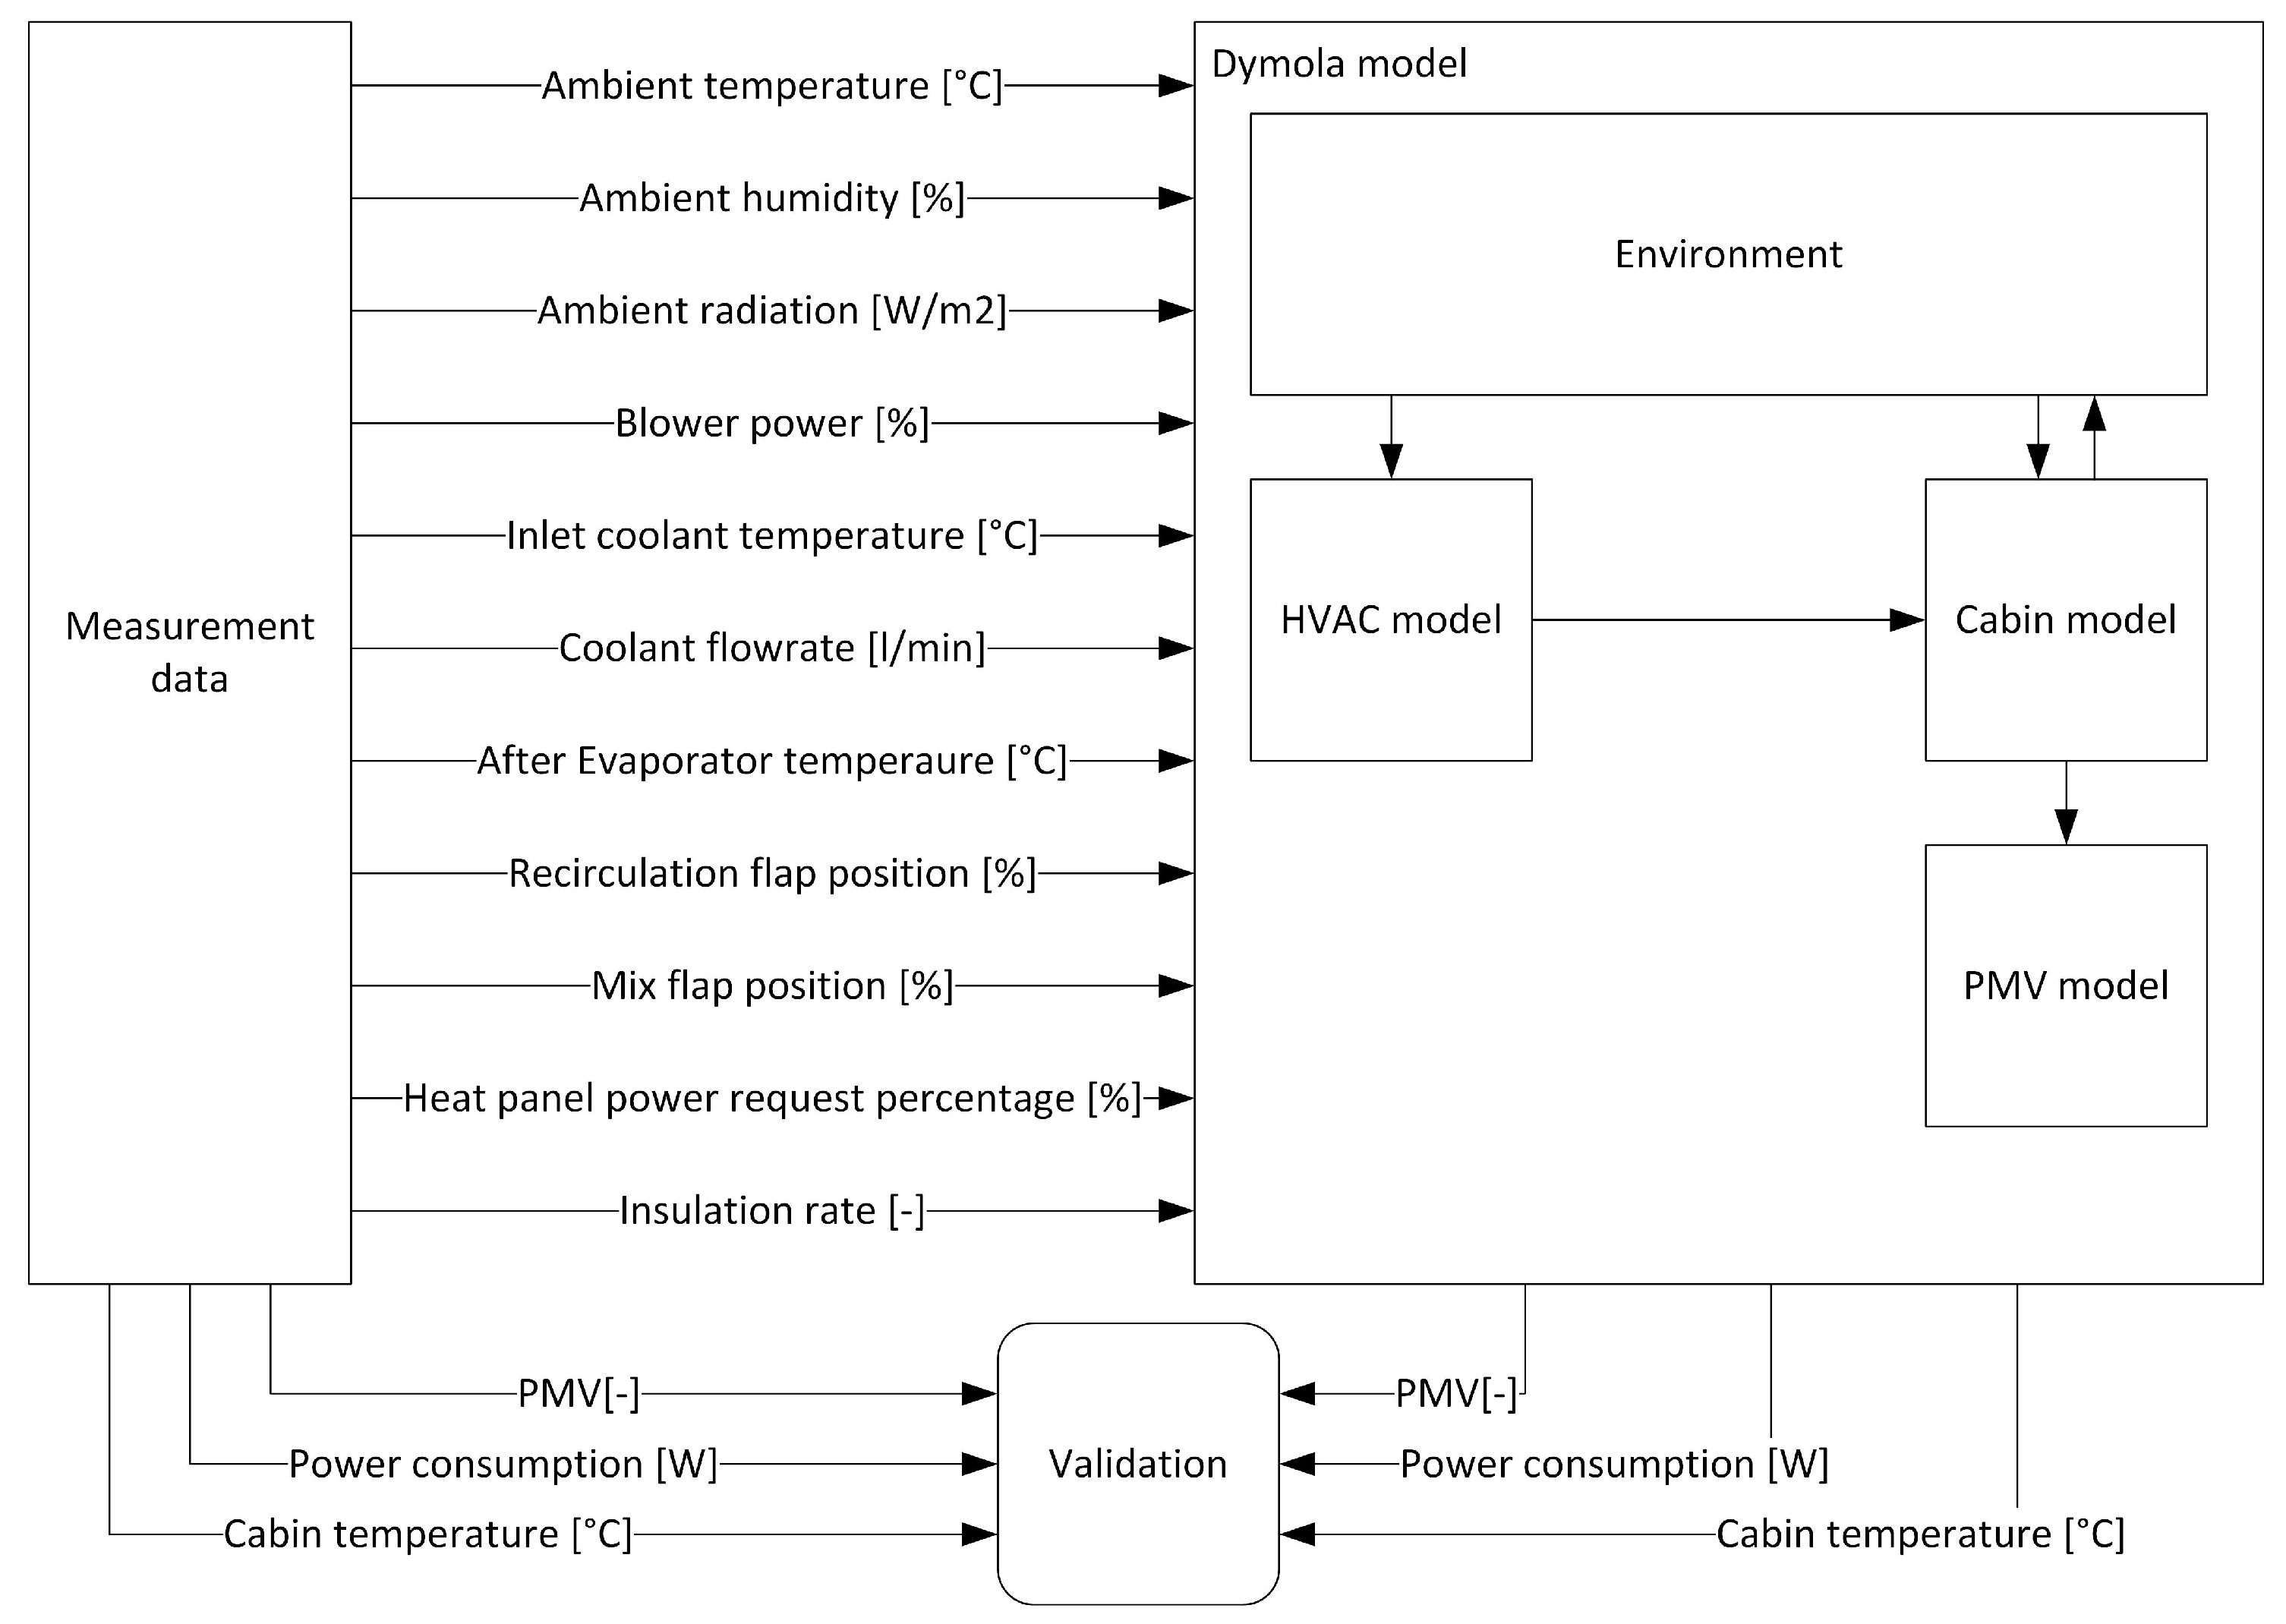
Figure 6.
Linear comfort model used in the simulation, relating surface and air temperatures to PMV.
Figure 6.
Linear comfort model used in the simulation, relating surface and air temperatures to PMV.
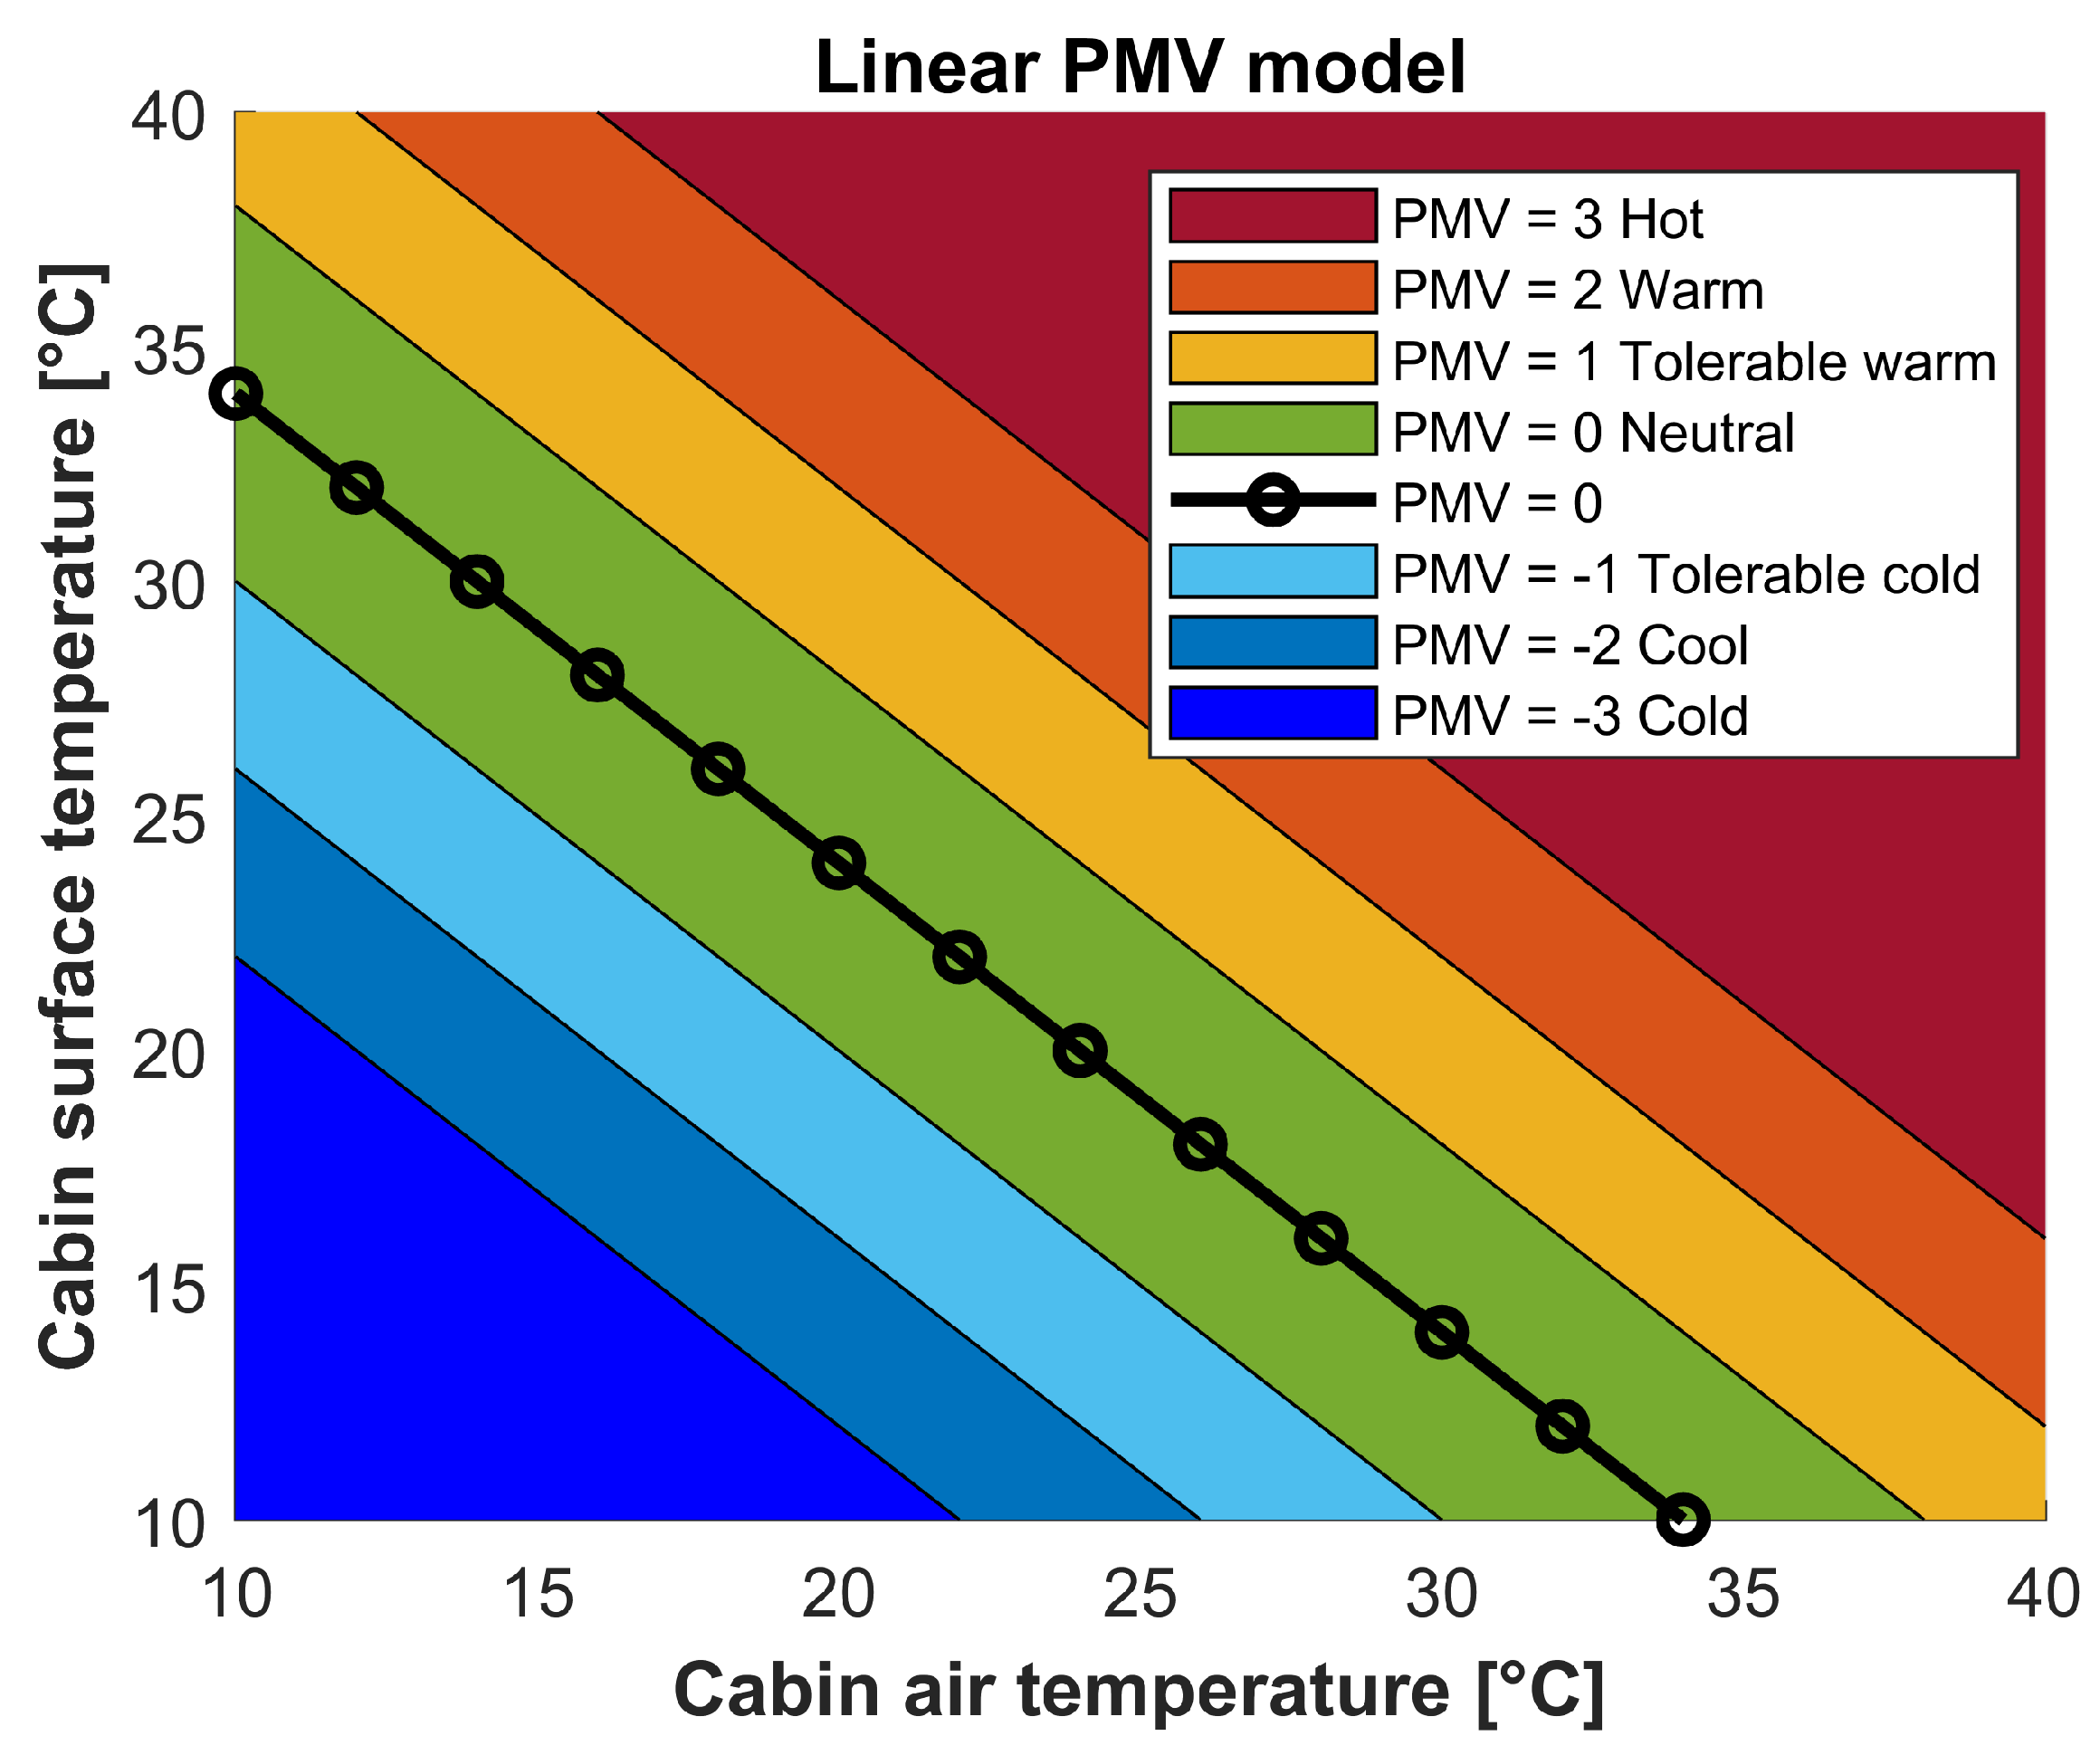
Figure 7.
(a) Power consumption and (b) cabin temperature in the insulated cabin under laboratory conditions with a 20 °C temperature difference. (c) Power consumption and (d) cabin temperature in the original (non-insulated) cabin in the climatic chamber at 0 °C.
Figure 7.
(a) Power consumption and (b) cabin temperature in the insulated cabin under laboratory conditions with a 20 °C temperature difference. (c) Power consumption and (d) cabin temperature in the original (non-insulated) cabin in the climatic chamber at 0 °C.
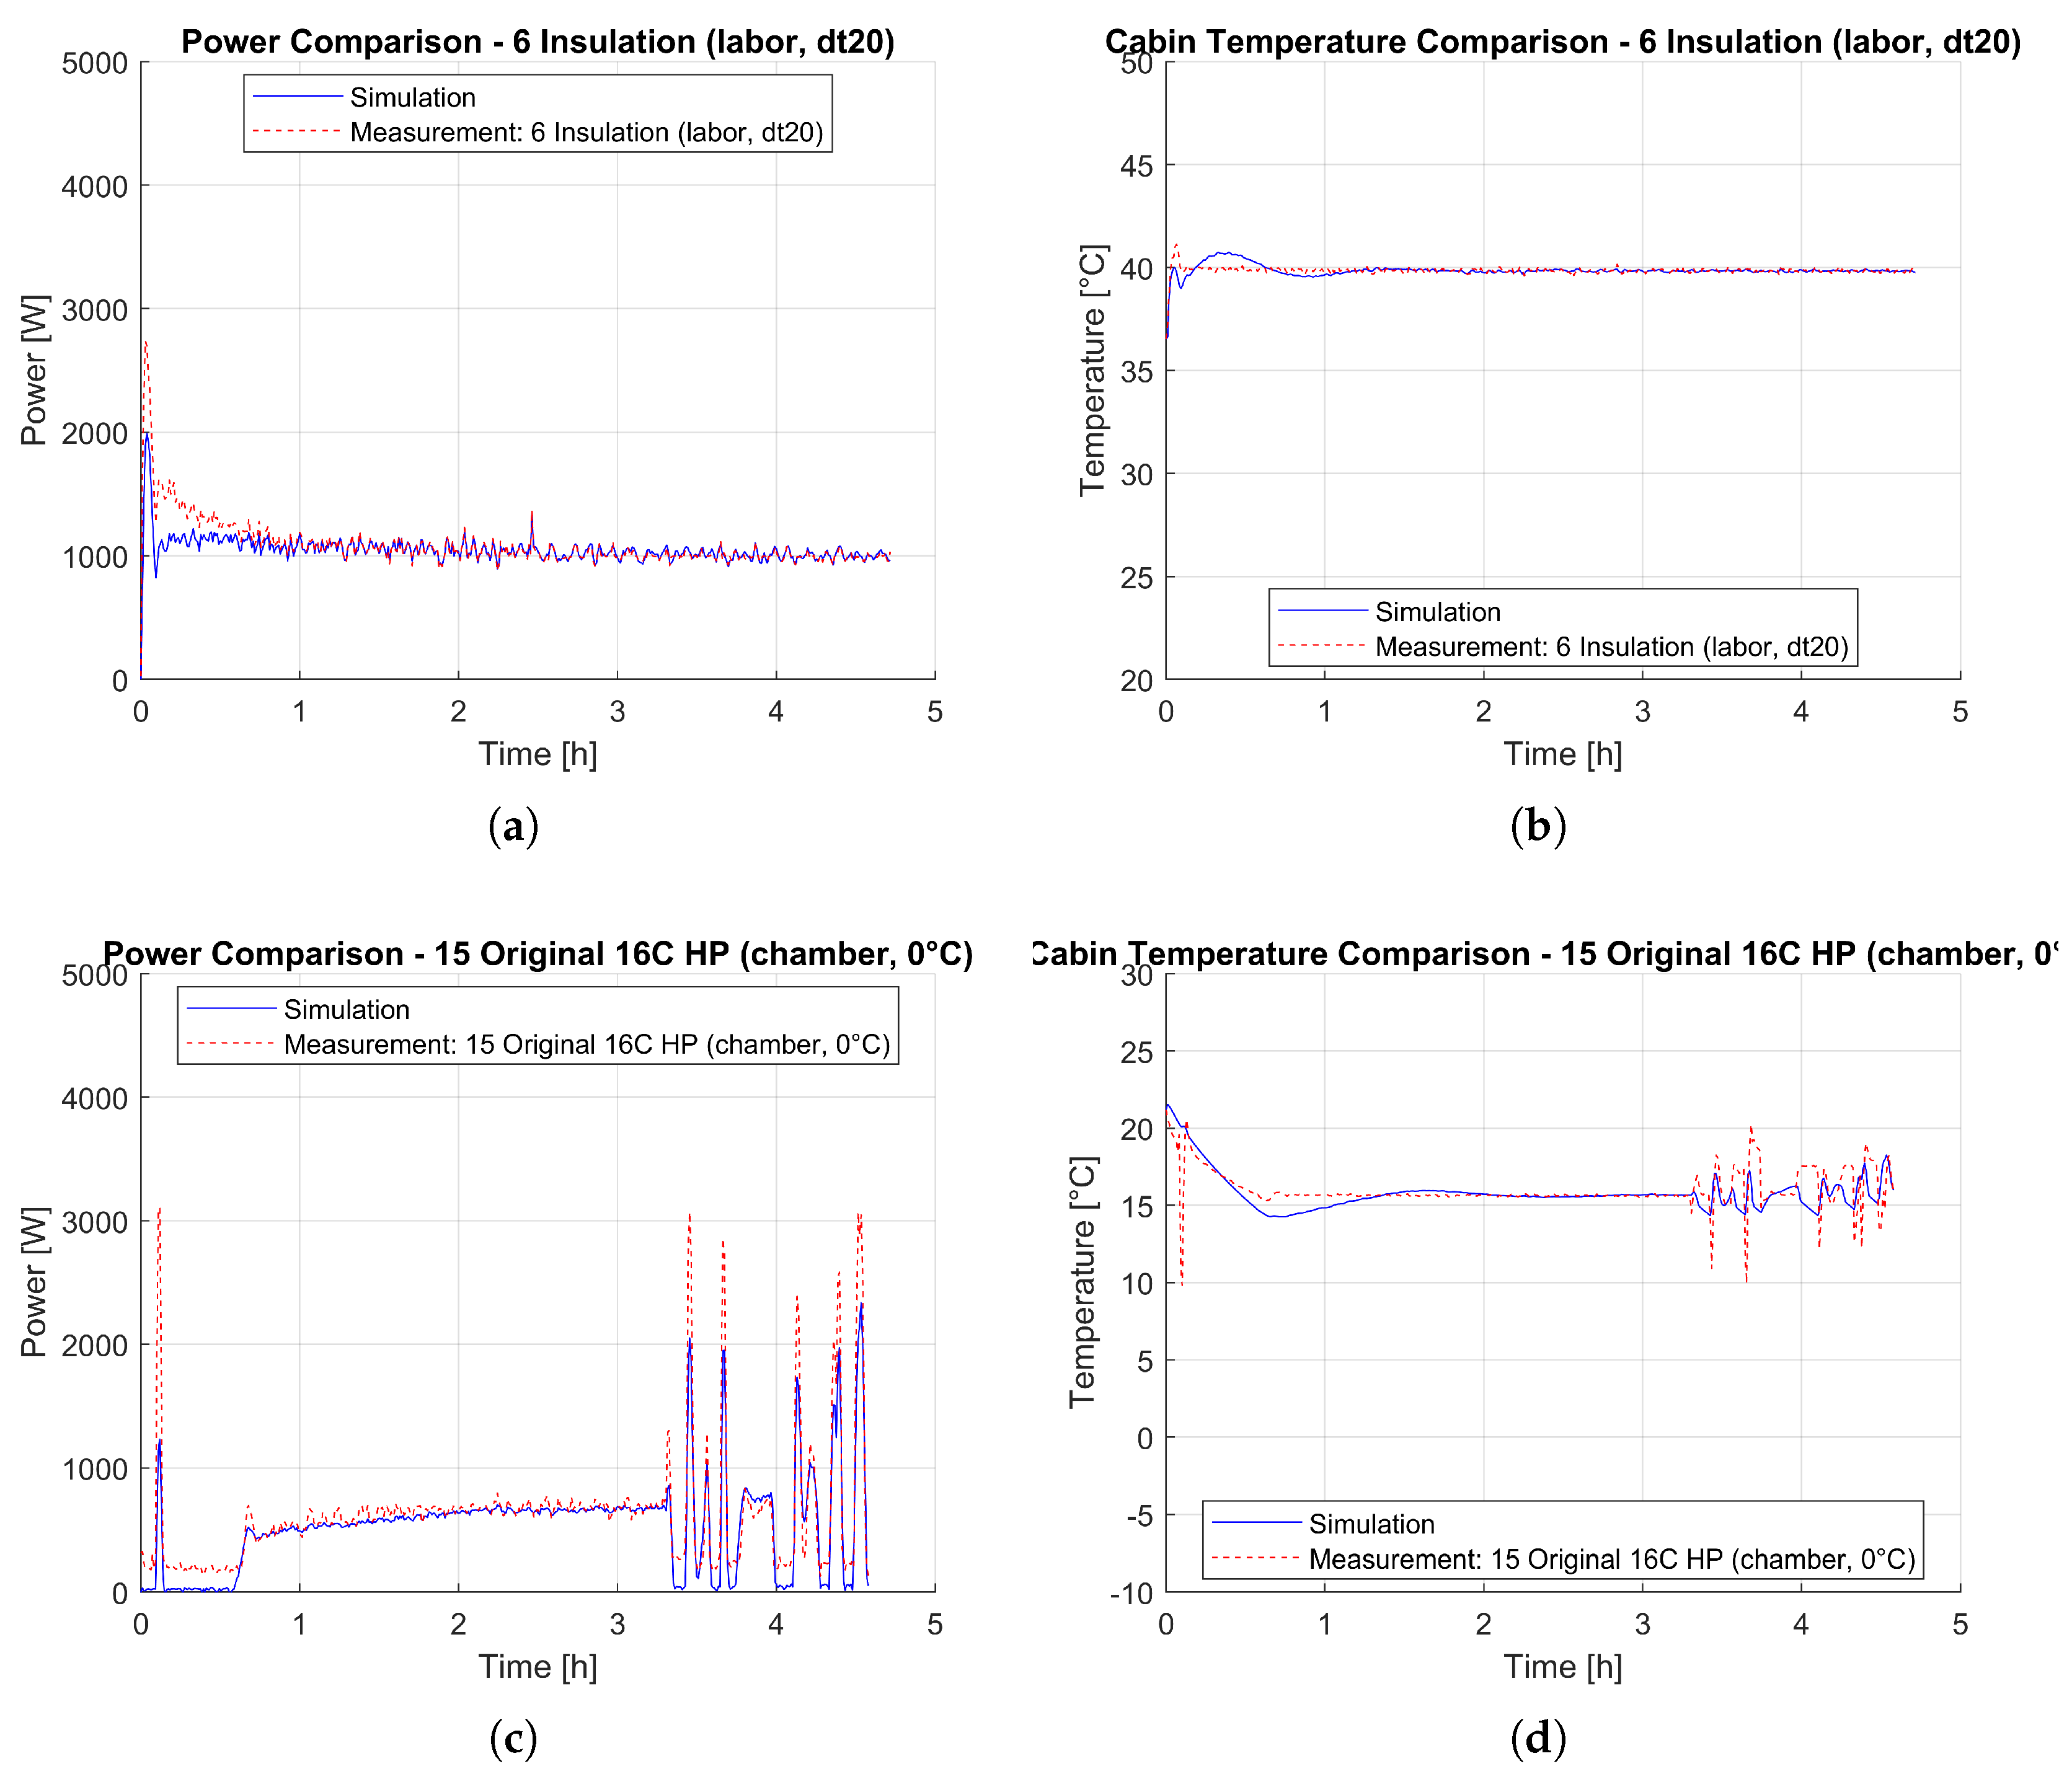
Figure 8.
Energy consumption comparison for different thermal configurations at 0°C and -10°C.
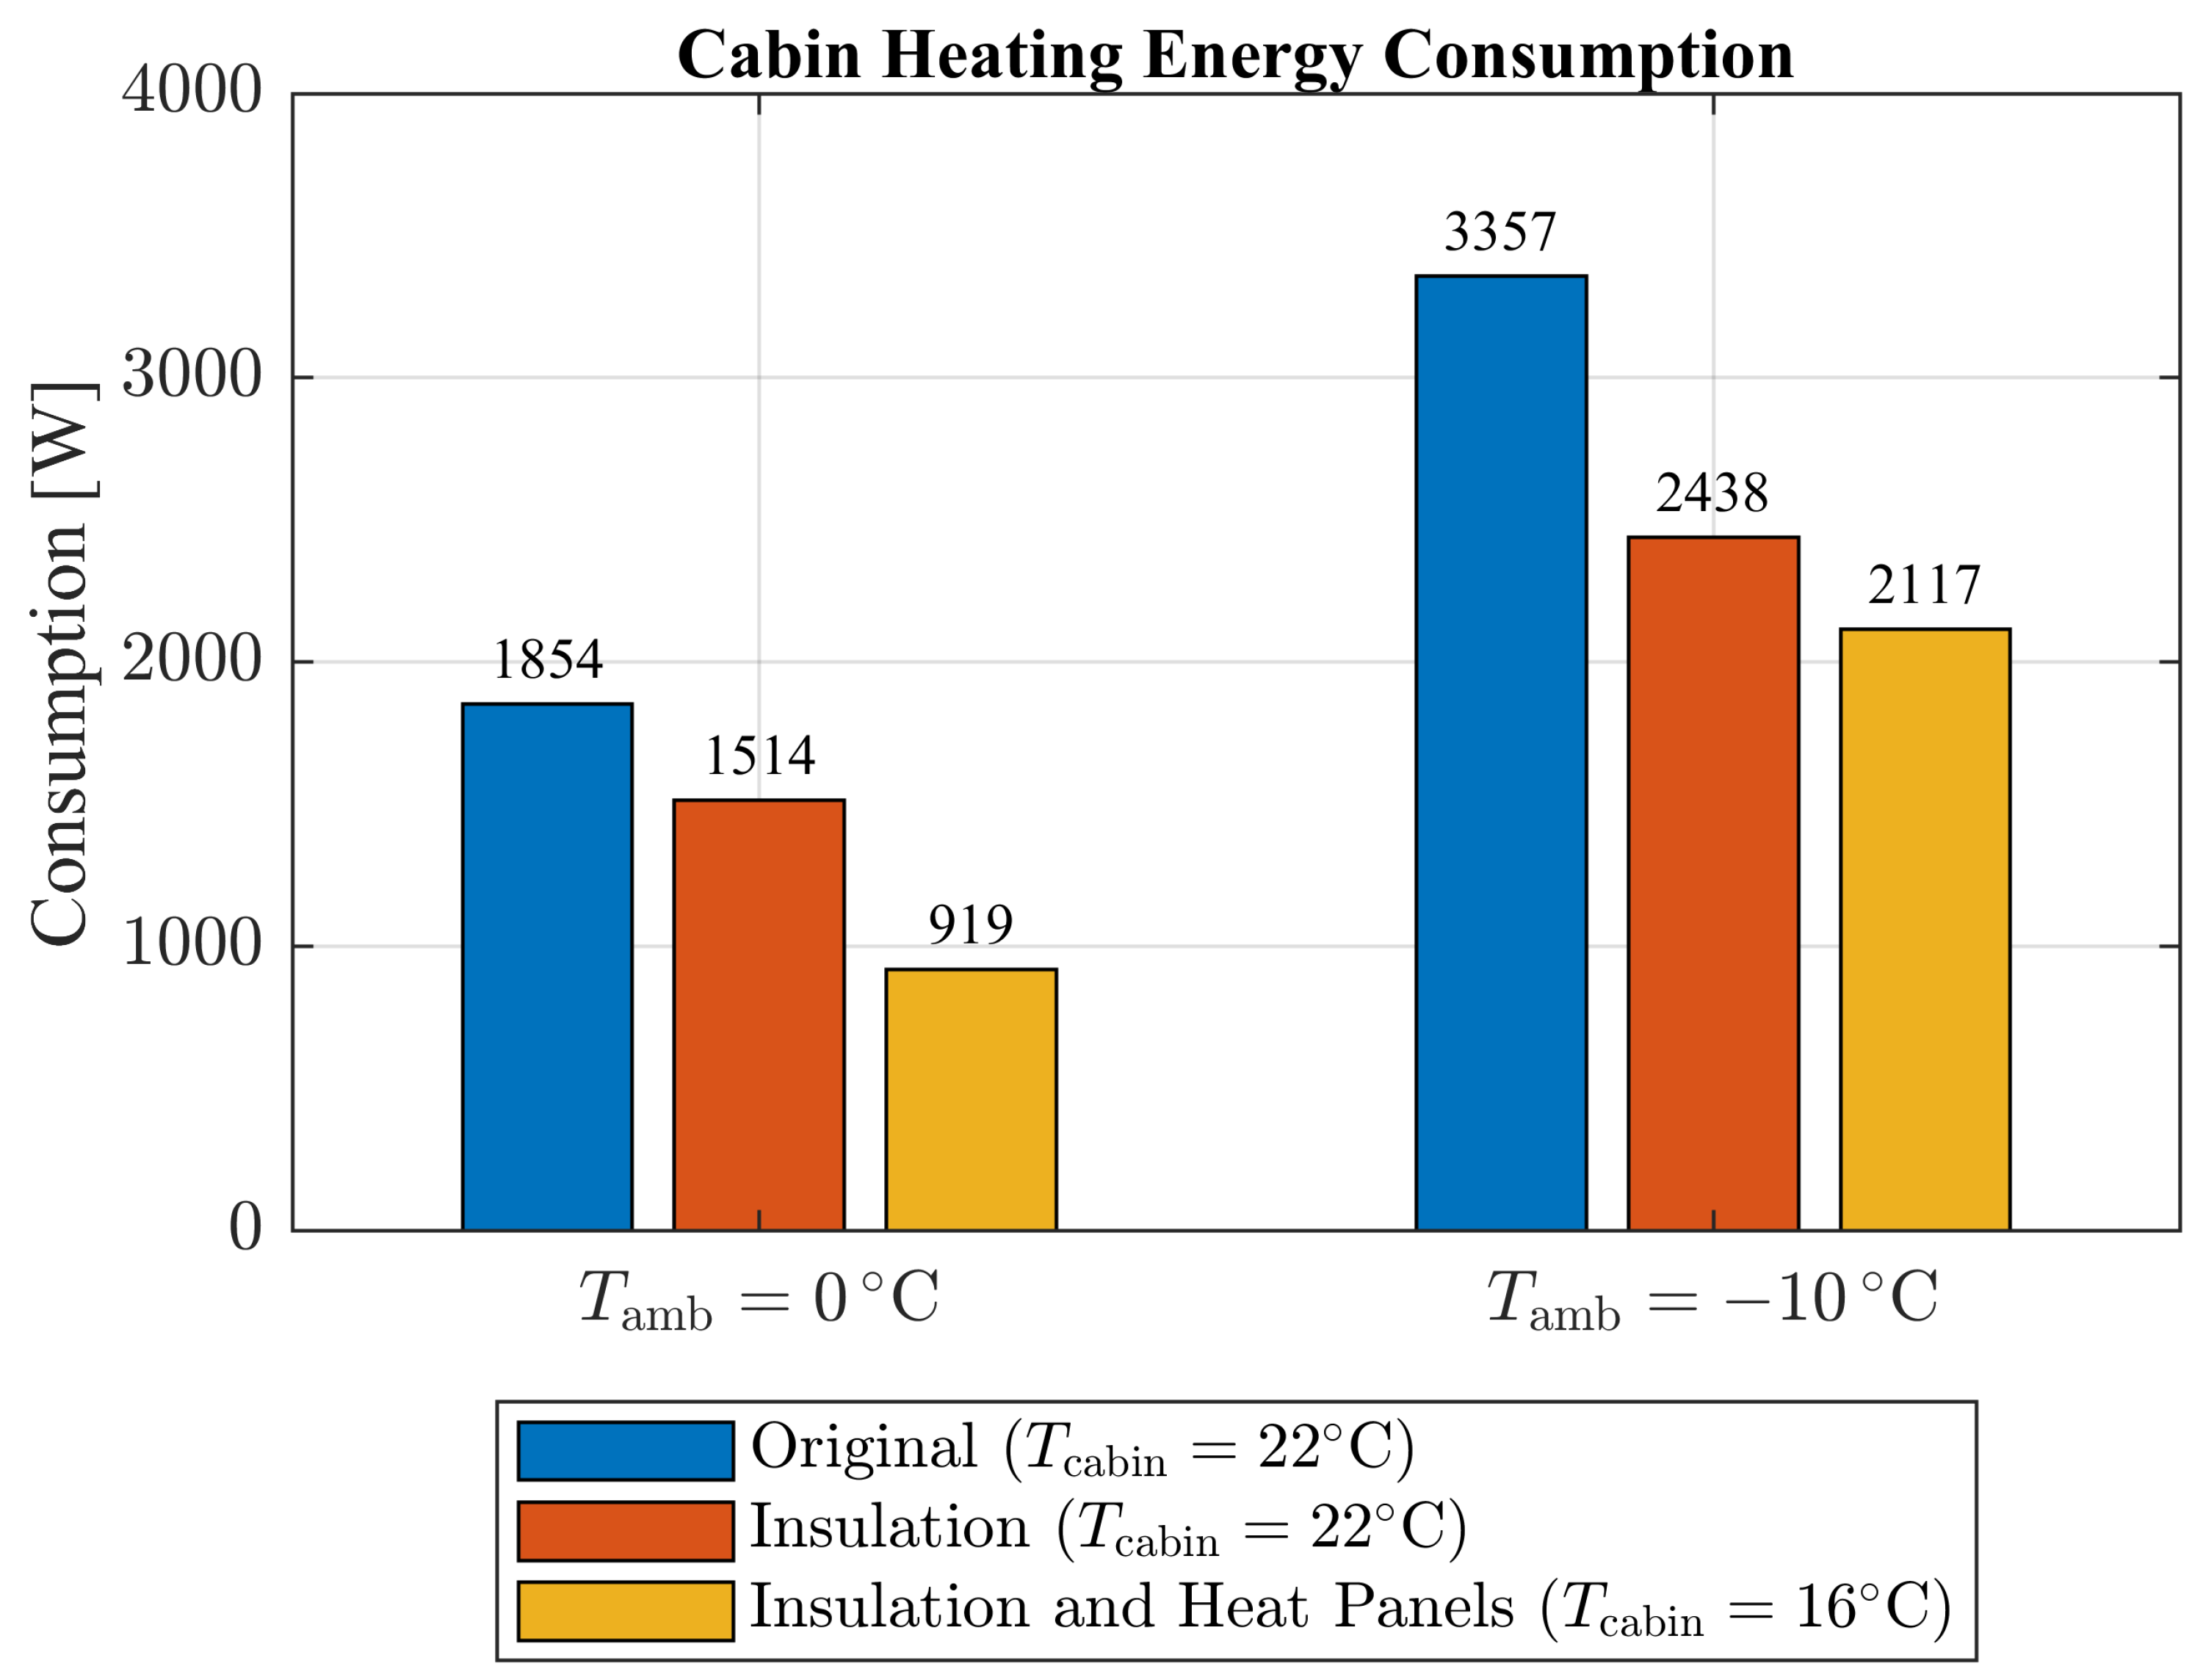
Figure 9.
PMV results at C: PMV values for individual body parts based on user feedback, the whole-body average PMV, and the PMV results from the thermal simulation.
Figure 9.
PMV results at C: PMV values for individual body parts based on user feedback, the whole-body average PMV, and the PMV results from the thermal simulation.
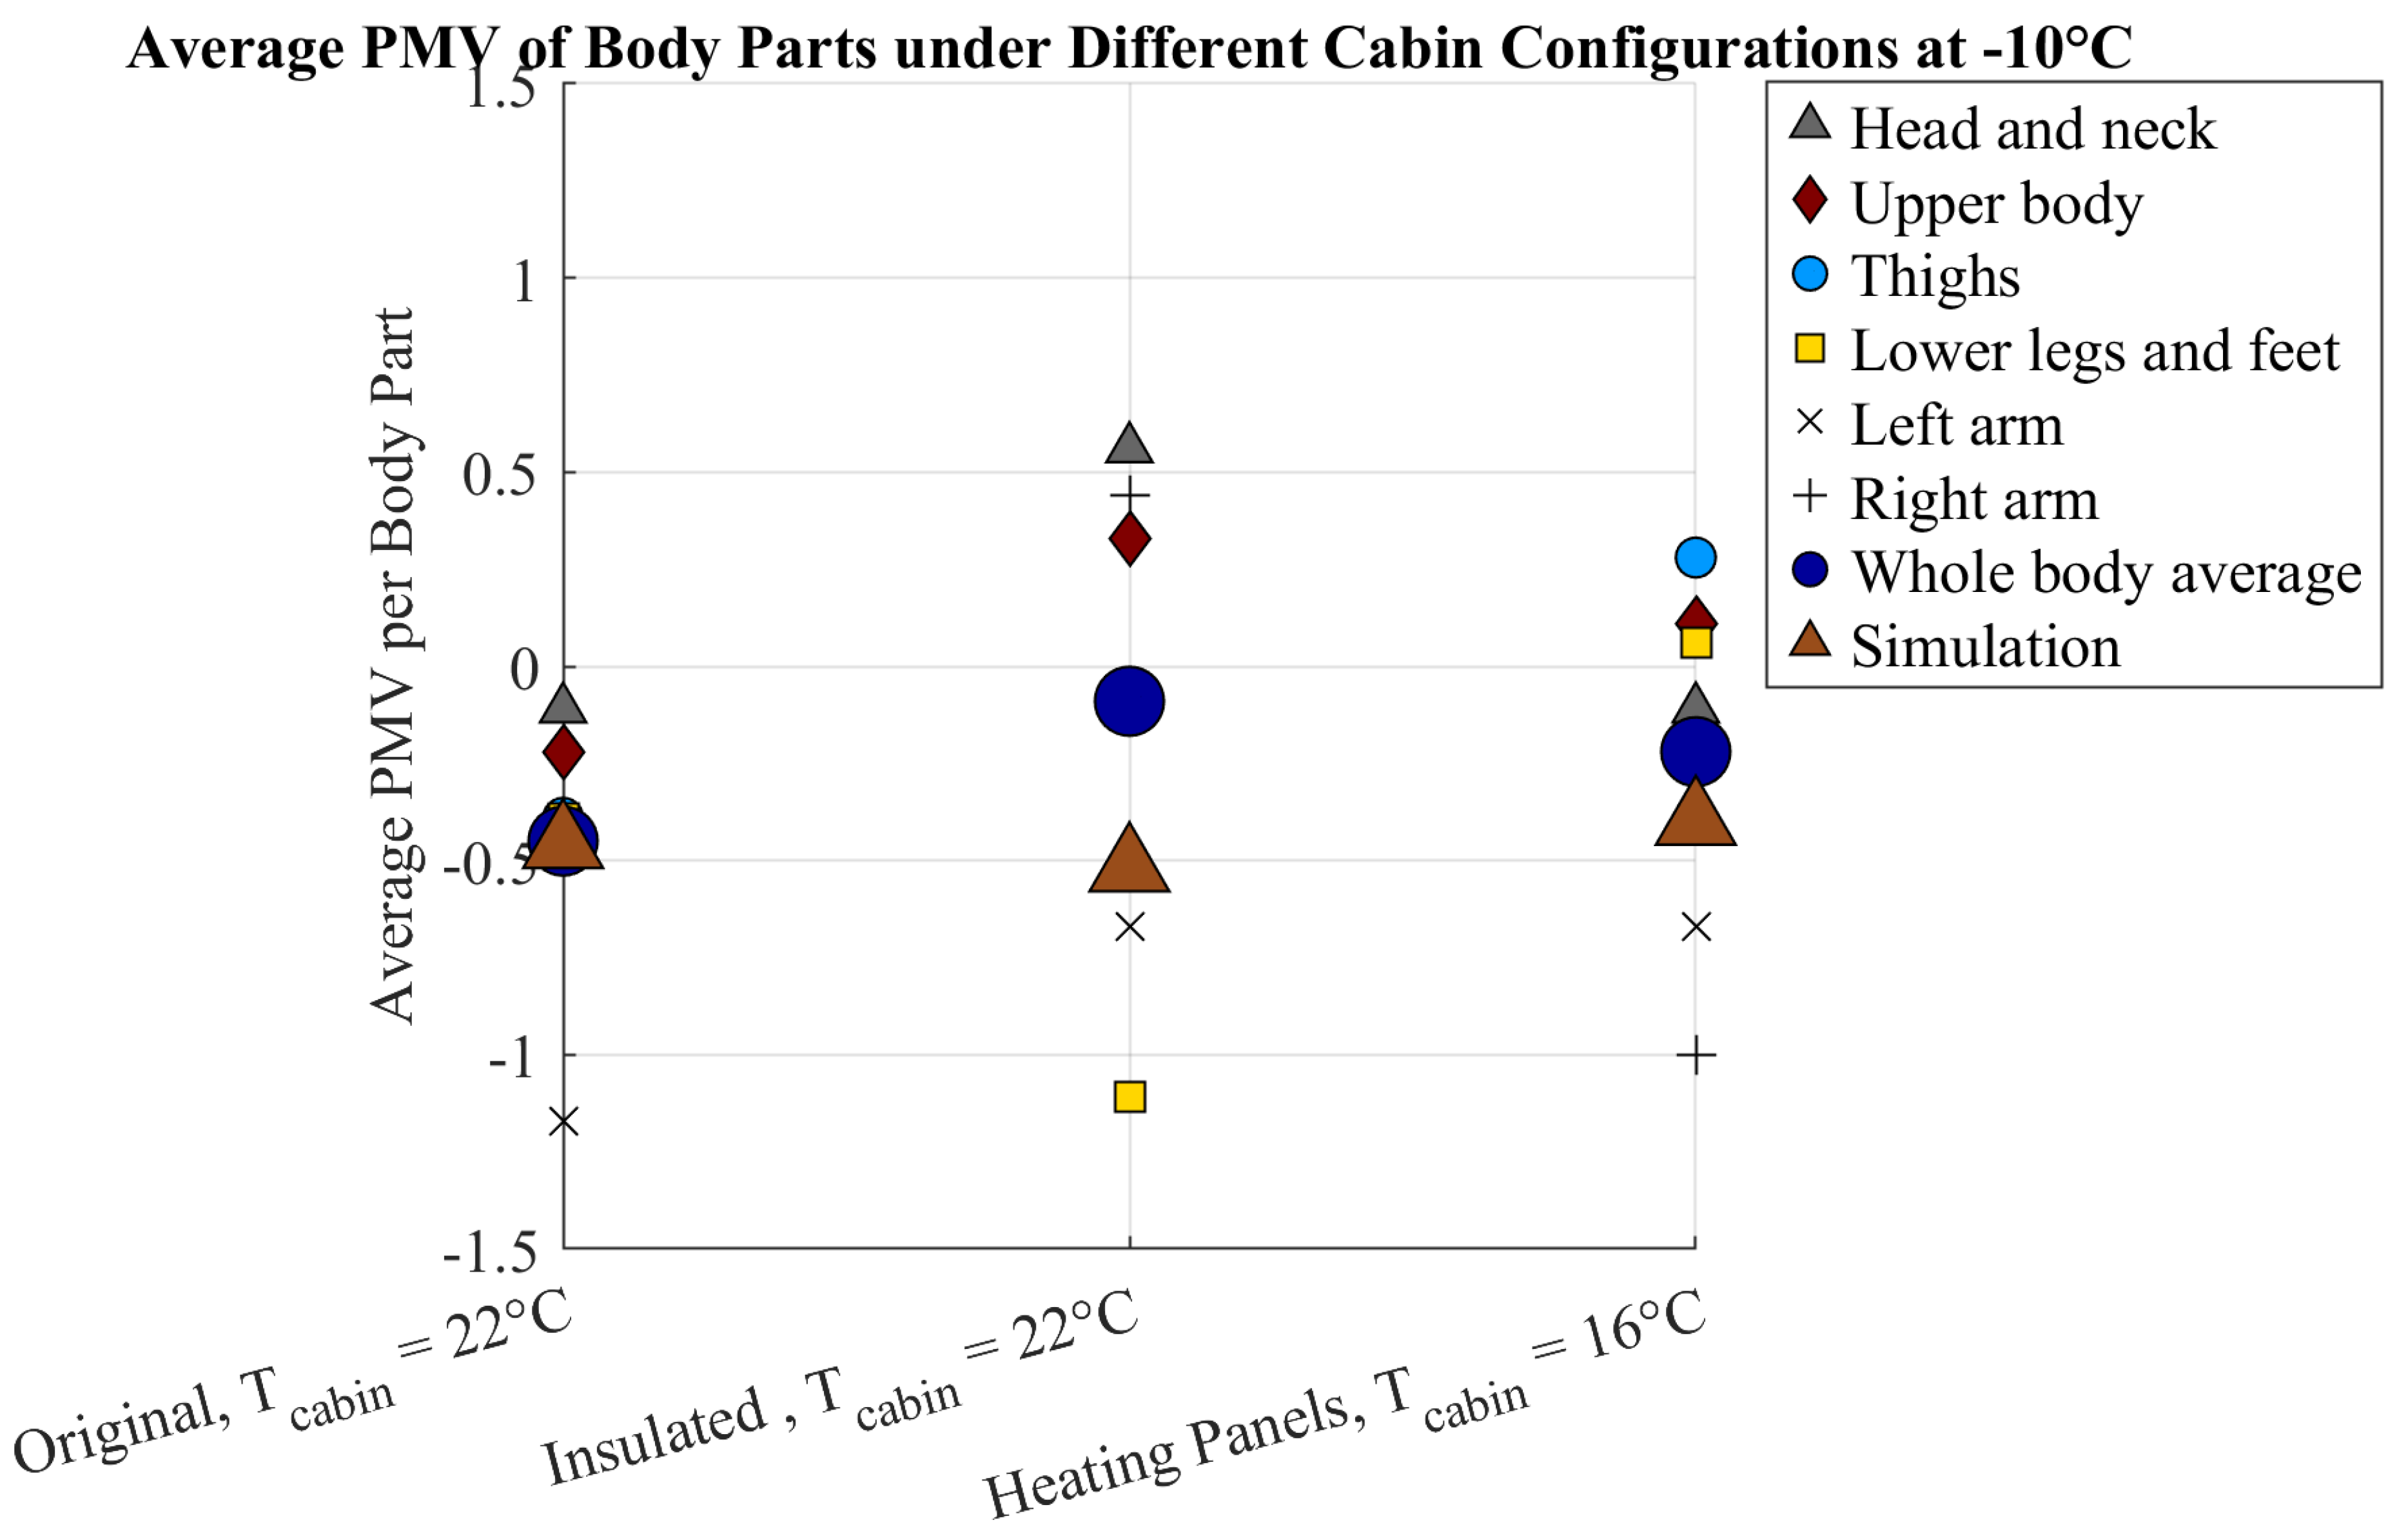
Figure 10.
Comparison of measurement results between laboratory and climatic chamber for both the original and insulated cases.
Figure 10.
Comparison of measurement results between laboratory and climatic chamber for both the original and insulated cases.
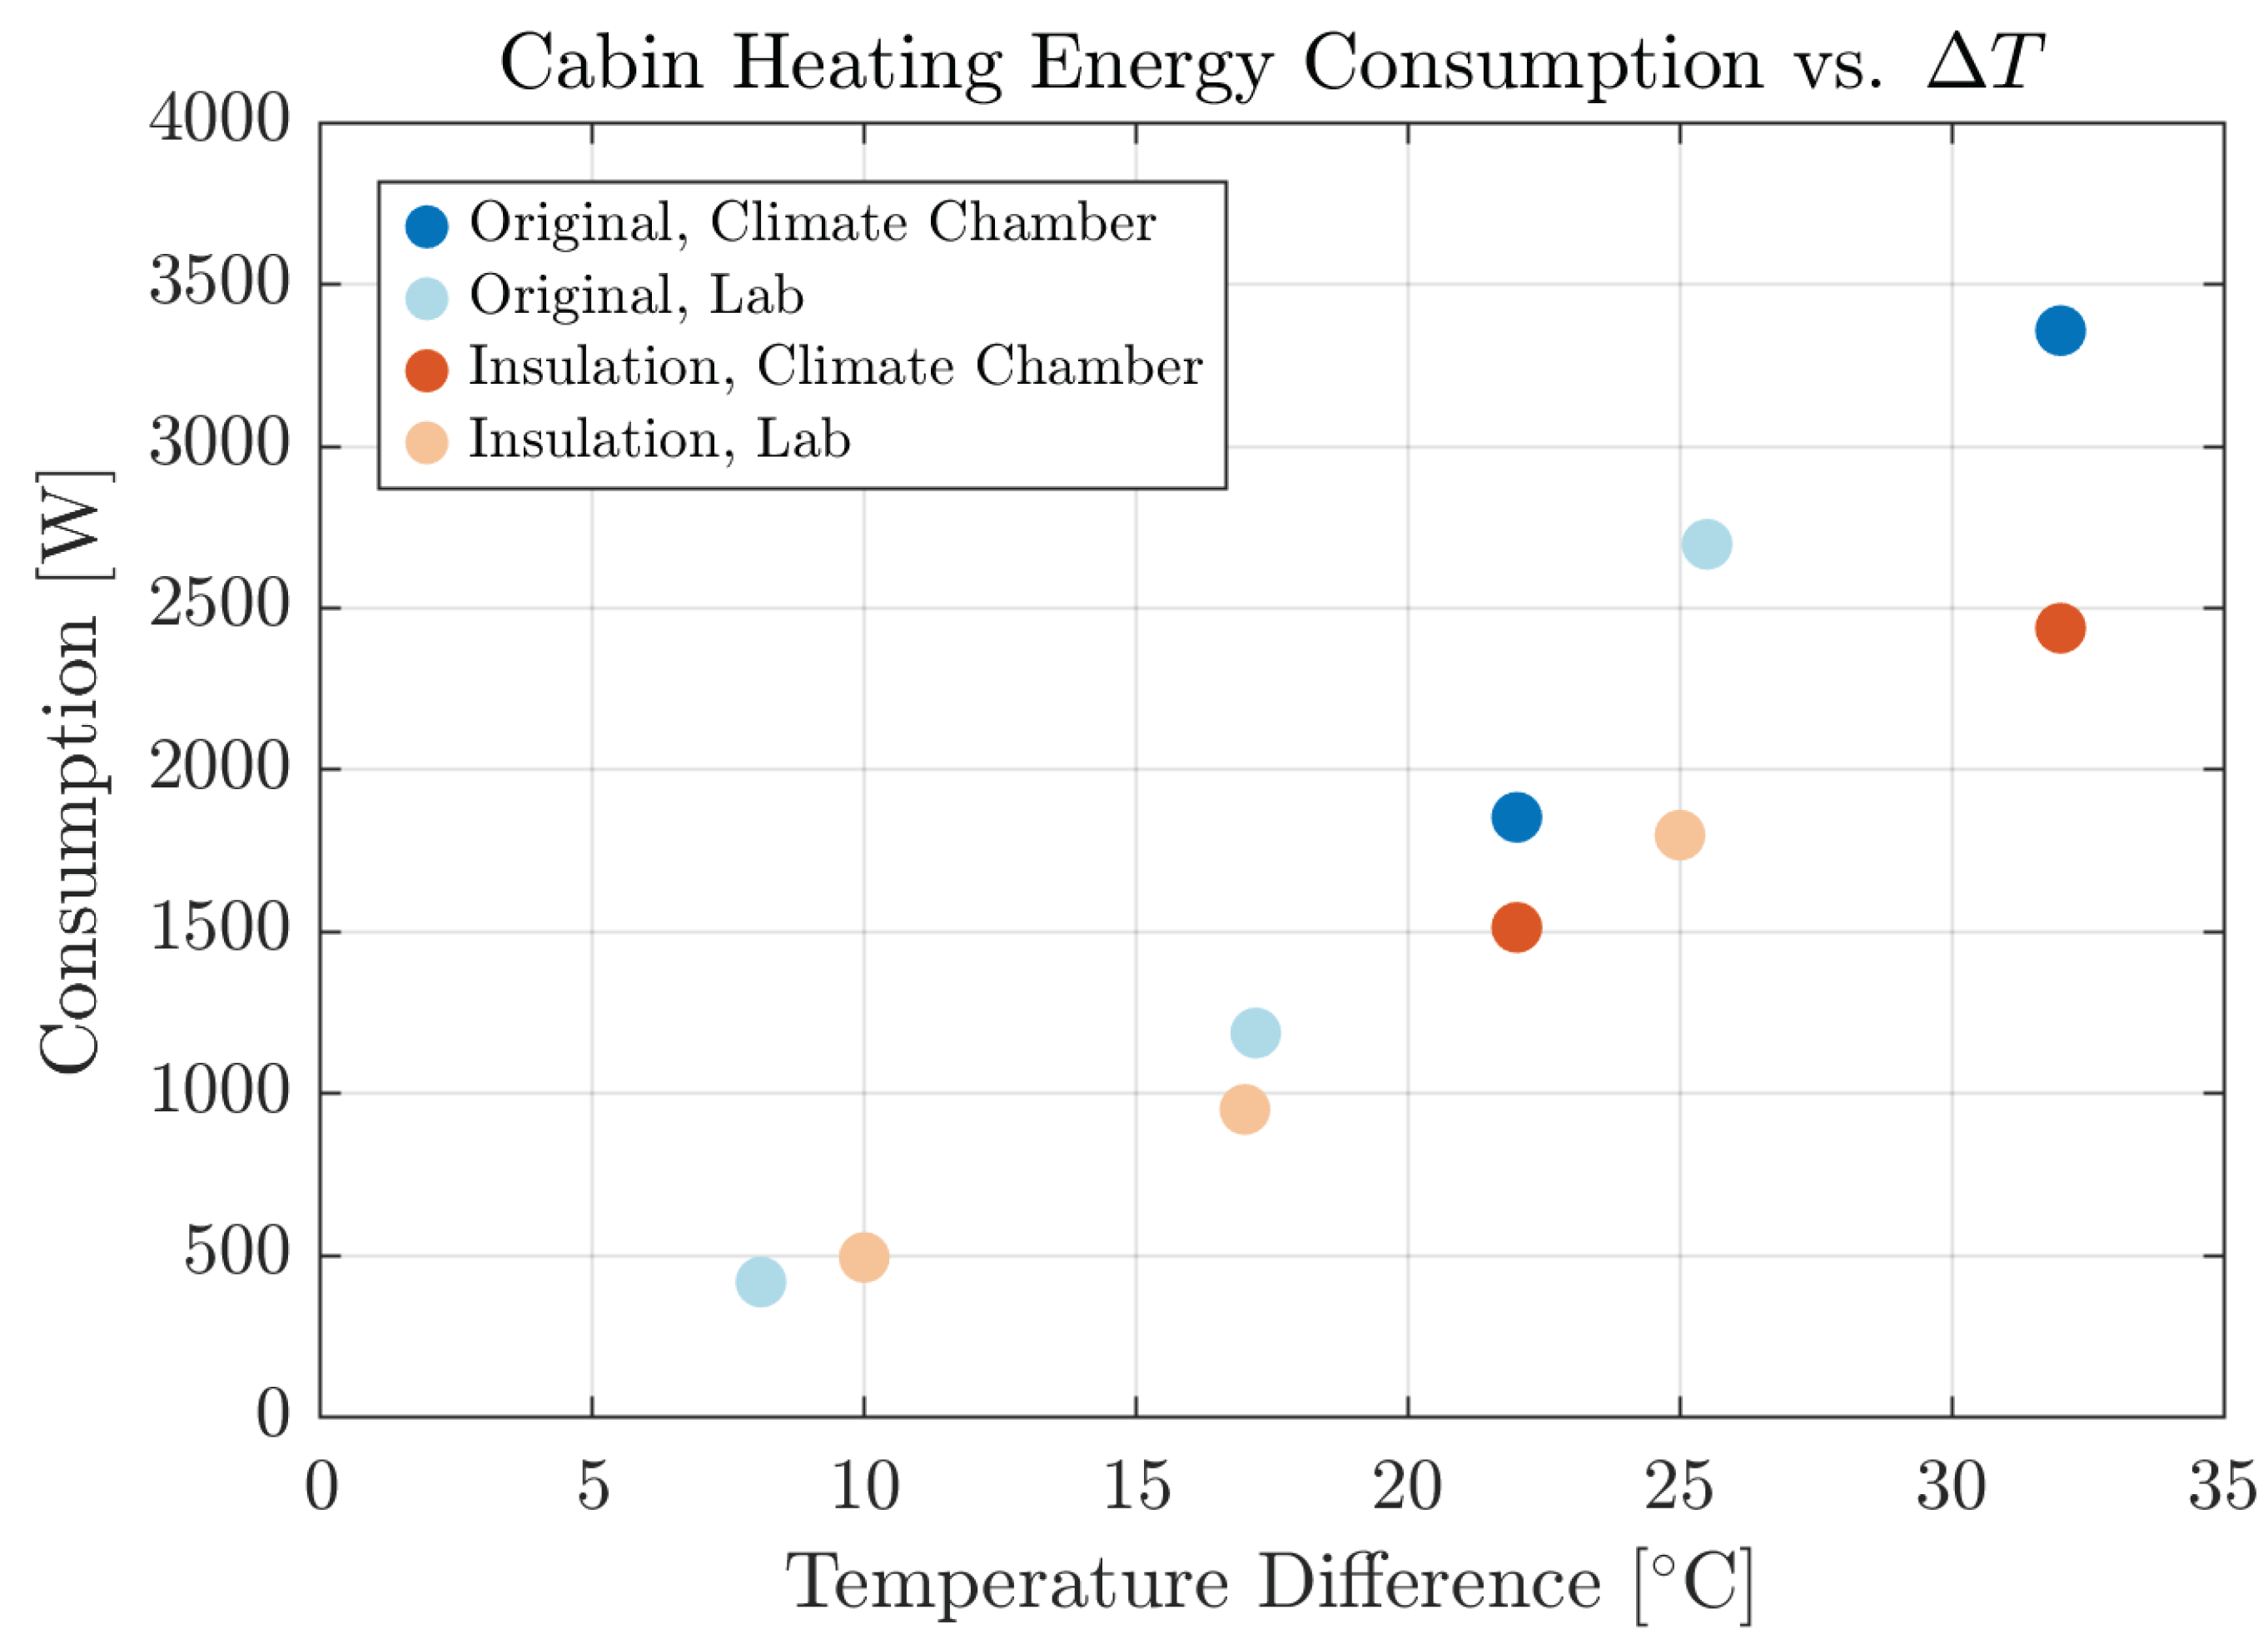

Table 1.
Main cabin characteristics used in the simulations.
| Quantity | Value | Unit |
|---|---|---|
| Surface area of cabin | 12 | m² |
| Volume of cabin | 2.4 | m³ |
| Heat capacity of cabin interior | 65,000 | J/K |
| Heat capacity of cabin walls | 21,000 | J/K |
| Heat capacity of air channels | 1,040 | J/K |
| Heat resistance of cabin walls | 1/310 | K/W |
Disclaimer/Publisher’s Note: The statements, opinions and data contained in all publications are solely those of the individual author(s) and contributor(s) and not of MDPI and/or the editor(s). MDPI and/or the editor(s) disclaim responsibility for any injury to people or property resulting from any ideas, methods, instructions or products referred to in the content. |
© 2025 by the authors. Licensee MDPI, Basel, Switzerland. This article is an open access article distributed under the terms and conditions of the Creative Commons Attribution (CC BY) license (http://creativecommons.org/licenses/by/4.0/).
Copyright: This open access article is published under a Creative Commons CC BY 4.0 license, which permit the free download, distribution, and reuse, provided that the author and preprint are cited in any reuse.


