
Submitted:
28 August 2025
Posted:
29 August 2025
You are already at the latest version
Abstract
Melt-spun PA6/TiO₂ fibers with TiO₂ modified by silane coupling agents KH550 and KH570 at 0, 1.6, and 4 wt% provide a practical testbed to address three fiber-centric gaps: transferable interphase quantification, interphase-resolved indications of compatibility, and a reproducible kinetics–structure–property link. We implement a documented SAXS/DSC/WAXS workflow to partition the polymer into four components on a polymer-only basis—crystal (c), partitioned into crystal-adjacent (RAF-c), interfacial rigid amorphous (RAF-i), and mobile amorphous fraction (MAF). From Porod invariants we obtain the specific interfacial area Sᵥ, and define Γᵢ (polymer-only RAF-i expressed per composite volume). Upon filling, Γi increases while RAF-c decreases, leaving the total RAF approximately conserved. Under identical cooling, DSC shows increases in crystallization peak temperature and half-time, indicating enhanced heterogeneous nucleation together with growth that becomes increasingly diffusion-limited under interphase confinement. At 4 wt% loading, KH570 vs KH550 exhibits higher α-phase orientation but a lower α/γ ratio. At the macroscale, storage modulus and tenacity increase whereas elongation decreases; this trend is consistent with orientation-driven stiffening accompanied by a reduction in the mobile amorphous fraction and stronger interphase constraints on chain mobility. Knitted fabrics achieve a UV protection factor (UPF) of at least 50. Taken together, the SAXS-derived pair (Sv,Γi) provides transferable interphase quantification and, together with WAXS and DSC, yields a reproducible link from interfacial geometry to kinetics, structure, and properties, revealing two limiting regimes—orientation-dominated and phase-fraction-dominated.
Keywords:
PA6/TiO2 fibers
; polymer nanocomposite fibers
; rigid amorphous fraction (RAF)
; interphase
; synchrotron SAXS
; Porod invariant
; WAXS
; Hermans orientation factor
; non-isothermal crystallization
; UPF
1. Introduction
Polyamide-6 (PA6)/TiO2 nanocomposite fibers are compelling for advanced textiles, filtration, and protective garments because they can combine mechanical robustness, thermal stability, and ultraviolet (UV) shielding within a single platform. Beyond overall loading, macroscopic behavior reflects the combined effects of interfacial chemistry and interphase geometry, via constrained chain dynamics that influence non-isothermal crystallization, orientation during drawing, and long-term durability. Within semicrystalline polymers, the rigid amorphous fraction (RAF) provides a physically grounded descriptor for such constrained domains and has long been linked to crystallization pathways and morphology development [1,2,3,4,5,6]. This conceptualization aligns with long-standing SAXS/WAXS and crystallization practice in polyamides, including precedents on non-isothermal kinetics and X-ray-based crystallinity quantification [7,8,9]; and is also consistent with metastable-state interpretations of semicrystalline transitions [10,11,12]. Organic–inorganic hybrid fiber systems therefore provide an effective route to integrate functional synergy with interfacial regulation, and recent reviews have summarized hybridization and interface-engineering strategies for multifunctional fibers [13,14]. These studies underline the centrality of interfacial design, and complementary analyses of TiO2 nanocomposites emphasize that enlarged interfacial area produces a significant polymer fraction with properties distinct from the bulk, yet reproducible quantification remains underdevelopment [15].
The classical three-phase picture crystal(c), RAF, and MAF—remains a powerful framework for semicrystalline polymers [1,2,5,8,16]. In nanocomposites, RAF can be apportioned by origin into RAF-c and RAF-i, enabling interface-resolved analysis of constrained domains without abandoning the three-phase foundation [17]. Four-phase RAF partitioning has been implemented in bulk/thin-film nanocomposites and linked to kinetic/dynamical readouts [18], their application to melt-spun fibers is technically challenging: invariant-based SAXS workflows are stringent, and fiber anisotropy couples Porod terms with α/γ orientation. Precedents exist in thin films and electrospun mats [18,19], but fiber studies rarely adopt geometry-normalized, interphase-resolved descriptors [20,21].
In melt-spun PA6/TiO2 fibers, high TiO2 loadings induce aggregation and weak interfaces, undermining strength and UV gains. Silane surface functionalization mitigates these drawbacks [22,23,24], and polymeric compatibilizers reported for PA6 can further reinforce the interface [25]. Recent PA6-fiber studies have mapped process–property windows, grafting-based thermal/UV stabilization, and interphase tailoring via macromolecular anchoring [26,27,28]. Yet fiber-relevant, reproducible descriptors that capture the geometry and continuity of the interfacial constrained layer under melt-spinning remain limited [15,29]. Against this backdrop, three gaps remain: (i) transferable fiber-scale quantification of the interphase-constrained amorphous fraction is scarce (downsizing amplifies interfacial area and yields fractions distinct from bulk [17,21]); (ii) routine XRD/WAXS, SAXS, DSC, and microscopy assess dispersion and compatibility but rarely provide interphase-resolved, geometry-normalized metrics for the geometry/redistribution of constrained amorphous material [30,31,32,33,34]; and (iii) a reproducible, in-one-study bridge linking non-isothermal crystallization kinetics [35,36,37,38], WAXS-derived orientation and polymorphism, and properties remains uncommon [3,20,39].
Here we address these gaps by extending the classical three-phase picture to a polymer-only four-phase partition (c, RAF-c, RAF-i, MAF). On this basis, SAXS Porod–Debye invariants after crystalline-peak subtraction provide the specific interfacial area [40,41,42], which, combined with DSC crystallinity, yields an interfacial-allocation descriptor; together they are summarized by an effective thickness as interphase-resolved, geometry-normalized readouts at the fiber scale. These descriptors are then linked to non-isothermal crystallization kinetics, WAXS-derived α/γ phase fractions and Hermans orientation [43], and non-isothermal kinetics are evaluated via Nakamura global fitting with complementary Kissinger/KAS closures consistent with ICTAC recommendations [35,36,37,38,44]. Complementary characterizations (mechanical, rheological, SEM, UPF [45], and qualitative coarse-grained MD) and sensitivity checks are summarized in Methods/SI.
2. Materials and Methods
2.1. Materials and Surface Modification
Polyamide 6 (PA6, grade M2400; Xinhui Meida Chemical Co., Ltd., China) from a single production lot was used for all experiments. According to the manufacturer’s specification for grade M2400, this is a fiber-grade, unfilled PA6 suitable for melt processing. Pellets were pre-crystallized in a vacuum rotary drum oven (JM-500ZDGX, Shanghai Jinma Electric) at 90 °C for 18 h, followed by vacuum drying at 135 °C for 18 h immediately prior to processing to minimize residual moisture. Titanium dioxide (TiO2, TA-300, Fuji Titanium, Japan; mean particle size 0.613 μm) was dried at 80 °C for 12 h and stored under nitrogen. The silane coupling agents γ-aminopropyltriethoxysilane (KH550, ≥98%) and γ-methacryloxypropyltrimethoxysilane (KH570, ≥98%) were purchased from Shanghai Chemical Reagent Co., Ltd., and tetrabutyl titanate (TBOT, ≥99%) was supplied by Sinopharm Chemical Reagent Co., Ltd. The mass ratio of silane to TiO2 was fixed at 5 wt%. Antioxidant Irganox 1010 (BASF, 0.1 wt%), release agent HLL-1 (Covestro, 0.05 wt%), and flow modifier Lotader AX8900 (Arkema, 0.2 wt%) were used as processing aids. Solvents included anhydrous ethanol and n-hexane (both ≥99%, Sinopharm Chemical Reagent), as well as deionized water prepared in-house.
For the surface modification of TiO2, 8.00 kg of pre-dried TiO2 powder was dispersed in 25.0 L anhydrous ethanol in a 50 L glass reactor, and 1.60 L TBOT was added. The mixture was stirred at room temperature for 60 min and left standing for 24 h. After filtration and washing with ethanol and deionized water, the product was vacuum dried at 80 °C for 12 h to yield TBOT-coated TiO2 (p-TiO2). For silane modification, 2.32 kg KH550 or KH570 was dissolved in 25.0 L ethanol, and 5.6 L deionized water was slowly added (silane: water: ethanol≈1:2:8). The solution was hydrolyzed at pH 5.5 for 1 h under stirring, then p-TiO2 was gradually added. The suspension was heated to 70 °C and stirred for 4 h, then filtered, washed, and vacuum dried at 80 °C for 12 h to obtain silane-modified TiO2 nanoparticles. Although the silane-to-TiO2 ratio during modification was fixed at 5 wt%, only DLS was performed on the modified powders. The effective surface coupling was then assessed after compounding—FTIR-ATR on PA6/TiO2 masterbatches and Raman/DMA/melt rheology on composite specimens—and is reported in the Results.
2.2. Fiber Preparation and Processing
Dried PA6 and silane-modified TiO2 powders were premixed in specific mass ratios, together with Irganox 1010 (0.1 wt%) and HLL-1 (0.05 wt%) as processing aids. The mixtures were dried at 120 °C under vacuum for 12 h prior to compounding.
Masterbatches containing 50 wt% and 60 wt% TiO2 were prepared using a CTE20 twin-screw extruder (Nanjing KEYA; screw diameter 20 mm, L/D = 25). The barrel temperature profile was set at 235-248 °C, and the screw speed was 350 rpm. The melt was filtered through 100-mesh and 200-mesh screens, extruded through a 2 mm die, water-cooled, pelletized (2-3 mm), and vacuum dried at 110 °C for 6 h. The masterbatches were designated as “PA6–50 %TiO2-KH550/570” and “PA6–60 %TiO2-KH550/570”.
For fiber spinning, the masterbatches were diluted with pure (neat) PA6 to obtain different TiO2 contents. The dried blends were processed on an ABE-25 single-screw extruder (operated at ~60% channel fill, 100 rpm). The temperature zones were set at 280-300 °C, with a 36-hole spinneret (0.15 mm diameter), dual-layer filters (50- and 200-mesh), and side air cooling. The as-spun fibers were collected at 800-1000 m/min and immediately drawn and heat-set using a UDY+DT stretching machine (hot plate 60 °C, hot roll 120 °C to a fixed draw ratio(DR) 3.0. The resulting yarns were named according to coupling agent and their TiO2 content. The samples are named and referenced as shown in Table 1 for direct comparison of TiO2 content, coupling agent, and draw ratio.
2.3. Characterization Techniques
Dynamic Light Scattering (DLS)
Particle size distributions of silane-modified TiO2 powders (KH550 or KH570) were measured using a Nano ZS90 instrument (Malvern Panalytical, UK) equipped with a 633 nm laser at a scattering angle of 90°. Powders were dispersed in absolute ethanol and ultrasonicated for 10 min prior to measurement at 25 ± 0.1 °C. Z-average diameter and polydispersity index (PDI) were obtained from intensity-weighted distributions (n = 3) using the instrument software and in-house scripts. A PDI value below 0.2 was considered indicative of monodispersity, following Bhattacharjee [46].
Filter Pressure Value (FPV) Testing
Fourier-Transform Infrared (FTIR) Spectroscopy
FTIR spectra were recorded using a Nicolet iS10 spectrometer (Thermo Fisher Scientific, USA) over 400–4000 cm−1 at 4 cm−1 resolution in attenuated total reflectance (ATR) mode. Samples were PA6 masterbatches containing unmodified or silane-modified TiO2, dried at 80 °C for 12 h prior to measurement.
Raman Spectroscopy
Raman spectra were collected on a Renishaw inVia Reflex confocal Raman microscope (Renishaw plc., UK) using 532 nm laser excitation (50× objective, spectral range 100–3200 cm−1). Injection-molded specimens were polished to ensure reproducible optical contact.
Scanning Electron Microscopy (SEM) and Energy-Dispersive X-Ray Spectroscopy (EDS)
Fiber microstructure and TiO2 dispersion were examined by SEM (JSM-5600LV, JEOL, Japan) operated at 1–10 kV accelerating voltage. Cross-sections of melt-spun PA6/TiO2 fibers were prepared by cryofracture in liquid nitrogen and sputter-coated with a thin Au layer. Elemental mapping and semi-quantitative analysis of Ti and O were performed using an attached EDS detector under identical imaging conditions. Representative SEM/EDS micrographs from related melt-spun fibers are provided in the Supporting Information (Figure S1).
Differential Scanning Calorimetry (DSC)
DSC is performed on a Pyris-1 (PerkinElmer, USA) using ~5–10 mg specimens sealed in standard aluminum pans. Cooling scans are conducted at β = 5, 10, 20, 30, and 40 °C·min−1 under nitrogen. Heat-flow signals are blank-corrected for TiO2 and normalized to PA6 mass (W g−1). Relative crystallinity Xₜ(t) is obtained by integrating the exotherm between onset and endset determined by the tangent-intercept method, followed by 0–1 normalization. Kinetics are analyzed with the Nakamura framework [37], assuming a rate-independent Avrami-type exponent n and a temperature-dependent rate constant; data from all rates are fitted jointly to Xₜ(t), with the fitting window restricted to X = 0.20–0.60. Apparent activation energies are evaluated by Kissinger [35] using peak temperatures Tₚ (linear regression of ln [β/Tₚ2] versus 1/Tₚ) and by the isoconversional KAS [36,44,47] method at fixed conversions X = 0.30, 0.40, 0.50, and 0.55 (regression of ln [β/Tₓ2] versus 1/Tₓ); temperatures in regressions are expressed in kelvin. Parameters are reported as mean ± standard deviation; uncertainties for Kissinger/KAS follow linear-regression statistics, and uncertainties for the Nakamura fit are derived from the covariance of the global model [38]. Supplementary Information provides the full DSC cooling curves (Figure S3), per-conversion KAS regressions (Figure S4), single-point Kissinger regressions (Figure S5), and a parameter/uncertainty summary (Table S1).
Synchrotron Small- and Wide-Angle X-ray Scattering (SAXS/WAXS)
Unless otherwise noted, all phase fractions φ—φc, φRAF-c, φRAF-i, φMAF, φA—are reported on a polymer-only basis (normalized to the polymer internal volume). The interfacial volume Γᵢ is reported per composite volume as Γᵢ = (1 − φᵢf)·φRAF-i, where φᵢf is the filler volume fraction. This convention is used consistently throughout all figures and tables.
SAXS. Experiments were conducted at the BL16B1 beamline of the Shanghai Synchrotron Radiation Facility (SSRF), Shanghai, China (λ = 0.124 nm) [48]. Fiber bundles were mounted on aluminum frames and equilibrated at 25 °C and 45% RH prior to measurement. Ag behenate was used for calibration. Raw images were reduced in pyFAI [49] with solid-angle and polarization corrections and exposure-scaled air subtraction, followed by azimuthal averaging to obtain I(q) (0.02–0.50 Å−1). Quantitative analysis used the Porod constant B and invariant Q: the specific interfacial area was obtained from Sv = 2π2 B / Q [40,41,42]. Polymer-internal phase fractions were resolved into four components—crystal (φc), rigid amorphous fraction (φRAF–c + φRAF–i), and mobile amorphous fraction (φMAF)—normalized to the polymer internal volume [3]. The interface fraction was defined as Γi = φRAF–i·(1–φf), and the effective interfacial-layer thickness as ti = Γi / Sv, enabling interface-resolved metrics [44,50]. Bragg peaks above q ≈ 0.14 Å−1 were masked/fitted and removed; the Porod invariant was integrated from the residuals over 0.02–0.50 Å−1, and the high-q Porod plateau was estimated on 0.32–0.40 Å−1. Details of masking, baseline handling, residual-based Q integration, and sensitivity analyses are provided in the SI (Figure S6; Tables S2–S3).
WAXS. CeO2 was used for q/geometry calibration. After masking, solid-angle and polarization corrections, and exposure-scaled air subtraction, diffraction images were binned onto a q–χ grid [49]. Hermans orientation factors were evaluated from narrow q-bands centered at the PA6 α(200) (~1.717 Å−1) and γ(200/020) (~2.776 Å−1) reflections. For each band, intensities across Δq were summed (main analysis) to preserve peak-height information, and the normalized I(χ) was converted to f following the Hermans formalism and modern implementations [43,51]. Azimuthal sectors affected by instrumentation (−180° to −160°, 0° to 20°) were excluded. For γ, notch masks were applied near TiO2 lines and a fixed narrow Δq = 0.010–0.012 Å−1 was used. The azimuthal zero was fixed at 90° based on an 85–95° scan. Uncertainties in f(α) and f(γ) were estimated by Monte-Carlo resampling (N = 300) over band center/width and noise injection. Robustness checks using band-wise means (instead of sums), alternative sector exclusions, and baseline options, as well as representative patterns and azimuthal profiles, are provided in Figures S8–S10.
Dynamic Mechanical Analysis (DMA)
DMA was conducted on a Q800 analyzer (TA Instruments, USA) in single-cantilever mode using injection-molded bars (35 × 10 × 2 mm). Temperature sweeps were run from −150 °C to 150 °C at 3 °C·min−1 and 1 Hz frequency after conditioning at 25 °C.
Rotational Rheology
Rotational rheology was performed on a Haake MARS rheometer (Thermo Fisher Scientific, Germany) with 20 mm-diameter, 1 mm-thick disk specimens at 230 °C under nitrogen.
Mechanical Testing
Tensile properties of multifilament yarns were measured using an XL-2 instrument (Shanghai Xinfang, China) according to GB/T 14337-2008. At least 5 specimens per condition were tested, and results are reported as mean ± SD.
Ultraviolet Protection Factor (UPF)
Plain-woven fabric swatches (10 × 10 cm) were conditioned at 25 °C and measured on a fabric ultraviolet transmittance analyzer equipped with an integrating sphere (UV1000F, Labsphere, USA). Spectra were recorded over 250–450 nm; UPF was computed from the 290–400 nm region in accordance with EN 13758-1 [4] and AATCC TM183 [45] using the EN 13758-1:2002 solar irradiance profile. Each specimen was measured at multiple positions using a 3×3 grid across the swatch (n = 4–5 per specimen), and results are reported as the mean UPF together with the 95% one-sided lower confidence bound (UPFLCB). For visualization, log10(UPF) (dimensionless) is used, and samples with UPF ≥ 50 are denoted as 50+. UVA (315–400 nm) and UVB (290–315 nm) transmittance statistics are provided in the Supplementary Information.
Molecular Dynamics (MD) Simulations
A two-stage, two-resolution coarse-grained (CG) workflow is employed to compare how silane coupling affects PA6–TiO2 crystallization. First, atomistic PA6 oligomers are mapped to Martini beads [52,53] (four beads per repeat unit) and equilibrated in GROMACS [54] to yield equilibrium CG melt trajectories via polymerization simulation [55], from which chain statistics were computed. Equilibrated CG melt trajectories were remapped to a one-bead-per-repeat PA6 (CGPA) model and transferred to LAMMPS [56] for production runs. Two TiO2 surface models representing KH550-anchored and KH570-passivated interfaces were implemented [23,24,57]. At the Martini level, standard Martini parameters are used. In the CGPA model, bonded terms (bonds/angles) are obtained by Boltzmann inversion of distributions from the Martini trajectories [58,59,60,61], whereas non-bonded interactions are fitted to interaction-energy–distance data generated by ORCA [62] DLPNO-CCSD(T) [63]/aug-cc-pVTZ [64] scans of two PA6 repeat-unit fragments (inputs prepared by Multiwfn [65]), and are implemented in LAMMPS as lj96/cut. Production runs follow an anneal–cool schedule consistent with processing; simulated heat-flow–temperature curves derived from energy–temperature traces are used to extract crystallization peak temperatures for comparison between the two surfaces. Representative snapshots and the simulated heat-flow traces for both surfaces are provided in the Supplementary Information (Figure S11). The simulations are used qualitatively to contextualize experimental trends rather than to assign quantitative causality.
Generative AI Disclosure
ChatGPT (OpenAI) was used for minor language polishing and to assist in drafting and refining code snippets for data processing and visualization. No data or figures were generated by AI. All AI-assisted outputs were reviewed by the authors.
3. Results
3.1. Nanoparticle Dispersion and Interfacial Chemistry
Anatase TiO2 (TA-300) was surface-modified with KH550 or KH570 silane coupling agents to enhance nanoparticle dispersion and interfacial compatibility in the PA6 matrix. The resulting powders and PA6 masterbatches were examined by DLS, FPV testing, FTIR, Raman spectroscopy, and SEM/EDS (Figure S1, Supporting Information). These complementary techniques yielded both quantitative and qualitative insights into particle size distribution, melt processability, chemical bonding at the polymer–filler interface, and spatial distribution of TiO2 in the matrix. Representative SEM/EDS micrographs from related melt-spun PA6/TiO2 fibers corroborated the dispersion and elemental distribution trends inferred from DLS, FPV, and spectroscopic analyses.
3.1.1. TiO2 Dispersion and Interfacial Modification
Dynamic light scattering (Figure 1a) showed monomodal particle size distributions with narrow peaks for both KH550- and KH570-modified TiO2 powders, indicating uniform dispersion. The Z-average diameters were 359.6 nm for KH550-modified and 455.0 nm for KH570-modified TiO2, with corresponding PDIs of 0.120 and 0.115 (n = 3). Both PDI values were below the 0.2 threshold for monodispersity [46].
FPV testing of PA6/TiO2 masterbatches at 4 wt% and 8 wt% filler loadings yielded values within the acceptable limits defined by BS EN 13900-5:2005. For KH550-modified TiO2, FPVs were 0.60 ± 0.02 bar g−1 (4 wt%) and 0.85 ± 0.02 bar g−1 (8 wt%); for KH570-modified TiO2, values were 0.80 ± 0.02 bar g−1 (4 wt%) and 0.89 ± 0.02 bar g−1 (8 wt%). All tested samples met the melt-filtration criteria for both low and high filler contents.
SEM images of representative melt-spun PA6/TiO2 fibers (Figure S1, Supporting Information) showed that, at 1.8 wt% TiO2, particles were uniformly distributed within the matrix, with core–shell-like features of approximately 200–300 nm. At 4.0 wt%, the particle density increased and occasional local adjacency was observed, but without formation of continuous agglomerated domains. EDS mapping confirmed Ti and O signals in particle-rich zones, consistent with the nominal TiO2 contents.
3.1.2. Chemical Interactions
The FTIR spectra of KH550- and KH570-modified TiO2 masterbatches (60 wt% TiO2 in PA6) exhibited additional absorption bands in the 930–1100 cm−1 region, which were not present in pure PA6 (Figure 2a, shaded area). The normalized absorbance in this region was higher for MB-570 than for MB-550. The inset difference spectra show positive deviations for both modified samples relative to pure PA6 in this range, with a slightly larger deviation for MB-570. A small shift of the amide I band (~1650 cm−1) towards lower wavenumbers was observed for both modified samples.
The Raman spectra (Figure 2b) were measured from injection-molded specimens prepared from the same masterbatch formulations but with different TiO2 loadings: KH550 series (0, 1.6, and 4 wt%) and KH570 series (4 wt%). Enhanced features in the low-frequency region (100–700 cm−1) were observed for all TiO2-containing samples compared with pure PA6. The inset focusing on the amide I region (1600–1700 cm−1) shows increased normalized peak intensities for the modified samples, with the 550–4 wt% specimen exhibiting the highest intensity and a slight shift of the peak position to lower wavenumbers relative to pure PA6. The full Raman spectra are provided in Figure S2 (Supplementary Information).
These spectral differences will be further considered in relation to rigid amorphous fraction (RAF) formation and crystallization behavior in Section 3.2.
3.2. Multi-Scale Structure and Crystallization Behavior
3.2.1. Non-Isothermal Crystallization Kinetics: Avrami–Nakamura and Isoconversional Analyses
The crystallization kinetics of pure PA6 and PA6/TiO2 fiber composites were quantified using a θ*-based Nakamura framework (with activation energies fixed from independent isoconversional analysis) together with an isoconversional KAS approach.
Figure 3a shows the non-isothermal DSC cooling curves at 20 °C·min−1. All samples exhibit a single, well-defined exothermic peak. The peak crystallization temperature (Tₚ) increases from 181.68 °C for pure PA6 to 183.23 °C (1.6 wt% TiO2–KH550), 183.74 °C (4 wt% TiO2–KH550), and 185.97 °C (4 wt% TiO2–KH570). The full width at half maximum (FWHM) narrows from 6.31 °C (pure PA6) to 5.43–5.83 °C for the composites. The crystallization enthalpy (ΔHc), normalized per gram of PA6 after TiO2 blank correction, is 55.10 J·g−1 for pure PA6 and 60.67–61.08 J·g−1 for the composites.
Figure 3b presents the evolution of relative crystallinity (Xₜ) as a function of time at 20 °C·min−1. Using the Nakamura model with isothermal-equivalent time (θ*), global fits were performed over 0.20 ≤ Xₜ ≤ 0.60 with E fixed from the independent isoconversional analysis and rate-specific K0*. The fitted Avrami-type exponents were n = 3.147 (pure PA6), 2.871 (1.6 wt% TiO2–KH550), 2.762 (4 wt% TiO2–KH550), and 2.360 (4 wt% TiO2–KH570), with R2 = 0.864–0.925 across formulations. Despite the stricter cross-rate normalization, the rate scaling remained internally consistent: regression of ln K0* versus ln β gave α̂ ≈ 2.10–2.12 with R2 ≥ 0.989, and the predicted curves closely tracked the experimental Xₜ(t) within the fit window. Uncertainty quantified by nonparametric bootstrap (B = 200) yielded 95% confidence intervals of 3.019–3.273, 2.691–3.107, 2.633–2.900, and 2.277–2.446 for the four samples, respectively; leave-one-rate validation gave n̄ = 3.144, 2.893, 2.765, and 2.356 (Table S6).
Figure 3c summarizes the isoconversional KAS (multi-point) analysis at X = 0.30, 0.40, 0.50, and 0.55 using cooling rates of 5–40 °C·min−1. Within this window, the apparent activation energy Eₐ(X) shows weak conversion dependence; formulation-level medians are 208.2 kJ·mol−1 (pure PA6), 202.9 kJ·mol−1 (1.6 wt% TiO2–KH550), 229.6 kJ·mol−1 (4 wt% TiO2–KH550), and 237.4 kJ·mol−1 (4 wt% TiO2–KH570). Complementary single-point Kissinger regressions are provided in Figure S5, with full-rate DSC curves and per-conversion KAS fits in Figures S3–S4, and parameter uncertainties (95% confidence intervals from bootstrap/leave-one-out) summarized in Table S6.
3.2.2. Rigid Amorphous Fraction (RAF) Quantification
SAXS intensity profiles for four samples—Pure PA6, 550 1.6% (KH-550, 1.6 wt% TiO2), 550 4% (KH-550, 4 wt% TiO2), and 570 4% (KH-570, 4 wt% TiO2)—are shown in Figure 4a. All TiO2-filled samples exhibit higher scattering intensity in the low-q range (0.08–0.14 Å−1) than Pure PA6. In the mid-q range (0.14–0.23 Å−1), the four curves are generally comparable, whereas in the high-q range (0.23–0.50 Å−1) the TiO2-filled samples show slightly lower intensities than pure PA6.
As presented in Figure 4b, Porod invariant integration shows that Q1 (low-q) is consistently higher for all TiO2-filled samples than for Pure PA6. Q2 (mid-q) remains similar across the four samples, while Q3 (high-q) is lower for the TiO2-filled samples. The total Porod invariant (Qtotal) is comparable among all samples, indicating that the redistribution of scattering intensity occurs mainly between the low- and high-q regions.
Using DSC-derived crystalline fractions together with SAXS Porod-invariant analysis, we quantified the phase fractions on a polymer-only basis with a fixed pipeline (Figure 4c): first, the interfacial rigid amorphous fraction (φRAF-i) was obtained by the low-q difference method, ΔQ1 = Q1, Sample − Q1, (pure PA6 constrained to φRAF-i = 0); second, φRAF-i was held fixed while the Q23 band was used to partition the crystal-adjacent RAF (φRAF-c) and the mobile amorphous fraction (φMAF). Point estimates and 95% bootstrap CIs are compiled in SI Table S2 (panels b and e); the Porod-invariant q-bands used are listed in Table S2a; the low-q baselines and increments that determine φRAF-i are in Table S2d; and interfacial metrics (Sv, Γi, ti) are given in Table S2c. Relative to pure PA6, all TiO2-filled samples show a non-zero, formulation-dependent φRAF-i and a compensating decrease in φMAF, whereas φc (DSC) and φRAF-c remain within a similar range. Among the three filled formulations, the total constrained fraction normalized by amorphous content, RAF-tot/φA = (φRAF-c + φRAF-i)/φA, lies within a narrow band and is statistically equivalent under a ±0.01 TOST margin (Figure S7b), while pure PA6 exhibits the expected lower baseline; formulation-level differences in φRAF-i are visualized with 95% CIs in Figure S7a. This partition aligns with literature that distinguishes crystal-induced and interfacial rigid fractions [17].
3.2.3. WAXS analysis of Polymorphs and Orientation
The α/γ crystalline phase ratio (Figure 5a) was 0.205 for pure PA6 and increased to 0.291 for the 550–1.6% TiO2 fiber and 0.360 for the 550–4% TiO2 fiber. In contrast, the 570–4% TiO2 fiber exhibited a sharply reduced value of 0.038. The γ-phase crystallite size, Dγ(rep), varied from 2.28 to 3.42 nm across the samples, with the largest value observed for the 550–4% TiO2 fiber and the smallest for pure PA6 (peak deconvolution shown in Figure S9).
For the Hermans orientation factors (Figure 5b), f(α) spans a wider range (0.41–0.70) compared with f(γ) (0.53–0.59). The highest α-phase orientation was observed in the 570–4 wt% TiO2 fiber (f(α)=0.697), whereas the lowest occurred in the 550–4 wt% TiO2 fiber (f(α)=0.414). By contrast, the γ-phase orientation exhibits only minor differences among the four samples (0.532–0.587). For 570–4 wt%, the α/γ ratio reaches the lowest value, while the Hermans factor of the α(200) reflection remains high and numerically stable (methodological validation in Figure S10, and extraction robustness is summarized in Figure S8). Sensitivity analyses (band width/center and noise injection; Table S3) confirm that the high f(α) observed for 570–4 wt% is robust against WAXS processing choices.
3.3. Macroscopic Functional and Mechanical Performance
3.3.1. Stiffness and Strength
Figure 6a shows the temperature dependence of the storage modulus (E′) for pure PA6 and PA6/TiO2 fibers with different silane modifications. Across the measured range from –150 to 120 °C, all TiO2-filled samples maintained higher E′ values than pure PA6, with the 550–4% sample exhibiting the highest modulus over most of the range. At low temperatures (< –50 °C), E′ values were in the range of 4000–5000 MPa, while in the intermediate region (–50 °C to 50 °C) the modulus decreased progressively with increasing temperature. The 570–4% sample consistently showed lower E′ values compared to other filled samples. The glass transition region was indicated by a rapid modulus drop between approximately 40 °C and 60 °C, consistent with Tg values determined from tan δ measurements (not shown).
Figure 6b summarizes the tensile properties measured at room temperature. Tensile strength ranged from 2.9 cN/dtex for the 550–1.6% sample to 5.6 cN/dtex for the 570–4% sample. Pure PA6 exhibited a strength of 4.2 cN/dtex, while the 550–4% sample reached 4.6 cN/dtex. Elongation at break varied inversely with strength, from 47.9% for 550–1.6% to 13.9% for 570–4%. Pure PA6 showed 42.9% elongation, higher than all samples except 550–1.6%. Overall, high-modulus samples tended to exhibit reduced elongation.
3.3.2. Flowability and UV Protection
The complex viscosity (η*) curves of pure PA6 and TiO2-filled fibers (550–1.6% and 550–4%) are presented in Figure 7a. All samples exhibit typical shear-thinning behavior, where η* remains nearly constant at low angular frequencies and decreases progressively with increasing ω. At ω = 100 rad·s−1, the η* values are approximately 4.10 × 10² Pa·s for pure PA6, 4.14 × 10² Pa·s for the 550–1.6% fiber, and 3.24 × 10² Pa·s for the 550–4% fiber. The differences between samples become more pronounced at higher frequencies, with the 550–4% fiber showing the steepest reduction in viscosity, indicating weakened interfacial restriction and enhanced chain mobility at short time scales.
Figure 7b shows that all TiO2-filled fabrics reach UPF 50+, whereas pure PA6 provides only minimal protection. Pure PA6 (UPF = 5.02; UPF_LCB95% = 4.78; n = 4) is far below the threshold. Among filled samples, 550–1.6% (666.33; 636.86; n = 5) shows the highest protection, followed by 550–4% (246.61; 224.28; n = 4). 570–4% (81.30; 77.41; n = 5) is the lowest among the filled samples yet still exceeds the threshold. The ranking is consistent with UVB transmittance—0.05% (550–1.6%), 0.27% (550–4%), and 1.12% (570–4%)—whereas UVA varies less; full UVA/UVB statistics are listed in Table S5.
3.4. Interface–Structure–Performance Coupling
The Spearman correlation heatmap summarizes monotonic associations among interface (RAF), kinetics (Tp), structure (Xc, α/γ, f(α)), and performance (tenacity σ, elongation ε, log10(UPF)). On a polymer-only basis, Xc and Tp are strongly positively associated (rs = 1.00). Phase composition and orientation are orthogonal in this set: α/γ and f(α) vary in opposite directions across the four specimens. Tenacity is positively associated with Tp and Xc, whereas elongation shows the opposite tendencies. The log10(UPF) metric shows positive associations with RAF and α/γ and weaker associations with Tp/Xc and f(α).
In the KH550 series (0, 1.6, and 4 wt% TiO2), α/γ increases from 0.21 to 0.29 and 0.36, whereas the Hermans factor of the α phase decreases from 0.511 to 0.416 and 0.414. The mechanical responses are non-monotonic: σ is 4.2, 2.9, and 4.6 cN/dtex, and ε is 42.9%, 47.9%, and 14.4%, respectively. The sequence denotes the series evolution; no optimality is implied.
At the same loading (4 wt% TiO2), KH570 shows a higher f(α) (0.697) and a lower α/γ (0.038) than KH550 (f(α) 0.414, α/γ 0.360). Among the three points displayed, KH570 exhibits the highest σ. Marker size encodes σ and color encodes ε; dashed arrows indicate the shift from the reference (Pure PA6).
4. Discussion
Building on the integrated dataset, we rationalize how interfacial chemistry restructures the constrained amorphous fraction (RAF) spatially, how such constraints couple to non-isothermal crystallization and phase orientation, and how these structural states relate to mechanical, rheological, and UV protection metrics, thereby providing transferable interphase quantification and interphase-resolved readouts of dispersion and compatibility. We emphasize mechanism-centric contrasts across silane types and loadings rather than optimality claims. Within this processing window and on a polymer-only basis, two equivalent routes emerge on the common outcome space: a geometry path (KH550 concentration series) and a chemistry-mediated friction path (4 wt% KH570 and KH550), whose endpoints are compactly visualized in Figure 8b,c, closing a reproducible kinetics–structure–property loop.
4.1. Role of Interfacial Chemistry in RAF Redistribution
Spectroscopic and dispersion evidence supports enhanced polymer–filler interactions with silane coupling agents. FTIR and Raman spectra show characteristic Si–O–C/Si–O–Si (and Ti–O–Si shoulder) features consistent with covalent grafting on TiO2 surfaces (Figure 2), in line with prior reports on silane-functionalized titania [22,31]. Complementary DLS, FPV, and SEM analyses demonstrate improved particle dispersion (Figure 1; Figure S1). On a polymer-only basis, SAXS-invariant analysis reveals that the total rigid amorphous fraction (RAF) remains approximately conserved, while its spatial allocation shifts from crystal-adjacent (φRAF-c) to filler-proximal (φRAF-i) zones (Figure 4c; Table S2b). This redistribution highlights that interfacial chemistry primarily relocates constrained amorphous domains rather than enlarging their overall amount, consistent with the established three-phase view of semicrystalline polymers [1,2,5,16,17,50,66].
To rationalize how a minor φRAF-i exerts measurable influence, we transform it into system-level descriptors. The interfacial RAF volume is defined as Γᵢ = φRAF-i(poly-only)·(1−φf), i.e., the portion of the entire composite volume occupied by polymer in the interfacial RAF. Dividing Γᵢ by the specific interfacial area Sᵥ yields an effective interfacial thickness tᵢ = Γᵢ/Sᵥ. Here Sᵥ is obtained from SAXS via the Porod constant and invariant (Sᵥ = 2π2B/Q) (Methods; Figure 4a,b; Figure S6; Table S2a) [40,41,42]. The resulting ti values are sub-nanometric (see Table S2c) and are treated as an effective descriptor rather than an absolute physical thickness; thin but spatially extensive interfacial skins can disproportionately affect chain mobility and non-isothermal crystallization. Such interfacial skins are known to impose disproportionate constraints on chain mobility and to modulate non-isothermal crystallization in semicrystalline polymers. [9,44,57]
Along the KH550 concentration series (0, 1.6, and 4 wt%), the system evolves from a orientation-dominated regime—characterized by higher Sᵥ and thinner tᵢ—towards a phase-fraction-dominated regime at higher loading, where Sᵥ decreases and tᵢ thickens (Table S2c). At comparable interfacial descriptors (4 wt% KH550 vs. 4 wt% KH570), the downstream kinetic–orientation responses diverge, suggesting that distinct coupling pathways are activated depending on the silane chemistry rather than interfacial area/skin thickness alone [23,24].
We therefore interpret the observed small-in-volume yet surface-abundant RAF-i through the (Sᵥ, tᵢ, Γᵢ) triad, consistent with the interphase perspective in polymer nanocomposites [29,66,67].
At similar specific interfacial area Sv but distinct effective thickness ti at 4 wt% loading, the outcomes diverge by chemistry: KH570 (passivated/low-friction) follows an orientation-dominated route (higher f(α) with lower α/γ), whereas KH550 (anchored/high-friction) follows a phase-fraction-dominated route (higher α/γ with lower f(α)) [25,68]. These contrasts do not require changing the total constrained fraction; they reflect RAF redistribution under comparable Sv and chemistry-dependent ti and Γi.
4.2. Influence of Interfacial RAF on Non-Isothermal Kinetics and Orientation
Increasing the interfacial RAF volume (Γᵢ) is associated with systematic shifts in non-isothermal crystallization metrics [37]: the supercooling ΔTₚ decreases (higher Tₚ) while −log10(t1/2) decreases (i.e., t1/2 lengthens) across formulations (Figure 3a,b). Partial Spearman correlations controlling TiO2 wt% and silane type support these associations (Table S5a: ρ(ΔTₚ, Γᵢ)<0; ρ(−log10t1/2, Γᵢ)<0). Taken together, these trends are consistent with an interfacial-constraint scenario [50] in which an ultrathin, high-coverage interfacial constrained layer provides earlier effective nucleation sites (reduced ΔTₚ) while constraining growth/transport (longer t1/2) in the Xt = 0.20–0.60 window used for Nakamura fitting [9,35,36,38] (Figure 3b; Table S1). Nakamura global fits (fixed Ea from isoconversional closure) show rate-dependent K* shifts with n varying modestly within uncertainty across formulations (Table S1), indicating changes in the overall time scale rather than a wholesale change of growth dimensionality.
WAXS reveals that phase composition (α/γ) and orientation (f(α) at α(200)) are orthogonal descriptors: a lower α/γ can coexist with a higher f(α)(Figure 5a,b). The Hermans factor is robust to q-band width, band-center, and noise injection (Table S3; Figure S8–S10), ensuring that observed differences reflect genuine orientation contrasts rather than processing artifacts [51]. Partial correlations indicate a negative association between f(α) and Γᵢ (filled + pure set), but a positive association between f(α) and the interfacial thickness tᵢ (filled subset) (Table S5a). This pattern is consistent with two coupling pathways: orientation-dominated skins (large Sv, small ti) correlate with higher f(α) and lower α/γ, whereas phase-fraction-dominated skins (smaller Sv, larger ti) correlate with higher α/γ and lower f(α).
Consistent with 4.1, partial Spearman correlations (controlling TiO2 wt% and silane type) show that larger Γi associates with smaller ΔTp (higher Tp) and longer t1/2 (Table S5a; Figure 3a,b). Along the KH550 series, Sv decreases while ti increases, with Γi varying modestly within the small-n uncertainty (Table S2c); α/γ rises whereas f(α) falls, consistent with a shift toward the phase-fraction-dominated side. We refrain from causal claims beyond the reported statistics and use these outcome labels to summarize directionality.
4.3. Structural States and Their Relation to Macroscopic Performance
The interfacial descriptors identified above—α-phase orientation (f(α), interfacial RAF volume (Γᵢ), interfacial coverage (Sᵥ), and the mobile amorphous fraction (MAF)—provide a common coordinate system to interpret stiffness, strength/ductility, viscoelasticity, and UV protection.
Across filled formulations, the storage modulus E′ increases relative to pure PA6 (Figure 6a), consistent with additional interfacial constraints on segmental mobility. Within the same structural coordinate, tensile strength tracks with f(α) and Γᵢ, whereas elongation at break decreases in line with reduced MAF (Figure 6b) [69,70,71]. Partial Spearman correlations (controlling TiO2 wt% and silane type) and descriptive ΔR2 confirm that f(α) and Γᵢ retain independent explanatory power beyond composition (Table S5a–b). This joint trend reflects a common trade-off: enhanced orientation/constraint bolsters strength but narrows large-strain compliance.
The low-frequency viscosity plateau remains comparable among formulations, while high-frequency shear-thinning diverges (Figure 7a), consistent with constraint-sensitive fast modes [70,71] in the viscoelastic spectrum; high-frequency response is governed by local segmental constraints and entanglement dynamics rather than fully relaxed network motions. Directional statistics on η* support these associations within the available subset (KH550 series + pure; Table S5a). Note that Figure 7a does not include the 570–4 wt% sample; hence, rheological comparisons involving KH570 rely on structural/mechanical/UV triangulation rather than direct η* statistics, and all controls are stated at the subset level.
log10(UPF) increases with improved dispersion/coverage (Sᵥ) and higher Γᵢ (Figure 7b; Table S5a–b), indicating that thin yet pervasive interfacial skins extend scattering/absorption pathways at the fiber scale. Several formulations meet or surpass the practical benchmark log10(UPF) ≈ 1.70 (UPF = 50) [4]; replicate-level lower confidence bounds (UPFLCB) and UVA/UVB transmittance are reported in Table S4 under EN 13758-1 [4] / AATCC TM183 protocols [45,72]. These enhancements are consistent with classical photostabilization mechanisms of polymer matrices [72].
At 4 wt% loading, KH570 attains the highest tenacity despite a lower α/γ, consistent with an orientation-dominated reinforcement scenario where higher f(α), better dispersion, and fewer stress concentrators outweigh the benefit of higher phase fraction under anchored interfaces. Conversely, the KH550 series increases α/γ but suppresses f(α) as loading rises, aligning with a phase-fraction-dominated constraint that limits draw-induced orientation. In this compact view, KH570-4% represents the orientation-dominated endpoint (higher f(α), lower α/γ, high σ with better dispersion), whereas the KH550 loading series progressively shifts toward the phase-fraction-dominated endpoint (higher α/γ, lower f(α), increased σ but reduced ε), consistent with the two equivalent routes summarized in Figure 8b,c.
4.4. Interfacial Regimes: Geometric Descriptors and Structural Outcomes
We distinguish between geometric descriptors and structural outcomes. The interfacial triad (Sv, ti, Γi) quantifies geometry (area, effective thickness, and interfacial volume), whereas the outcome regimes describe how the structure responds: orientation-dominated versus phase-fraction-dominated. In practice, high Sv with smaller ti tends to favor orientation-dominated responses, while lower Sv with larger ti tends to favor phase-fraction-dominated responses. Across the filled formulations, RAF-tot normalized by the amorphous phase (φRAF-tot/φA) remains statistically equivalent, indicating that interfacial chemistry redistributes RAF between RAF-i and RAF-c instead of increasing the total constrained fraction (Table S2c). These outcome regimes summarize how interfacial geometry biases nucleation versus alignment pathways in semicrystalline polymer–particle systems [71,73].
Along the KH550 loading series, Sv decreases and ti increases, and the outcome shifts toward a phase-fraction-dominated response (α/γ increases while f(α) decreases). At 4 wt%, KH570 exhibits smaller ti at similar Sv (Table S2c) and follows an orientation-dominated response (high f(α) with low α/γ), whereas KH550 shows the complementary phase-fraction-dominated pattern (high α/γ with low f(α)). These outcome regimes rationalize the distinct strength–ductility balances seen in Figure 8b–c without implying recipe optimality.
At comparable specific interfacial area (Sᵥ within 95% CIs), the functional-group chemistry of the silane coupling agent modulates adhesion versus interfacial slip, biasing the structural route. KH550 (3-aminopropyl; –NH2) can form stronger H-bond/Lewis acid–base interactions with PA6 amide carbonyls (and may condense with –COOH chain ends), consistent with higher interfacial anchoring/friction [25,68]; KH570 (methacryloxypropyl; –COO–) interacts more weakly and permits easier slip. Accordingly, at 4 wt% TiO2 and comparable Sᵥ, KH570 exhibits smaller tᵢ and Γᵢ and follows an orientation-dominated response (higher f(α), lower α/γ), whereas KH550 shows larger tᵢ and Γᵢ and a phase-fraction-dominated response (higher α/γ, lower f(α)) (Figure 5a–b; Table S2c) [39]. Cross-stage, qualitative side-evidence is consistent with this picture: the Raman amide-I band in 550–4% is stronger and slightly red-shifted; DMA storage modulus E′ peaks at 550–4%; while 570–4% attains the highest tenacity despite lower α/γ, consistent with a low-friction/thin-skin, orientation-led route. These trends are mutually coherent with the SAXS interfacial metrics (tᵢ, Γᵢ), WAXS polymorphs and orientation, and DSC kinetics (see operational definitions & statistical notes of Table S5).
Spearman rank correlations (Table S5a) summarize directional associations among Γi, kinetic/structural responses (ΔTp, −log10 t1/2, f(α)), and interfacial geometry (Sv/ti), while descriptive ΔR2 (Table S5b) provides effect-size context under small n. Together with Porod-based surface quantification and RAF partitioning (Table S2c), the orientation- vs phase-fraction-dominated regimes reconcile the trends observed in Figure 8a–c without invoking ranking or optimal recipes [57,60].
4.5. Geometry-Based Summary of RAF–Kinetics–Structure–Performance Relations
The interfacial triad (Sv, ti, Γi) is purely geometric, providing a transferable, reproducible way to parameterize constrained skins at filler surfaces. In practical terms, concentration mainly “turns” the geometry axis (Sv with induced changes in Γi), while silane chemistry mainly “turns” the friction axis (effective ti, hence Γi) at comparable Sv. Both routes are equivalent in that they relocate samples on the same low-dimensional manifold and project onto the orientation- vs phase-fraction-dominated outcomes captured by Figure 8b,c, while RAFtot/ϕA remains statistically equivalent within this window.
Within the three-phase picture of semicrystalline polymers (crystal/RAF/MAF), this triad explains how a small φRAF-i can yield measurable effects when widely distributed as a sub-nanometric, high-coverage interfacial layer [1,2,50,74]. The approach builds on established SAXS invariants and Porod asymptotics to quantify specific interface area [40,41,75], with phase fractions expressed on a polymer-only basis for internal consistency.
Rather than relying on potentially misleading scatter fits at small n, we summarize directional relationships using Spearman rank correlations (exploratory, n = 4) and silane type, and we report descriptive ΔR2 for nested models (Figure 8a; Table S5a–S5b). In this compact view, Γᵢ aligns with non-isothermal kinetics (ΔTₚ and −log10t1/2), while Xc co-varies strongly with Tp on a polymer-only basis; RAF shows weak positive associations with Xc and α/γ. Sv and ti show tendencies consistent with orientation and phase ratio (f(α), α/γ). Tenacity increases with Tp and Xc, whereas elongation shows the opposite tendency; log10(UPF) trends with RAF and α/γ and exhibits near-zero association with f(α). For completeness, model-based analyses—Nakamura global fits and isoconversional methods (Kissinger/KAS)—are reported in the SI (see Figure S3 for multi-rate DSC, Figure S4 for KAS isoconversional results, Figure S5 for Kissinger plots, and Table S1 for Nakamura parameters); these reproduce the rate-dependent time-scale shifts consistent with the Tp trends used here, without requiring rate-wise changes in growth dimensionality within the analyzed conversion window [6,9,35,36,37,38,44].
The regime view—coverage-dominated (high Sᵥ, thin tᵢ) vs thickness-dominated (lower Sᵥ, thicker tᵢ)—rationalizes concentration trends and silane-dependent pathways. At fixed loading, KH550 and KH570 can share similar Sᵥ and tᵢ yet exhibit distinct kinetic–orientation signatures, indicating that interfacial chemistry modulates the activation of nucleation and alignment routes beyond geometry alone (Figure 8b,c). This is consistent with literature on polymer-nanoparticle interphases where interfacial layer thickness and interaction strength co-govern dynamics and properties [29].
Coarse-grained MD (Figure S11) illustrates stronger interfacial adhesion and more upright chain alignment near KH550-modified surfaces compared with the passivated KH570 surfaces, qualitatively consistent with the kinetic shifts inferred from DSC. We emphasize that these simulations visualize plausible local motifs; absolute temperatures depend on mapping and potential simplifications.
Overall, the (Sᵥ, tᵢ, Γᵢ) triad, coupled with small-sample-robust statistics, offers a reproducible and transferable protocol to connect interface-resolved RAF with kinetics, structure, and performance across polymer–nanoparticle fiber systems [5]. Building on the interphase perspective emphasized by Huang et al. [29], our study quantifies and reproducibly partitions RAF into interfacial and crystal-adjacent components. By integrating SAXS invariants and DSC kinetics within fiber systems, we operationalize the interphase concept into transferable descriptors (Sᵥ, tᵢ, Γᵢ), thereby providing a practical, cross-scale basis for design.
For operational clarity, we use a minimal two-readout notion of “compatibility”: (i) nucleation-compatibility, summarized by ΔTₚ (and apparent Eₐ from KAS/Kissinger) evaluated at comparable Sᵥ (or expressed per unit Sᵥ when appropriate); and (ii) constraint-compatibility, summarized by Γᵢ and tᵢ (= Γᵢ/Sᵥ). We employ these strictly as operational readouts, not as theory claims; full operational definitions and statistical notes are provided in table S5 notes.
5. Conclusions
We established an interface-to-performance link for PA6/TiO2 fibers that is consistent across kinetics, structure, and properties. On a polymer-only basis, the total rigid amorphous fraction remains approximately conserved, while its allocation redistributes from crystal-adjacent RAF to filler-proximal interfacial RAF, thereby addressing transferable interphase quantification at the fiber scale. To summarize interfacial participation without over-emphasizing thickness magnitudes, we use a geometry-aware pair (Sv, Γi) derived from SAXS invariants: specific interfacial area and the interfacial RAF volume within the composite—with ti treated as an effective descriptor.
Across formulations, Γi aligns with non-isothermal crystallization metrics (higher Tp and longer t1/2 within the fitted window), while phase proportion (α/γ) and orientation (f(α)) act as orthogonal structural coordinates, providing interphase-resolved readouts of dispersion and compatibility. In this sense, for clarity of terminology only, we refer to “compatibility” in descriptive terms as nucleation-compatibility and constraint-compatibility. These labels are used here as operational descriptors, conceptually consistent with RAF and mesophase views, rather than as a quantitative model in this work.
At fixed loading, KH550 (anchored and high-friction) and KH570 (passivated and low-friction) can show similar Sv, while effective ti (hence Γi) differ, and thus follow different coupling routes: a phase-fraction–dominated path (higher α/γ with comparatively lower f(α)) versus an orientation-dominated path (higher f(α) with comparatively lower α/γ). Performance changes therefore arise from redistribution and pathway choice, rather than from a net increase of RAF. The (Sv, Γi) descriptors and the associated workflow based on SAXS invariant together with WAXS and DSC provide a transferable, reproducible basis for interphase-aware design of polymer–nanoparticle fibers , thereby closing the kinetics–structure–property loop articulated in the Introduction.
Supplementary Materials
The following supporting information can be provided upon acceptance. Figure S1: SEM micrographs of melt-spun PA6/TiO2 fibers at representative loadings; Figure S2: Full-range Raman spectra (100–1800 cm−1) of injection-molded PA6/TiO2 composites (KH550/KH570 series); Figure S3: Full non-isothermal DSC cooling curves at β = 5–40 °C·min−1; Figure S4: Per-conversion KAS regressions (ln [β/Tₓ2] vs 1/Tₓ) at X = 0.30–0.55; Figure S5: Kissinger regressions (ln [β/Tₚ2] vs 1/Tₚ) and fitted Eₖ; Figure S6: Raw SAXS profiles and Bragg-peak subtraction used for Porod invariants; Figure S7: Interfacial rigid amorphous fraction (φRAF-i) and normalized total RAF (RAFtot/φA, polymer-only basis) with 95% CIs and TOST equivalence assessment; Figure S8: Robustness of the Hermans factor extraction at the PA6 α(200) reflection; Figure S9: Representative peak deconvolution of the WAXS pattern for the 550–1.6% sample; Figure S10: Azimuthal profile at PA6 α(200) for Hermans factor evaluation; Figure S11: Coarse-grained MD snapshots and DSC-like heat-flow curves (−dU/dT). Table S1: Nakamura (θ*) parameters and uncertainties under non-isothermal cooling; Table S2: SAXS results panel—(a) Porod invariants by q-range; (b) phase fractions (φc, φRAF-c, φRAF-i, φMAF) on a polymer-only basis; (c) interfacial-layer metrics (Sv, Γi, ti); (d) low-q baselines and increments (ΔQ1) used to fix φRAF-i; (e) master summary with 95% CIs and absolute scale factor α; Table S3: Robustness of the α(200) Hermans factor; Table S4: Ultraviolet protection metrics (UPF, T(UVA), T(UVB)) for woven fabrics; Tables S5a–S5b: Partial correlations and descriptive ΔR2 linking interfacial metrics (Γi, Sv, ti) to proximal responses (ΔTp, t1/2, f(α), η*).
Author Contributions
Conceptualization, H. Yu and B. Sun; Resources, B. Sun; Methodology, Investigation, Data Curation, Visualization, and Formal Analysis, H. Yu; Writing—Original Draft Preparation, H. Yu; Writing—Review & Editing, H. Yu, X. Jiang, P. Liu, and X. Ji; Supervision, B. Sun; Project Administration, X. Jiang and B. Sun; Funding Acquisition, B. Sun. All authors have read and agreed to the published version of the manuscript.
Funding
This research was funded by the National Undergraduate Innovation and Entrepreneurship Training Program of China, grant number 106-06-0041018.
Institutional Review Board Statement
Not applicable.
Data Availability Statement
The data presented in this study are available on request from the corresponding author.
Acknowledgments
The authors acknowledge the Shanghai Synchrotron Radiation Facility (SSRF) for beamtime at BL16B1 under the proposal “Structure Regulation of Condensed Matter Interfaces for the Fabrication of High-Performance Thermoplastic Polymer Nanocomposite Fibers” (Project No. 2020-SSRF-PT-012686). We gratefully acknowledge Dr. Xiaran Miao and the BL16B1 beamline staff for their assistance during the SAXS/WAXS measurements, as well as Jing Shen and Jia Chen from our research group for their participation and support throughout the project. Computational resources for the molecular dynamics simulations were provided by the High-Performance Computing cluster of the Department of Theory of Polymers (ITP), Leibniz Institute of Polymer Research Dresden (Leibniz-Institut für Polymerforschung Dresden, IPF), Germany, which were used to generate the data reported in the Supplementary Information.
Conflicts of Interest
The authors declare no conflicts of interest.
References
- Wunderlich, B. Reversible crystallization and the rigid–amorphous phase in semicrystalline macromolecules. Prog. Polym. Sci. 2003, 28, 383–450. [Google Scholar] [CrossRef]
- Di Lorenzo, M.L.; Righetti, M.C. Crystallization-induced formation of rigid amorphous fraction. Polymer Crystallization 2018, 1, e10023. [Google Scholar] [CrossRef]
- Strobl, G. From the melt via mesomorphic and granular crystalline layers to lamellar crystallites: A major route followed in polymer crystallization? The European Physical Journal E 2000, 3, 165–183. [Google Scholar] [CrossRef]
- Gambichler, T.; Laperre, J.; Hoffmann, K. The European standard for sun-protective clothing: EN 13758. J. Eur. Acad. Dermatol. Venereol. 2006, 20, 125–130. [Google Scholar] [CrossRef] [PubMed]
- Strobl, G. The Physics of Polymers: Concepts for Understanding Their Structures and Behavior; Springer: Berlin/Heidelberg, Germany, 2007; pp. 1–518. [Google Scholar]
- Strobl, G. Colloquium: Laws controlling crystallization and melting in bulk polymers. Rev. Mod. Phys. 2009, 81, 1287–1300. [Google Scholar] [CrossRef]
- Mo, Z. A Method for the Non-Isothermal Crystallization Kinetics of Polymers. Acta Polymerica Sinica 2008, 656–661. [Google Scholar] [CrossRef]
- Cheng, S.Z.D.; Wunderlich, B. Thermal analysis of thermoplastic polymers. Thermochim. Acta 1988, 134, 161–166. [Google Scholar] [CrossRef]
- Jeziorny, A. Parameters characterizing the kinetics of the non-isothermal crystallization of poly(ethylene terephthalate) determined by d.s.c. Polymer 1978, 19, 1142–1144. [Google Scholar] [CrossRef]
- Keller, A. A note on single crystals in polymers: Evidence for a folded chain configuration. Philos. Mag. 1957, 2, 1171–1175. [Google Scholar] [CrossRef]
- Porter, R.S. Macromolecular physics, volume 3—crystal melting, Bernhard Wunderlich, Academic Press; John Wiley & Sons, Ltd.: New York, NY, US, 1980; Volume 18, pp. 824–824. [Google Scholar]
- Cheng, S.Z.D. Phase transitions in polymers: the role of metastable states; Elsevier: Oxford, UK, 2008. [Google Scholar]
- Zhang, F.; Sherrell, P.C.; Luo, W.; Chen, J.; Li, W.; Yang, J.; Zhu, M. Organic/Inorganic Hybrid Fibers: Controllable Architectures for Electrochemical Energy Applications. Advanced Science 2021, 8, e2102859. [Google Scholar] [CrossRef]
- Cheng, Y.; Wang, X.; Sun, B.; Chen, L.; Xiang, H.; Zhu, M.; Chen, Z.; Wang, S.; Zhou, Z. Organic-inorganic hybrid material and multifunctional fibers. SCIENTIA SINICA Technologica 2014, 44, 1137–1144. [Google Scholar] [CrossRef]
- Cazan, C.; Enesca, A.; Andronic, L. Synergic Effect of TiO2 Filler on the Mechanical Properties of Polymer Nanocomposites. Polymers (Basel) 2021, 13. [Google Scholar] [CrossRef]
- Wu, Q. Polymer condensation process and phase transition; Higher Education Press, Beijing: Beijing, China, 2016. [Google Scholar]
- Klonos, P.; Pissis, P. Effects of interfacial interactions and of crystallization on rigid amorphous fraction and molecular dynamics in polylactide/silica nanocomposites: A methodological approach. Polymer 2017, 112, 228–243. [Google Scholar] [CrossRef]
- Ma, Q.; Pyda, M.; Mao, B.; Cebe, P. Relationship between the rigid amorphous phase and mesophase in electrospun fibers. Polymer 2013, 54, 2544–2554. [Google Scholar] [CrossRef]
- Klonos, P.; Terzopoulou, Z.; Koutsoumpis, S.; Zidropoulos, S.; Kripotou, S.; Papageorgiou, G.Z.; Bikiaris, D.N.; Kyritsis, A.; Pissis, P. Rigid amorphous fraction and segmental dynamics in nanocomposites based on poly(l–lactic acid) and nano-inclusions of 1–3D geometry studied by thermal and dielectric techniques. Eur. Polym. J. 2016, 82, 16–34. [Google Scholar] [CrossRef]
- Shayestehfar, S.; Yazdanshenas, M.E.; Khajavi, R.; Rashidi, A.-S. Physical and mechanical properties of nylon 6/titanium dioxide micro and nano-composite multifilament yarns. Journal of Engineered Fibers and Fabrics 2014, 9, 155892501400900319. [Google Scholar] [CrossRef]
- Cot, M.; Mijas, G.; Prieto-Fuentes, R.; Riba-Moliner, M.; Cayuela, D. The Influence of Titanium Dioxide (TiO2) Particle Size and Crystalline Form on the Microstructure and UV Protection Factor of Polyester Substrates. Polymers (Basel) 2024, 16. [Google Scholar] [CrossRef]
- Dalod, A.R.; Henriksen, L.; Grande, T.; Einarsrud, M.A. Functionalized TiO2 nanoparticles by single-step hydrothermal synthesis: the role of the silane coupling agents. Beilstein Journal of Nanotechnology 2017, 8, 304–312. [Google Scholar] [CrossRef]
- Nguyen, T.-C.; Nguyen, T.-D.; Vu, D.-T.; Dinh, D.-P.; Nguyen, A.-H.; Ly, T.-N.-L.; Dao, P.-H.; Nguyen, T.-L.; Bach, L.-G.; Thai, H.; et al. Modification of Titanium Dioxide Nanoparticles with 3-(Trimethoxysilyl)propyl Methacrylate Silane Coupling Agent. Journal of Chemistry 2020, 2020, 1–10. [Google Scholar] [CrossRef]
- Meroni, D.; Lo Presti, L.; Di Liberto, G.; Ceotto, M.; Acres, R.G.; Prince, K.C.; Bellani, R.; Soliveri, G.; Ardizzone, S. A Close Look at the Structure of the TiO(2)-APTES Interface in Hybrid Nanomaterials and Its Degradation Pathway: An Experimental and Theoretical Study. The Journal of Physical Chemistry C 2017, 121, 430–440. [Google Scholar] [CrossRef]
- Chen, Q.; Li, F.; Zhai, Z.; Li, S.; Cai, Y.; Li, Q. Effect of Interfacial Compatibility on Mechanical Property of Polyamide 6 Modified by Polyborosiloxane. Polymers (Basel) 2025, 17. [Google Scholar] [CrossRef] [PubMed]
- Ludas Dujmic, A.; Radicic, R.; Ercegovic Razic, S.; Cingesar, I.K.; Glogar, M.; Jurov, A.; Krstulovic, N. Characterization of Melt-Spun Recycled PA 6 Polymer by Adding ZnO Nanoparticles during the Extrusion Process. Polymers (Basel) 2024, 16, 1883. [Google Scholar] [CrossRef] [PubMed]
- Du, S.; Wei, Y.; Ahmed, S.; Zhou, F.; Tan, Y.; Li, Y.; Wang, M.; Chen, X.; Zhou, W. Enhanced thermal stability and UV resistance of polyamide 6 filament fabric via in-situ grafting with methyl methacrylate. Colloids and Surfaces A: Physicochemical and Engineering Aspects 2022, 651, 129371. [Google Scholar] [CrossRef]
- Yu, X.; Zhang, Y.; Fan, X.; Lv, Y.; Wang, Z.; Zhang, X.; Liu, T. Macromolecular PEI-modified carbon nanotubes as multifunctional additives in controlling crystallization and enhancing comprehensive performance of polyamide 6 nanocomposites. Composites Communications 2024, 51, 102057. [Google Scholar] [CrossRef]
- Huang, J.; Zhou, J.; Liu, M. Interphase in Polymer Nanocomposites. JACS Au 2022, 2, 280–291. [Google Scholar] [CrossRef]
- Buccella, M.; Dorigato, A.; Rizzola, F.; Caldara, M.; Fambri, L. Influence of the processing parameters on the dispersion and coloration behavior of a halogenated copper phthalocyanine-based masterbatch. Adv. Polym. Tech. 2018, 37, 778–785. [Google Scholar] [CrossRef]
- Wang, L.; Xie, G.; Mi, X.; Zhang, B.; Du, Y.; Zhu, Q.; Yu, Z. Surface-Modified TiO2@SiO2 Nanocomposites for Enhanced Dispersibility and Optical Performance to Apply in the Printing Process as a Pigment. ACS Omega 2023, 8, 20116–20124. [Google Scholar] [CrossRef]
- Zhu, R.; Yadama, V.; Liu, H.; Lin, R.J.T.; Harper, D.P. Fabrication and characterization of Nylon 6/cellulose nanofibrils melt-spun nanocomposite filaments. Composites Part A: Applied Science and Manufacturing 2017, 97, 111–119. [Google Scholar] [CrossRef]
- Fu, S.; Sun, Z.; Huang, P.; Li, Y.; Hu, N. Some basic aspects of polymer nanocomposites: A critical review. Nano Materials Science 2019, 1, 2–30. [Google Scholar] [CrossRef]
- CEN. Pigments and extenders — Methods of dispersion and assessment of dispersibility in plastics — Part 5: Determination by filter pressure value test. EN 13900-5:2005 2005.
- Kissinger, H.E. Reaction Kinetics in Differential Thermal Analysis. Anal. Chem. 1957, 29, 1702–1706. [Google Scholar] [CrossRef]
- Akahira, T.; Sunose, T. Method of determining activation deterioration constant of electrical insulating materials. Res Rep Chiba Inst Technol (Sci Technol) 1971, 16, 22–31. [Google Scholar]
- Nakamura, K.; Watanabe, T.; Katayama, K.; Amano, T. Some aspects of nonisothermal crystallization of polymers. I. Relationship between crystallization temperature, crystallinity, and cooling conditions. J. Appl. Polym. Sci. 1972, 16, 1077–1091. [Google Scholar] [CrossRef]
- Vyazovkin, S.; Burnham, A.K.; Criado, J.M.; Pérez-Maqueda, L.A.; Popescu, C.; Sbirrazzuoli, N. ICTAC Kinetics Committee recommendations for performing kinetic computations on thermal analysis data. Thermochim. Acta 2011, 520, 1–19. [Google Scholar] [CrossRef]
- Huang, Y.-P.; Chen, T.-K.; Tang, J.-W.; Yeh, C.; Tien, C.-H. Effect of PET melt spinning on TiO2 nanoparticle aggregation and friction behavior of fiber surface. Ind. Eng. Chem. Res. 2007, 46, 5548–5554. [Google Scholar] [CrossRef]
- Feigin, L.; Svergun, D.I. Structure analysis by small-angle X-ray and neutron scattering; Springer: Boston, MA, USA, 1987; Volume 1. [Google Scholar]
- Rambo, R.P.; Tainer, J.A. Characterizing flexible and intrinsically unstructured biological macromolecules by SAS using the Porod-Debye law. Biopolymers 2011, 95, 559–571. [Google Scholar] [CrossRef] [PubMed]
- Glatter, O. Small angle X-ray scattering. (No Title) 1982.
- Hermans, P.; Weidinger, A. Quantitative x-ray investigations on the crystallinity of cellulose fibers. A background analysis. J. Appl. Phys. 1948, 19, 491–506. [Google Scholar] [CrossRef]
- Di Lorenzo, M.L.; Silvestre, C. Non-isothermal crystallization of polymers. Prog. Polym. Sci. 1999, 24, 917–950. [Google Scholar] [CrossRef]
- Aatcc, T.M. 183; Transmittance or Blocking of Erythemally Weighted Ultraviolet Radiation through Fabrics. American Association of Textile Chemists and Colorists (AATCC): Research Triangle Park, NC, USA 2020.
- Bhattacharjee, S. DLS and zeta potential - What they are and what they are not? Journal of Controlled Release 2016, 235, 337–351. [Google Scholar] [CrossRef]
- Zhang, X. Applications of Kinetic Methods in Thermal Analysis: A Review. Engineered Science 2020, 14, 1–13. [Google Scholar] [CrossRef]
- Feng, T.; Xiu-Hong, L.; Yu-Zhu, W.; Chun-Ming, Y.; Ping, Z.; Jin-You, L.; Zeng, J.; Chun-Xia, H.; Wen-Qiang, H.; Xiao-Yun, L.; et al. Small angle X-ray scattering beamline at SSRF. Nuclear Science and Techniques 2015, 26. [Google Scholar] [CrossRef]
- Kieffer, J.; Karkoulis, D. PyFAI, a versatile library for azimuthal regrouping. In Proceedings of the Journal of Physics: Conference Series, Bristol, UK; 2013; p. 202012. [Google Scholar]
- Xu, H.; Ince, B.S.; Cebe, P. Development of the crystallinity and rigid amorphous fraction in cold-crystallized isotactic polystyrene. J. Polym. Sci., Part B: Polym. Phys. 2003, 41, 3026–3036. [Google Scholar] [CrossRef]
- Ogle, J.; Powell, D.; Amerling, E.; Smilgies, D.-M.; Whittaker-Brooks, L. Quantifying multiple crystallite orientations and crystal heterogeneities in complex thin film materials. CrystEngComm 2019, 21, 5707–5720. [Google Scholar] [CrossRef]
- Marrink, S.J.; Risselada, H.J.; Yefimov, S.; Tieleman, D.P.; de Vries, A.H. The MARTINI force field: coarse grained model for biomolecular simulations. The Journal of Physical Chemistry B 2007, 111, 7812–7824. [Google Scholar] [CrossRef] [PubMed]
- Alessandri, R.; Barnoud, J.; Gertsen, A.S.; Patmanidis, I.; De Vries, A.H.; Souza, P.C.T.; Marrink, S.J. Martini 3 coarse-grained force field: Small molecules. Advanced Theory and Simulations 2022, 5, 2100391. [Google Scholar] [CrossRef]
- Abraham, M.J.; Murtola, T.; Schulz, R.; Páll, S.; Smith, J.C.; Hess, B.; Lindahl, E. GROMACS: High performance molecular simulations through multi-level parallelism from laptops to supercomputers. SoftwareX 2015, 1-2, 19–25. [Google Scholar] [CrossRef]
- Mousavifard, S.M.; Ghermezcheshme, H.; Mirzaalipour, A.; Mohseni, M.; de With, G.; Makki, H. PolySMart: a general coarse-grained molecular dynamics polymerization scheme. Materials Horizons 2023, 10, 2281–2296. [Google Scholar] [CrossRef]
- Thompson, A.P.; Aktulga, H.M.; Berger, R.; Bolintineanu, D.S.; Brown, W.M.; Crozier, P.S.; in ‘t Veld, P.J.; Kohlmeyer, A.; Moore, S.G.; Nguyen, T.D.; et al. LAMMPS - a flexible simulation tool for particle-based materials modeling at the atomic, meso, and continuum scales. Comput. Phys. Commun. 2022, 271, 108171. [Google Scholar] [CrossRef]
- Luo, C.; Kröger, M.; Sommer, J.-U. Molecular dynamics simulations of polymer crystallization under confinement: Entanglement effect. Polymer 2017, 109, 71–84. [Google Scholar] [CrossRef]
- Mortezazadeh, S.; Jamali, Y.; Naderi-Manesh, H.; Lyubartsev, A.P. Implicit solvent systematic coarse-graining of dioleoylphosphatidylethanolamine lipids: From the inverted hexagonal to the bilayer structure. PLoS One 2019, 14, e0214673. [Google Scholar] [CrossRef]
- Pereira, G.P.; Alessandri, R.; Dominguez, M.; Araya-Osorio, R.; Grunewald, L.; Borges-Araujo, L.; Wu, S.; Marrink, S.J.; Souza, P.C.T.; Mera-Adasme, R. Bartender: Martini 3 Bonded Terms via Quantum Mechanics-Based Molecular Dynamics. J. Chem. Theory Comput. 2024, 20, 5763–5773. [Google Scholar] [CrossRef]
- Reith, D.; Putz, M.; Muller-Plathe, F. Deriving effective mesoscale potentials from atomistic simulations. J. Comput. Chem. 2003, 24, 1624–1636. [Google Scholar] [CrossRef]
- Moore, T.C.; Iacovella, C.R.; McCabe, C. Derivation of coarse-grained potentials via multistate iterative Boltzmann inversion. The Journal of Chemical Physics 2014, 140, 224104. [Google Scholar] [CrossRef]
- Neese, F. The ORCA program system. WIREs Computational Molecular Science 2011, 2, 73–78. [Google Scholar] [CrossRef]
- Riplinger, C.; Sandhoefer, B.; Hansen, A.; Neese, F. Natural triple excitations in local coupled cluster calculations with pair natural orbitals. J. Chem. Phys. 2013, 139, 134101. [Google Scholar] [CrossRef] [PubMed]
- Kendall, R.A.; Dunning, T.H.; Harrison, R.J. Electron affinities of the first-row atoms revisited. Systematic basis sets and wave functions. The Journal of Chemical Physics 1992, 96, 6796–6806. [Google Scholar] [CrossRef]
- Lu, T.; Chen, F. Multiwfn: a multifunctional wavefunction analyzer. J. Comput. Chem. 2012, 33, 580–592. [Google Scholar] [CrossRef] [PubMed]
- Pissis, P.; Klonos, P.; Kyritsis, A. Interfacial effects in polymer nanocomposites studied by dielectric and thermal techniques. In Proceedings of the 2011-14th International Symposium on Electrets, Piscataway, NJ, USA; 2011; pp. 67–68. [Google Scholar]
- Keddie, J.L.; Jones, R.A.L.; Cory, R.A. Interface and surface effects on the glass-transition temperature in thin polymer films. Faraday Discuss. 1994, 98, 219–230. [Google Scholar] [CrossRef]
- Yu, D.; Wang, J.; Wang, G. Glass fiber treated with a glycine bridged silane coupling agent reinforcing polyamide 6(PA6): effect of hydrogen bonding. RSC Advances 2025, 15, 3331–3338. [Google Scholar] [CrossRef]
- Doi, M.; Edwards, S.F.; Edwards, S.F. The theory of polymer dynamics; oxford university press: Oxford, UK, 1988; Volume 73. [Google Scholar]
- Ferry, J.D. Viscoelastic properties of polymers; John Wiley & Sons: New York, NY, USA, 1980. [Google Scholar]
- Landel, R.F.; Nielsen, L.E. Mechanical properties of polymers and composites; CRC press: Boca Raton, FL, USA, 1993. [Google Scholar]
- Allen, N.S.; Chirinis-Padron, A.; Henman, T.J. The photo-stabilisation of polypropylene: A review. Polym. Degrad. Stab. 1985, 13, 31–76. [Google Scholar] [CrossRef]
- Ward, I.M.; Sweeney, J. Mechanical properties of solid polymers; Wiley Online Library: Chichester, UK, 1971; Volume 313. [Google Scholar]
- Forrest, J.A.; Dalnoki-Veress, K. The glass transition in thin polymer films. Advances in Colloid and Interface Science 2001, 94, 167–195. [Google Scholar] [CrossRef]
- Blachnio, M.; Zienkiewicz-Strzalka, M.; Derylo-Marczewska, A.; Nosach, L.V.; Voronin, E.F. Chitosan-Silica Composites for Adsorption Application in the Treatment of Water and Wastewater from Anionic Dyes. Int. J. Mol. Sci. 2023, 24, 11818. [Google Scholar] [CrossRef]
Figure 1.
(a) DLS intensity-weighted particle size distributions of KH550- and KH570-modified TiO2 powders dispersed in ethanol. Curves represent the mean ± standard error of the mean (SEM) from three replicates; Z-average diameters and PDIs are reported in the text. (b) Filtration pressure values (FPV) of PA6/TiO2 masterbatches containing 4 wt% and 8 wt% TiO2. Error bars indicate 95% confidence intervals (n = 3).
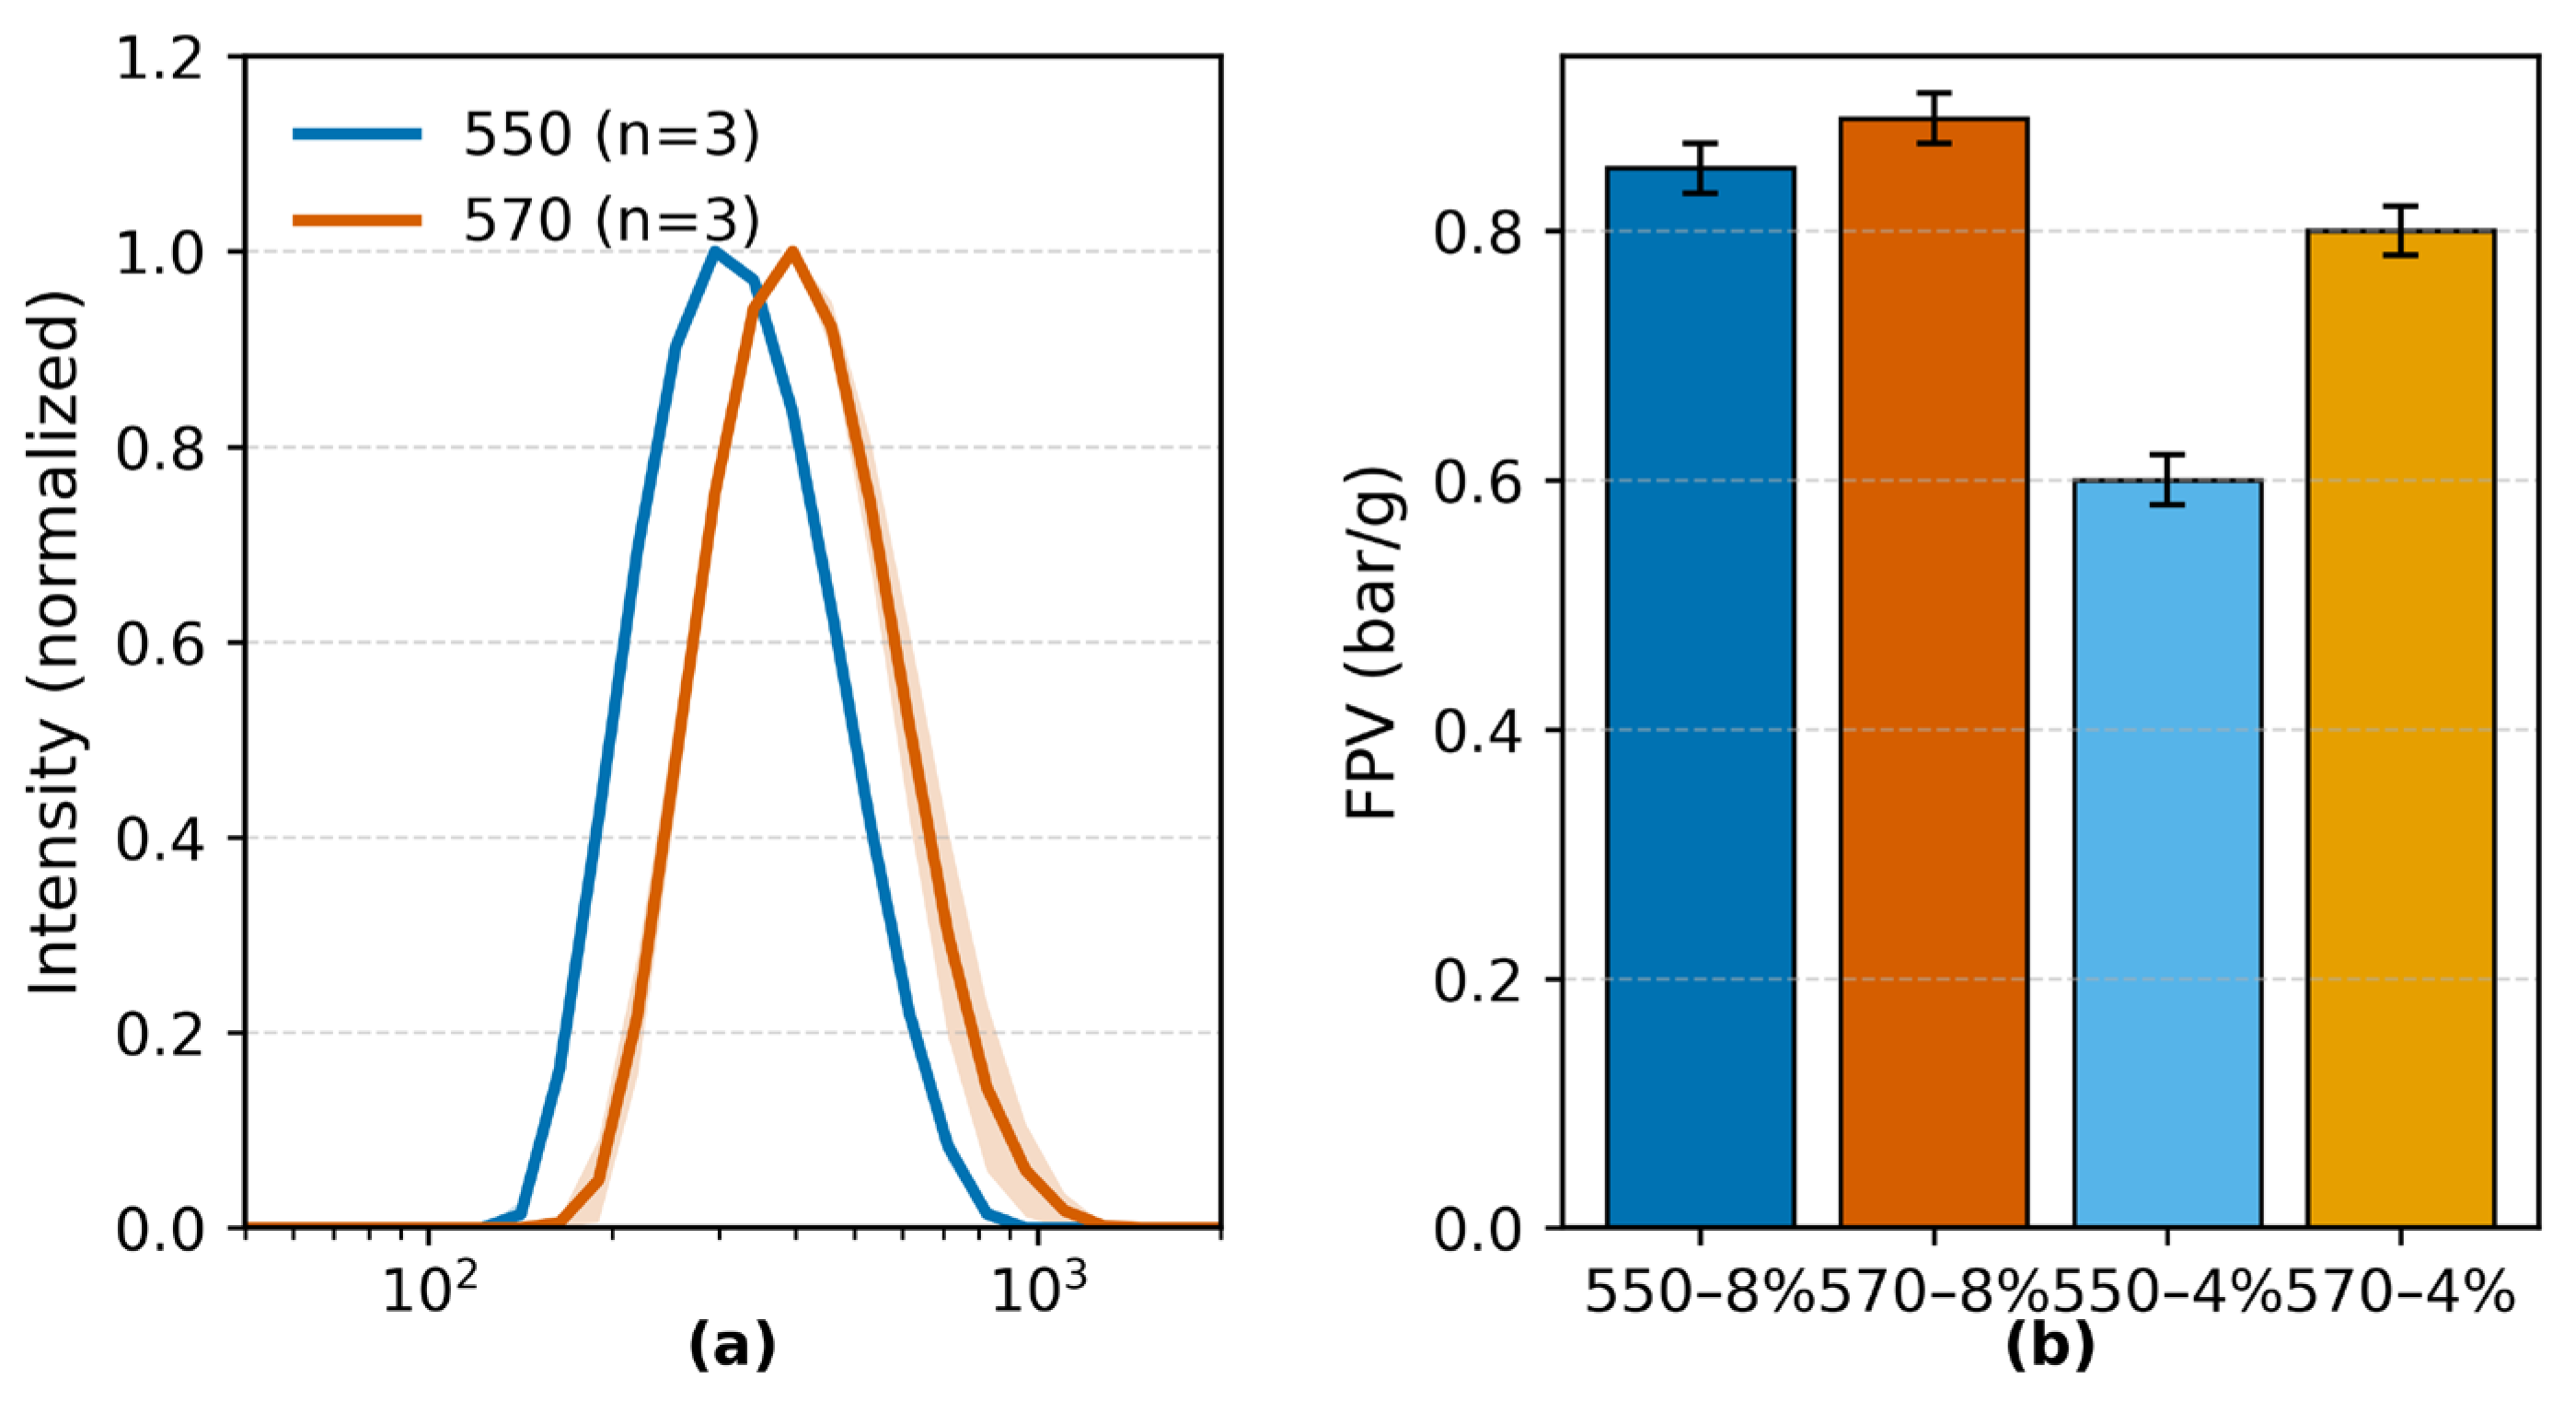
Figure 2.
(a) FTIR spectra of pure PA6 and silane-treated TiO2 masterbatches (MB-550 and MB-570, 60 wt% TiO2 in PA6 carrier), normalized to the 0–1 range and plotted from 4000 to 650 cm−1. Shaded regions mark the O–H/N–H stretching (3600–3200 cm−1), amide I (C=O, ~1650 cm−1), and Si–O–Ti/Si–O–Si stretching (930–1100 cm−1) regions. The inset shows the difference spectra of MB-550 and MB-570 relative to pure PA6, obtained after least-squares scaling outside 930–1100 cm−1 to isolate silane–TiO2 related absorption. (b) Raman spectra of injection-molded specimens (pure PA6, 550–1.6 wt%, 550–4 wt%) normalized to the 95th percentile intensity over 100–700 cm−1. The inset magnifies the amide I region (1600–1700 cm−1) to compare peak intensity and profile changes among samples.
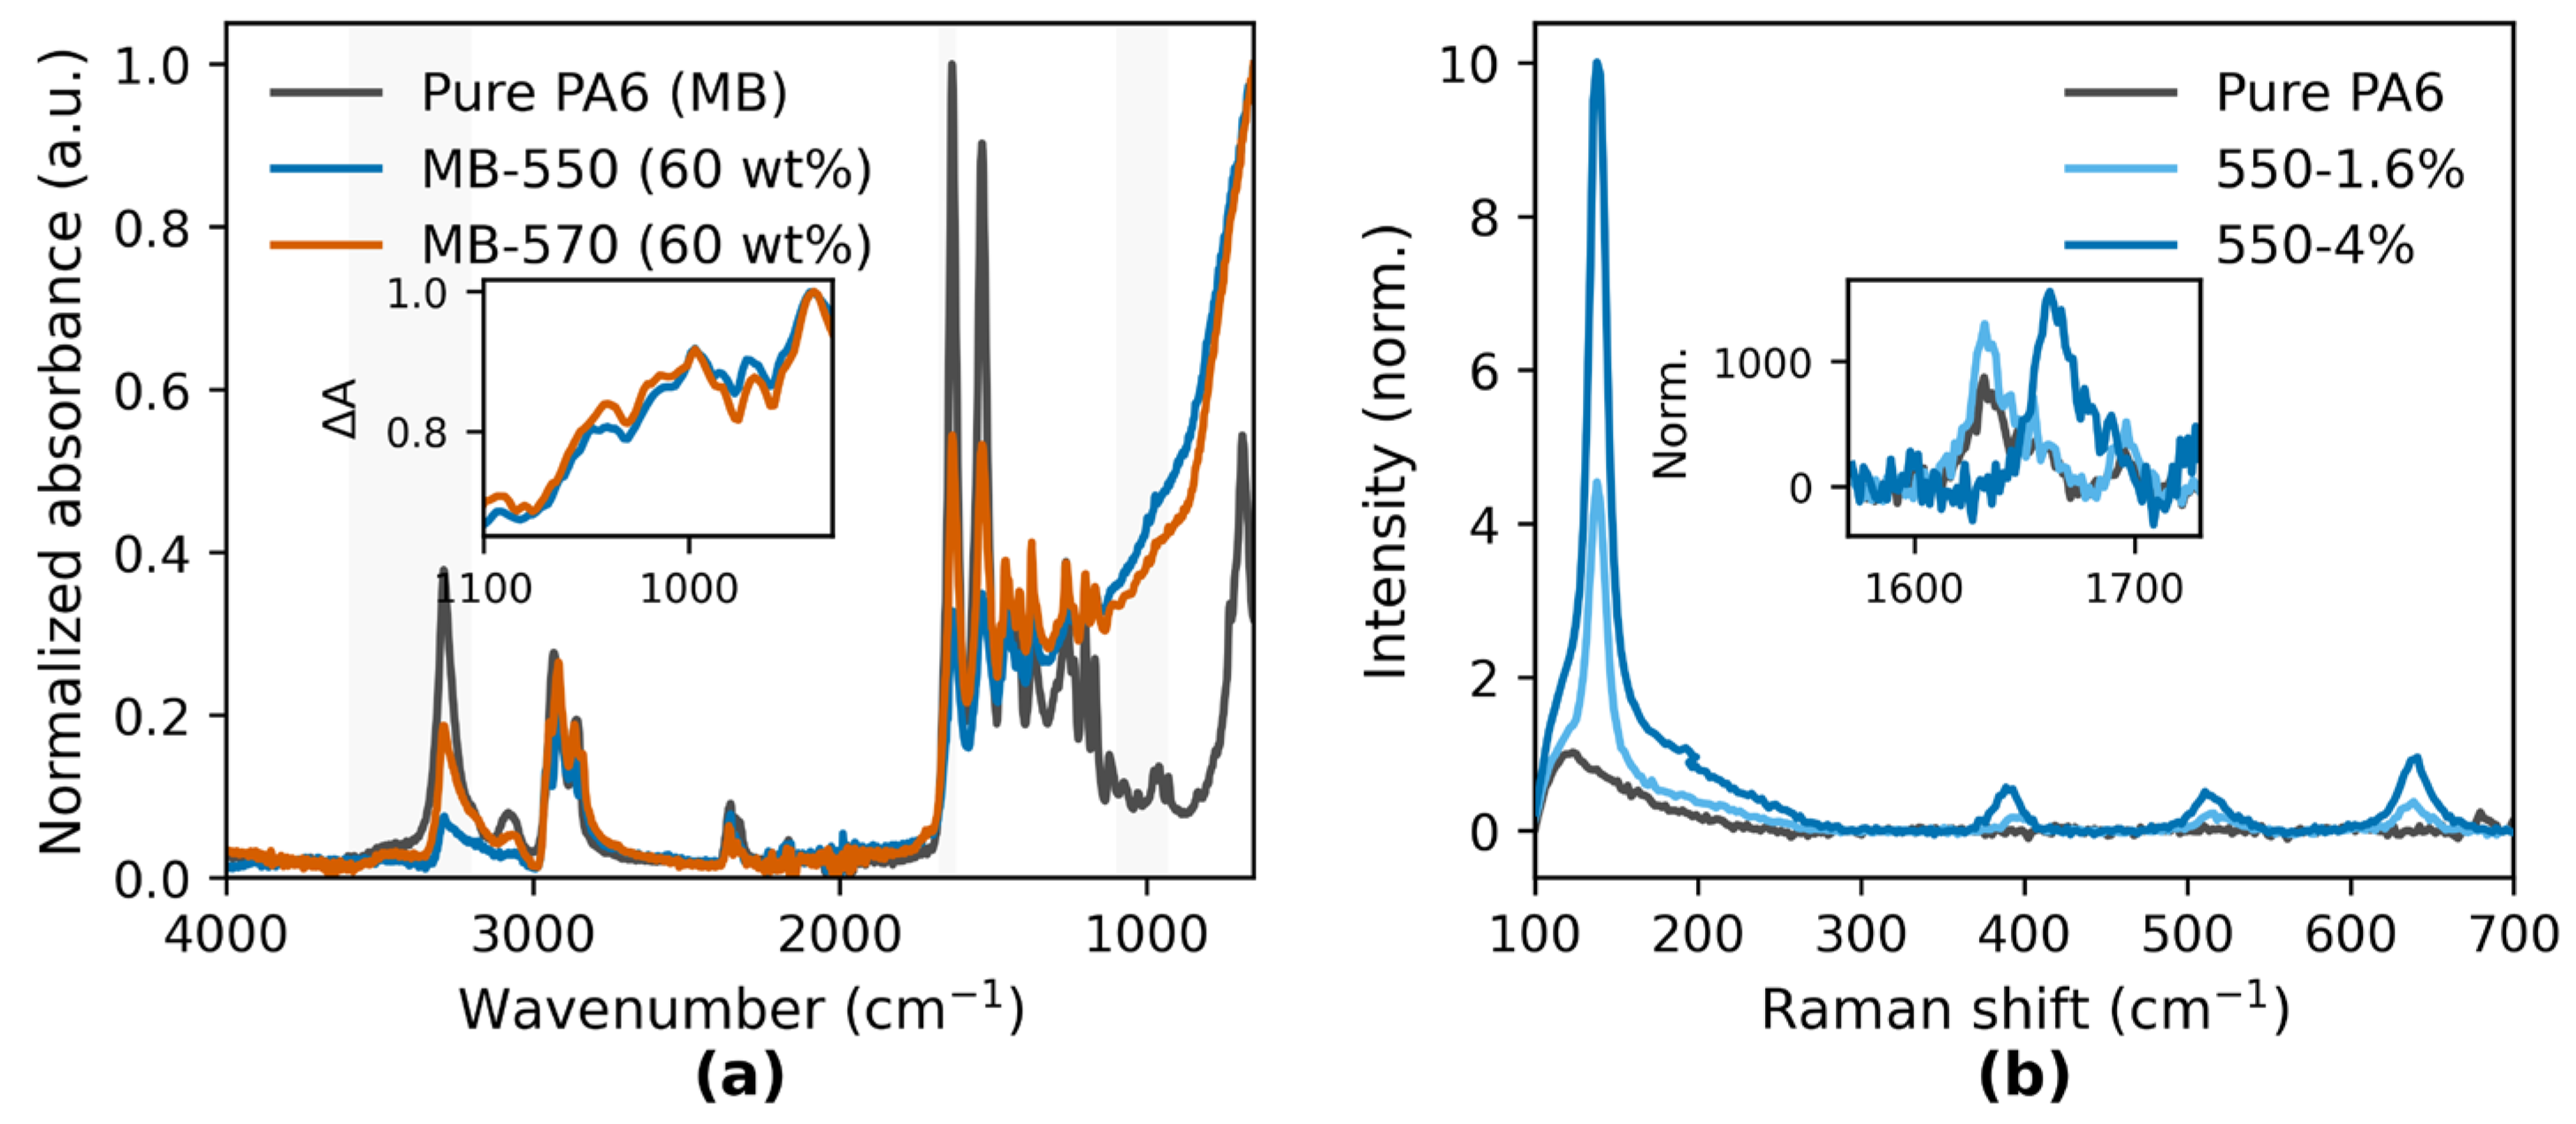
Figure 3.
Non-isothermal DSC cooling curves of pure PA6 and PA6/TiO2 fibers (0, 1.6, and 4 wt% KH-550; and 4 wt% KH-570) at a cooling rate of 20 °C·min−1. Heat flow is PA6-normalized (W g−1) after TiO2 blank correction. (b) Relative crystallinity Xt as a function of time for the same samples at 20 °C·min−1. Symbols are experimental data; thin dashed lines are Nakamura fits based on the isothermal-equivalent time θ*, performed over 0.20≤Xt≤0.60 with activation energies fixed from independent isoconversional analysis. (c) Isoconversional KAS (multi-point) analysis: plots of ln [β/TX2] versus 1/TX at conversion levels X=0.30 (solid), 0.40 (dashed), 0.50 (dotted), and 0.55 (dash-dotted), for cooling rates of 5, 10, 20, 30, and 40 °C·min−1. The slopes are used to obtain the apparent activation energy Ea(X).
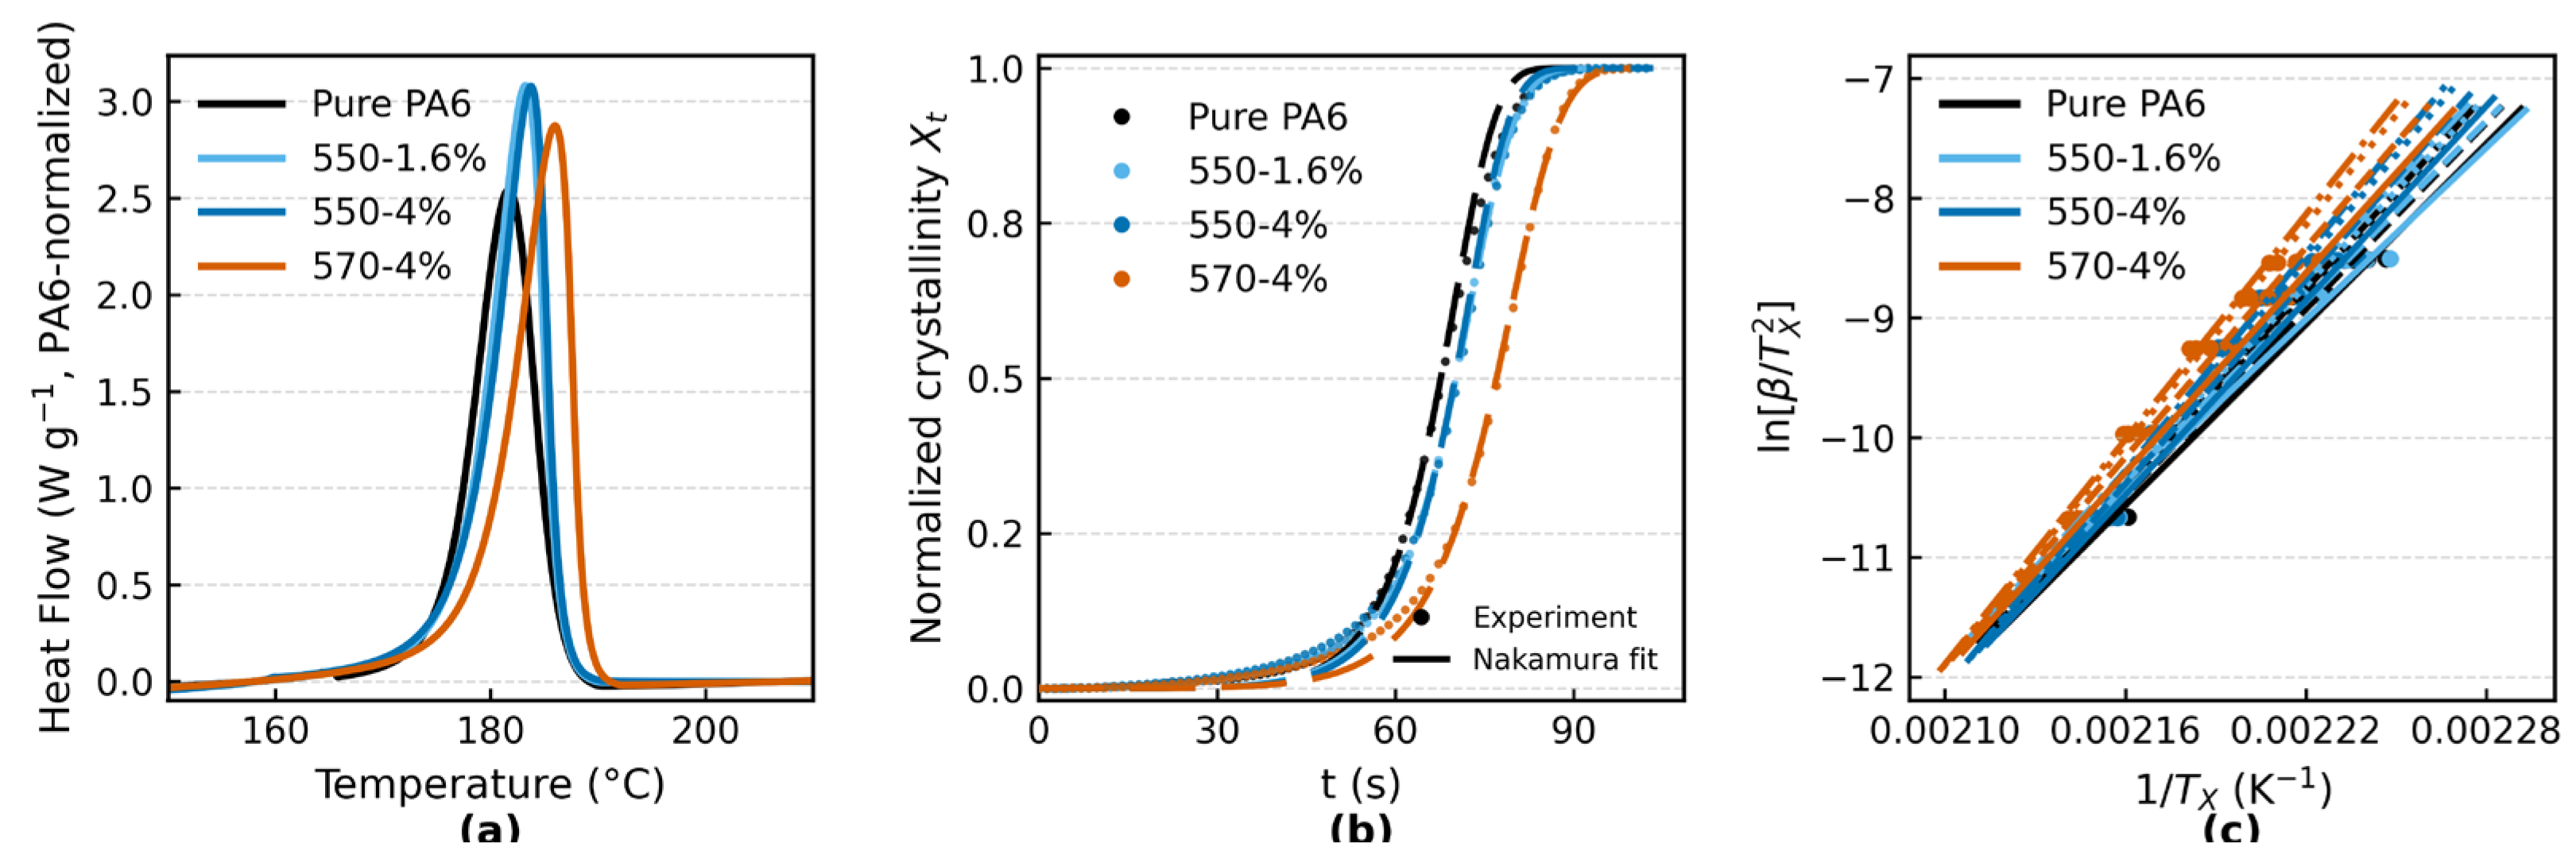
Figure 4.
(a) Small-angle X-ray scattering (SAXS) intensity profiles I(q) for pure PA6, 550 1.6% (KH-550, 1.6 wt% TiO2), 550 4% (KH-550, 4 wt% TiO2), and 570 4% (KH-570, 4 wt% TiO2), plotted on a logarithmic scale. Shaded areas denote the low-q (Q1: 0.08–0.14 Å−1), mid-q (Q2: 0.14–0.23 Å−1), and high-q (Q3: 0.23–0.50 Å−1) regions used for Porod invariant integration. (b) Porod invariant integrals Q1, Q2, and Q3 for each region, representing different characteristic length scales and interface contributions. (c) Phase volume fractions obtained by combining Porod invariant analysis with DSC crystallinity results, including crystalline fraction (φc), crystalline-bound rigid amorphous fraction (φRAF−c), interfacial-bound rigid amorphous fraction (φRAF−i), and mobile amorphous fraction (φMAF). All φ are polymer-only; Γi is reported per composite volume.
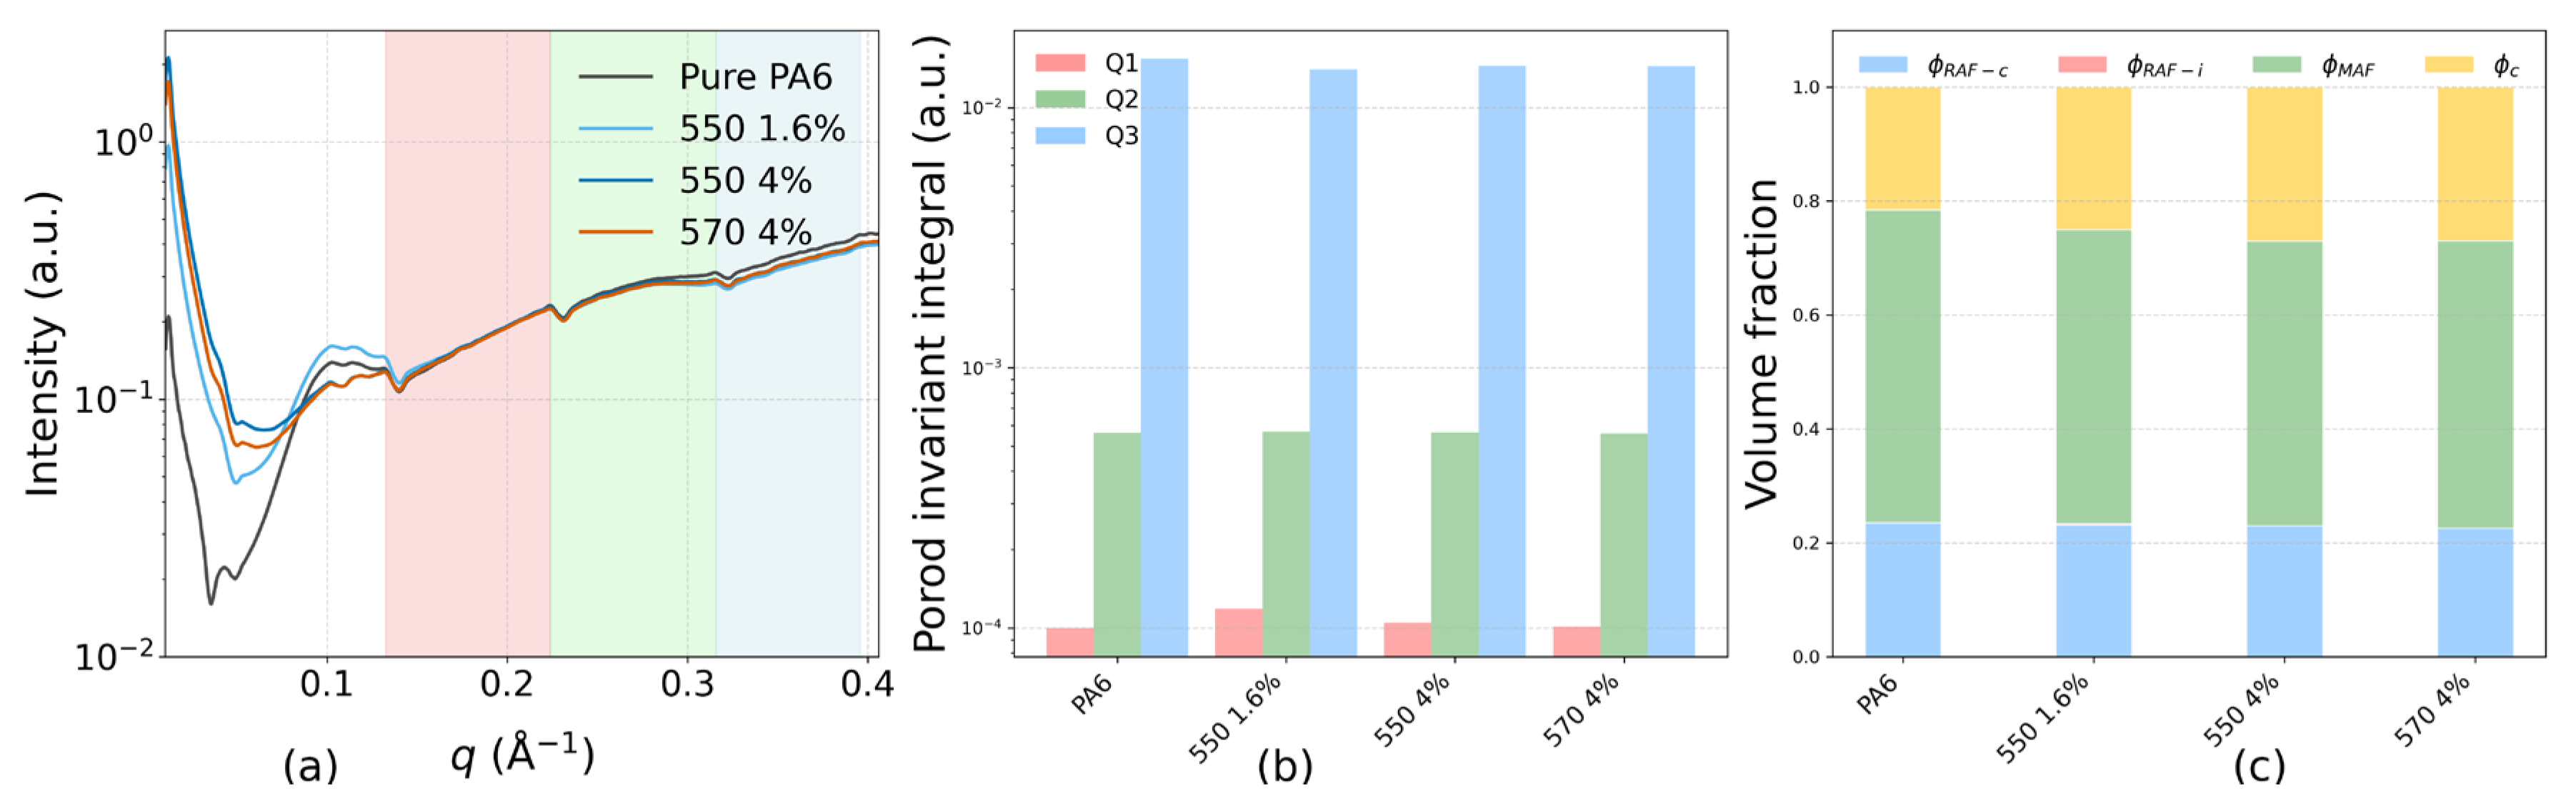
Figure 5.
(a) α/γ crystalline phase ratio (bars, left axis) and γ-phase crystallite size, Dγ(rep) (circles, right axis) for pure PA6 and TiO2-filled fibers with different silane coupling agents. (b) Hermans orientation factors for α- and γ-crystalline phases. Sample codes: pure PA6; 550-1.6% TiO2; 550-4% TiO2; 570-4% TiO2. Error bars denote standard deviations from replicate measurements.
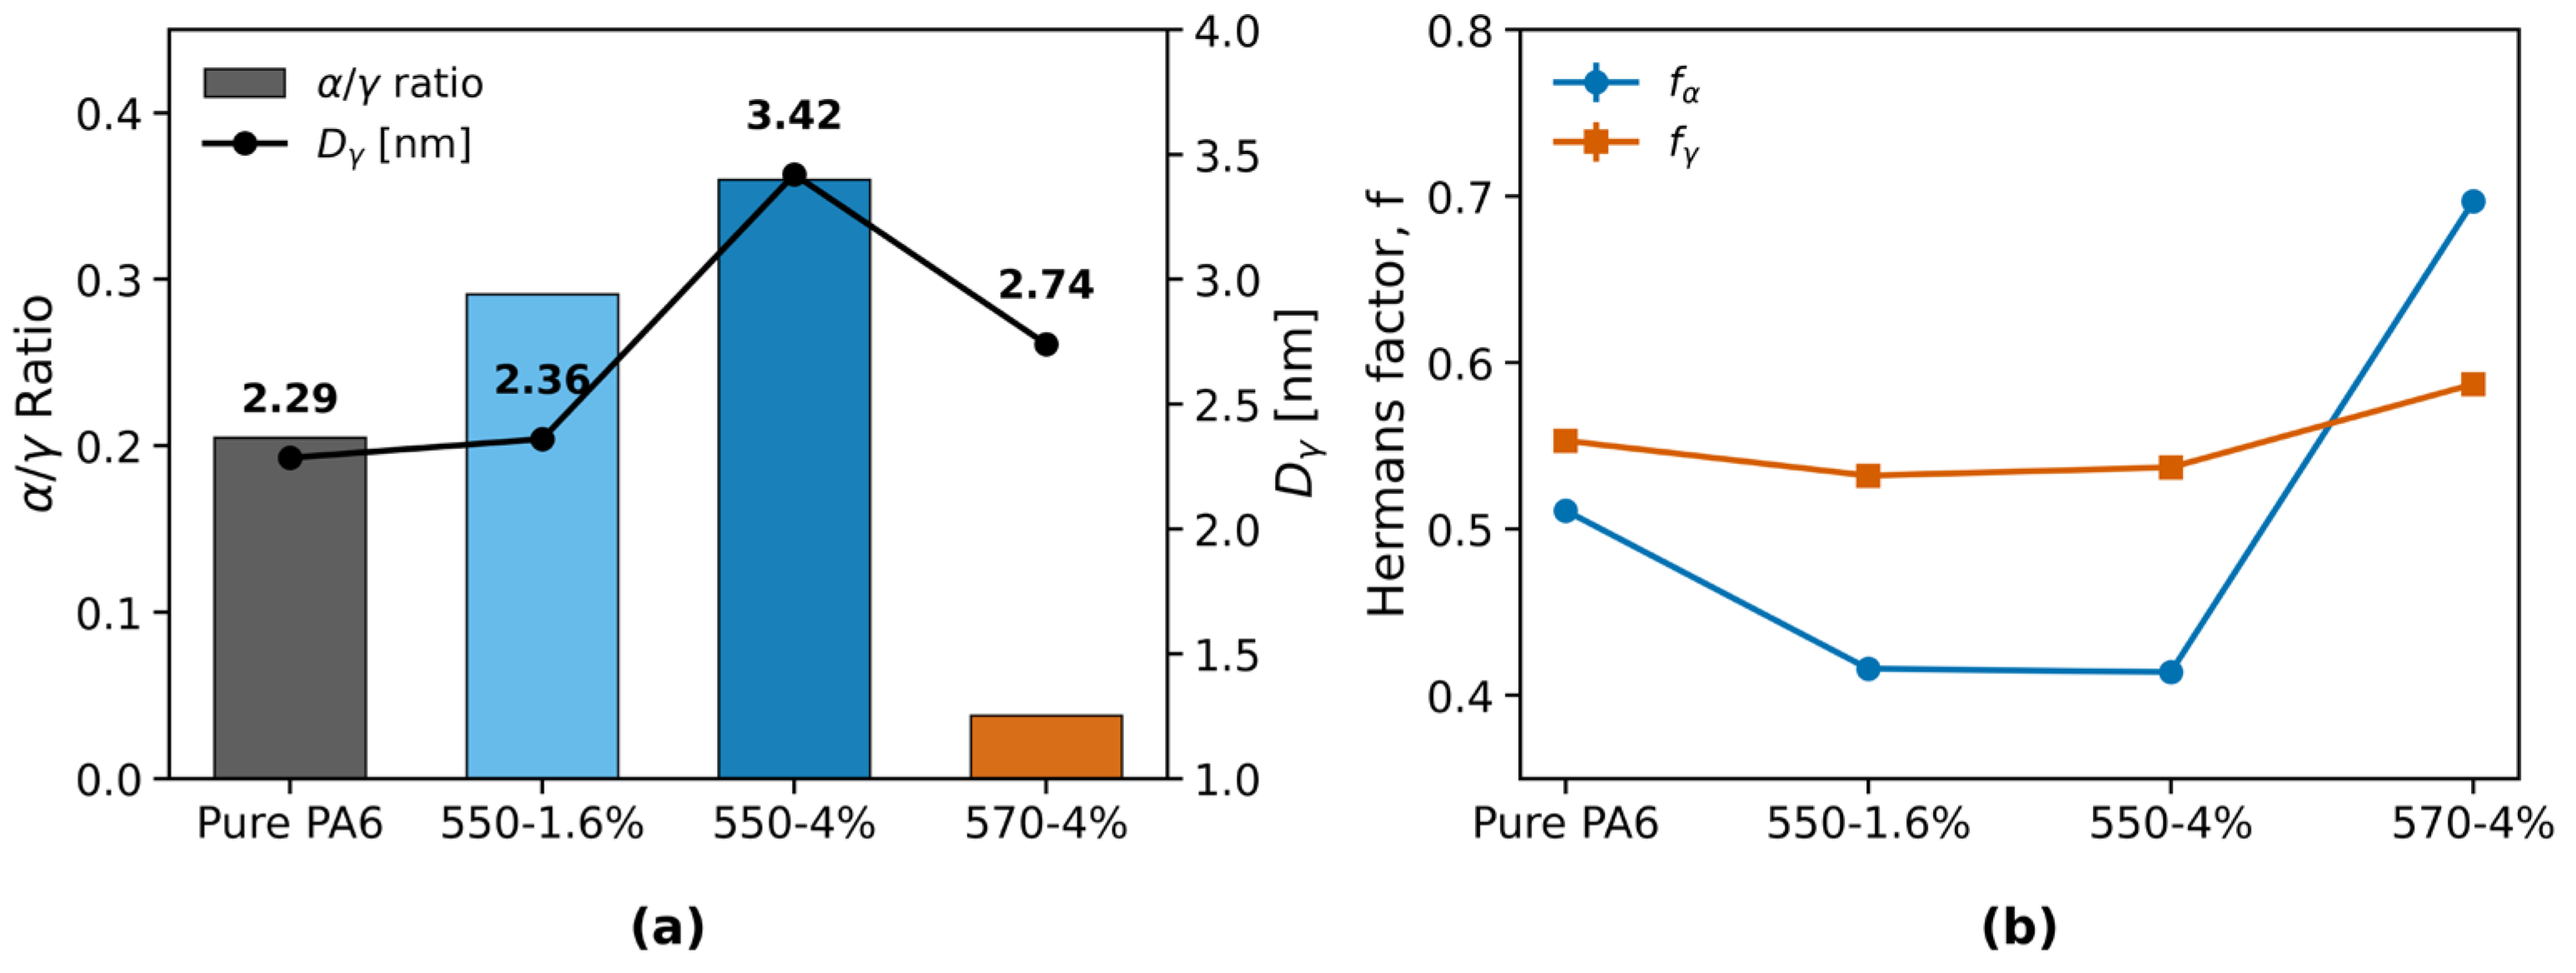
Figure 6.
Storage modulus (E′) as a function of temperature for pure PA6 and PA6/TiO2 fibers containing different TiO2 loadings and silane coupling agents, measured by DMA at 1 Hz. (b) Tensile strength (bars, left axis) and elongation at break (symbols, right axis) for the same samples; numbers on bars denote average strength values, and percentages above symbols indicate elongation. Linear densities (dtex) are listed in Table S4. Error bars represent standard deviations.
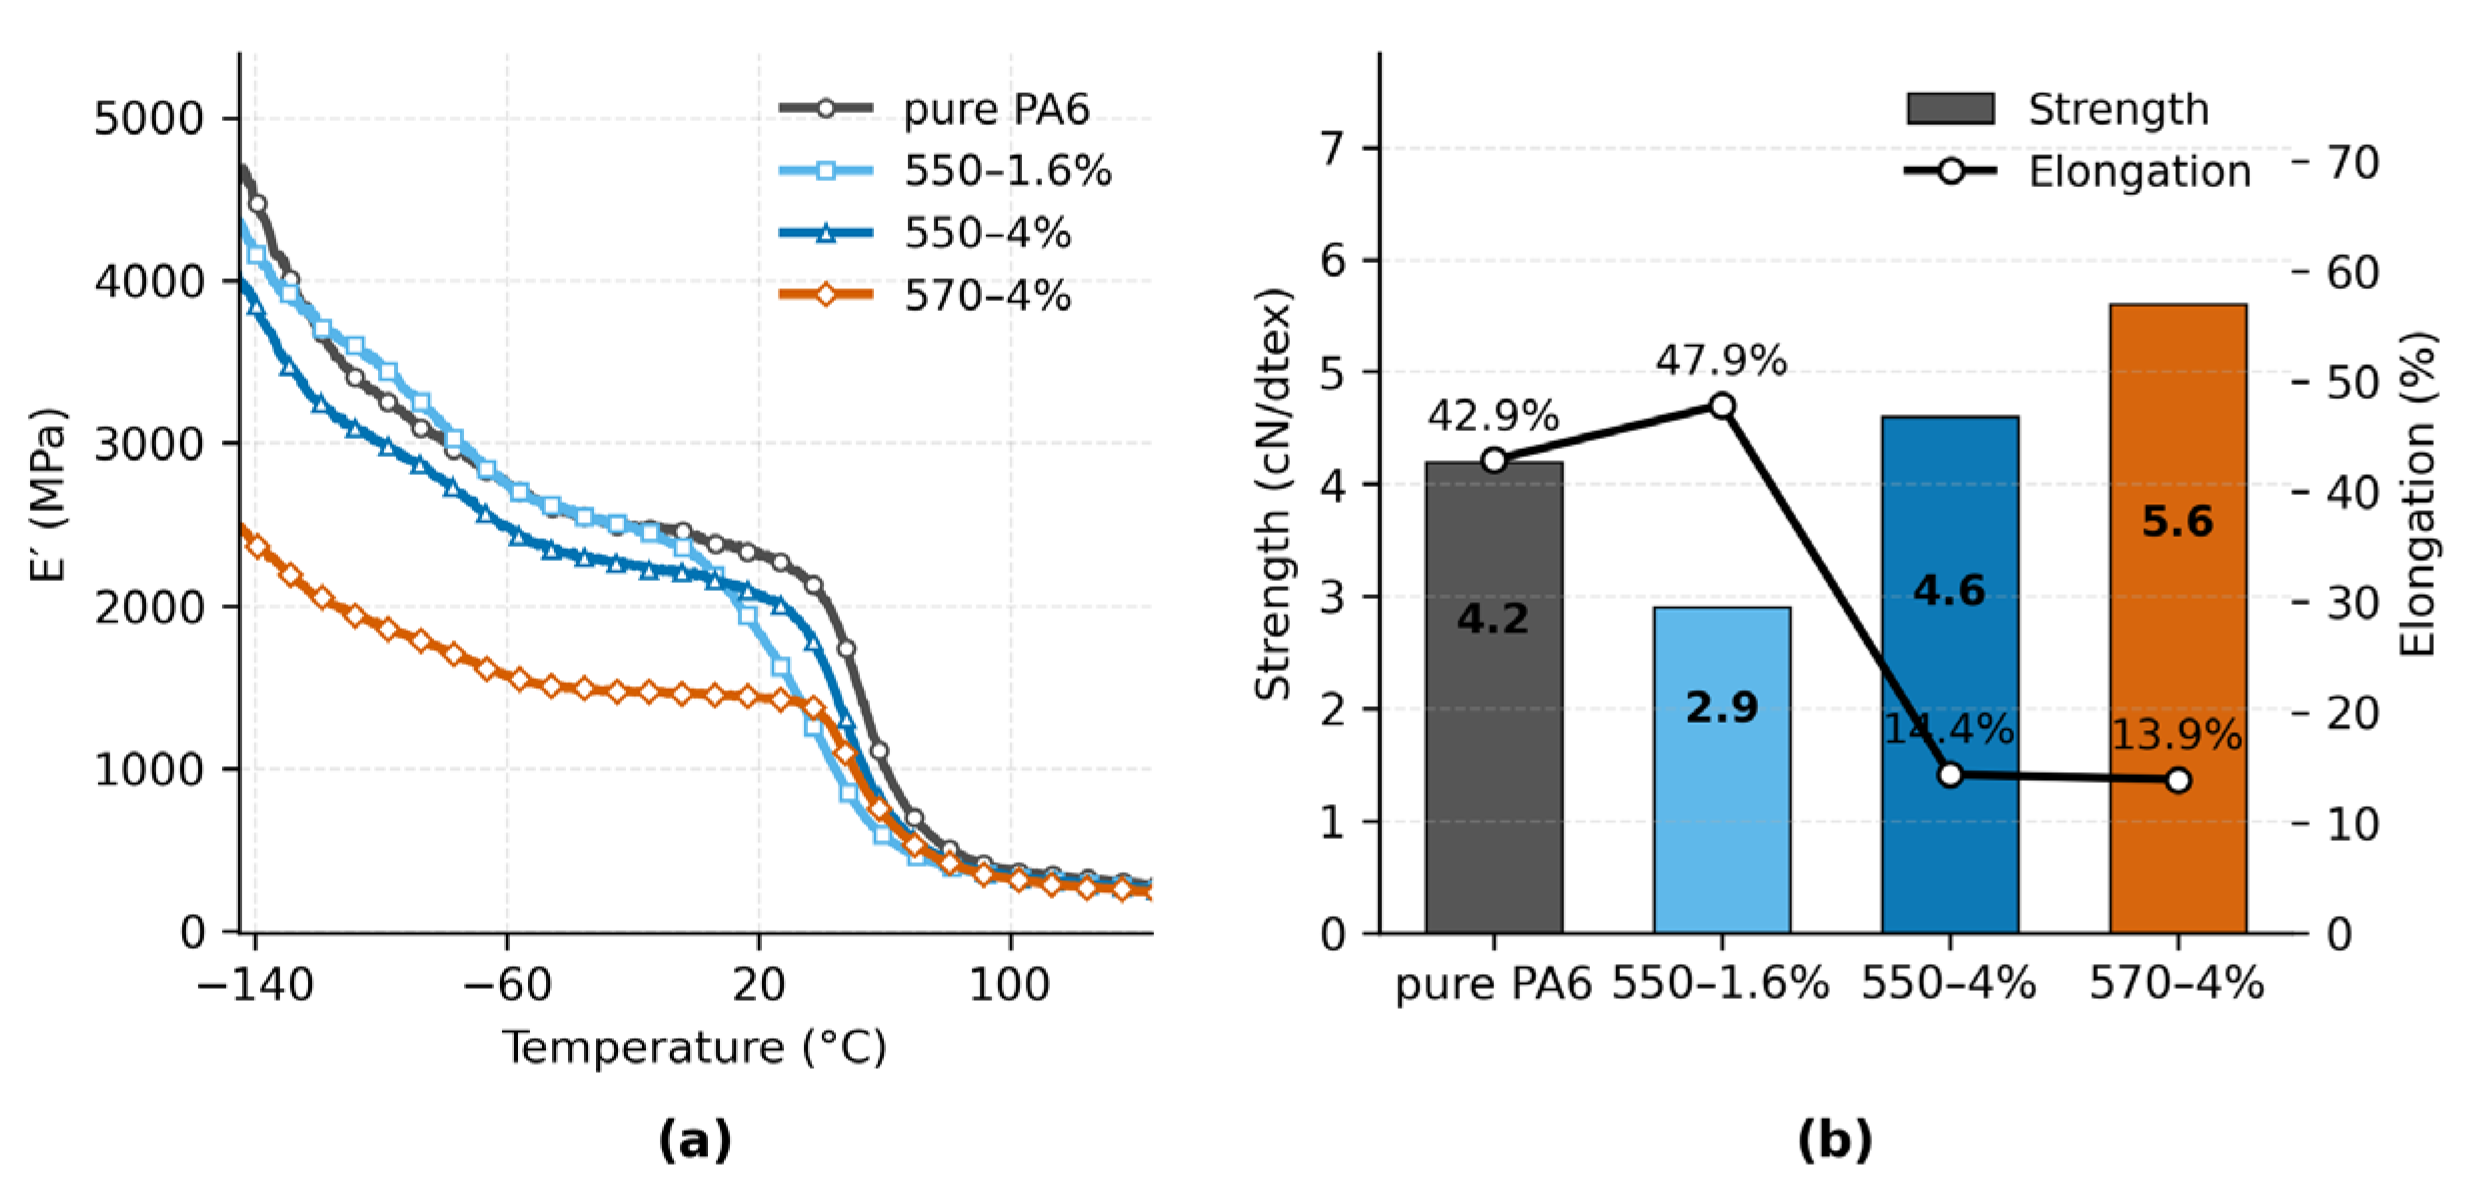
Figure 7.
(a) Complex viscosity (η*) as a function of angular frequency (ω) at 230 °C for pure PA6 and TiO2-filled fibers (550–1.6%, 550–4%). Curves represent measured η*; measurement details are provided in Methods. (b) Ultraviolet protection reported as log10(UPF) (dimensionless) for the same specimens. The dashed line marks UPF = 50 (log10 = 1.70). Replicate numbers and 95% one-sided lower confidence bounds (UPF_LCB) are reported in the Results, and UVA/UVB transmittance statistics are summarized in Table S5.
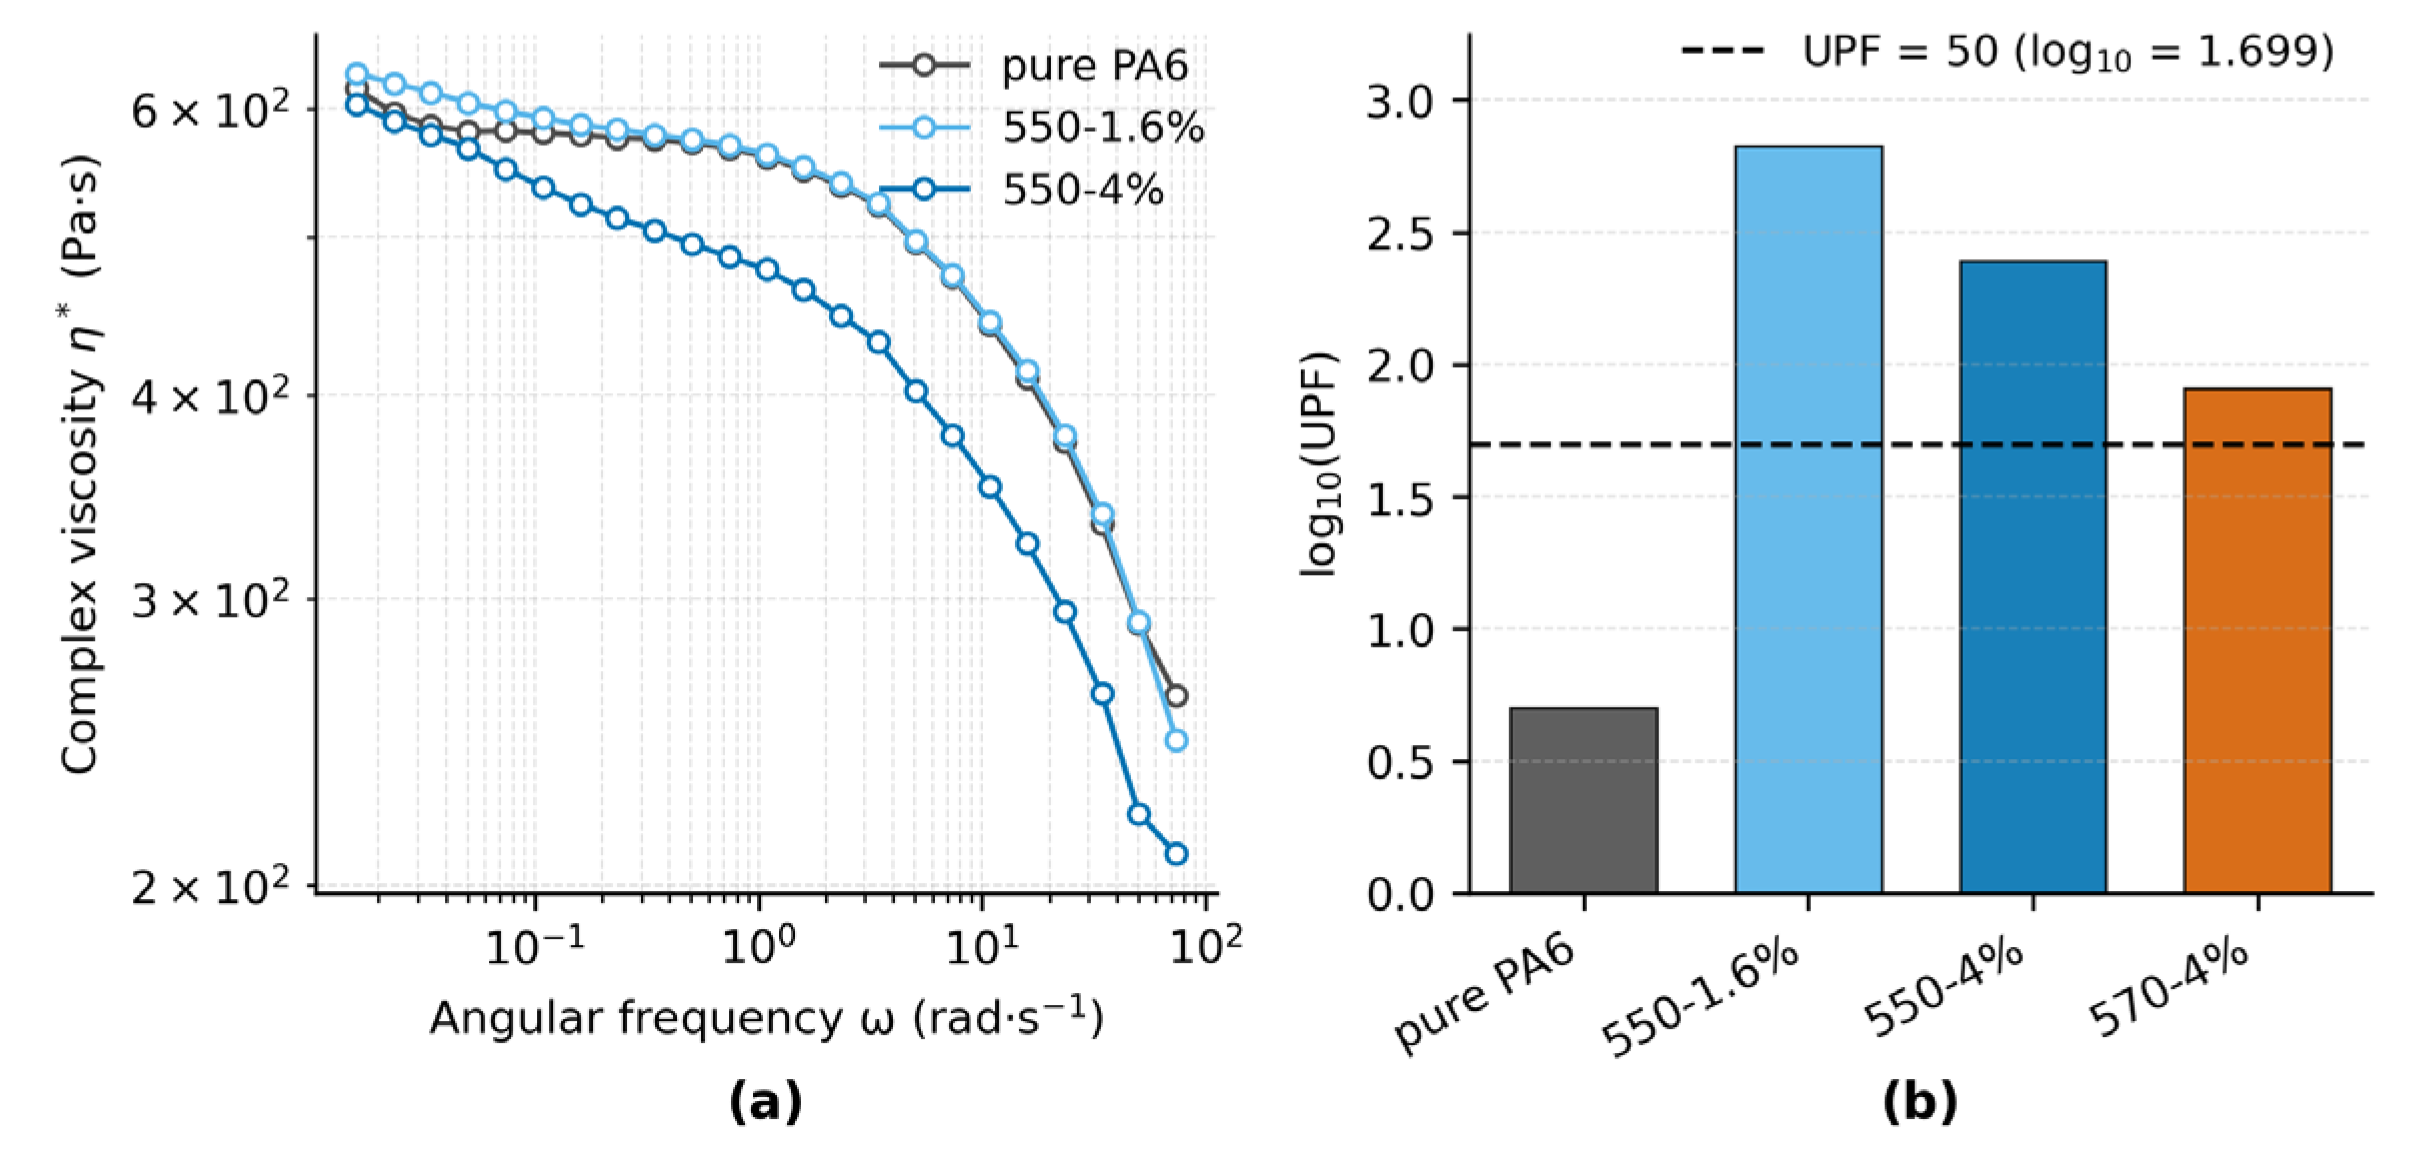
Figure 8.
(a) Spearman correlation heatmap among eight key parameters representing interface (RAF), kinetics (Tp), structure (Xc, α/γ, f(α), and performance (tenacity σ, elongation at break ε, log10(UPF)) of PA6/TiO2 fibers. Short labels are used; units and definitions are provided in Methods. (b) Evolution of α/γ (left axis, phase proportion) and Hermans orientation factor f(α) (right axis) in the KH550 series (0, 1.6, and 4 wt% TiO2). Tensile strength and elongation are annotated near each point. (c) Structure–performance map for representative samples (Pure PA6, 550–4%, and 570–4%). Marker size scales with σ and color with ε. Dashed arrows indicate the shift from the reference to TiO2-modified fibers. Panel (c) shares the same f(α) axis scale as the right axis in (b). Given n=4, the correlations are exploratory. Panels (b–c) use orientation-dominated and phase-fraction-dominated as outcome descriptors; the geometric drivers (Sv, ti, Γi) are reported in Table S2c.
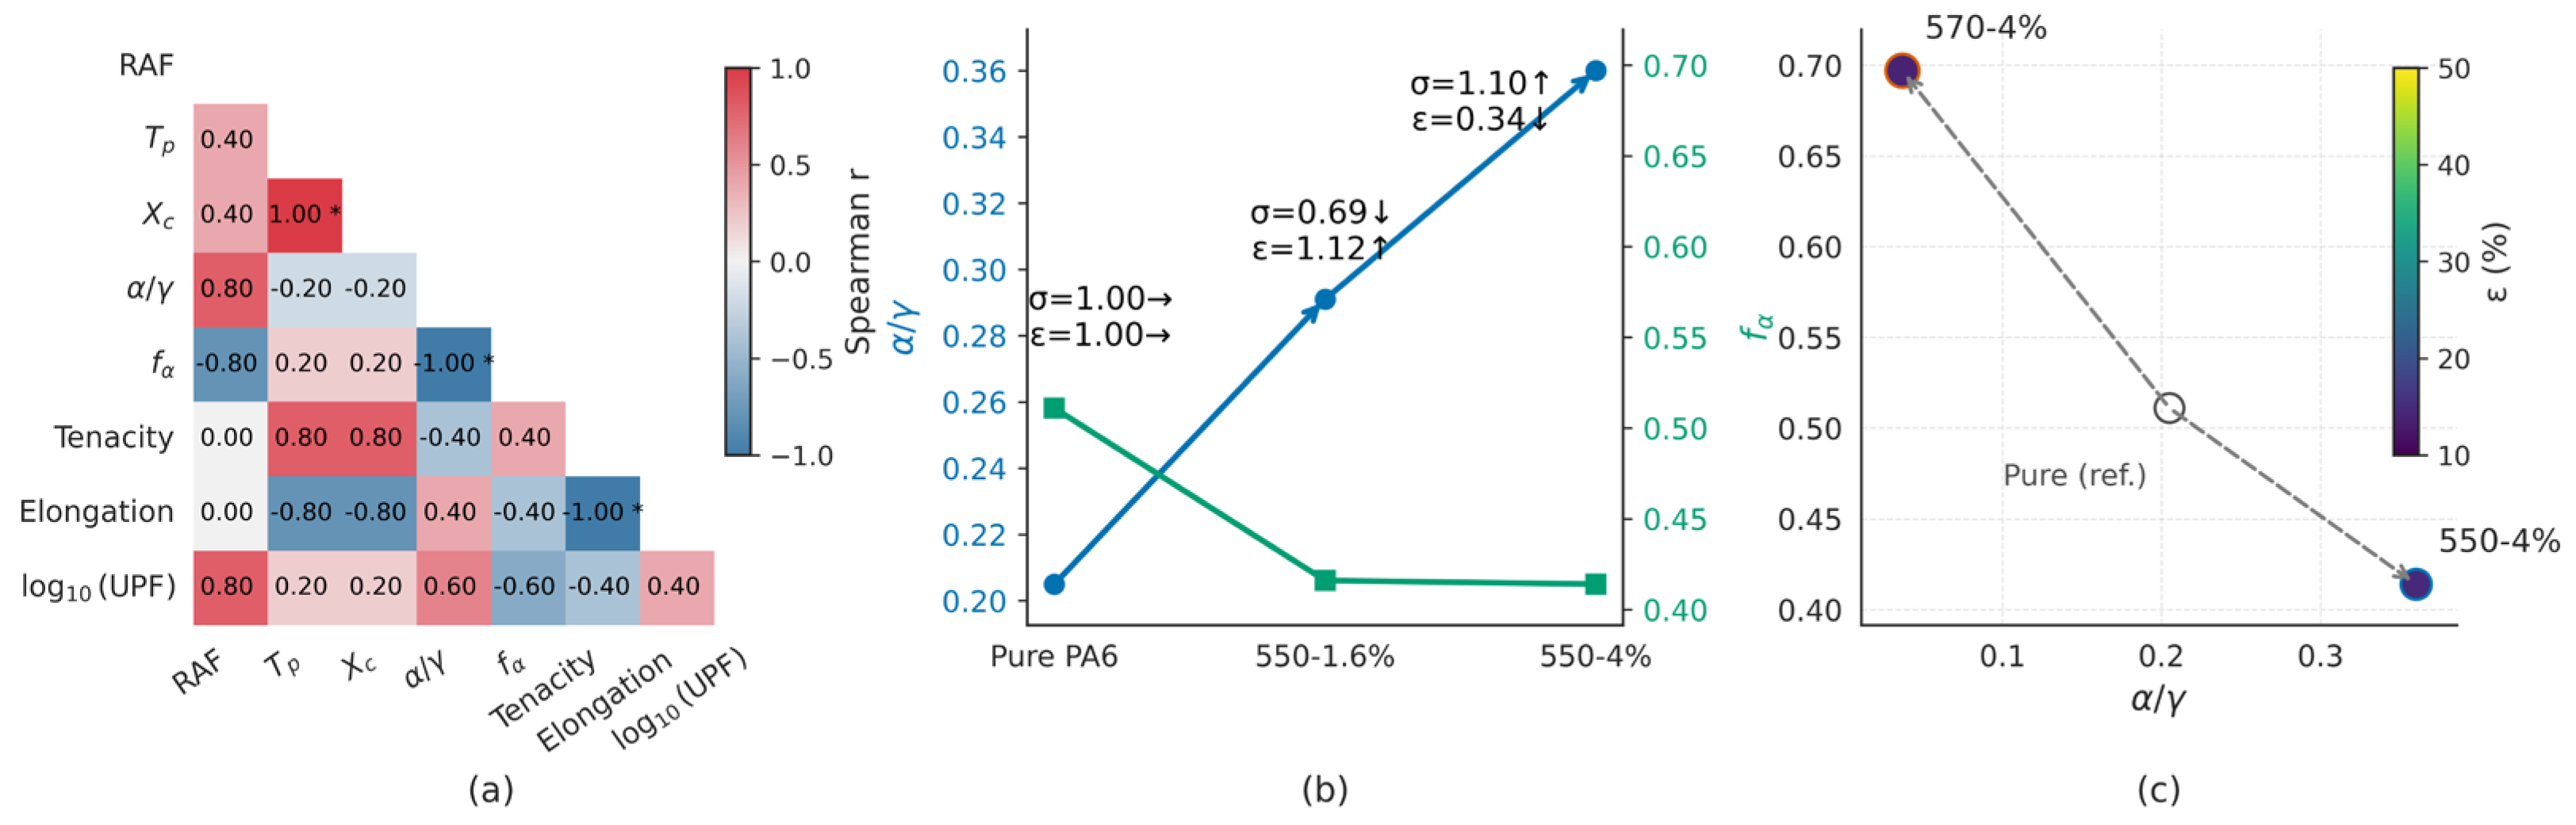

Table 1.
Fiber samples used for quantitative analysis and their preparation parameters.
| Sample ID | Silane Coupling Agent | TiO2 Content (wt%) | DrawRatio |
| pure PA6 | None | 0 | 3.0 |
| PA6-1.6 wt% TiO2-KH550 | KH550 | 1.6 | 3.0 |
| PA6-4.0 wt% TiO2-KH550 | KH550 | 4.0 | 3.0 |
| PA6-4.0 wt% TiO2-KH570 | KH570 | 4.0 | 3.0 |
Sample IDs (e.g., 550–1.6%, 570 4%) are shorthand notations used consistently in figures and tables to denote PA6/TiO2 fibers with specified TiO2 content (wt%) and silane coupling agents (KH550 or KH570).
Disclaimer/Publisher’s Note: The statements, opinions and data contained in all publications are solely those of the individual author(s) and contributor(s) and not of MDPI and/or the editor(s). MDPI and/or the editor(s) disclaim responsibility for any injury to people or property resulting from any ideas, methods, instructions or products referred to in the content. |
© 2025 by the authors. Licensee MDPI, Basel, Switzerland. This article is an open access article distributed under the terms and conditions of the Creative Commons Attribution (CC BY) license (http://creativecommons.org/licenses/by/4.0/).
Copyright: This open access article is published under a Creative Commons CC BY 4.0 license, which permit the free download, distribution, and reuse, provided that the author and preprint are cited in any reuse.


