
Submitted:
22 August 2025
Posted:
28 August 2025
You are already at the latest version
Abstract
Background/Objectives: Bovine anaplasmosis is a serious health problem in the livestock industry. Currently, there is a lack of information regarding the molecular mechanisms by which Anaplasma marginale adheres and invades bovine erythrocytes. Even more is unknown about how it binds to tick gut cells when the tick feeds on infected blood. In other pathogens, enolase has been shown to play a significant role in adhesion to host tissue, serving as the first step in invasion and colonization. Therefore, the elucidation of the role of the moonlighting protein enolase AmEno15 of A. marginale in the adhesion to erythrocytes, tick gut tissue, and plasminogen, is addressed in this work. Methods: We explored the role of A. marginale recombinant AmEno15 in the adhesion to spectrin, stomatin, fibronectin, and plasminogen. Firstly, we modeled AmEno15 tridimensionally and performed a molecular dynamics approach to understand the possibility that AmEno15 could bind to the proteins mentioned above. Then, we expressed recombinant AmEno15 and performed a microplate binding assay using fixed concentrations of the erythrocyte proteins, fibronectin, and plasminogen, as well as variable concentrations of AmEno15. Results: We found that AmEno15 binds to all assessed proteins in a specific and concentration-dependent manner. Spectrin and fibronectin-AmEno15 binding occurs at high concentrations, while stomatin and plasminogen-AmEno15 binding occurs at lower concentrations. Conclusions: Our findings bring us closer to understanding the role of the moonlighting protein enolase and suggest its participation in the A. marginale adhesion and invasion processes, providing the basis for the control of tick-borne diseases.
Keywords:
red blood cells
; moonlighting proteins
; cattle
; pathogens
; tick gut
1. Introduction
The pathogen Anaplasma marginale, the causative agent of bovine anaplasmosis, is a Gram-negative bacterium that infects red blood cells. In cattle, anaplasmosis is characterized by anemia, jaundice, abortions, loss of milk and meat production, and even death [1,2,3]. This disease is primarily transmitted by ticks of the genera Rhipicephalus and Dermacentor, which act as biological vectors, as well as by veterinary surgical materials and blood-sucking flies, considered as mechanical vectors [4]. Bovine anaplasmosis's most significant impact is on the production of dairy and meat derivatives. Therefore, addressing economic losses becomes a priority, not only in the world's tropical regions where vectors are abundant, but also in cold regions to which ticks have migrated due to climate change [5,6]. To date, efforts to develop an effective vaccine for bovine anaplasmosis have been unsuccessful. Thus, the search for new candidates demands powerful and novel bioinformatics strategies in vaccine design based on different proteins from those typically analyzed (MSPs, OMPs, T4SSs) [7,8]. In this regard, recent genomic approaches of A. marginale Mexican strains have proposed moonlighting proteins (MLPs) as potential vaccine candidates against anaplasmosis, due to their role in invasion, adhesion, and virulence, reported in other pathogens [9,10,11]. The MLPs' functional versatility represents an advantage for many pathogens, allowing them to perform multiple functions despite having a reduced genome, as in A. marginale [12,13]. The main characteristic of MLPs is the ability to perform a canonical function in the primary metabolism and a different secondary function in other cellular locations [14]. Due to the above, several MLPs have been proposed as immunogenic targets against bacteria and parasites, like enolase, a protein participating primarily in glycolysis, and in many pathogens has been considered as a virulence factor. Generally, the second function of enolase is a strategy to initiate host tissue invasion through adhesion to host cells, and this mechanism is associated with intracellular pathogens [15,16,17,18,19]. Recently, the identification of enolase AmEno15 in A. marginale has been reported; however, its role in anaplasmosis pathogenesis has not been elucidated [20]. Nevertheless, the enolase role in other pathogenic bacteria is well known,
as the enolase of Mycoplasma bovis and Mycoplasma hyopneumoniae, which binds to plasminogen, activates it into plasmin, and favors invasion of embryonic bovine lung cells and swine tracheal epithelial cells, respectively [21,22]. Additionally, in Mycoplasma suis, a pathogen of porcine red blood cells, recombinant enolase adheres to host tissue and induces an immune response, conferring partial resistance to mycoplasmosis [23,24]. On the other hand, plasminogen is not the only protein to which enolase can bind; it can also bind to proteins of the extracellular matrix, including fibronectin [10], vitronectin [25], laminin [26,27], and collagen [28]. It is worth noting that the process by which A. marginale adheres to and infects bovine erythrocytes remains unknown. Interestingly, molecular docking predictions suggest that AmEno15 might bind to erythrocyte membrane proteins as well as extracellular matrix proteins [29,30]. This fact is relevant for understanding the mechanism related to A. marginale internalization into its target cell. Thus, in this work, we employ a deep immunoinformatics approach to explore the possibility of AmEno15 binding to erythrocyte membrane proteins (spectrin and stomatin), extracellular matrix (ECM) proteins associated with the tick gut tissue (fibronectin), and plasminogen. Additionally, we demonstrate through microplate binding assays that AmEno15 effectively binds to these proteins. These results contribute to understanding the relationship pathogen-vector-host mediated by AmEno15, and its possible role in the adhesion and invasion of A. marginale to erythrocytes, as well as the molecular interaction with tick cells, a key step in the pathogen transmission.
2. Materials and Methods
2.1. Sequence Retrieval
The amino acid sequence of A. marginale enolase was obtained from the NCBI database by browsing the strain MEX-15-099-01 genome annotation (GenBank GCA_008690255.1), and downloading the protein sequence (KAA8472002.1) annotated as phosphopyruvate hydratase. The sequence protein was called AmEno15 and its molecular size was predicted in ProtParam (https://web.expasy.org/protparam/).
2.3. Tridimensional (3D) Modeling
AmEno15 was modeled using SwissModel, a bioinformatics tool that uses protein structure homology to build 3D protein structure models [24]. In this server, models from the AlphaFold DB are appended to the available structures/models [25]. All generated models in SwissModel using AlphaFold DB per-residue scores are transferred to values of pLDDT (predicted local distance difference test) from the underlying template to provide a global model evaluation, where pLDDT is a per-residue measure of local confidence scaled from 0 to 100, with higher scores indicating higher confidence and a more accurate prediction.
2.4. Molecular Docking and Molecular Dynamics Simulation
The docking of the modeled AmEno15 with four protein ligands was performed in the ClusPro server to analyze their binding affinity [31]. The proteins used were plasminogen (PDB: 4DUR), fibronectin (PDB: 3M7P), spectrin (PDB: 3LBX), and stomatin (PDB: 7WH3). For each molecular docking, ten models were generated in ClusPro and downloaded in PDB format, then visualized in UCSF ChimeraX [32]. The model with the highest score was selected.
Molecular dynamics simulation was performed in the iMODS server (https://imods.iqf.csic.es/) to evaluate the docking complex stability (AmEno15 and each ligand) by considering deformability, the B-factor, covariance map, variances, elastic network model, and eigenvalues. These parameters analyze the docked complexes' motions, as they are usually dynamic and entail significant and collective conformational changes [33].
2.5. AmEno15 Recombinant Expression
AmEno15 was subcloned into plasmid pET32a(+), and the expression was carried out in Escherichia coli strain Rosetta (DE3). This plasmid contains a thioredoxin tag (Trx) and a 6-histidine tag (6His), both of which are in frame with the AmEno15 sequence. Cultures transformed with recombinant plasmids were grown in Luria-Bertani medium containing 100 mg/mL ampicillin, and induced with 0.8 mM isopropyl thio-β-D-galactoside (IPTG, Sigma Aldrich). Before induction, cultures were grown at 37°C to an A600 of 0.6–0.8, and two conditions of time (4 and 16 h) and temperature (16°C and 37°C) were evaluated. After selecting the induction condition at 37°C for 4 h. Then, the cells were pelleted by centrifugation at 6000 × g for 30 min and stored at -80°C. The cells were lysed by incubation in 50 mM sodium phosphate (10 mL per g wet weight), pH 8.0, containing 300 mM NaCl, 1 mg/mL lysozyme and 1 mM phenylmethanesulfonyl fluoride (PMSF) for 30 min on ice and sonicated for six cycles, 15 s each with 15 s cooling between successive bursts at 5 output in a Branson sonifier 450. The lysate was centrifuged at 20000 × g for 30 min in a Beckman Ultracentrifuge (model LE-80K, 70 Ti rotor). The recombinant AmEno15 was purified from the soluble fraction with a His6-tagged r-Pfen using Ni-NTA (Thermo Scientific) acid affinity chromatography protocol.
2.6. Microplate Binding Assays to Erythrocyte Membrane Proteins, Plasminogen, and Fibronectin
Microplate assays analyzed the interaction of AmEno15 with erythrocyte membrane proteins (stomatin and spectrin), plasminogen, and fibronectin. Briefly, a 96-well ELISA plate (Costar, Fisher Scientific) was coated with 100 μL of 3 μg/mL spectrin (S3644, Sigma-Aldrich, Uniprot P02549), stomatin (ab132752, Abcam, Uniprot P27105), plasminogen (SRP6518, Sigma-Aldrich, Uniprot P00747), or fibronectin (F2006, Sigma-Aldrich, Uniprot P02751) and incubated overnight at 4°C. The plates were washed once with 100 μL of PBST (0.05% Tween-20) (P4417 and P9416, Sigma Aldrich), followed by a blocking with 100 μL of 5% BSA-PBST 0.05% for 2 h at 37°C. After blocking, one wash was performed with 100 μL of PBST 0.05% and 100 μL of recombinant AmEno15 was added at different concentrations (ranging from 10 to 0.039 μg/mL), and incubated for 2 h at 37°C. After incubation, the plate was washed with 100 μL of PBST 0.05%. Then, 100 μL of Trx tag antibody, mAb, mouse (dilution 1:1000, Cat. A00180-40, GeneScript) was added and incubated at 37°C for 1 h. Another wash with PBST 0.05% was performed before incubation with 100 μL of HRP-conjugated goat anti-mouse IgG (H+L) (dilution 1:10,000, Cat. 31430, Thermo Scientific) at 37°C for 1 h. After washing with PBST 0.05%, 100 μL of the substrate 1-Step™ Ultra TMB-ELISA Substrate (Thermo Scientific) was added and incubated for 15 min at 37°C. The reaction was then stopped with 100 μL of 2 M sulfuric acid (Baker), and the absorbance was measured at 450 nm (Multiskan FC, Thermo Scientific). Each binding assay comprised three independent experiments with three replicates each. In the binding assays to spectrin and fibronectin, the AmEno15 concentrations used were 10 μg/mL, 5 μg/mL, 2.5 μg/mL, 1.25 μg/mL, 0.625 μg/mL, and 0.312 μg/mL, whereas, with stomatin and plasminogen, the AmEno15 concentrations were 1.25 μg/mL, 0.625 μg/mL, 0.312 μg/mL, 0.156 μg/mL, 0.078 μg/mL, and 0.039 μg/mL. The specificity control for primary and secondary antibodies were the ligand-coated wells assayed with BSA at different concentrations (ranging from 10 μg/mL to 0.039 μg/mL), and carbonate buffer-coated wells (only AmEno15 at 10 μg/mL to 0.039 μg/mL) were used as controls for AmEno15 specificity.
2.6. Statistical Analysis
The statistical significance of the data was determined using one-way Analysis of Variance (ANOVA) with a post hoc Duncan's Multiple Range Test (DMRT) in STATISTICA software version 7.0 [34]. P values of < 0.05 were considered statistically significant. All measurements were conducted in triplicate with three internal repetitions. Plots were created in RStudio [35].
3. Results
3.1.3D AmEno15 Modeling
A 3D model of AmEno15 monomer was generated using the template of the enolase from A. marginale AlphaFold DB (Q5PAS6.1.A), with an average pLDDT of 95.40%, 100% sequence identity, and 80% coverage. A Ramachandran plot showed that 95.10% of the amino acids fell within the favored regions; hence, the AmEno15 3D model could be considered a structure with good resolution, since the scores of over 90% correspond to protein structures with a resolution of 2-3 Å (Figure 1). The AmEno15 3D model assessment yielded a MolProbity score of 1.24, which reflects its high quality. This score is calculated by combining clashscore (bad steric overlap), Ramachandran, and rotamers, and is normalized to be on the same scale as X-ray resolution.
3.2. AmEno15 Recombinant Expression
The recombinant expression of AmEno15-Trx-6His resulted in a protein with a molecular weight of 64 kDa (Figure 2), which is consistent with ProtParam that predicted a molecular weight of 64.57 kDa, corresponding to 587 amino acids.
3.2. Molecular Docking and Molecular Dynamics Simulation
Four protein–protein dockings were performed using AmEno15 as a receptor, and the proteins spectrin (3LBX), stomatin (7WH3), fibronectin (3M7P), and plasminogen (4DUR), as ligands. The ten generated docking models were retrieved as "models with balanced coefficients since we do not know what forces dominate the complex protein–protein," as recommended in the ClusPro manual. The best docking models predicted correspond to the lowest energy model, which were -928.7 kcal/mol, -880.6 kcal/mol, -1133.4 kcal/mol, and -1046.2 kcal/mol, for AmEno15-3LBX, AmEno15-7WH3, AmEno15-3M7P, and AmEno15-4DUR, respectively. Additionally, all models were evaluated using Ramachandran plots to validate the docking quality in PDBsum. According to this, the obtained values for the most favored regions were 90.6% (AmEno15-3LBX), 87.3% (AmEno15-7WH3), 84.6% (AmEno01-3M7P), and 76.8% (AmEno15-4DUR) (Figure 3, Figure 4, Figure 5 and Figure 6, panels A).
Additionally, molecular dynamics simulations were performed using the iMODs server. The green graph of all dockings showed areas of hinges indicating the deformability degree measured between 0 and 1 Å, which in all models is lower than 1 Å. Notably, the docking AmEno15-7WH3 showed the lowest deformability values, while the docking AmEno15-4DUR showed the highest values (Figure 3, Figure 4, Figure 5 and Figure 6, Panels B). The B-factor (pink graphs) showed the protein flexibility and movement, allowing the identification of mobile or static regions within the structure. Regions with high B-factors indicate greater flexibility and movement, while those with low B-factors suggest static regions. According to this, our results indicate regions with significant flexibility in the four docking (Figure 3, Figure 4, Figure 5 and Figure 6, Panels C). Regarding the eigenvalues (purple graphs), which represent the energy required to deform the structure, we found that the values for each docking were 6.174995 e-06 (AmEno15-3LBX), 6.106602 e-05 (AmEno15-7WH3), 8.125026 e-05 (AmEno01-3M7P), and 9.918514 e-06 (AmEno15-4DUR). As the lower values denote easier deformability, the results suggest that docking AmEno15 with spectrin (3LBX) and plasminogen (4DUR) are the most flexible structures, requiring less energy to be deformed (Figure 3, Figure 4, Figure 5 and Figure 6, Panels D). In the conformational change analysis, the variance map, showed the parts of the docking complex more likely to move together; in this regard, we found in all docked models high values of cumulative variance (cyan bars) representing significant movements, while low individual variances percentages (purple bars), indicated the atoms more likely to remain in place or move together as a rigid unit (Figure 3, Figure 4, Figure 5 and Figure 6, Panels E). The covariance maps represent the movement patterns between linked amino acid residues, which result in molecular communication and interactions within the docked structure, revealing key regions of protein function. In this regard, our results revealed red regions along the diagonal line of the map in the four docked complexes, which represent linked regions among the receptor and ligand amino acids. In contrast, the regions in white and blue were out of the diagonal line, which represent the uncorrelated and anti-correlated amino acids, respectively (Figure 3, Figure 4, Figure 5 and Figure 6, Panels F). Lastly, the elastic network model showed that each dot in the graph corresponded to one spring between a pair of atoms. The more grey the dot, the more rigid the spring (grey-black scale). Our results showed dots in light grey along the diagonal, which represent a low spring's stiffness, resulting in highly flexible docked complexes (Figure 3, Figure 4, Figure 5 and Figure 6, Panels G).
3.3. Microplate Binding Assays to Stomatin, Spectrin, Plasminogen, and Fibronectin
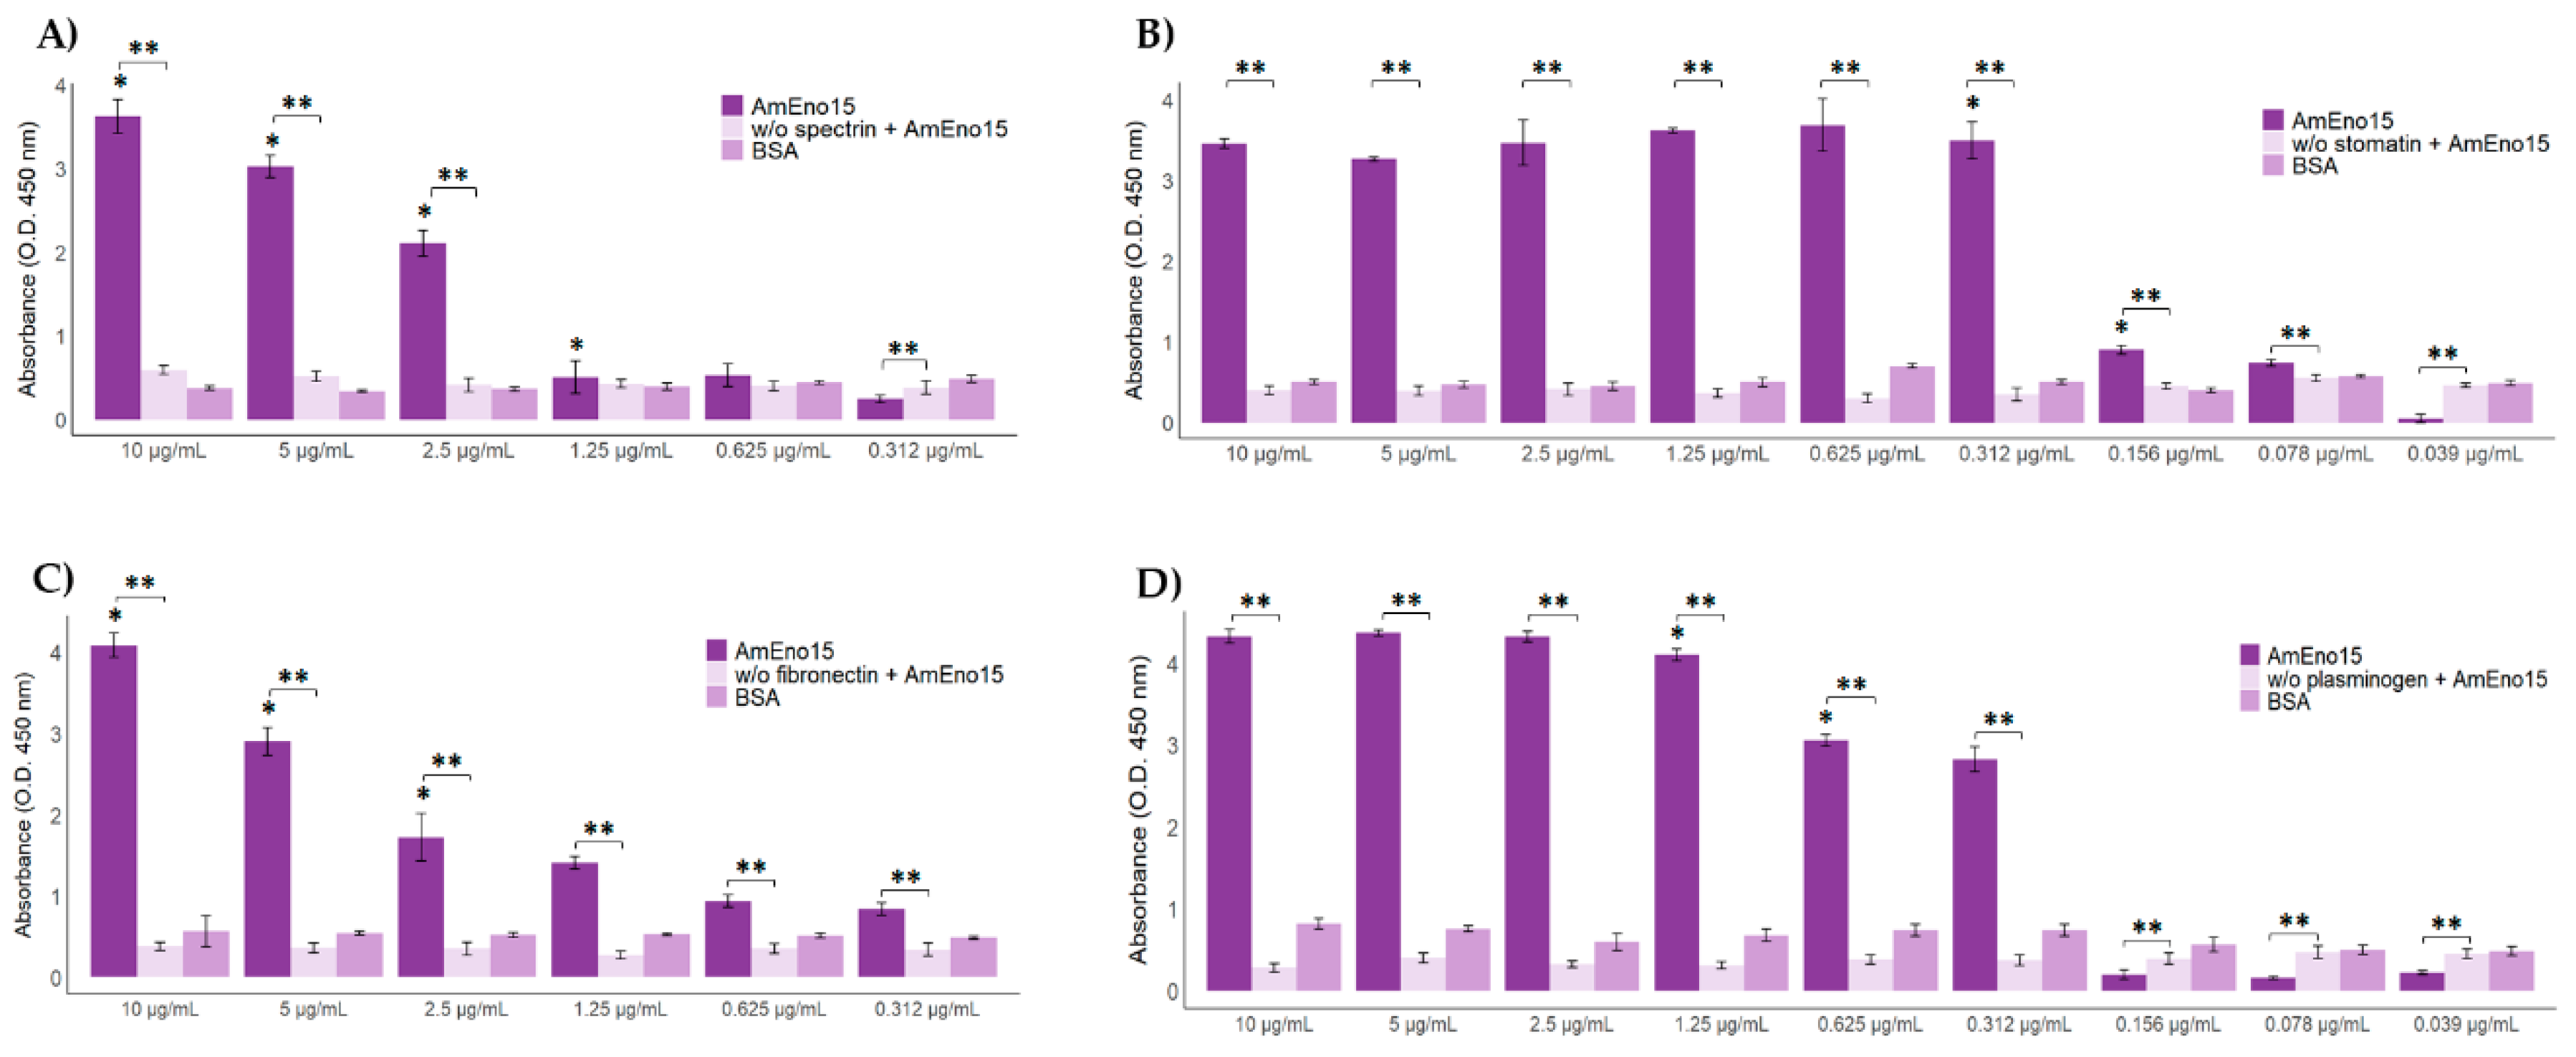
The binding of recombinant AmEno15 to erythrocyte proteins (stomatin and spectrin), fibronectin, and plasminogen was evaluated by a microplate binding assay. We observed that AmEno15 binds to spectrin in a concentration-dependent manner ranging from 10 to 0.312 μg/mL, but not in the BSA control (Figure 7A). Interestingly, the binding assay of AmEno15 to stomatin, with concentrations ranging from 10 to 0.312 μg/mL, showed a similar binding in all cases, but not in a concentration-dependent manner. Nevertheless, when we used lower concentrations (0.312 to 0.039 μg/mL), we did observe binding in a concentration-dependent manner (Figure 7B). As in the previous assay, we did not observe binding to the BSA control. Regarding the AmEno15 to fibronectin binding assay, we observed a concentration-dependent binding in all cases (10 to 0.312 μg/mL), and we did not observe binding to the BSA control (Figure 7C). Finally, in the assay using plasminogen, we found that in concentrations of 10, 5, and 2.5 μg/mL, there is no significant difference in the binding of AmEno15. Notably, at concentrations 1.25, 0.625, and 0.312 μg/mL, the results suggest a concentration-dependent binding. Nevertheless, in BSA control wells, at lower concentrations than 0.312 μg/mL, we did not observe any binding (Figure 4D). It is important to note that the control used in all assays (only AmEno15 at different concentrations) revealed absorbances that corresponded to a non-specific binding, which supports the idea that the binding of AmEno15 depends exclusively on the presence of the ligand.
4. Discussion
So far, bovine anaplasmosis is a disease with many unanswered questions and molecular processes that need to be understood. Several efforts have been made to elucidate the fundamental biological mechanisms of A. marginale, including adhesion and invasion of erythrocytes, as well as adhesion to tick cells [36,37,38]. Nevertheless, research must continue to identify the leading proteins of these key mechanisms and to propose new strategies to develop vaccine candidates. In this regard, only a few studies of the molecules involved in the A. marginale-erythrocyte interaction have been reported. Like Noh et al. [36], who identified A. marginale proteins Msp1a, Mlp3, Am779, Msp3, as adhesins for bovine erythrocytes, and Omp13 as a binding protein to tick cells. Similarly, the recombinant proteins Msp1a and Msp1b of A. marginale expressed in E. coli allowed this bacterium to adhere to bovine erythrocytes [38].
According to this, there is growing research on this topic to understand the A. marginale target cell adhesion, whether in the host or the biological vector. Thus, we performed an immunoinformatics analysis that allowed us to predict the binding potential of AmEno15 to diverse ligand proteins. In this regard, we include as ligands some erythrocyte membrane proteins like spectrin (3LBX) and stomatin (7WH3), and other proteins probably related to bacterial pathogenesis (fibronectin (3M7P9), and plasminogen (4DUR)) [10,39,40]. The bioinformatics analysis of the Ramachandran plot scores for the four docked complexes strongly suggests feasible interactions of AmEno15 with all ligands. Additionally, the molecular dynamics of these complexes revealed the potential interactions between individual amino acid residues, as well as a high degree of deformability. Therefore, the AmEno15 may be able to bind to ligands involved in different pathogenic processes.
Experimentally, we demonstrated that AmEno15 can bind specifically to spectrin and stomatin in a concentration-dependent manner. These results could support the fact that A. marginale binding to the membrane is key in the invasion and establishment inside the erythrocyte, which is fundamental for pathogen survival in the host. Therefore, we propose that A. marginale could utilize AmEno15 to bind to stomatin during the initial adhesion process, and potentially, AmEno15 would bind to spectrin once A. marginale reaches the inside of the erythrocytes, since spectrin is located at the inner cytoplasmic face and is the principal constituent of the erythrocyte membrane skeletal network [41].
In addition, we prove that the AmEno15 also binds to fibronectin and plasminogen in a concentration-dependent manner. In this regard, we hypothesize that A. marginale could use AmEno15 as a virulence factor to invade fibronectin-producing cells [42]. The above is based on the fact that some members of the Anaplasmataceae family, such as A. phagocytophilum, can infect and lyse endothelial cells, which is crucial in the bacterial infection and invasion [43]. Likewise, experiments using dual fluorescence microscopy showed co-localization of A. marginale with an endothelial cell marker in tissue sections from an infected calf, suggesting a potential tissue invasion [37]. Although this process remains unexplored in A. marginale, our findings do not exclude this possibility.
Concerning the vector, we propose that AmEno15 may participate in the fibrinolysis process by binding to circulating plasminogen in host blood, thereby avoiding coagulation and facilitating tick blood intake [44]. Additionally, we think that the AmEno15-fibronectin interaction could be relevant in the context of the A. marginale infection to tick gut cells, similarly to Borrelia burgdorferi, whose membrane proteins interact with a protein containing fibronectin domains in the Ixodes spp gut cells. This process induces a spirochete congregation in the tick gut, facilitating the bacteria's exit to the salivary glands [39]. However, this hypothesis must be studied in greater depth in A. marginale.
Since the identification of the moonlighting proteins in the Mexican strains of A. marginale [11], elucidating the role of AmEno15 was a priority. Our results showed that AmEno15 binds specifically to spectrin, stomatin, fibronectin, and plasminogen; however, the molecular role of AmEno15 in each interaction remains to be explored under in vivo conditions. Therefore, this work represents the first approach to understanding, particularly the role of enolase, in binding to erythrocyte proteins, extracellular matrix components, tick gut proteins, and plasminogen.
It is undeniable that our findings contribute to the knowledge of A. marginale biology and the elucidation of the molecular communication between vector-pathogen-host, a topic of research that may be useful in the development of drugs and/or vaccines against tick-borne diseases.
Author Contributions
Conceptualization, REQC, HAD, ABS; methodology, MSLL, REQC, and HAD; formal analysis, REQC, HAD, ABS, and MSLL; investigation, MSLL; data curation, MSLL, REQC, and HAD; writing—original draft preparation, REQC and MSLL; writing—review and editing, REQC, HAD; project administration, REQC; funding acquisition, REQC. All authors have read and agreed to the published version of the manuscript.
Funding
This research was funded by CONAHCYT, grant number CF-2023-I-2600.
Data Availability Statement
Data generated or analyzed during this study are available in the published article.
Conflicts of Interest
The authors declare no conflicts of interest.
Acknowledgements
To SECIHTI, for scholarship granted to Maria del Socorro López-López. No. 2060876 attached to the Master's Degree in Natural Resources Management, CIB-UAEM.
References
- Kuttler, K.L. Anaplasma Infections in Wild and Domestic Ruminants: A Review. J. Wildl. Dis. 1984, 20, 12–20. [Google Scholar] [CrossRef]
- Kocan, K.M.; de la Fuente, J.; Blouin, E.F.; Coetzee, J.F.; Ewing, S. a. The Natural History of Anaplasma Marginale. Vet. Parasitol. 2010, 167, 95–107. [Google Scholar] [CrossRef]
- Aubry, P.; Geale, D.W. A Review of Bovine Anaplasmosis. Transbound. Emerg. Dis. 2011, 58, 1–30. [Google Scholar] [CrossRef] [PubMed]
- Kocan, K.M.; de la Fuente, J.; Blouin, E.F.; Garcia-Garcia, J.C. Anaplasma Marginale (Rickettsiales: Anaplasmataceae): Recent Advances in Defining Host–Pathogen Adaptations of a Tick-Borne Rickettsia. Parasitology 2004, 129, S285–S300. [Google Scholar] [CrossRef]
- Barbet, A.F.; Blentlinger, R.; Yi, J.; Lundgren, A.M.; Blouin, E.F.; Kocan, K.M. Comparison of Surface Proteins of Anaplasma Marginale Grown in Tick Cell Culture, Tick Salivary Glands, and Cattle. Infect. Immun. 1999, 67, 102–107. [Google Scholar] [CrossRef] [PubMed]
- Estrada-Peña, A.; Acedo, C.S.; Quílez, J.; Del Cacho, E. A Retrospective Study of Climatic Suitability for the Tick Rhipicephalus (Boophilus)Microplus in the Americas. Glob. Ecol. Biogeogr. 2005, 14, 565–573. [Google Scholar] [CrossRef]
- Cangussu, A.S.R.; Mariúba, L.A.M.; Lalwani, P.; Pereira, K.D.E.S.; Astolphi-Filho, S.; Orlandi, P.P.; Epiphanio, S.; Viana, K.F.; Ribeiro, M.F.B.; Silva, H.M.; et al. A Hybrid Protein Containing MSP1a Repeats and Omp7, Omp8 and Omp9 Epitopes Protect Immunized BALB/c Mice against Anaplasmosis. Vet. Res. 2018, 49, 6. [Google Scholar] [CrossRef]
- Morse, K.; Norimine, J.; Hope, J.C.; Brown, W.C. Breadth of the CD4+ T Cell Response to Anaplasma Marginale VirB9-1, VirB9-2 and VirB10 and MHC Class II DR and DQ Restriction Elements. Immunogenetics 2012, 64, 507–523. [Google Scholar] [CrossRef]
- Henderson, B.; Martin, A. Bacterial Virulence in the Moonlight: Multitasking Bacterial Moonlighting Proteins Are Virulence Determinants in Infectious Disease. Infect. Immun. 2011, 79, 3476–3491. [Google Scholar] [CrossRef]
- Esgleas, M.; Li, Y.; Hancock, M.A.; Harel, J.; Dubreuil, J.D.; Gottschalk, M. Isolation and Characterization of α-Enolase, a Novel Fibronectin-Binding Protein from Streptococcus Suis. Microbiology 2008, 154, 2668–2679. [Google Scholar] [CrossRef]
- Quiroz-Castañeda, R.E.; Aguilar-Díaz, H.; Coronado-Villanueva, E.; Catalán-Ochoa, D.I.; Amaro-Estrada, I. Molecular Identification and Bioinformatics Analysis of Anaplasma Marginale Moonlighting Proteins as Possible Antigenic Targets. Pathogens 2024, 13. [Google Scholar] [CrossRef]
- Yadav, P.; Singh, R.; Sur, S.; Bansal, S.; Chaudhry, U.; Tandon, V. Moonlighting Proteins: Beacon of Hope in Era of Drug Resistance in Bacteria. Crit. Rev. Microbiol. 2023, 49, 57–81. [Google Scholar] [CrossRef]
- Dantán-González, E.; Quiroz-Castañeda, R.E.; Aguilar-Díaz, H.; Amaro-Estrada, I.; Martínez-Ocampo, F.; Rodríguez-Camarillo, S. Mexican Strains of Anaplasma Marginale: A First Comparative Genomics and Phylogeographic Analysis. Pathog. (Basel, Switzerland) 2022, 11. [Google Scholar] [CrossRef]
- Jeffery, C.J. What Is Protein Moonlighting and Why Is It Important? Moonlighting Proteins Nov. Virulence Factors Bact. Infect. 2016, 1–19. [Google Scholar] [CrossRef]
- Chen, N.; Yuan, Z.-G.; Xu, M.-J.; Zhou, D.-H.; Zhang, X.-X.; Zhang, Y.-Z.; Wang, X.-W.; Yan, C.; Lin, R.-Q.; Zhu, X.-Q. Ascaris Suum Enolase Is a Potential Vaccine Candidate against Ascariasis. Vaccine 2012, 30, 3478–3482. [Google Scholar] [CrossRef]
- Feng, Y.; Pan, X.; Sun, W.; Wang, C.; Zhang, H.; Li, X.; Ma, Y.; Shao, Z.; Ge, J.; Zheng, F.; et al. Streptococcus Suis Enolase Functions as a Protective Antigen Displayed on the Bacterial Cell Surface. J. Infect. Dis. 2009, 200, 1583–1592. [Google Scholar] [CrossRef]
- Arce-Fonseca, M.; González-Vázquez, M.C.; Rodríguez-Morales, O.; Graullera-Rivera, V.; Aranda-Fraustro, A.; Reyes, P.A.; Carabarin-Lima, A.; Rosales-Encina, J.L. Recombinant Enolase of Trypanosoma Cruzi as a Novel Vaccine Candidate against Chagas Disease in a Mouse Model of Acute Infection. J. Immunol. Res. 2018, 2018, 8964085. [Google Scholar] [CrossRef]
- Zhang, C.; Gu, Y.; Tang, J.; Lu, F.; Cao, Y.; Zhou, H.; Zhu, G.; Cao, J.; Gao, Q. Production of Plasmodium Vivax Enolase in Escherichia Coli and Its Protective Properties. Hum. Vaccines Immunother. 2016, 12, 2855–2861. [Google Scholar] [CrossRef] [PubMed]
- Ayón-Núñez, D.A.; Fragoso, G.; Espitia, C.; García-Varela, M.; Soberón, X.; Rosas, G.; Laclette, J.P.; Bobes, R.J. Identification and Characterization of Taenia Solium Enolase as a Plasminogen-Binding Protein. Acta Trop. 2018, 182, 69–79. [Google Scholar] [CrossRef] [PubMed]
- Quiroz-Castañeda, R.E.; Aguilar-Díaz, H.; Amaro-Estrada, I. An Alternative Vaccine Target for Bovine Anaplasmosis Based on Enolase, a Moonlighting Protein. Front. Vet. Sci. 2023, 10, 1225873. [Google Scholar] [CrossRef] [PubMed]
- Song, Z.; Li, Y.; Liu, Y.; Xin, J.; Zou, X.; Sun, W. α-Enolase, an Adhesion-Related Factor of Mycoplasma Bovis. PLoS One 2012, 7, e38836. [Google Scholar] [CrossRef]
- Xie, Q.; Xing, H.; Wen, X.; Liu, B.; Wei, Y.; Yu, Y.; Xie, X.; Song, D.; Shao, G.; Xiong, Q.; et al. Identification of the Multiple Roles of Enolase as an Plasminogen Receptor and Adhesin in Mycoplasma Hyopneumoniae. Microb. Pathog. 2023, 174, 105934. [Google Scholar] [CrossRef] [PubMed]
- Schreiner, S.A.; Sokoli, A.; Felder, K.M.; Wittenbrink, M.M.; Schwarzenbach, S.; Guhl, B.; Hoelzle, K.; Hoelzle, L.E. The Surface-Localised α-Enolase of Mycoplasma Suis Is an Adhesion Protein. Vet. Microbiol. 2012, 156, 88–95. [Google Scholar] [CrossRef] [PubMed]
- Xue, S.; Seo, K.; Yang, M.; Cui, C.; Yang, M.; Xiang, S.; Yan, Z.; Wu, S.; Han, J.; Yu, X.; et al. Mycoplasma Suis Alpha-Enolase Subunit Vaccine Induces an Immune Response in Experimental Animals. Vaccines 2021, 9, 18–20. [Google Scholar] [CrossRef]
- Satala, D.; Satala, G.; Karkowska-Kuleta, J.; Bukowski, M.; Kluza, A.; Rapala-Kozik, M.; Kozik, A. Structural Insights into the Interactions of Candidal Enolase with Human Vitronectin, Fibronectin and Plasminogen. Int. J. Mol. Sci. 2020, 21. [Google Scholar] [CrossRef]
- Carneiro, C.R.W.; Postol, E.; Nomizo, R.; Reis, L.F.L.; Brentani, R.R. Identification of Enolase as a Laminin-Binding Protein on the Surface of Staphylococcus Aureus. Microbes Infect. 2004, 6, 604–608. [Google Scholar] [CrossRef]
- O’Kelly, E.; Cwiklinski, K.; De Marco Verissimo, C.; Calvani, N.E.D.; López Corrales, J.; Jewhurst, H.; Flaus, A.; Lalor, R.; Serrat, J.; Dalton, J.P.; et al. Moonlighting on the Fasciola Hepatica Tegument: Enolase, a Glycolytic Enzyme, Interacts with the Extracellular Matrix and Fibrinolytic System of the Host. PLoS Negl. Trop. Dis. 2024, 18, e0012069. [Google Scholar] [CrossRef]
- Salzillo, M.; Vastano, V.; Capri, U.; Muscariello, L.; Sacco, M.; Marasco, R. Identification and Characterization of Enolase as a Collagen-Binding Protein in Lactobacillus Plantarum. J. Basic Microbiol. 2015, 55, 890–897. [Google Scholar] [CrossRef]
- Narasimhan, S.; Rajeevan, N.; Liu, L.; Zhao, Y.O.; Heisig, J.; Pan, J.; Eppler-Epstein, R.; Deponte, K.; Fish, D.; Fikrig, E. Gut Microbiota of the Tick Vector Ixodes Scapularis Modulate Colonization of the Lyme Disease Spirochete. Cell Host Microbe 2014, 15, 58–71. [Google Scholar] [CrossRef] [PubMed]
- Kurokawa, C.; Lynn, G.E.; Pedra, J.H.F.; Pal, U.; Narasimhan, S.; Fikrig, E. Interactions between Borrelia Burgdorferi and Ticks. Nat. Rev. Microbiol. 2020, 18, 587–600. [Google Scholar] [CrossRef]
- Kozakov, D.; Hall, D.R.; Xia, B.; Porter, K.A.; Padhorny, D.; Yueh, C.; Beglov, D.; Vajda, S. The ClusPro Web Server for Protein–Protein Docking. Nat. Protoc. 2017, 12, 255–278. [Google Scholar] [CrossRef]
- Goddard, T.D.; Huang, C.C.; Meng, E.C.; Pettersen, E.F.; Couch, G.S.; Morris, J.H.; Ferrin, T.E. UCSF ChimeraX: Meeting Modern Challenges in Visualization and Analysis. Protein Sci. 2018, 27, 14–25. [Google Scholar] [CrossRef]
- López-Blanco, J.R.; Aliaga, J.I.; Quintana-Ortí, E.S.; Chacón, P. IMODS: Internal Coordinates Normal Mode Analysis Server. Nucleic Acids Res. 2014, 42, 271–276. [Google Scholar] [CrossRef]
- StatSoft, Inc. Available online: www.statsoft.com.
- Posit Team.
- Noh, S.M.; Ujczo, J.; Alperin, D.C. Identification of Anaplasma Marginale Adhesins for Bovine Erythrocytes Using Phage Display. Front. Trop. Dis. 2024, 5, 1–8. [Google Scholar] [CrossRef]
- Carreño, A.D.; Alleman, A.R.; Barbet, A.F.; Palmer, G.H.; Noh, S.M.; Johnson, C.M. In Vivo Endothelial Cell Infection by Anaplasma Marginale. Vet. Pathol. 2007, 44, 116–118. [Google Scholar] [CrossRef]
- de la Fuente, J.; Garcia-Garcia, J.C.; Blouin, E.F.; Kocan, K.M. Differential Adhesion of Major Surface Proteins 1a and 1b of the Ehrlichial Cattle Pathogen Anaplasma Marginale to Bovine Erythrocytes and Tick Cells. Int. J. Parasitol. 2001, 31, 145–153. [Google Scholar] [CrossRef] [PubMed]
- Narasimhan, S.; Coumou, J.; Schuijt, T.J.; Boder, E.; Hovius, J.W.; Fikrig, E. A Tick Gut Protein with Fibronectin III Domains Aids Borrelia Burgdorferi Congregation to the Gut during Transmission. PLoS Pathog. 2014, 10, e1004278–e1004278. [Google Scholar] [CrossRef] [PubMed]
- Kolberg, J.; Aase, A.; Bergmann, S.; Herstad, T.K.; Rødal, G.; Frank, R.; Rohde, M.; Hammerschmidt, S. Streptococcus Pneumoniae Enolase Is Important for Plasminogen Binding despite Low Abundance of Enolase Protein on the Bacterial Cell Surface. Microbiology 2006, 152, 1307–1317. [Google Scholar] [CrossRef] [PubMed]
- Marchesi, V.T.; Steers, E. Selective Solubilization of a Protein Component of the Red Cell Membrane. Science (80-. ). 1968, 159, 203–204. [Google Scholar] [CrossRef]
- Hamidi, H.; Ivaska, J. Vascular Morphogenesis: An Integrin and Fibronectin Highway. Curr. Biol. 2017, 27, R158–R161. [Google Scholar] [CrossRef]
- Wang, J.; Dyachenko, V.; Munderloh, U.G.; Straubinger, R.K. Transmission of Anaplasma Phagocytophilum from Endothelial Cells to Peripheral Granulocytes in Vitro under Shear Flow Conditions. Med. Microbiol. Immunol. 2015, 204, 593–603. [Google Scholar] [CrossRef] [PubMed]
- O’Kelly, E.; Cwiklinski, K.; Verissimo, C.D.M.; Calvani, N.E.D.; Corrales, J.L.; Jewhurst, H.; Flaus, A.; Lalor, R.; Serrat, J.; Dalton, J.P.; et al. Moonlighting on the Fasciola Hepatica Tegument: Enolase, a Glycolytic Enzyme, Interacts with the Extracellular Matrix and Fibrinolytic System of the Host. PLoS Negl. Trop. Dis. 2024, 18, 1–24. [Google Scholar] [CrossRef] [PubMed]
Figure 1.
3D model and assessment of AmEno15. A) AmEno15 modeled on A. marginale enolase monomer (Q5PAS6.1.A) in the SwissModel server. B) Ramachandran plot for the AmEno15 3D model showed that most of the amino acids are in the favored regions according to the Phi (Φ) and Psi (Ψ) angles value. .
Figure 1.
3D model and assessment of AmEno15. A) AmEno15 modeled on A. marginale enolase monomer (Q5PAS6.1.A) in the SwissModel server. B) Ramachandran plot for the AmEno15 3D model showed that most of the amino acids are in the favored regions according to the Phi (Φ) and Psi (Ψ) angles value. .
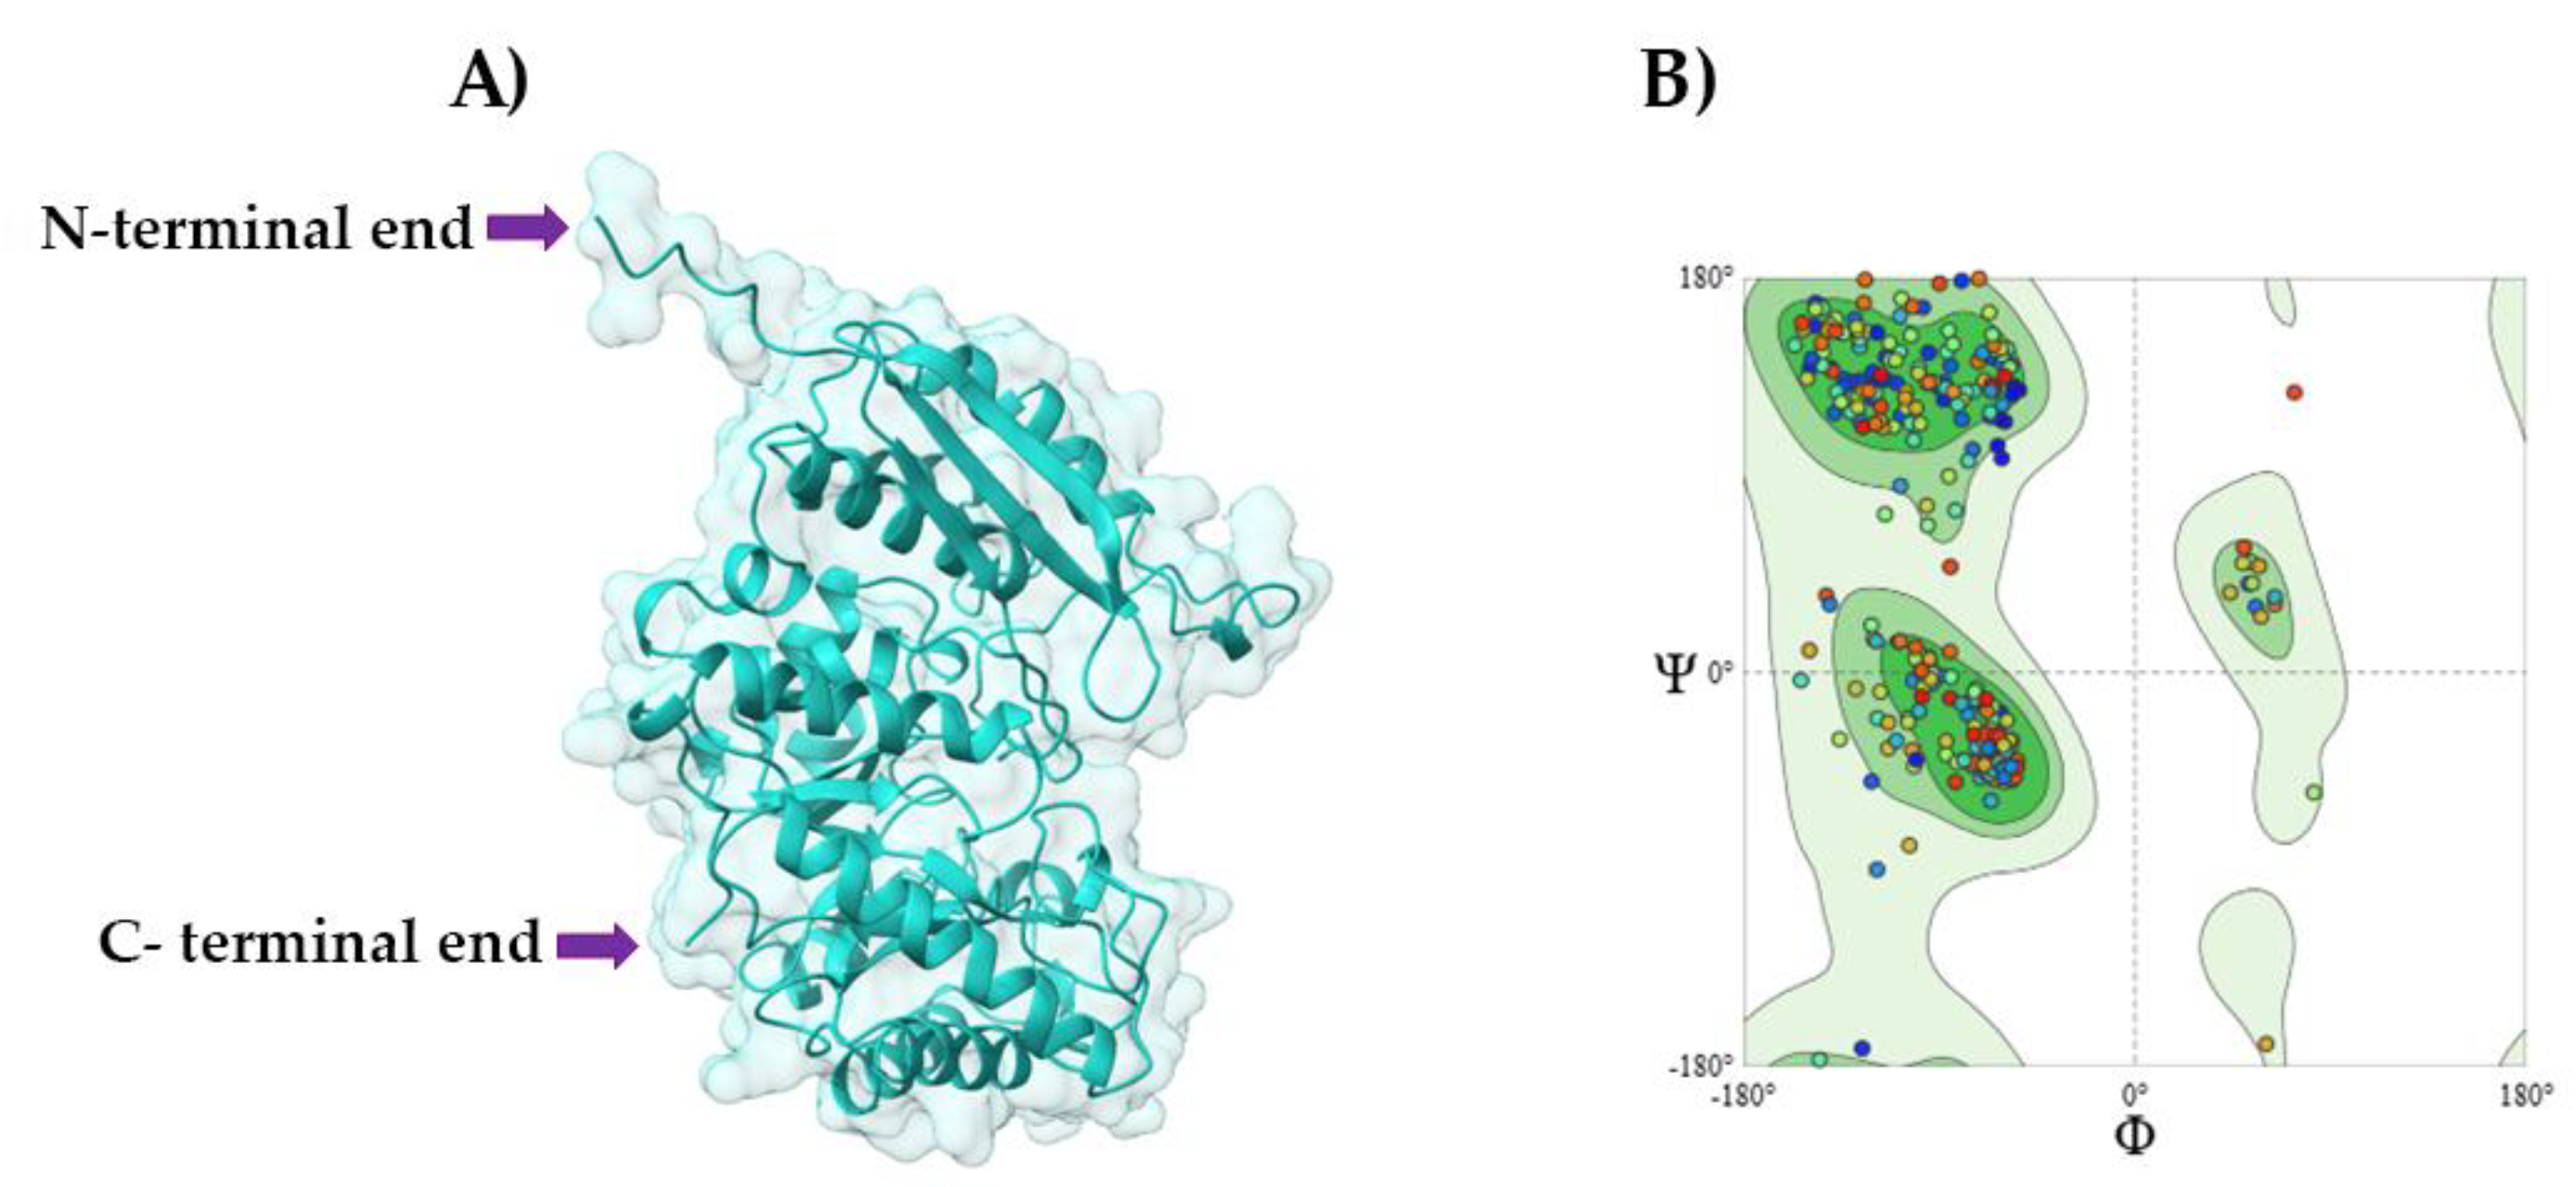
Figure 2.
Expression and purification of recombinant AmEno15-Trx-6His. A) SDS-PAGE 12% of induction of AmEno15-Trx-6His at different conditions. Line 1, Bovine serum albumin (BSA, 0.4 mg/mL); Line 2, Molecular weight marker; Line 3, culture induced with 0.8 mM IPTG after 4 h of induction at 37°C; Line 4, culture induced with 0.8 mM IPTG after 16 h of induction at 16°C. Recombinant AmEno15-Trx-6His (64 kDa, black arrow). The selected expression condition was 0.8 mM IPTG, 4 h at 37°C. B) SDS-PAGE 12% of purified AmEno15-Trx-6His. Line 1, BSA; Line 2, Molecular weight marker; Line 3, Purified AmEno15-Trx-6His dialyzed with PBS (64 kDa, black arrow).
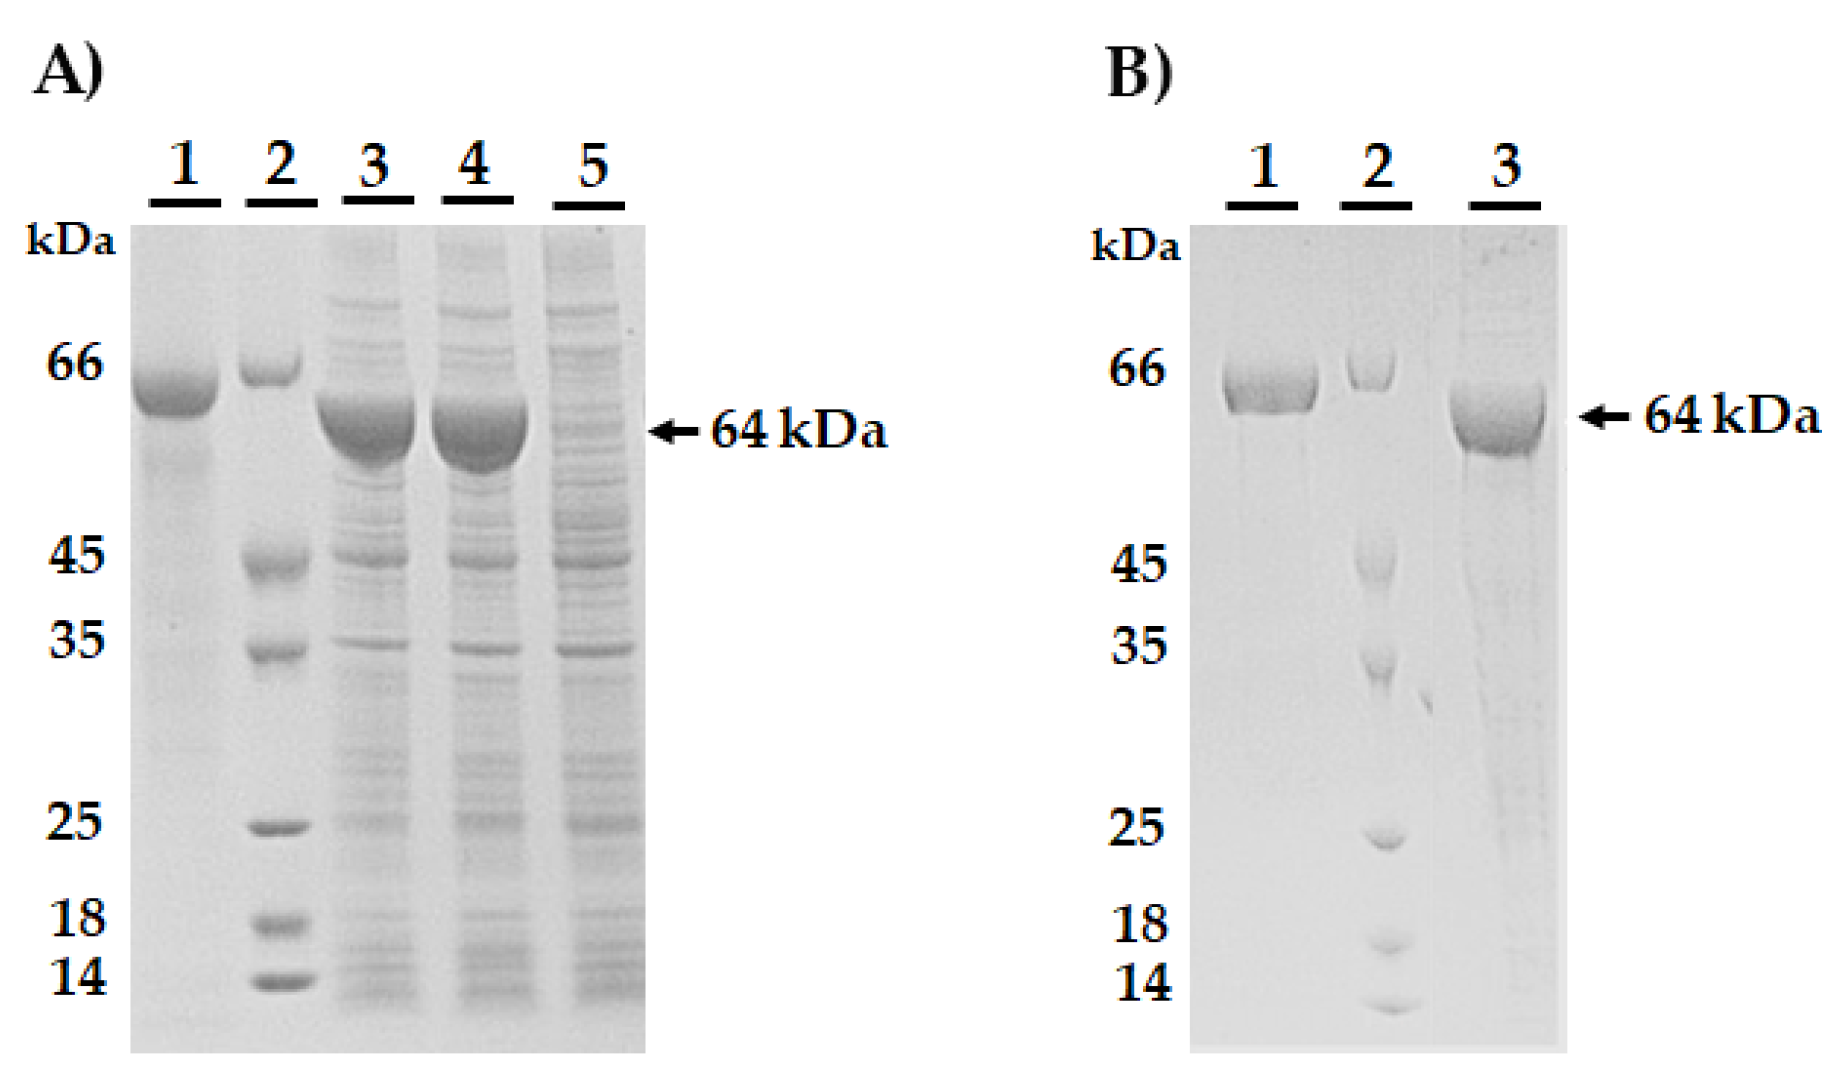
Figure 3.
Molecular dynamics simulation of AmEno15-spectrin (3LBX) docking complex. A) 3D model and assessment by Ramachandran plot of AmEno15-spectrin interaction. Docking complex molecular dynamics simulation: B) The deformability (green graph) indicates the degree of deformability measured between 0-1 Å; C) The B-factor (pink graph) shows a visualization of the flexibility and movement; D) The eigenvalues (purple graph) represents the energy required to deform the structure (lower values denotes easier deformation); E) The variance map (cyan bars) shows the complex parts more likely to move during a conformational change; F) The covariance map shows the correlated regions between linked amino acid (white, uncorrelated; red, correlated regions, and blue, anti-correlated); and, G) The elastic network model reveals the pair of atoms connected by springs (each dot represents a spring; dots in light grey suggest a more flexible complex).
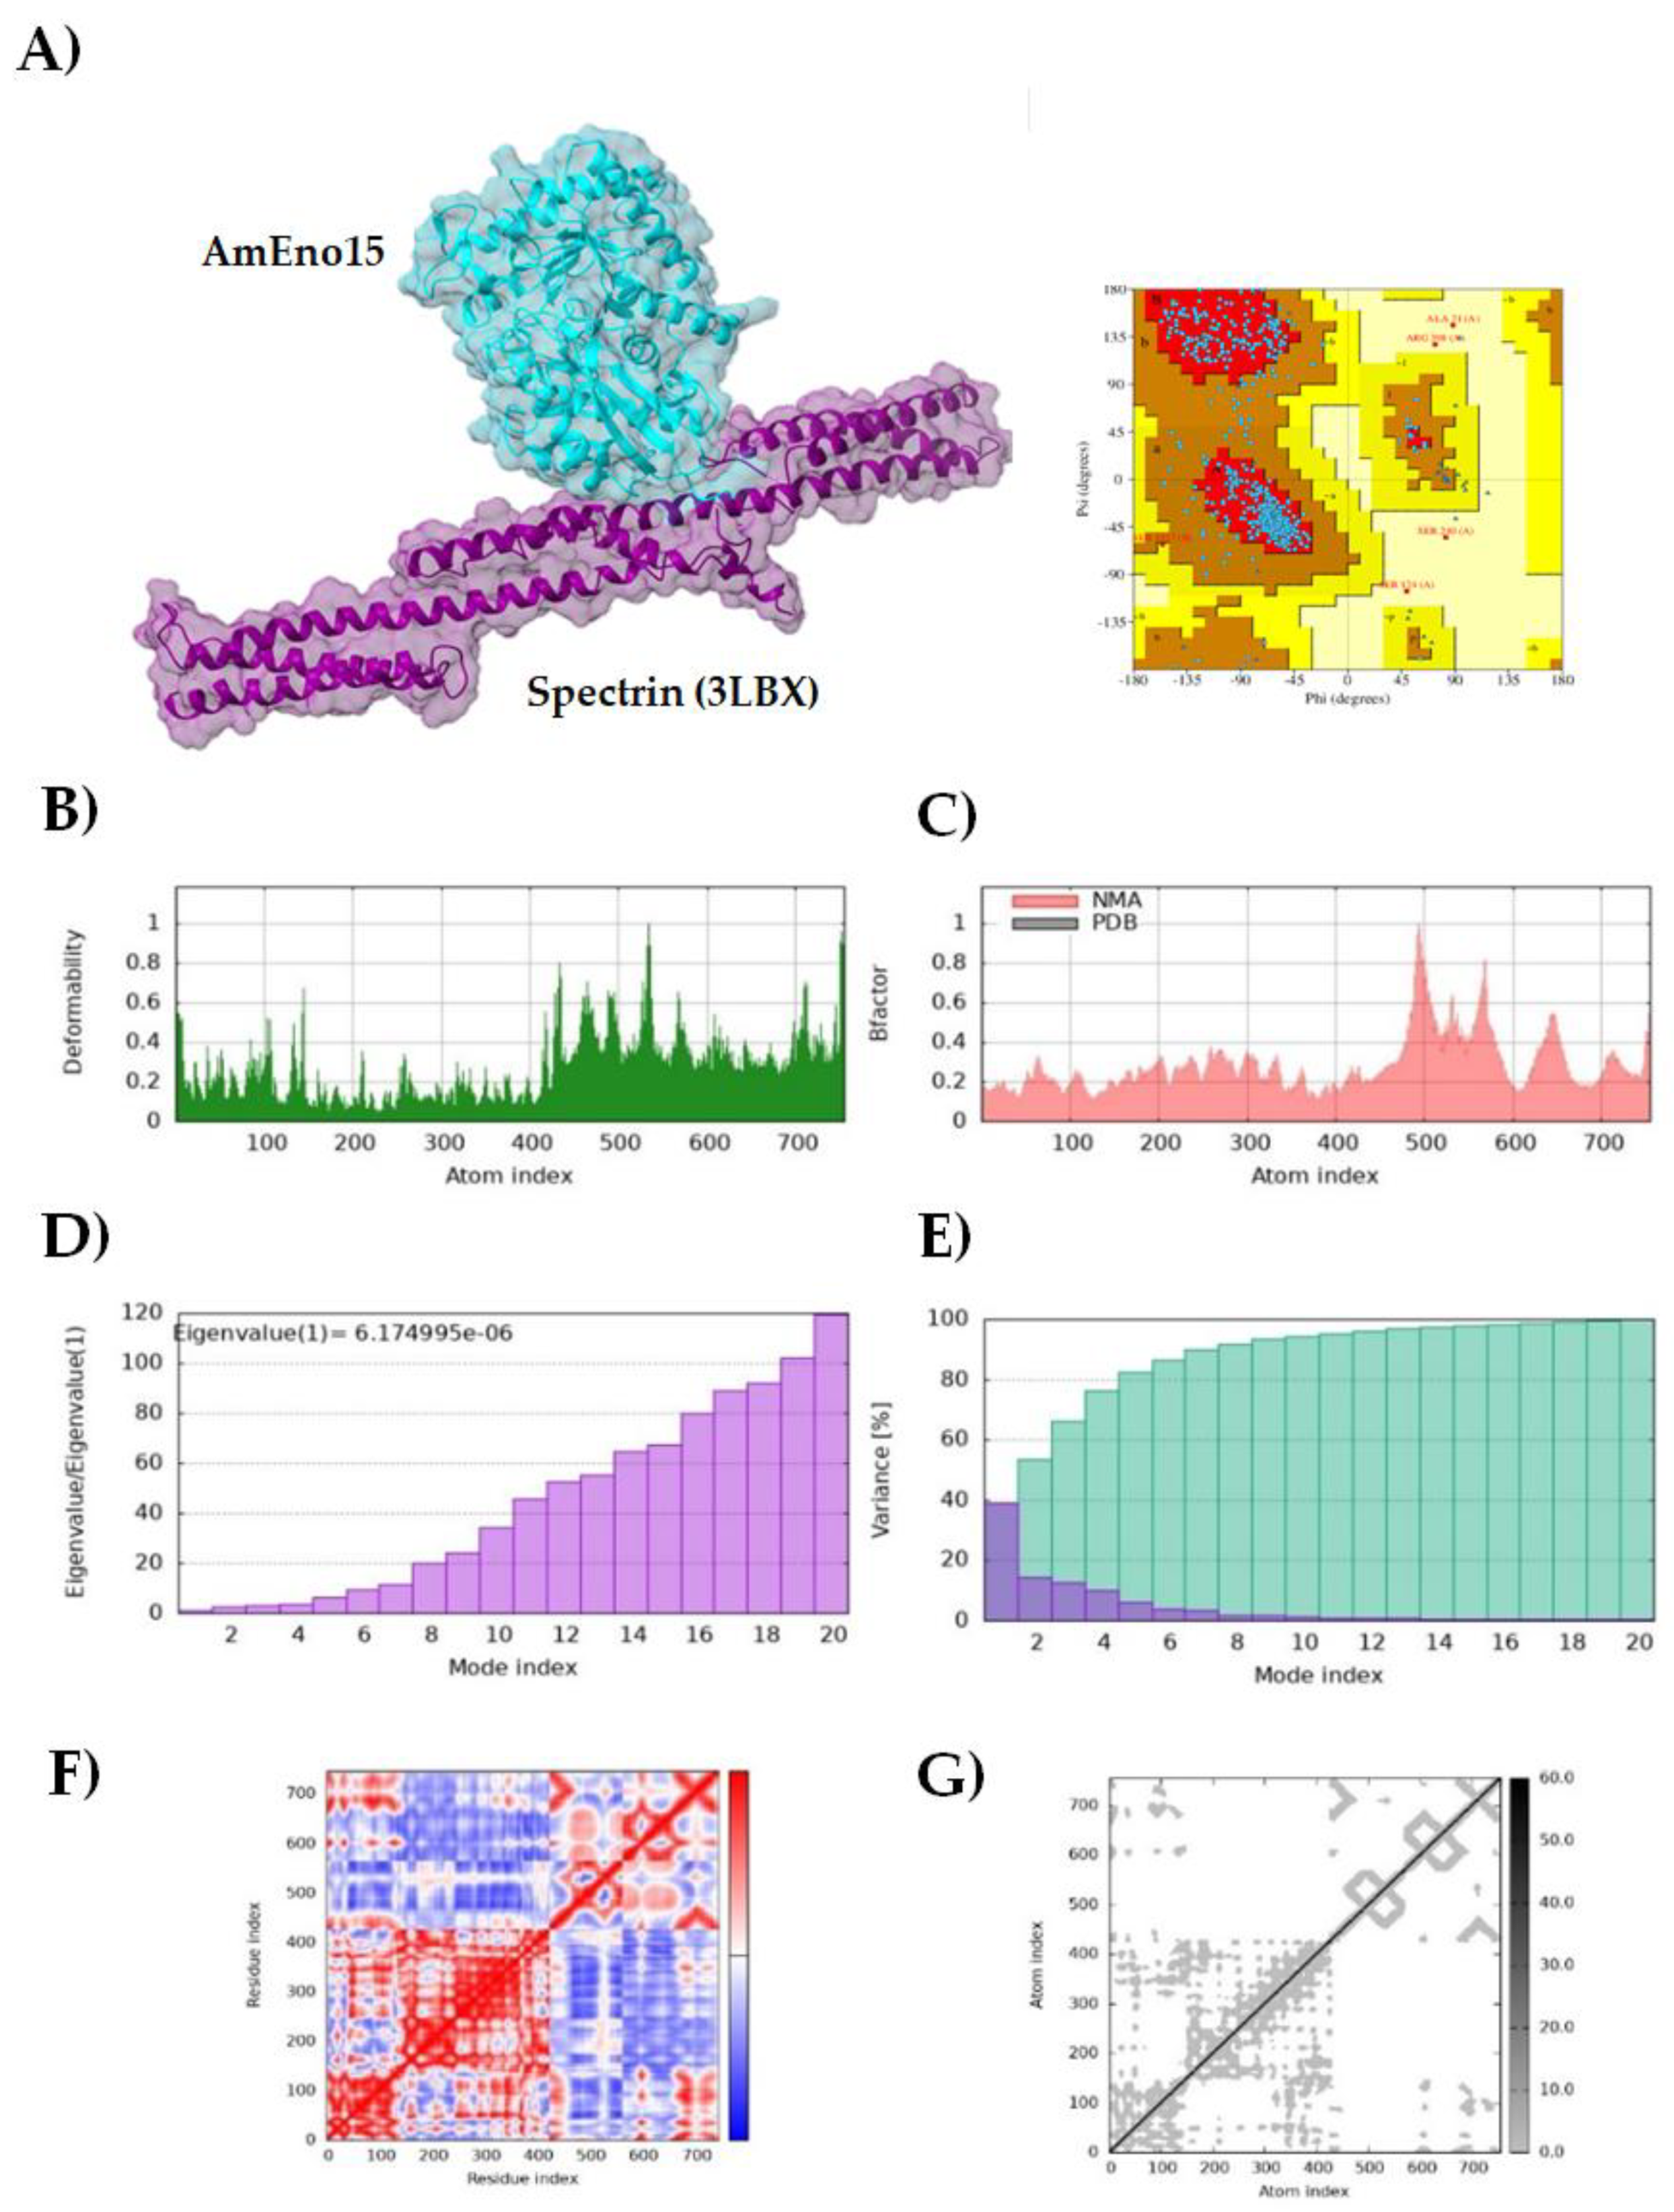
Figure 4.
Molecular dynamics simulation of AmEno15-stomatin (7WH3) docking complex. A) 3D model and assessment by Ramachandran plot of AmEno15-stomatin interaction. Docking complex molecular dynamics simulation: B) The deformability (green graph) indicates the degree of deformability measured between 0-1 Å; C) The B-factor (pink graph) shows a visualization of the flexibility and movement; D) The eigenvalues (purple graph) represents the energy required to deform the structure (lower values denotes easier deformation); E) The variance map (cyan bars) shows the complex parts more likely to move during a conformational change; F) The covariance map shows the correlated regions between linked amino acid (white, uncorrelated; red, correlated regions, and blue, anti-correlated); and, G) The elastic network model reveals the pair of atoms connected by springs (each dot represents a spring; dots in light grey suggest a more flexible complex). .
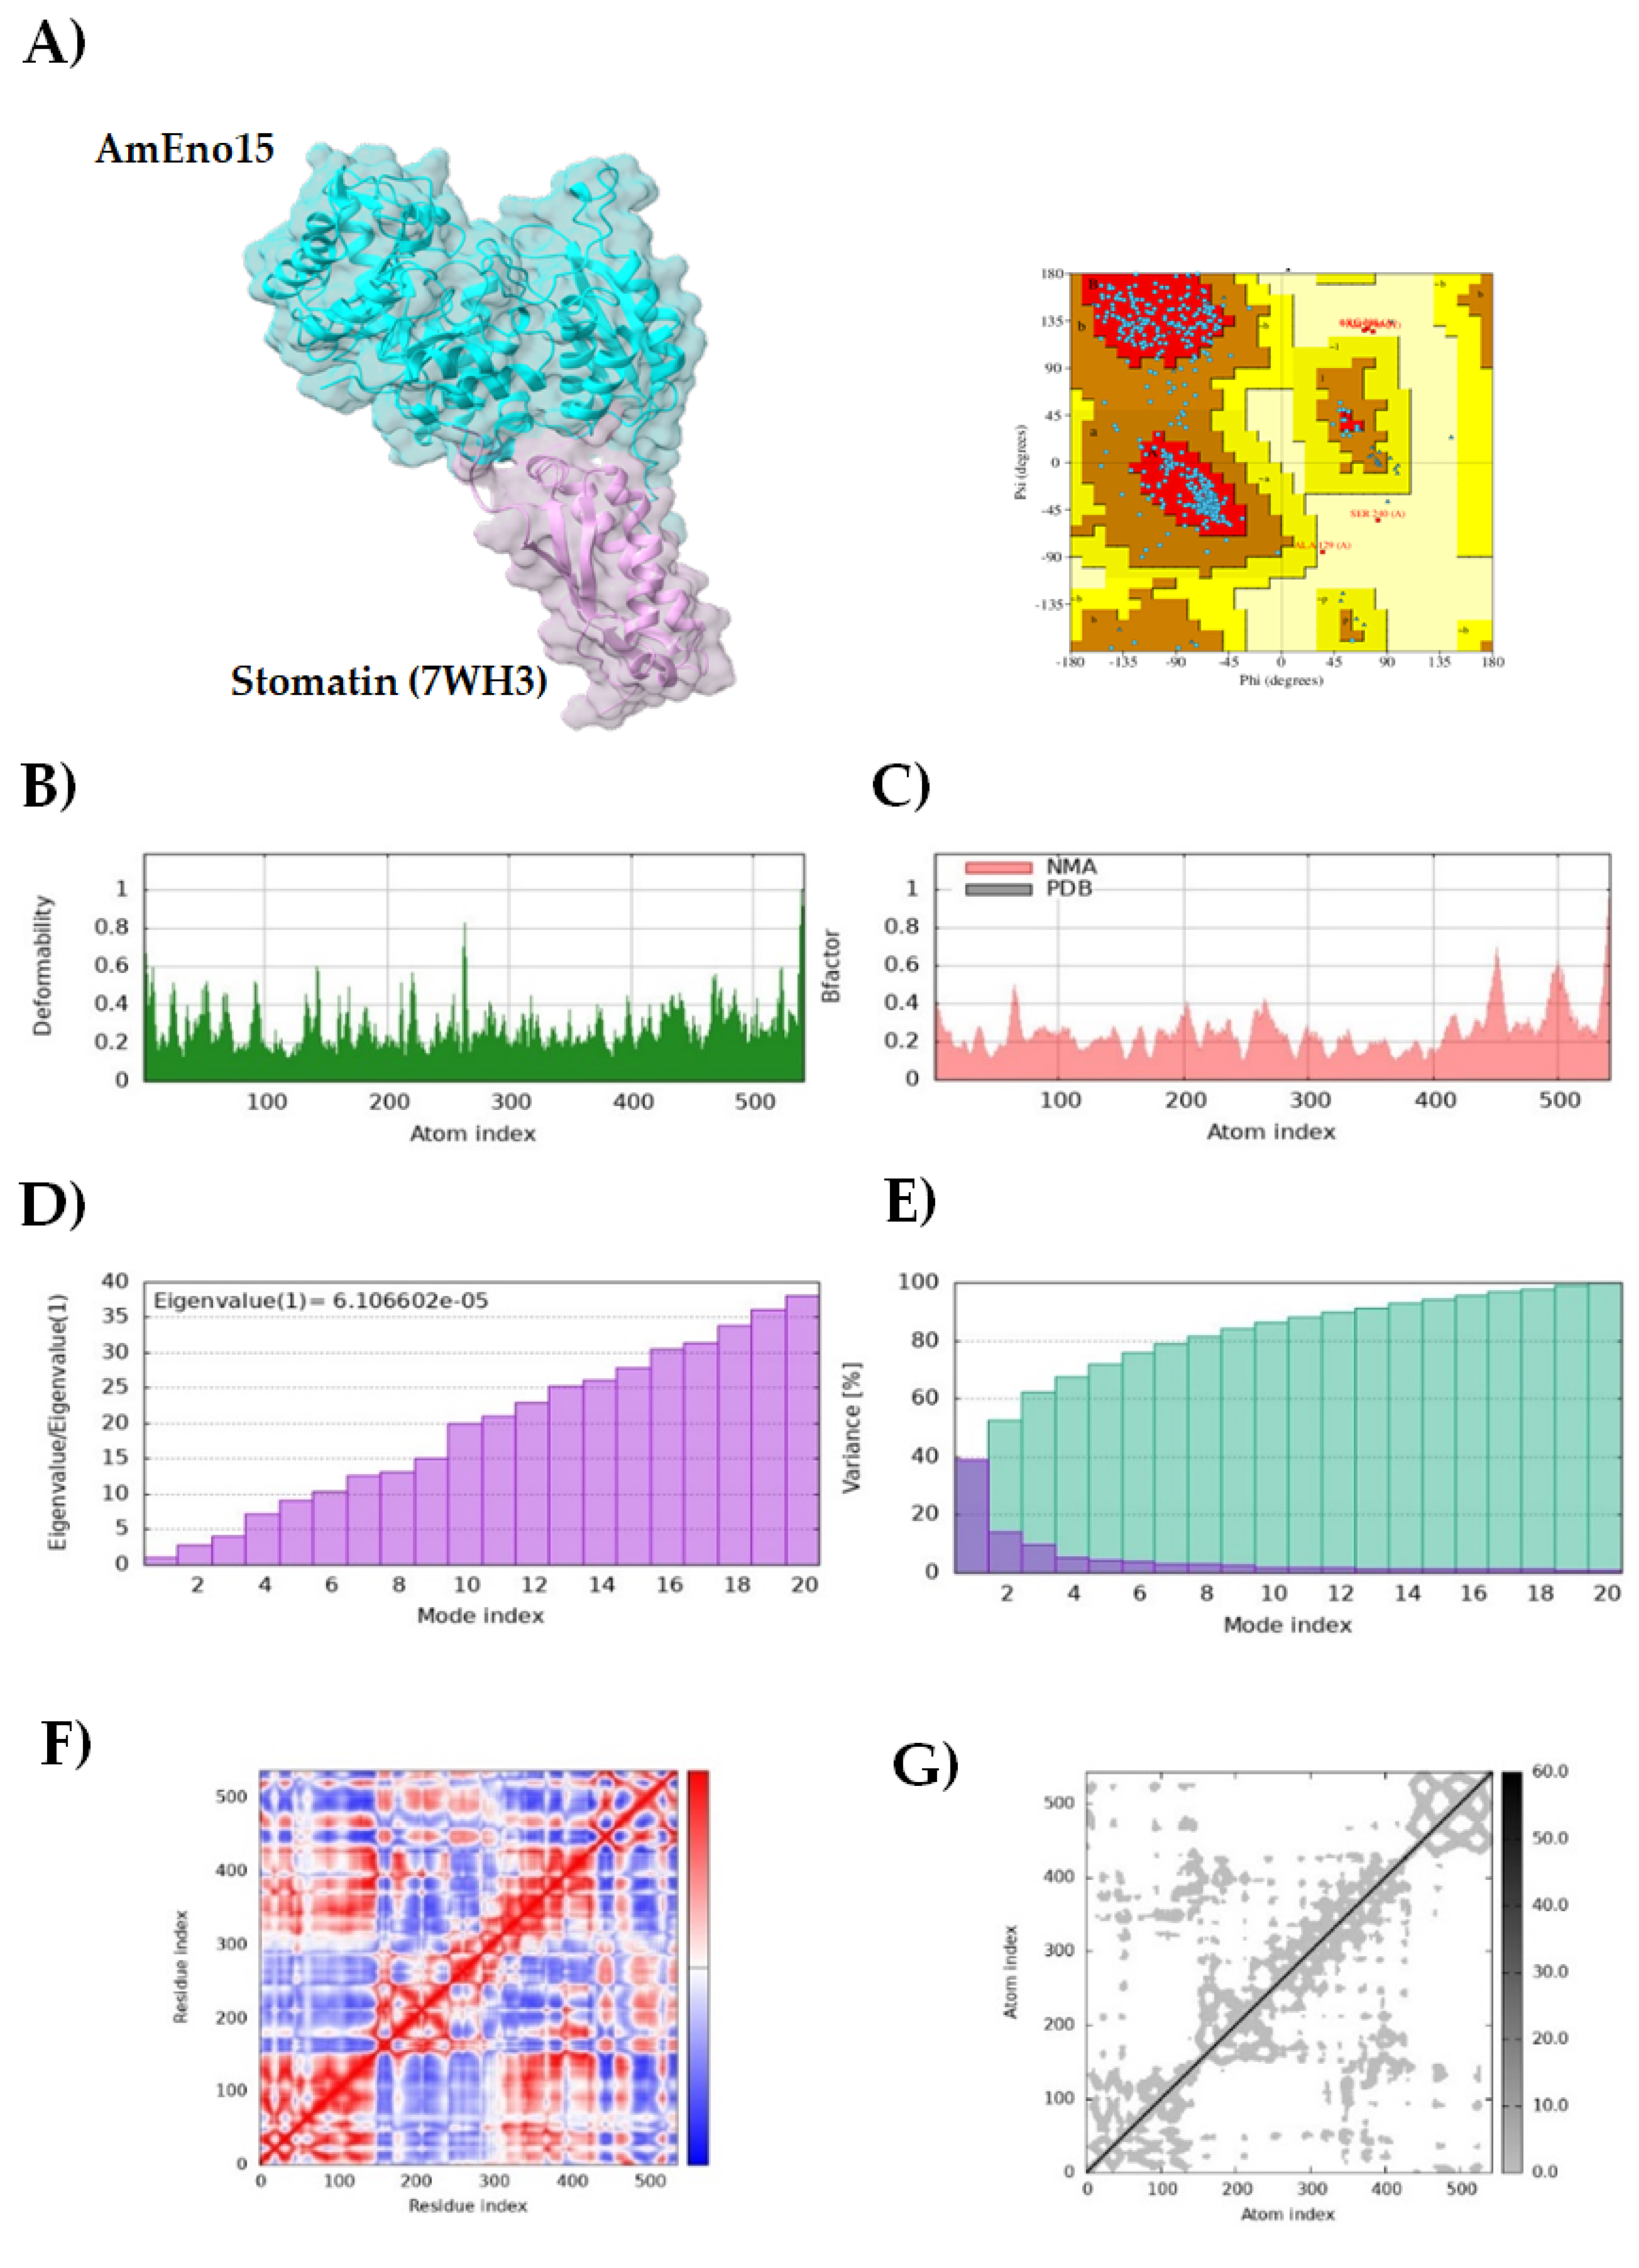
Figure 5.
Molecular dynamics simulation of AmEno15-fibronectin (3M7P) docking complex. A) 3D model and assessment by Ramachandran plot of AmEno15-fibronectin interaction. Docking complex molecular dynamics simulation: B) The deformability (green graph) indicates the degree of deformability measured between 0-1 Å; C) The B-factor (pink graph) shows a visualization of the flexibility and movement; D) The eigenvalues (purple graph) represents the energy required to deform the structure (lower values denotes easier deformation); E) The variance map (cyan bars) shows the complex parts more likely to move during a conformational change; F) The covariance map shows the correlated regions between linked amino acid (white, uncorrelated; red, correlated regions, and blue, anti-correlated); and, G) The elastic network model reveals the pair of atoms connected by springs (each dot represents a spring; dots in light grey suggest a more flexible complex).
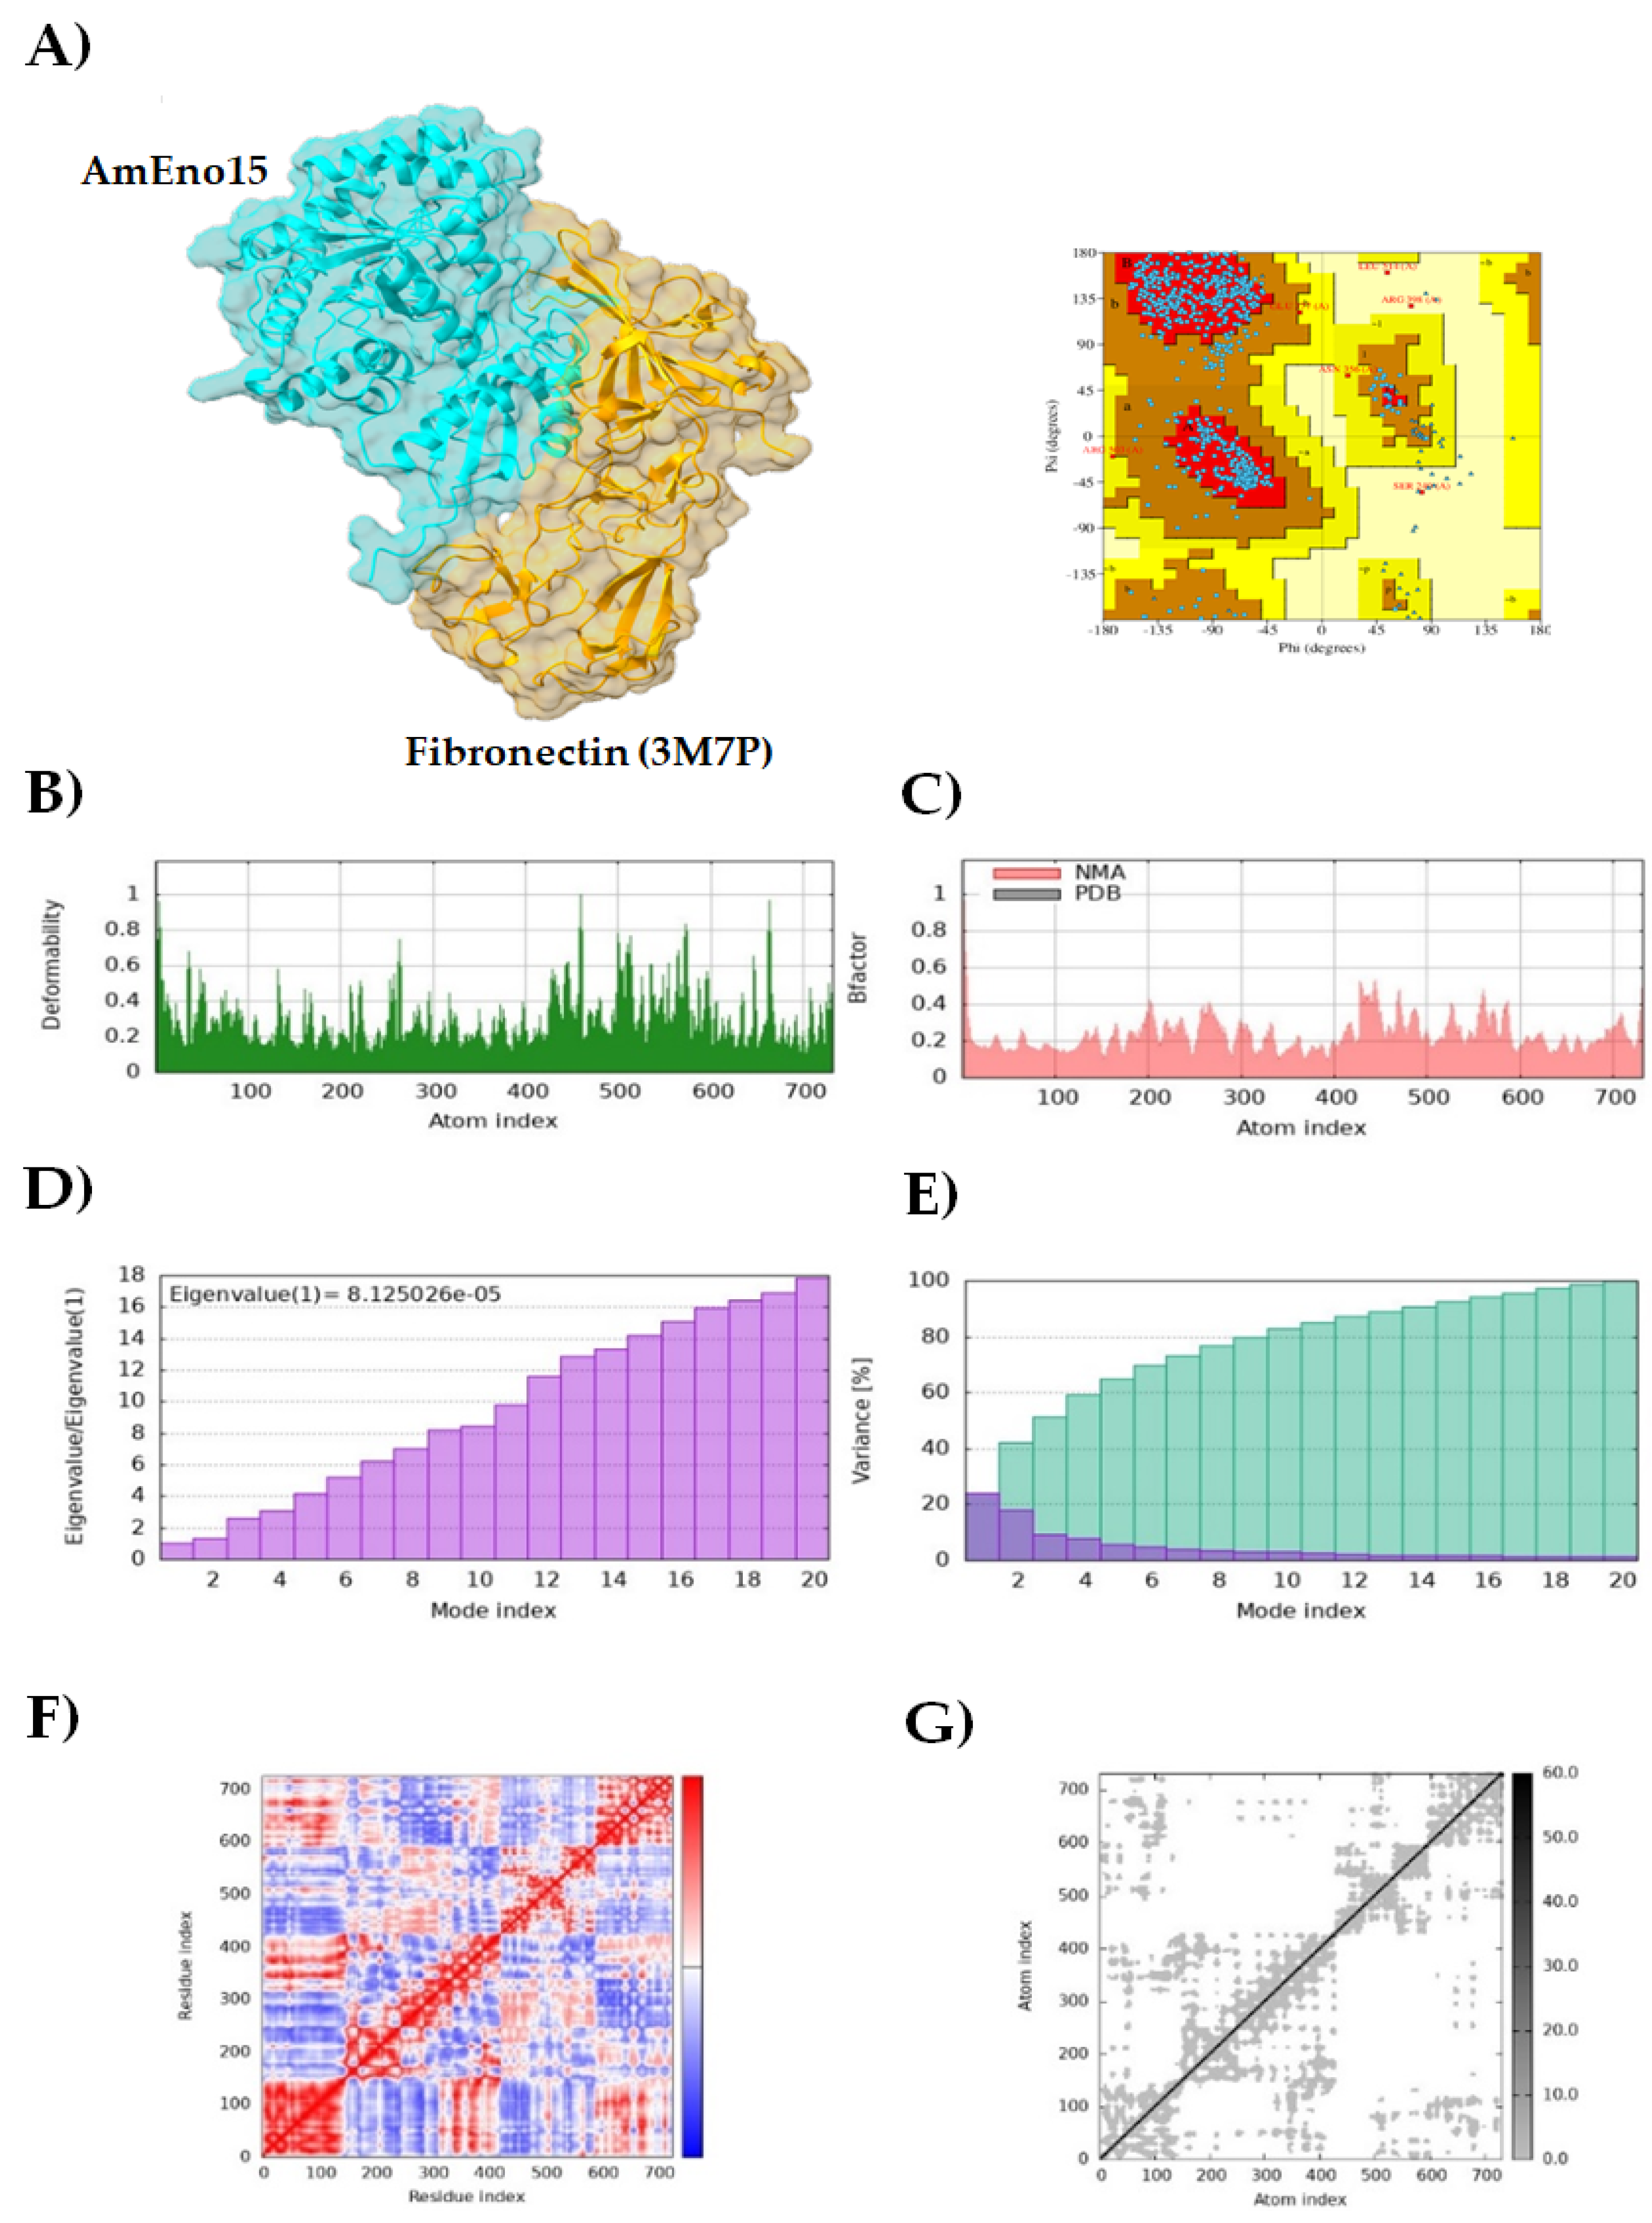
Figure 6.
Molecular dynamics simulation of AmEno15-plasminogen (4DUR) docking complex. A) 3D model and assessment by Ramachandran plot of AmEno15-plasminogen interaction. Docking complex molecular dynamics simulation: B) The deformability (green graph) indicates the degree of deformability measured between 0-1 Å; C) The B-factor (pink graph) shows a visualization of the flexibility and movement; D) The eigenvalues (purple graph) represents the energy required to deform the structure (lower values denotes easier deformation); E) The variance map (cyan bars) shows the complex parts more likely to move during a conformational change; F) The covariance map shows the correlated regions between linked amino acid (white, uncorrelated; red, correlated regions, and blue, anti-correlated); and, G) The elastic network model reveals the pair of atoms connected by springs (each dot represents a spring; dots in light grey suggest a more flexible complex). .
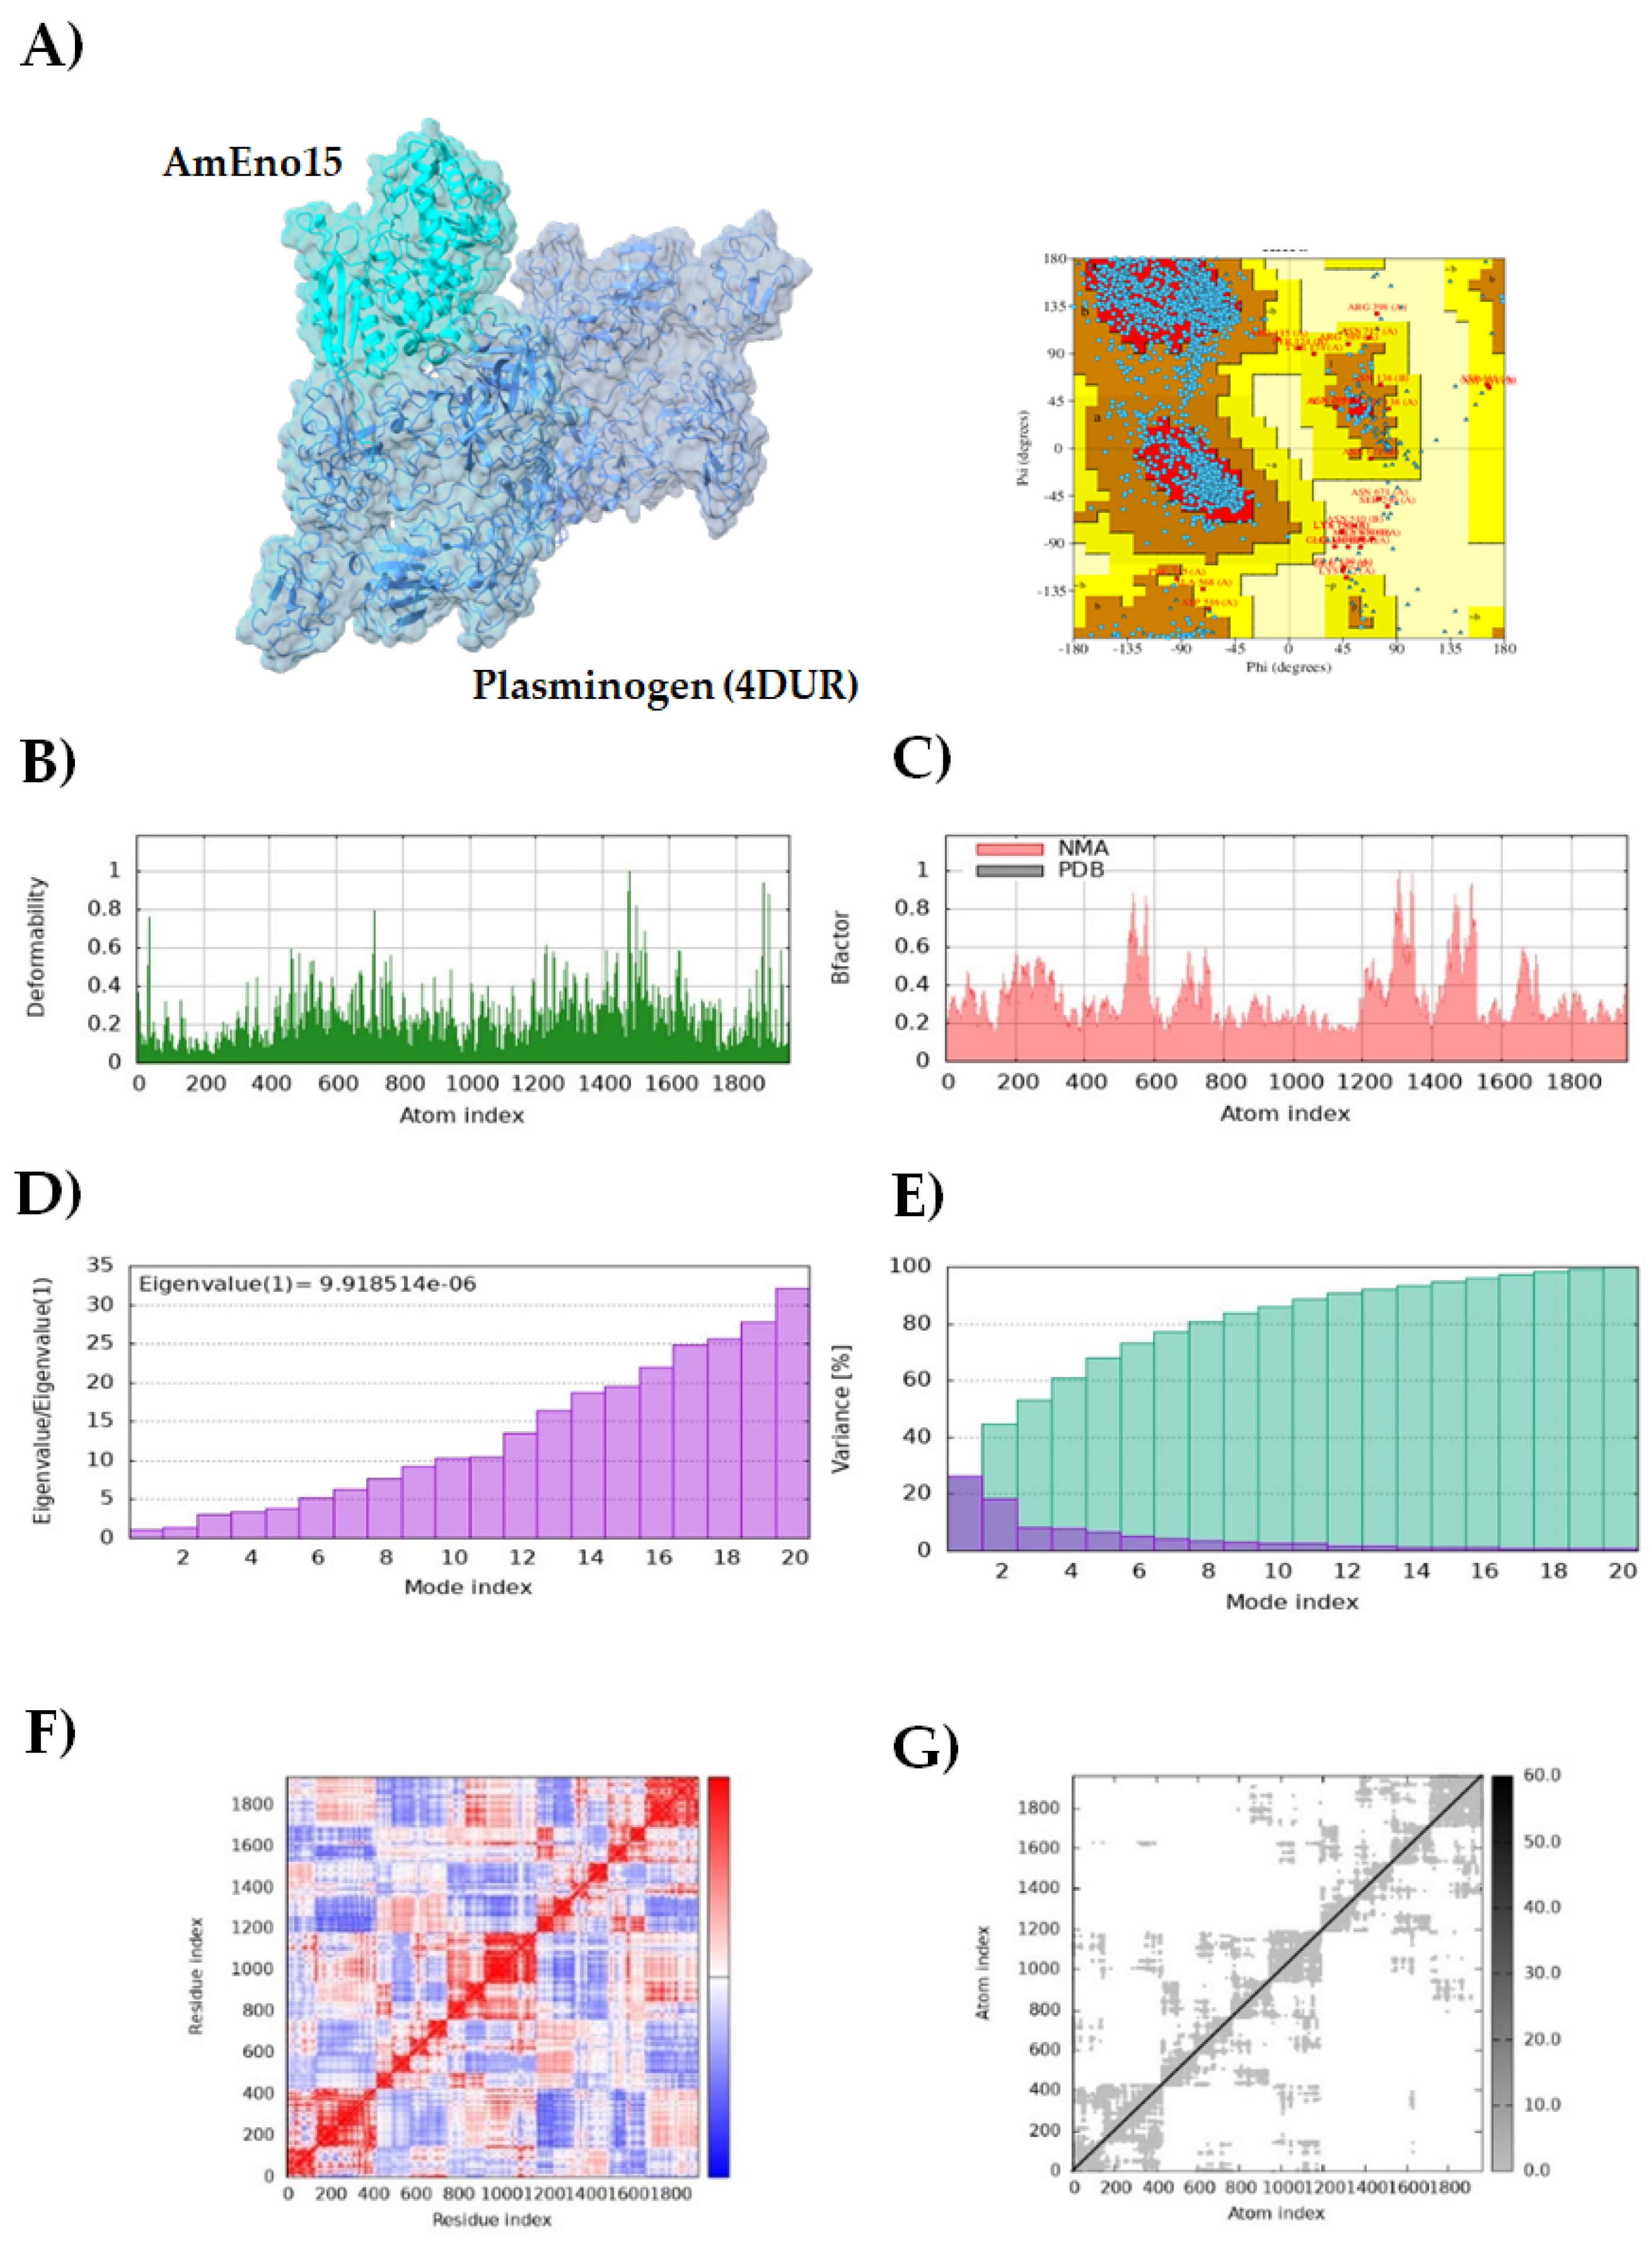
Figure 7.
Microplate binding assays of AmEno15 to erythrocyte proteins (spectrin and stomatin), fibronectin, and plasminogen. A) AmEno15-Spectrin binding, B) AmEno15-Stomatin binding, C) AmEno15-Fibronectin binding, and D) AmEno15-Plasminogen binding. Different concentrations of AmEno15 were used in the assay (deep purple); carbonate buffer-coated wells (only AmEno15) were used as specificity controls (light purple); ligand-coated wells and BSA were used as specificity controls for primary and secondary antibodies (violet). The assays were performed in three independent experiments, and the absorbance values at O.D. 450 nm are the mean ± standard deviation of triplicate wells. *p values < 0.05 and **p < 0.01 were considered statistically significant.
Disclaimer/Publisher’s Note: The statements, opinions and data contained in all publications are solely those of the individual author(s) and contributor(s) and not of MDPI and/or the editor(s). MDPI and/or the editor(s) disclaim responsibility for any injury to people or property resulting from any ideas, methods, instructions or products referred to in the content. |
© 2025 by the authors. Licensee MDPI, Basel, Switzerland. This article is an open access article distributed under the terms and conditions of the Creative Commons Attribution (CC BY) license (http://creativecommons.org/licenses/by/4.0/).
Copyright: This open access article is published under a Creative Commons CC BY 4.0 license, which permit the free download, distribution, and reuse, provided that the author and preprint are cited in any reuse.


