Submitted:
27 August 2025
Posted:
29 August 2025
You are already at the latest version
Abstract
Future lunar exploration efforts rely on an improved understanding of regolith behavior, as evidenced by the adhesion problems encountered during the Apollo missions. The Lunaris Payload, a compact lunar instrument developed in Poland, aims to assess the adhesion of lunar regoliths to various materials using an optical method chosen to meet strict mass constraints. We introduce and validate a resource-constrained optical method to estimate three-dimensional volumes of lunar regolith particles from two-dimensional imagery, using high-resolution micro-CT as ground truth. The approach supports in-situ surface characterization and dust-related risk assessment under the mass and power constraints typical of small payloads. Micro-CT scans were used to establish accurate reference volumes, and multiple geometric approximation methods were applied, including spherical, ellipsoidal, and cylindrical models, to derive volume estimates from a 2D representation. Comparative analyses demonstrate that ellipsoid-based models, particularly those that incorporate a fixed aspect ratio, provide the most accurate volume estimations. These findings offer a practical in situ methodology for analysing the volumes of regolith particles, thus advancing the capacity of the Lunaris mission to characterise lunar adhesion of regolith particles and supporting broader efforts in lunar resource utilisation and habitat construction. To our knowledge, this is the first benchmarking of six 2D-to-3D volume models against micro-CT for lunar regolith adhesion applications. Our findings demonstrate that ellipsoid-based methods achieve the best results, offering a validated, efficient technique for in-situ dust characterization critical for future lunar missions.
Keywords:
regoliths
; image processing
; experimental techniques
; data reduction techniques
; moon surface
1. Introduction
The Moon, often envisioned as a natural extension of Earth’s space capabilities, is reachable within approximately three days. However, despite this proximity, direct human exploration has been limited to only 12 astronauts, as documented after the Apollo programme by Johnson et al. [1]. Nonetheless, its close proximity and the existing body of knowledge continue to make the Moon an intriguing subject for research and a promising foundation for a space-based economy, as noted by Crawford et al. [2].
More than five decades after the last human lunar landing in 1972 [3], interest in lunar exploration has been reignited. A new era of lunar exploration has emerged with an increasing number of private and governmental missions. This resurgence is largely driven by the pivotal discovery of water ice deposits on the lunar surface. Based on data from the Chandrayaan-1 probe, Pieters et al. [4] published a study detailing these findings, which profoundly altered our understanding of the lunar environment and its potential to support future human habitation and scientific endeavors.
1.1. Motivations and Science Objectives
Lunar regolith includes fine particles, characterised by irregular shapes as described by Isachenkov et al. [5]. The concept of In Situ Resource Utilisation (ISRU), as discussed by Meurisse and Carpenter [6] involves harnessing lunar regolith to manufacture structures and other essential commodities directly on the Moon using locally sourced materials. This approach significantly improves the efficiency and sustainability of lunar exploration and resource utilisation efforts as described by Guerrero-Gonzalez and Zabel [7]. ISRU enables the extraction of oxygen, hydrogen and metals [8], which can support long-term lunar habitation, according to Anand et al. [9]. The entire habitat structure could be constructed using sintered regolith, which exhibits promising properties for thermal storage and radiation protection [10,11]. Furthermore, 3D printing technology can facilitate this process, as demonstrated by Taylor et al. [12], and the direct production of solar panels on the Moon using local materials is considered feasible, providing a sustainable energy source, as suggested by Freundlich et al. [13]. As Lin et al. [14] describe, remote observations of the regolith have been conducted using orbiters such as the Lunar Reconnaissance Orbiter [15] and rovers, for instance, the Yutu-2 rover [16], and samples were brought back by the Apollo, Luna, and Chang’e missions. However, in situ observations remain limited. Without direct measurements, neither the formation processes nor the true properties of the lunar regolith can be fully understood, as noted by Plescia [17]. Moreover, the safe human operations that would benefit lunar science the most still rely on robotic missions that provide critical information, as noted by Crawford et al. [18]. Lunar regolith poses a significant threat to human and robotic exploration of the Moon, making it crucial to understand how to mitigate its effects. The fine, abrasive, and adhesive nature of lunar regolith caused significant damage to the equipment during Apollo missions [19,20]. The challenges for ISRU include managing the adhesion and abrasion effects caused by this material, as discussed by Cannon et al. [21]. The thickness of the lunar regolith varies across the Moon, averaging approximately 5 metres in the mare regions and 12 metres in the highlands, according to Shkuratov [22]. Its unique properties, shaped by distinct erosive processes, make lunar regolith significantly different from terrestrial sand [23].
One such initiative that will gather more information on lunar regolith adhesion is the Lunaris payload, a lunar research project developed by a research group from AGH University of Krakow in partnership with Orbital-Space. This payload was selected through a global competition organised by Orbital-Space and is now scheduled to be aboard Astrobotic’s Griffin Mission 3, which is expected to launch no earlier than 2027 [24]. The primary objective of the Lunaris mission is to gather data on how lunar regolith adheres to different materials in situ. To achieve this, the payload employs an optical system that captures 2D images of adhered particles for subsequent analysis.
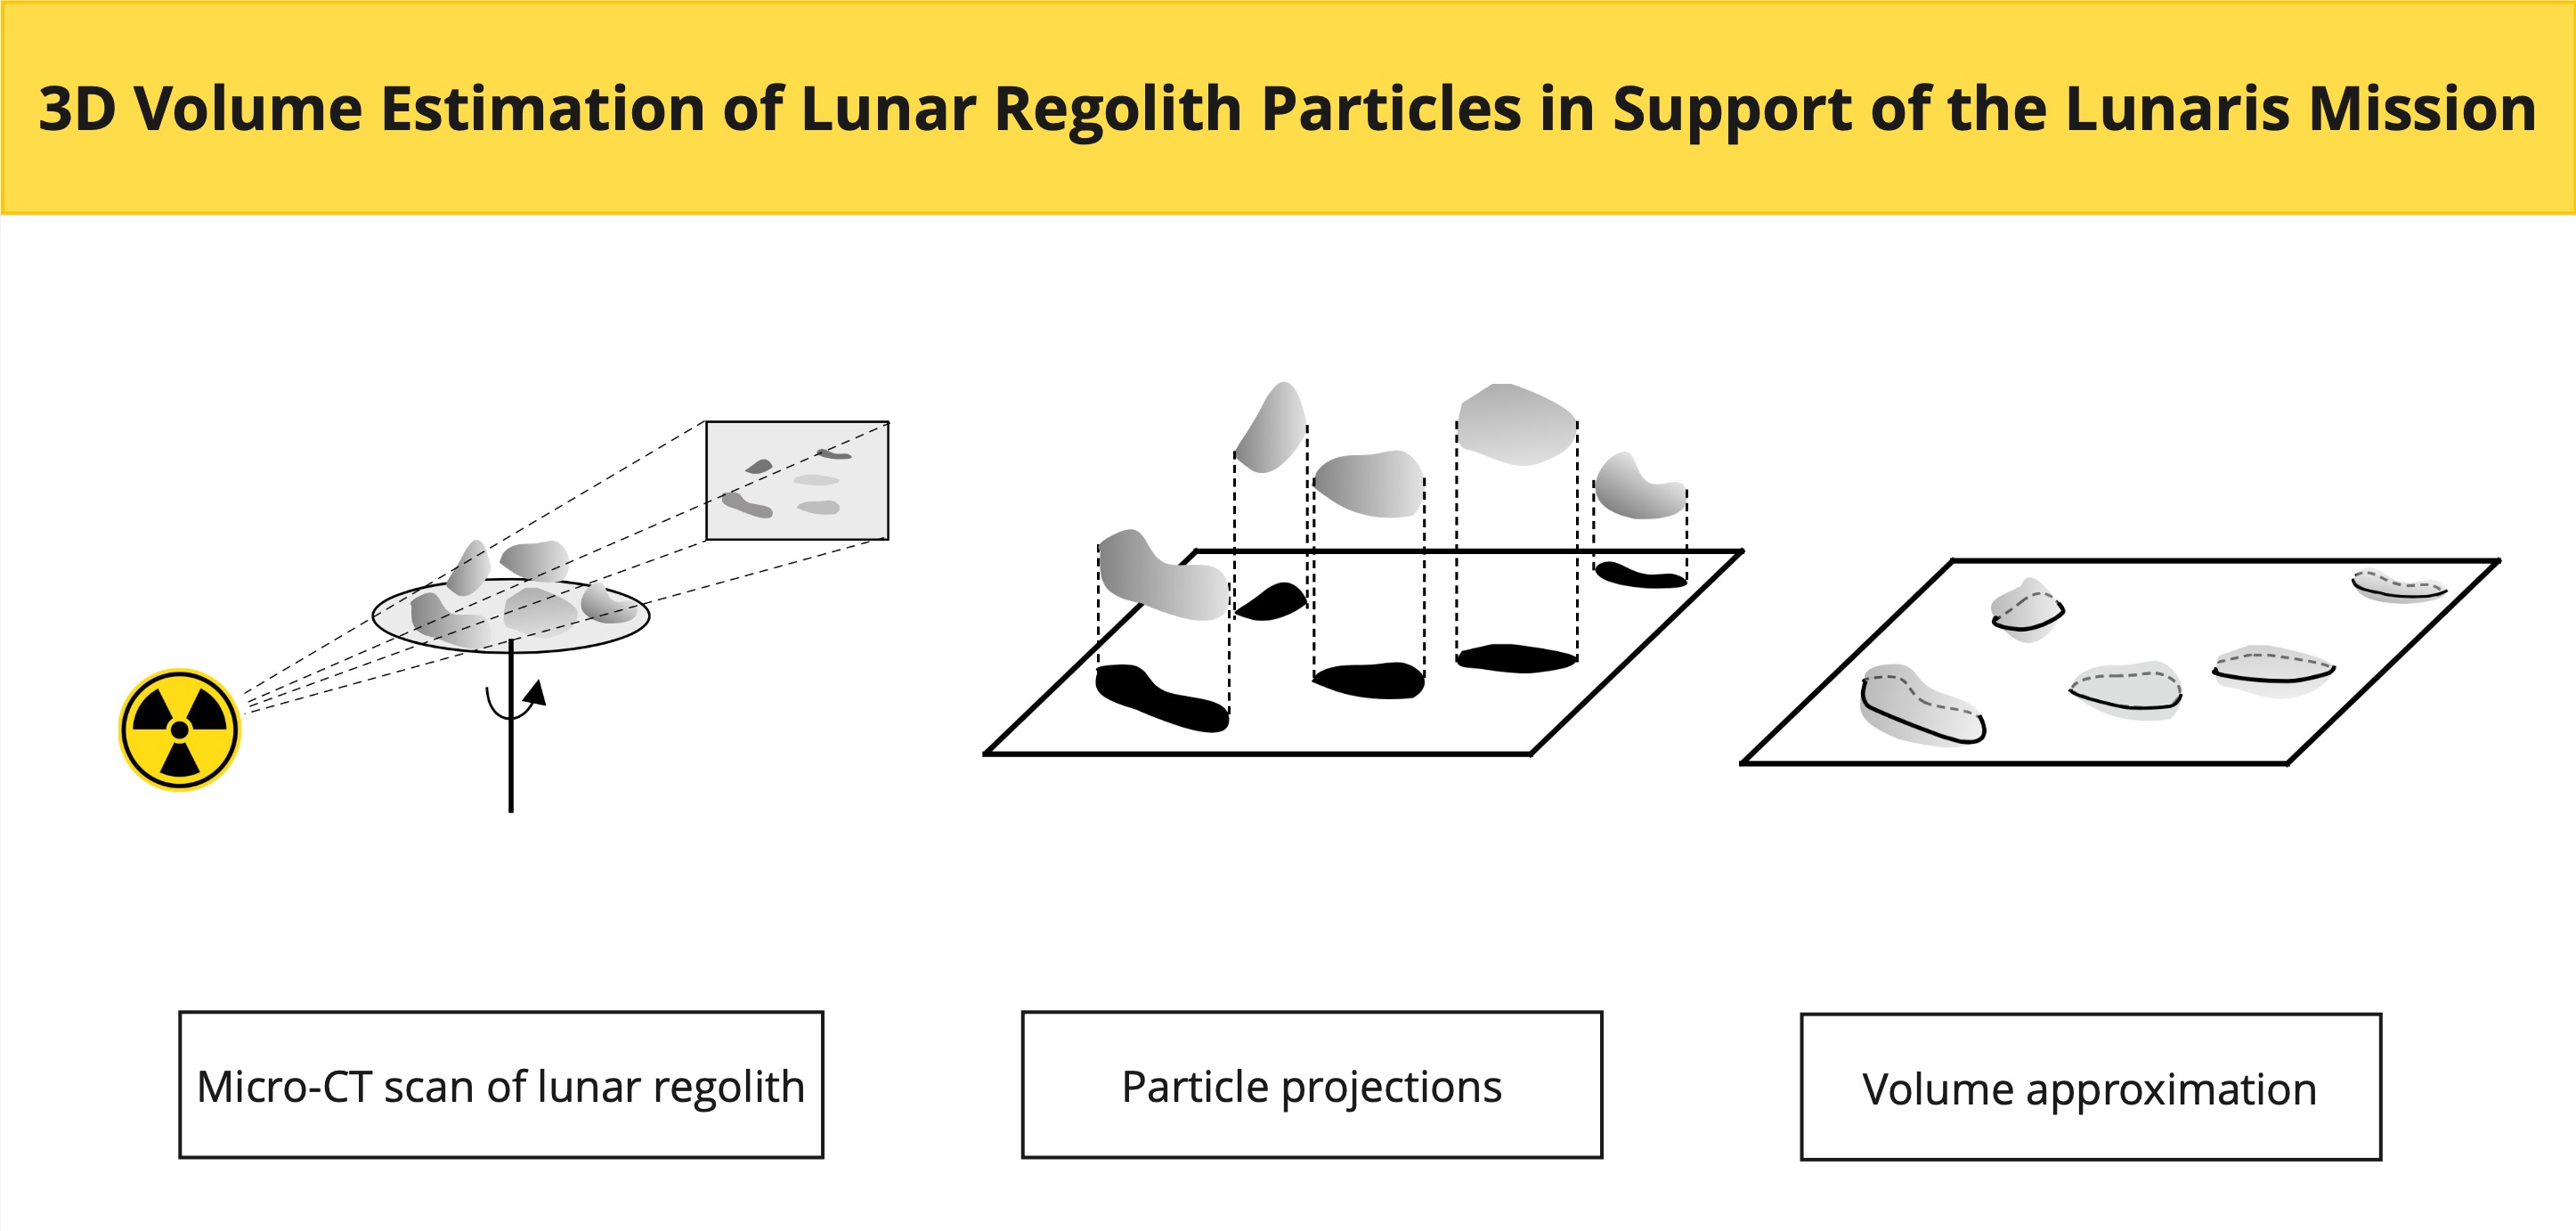
This study introduces techniques for approximating the three-dimensional (3D) volumes of lunar regolith particles based on two-dimensional (2D) image analysis, addressing a critical requirement for the Lunaris mission. Precise determination of particle volume is particularly significant in experimental methods aimed at measuring particle adhesion forces. Because the mass of individual regolith particles depends directly on their volume assuming the density is known, accurate volume assessments are fundamental for reliable adhesion force calculations. For instance, in centrifugal adhesion measurement methods commonly employed in regolith particles adhesion research [25,26,27], the maximum adhesion force is calculated based on particle mass, rotational speed, and radius of rotation. Given that such methods often necessitate rapid estimations of particle volume from 2D imagery due to experimental constraints, the accuracy of 3D volumes significantly influences the reliability of adhesion measurements.
This paper is structured as follows; The first section introduces the scientific background and motivations behind the study, highlighting the challenges of lunar exploration and the importance of accurately approximating the volume of lunar regolith particles. An overview of the Lunaris payload follows, detailing the mission design, operational concept, and key components. Subsequently, the materials and methods are described, including the experimental procedures, image acquisition, and post-processing techniques used for regolith analysis. Various volume calculation methods are then presented to estimate particle volumes from 2D images. Finally, the results are discussed in detail, comparing the performance of different methods and evaluating their implications for future lunar exploration and in situ resource utilisation.
2. Lunaris Payload Overview
The Lunaris payload is a sub 1U-class, 3D-printed, deployable system for in-situ optical sensing under mass (200 g) and power (0.5 W) budget, illustrating how compact instrumentation can deliver exploration-relevant regolith characterization within smallsat constraints. Its primary structure is made of CRP Windform XT 2.0, a space-qualified material used in CubeSats and deployers [28]. The integrated structure includes a bus and a spring-loaded hatch supporting a camera and a dual-section LED lighting system. These components face a tiltable material sample plate, aligned with the camera using a stepper motor and monitored by Hall-effect and optical endstop sensors. A render is shown in Figure 1. The electronics-onboard computer, power unit, and motor controller-are housed within the bus. The payload operates by deploying the hatch, contacting the lunar surface with the sample plate, illuminating the contact area, capturing images, and transmitting data to Earth. It complies with stringent mission constraints: 200 g total mass, a maximum power consumption of 0.5 W and a compact 1U form factor.
3. Materials and Methods
Due to constraints related to mass, power, and resource limitations, optical methods are employed to analyse the adhesion of lunar regolith particles in situ. The calibration method for the Lunaris payload uses a 3D scanner, specifically a GE phoenix v|tomex|m micro-CT system. This approach aims to establish a precise calibration method for quantifying adhered particles of the regolith analogue. By determining the 3D volume of particles deposited on PEEK samples, it is possible to estimate the total volume of adhered material. The calibration is performed only once and serves to validate the methodology used to approximate the 3D volume of regolith particles, thereby ensuring the reliability of subsequent optical measurements.
Lunex Technology LX-M100 is a Mare-type lunar regolith simulant. The mineralogical composition of this simulant is presented in Table 1.
3.1. Experimental Procedure
The experiment involved the following steps:
- Sieving the regolith to obtain a controlled particle distribution below 100 µm.
- Depositing the regolith onto 2 mm PEEK disk samples, which were then mounted on a glass rod.
- Attaching a piece of low-density foam to the glass rod, to which the sample with regolith was affixed using hot glue.
- Placing the glass rod in a self-centering, rotating holder to ensure stable positioning during scanning.
-
Testing two different PEEK samples (B and C), with multiple scans per sample:
- Sample B: four scans,
- Sample C: three scans.
PEEK was selected due to its compatibility with the measurement technique, specifically its effective X-ray transparency. Scans were performed using a dual-lamp GE Phoenix v|tome|x|m tomograph, during which each sample was rotated 360° to ensure comprehensive visualization. The sample was mounted on a glass rod and positioned within a self-centering holder inside the scanner. Centrifugal detachment tests conducted between scans caused a gradual reduction in particle volume, visible across successive images. Differences in the total number of scans between samples B and C are attributable to variations in the visualization approach. Sample C included an initial pre-dusting scan, which was subsequently excluded from comparative analysis. In contrast, scanning of sample B commenced after the dusting procedure, resulting in four scans for sample B and three scans for sample C, all of which were included in the analysis. The reconstructed 3D greyscale model represents the levels of X-ray absorption, which are largely dependent on material density. The voxel size achieved in this study was 2 µm3. Each sample scan took approximately one hour.
3.2. Post-processing
After exportation, the samples were initially aligned using VGStudio and exported to the .raw format. The next step was to import them into Avizo Thermo Fisher 2020.3, which enabled segmentation and 3D visualisation of the samples. The first step involved importing the raw file and performing an initial representation to verify data integrity. Once confirmed, a median filter and then interactive thresholding were applied to segment the regolith, leveraging its distinct X-ray permeability relative to PEEK. The result is shown in Figure 2.
Due to variations in atmospheric conditions, such as pressure fluctuations that affect scan intensity, each sample was manually analyzed to ensure consistency. Subsequently, the ’separate objects’ function was applied to detach clustered particles. Following segmentation, labeling analysis was conducted, and the 3D volumes of the regolith particles were reconstructed. The overall process is depicted in Figure 3.
To enable quantitative analysis, image stacking was used to create a 2D representation of the segmented volume. The resulting image, shown in Figure 4, illustrates the segmentation results. Each color represents an individual particle. Following segmentation, the processed data-including particle volumes and shape descriptors-were exported for subsequent analysis.
Subsequent processing was performed in MATLAB 2024b, where the images were imported and converted to greyscale. To ensure accurate measurements, the scale was manually determined for each image, enabling the calculation of the pixel-to-micrometre ratio. A circular region of interest was applied to isolate the relevant portions of each image, minimising the influence of background noise. The process is presented in Figure 5.
The scale factors used for conversion of exported images from Avizo are presented in Table 2.
For particle segmentation, an adaptive thresholding approach was employed to facilitate binarization, followed by the application of the SLIC algorithm (Simple Linear Iterative Clustering) [29], which generated approximately 2300 superpixels per image with a compactness factor of 20. To refine the particle boundaries, the edges between the superpixels were set to zero in the binary image. The described process is presented in Figure 5.
In order to effectively separate touching particles, the Euclidean distance transform of the inverted binary image was computed, followed by the application of the watershed algorithm. A similar approach to that presented by Sun and Luo [30] was used to effectively address the problem of oversegmentation. Extended minima with a height threshold of 0.5 were imposed to identify particle cores, ensuring accurate segmentation. The watershed lines were subsequently set to zero in the binary image to finalise the particle delineation. Finally, any artifacts smaller than one pixel were removed through an area opening to enhance the segmentation accuracy.
Once segmentation was completed, the geometrical properties of the individual particles were extracted using the regionprops function. This allowed for the measurement of key morphological parameters, including particle area, major axis length, and minor axis length, initially in pixel units. These values were then converted to micrometres using the image-specific scale factor. The total particle volume per image was determined by adding the individual particle volumes, allowing for direct comparison with the reference data set and facilitating an evaluation of the accuracy of the measurement.
4. Volume Calculation Methods
To quantify the volume of particles identified in the segmented images, six methods are used, each based on different geometric assumptions about particle shape. Let represent the physical area of the i-th particle (in ), derived from the area of the pixel scaled by the square of the scale factor (), where and N are the total number of particles in an image. For methods using Feret diameters or ellipse axes, additional measurements are defined: and are the maximum and minimum Feret diameters, and and are the lengths of the major and minor axes of the fitted ellipse, all in physical units (). The total volume for each method is computed as follows:
where is the volume of the i-th particle according to the specified method. In the following, each method is described and its corresponding volume equation for a single particle is provided.
4.1. Sphere Method
This method follows the principles outlined by [31], where the estimation of particle size approximates particles as spheres for simplified calculations whose projected area equals the measured area . The radius is derived from , so . The volume is then:
4.2. Ellipsoid with Fixed Aspect Ratio
Here, particles are modelled as ellipsoids ([32]), with two equal semi-axes and a third axis scaled by a fixed aspect ratio , as specified in the technical datasheet of the employed regolith simulant. Assuming the projected equatorial area is (where ) visible in the Figure 6, and the third semi-axis is , the volume is derived as:
This formulation adjusts the spherical volume by aspect ratio, reflecting an oblate spheroid when .
4.3. Feret Method
This approach uses the maximum and minimum Feret diameters to approximate each particle as an ellipsoid ([33]). The maximum Feret diameter is the longest distance between two points in the convex hull of the particle, and the minimum Feret diameter is the smallest width perpendicular to this direction, both sized to physical units. The semiaxes are assigned as , , yielding:
4.4. Cylinder Method
Particles are approximated as cylinders with a base area equal to the projected area and a height equal to the diameter of a circle with that area. If , then , and the height is . The volume is:
4.5. Voxel Method
This method modifies the cylinder approach by applying an empirical scaling factor of 0.4, possibly to adjust for overestimation or to align with voxel-based measurements. The volume is:
4.6. Adaptive Ellipsoid Method
This method models each particle as an ellipsoid with semiaxes derived from the lengths of the major and minor axes of the fitted ellipse ( and ), with the third axis set as half the minor axis. The semiaxes are , , , so:
4.7. Percentage Difference Calculation
The percentage difference is used to compare the volume estimated by each method with the reference volume for each image. It quantifies the relative error of the estimate as a percentage. The calculation is defined as follows:
For each image i and volume estimation method m, the percentage difference is calculated using the formula:
where:
- represents the reference volume of the particles in image i,
- is the volume estimated by method m for image i,
- is the percentage difference for method m on image i, expressed as a percentage.
The above methods have been applied for the experimental data processing.
5. Results
The volume estimation results for each image are presented in Table 3, where the estimated volumes are reported along with the percentage differences from the reference volume. The closest estimation for each sample is underlined.
A heatmap-style colouring scheme has been applied to indicate the accuracy of each method:
- Green (low error, ≤20%): represents the most accurate estimations.
- Yellow (moderate error, 20%–60%): represents estimations with moderate deviations.
- Red (high error, >60%): indicates significant deviations from the reference volume.
For images 3B and 4B, the smallest percentage errors were observed, with Ellipsoid_AR1 achieving deviations below 1%. In contrast, images 1B and C1 exhibited greater variations between methods, with errors exceeding 99% for some approaches. The Cylinder and Sphere methods generally produced the highest overestimations, while the Adaptive Ellipsoid and Ellipsoid_AR1 methods provided more accurate results in most cases. The Voxel method demonstrated moderate errors ranging from 19% to 66%, depending on the image. Across all images, Ellipsoid_AR1 achieved the most consistent accuracy, particularly for smaller volumes.
Continuing on these results, sample 2B showed relatively low errors with Ellipsoid_AR1 () and Adaptive Ellipsoid (), whereas the Sphere method drastically overestimated by and the Cylinder method soared to . Likewise, for sample 2C, the Adaptive Ellipsoid approach produced the smallest error (), followed closely by Ellipsoid_AR1 (), while the Cylinder approximation reached . Conversely, sample 3C offers a rare instance where the Sphere method yielded the lowest error (). Although ellipsoid-based models generally excel-particularly Ellipsoid_AR1.
6. Conclusions
This study evaluated six methods for 3D volume approximation of lunar regolith particles, with ellipsoid-based approaches proving most accurate. These findings improve the ability of the Lunaris mission to study regolith adhesion in situ, supporting future lunar exploration and ISRU applications.
Adhesion measurement is a key aspect in the future of lunar exploration. During the Apollo era, numerous problems with regolith greatly impeded moon exploration. Adhesion and its mechanisms differ significantly from those on Earth: the high-vacuum Moon environment eliminates water-related capillary effects, leading to a fundamentally different behaviour of lunar regolith particles. To prepare for these challenges, extensive experiments must be performed in simulated environments and then on the Moon.
Many novel techniques have been developed, but adhesion forces typically depend on the mass of the particles, which makes it crucial to assess their volume. Among them is the Lunaris payload that uses a camera to visualise the adhered particles. Optical methods are frequently used in such studies because they yield quick and low volume data. However, 3D visualisation is far more accurate but requires high-performance computing and advanced equipment. Despite these requirements, it produces substantially more precise volume information. In the context of regolith particles volume evaluation, Barker et al. [27] used Feret length to estimate the volume of the particles under the assumption of sphericity; however, their results show that this approach is imprecise. Another example is presented by Oudayer et al. [34], who also assume particle sphericity and derive volumes from a diameter measure. Similarly, [25] used particle sphericity for volume calculation. Ilse et al. [35] employed a cross-sectional diameter to define an equivalent spherical diameter for volume estimation. A narrower particle size distribution can also be achieved by sieving through two meshes, enabling the use of a particle counter analyser or spherical simulants to represent the regolith. Wohl et al. [36] adopted such a strategy.
Ellipsoid_AR1 employs a constant aspect ratio. This method fits our data set well. However, when the mean value of the aspect ratio is unknown, the Adaptive Ellipsoid method provides an alternative to calculate volume without a predefined ratio.
Most adhesion studies still rely on spherical volume approximations, which often introduce significant errors. In samples 1B and 1C, many particles overlapped, preventing the optical method from capturing regolith grains beneath the top layer. As shown in Figure 7, a side-view micro-CT reconstruction reveals distinct differences in the distribution of regoliths in samples. Sample 1B contains the highest amount of regolith, while sample 4B contains the least. In particular, samples 1B and 2B exhibit substantial particle layering, further emphasizing the limitations of optical methods in densely packed samples.
Regolith grains are highly irregular, and the accuracy of measurement strongly depends on the orientation of the particles. In 2B, more grains were exposed, which yielded better measurements. For 3C, which contains only 38 regolith grains, the error was larger for Ellipsoid_AR1, whereas the spherical approach produced the smallest error. Although ellipsoid-based methods can underestimate volume when the particle count is small, they remain the most suitable if the aspect ratio is known. The Adaptive Ellipsoid method produces similar results and may also be considered. These findings illustrate that certain datasets with few particles or unusual size distributions can favour simpler shapes. Overall, simpler geometries (e.g. spheres, cylinders) often lead to significant overestimations, whereas more flexible ellipsoid-based methods provide superior and more consistent accuracy across diverse sample sizes.
Acknowledgments
This work was supported by IDUB AGH: University grant system for research projects carried out with the participation of doctoral students [grant numbers 10445, 2024]
Conflicts of Interest
The authors declare no conflicts of interest. The funders had no role in the design of the study; in the collection, analyses, or interpretation of data; in the writing of the manuscript; or in the decision to publish the results.
Abbreviations
The following abbreviations are used in this manuscript:
| ISRU | In Situ Resource Utilization |
| CT | Computed Tomography |
| PEEK | Polyetheretherketone |
| ROI | Region of Interest |
| LED | Light Emitting Diode |
| TVAC | Thermal Vacuum |
| AR | Aspect Ratio |
| SLIC | Simple Linear Iterative Clustering |
| VGStudio | Volume Graphics Studio |
| MATLAB | Matrix Laboratory |
| GE | General Electric |
References
- Johnson, S.W.; Chua, K.M. Properties and Mechanics of the Lunar Regolith. Applied Mechanics Reviews 1993, 46, 285–300. [Google Scholar] [CrossRef]
- Crawford, I.A. Lunar resources: A review. Progress in Physical Geography: Earth and Environment 2015, 39, 137–167. [Google Scholar] [CrossRef]
- Neal, C.R. The Moon 35 years after Apollo: What’s left to learn? Geochemistry 2009, 69, 3–43. [Google Scholar] [CrossRef]
- Pieters, C.M.; Goswami, J.N.; Clark, R.N.; Annadurai, M.; Boardman, J.; Buratti, B.; Combe, J.P.; Dyar, M.D.; Green, R.; Head, J.W.; et al. Character and Spatial Distribution of OH/H 2 O on the Surface of the Moon Seen by M 3 on Chandrayaan-1. Science 2009, 326, 568–572. [Google Scholar] [CrossRef]
- Isachenkov, M.; Chugunov, S.; Landsman, Z.; Akhatov, I.; Metke, A.; Tikhonov, A.; Shishkovsky, I. Characterization of novel lunar highland and mare simulants for ISRU research applications. Icarus 2022, 376, 114873. [Google Scholar] [CrossRef]
- Meurisse, A.; Carpenter, J. Past, present and future rationale for space resource utilisation. Planetary and Space Science 2020, 182, 104853. [Google Scholar] [CrossRef]
- Guerrero-Gonzalez, F.J.; Zabel, P. System analysis of an ISRU production plant: Extraction of metals and oxygen from lunar regolith. Acta Astronautica 2023, 203, 187–201. [Google Scholar] [CrossRef]
- Landis, G.A. Materials refining on the Moon. Acta Astronautica 2007, 60, 906–915. [Google Scholar] [CrossRef]
- Anand, M.; Crawford, I.; Balat-Pichelin, M.; Abanades, S.; Van Westrenen, W.; Péraudeau, G.; Jaumann, R.; Seboldt, W. A brief review of chemical and mineralogical resources on the Moon and likely initial in situ resource utilization (ISRU) applications. Planetary and Space Science 2012, 74, 42–48. [Google Scholar] [CrossRef]
- Cesaretti, G.; Dini, E.; De Kestelier, X.; Colla, V.; Pambaguian, L. Building components for an outpost on the Lunar soil by means of a novel 3D printing technology. Acta Astronautica 2014, 93, 430–450. [Google Scholar] [CrossRef]
- Meurisse, A.; Makaya, A.; Willsch, C.; Sperl, M. Solar 3D printing of lunar regolith. Acta Astronautica 2018, 152, 800–810. [Google Scholar] [CrossRef]
- Taylor, S.L.; Jakus, A.E.; Koube, K.D.; Ibeh, A.J.; Geisendorfer, N.R.; Shah, R.N.; Dunand, D.C. Sintering of micro-trusses created by extrusion-3D-printing of lunar regolith inks. Acta Astronautica 2018, 143, 1–8. [Google Scholar] [CrossRef]
- Freundlich, A.; Ignatiev, A.; Horton, C.; Duke, M.; Curreri, P.; Sibille, L. Manufacture of solar cells on the moon. In Proceedings of the Conference Record of the Thirty-first IEEE Photovoltaic Specialists Conference, Lake buena Vista, FL, USA; 2005; pp. 794–797. [Google Scholar] [CrossRef]
- Lin, H.; Lin, Y.; Yang, W.; He, Z.; Hu, S.; Wei, Y.; Xu, R.; Zhang, J.; Liu, X.; Yang, J.; et al. New Insight Into Lunar Regolith-Forming Processes by the Lunar Rover Yutu-2. Geophysical Research Letters 2020, 47, e2020GL087949. [Google Scholar] [CrossRef]
- Robinson, M.S.; Brylow, S.M.; Tschimmel, M.; Humm, D.; Lawrence, S.J.; Thomas, P.C.; Denevi, B.W.; Bowman-Cisneros, E.; Zerr, J.; Ravine, M.A.; et al. Lunar Reconnaissance Orbiter Camera (LROC) Instrument Overview. Space Science Reviews 2010, 150, 81–124. [Google Scholar] [CrossRef]
- Lin, H.; Yang, Y.; Lin, Y.; Liu, Y.; Wei, Y.; Li, S.; Hu, S.; Yang, W.; Wan, W.; Xu, R.; et al. Photometric properties of lunar regolith revealed by the Yutu-2 rover. Astronomy & Astrophysics 2020, 638, A35. [Google Scholar] [CrossRef]
- Plescia, J. Lunar Surface Environmental Conditions: Challenges of Developing an Outpost and Exploiting in Situ Resources. In Proceedings of the 47th AIAA Aerospace Sciences Meeting including The New Horizons Forum and Aerospace Exposition, Orlando, Florida; 2009. [Google Scholar] [CrossRef]
- Crawford, I.; Anand, M.; Cockell, C.; Falcke, H.; Green, D.; Jaumann, R.; Wieczorek, M. Back to the Moon: The scientific rationale for resuming lunar surface exploration. Planetary and Space Science 2012, 74, 3–14. [Google Scholar] [CrossRef]
- Gaier, J.R. The Effects of Lunar Dust on EVA Systems During the Apollo Missions. NASA 2007, NASA/TM—2005-213610/REV1.
- Budzyn, D.H.; Zare-Behtash, H.; Cowley, A.; Cammarano, A. Compliant mechanisms for dust mitigation in Lunar hardware development: technology and material considerations. IOP Conference Series: Materials Science and Engineering 2023, 1287, 012001. [Google Scholar] [CrossRef]
- Cannon, K.M.; Dreyer, C.B.; Sowers, G.F.; Schmit, J.; Nguyen, T.; Sanny, K.; Schertz, J. Working with lunar surface materials: Review and analysis of dust mitigation and regolith conveyance technologies. Acta Astronautica 2022, 196, 259–274. [Google Scholar] [CrossRef]
- Shkuratov, Y. Regolith Layer Thickness Mapping of the Moon by Radar and Optical Data. Icarus 2001, 149, 329–338. [Google Scholar] [CrossRef]
- Xiao, Z.; Zeng, Z.; Ding, N.; Molaro, J. Mass wasting features on the Moon – how active is the lunar surface? Earth and Planetary Science Letters 2013, 376, 1–11. [Google Scholar] [CrossRef]
- Astrobotic. Orbital space announces historic first privately funded lunar mission from the arab world, 2024.
- Sun, H.; Li, D.; Gao, H.; Wu, Y.; Shen, Z.; Liu, Z.; Li, Y. Measuring adhesion of microparticles in lunar regolith simulant BHLD1000 by centrifugal technique. Planetary and Space Science 2022, 220, 105535. [Google Scholar] [CrossRef]
- Zhang, H.; Wang, X.; Zhang, J.; Mu, M.; Wang, M.; Zhu, Y.; Wang, W. Adhesion effect analysis of ultra-fine lunar dust particles on the aluminum-based rough surface based on the fractal theory. Advances in Space Research 2022, 69, 2745–2755. [Google Scholar] [CrossRef]
- Barker, D.C.; Olivas, A.; Farr, B.; Wang, X.; Buhler, C.R.; Wilson, J.; Mai, J. Adhesion of lunar simulant dust to materials under simulated lunar environment conditions. Acta Astronautica 2022, 199, 25–36. [Google Scholar] [CrossRef]
- Stark, A.; Paddock, A.; Nguyen, T.; Woodham, K. Windform® XT 2.0 Use as 3U CubeSat Primary Structure, Logan, UT, 2023.
- He, W.; Li, C.; Guo, Y.; Wei, Z.; Guo, B. A Two-Stage Gradient Ascent-Based Superpixel Framework for Adaptive Segmentation. Applied Sciences 2019, 9, 2421. [Google Scholar] [CrossRef]
- Sun, H.; Luo, Y. Adaptive watershed segmentation of binary particle image. Journal of Microscopy 2009, 233, 326–330. [Google Scholar] [CrossRef]
- Fayed, M.E.; Otten, L. (Eds.) Handbook of Powder Science & Technology; Springer US: Boston, MA, 1997. [Google Scholar] [CrossRef]
- Tripathi, P.; Lee, S.J.; Lee, C.H.; Shin, M. Towards 3D Shape Estimation from 2D Particle Images: A State-of-the-Art Review and Demonstration. KONA Powder and Particle Journal 2025, 42, 37–56. [Google Scholar] [CrossRef]
- Zhang, X.; Wang, H.; Luo, L. Comparison Analysis of the Calculation Methods for Particle Diameter. Crystals 2022, 12, 1107. [Google Scholar] [CrossRef]
- Oudayer, P.; Mateo-Velez, J.C.; Puybras, C.; Roussel, J.F.; Hess, S.; Sarrailh, P.; Murat, G. Development of a new test bench dedicated to adhesion characterization of lunar dust simulants in space environment. International Symposium on Materials in Space Environment (ISMSE 2018), 2018, 2018). [Google Scholar]
- Ilse, K.; Khan, M.Z.; Lange, K.; Gurumoorthy, H.N.; Naumann, V.; Hagendorf, C.; Bagdahn, J. Rotational force test method for determination of particle adhesion—from a simplified model to realistic dusts. Journal of Renewable and Sustainable Energy 2020, 12, 043503. [Google Scholar] [CrossRef]
- Wohl, C.J.; Atkins, B.M.; College, R.; Connell, J.W. Method and Apparatus for the Quantification of Particulate Adhesion Forces on Various Substrates. NASA 2011. [Google Scholar]
Figure 1.
Render of the Lunaris Payload.
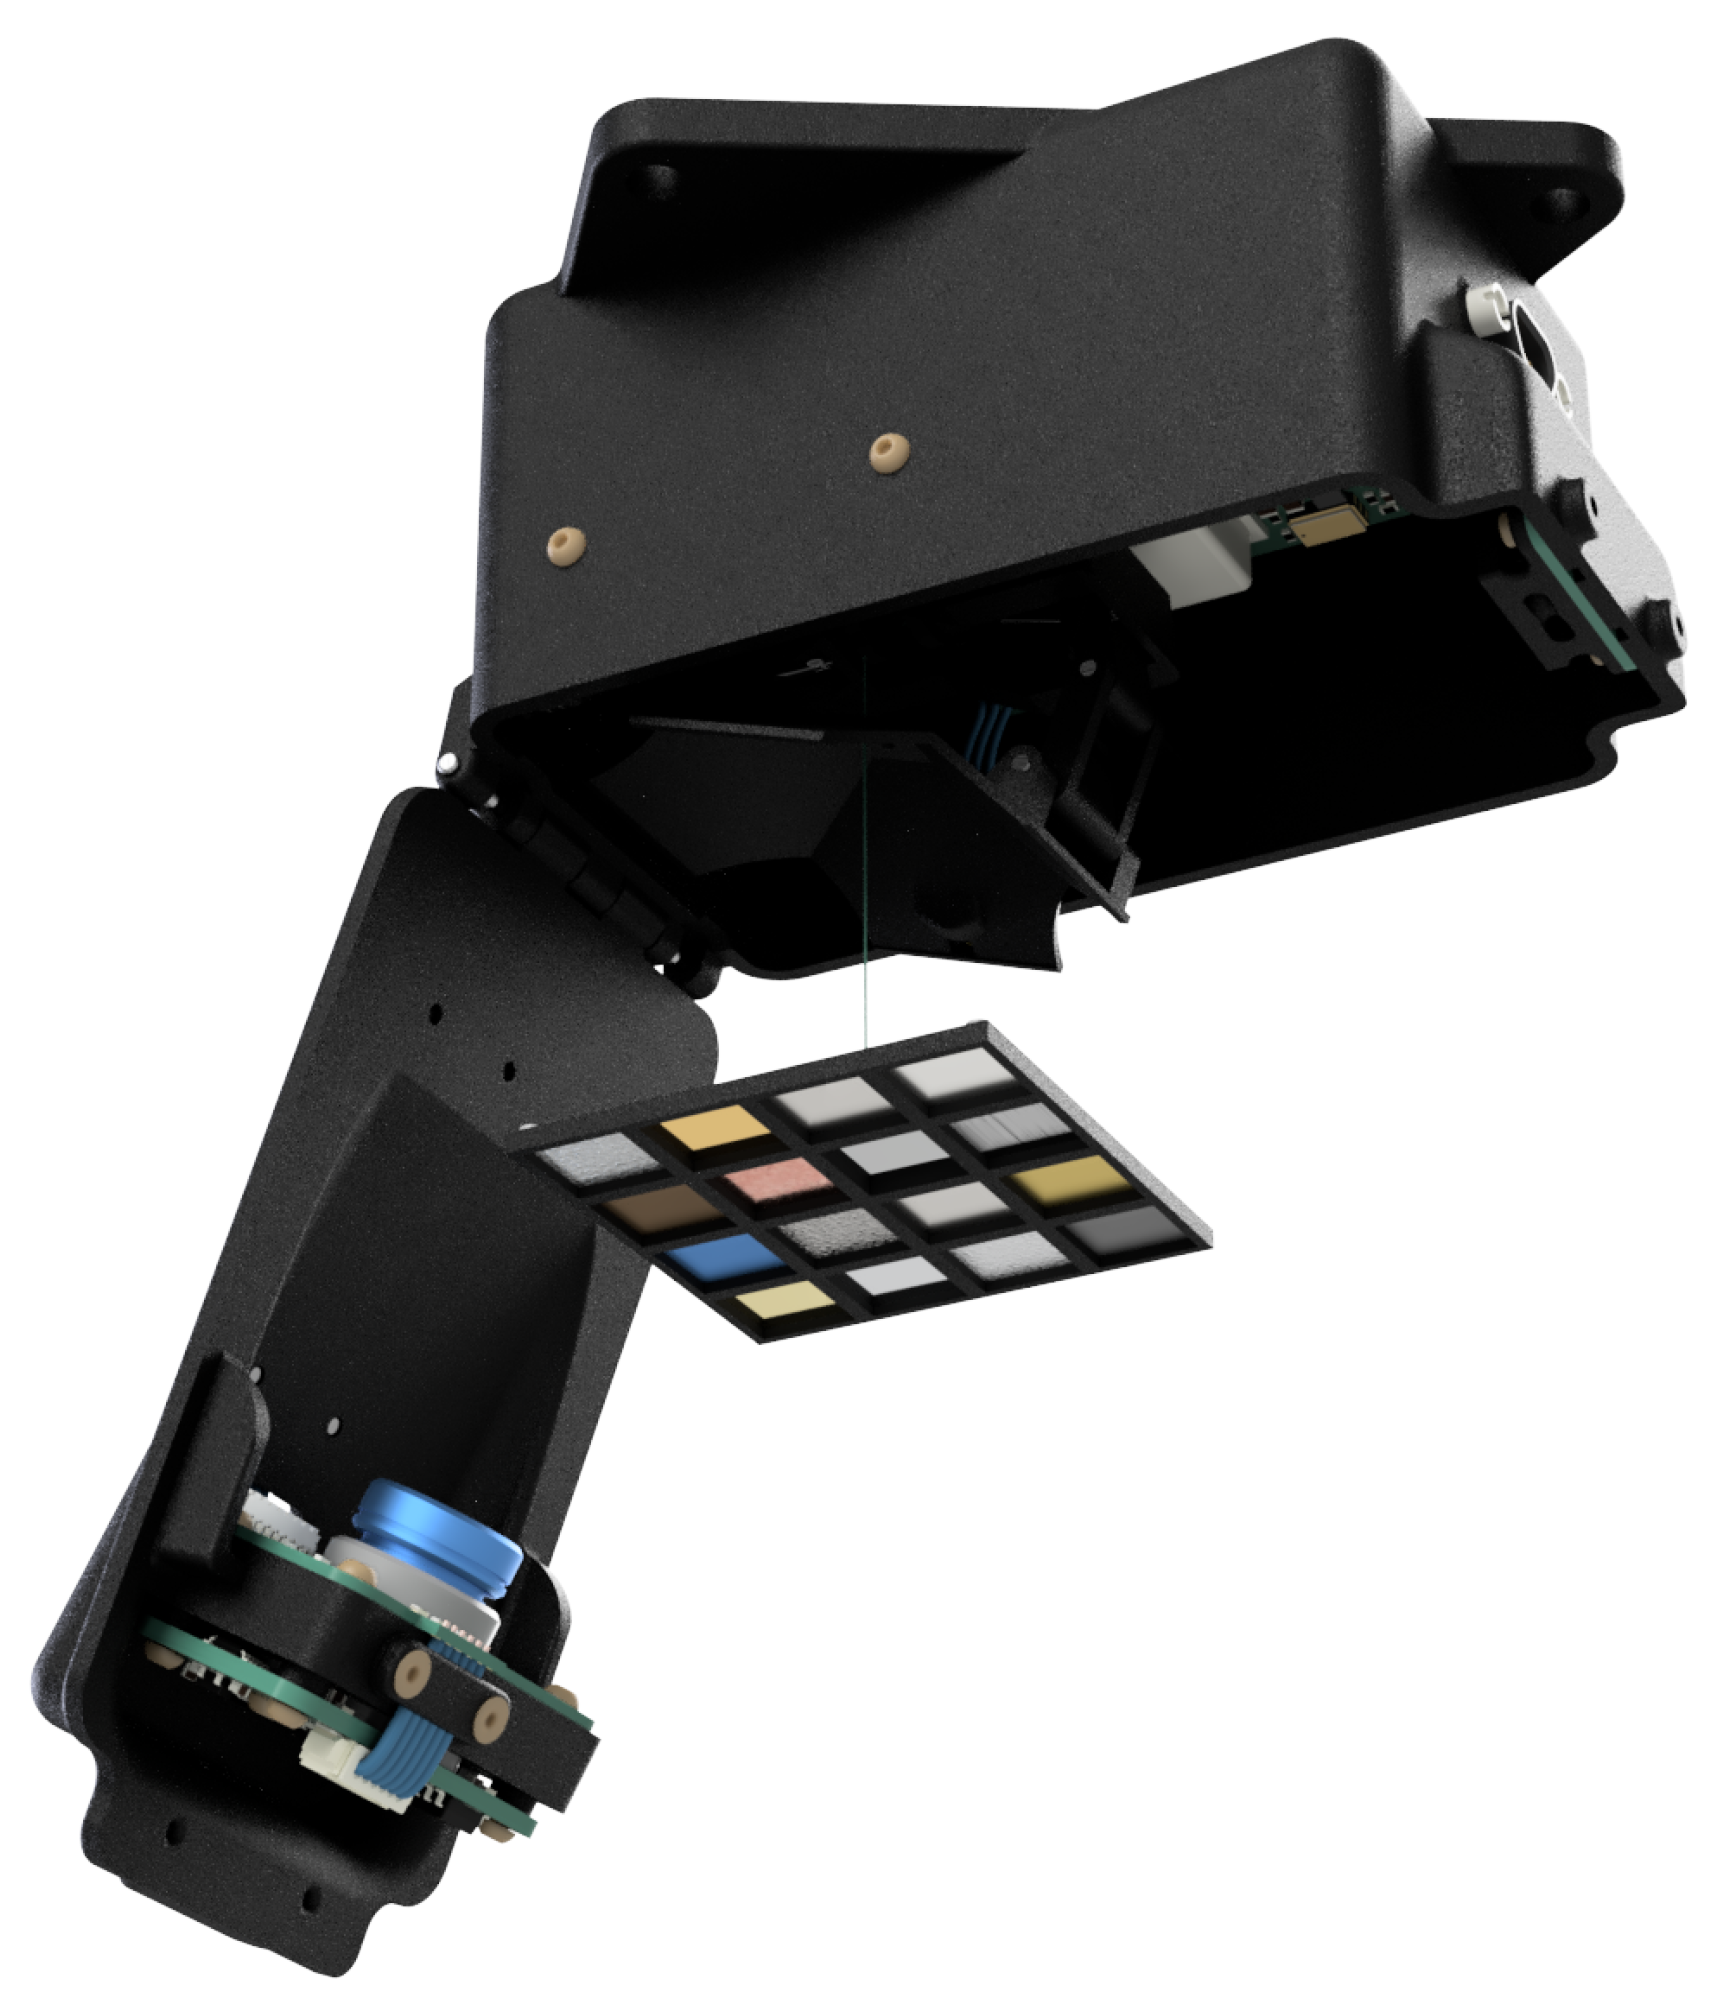
Figure 2.
Part of slice scan after median filtering.
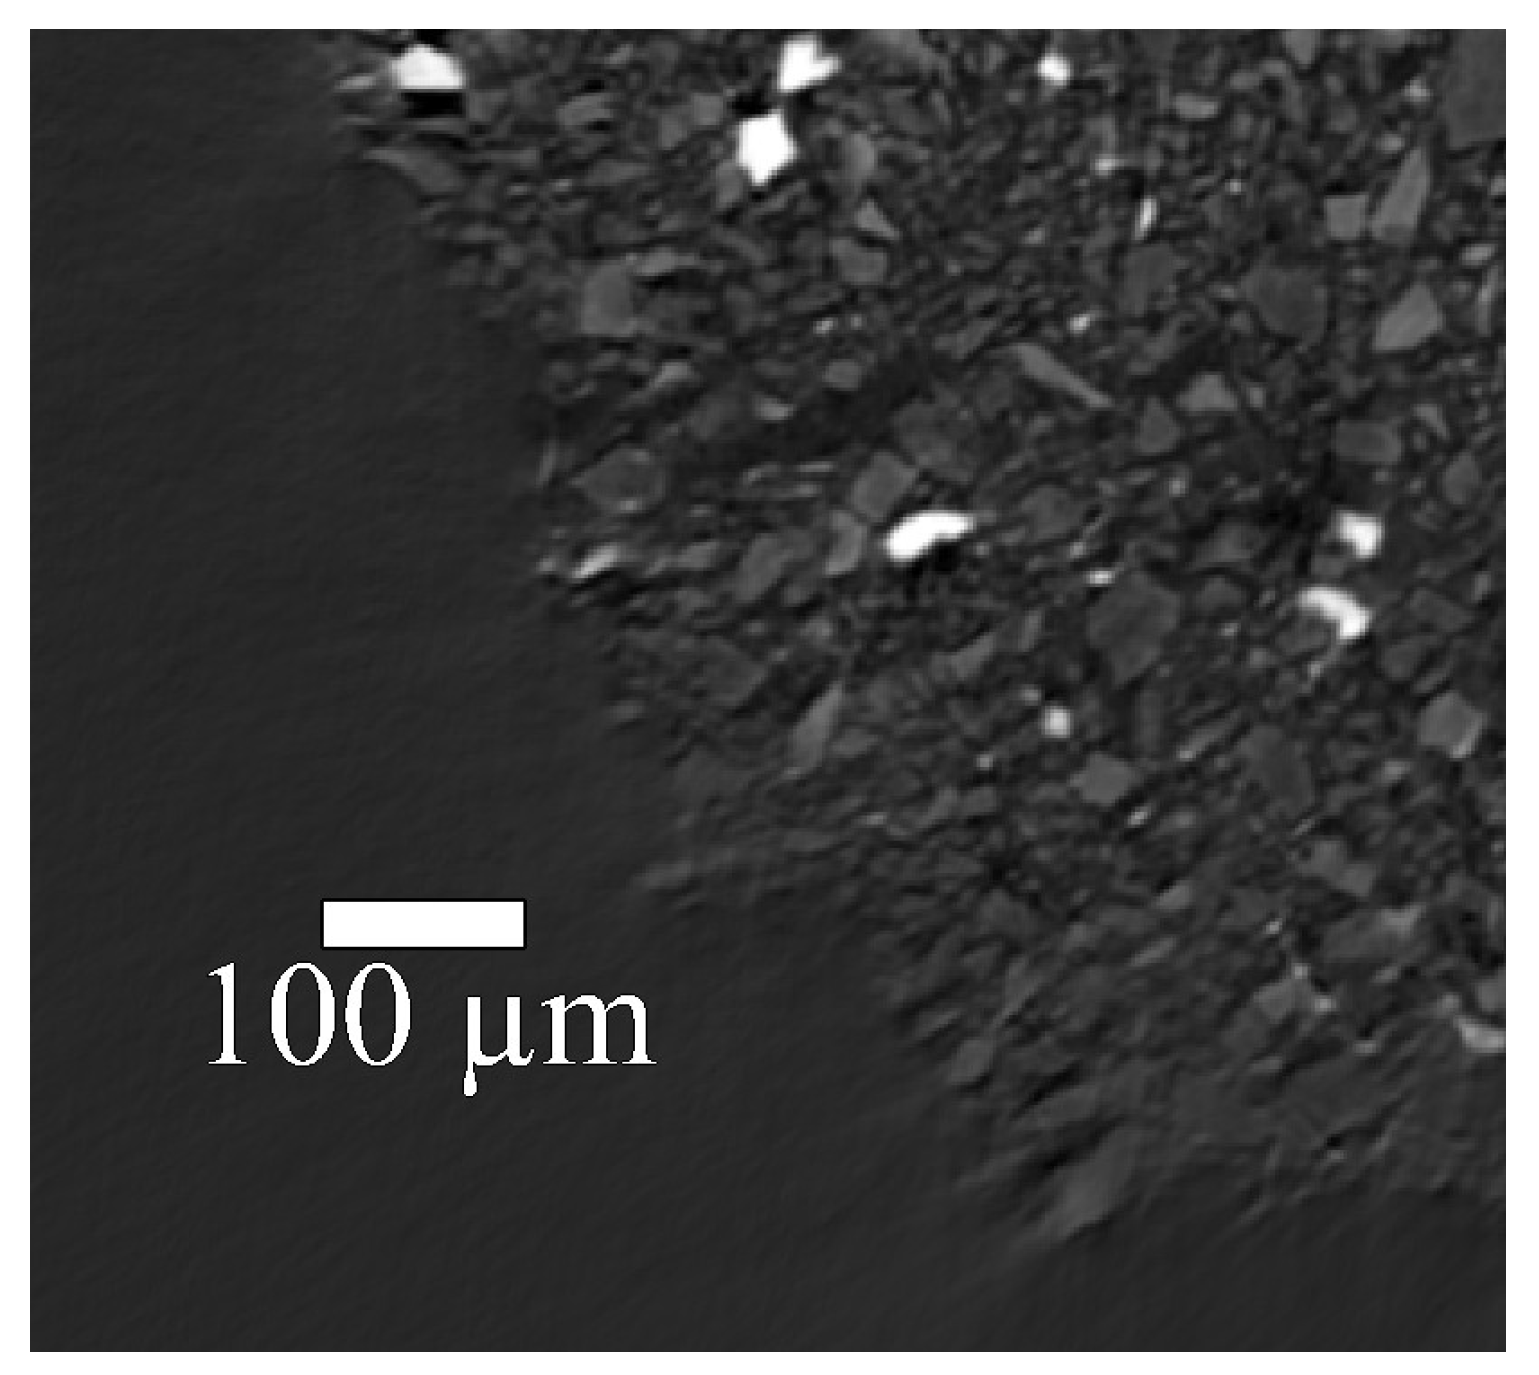
Figure 3.
Workflow of the image segmentation and 3D reconstruction process.
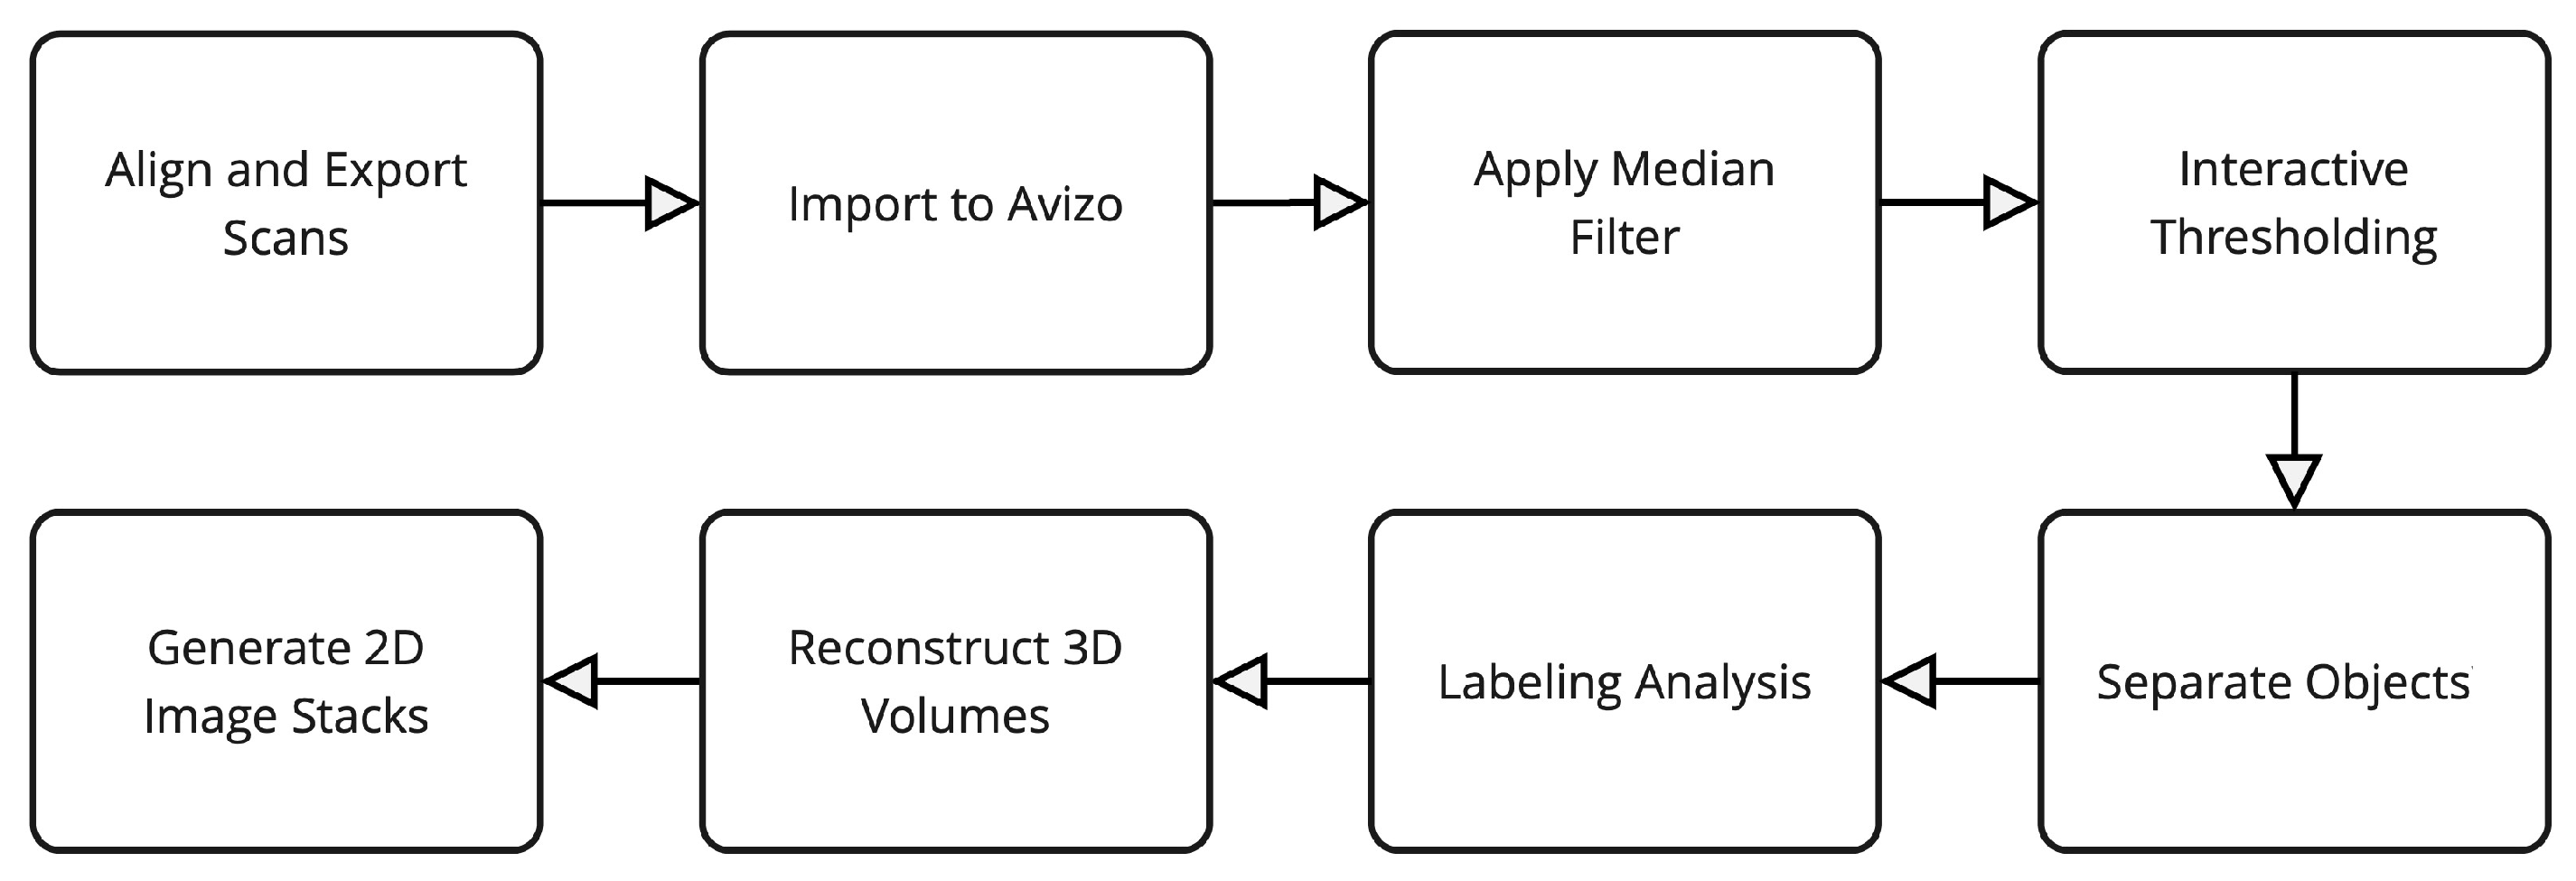
Figure 4.
Image stacking representation of sample 3B. Different colors correspond to segmented individual particles.
Figure 4.
Image stacking representation of sample 3B. Different colors correspond to segmented individual particles.
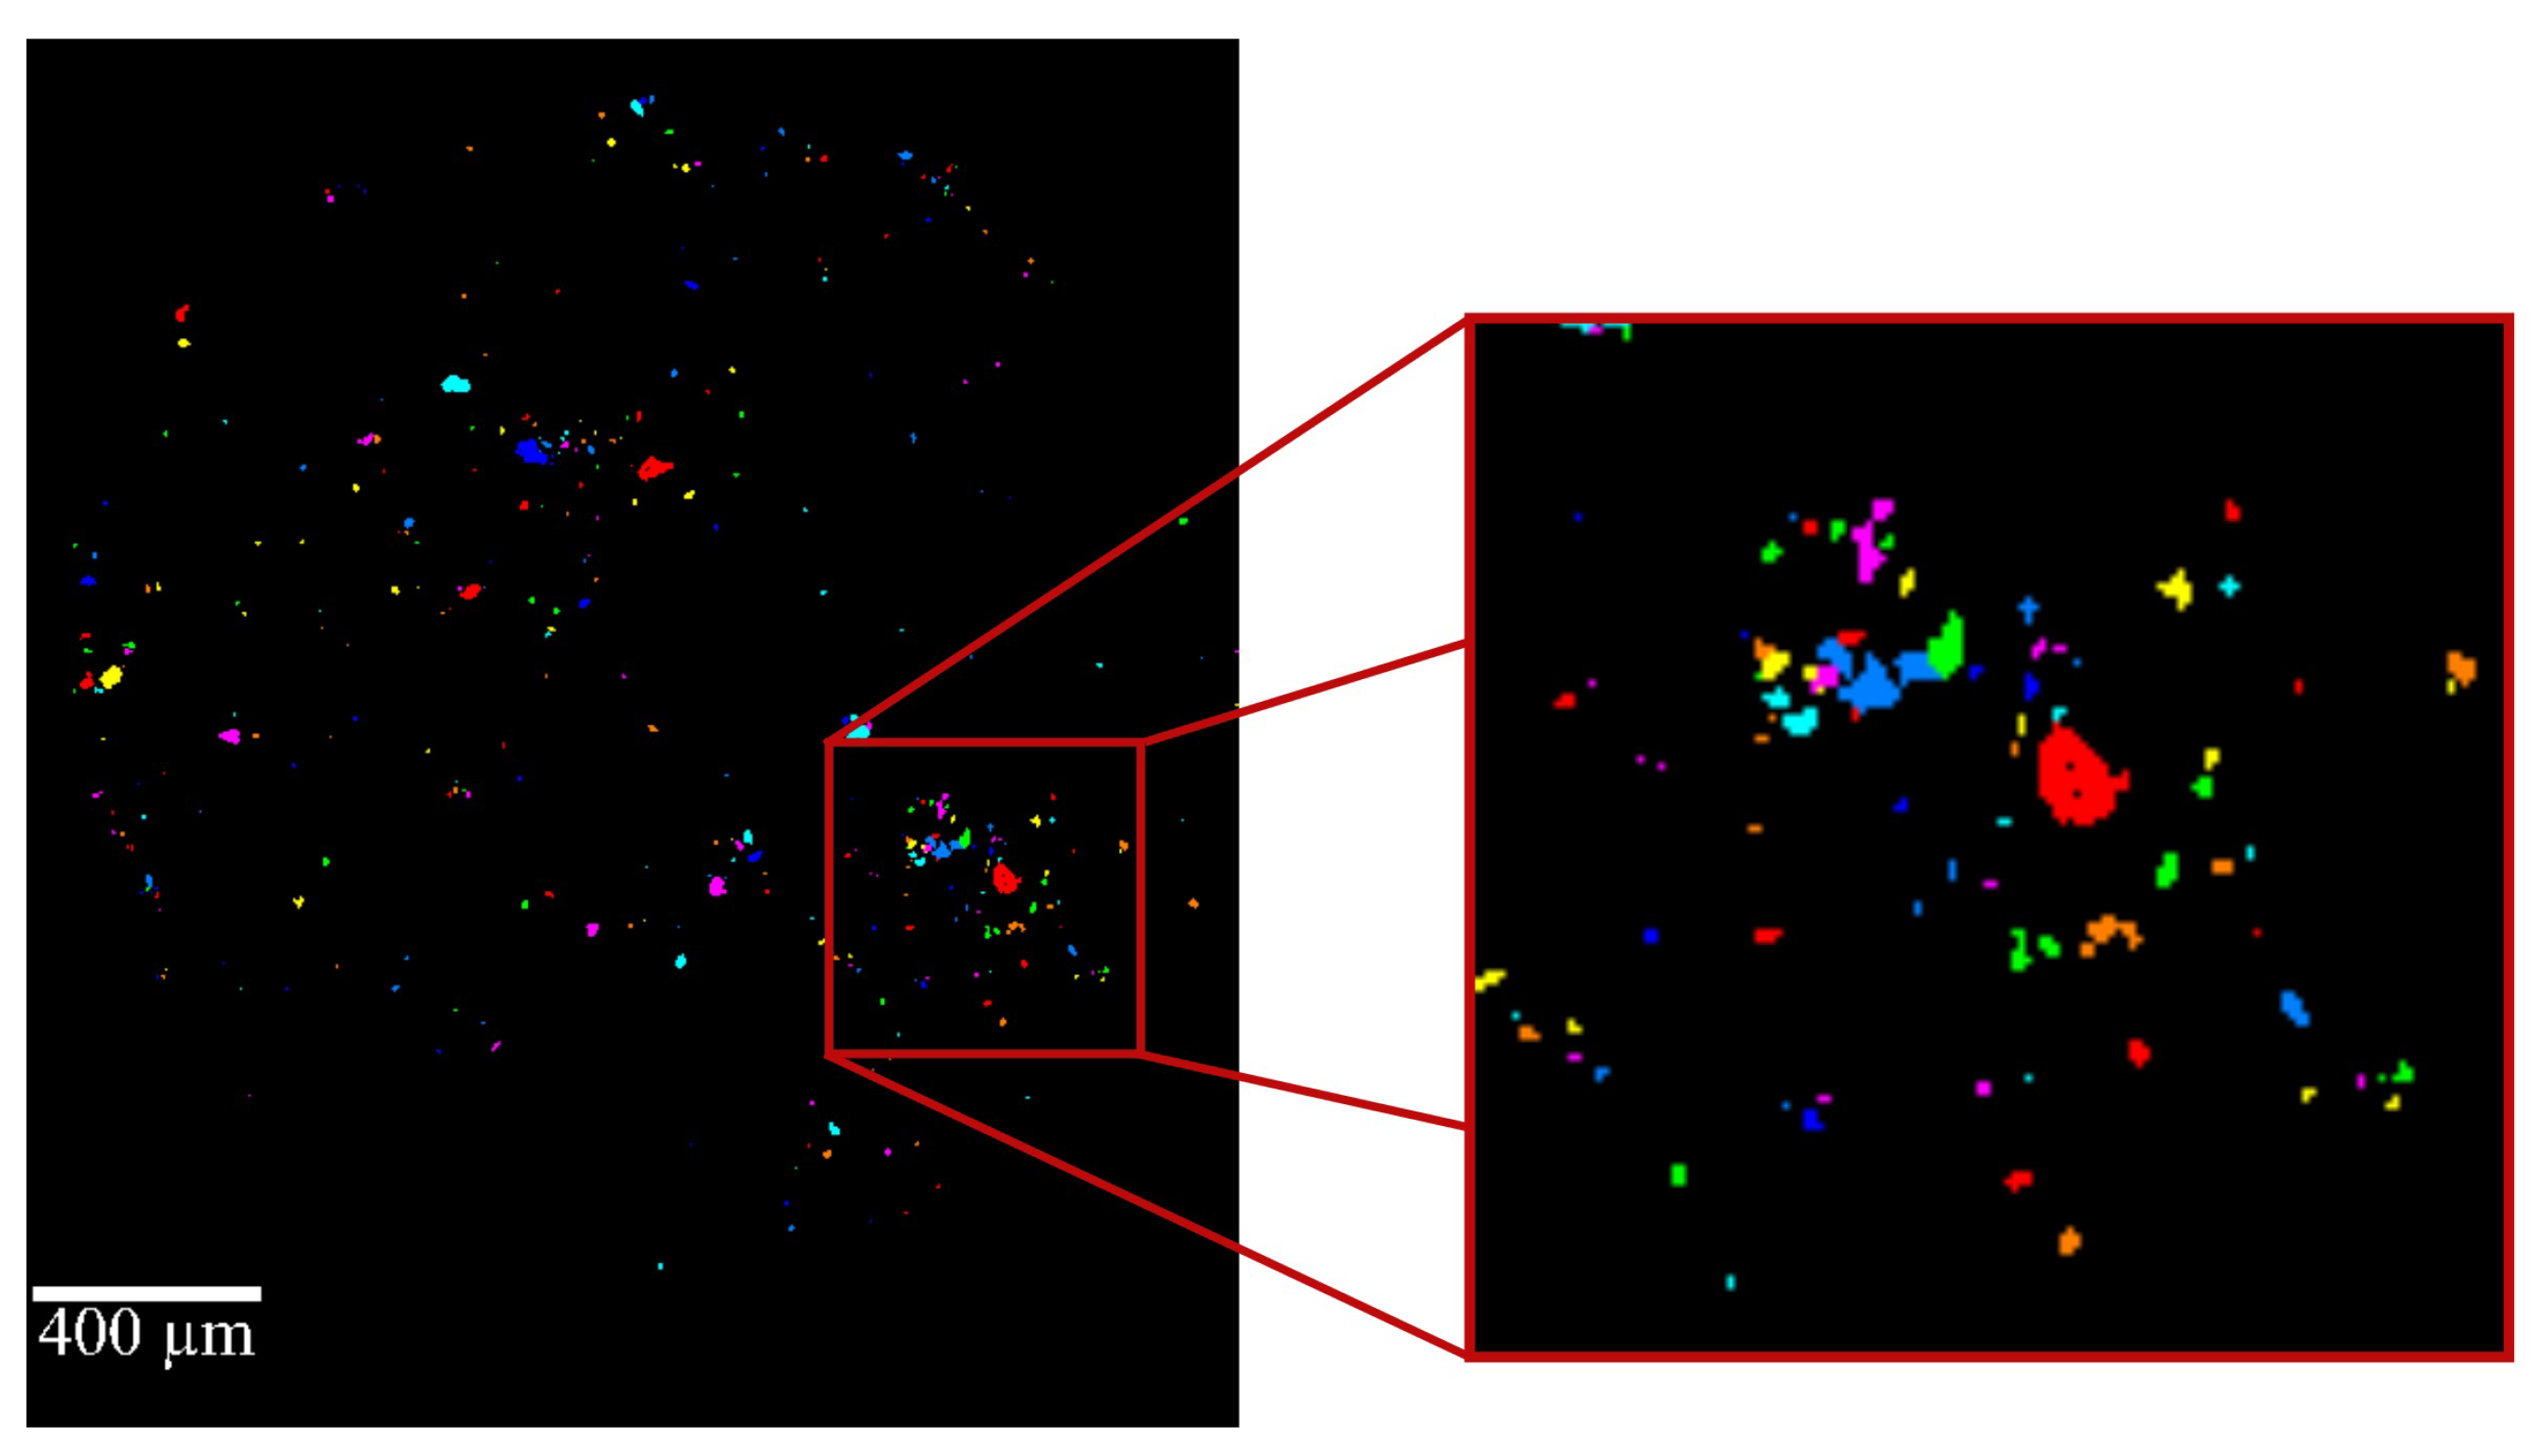
Figure 5.
MATLAB image processing workflow.
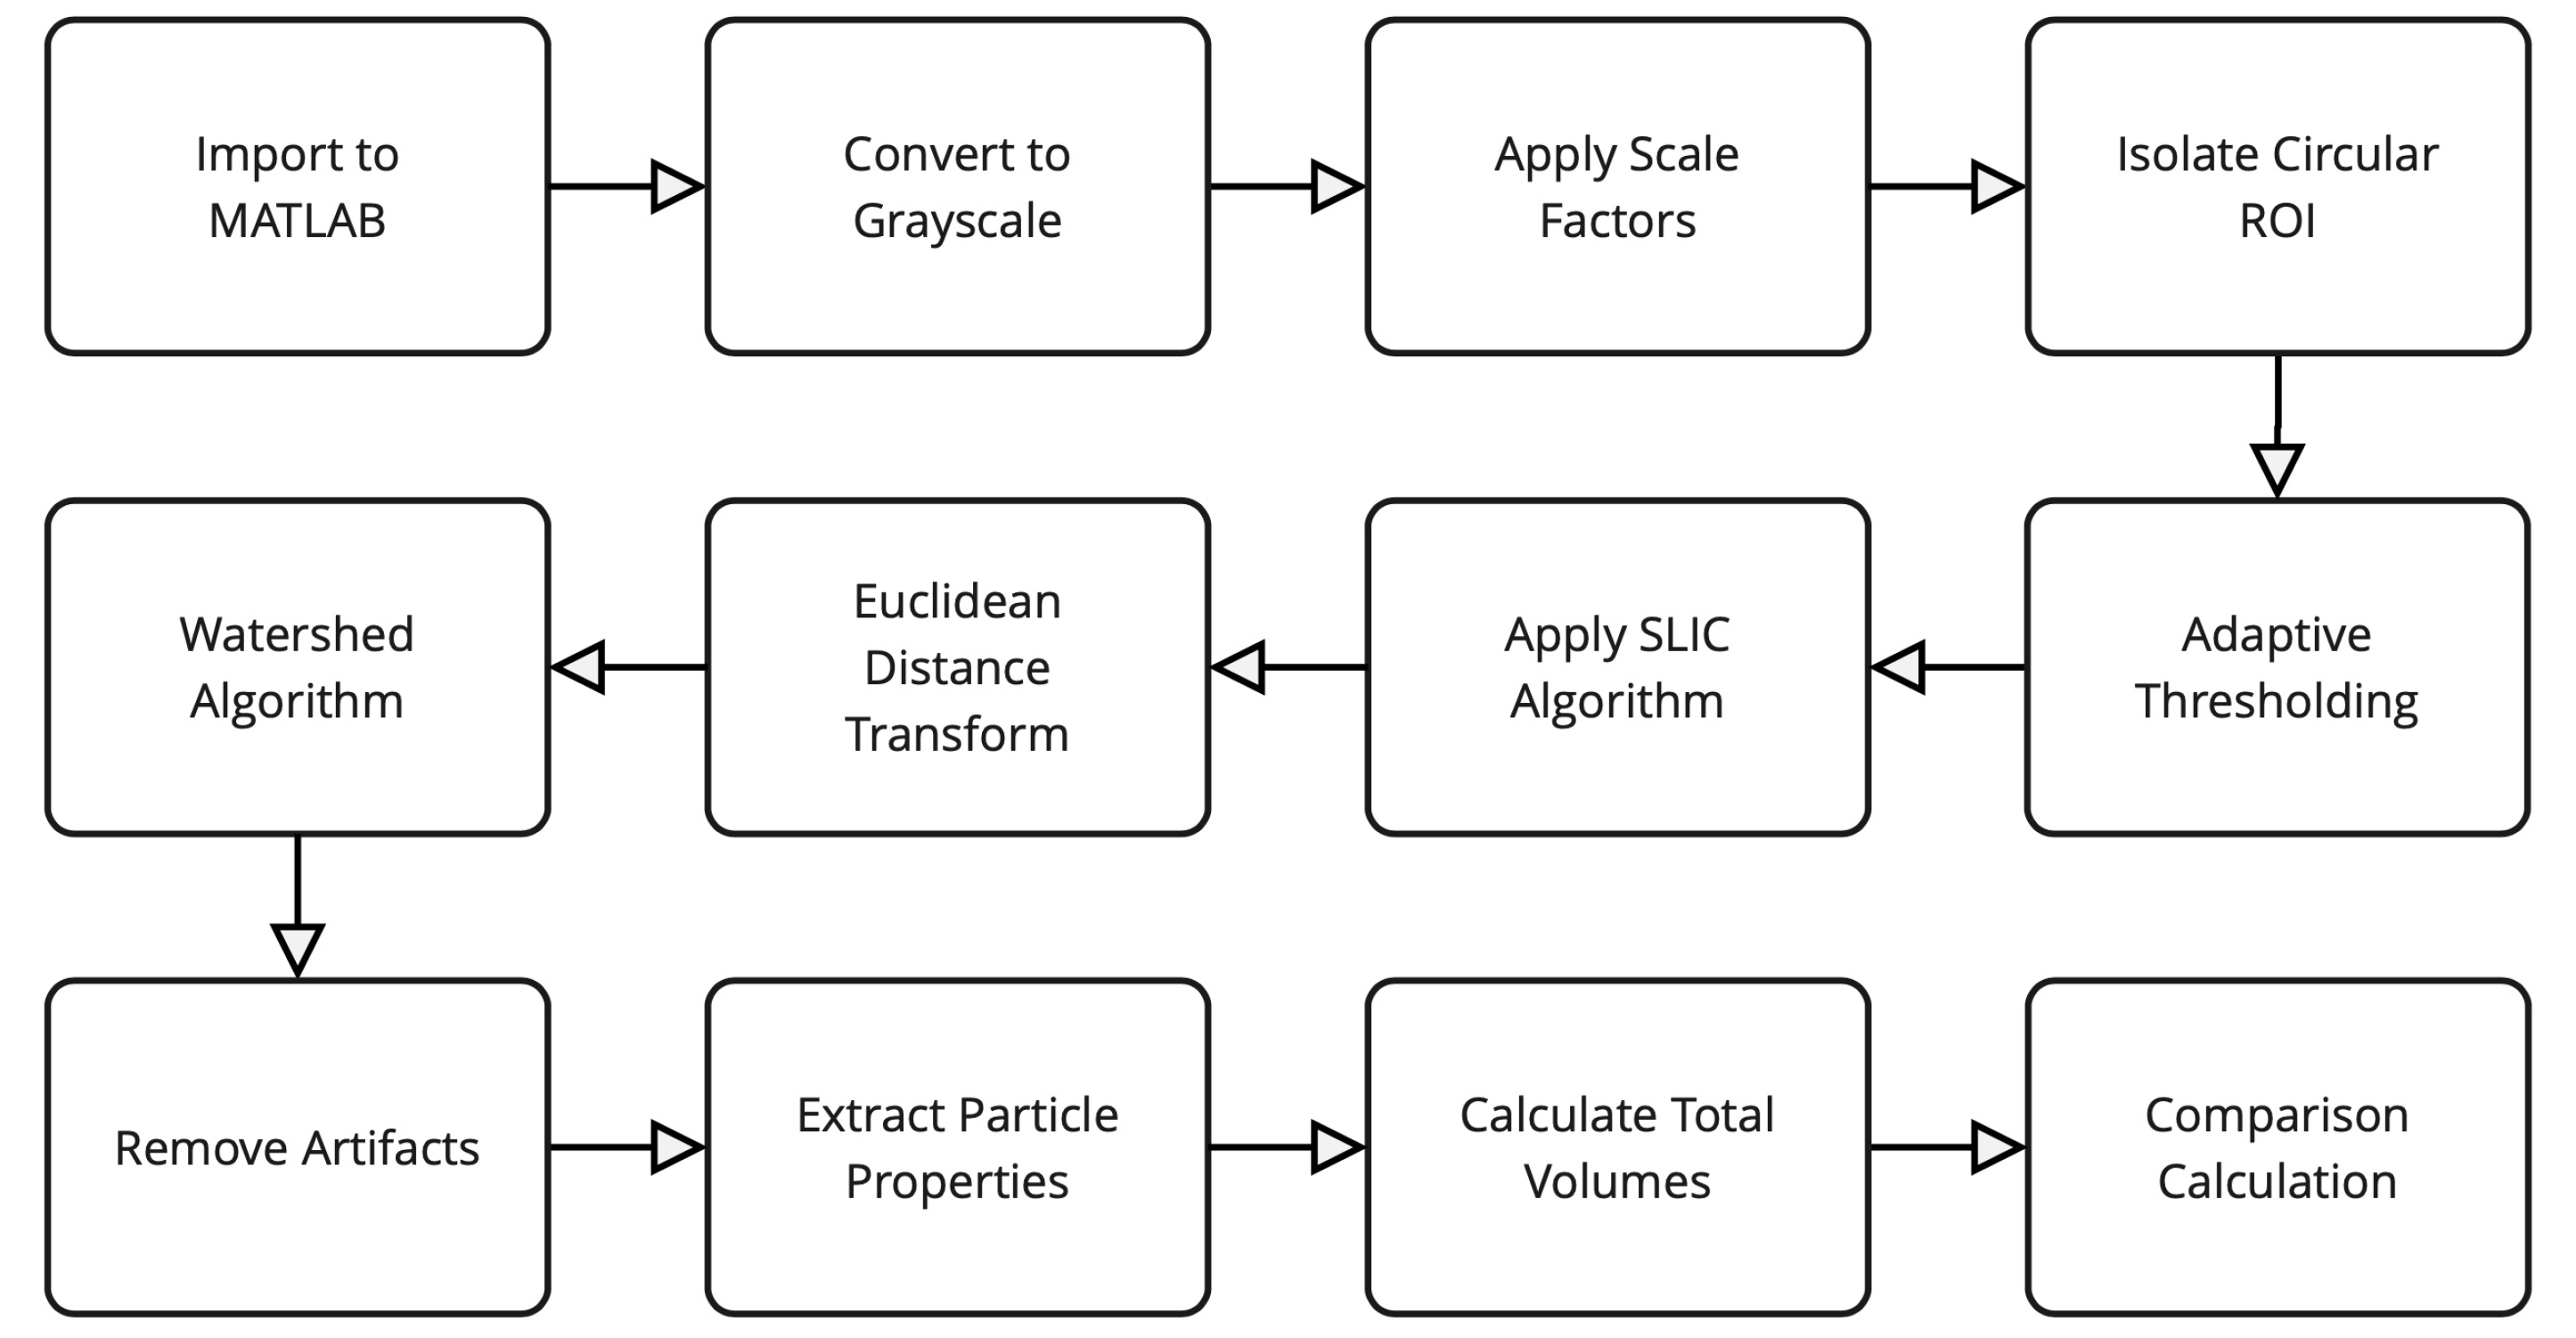
Figure 6.
Ellipsoid approximation showing semi-axes relations.
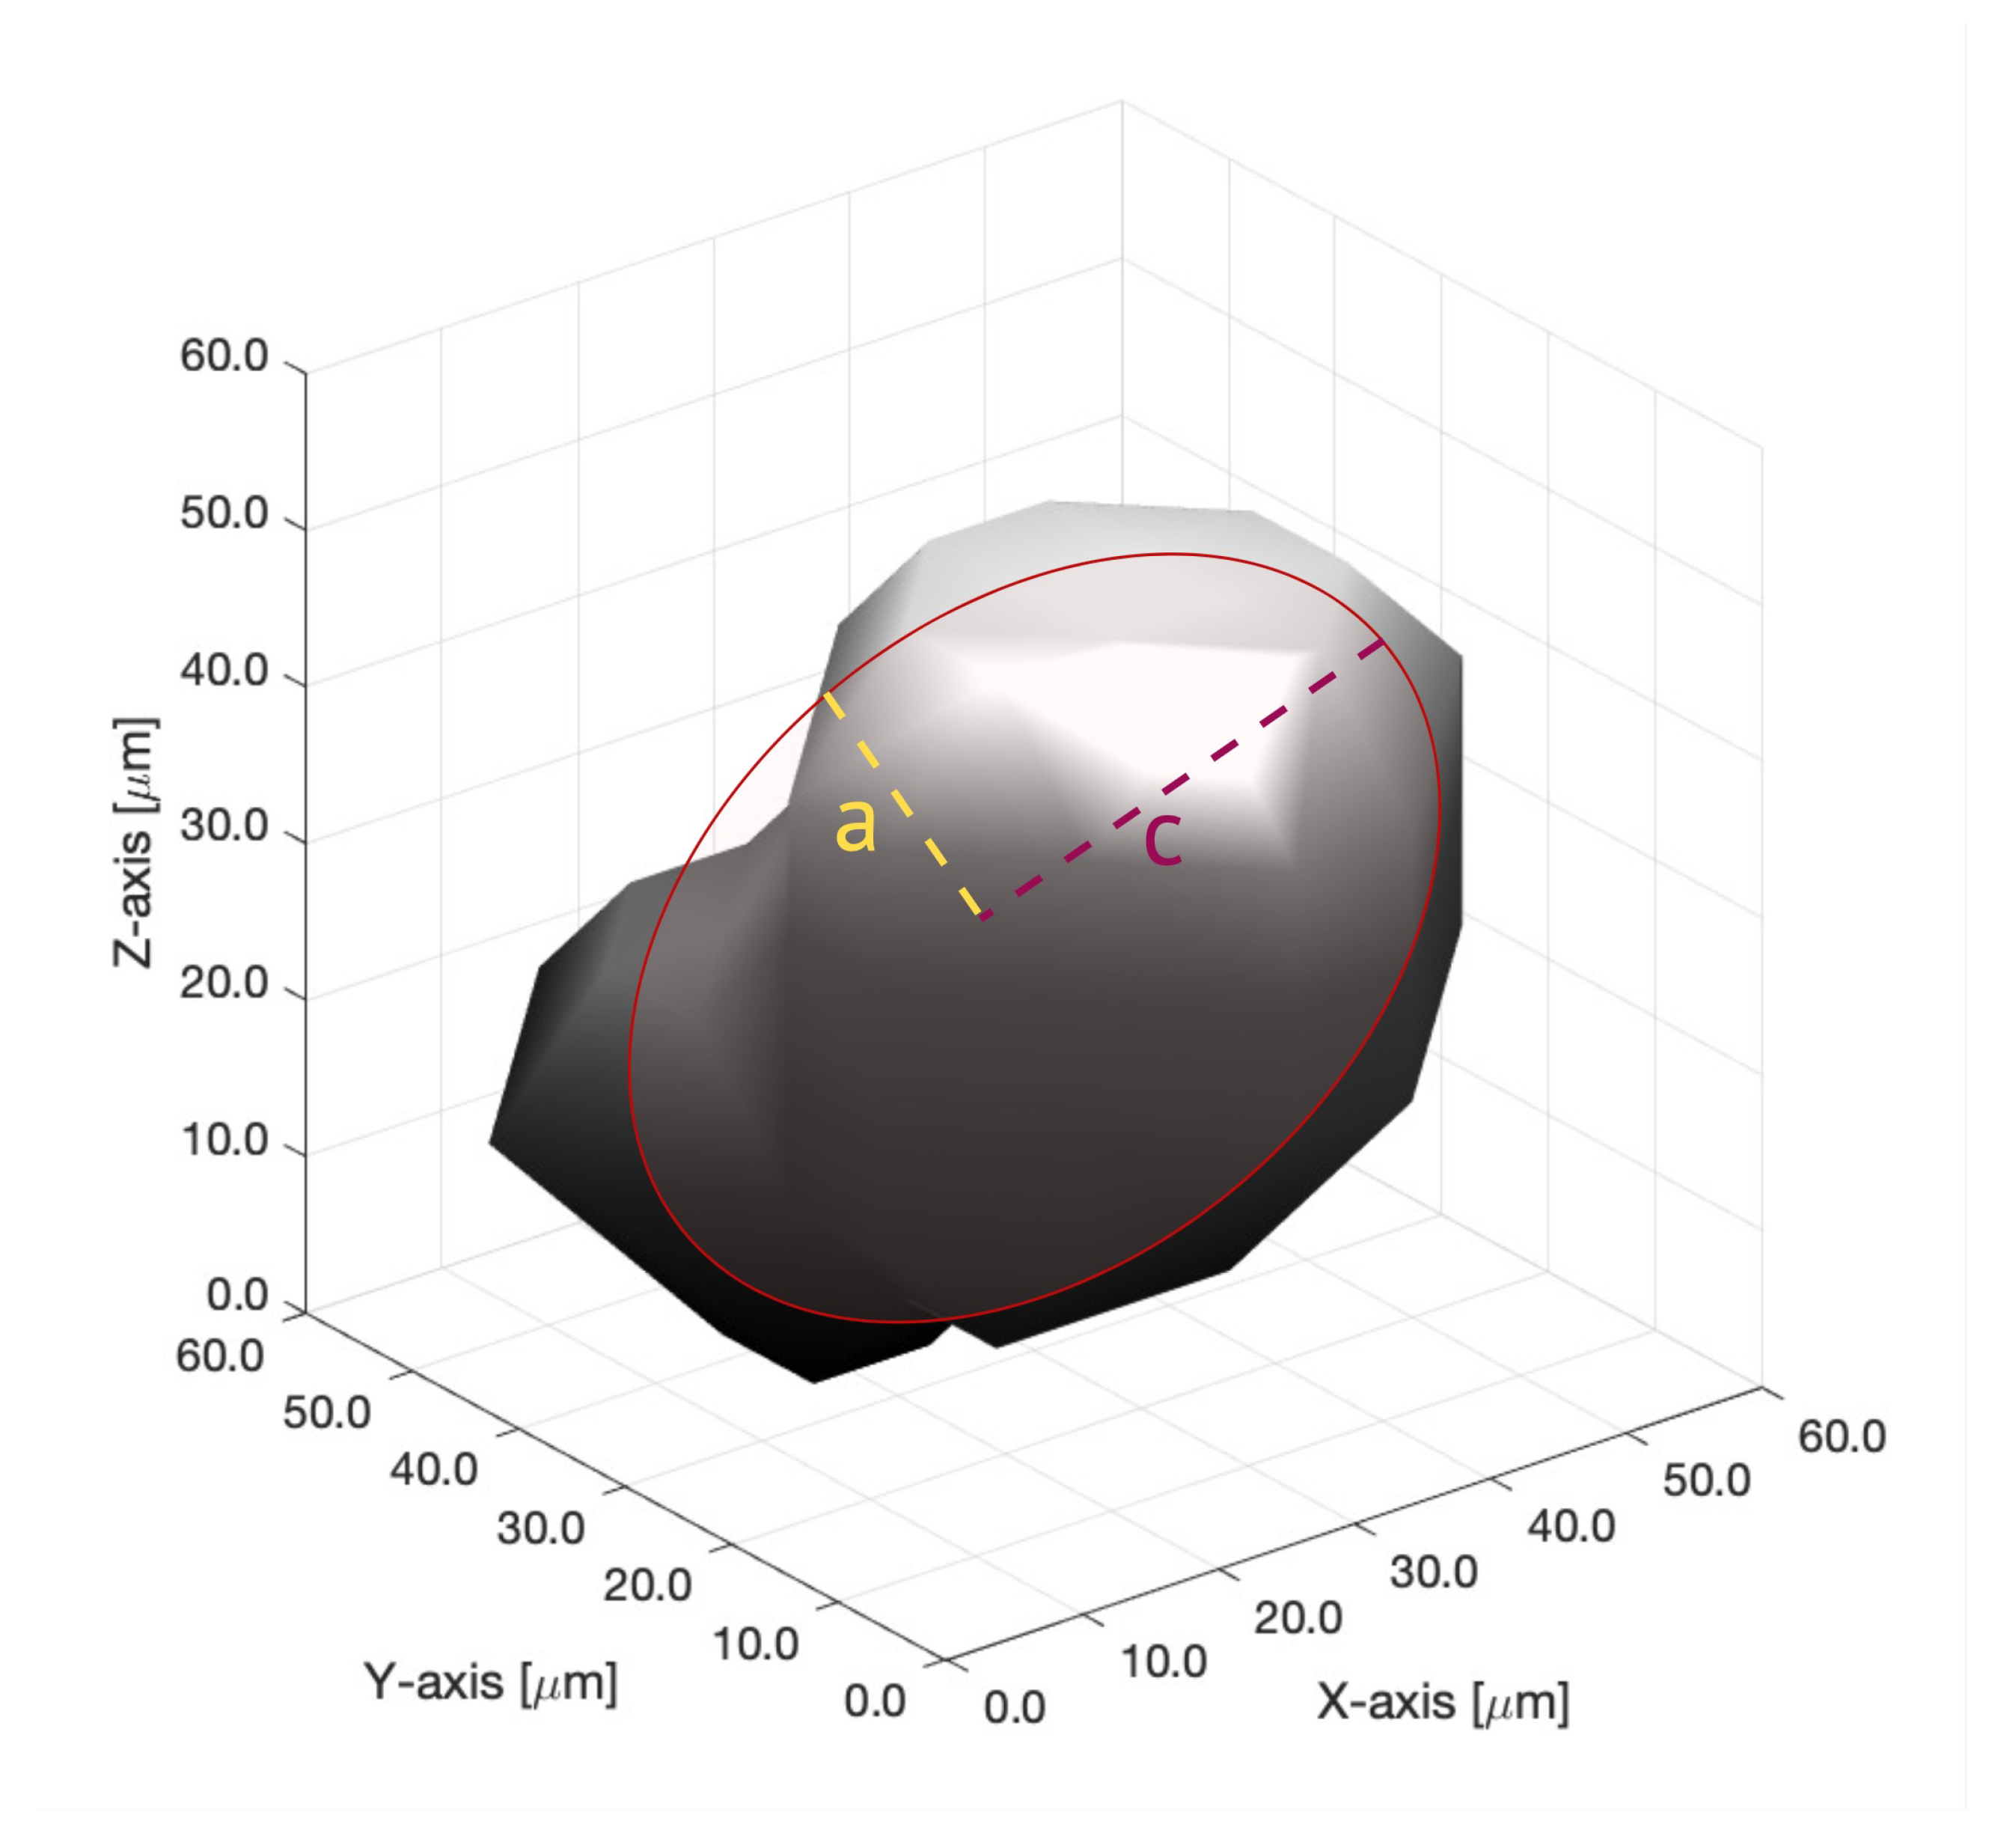
Figure 7.
Side-view micro-CT reconstruction illustrating the regolith particle layering in sample B.
Figure 7.
Side-view micro-CT reconstruction illustrating the regolith particle layering in sample B.
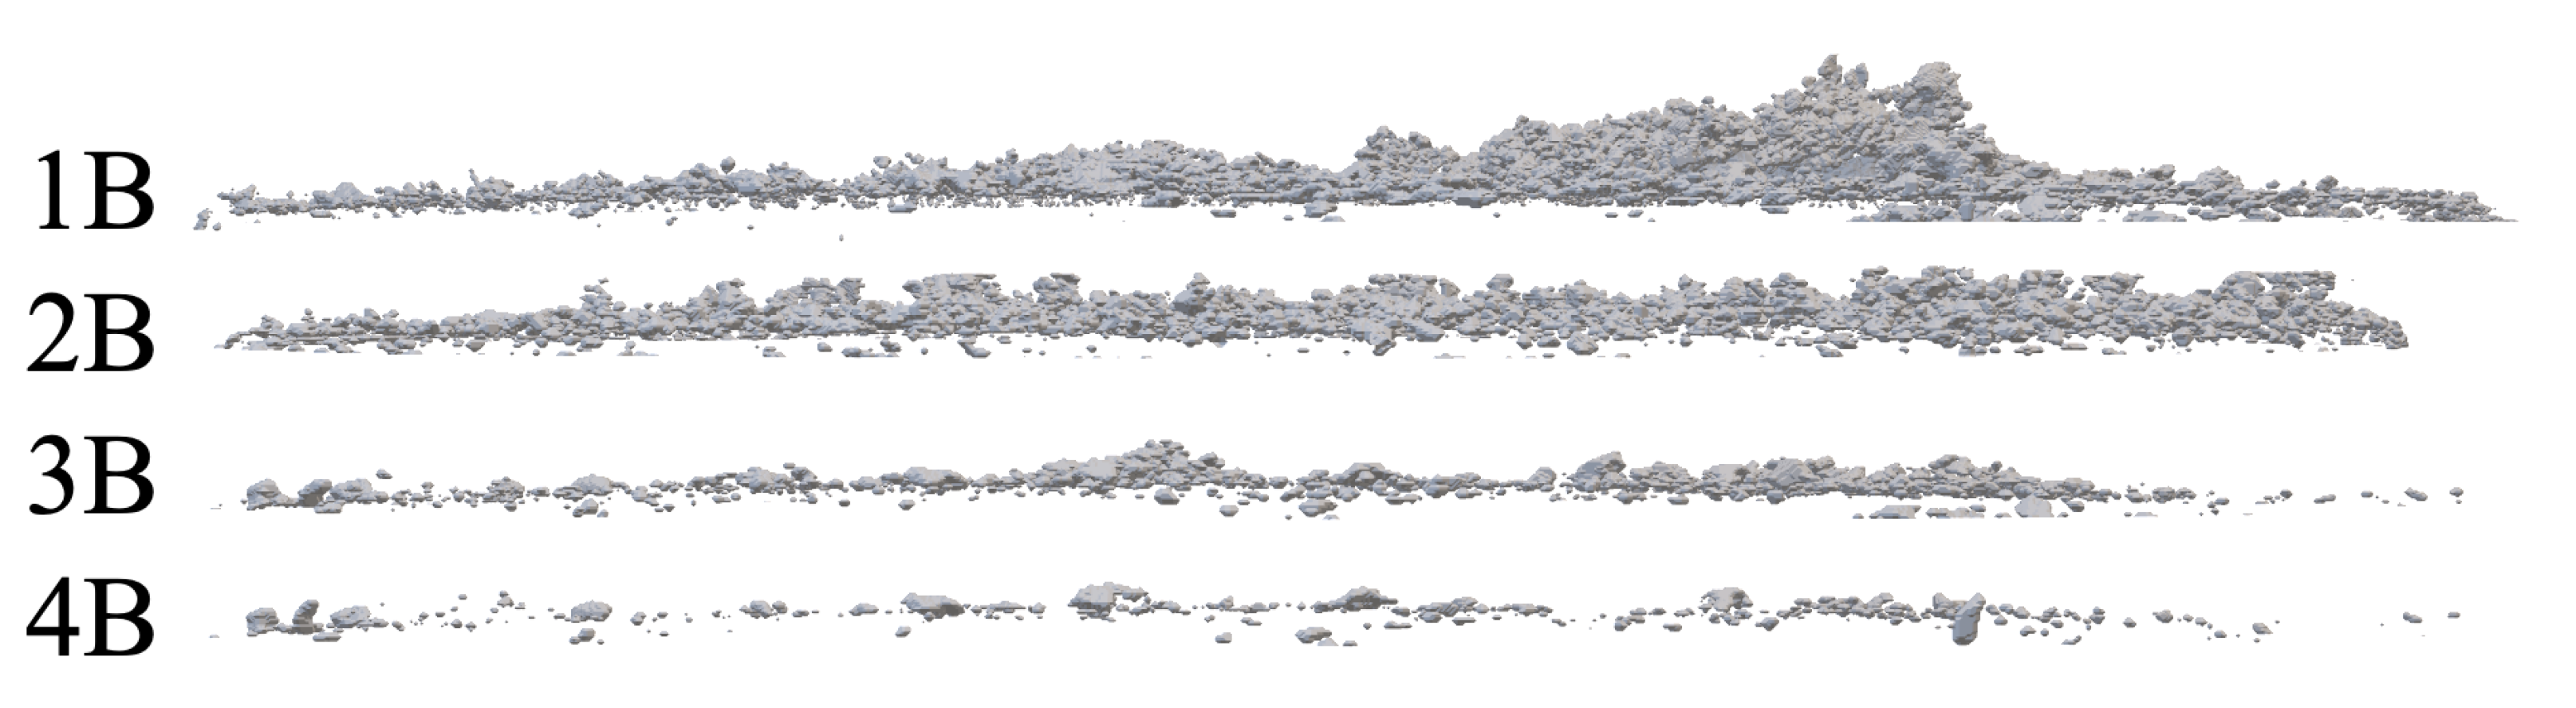

Table 1.
Mineral composition of Lunex technology LX-M100 regolith analog.
| Mineral phase | Volume fraction [vol%] |
|---|---|
| Plagioclase feldspar (Labradorite) | 38.4 |
| Pyroxene (Augite) | 41.9 |
| Olivine (Forsterite) | 18.4 |
| Titanomagnetite | 1.0 |
| Alkali Feldspar | 0.3 |
Table 2.
Scale factors used for pixel-to-micrometer conversion.
| Image | Scale Factor (µm/pixel) |
|---|---|
| 1B | 3.8462 |
| 2B | 3.7031 |
| 3B | 3.8462 |
| 4B | 3.8462 |
| 1C | 3.7736 |
| 2C | 3.6980 |
| 3C | 3.7031 |
Table 3.
Comparison of volume estimation methods for each image. Volumes are in , with the percentage differences from reference volumes indicated below estimated values. The closest estimations (lowest percentage) in each row are underlined.
Table 3.
Comparison of volume estimation methods for each image. Volumes are in , with the percentage differences from reference volumes indicated below estimated values. The closest estimations (lowest percentage) in each row are underlined.
| Image | Particles | Reference Volume | Sphere | Ellipsoid_AR1 | Feret Method | Cylinder | Voxel | Adaptive Ellipsoid |
|---|---|---|---|---|---|---|---|---|
| 1B | 1987 | 78,390,888 |
64,477,518 (17.75%) |
32,238,759 (58.87%) |
102,714,739 (31.03%) |
96,716,277 (23.38%) |
38,686,511 (50.65%) |
32,636,083 (58.37%) |
| 2B | 2784 | 4,790,720 | 11,204,390 (133.88%) |
5,602,195 (16.94%) |
17,333,278 (261.81%) |
16,806,585 (250.82%) |
6,722,634 (40.33%) |
5,688,187 (18.73%) |
| 3B | 709 | 836,632 | 1,665,194 (99.04%) |
832,597 (0.48%) |
2,600,915 (210.88%) |
2,497,791 (198.55%) |
999,117 (19.42%) |
915,138 (9.38%) |
| 4B | 277 | 195,112 | 389,406 (99.58%) |
194,703 (0.21%) |
477,892 (144.93%) |
584,109 (199.37%) |
233,644 (19.75%) |
185,263 (5.05%) |
| 1C | 2806 | 3,395,408 | 8,843,351 (160.45%) |
4,421,675 (30.23%) |
14,421,407 (324.73%) |
13,265,027 (290.68%) |
5,306,011 (56.27%) |
4,883,668 (43.83%) |
| 2C | 116 | 20,328 | 56,541 (178.15%) |
28,270 (39.07%) |
61,914 (204.58%) |
84,812 (317.22%) |
33,925 (66.89%) |
27,513 (35.35%) |
| 3C | 38 | 31,376 |
28,921 (7.82%) |
14,460 (53.91%) |
28,671 (8.62%) |
43,382 (38.27%) |
17,353 (44.69%) |
12,588 (59.88%) |
Disclaimer/Publisher’s Note: The statements, opinions and data contained in all publications are solely those of the individual author(s) and contributor(s) and not of MDPI and/or the editor(s). MDPI and/or the editor(s) disclaim responsibility for any injury to people or property resulting from any ideas, methods, instructions or products referred to in the content. |
© 2025 by the authors. Licensee MDPI, Basel, Switzerland. This article is an open access article distributed under the terms and conditions of the Creative Commons Attribution (CC BY) license (http://creativecommons.org/licenses/by/4.0/).
Copyright: This open access article is published under a Creative Commons CC BY 4.0 license, which permit the free download, distribution, and reuse, provided that the author and preprint are cited in any reuse.


