1. Introduction
In 2023, two different earthquakes with a magnitude of 7.8 Mw and 7.5 Mw took place in Turkey, the epicenter of which was in the province of Kahramanmaraş. The earthquakes were named 'Kahramanmaraş Earthquake' and declared as a Level 3 emergency by the World Health Organization (2023 Kahramanmaraş Earthquakes, 2023). In Turkey, after the Kahramanmaraş Earthquake, 50,783 people lost their lives, approximately 122,000 people were injured, more than 35,000 buildings were destroyed and approximately 50,576 structures were severely damaged (6 February Earthquake with Data, 2023). A state of emergency was declared in approximately 10 different cities of Turkey, a total of 10,911 heavily damaged buildings were identified, and Hatay province recorded most damage after the earthquake.
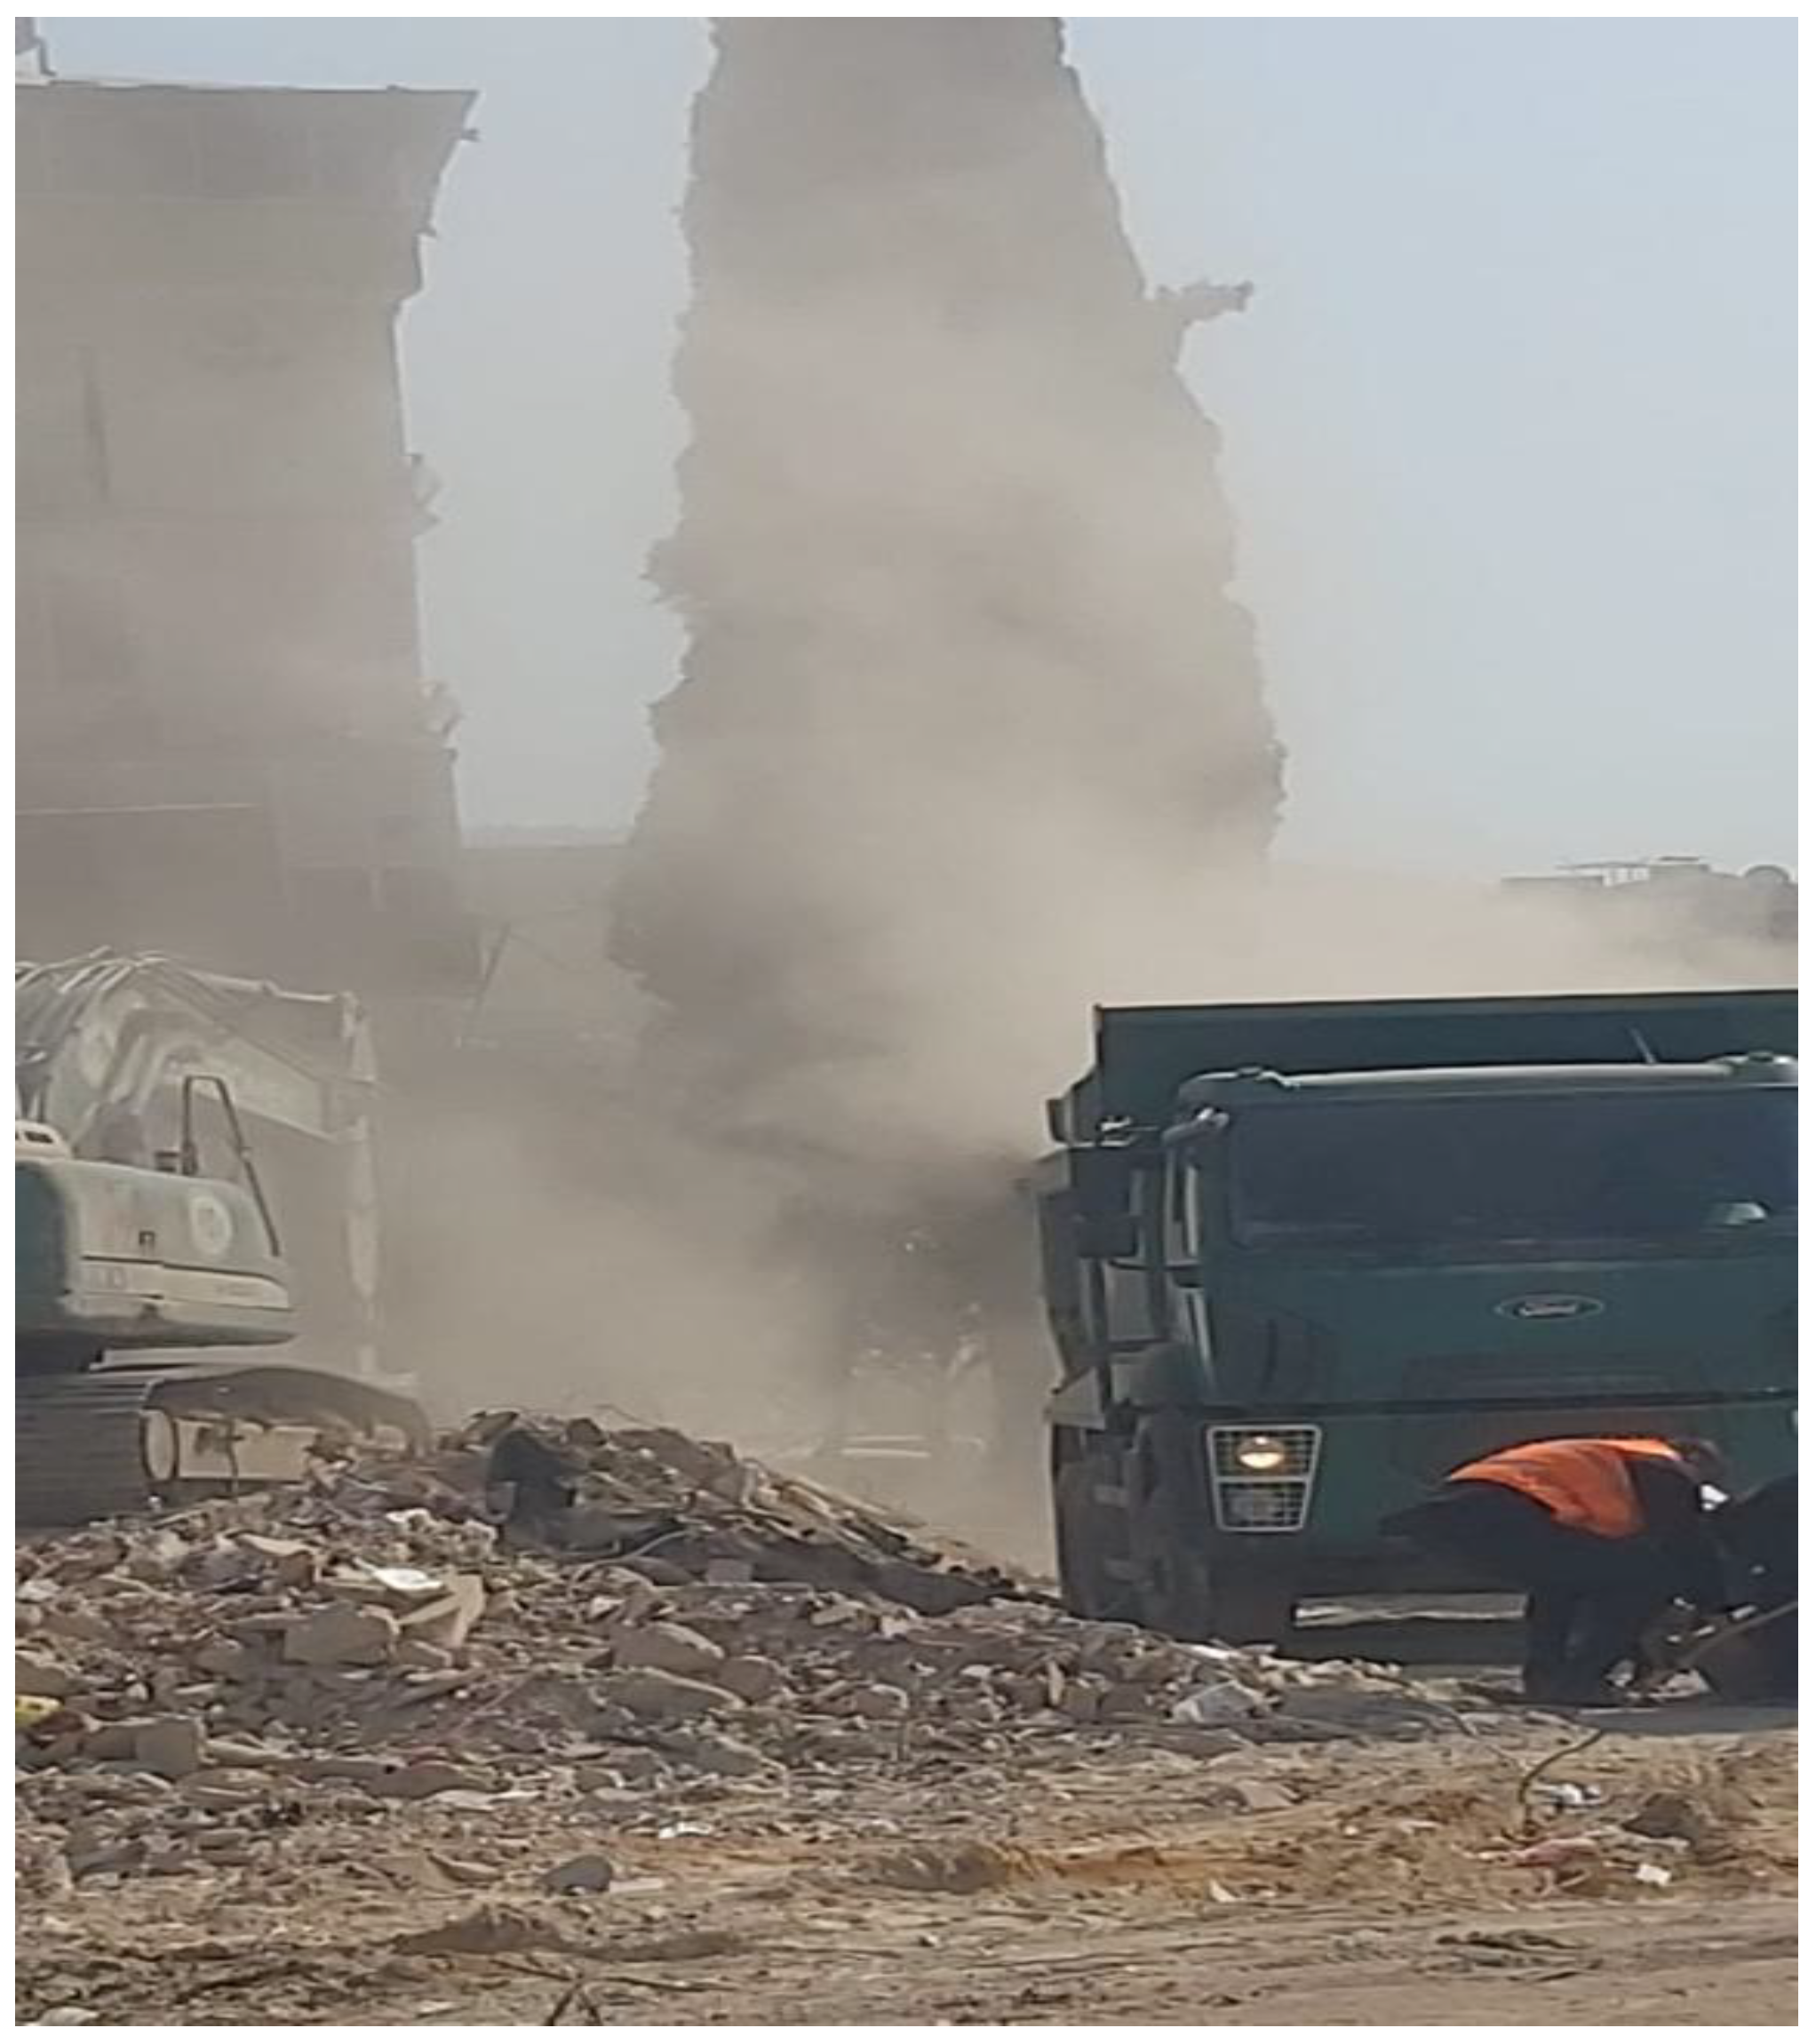
Many negativities were observed in the region’s ecological and environmental balance. The urban waste generated by the simultaneous collapse of buildings due to Kahramanmaraş earthquake caused degradation of flora, and dust clouds caused serious environmental effects such as air and water pollution (Savcı, 2023). While the incorporation of organic and inorganic dust into the air due to the collapse of structures is considered as a direct risk factor; the incorporation of some minerals and chemical dust from excavations into the air during search and rescue operations were evaluated as indirect risk factors. As such, the formation of dust clouds in the region after the Kahramanmaraş earthquake stemmed from two different sources. The first, the simultaneous collapse of a large number of structures; the second, ongoing search and rescue efforts and debris removal. Especially during debris removal, a lot of dust clouds were resulted from the process of the construction equipment breaking the reinforced concrete structures into smaller pieces (
Figure 1). Chemical elements and compounds in dust clouds can cause incurable respiratory diseases such as silicosis, asbestosis, mesothelioma and lung cancer (Dündar and Pala, 2002; Kahraman and Yürüten Özdemir, 2022). Dust clouds that cause silicosis and asbestos-based diseases contain Silicon dioxide (SiO2), Magnesium (Mg), Iron (Fe), Calcium (Ca) (Karabulut, 2021).
As shown in
Figure 1, even in an open area, a lot of dust clouds have formed. However, due to the inhomogeneity of the region, it is not possible to determine whether the content of the dust clouds originated from organic or inorganic sources. For this reason, investigation and observation endeavors in the research area were according to the most critical levels.
Dust clouds are generally composed of chemical elements or compounds that can cause incurable respiratory diseases such as silicosis, asbestosis, mesothelioma and lung cancer (Dündar and Pala, 2002; Kahraman and Yürüten Özdemir, 2022). During the progress of these diseases, the deterioration rate varies according to factors such as the length of time spent in the dusty environment, the particle sizes of the dust, the properties of the substances that cause dust, and whether it is an open or closed environment (Kahraman and Yürüten Özdemir, 2022). Significantly, respiratory diseases will develop faster if inadequate precautions are taken against dust clouds formed in a closed area.
Due to the research area being declared a Level 3 Emergency zone, only the density/mass of the generated dust clouds could be measured. The density of dust clouds was calculated in two different ways: total dust concentration, which represents the total amount of dust present in an open or closed area where an individual is located, and respirable dust concentration, which refers to the amount of dust directly inhaled by an individual. “Total dust is defined as dust where 50% or more of the particles have an aerodynamic diameter below 80–100 µm, including those reaching the trachea and alveoli, and affect the entire respiratory system upon exposure. On the other hand, respirable dust is defined as dust in which 50% or more of the particles have an aerodynamic diameter below 0.1–5 µm and can reach the alveoli when inhaled” (Çevikler, 2009). In short, it can also be described as the calculation of the mass of all airborne particles that remain suspended in the air when inhaled through the mouth and nose.
Following the aforementioned devastating earthquakes, the Scientific and Technological Research Council of Türkiye (TÜBİTAK) launched the "1002C - Emergency Support Program for Field Studies Focused on Natural Disasters" to facilitate scientific research in the affected areas. With the approval of our application, field research was conducted (TÜBİTAK, 2023), and the necessary research permits, and funding were provided by TÜBİTAK. Hatay was selected as the study area since it experienced the highest number of casualties and the most extensive structural damage among the affected regions. Measurements were taken between February 17, 2023, and February 21, 2023 while search and rescue operations were still ongoing. A five-member research team actively measured dust concentration levels over five days. To calculate the dust concentration, emergency response personnel and research teams operating in the area were equipped with dust measurement devices, and the collected data were analyzed using the gravimetric determination method outlined in "Methods for the Determination of Hazardous Substances (MDHS-14/13)". The primary finding of this study is the mass of dust clouds generated due to the collapse of buildings following the earthquake. The secondary findings concern the necessity of raising awareness among individuals affected by the earthquake and emergency response teams regarding this issue.
2. Material and Method
2.1. Materials
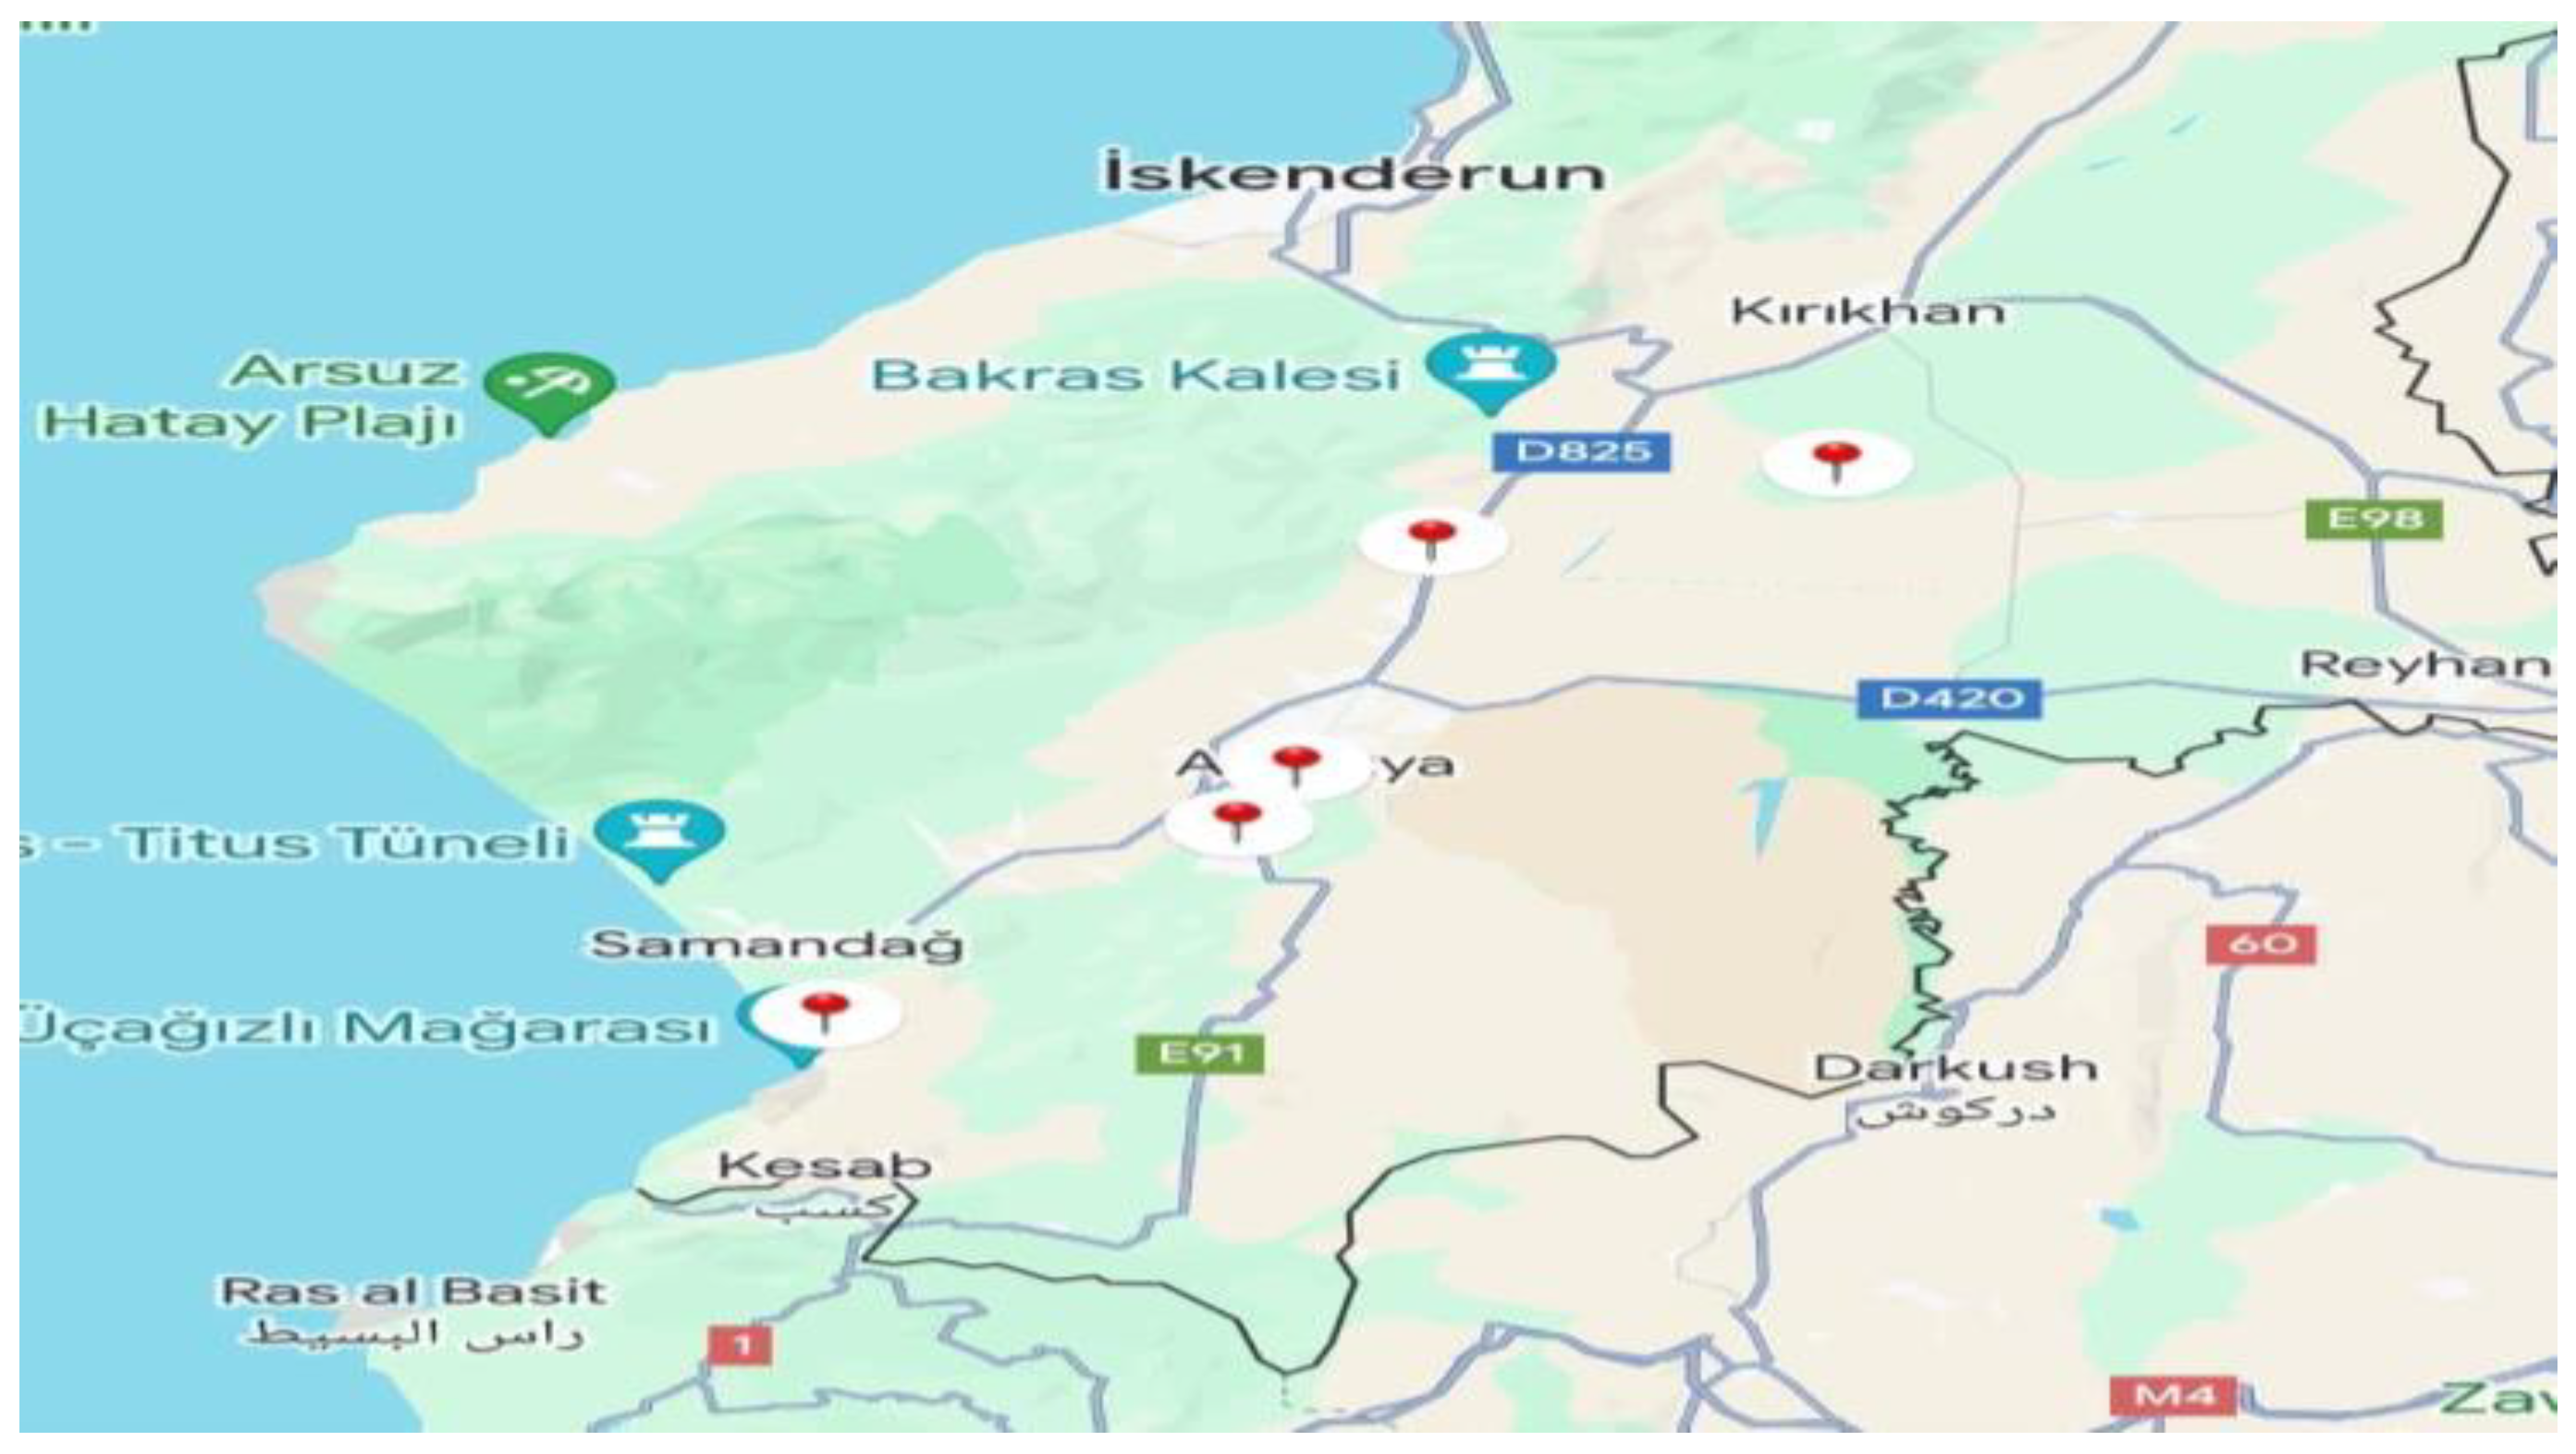
After determining the appropriate locations for the measurements, device installations were carried out to collect samples. The locations where measurements were taken in 17.02.2023 and 21.02.2023 are shown on
Figure 2 and at the coordinates indicated in
Table 1 on the times given.
Filters: High-performance Micro-porous Cellulose Ester (MCE) filters, which are widely used to preserve the characteristics of samples during measurements, were preferred. Before going to the research site, all filters were stabilized under controlled conditions (20°C ± 1°C temperature and 50% ± 5% relative humidity) for 24 hours at the Istanbul Metropolitan Municipality, Occupational Health and Safety Branch Directorate, Occupational Hygiene Measurement Laboratory. After stabilization, they were weighed on an analytical balance, and their weights were recorded.
Precision Balance: A 5-digit analytical balance with an accuracy of 0.001 mg was used to weigh dust masses.
Use of Cyclone Sampler Head: Appropriate personal sampling devices were employed to collect respirable and total dust concentrations. A cyclone sampler head was utilized for respirable concentration measurement, while the Institute of Occupational Medicine (IOM) head was preferred for total dust assessment. The cyclone sampler head functions as a total dust measurement head designed to operate at high flow rates and enables the measurement of a broader range of particle size distribution in the environment (Zefon, 2024).
IOM (Institute of Occupational Medicine) Sampler Head: Designed for the measurement of fine dust particles, it is suitable for use at low flow rates. Specifically, it provides high performance in the measurement of respirable dust particles (Novel, 2024).
2.3. Method
2.3.1. Calculation of the Mass of Dust Concentration
In the calculation of the mass of respirable and total dust concentration, the Gravimetric Determination Method was used, referencing the HSE MDHS 14/3 standard. This measurement method is generally used to determine the amount of dust that individuals get exposed to, assess the potential health effects of dust on individuals, and implement protective measures based on this assessment (Health and Safety Executive, 2000). The values obtained from the measurements were evaluated according to HSE standards, which require a precision balance with a resolution of 0.01 mg or higher, a pump providing an accuracy of 0.1 L/min, appropriate filters, a cyclone sampler head, and at least three blank samples. The final calculations were conducted using the collected data (Eq.1) to determine the time-weighted average (TWA-8 hours) (Franque Mirembo, Swanepoel and Rees, 2013; CDC, 2021; Gökcan et al., 2022).
C: Dust concentration; Wf: Post-sampling weight of the sample filter (mg); Wi: Pre-sampling weight of the sample filter (mg); Bf: Final weight of the blank sample; Bi: Initial weight of the blank sample; V: Volumetric air flow rate (L/min); t: Sampling duration (min).
Before starting dust measurements, the sampler pumps' flow rates were checked using a flow calibrator. To establish the equation given in (Eq.1), the pre- and post-sampling filter weights, measurement duration, and flow rates were calculated. The flow rate required for sampling was set between 2.0 L/min for total dust and 1.7 L/min for respirable dust. This flow rate was maintained consistently throughout the measurement process and periodically verified for accuracy.
As the research site was an open area, all parameters that could potentially influence the measurement values (air temperature, pressure, humidity, and wind speed etc.) were considered and evaluated by the day. Since attempting a correlation analysis on the measurement results would lead to erroneous outcomes, the collected sample data were analyzed in a laboratory setting. This approach ensured accurate calculation of the total dust concentration quantities.
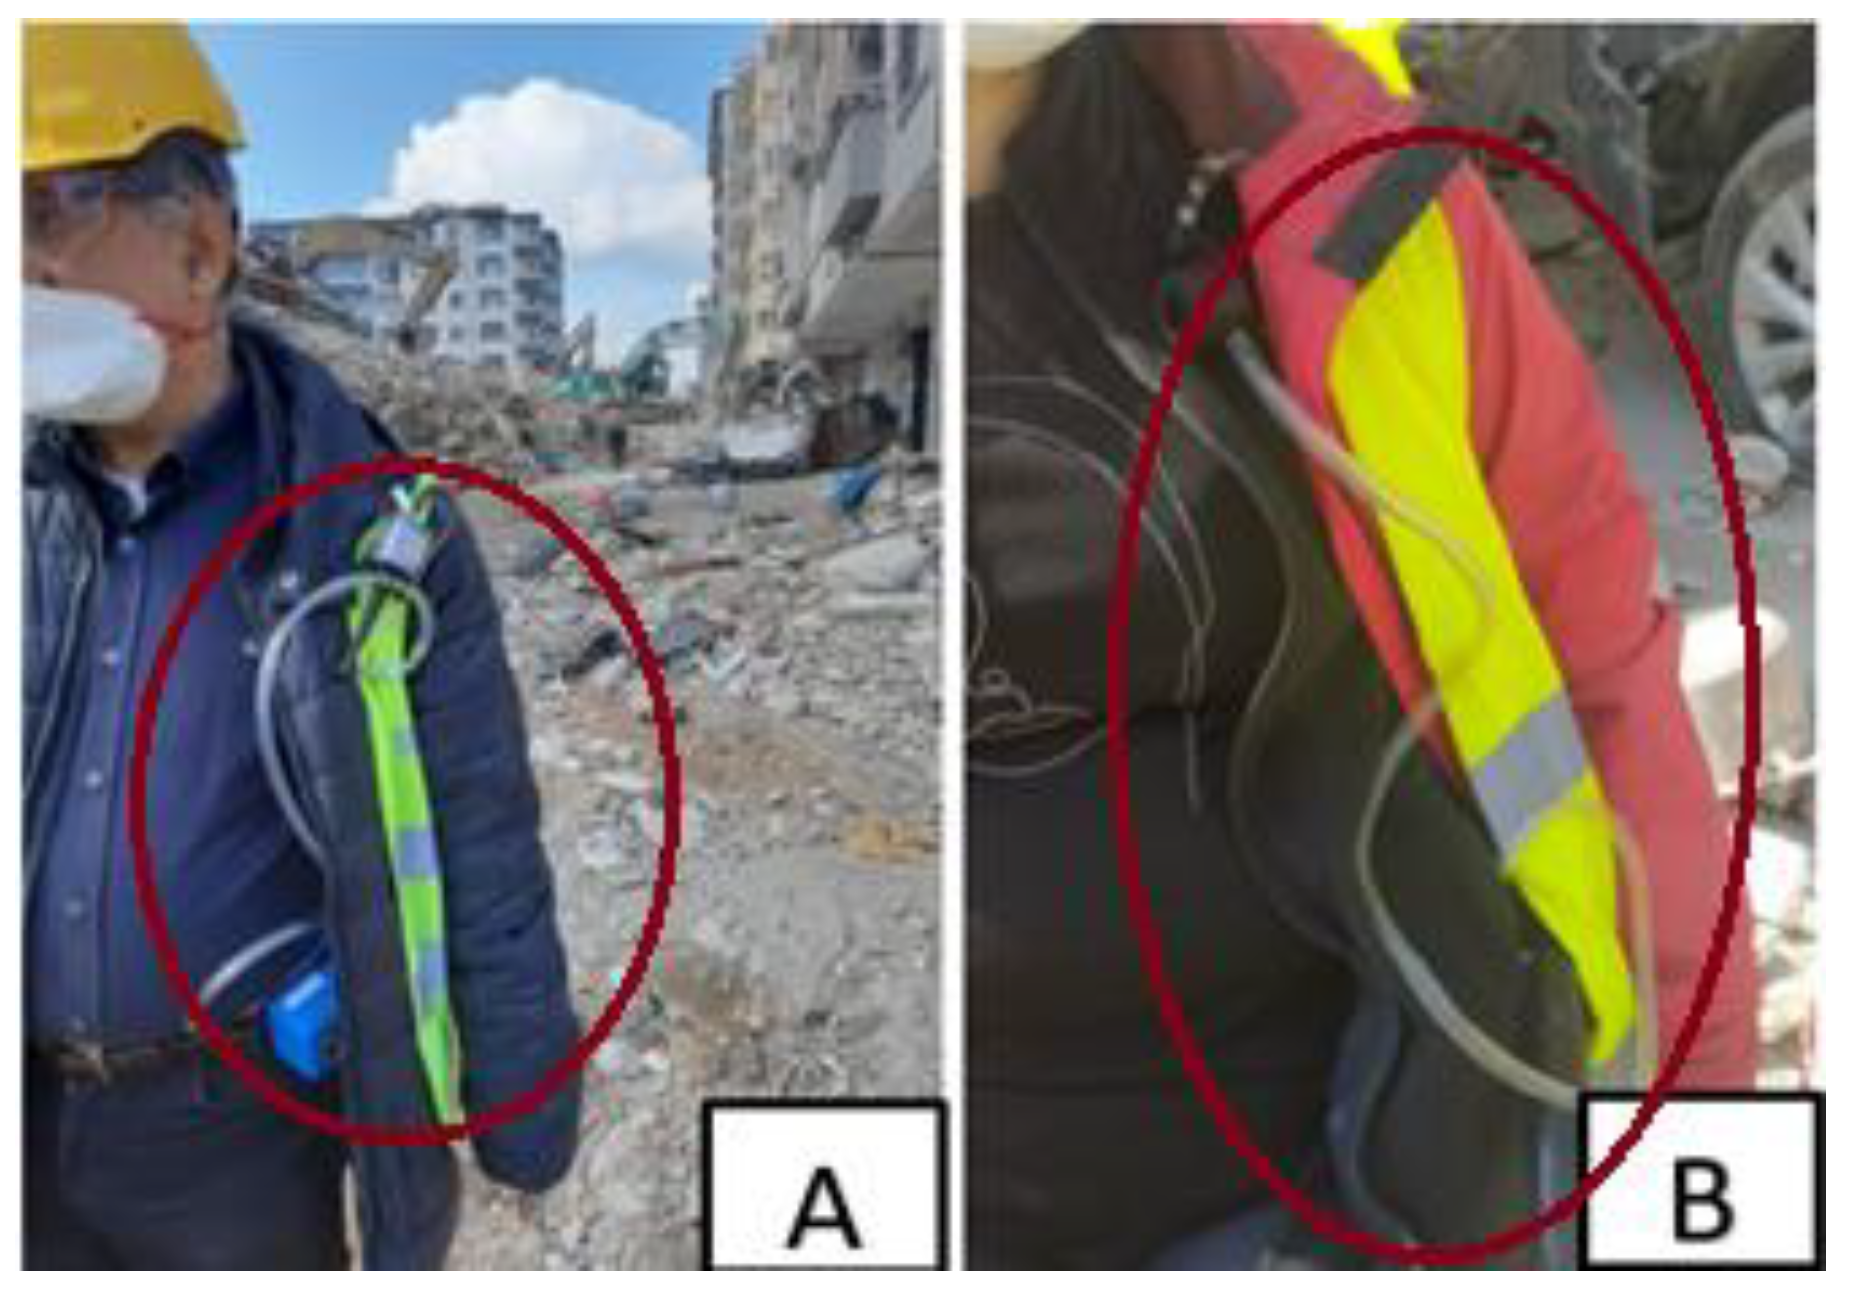
Dust measurement devices were attached to the search and rescue teams at the area for a duration of 1 to 3 hours, following the necessary permissions. Great care was taken to ensure that the measurement process did not interfere with post-disaster search and rescue operations. In cases where it was not possible to attach the measurement device to the search and rescue teams, the devices were worn by members of the research team instead. Additionally, efforts were made to remain near the dust-generating sources to ensure accuracy (
Figure 3).
The measurement devices were worn by individuals for a duration ranging from a minimum of 1 hour to a maximum of 3 hours per day over a period of 5 days. Each measurement was conducted independently at different locations.
Stabilization and Weighing of Samples: After the measurements were concluded, the filters were carefully removed from the sampler heads and transported to the laboratory in sealed containers to prevent contamination. Before the final weighing process, they were re-stabilized for 24 hours. At the end of the stabilization period, the filters were weighed again.
On the third day of the study, to verify the accuracy of the measurements, tests were conducted in the Chemistry Laboratory of Osmaniye Korkut Ata University, which was the closest available facility to the earthquake-affected area. Following these tests, an interim evaluation report was prepared.
2.3.2. Determination of the Morphological Characteristics of Dust Concentrations
To obtain information on the morphological characteristics of the dust samples collected from the earthquake-affected area between February 17 and February 21, 2023, SEM (Scanning Electron Microscopy) and EDX (Energy Dispersive X-ray Spectroscopy) characterization methods were applied.
Scanning Electron Microscope (SEM) is a type of electron microscope that enables high-resolution imaging by magnifying materials at the micro- or nanoscale to obtain detailed images of their surfaces (Akhtar et al., 2018). Unlike optical microscopes, electron microscopes use an electron beam instead of light to scan the sample. The interaction between the electron beam and the sample generates secondary electrons, which are collected by a detector to produce highly detailed images. This process allows for an in-depth examination of the structure and composition of material surfaces (Akhtar et al., 2018).
Energy Dispersive X-ray Spectroscopy (EDX) is an analytical technique used to determine the elemental composition of a material by analyzing the energy levels of emitted X-rays. Since each element has a unique atomic structure, it emits X-rays at specific energy levels. EDX detects and analyzes these energy emissions, helping to identify the elements present in the material (Russ, 2013). Additionally, EDX is used to map the distribution of specific elements across a material’s surface and assess the homogeneity of its composition (Russ, 2013). In summary, this technique aids in analyzing the elemental composition of a given sample.
The ability to perform SEM imaging and EDX analysis simultaneously allows for the concurrent acquisition of both structural and chemical information about the sample (Wang et al., 2008).
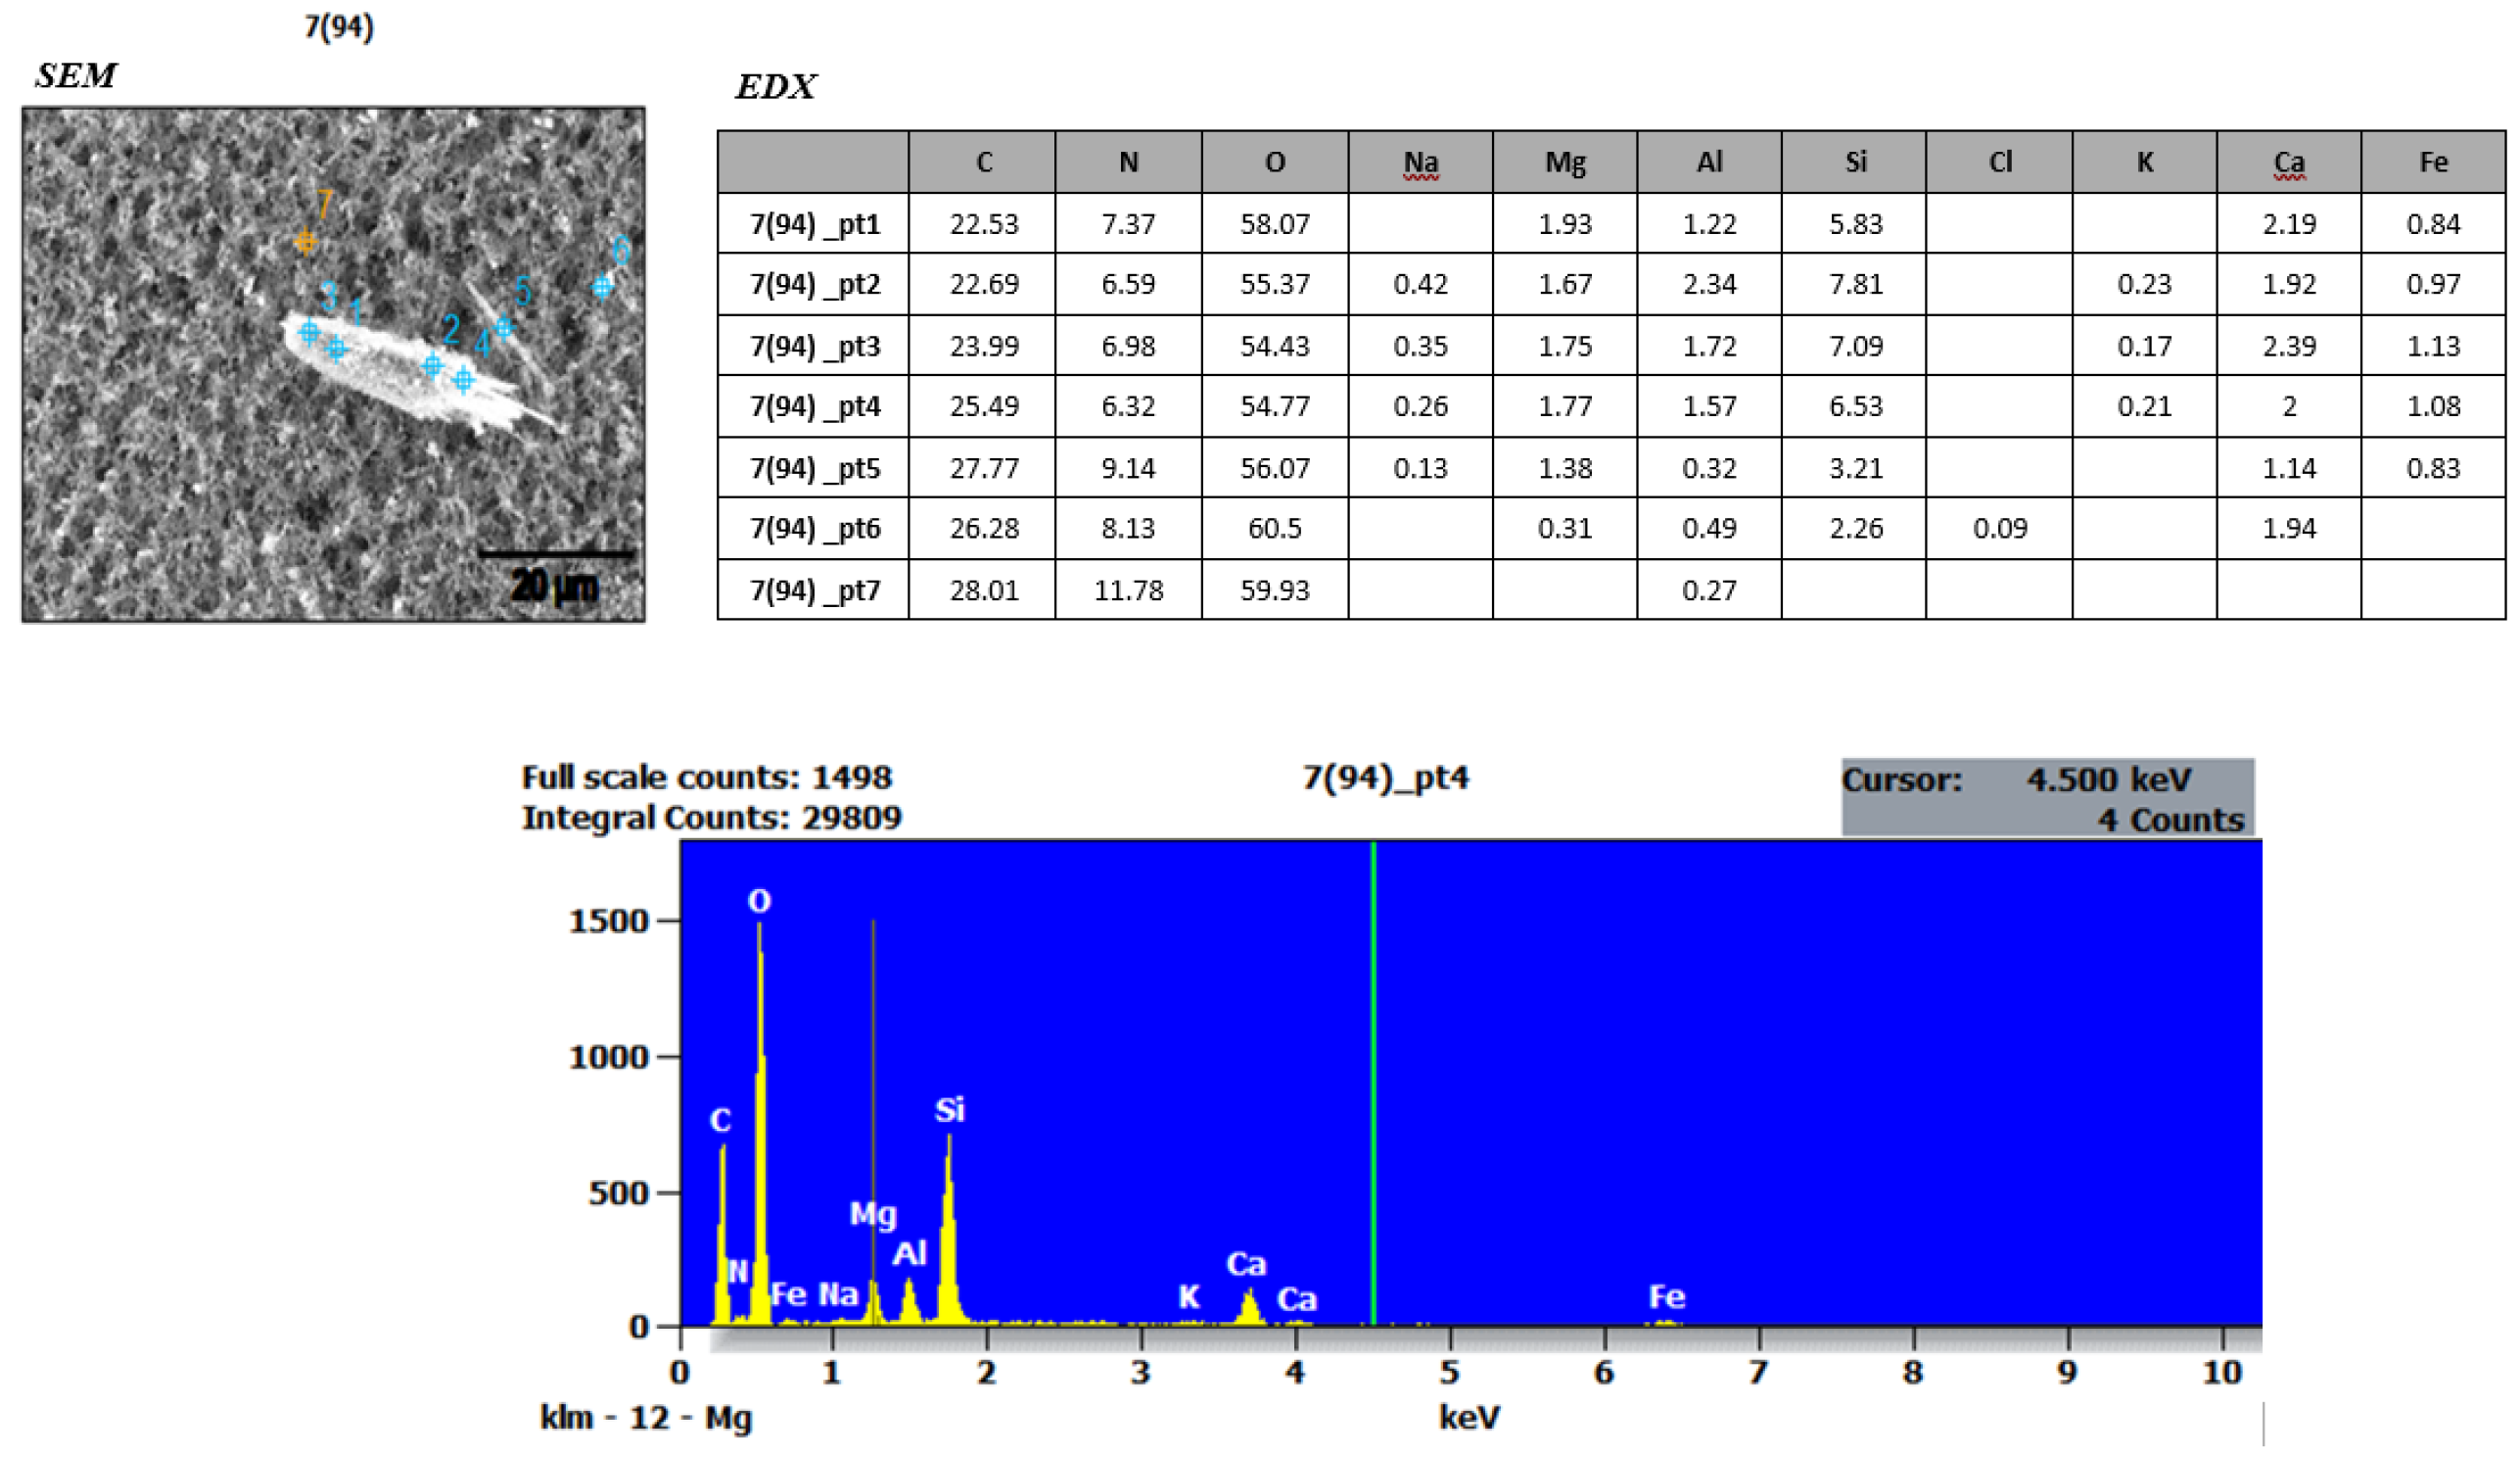
The health effects of dust vary depending on whether it is of inorganic or organic origin (Aslan and Aybek, 2016). Therefore, in this study investigating the density of dust clouds formed in the earthquake-affected area, SEM and EDX methods were applied to the collected dust samples to obtain information on both their structural and chemical composition. The SEM method was used to determine whether the samples had a fibrous structure, while the EDX method aimed to identify the presence of chemical elements such as Si, Mg, Fe, Ca, O, Na, and Al. Additionally, due to the diversity of collapsed structures in the region, the study sought to assess the potential presence of asbestos within the dust sources.
3. Findings
Between February 17 and February 21, 2023, the density of dust clouds generated during search and rescue as well as debris removal operations among collapsed structures in Hatay, Turkey, was measured. The collected data were analyzed to assess the impact of these dust clouds on ambient air quality and to calculate the "respirable dust concentration," which directly affects the health of individuals present in the research area. Additionally, SEM and EDX methods were employed to determine the structural and chemical composition of the inhaled dust clouds.
3.1. Dust Concentration Values
Airborne dust is transported by wind flow, temperature, and atmospheric humidity levels (Schepanski, 2018). A study conducted by Wang et al. (2005) on the formation of dust storms in Northeast Asia emphasized the impact of air pressure on dust dispersion. As particle size decreases, the suspension time of dust in the air increases, allowing it to be transported over longer distances (Schepanski, 2018). Therefore, meteorological factors influencing dust dispersion and measurement results, including air temperature, humidity, wind speed, and pressure, were regularly measured and incorporated into the calculations. The recorded values for wind speed, humidity, temperature, and pressure during the study period are presented in
Table 2.
In the designated disaster area, dust clouds formed among the debris piles during search and rescue operations due to the collapse of structures. These dust clouds, directly inhaled by individuals in the region and potentially affecting their health, were quantified as "respirable dust concentration" values. The calculated values are presented in
Table 3.
Using personal measurement devices attached to personnel working in the disaster area or members of the research team (
Figure 3), dust samples were collected. Considering the influence of the parameters provided in
Table 2, the minimum measured dust concentration was determined as 1.24 mg/m³, the maximum as 97.81 mg/m³, and the five-day average measurement as 30.84 mg/m³.
Due to the collapse of structures following the earthquake, dust clouds generated during search and rescue operations affected air quality and posed potential health risks to individuals in the region, including survivors, aid workers, and emergency response teams, even if they were not in direct proximity to the dust source. These dust clouds were quantified as "total dust concentration" values, which are presented in
Table 4.
Using devices placed at different locations within the disaster area, airborne dust particle samples were collected. Considering the influence of the parameters provided in
Table 2, the minimum measured dust concentration was determined as 25.48 mg/m³, the maximum as 43.84 mg/m³, and the five-day average measurement as 33.66 mg/m³. It is clearly that total dust concentration values will cause a decrease in air quality.
On the final day of the study (Day 5), on February 20, 2023, a 6.4 Mw magnitude aftershock occurred in Hatay (Earthquake Department Presidency, 2023). Due to ongoing aftershocks and the crisis caused by emergency interventions in the disaster area, a suitable environment for setting up the total dust concentration measurement device could not be found, and thus, no measurements were taken on the last day.
In Turkey, the "Dust Control Regulation" specifies the permissible limits for respirable dust concentrations that individuals may be directly exposed to through inhalation, as well as the total dust concentration levels that can be encountered in a given environment (
Table 5). Any values exceeding these limits are considered hazardous (Dust Control Regulation, 2013).
Various organizations, including the World Health Organization (WHO), the International Labour Organization (ILO), the Occupational Safety and Health Administration (OSHA), the National Institute for Occupational Safety and Health (NIOSH), and the European Union (EU), have established specific limit values for dust exposure. During the study, the dust particles accumulated on the filters of the measurement devices were found to be approximately 0.1–1 µm in size. Therefore, the limit values presented in
Table 6 apply to particulate matter (PM) with sizes of 2.5 µm or smaller.
3.2. SEM and EDX Results
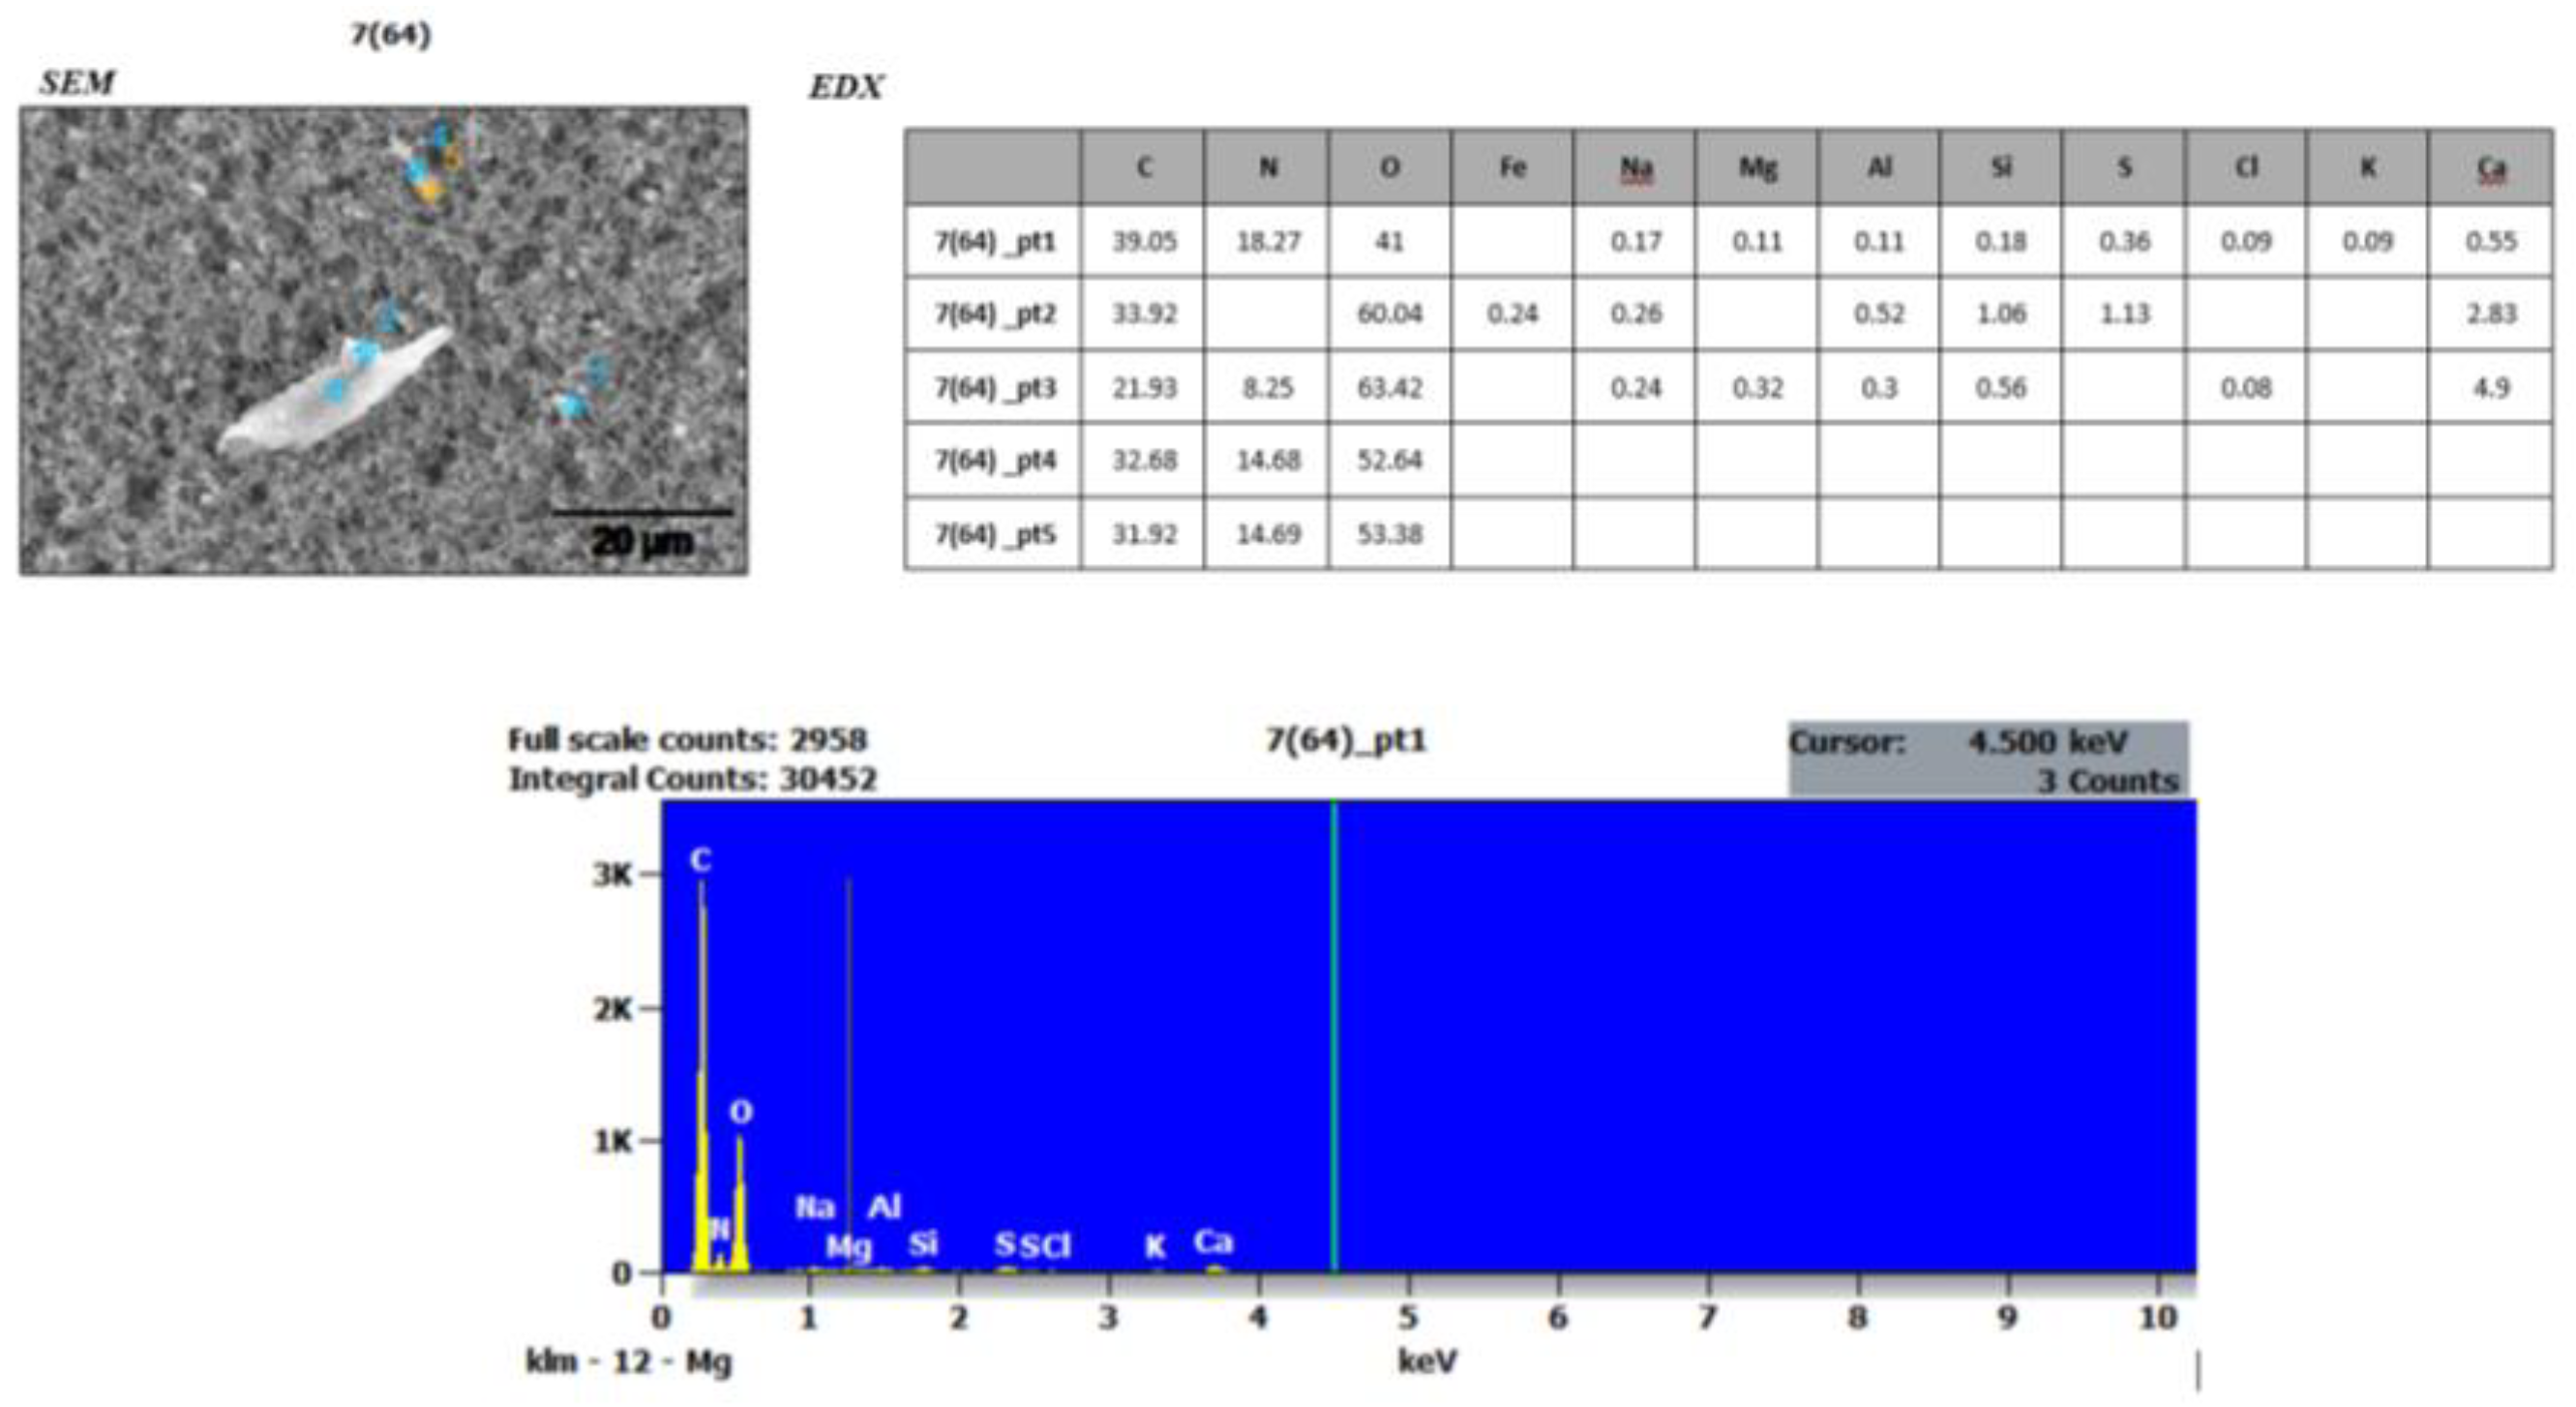
To determine the morphological characteristics of the dust samples collected from the research site, SEM and EDX analyses were conducted at the BİLTAM Laboratory of Istanbul Medeniyet University. Approximately 20 dust samples were examined using SEM and EDX techniques. Since the filters themselves contained Si, Mg, and Fe elements, the focus was placed on two dust samples (
Figure 4 and
Figure 5) that exhibited significantly different Si, Mg, and Fe element values.
Upon examining the SEM images presented in
Figure 4 and
Figure 5, it is observed that cubic and irregularly shaped, non-homogeneous particles are distributed across the surface of the filters. This non-homogeneous distribution may be attributed to an insufficient accumulation time for the dust particles to adhere to the filter layer or the presence of particles of varying sizes. Additionally, an increase in moisture balance influences aggregate formation, and as concentration increases, particle size and accumulation also increase.
4. Discussion
The five-day average respirable dust concentration in the research area was calculated as 30.84 mg/m³, while the average total dust concentration was 33.66 mg/m³. When compared to regulatory limit values, the respirable dust concentration in Turkey exceeds the national threshold by approximately 6.2 times, and the total dust concentration surpasses the national limit by 2.24 times. When evaluated against international legal limits, the respirable dust concentration is 3.08 times higher than the ILO standard, while the total dust concentration exceeds the OSHA/NIOSH and EU limits by 2.24 times. These findings indicate that the density of dust clouds formed in the earthquake-affected region significantly exceeds both national and international regulatory limits, highlighting the severity of the situation. Scientific studies on the health effects of dust exposure suggest that even if the dust concentrations are of organic origin, they can still cause allergic reactions, respiratory diseases, byssinosis, microbial and fungal infections, or viral and bacterial illnesses (Cherrie & Howie, 2003; Ray & Finkelman, 2005; NIOSH, 2009). If the dust is of fibrogenic origin, it can lead to pneumoconiosis, such as silicosis and asbestosis. Additionally, exposure to toxic dust can result in chronic or acute toxic effects on various organs, including the nervous system, liver, kidneys, gastrointestinal tract, and respiratory organs (Ediz et al., 2001).
In the construction industry, the technical properties and cost advantages of asbestos-containing cement and concrete pipes, concrete poles, corrugated sheets (eternit), and other asbestos cement products, such as drainage channels, have led to their widespread use (Demir et al., 2018). Scientific studies on the dust sources generated by the collapsed buildings in the research area indicate that cement materials used in construction contain Cr VI (Hexavalent Chromium), which is harmful to human health. According to the European Parliament’s 2003/53/EC directive, the chromium content in cement should not exceed 2 ppm due to its health risks (Güngörmüş, 2015). Therefore, minimizing exposure to cement-based dust concentrations and reducing respirable dust levels is crucial (Özkan & Yıldız, 2022).
Ali (2023) conducted a study on the relationship between dust exposure and human health. The findings revealed that the composition and concentration of inhaled dust significantly increase the risk of diseases and are a primary cause of severe health issues, including skin, eye, heart, stomach, and respiratory diseases. Additionally, the chemical components within dust clouds may contribute to cancer development, emphasizing the importance of controlling dust exposure.
The SEM and EDX analysis results of dust samples collected from the research area revealed the presence of fibrous structures and elemental findings associated with asbestos minerals (
Figure 4 and
Figure 5). Additionally, studies support that the research area's geological location falls within regions identified in Turkey’s Asbestos Map. Atabey (2015) conducted a study titled "Turkey Asbestos Map", which identified chrysotile asbestos in Aladağ (Adana), asbestos deposits and occurrences in Eğil, Çüngüş, and Maden (Diyarbakır), chrysotile asbestos in Nurdağı (Gaziantep), asbestos reserves in Antakya (Hatay) and asbestos veins in Yayladağı (Hatay), and chrysotile asbestos in Afşin (Kahramanmaraş). Due to the simultaneous and uncontrolled collapse of multiple structures and active tectonic movements caused by the earthquake, the potential presence of asbestos within the dust concentrations is particularly concerning. The primary exposure pathway for asbestos is inhalation, where the fibers adhere to the lungs over time (IARC, 2012). Unlike other airborne pollutants, asbestos exposure does not diminish over time once inhaled. The most severe health condition linked to asbestos inhalation is mesothelioma, a cancer of the lung and abdominal linings, which is fatal without early diagnosis and treatment (Asbestos, 2023). In addition to mesothelioma, asbestos exposure can lead to asbestosis, parenchymal lung diseases, pleural reactions, and tumors affecting organs such as the kidneys (Asbestos, 2023).
The small particle size of the dust clouds allows them to be transported by wind, leading to potential environmental impacts. If dust concentrations contain chemicals such as salt and herbicides, they can facilitate the spread of pathogens like bacteria and fungi. Additionally, if the dust contains elements such as iron, phosphorus, or nitrates and enters nearby rivers, streams, or seas, it can contribute to algal growth (Griffin, 2007; Nazari et al., 2016). The Asi River, which flows through Hatay, originates in Lebanon and empties into the Mediterranean. Given the complex and diverse composition of the dust clouds generated by the collapsed debris after the earthquake, pollution-related algal blooms may develop in the river over time.
Scientific studies on the effects of earthquakes indicate that a study conducted by Dündar and Pala (2002) after the 1999 Gölcük earthquake remeasured the levels of heavy metals in the same region one year later for comparison. Measurement results from the Adapazarı region, assessing the levels of heavy metals caused by the earthquake, revealed that even one year after the natural disaster, the concentrations of nickel (Ni), chromium (Cr), cadmium (Cd), lead (Pb), and copper (Cu) in the environment remained very close to the lower limit values.
When scientific studies and obtained findings are compared, it becomes evident that natural disasters with destructive impacts, such as earthquakes, have significant environmental, chemical, and health-related effects, emphasizing the importance of these factors.
5. Conclusion
In general, direct exposure to dust or dust clouds has negative effects on human health. Specifically, the amount of dust concentration, its chemical composition, and the duration of exposure can lead to temporary or permanent diseases. To prevent the development of these health issues, legal limitations on dust exposure have been established both in Turkey and globally. It is well known that exceeding these threshold values can cause respiratory diseases and necessitates serious preventive measures (ILO, 1997; Dust Control Regulation, 2013; WHO, 2021; EU, 2022; OSHA, 2023).
By conducting this study in the open-air earthquake-affected area, measurements were taken to assess the level of dust cloud exposure for everyone present in the region. According to the measurement results obtained through the gravimetric analysis method, the dust concentrations were found to be at levels that could negatively impact the health of individuals in the field, including search and rescue teams, first aid personnel, disaster coordination officials, military personnel, security guards, and earthquake survivors.
An analysis of
Table 3 and
Table 4 indicates that on the first day of the study, measurements were taken at approximately 25-30 meters from the dust source. As a result, the findings from the first day show lower value compared to the overall dataset. On the second day, measurements were conducted 15-20 meters from the dust source, leading to an increase in recorded dust concentrations. On the third day, measurements were taken directly at the source using devices attached to the search and rescue team, and the highest concentration values were recorded. The data in
Table 3 and
Table 4 show a clear increase in respirable dust and total dust concentrations as the measurement point gets closer to the dust source. On the fourth day, measurements were taken near the dust source, but as shown in
Table 2, increased wind speed and brief rainfall led to a decrease in total dust concentration values. On the fifth day, due to the impact of a 6.4 Mw aftershock, measurements were conducted for a short duration near the dust source before field conditions changed.
An analysis of
Table 5, which provides dust exposure limits in Turkey, and
Table 6, which outlines international regulatory limits, indicates that despite being conducted in an open environment, the obtained measurement results are significantly high and exceed the established thresholds. This finding suggests that the dust clouds generated following a destructive earthquake not only deteriorate air quality but also pose serious health risks. Additionally, it is scientifically known that smaller dust particles exhibit higher volatility and dispersion in open environments. Nevertheless, the highest recorded respirable dust concentration was 97.81 mg/m³, while the total dust concentration reached 43.84 mg/m³. These results indicate that dust clouds formed after the earthquake have a substantial impact on the health of individuals present in the study area and may increase the likelihood of developing lung diseases in the coming years.
The uncontrolled and simultaneous demolition of both old and new structures in the research area raised concerns about the potential presence of asbestos. Asbestos is generally composed of silica (SiO₂) and magnesium (Mg), among other chemical elements, and is known as a fibrous mineral (Chornkrathok et al., 2024; Hughes & Weill, 2001). However, all types of asbestos contain Si, Mg, Fe, Ca, O, Na, and Al, which define their physical and chemical properties (Green & Ringwood, 2002). Therefore, the dust samples collected from the study area were analyzed using SEM to determine particle sizes and EDX to examine elemental composition, presented in histograms (
Figure 4 and
Figure 5). The average particle sizes accumulated on the filters ranged from approximately 0.1 to 1 µm. However, two specific dust samples contained particularly notable findings. The SEM images of these samples revealed fiber-like particles of varying sizes, measuring between 20 and 40 µm, which suggests the presence of asbestos-like structures. These findings underscore the urgent need for comprehensive air quality assessments and strict occupational safety regulations in post-disaster environments. Effective mitigation strategies, including the implementation of controlled demolition protocols and the use of personal protective equipment (PPE), are essential to minimizing long-term health risks for both emergency responders and affected communities.
Despite wearing full protective gear during the measurements, the field research team experienced allergic reactions such as eye irritation and watering. This highlights the need for dust cloud scenarios to be incorporated into disaster relief planning for large-scale natural disasters. The formation of dust clouds poses an additional hazard for everyone in the earthquake zone, including survivors, search and rescue teams, first aid personnel, and military staff. Therefore, it is recommended that all individuals present in the affected area undergo periodic respiratory health screenings and follow-ups to monitor potential long-term effects. This field study emphasizes the severity of dust clouds generated after destructive natural disasters and their impact on human health. Moreover, it is the first study to examine both the density and morphological characteristics of dust clouds in such a disaster scenario. As a result, this research raises awareness about integrating dust cloud impact assessments into emergency response plans and the importance of implementing preventive measures to mitigate their formation following an earthquake.
Funding
This research was funded by TÜBİTAK under the "1002C - Emergency Support Program for Field Studies Focused on Natural Disasters." Additionally, the dust measurement devices used in the research area were provided by the Istanbul Metropolitan Municipality Occupational Hygiene Laboratory. On the third day of the study, to verify the accuracy of the measurements, the Chemistry Laboratory of Osmaniye Korkut Ata University was utilized.
References
- Akhtar, K., Khan, S.A., Khan, S.B. and Asiri, A.M. (2018). Scanning Electron Microscopy: Principle and Applications in Nanomaterials Characterization. In: Sharma, S. (eds) Handbook of Materials Characterization. Springer, Cham. [CrossRef]
- Asbestos, (2023). T.R. Ministry of Labor and Social Security. ''Asbestos''. https://www.csgb.gov.tr/isgum/contents/asbest/. Last Access Date: 10.02.2023.
- Aslan, S. and Aybek, A. (2016). Health Effects of Particulate Matter Exposure in Agriculture, Research Topics and Policies. Journal of Agricultural Machinery Science, 12(3), 177-189.
- Atabey, E. (2015). Türkiye Asbestos Map (Environmental Asbestos Exposure-Lung Cancer-Mesothelioma). Tuberk Thorax; 63(3), 199-219.
- CDC, (2021). Centers for Disease Control and Prevention, Particulates Not Otherwise Regulated, Respirable. https://www.cdc.gov/niosh/docs/ 2003-154/pdfs/0600.pdf, Access date: 05.03.2023.
- Cherrie, J.W. and Howie, J. (2003). Health effects of organic dust exposure in the workplace. Occupational Medicine, 53(2), 110-119. [CrossRef]
- Chornkrathok, S., Carbone, M., Yang, H., Rouf, M., Dodson, R.F. and Dera, P. (2024). Mineralogical investigation of asbestos contamination of soil near old vermiculite processing plant in Honolulu, Hawaiʻi. Environmental Pollution, 356, 1-10. [CrossRef]
- Çevikler, E. (2009). Investigation of Respirable Dust Densities and Quartz Contents in Foot Workplaces of TTK Üzülmez Establishment. Adana: Çukurova University, Institute of Science and Technology, Mining Engineering Department.
- Earthquake Department, (2023). Preliminary Assessment Report on the 20 February 2023 Yayladağı (Hatay) Mw 6.4 Earthquake. TC. Ministry of Internal Affairs, Disaster and Emergency Management Presidency, 25 February 2023.
- Dündar, M. and Pala, M. (2002). Heavy Metal Pollution in Adapazarı Street Dust After the 17 August 1999 Earthquake. Sakarya University Journal of Science, 63-68.
- Ediz, I. G., Beyhan, S. and Yuvka, Ş. 2001. Occupational Diseases Due to Dust in Mining. Journal of Science and Technology of Dumlupınar University, (002), 111-120.
- EU, (2022). Occupational Exposure Limits. Access Address: chrome-extension://efaidnbmnnnibpcajpcglclefindmkaj/https://ima-europe.eu/wp-content/uploads/2022/12/OEL-FULL-TABLE-January-2022-Europe.pdf.
- Franque Mirembo, J. C., Swanepoel, A. J. and Rees, D. (2013). Respirable quartz exposure on two medium-sized farms in southern Mozambique. International Journal of Occupational and Environmental Health, 19(2), 113-118. [CrossRef]
- Google Maps, (2023). Hatay Province Map in Turkey. Access address: https://www.google.com/maps, Access date: 01.03.2023.
- Gökcan, A., Demir Handan, H., Aktaş, C. E., Gür, R., Uyğun H. and Demir, G. (2022). Evaluation of indoor air quality in a selected sector on the basis of occupational health and safety. Frontiers in Life Sciences and Related Technologies, 3(1), 1-6. [CrossRef]
- Green, T. H. and Ringwood, A. E. (2002). Asbestos: Chemistry, structure and occurrence. Journal of Geology, 110(3), 299-312. [CrossRef]
- Griffin D.W. (2007). Atmospheric movement of microorganisms in clouds of desert dust and implications for human health. Clinical microbiology reviews. 20(3): 459-77. [CrossRef]
- Güngörmiş, H. (2015). Reduction of water-soluble Chromium (VI) in cement with the help of different reducers, Institute of Science and Technology, Master's Thesis, Pamukkale University.
- Health and Safety Executive, (2000). General methods for sampling and gravimetric analysis of respirable and inhalable dust. Methods for Determination of Hazardous Substances no. 14/3.
- https://www.osha.gov/chemicaldata/801.
- Hughes, J. M. and Weill, H. (2001). Asbestos and disease: Historical perspectives. Environmental Health Perspectives, 109(5), 557-567. [CrossRef]
- IARC, (2012). International Agency for Research on Cancer: Asbestos (chrysotile, amosite, crocidolite, tremolite, anthophyllite, and actinolite). In IARC Monographs on the Evaluation of Carcinogenic Risks to Humans, Vol. 100C. Access address: https://www.iarc.fr.
- ILO, (1987). Dusts. International Labor Organisation. African Newsletter on Occupational Health and Safety. (Helsinki).
- Kahramanmaraş Earthquakes. (2023). Kahramanmaraş Earthquake 2023. Access address: https://tr.wikipedia.org/wiki/2023_Kahramanmaraş_depremleri.
- Kahraman, Z. and Yürüten Özdemir, K. (2022). Occupational Diseases and Fighting Dust in Dusty Works. Soma Vocational School Technical Sciences Journal, 13-29.
- Karabulut, M. (2021, June). Personal and Workplace Environment Dust Concentration Gravimetric Determination: Retrieved from https://www.csgb.gov.tr/media/80072/toz-sunumu-17haziran.pdf.
- Nazari, Ş., Kermani, M., Fazizadeh, M., Alizadeh-Matboo, S. and Yari, A.R. (2016). The Origins and Sources of Dust Particles, Theieffects on Environment and Health, and Controstrategies: A Review. Journal Of Air Pollution and Health, 1(2), 137-152.
- NIOSH, (2009). National Institute for Occupational Safety and Health Organic dusts: Health hazards in agriculture. Access address: https://www.cdc.gov/niosh/topics/agriculture/default.html.
- Novel, (2024). IOM Caps for Zefon Inhalable Powders. Access address: https://novel.com.tr/isg-zefon-solunılır-toz-iom-inhalable-dust-numune-ornekleme-basligi.html Access date: 05.03.2023.
- OSHA, (2023). Particulates Not Otherwise Regulated, Total and Respirable Dust (Pnor). Access address: https://www.osha.gov/chemicaldata/801.
- Özkan, T. and Yıldız, Z. (2022). Determination of Dust Levels in a Cement Factory and Its Effects on Employee Health. Health Academy Kastamonu (SAK), 7 (3), pp.548-563.
- Ray, D. L. and Finkelman, R. B. (2005). Dust in the workplace: Occupational health hazards of airborne particulates (1st ed.). CRC Press.
- Russ, J.C. (2013). Fundamentals of energy dispersive X-ray analysis: Butterworths monographs in materials. Butterworth-Heinemann.
- Savcı, S. (2023). Environmental Effects of Earthquake. In Current Debates in Natural and Engineering Sciences (pp. 523-534). Ankara: Bilgin Culture and Art Publications.
- Schepanski, K. (2018). Transport of Mineral Dust and Its Impact on Climate. Geosciences 2018, 8(5), 151. [CrossRef]
- TÜBİTAK, (2023). 1002-C Natural Disasters Focused Field Work Emergency Support Program. Access address: https://mam.tubitak.gov.tr/tr/duyuru/1002-c-dogal-afetler-odakli-saha-calismasi-acil-destek-programi Access date: 05.03.2023.
- February 6 Earthquake with data. (2023, February 15). Ministry of Environment, Urbanization and Climate Change: Retrieved from https://www.verikaynagi.com/genel/6-subat-kahramanmaras-depreminin-ardindan/.
- Wang X, Dong Z, Yan P, Yang Z and Hu Z. (2005). Surface sample collection and dust source analysis in northwestern China. Catena, 59(1), 35-53. [CrossRef]
- Wang, S., Baxter, L., Fonseca, F. (2008). Biomass fly ash in concrete: SEM, EDX and ESEM analysis. Fuel, 87(3), 372-379. [CrossRef]
- WHO, (2021). WHO Global Air Quality Guidelines. Access address: https://www.who.int/publications/i/item/9789240034228.
- Zefon, (2024). The World's Best Air Sampling Equipment Cyclone Heads for Respirable Dusts. Access address: chrome-extension://efaidnbmnnnibpcajpcglclefindmkaj/https://novel.com.tr/pdf/Zefon_Solunılır_%20Tozlar_icin_Cyclone_Basliklari.pdf Access date: 05.03.2023.
Figure 1.
Photo taken by the research team. Province: Hatay, Date: 17.02.2023. Sources: Authors.
Figure 1.
Photo taken by the research team. Province: Hatay, Date: 17.02.2023. Sources: Authors.
Figure 2.
Map showing the places where measurements were taken in the research area. Province: Hatay, Date: 17.02.2023-21.02.2023 (Google Maps, 2023).
Figure 2.
Map showing the places where measurements were taken in the research area. Province: Hatay, Date: 17.02.2023-21.02.2023 (Google Maps, 2023).
Figure 3.
Illustrates the attachment of measurement devices to the research team. Sources: Research Team.
Figure 3.
Illustrates the attachment of measurement devices to the research team. Sources: Research Team.
Figure 4.
SEM and EDX Results of Dust Sample 7(64) Collected from the Research Site. Province: Hatay. Sources: Authors.
Figure 4.
SEM and EDX Results of Dust Sample 7(64) Collected from the Research Site. Province: Hatay. Sources: Authors.
Figure 5.
SEM and EDX results of dust sample 7(94) collected from the research site. Province: Hatay. Sources: Authors.
Figure 5.
SEM and EDX results of dust sample 7(94) collected from the research site. Province: Hatay. Sources: Authors.
Table 1.
Date, Location and Measurement Times, Province: Hatay, Country: Turkey.
Table 1.
Date, Location and Measurement Times, Province: Hatay, Country: Turkey.
| Measurement Date |
Time |
Location |
Duration |
| 17.02.2023 |
Morning |
Atatürk Street |
2 Hour |
| 17.02.2023 |
Afternoon |
Atatürk Street |
2 Hour |
| 18.02.2023 |
Morning |
Fatih Street |
1 Hour |
| 18.02.2023 |
Afternoon |
Atatürk Street |
1 Hour |
| 19.02.2023 |
Morning |
Cumhuriyet Street |
1 Hour |
| 19.02.2023 |
Afternoon |
Cumhuriyet Street |
1 Hour |
| 20.02.2023 |
Morning |
Atatürk Street |
3 Hour |
| 20.02.2023 |
Afternoon |
Fatih Street |
3 Hour |
| 21.02.2023 |
Afternoon |
Cumhuriyet Street |
3 Hour |
Table 2.
Humidity, Temperature, Wind Speed, and Pressure Values Recorded During the Measurement Period Location: Hatay, Date: February 17–21, 2023.
Table 2.
Humidity, Temperature, Wind Speed, and Pressure Values Recorded During the Measurement Period Location: Hatay, Date: February 17–21, 2023.
| Date |
Humidity (%) |
Air Temperature (ᵒc) |
Wind Speed (m/sn) |
Pressure (Hpa) |
| 17.02.2023 |
43 |
11,6 |
0,5 |
1003 |
| 31 |
19,3 |
1 |
1014 |
| 18.02.2023 |
49,3 |
15,1 |
1 |
1005 |
| 48,6 |
16,2 |
1 |
1015 |
| 19.02.2023 |
52,4 |
17 |
0,4 |
1010 |
| 49,5 |
21,1 |
1,7 |
1015 |
| 20.02.2023 |
54,5 |
18,5 |
0,9 |
1011 |
| 46,6 |
22 |
3,6 |
1011 |
| 47,5 |
24 |
1 |
1010 |
| 21.02.2023 |
53,5 |
20 |
3 |
1009 |
Table 3.
Respirable Dust Concentration Measurement Dates and Values. Province: Hatay,.
Table 3.
Respirable Dust Concentration Measurement Dates and Values. Province: Hatay,.
| Date |
Sample No. |
Hour |
Duration (Hour) |
Value (mg/m³) |
| 17.02.2023 |
6 |
11:30 |
2 |
1,239 |
| 7 |
2,619 |
| 8 |
15:00 |
16,004 |
| 9 |
15:05 |
26,771 |
| 18.02.2023 |
11 |
13:20 |
1 |
4,213 |
| 12 |
27,07 |
| 13 |
14.37 |
9,951 |
| 14 |
14:38 |
37,364 |
| 15 |
14:40 |
43,136 |
| 19.02.2023 |
17 |
12:12 |
1 |
97,81 |
| 18 |
13:30 |
2,952 |
| 19 |
13:35 |
36,022 |
| 20 |
13:25 |
84,896 |
| 20.02.2023 |
21 |
11:45 |
1 |
38,561 |
| 22 |
11:50 |
3 |
12,645 |
| 23 |
13:18 |
|
90,926 |
| 24 |
13:20 |
1 |
42,599 |
| 25 |
14:25 |
|
65,227 |
| 21.02.2023 |
26 |
13:10 |
1 |
77,707 |
Table 4.
Total Dust Concentration Measurement Dates and Values, Province: Hatay.
Table 4.
Total Dust Concentration Measurement Dates and Values, Province: Hatay.
| Date |
Sample No |
HOUR |
Duration (Hour) |
Value (mg/m³) |
| 17.02.2023 |
1 |
11:30 |
2 |
33,635 |
| 18.02.2023 |
2 |
13.25 |
1 |
43,837 |
| 19.02.2023 |
3 |
12:05 |
1 |
35,896 |
| 20.02.2023 |
4 |
11:50 |
1 |
29,426 |
| 5 |
14:30 |
1 |
25,479 |
Table 5.
Limit Values for Dust Exposure According to the Dust Control Regulation in Turkey (Dust Control Regulation, 2013).
Table 5.
Limit Values for Dust Exposure According to the Dust Control Regulation in Turkey (Dust Control Regulation, 2013).
| Substance |
Total Dust Amount
(mg/m3) (TWA) |
Amount of Respirable Dust
(mg/m3) (TWA) |
| Calcium Carbonate (Marble) |
15 |
5 |
| Calcium Carbonate (Limestone) |
15 |
5 |
| Calcium Hydroxide |
15 |
5 |
| Calcium Silicate |
15 |
5 |
| Calcium Sulfate |
15 |
5 |
| Plaster of Paris |
15 |
5 |
| Portland Cement |
15 |
5 |
| Emery |
15 |
5 |
Table 6.
Exposure Limit Values for Dust Set by International Organizations (WHO, 2021; ILO, 1997; OSHA, 2023; EU, 2022).
Table 6.
Exposure Limit Values for Dust Set by International Organizations (WHO, 2021; ILO, 1997; OSHA, 2023; EU, 2022).
|
PM2.5
|
WHO |
ILO |
OSHA/NIOSH |
EU |
| Annual Average |
Daily Average |
Respirable Dust |
Free Silica |
Silica Dust
|
General Dust Exposure |
General Dust Exposure |
Crystalline Silica |
| 10 mg/m3 |
25 mg/m3 |
10 mg/m3 |
0.1 mg/m3 |
0.05 mg/m3 |
15 mg/m3 |
10 mg/m3 |
0.1 mg/m3 |
|
Disclaimer/Publisher’s Note: The statements, opinions and data contained in all publications are solely those of the individual author(s) and contributor(s) and not of MDPI and/or the editor(s). MDPI and/or the editor(s) disclaim responsibility for any injury to people or property resulting from any ideas, methods, instructions or products referred to in the content. |
© 2025 by the authors. Licensee MDPI, Basel, Switzerland. This article is an open access article distributed under the terms and conditions of the Creative Commons Attribution (CC BY) license (http://creativecommons.org/licenses/by/4.0/).