Submitted:
05 September 2025
Posted:
05 September 2025
You are already at the latest version
Abstract
This study employs an industry-specific patent classification methodology (ISPCM) and complex network analysis across temporal, industrial, and spatial dimensions to examine China’s new energy vehicle (NEV) patent collaboration network and uncover the mechanisms underlying China’s global ascendancy in the NEV sector. The results demonstrate the effectiveness of the ISPCM and reveal a three-phase growth pattern driven by policy initiatives and market expansion. Domestic entities dominate the patent landscape, with a noticeable shift from invention patents to utility model patents, reflecting a focus on application-oriented innovation. The collaboration network exhibits small-world and scale-free properties, forming an oligopolistic structure where state-owned enterprises (SOEs) act as "innovation orchestrators," while private firms concentrate on specialized R&D. Across the industrial chain, the component segment serves as a hub, the complete vehicle segment remains relatively isolated, and the aftermarket clusters around battery recycling. A clear divide between domestic and foreign entities suggests potential decoupling risks. The findings reveal a dual-circulation innovation model that combines state-led coordinated research with market-driven independent research, offering valuable insights for sustainable industrial transformation.
Keywords:
new energy vehicles
; patent cooperation networks
; complex network analysis
; innovation ecosystem
; large language model
1. Introduction
Since the initiation of China’s “863 Program” focused on electric vehicles in 2001, the country has embarked on more than two decades of NEV R&D, evolving from a technological follower to a global leader. In 2023, China’s NEV sales reached 9.49 million units, representing over 60% of global sales (approximately 15 million units), significantly exceeding those in Europe (around 3 million) and the United States (about 1.4 million). The NEV penetration rate in China surpassed 35% in 2023, outpacing the European Union (around 20%) and the United States (7%). Meanwhile, China exported 1.77 million NEVs in 2023, a 67% year-on-year increase, establishing itself as the world’s largest NEV exporter, with key markets in Southeast Asia, Europe, and Latin America. These achievements raise a critical question: what explains the rapid rise of China’s NEV industry? This study investigates this question through the lens of patent innovation.
As core embodiments of technological innovation, patents offer valuable insights into industrial dynamics, making patent data analysis a crucial methodology in NEV research. However, the vast volume of patents, coupled with complex technical descriptions and specialized terminology, poses significant challenges to traditional classification methods in terms of both efficiency and accuracy [1]. Furthermore, the NEV industry encompasses multiple layers of the industrial chain: upstream components, midstream complete vehicles, and downstream aftermarket services. For instance, the upstream component layer includes batteries, motors, electronic controls, intelligent connected systems, body systems, power systems, chassis systems, universal components, environmental perception systems, among others. Within the battery subcategory alone, further subdivisions exist—such as battery packs, cells, battery structural components, and battery management systems. Constructing a precise and hierarchically structured classification framework for such a complex and multi-layered industry remains an unresolved challenge. Although pre-trained language models like BERT have shown improvements in general patent classification, their performance in the specialized NEV domain is still limited, and the risk of model hallucinations remains a significant concern [2,3,4,5].
To address these challenges, this study introduces an industry-specific patent classification methodology (ISPCM) that integrates expert knowledge with large language models (LLMs). Specifically, we first construct a multi-layer classification system—an NEV industry knowledge graph—and design rule-based matching patterns to identify patents across industry segments. These patterns are incorporated into LLM prompts. This approach is further enhanced by the reasoning and question-answering capabilities of LLMs, improving classification efficiency while reducing the risk of hallucinations.
In parallel, complex network theory provides powerful tools for analyzing relationships and dynamics in large-scale systems [6,7]. By combining this framework with the ISPCM, we examine the evolution of China’s NEV patent collaboration network across temporal, industrial, and spatial dimensions, uncovering the mechanisms behind the country’s global leadership [8].
Overall, this study contributes to the field by enhancing the accuracy of NEV patent identification [9,10,11], revealing structural features of patent collaboration, and diagnosing potential risks within the innovation network [12]. The remainder of this paper is structured as follows: Section 2 reviews related literature; Section 3 outlines the research framework; Section 4 presents results and discussion; and Section 5 concludes with implications and future research directions.
2. Related Literature
In recent years, technology identification and patent analysis in the NEV industry have gained significant attention in both academic and industrial circles. Existing studies have explored various perspectives, including technological trajectories, cooperation networks, and evolutionary dynamics [13,14].
Yuan et al. [13] observed a gradual recovery in fuel cell vehicle (FCEV) technologies since 2014. The United States, Japan, Germany, China, and South Korea remain core contributors, although the sources of FCEV innovation are undergoing restructuring. Leading firms, especially major automakers and component suppliers, play a pivotal role in advancing hydrogen fuel cell technologies. Liu et al. [14] revealed that electric vehicle charging technologies are concentrated in areas such as line arrangement, batteries, safety devices, and charging stations. However, large institutions exhibit weak collaboration, with competition focused on traction power, line arrangement, system control, and charging stations.
Complex network theory has proven highly effective in analyzing international cooperation patterns and synergistic effects, often through the construction of multi-dimensional patent collaboration networks [15,16,17]. For example, Wang et al. [18] employed Latent Dirichlet Allocation and patent cooperation data to construct innovation networks, identify development periods, and reveal the evolution of hotspots such as batteries, drive systems, and control technologies. Li et al. [19] examined patent networks at national and regional levels in the Yangtze River Delta, highlighting distinct cooperation patterns across regions. Hu et al. [20] applied social network analysis to reveal the core–periphery structure and regional disparities in China’s charging station patent collaborations. Chen et al. [21] integrated the S-curve model with social network analysis and time-series methods, identifying development phases for electric vehicle (EV) technologies and sustainable directions. Their findings suggest that EV technologies globally and in South Korea have reached saturation, with Korea maintaining a two-year advantage in areas such as fast charging, infrastructure, battery monitoring, and AI-based applications. Li et al. [22] argued that China’s NEV industry is likely to evolve toward electrification, intelligence, lightweighting, and sustainability. However, their study was limited by overly generalized predictions, which may lack actionable insights for national or corporate technology roadmaps.
A critical review of prior studies indicates that most analyses rely on partial datasets (e.g., specific periods or technological segments) rather than comprehensive patent portfolios, limiting the ability to capture full lifecycle dynamics. Moreover, many studies use keyword searches and IPC classifications for patent identification, often introducing data noise and omissions.
Against this backdrop, this study introduces a novel patent classification framework that integrates knowledge graphs and LLMs. Based on this framework, we propose a four-stage analytical approach to investigate China’s NEV patents and collaboration networks across temporal, industrial, and spatial dimensions.
3. Materials and Methods
3.1. Research Framework
As shown in Figure 1, this study adopts a four-stage analytical framework.
Stage 1: Construction of the NEV patent dataset. All patent data were obtained from the China National Intellectual Property Administration (CNIPA), which provides comprehensive datasets widely used in innovation and technology studies [23]. The data were stored and managed in HDFS of Cloudera big data platform [24]. To identify NEV-related patents, the ISPCM was developed by integrating an NEV industry knowledge graph with the Qwen LLM [25], enabling hierarchical multi-label classification across the NEV industrial chain, thereby constructing the China new energy vehicle industry patent (CNEVIP) dataset in Elasticsearch [26].
Stage 2: Development of a multi-attribute indexing system. Each patent was indexed by classification label, patent type, applicant, grant year, and geographic location.
Stage 3: Extraction of relational data and construction of patent collaboration networks. Collaborative patents were defined as those with two or more applicants, further categorized as domestic or foreign. Gephi was used to construct undirected collaboration networks based on the extracted relationships.
Stage 4: Statistical and network analysis. Using descriptive statistics and complex network analysis, this study evaluates the CNEVIP landscape and derives insights for innovation policy and strategic planning.
3.2. Dataset Constructed by ISPCM
Patents were categorized into invention patents (Type B), utility model patents (Type U), and design patents (Type S). Traditional approaches often rely on IPC codes or keyword searches to filter relevant patents; however, these methods fail to fully capture emerging NEV technologies and tend to yield numerous irrelevant matches. To overcome these limitations, this study employed the ISPCM, which combines a domain-specific knowledge graph with LLMs. After comparing multiple open-source models, including Baichuan [27], ChatGLM [28], ChatGPT [29], and Qwen [25], Qwen was selected as the base model due to its classification performance and cost-effectiveness.
The NEV knowledge graph consists of seven hierarchical layers, including three first-level categories (upstream components, midstream complete vehicles, and downstream aftermarket), 21 second-level categories, and 75 third-level categories. Due to its large scale, the full graph is not included in this paper but is available on Gitee at: https://gitee.com/LyuXiaozhong/NEV.git. The ISPCM model was parallelized on a server equipped with eight NVIDIA A40 GPUs to efficiently extract and classify NEV-related patents from the CNIPA dataset, resulting in the construction of the CNEVIP dataset. All patents can be categorized across the various layers of China’s NEV industrial chain. Since the method supports multi-label classification, a single patent may be assigned multiple labels. Compared to conventional IPC- or keyword-based filtering approaches, the ISPCM significantly reduces noise and improves recall, thereby providing a more robust foundation for subsequent network analysis. Comprehensive details of the ISPCM are provided in our granted patent (granted number: CN118798188B) [30].
3.3. Data Processing
The patent collaboration network is a central focus of this study. Patents with two or more applicants were defined as collaborative patents, and applicants were categorized as domestic or foreign. Both static and temporal analyses were conducted for patents filed between 2001 and 2022, resulting in an undirected collaboration network of the CNEVIP dataset.
Complex network analysis, a graph-theoretical tool widely used to study complex systems, was employed to characterize relationships and collaboration patterns within the network [31]. Network metrics, such as degree centrality and betweenness centrality, were used to identify key applicants, while topological properties, including small-world characteristics and community structures, revealed the distribution of innovation resources and collaboration patterns. This approach also facilitates the analysis of network evolution, technology diffusion, and potential guidance for innovation policy and corporate strategy. To systematically characterize the NEV patent collaboration network, we conducted structural, centrality, and cohesion analyses as follows.
3.3.1. Network Structural Analysis
Network Density (D) measures the overall connectivity among nodes and reflects the intensity of node interactions. Higher network density indicates more frequent interactions, leading to more efficient and rapid knowledge dissemination [32]. Network density is defined as the ratio of the actual number of edges to the maximum possible number of edges in the network, ranging between [0, 1]. Higher values indicate tighter connections between nodes.
Average Degree (K) describes the average number of connections per node, reflecting the overall connectivity of the network. It is calculated as the arithmetic mean of the degrees of all nodes.
where is the actual number of edges and is the number of nodes in formula (1) and (2).
Network Diameter (D) indicates the expansiveness of the network, measuring the longest shortest path between any pair of nodes. It is used to analyze information propagation efficiency and network scale.
where is the shortest path length between nodes and , and represents the set of nodes.
Average Clustering Coefficient (C) describes the average level of local connectivity among nodes, reflecting the modularity and community structure of the network [33]. It is the mean of the clustering coefficients of all nodes, where the clustering coefficient of a node measures the connectivity among its neighbors.
where is the number of edges among the neighbors of node , is the degree of node , and is the number of nodes.
Average Path Length (L) measures the mean shortest distance between any two nodes in the network, evaluating the overall efficiency of the network. Shorter path lengths generally indicate higher efficiency [34].
where is the shortest path length between nodes and , and is the number of nodes.
3.3.2. Network Centrality Analysis
Centrality reflects the importance of a node within the network [35,36]. Metrics include degree centrality, betweenness centrality, closeness centrality, and eigenvector centrality.
Degree Centrality () measures a node’s direct influence or activity level, identifying the most active or highly connected nodes in the network. It is defined as the number of direct connections a node has to other nodes.
where is the degree of node , and is the number of nodes.
Betweenness Centrality () measures a node’s role as a bridge between other nodes, identifying those that control information flow or connectivity in the network. It is defined as the fraction of shortest paths passing through a node.
where is the total number of shortest paths from node to node , and is the number of those paths passing through node .
Closeness Centrality () measures the average distance from a node to all other nodes, reflecting its proximity to the rest of the network. Nodes with higher closeness can disseminate information more quickly.
where is the shortest path length between nodes and , and is the number of nodes.
Eigenvector Centrality (C_E) reflects the influence of a node based on the centrality of its neighbors. A node is considered important if it is connected to other important nodes.
where , is the adjacency matrix of the graph, and is the largest real eigenvalue.
3.3.3. Network Cohesion Analysis
Network cohesion is generally measured through network density, average path length, and cohesiveness [37]. Higher network density implies tighter connections between nodes, enhancing the network’s overall influence on individual nodes. Cohesiveness evaluates the overall tightness of connections in the network. Based on connectivity, networks can be categorized into four types: fully connected graphs, largest connected subgraphs, weakly connected graphs, and strongly connected graphs. Connected subgraphs exhibit tight internal connections and sparse external connections. The formation of subgraphs is influenced by collaboration types, regional preferences, and technological biases, reflecting certain connection preferences and clique phenomena.
4. Results and Discussion
This section is divided into two parts. Section 4.1 presents the overall landscape and temporal evolution of CNEVIPs, including quantitative analyses of patent trends, collaborative patent trends, patent-type distribution, and regional differences. Section 4.2 examines the structural characteristics of the CNEVIP collaboration network, focusing on network evolution, topological properties, community structures, key actors, and linkage patterns.
4.1. Patent Temporal Analysis
4.1.1. Overview of Patent Data
Using the ISPCM, we extracted 188,989 NEV-related patents filed and granted in China between 1985 and 2022 from the CNIPA dataset. Since China officially entered the NEV R&D phase in 2001, and the average patent authorization time is approximately 2.9 years [38], this study focuses on patents filed between 2001 and 2022 to ensure completeness and analytical validity.
4.1.2. Overall Temporal Evolution
As shown in Figure 2, a total of 100,614 authorized NEV patents were identified, including 3,078 collaborative patents, 18,517 invention patents, 13,661 design patents, and 68,436 utility model patents. Both the overall number of patents and the three major patent types show a sustained upward trajectory. The number of China’s NEV patents retrieved using conventional IPC and keyword-based methods reached 13,000 in 2012 and 7.058 million in 2022 [18]. In comparison, the ISPCM method proposed in this study identified 2,951 and 13,786 relevant patents for the same years, respectively. The substantial reduction in patent count and increased focus on relevant results demonstrate that the ISPCM method effectively excludes unrelated patents, thereby enhancing the reliability and accuracy of the findings.
The temporal evolution of patents can be divided into three periods based on development indicators and product life cycle theory [39]:
Initial Development Period (2001–2008): Annual authorizations remained below 1,000, reflecting an exploratory phase with limited patenting activity. Invention patents accounted for a relatively high proportion, indicating a focus on fundamental research and core technology breakthroughs.
Rapid Growth Period (2009–2017): Annual authorizations rose sharply to 1,000–10,000. The launch of BYD’s mass-produced NEV in December 2008 and the “Ten Cities, Thousand Vehicles” demonstration program in 2009 marked turning points for the industry. This period saw rapid expansion of application-driven innovation, reflected in a surge of utility model patents that surpassed invention patents.
Mature Development Period (2018–2022): Annual authorizations exceeded 10,000, signaling industrial maturity. China’s NEV sales led the global market, highlighting the close linkage between patent growth and market expansion.
Although collaborative patents increased in absolute terms, their share remained around 3%, suggesting that innovation was still primarily firm-driven rather than based on large-scale cross-organizational collaboration.
In terms of patent types, utility model patents comprised the majority, followed by invention patents, while design patents were the least numerous. This distribution indicates that China’s NEV industry has prioritized applied and engineering-driven innovation, while earlier phases placed greater emphasis on original inventions in core technologies.
4.1.3. Temporal Evolution of Patents in Three Industry Segments
From the perspective of industry segmentation, the component segment holds the largest share of patents, with a total of 95,748, including 17,661 invention patents, 12,821 design patents, 65,266 utility model patents, and 2,901 collaborative patents (collaboration rate 3%). In contrast, the complete vehicle sector has significantly fewer patents (1,217), comprising 90 invention patents, 239 design patents, 883 utility model patents, and only 22 collaborative patents (collaboration rate 1.8%). The aftermarket sector accounts for 4,310 patents, including 851 invention patents, 733 design patents, 2,726 utility model patents, and 152 collaborative patents (collaboration rate 3.5%). Overall, China’s NEV patent landscape is heavily concentrated in components, supplemented by the aftermarket, while the complete vehicle segment accounts for the smallest share. This indicates that patent activity emphasizes critical components and supporting technologies rather than complete vehicles. Notably, patent type distribution varies significantly: both components and aftermarket are dominated by utility model and invention patents, whereas the complete vehicle sector emphasizes utility model and design patents, reflecting a stronger focus on exterior protection and structural modifications.
The temporal distribution in Figure 3 shows that patent filings across all three segments have increased over time, though the share of collaborative patents remains persistently low without significant improvement. This suggests that relatively stable cooperation communities have emerged within each segment, but collaborative innovation is not the primary driver. Furthermore, the component segment started earliest and has maintained long-term dominance, while complete vehicle and aftermarket segments lagged behind. This pattern reveals an innovation trajectory of “component breakthroughs to complete vehicle integration to aftermarket.” In the early period, aftermarket patents were dominated by low-barrier design patents related to decoration and customization, whereas patents for charging, battery swapping, and cascade utilization technologies—requiring higher R&D input and longer cycles—only gained momentum in the mid-to-late development period.
In summary, the temporal evolution and distribution of patents across NEV industry segments demonstrate that innovation initially relied on breakthroughs in components, which subsequently stimulated advances in complete vehicles and aftermarket technologies. Components and aftermarket innovation are mainly utility model–driven, reflecting an application- and engineering-oriented approach, whereas the complete vehicle segment shows greater emphasis on design protection. Moreover, aftermarket innovation has evolved from low-cost, short-term design patents in the early period to high-barrier utility models and invention patents related to charging and battery utilization in the later period, highlighting a transition from rapid, profit-oriented innovation toward high-investment, long-cycle R&D.
4.1.4. Temporal Evolution of Patents Across Domestic and Foreign Applicants
From the perspective of applicant nationality, China’s NEV patents are overwhelmingly filed by domestic entities. A total of 98,518 domestic patents have been granted, including 16,980 invention patents, 13,130 design patents, 68,408 utility model patents, and 2,978 collaborative patents, with a collaboration rate of only 3%. Since 2001, domestic patent filings have grown steadily, accelerating sharply after 2015, when both overall and collaborative patents increased significantly. Notably, since 2015, China’s NEV sales have remained the highest in the world. Domestic patent activity is dominated by utility model patents, underscoring a focus on engineering applicability and rapid commercialization. Their short application cycles and fast approval processes enable rapid iterations, reflecting a “large-scale, wide-coverage” innovation model that has characterized the expansion phase of China’s NEV industry.
Figure 4.
Patent statistics of NEV industry by domestic and foreign applicants.
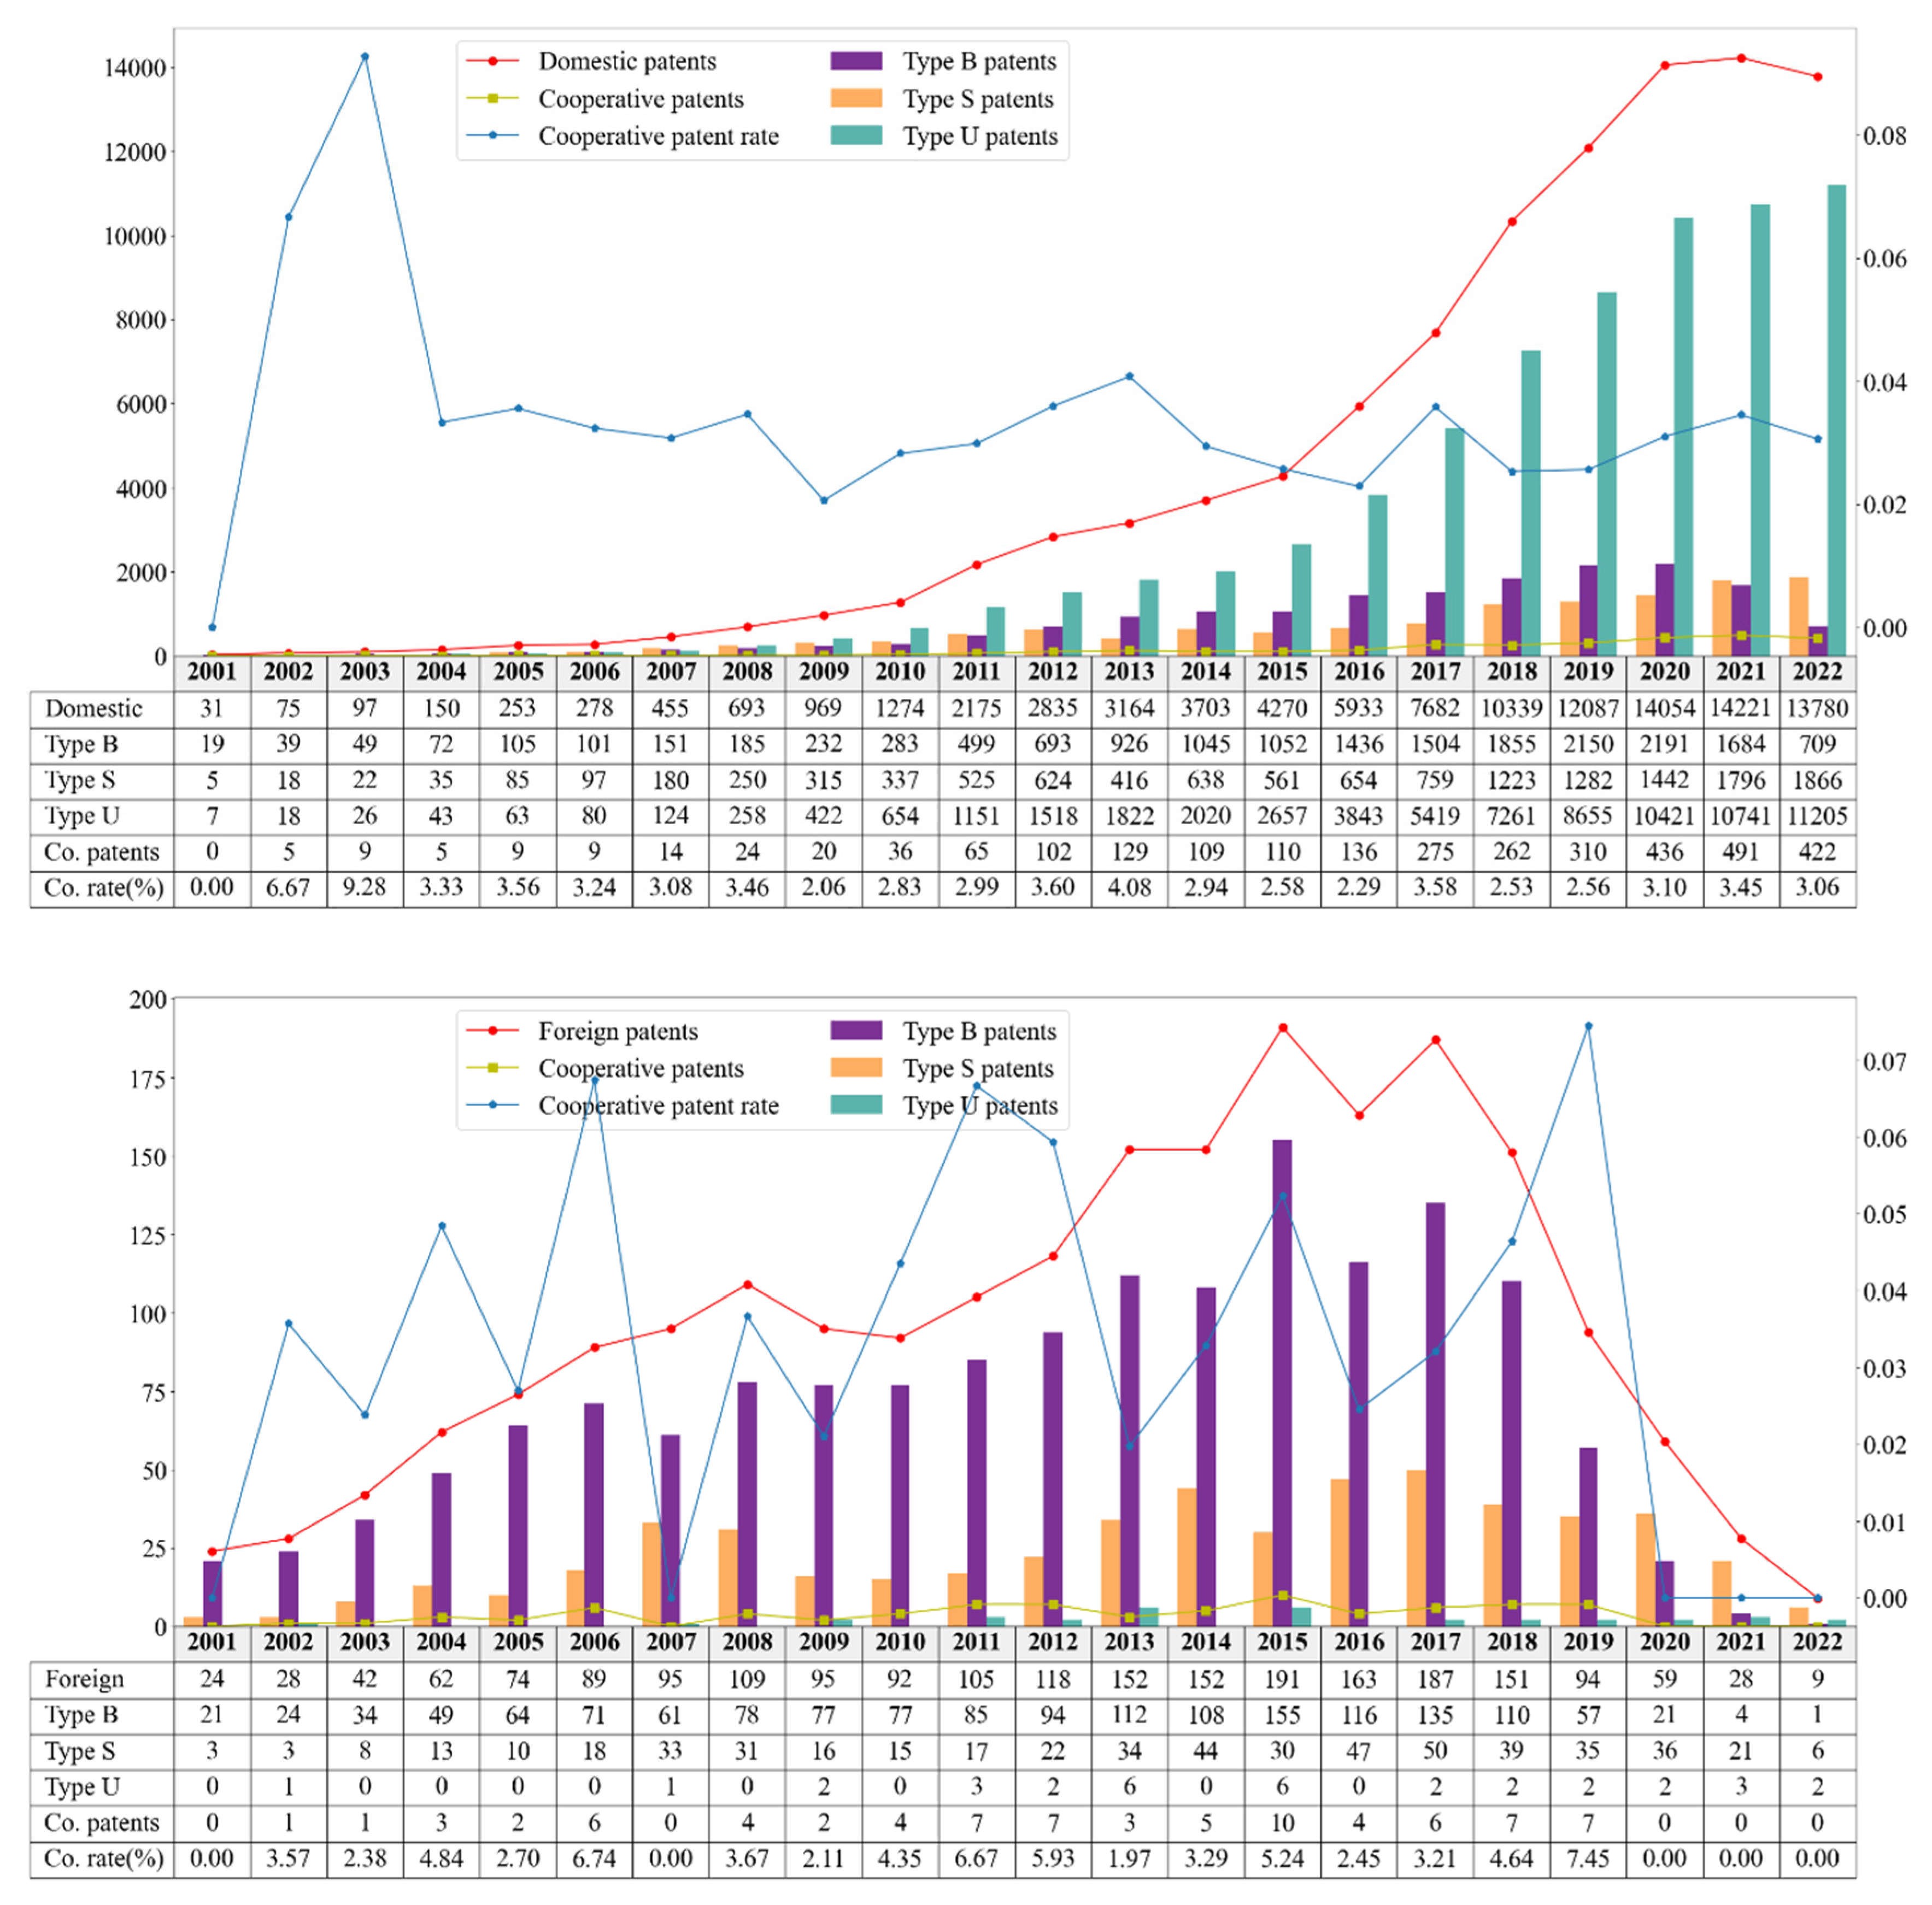
In contrast, foreign applicants account for only 2,119 patents in China, comprising 1,554 invention patents (over 70% of their total), 531 design patents, and just 34 utility model patents. Among them, 79 are collaborative patents, with a collaboration rate of 3.7%, slightly higher than domestic applicants. The temporal trend shows that foreign patents peaked in 2015 but declined steadily thereafter, forming a clear “peak-shaped” distribution. Unlike domestic entities, foreign applicants focus primarily on invention patents, underscoring original innovation and stronger technological barriers. However, their declining patent presence indicates reduced innovation investment and a shift in strategic priorities.
Overall, China’s NEV patent landscape is dominated by domestic applicants, whose patents far outnumber those of foreign entities. This highlights the growing strength of indigenous innovation and the collective engagement of Chinese firms. In terms of patent types, domestic applicants emphasize utility models, whereas foreign entities focus on invention patents, suggesting divergent innovation strategies, application-driven versus originality-driven. Regarding collaboration, domestic applicants maintain a relatively stable collaboration rate (3%), while foreign entities exhibit a slightly higher but volatile rate, indicating weaker sustainability.
We attribute these differences to several factors: (1) Tesla’s 2014 patent pledge, which reduced entry barriers and weakened foreign incentives to file in China; (2) rapid expansion of China’s NEV market, where intense competition prompted domestic firms to secure market share through utility model patents; (3) a divergence in innovation orientation, with domestic firms pursuing application-driven protection while foreign firms emphasize original inventions; and (4) strong government support in China, including policy incentives and R&D subsidies, which fueled continuous domestic patent growth.
In summary, the NEV patent innovation landscape in China is characterized by sustained growth, domestic dominance, and a strong preference for utility model patents, while foreign applicants have shown a declining presence since 2015, reflecting their diminishing competitive advantage in the Chinese NEV market.
4.2. Patent Cooperation Network
4.2.1. Overall Cooperation Network
Based on the Gephi analysis of 21,347 applicants from 2001 to 2022, Figure 5 illustrates the patent cooperation network, where each node represents an applicant. Node size reflects degree centrality and relative importance, while edges indicate collaborative patent relationships, with edge thickness proportional to cooperation frequency. Different colors denote distinct cooperation communities; for clarity, the six largest communities are presented.
As shown in Table 2, the cooperation network of China’s NEV industry exhibits typical features of a complex system. The network density is extremely low (0.0000087), suggesting that actual collaborations are far fewer than the potential maximum, and overall cooperation remains sparse. The network consists of 19,885 connected subgraphs, of which the largest contains only 300 nodes (1.41% of all nodes) but accounts for 25.92% of all connections and 20.21% of cooperative ties. This indicates that more than 93% of applicants exist in isolated small groups, with innovation activity highly fragmented. Most SMEs and research institutes remain outside the core network.
Despite the overall sparsity, the average clustering coefficient is high (0.711) and the average path length is relatively short (3.738), indicating a “small-world” structure [40]. Locally, dense clusters of tightly connected innovation groups exist, while a few central hub nodes serve as bridges enabling short global paths and efficient knowledge transfer across communities. This structure allows for deep knowledge sharing within clusters and rapid diffusion across clusters through hub nodes, balancing modular stability with global efficiency.
Table 1 and Figure 5 highlight the highly unequal power distribution. The State Grid Corporation of China (SGCC) ranks highest across degree, betweenness, and eigenvector centralities, underscoring its role as the dominant hub, primary bridge, and collaborator with other authoritative institutions. SGCC thus forms the only “super-hub” in the network. Combined with the analysis of Table 2, it can be concluded that the patent collaboration network exhibits characteristics of a scale-free network [41]. Other leading communities are centered on Zhejiang Geely Holding Group (private enterprise), Sinopec Zhuhai Dongfang Gas Station (SOE), Huaneng Clean Energy Research Institute (SOE), Gree Altairnano New Energy Inc (private enterprise), and Shanghai Jiao Tong University (university). Notably, four of the six hubs are SOEs, reflecting the decisive role of state-owned capital and policy support in shaping China’s NEV innovation ecosystem. With the exception of SJTU, the hubs are all enterprises, confirming that firms, particularly SOEs, are the core drivers and organizers of industry–university–research collaboration. An interesting finding is that Sinopec Zhuhai Dongfang Gas Station has the highest closeness centrality, making it the most efficient information hub despite its weaker resource control compared to SGCC. This likely reflects its unique position at the market interface, linking upstream component R&D, midstream complete vehicle manufacturing, and downstream services.
Comparison of Table 1 and Table 3 reveals a mismatch between innovation productivity and network influence. Firms such as Chery, CATL, and JAC lead in patent output (over 1,000 grants each) but do not occupy central positions in the cooperation network. Conversely, SGCC, with only 658 granted patents (ranked 13th), holds unmatched influence as a network hub. This dichotomy suggests two distinct innovation models:
Technology-independent-breakthrough-driven innovation model: Firms such as Chery, China’s largest vehicle exporter, and CATL, the world’s leading power battery manufacturer, demonstrate substantial internal R&D capabilities, as reflected in their high patent output. However, their relatively limited engagement in external collaborations results in lower network centrality, highlighting an innovation trajectory that prioritizes technological breakthroughs over cooperative integration within the broader innovation ecosystem.
Resource-integration-led innovation model: SGCC, despite moderate patent output, leverages its resource integration and infrastructural monopoly to dominate cooperation and innovation direction, demonstrating power derived from network position rather than volume of output.
In conclusion, China’s NEV patent cooperation network is structurally fragmented yet locally clustered, with a “small-world” topology shaped by a few dominant hubs. State-owned capital, particularly SGCC, plays a decisive role, creating an oligopolistic structure of “only super power and multi-great power.” The observed mismatch between patent output and network influence highlights that technological capacity does not automatically confer network power. Future industrial policy should therefore not only support technological breakthroughs but also address cooperation barriers, improve network connectivity, and enable broader participation of diverse innovation actors to enhance resilience and vitality of the overall innovation ecosystem.

Table 1.
Key nodes in the cooperation network.
| Centrality | 2001-2022 |
|---|---|
| State Grid Corporation of China | |
| Zhejiang Geely Holding Group Company Limited | |
| Sinopec Sales Co., Ltd. Guangdong Zhuhai Dongfang Gas Station | |
| Tsinghua University | |
| Sinopec Sales Co., Ltd. Guangdong Zhuhai Dongfang Gas Station | |
| Gree Electric Appliances,Inc.of Zhuhai | |
| BYD Company Limited | |
| Boe Technology Group Co., Ltd. | |
| State Grid Corporation of China | |
| Tsinghua University | |
| Northern Altair Nanotechnologies Co., Ltd. | |
| GREE ALTAIRNANO NEW ENERGY INC. | |
| State Grid Corporation of China | |
| China Electric Power Research Institute Co., Ltd. | |
| XJ Group Corporation | |
| Xj Power Co., Ltd. |
Table 2.
Structural characteristics of the cooperation network.
| Structural characteristic | 2001-2022 |
|---|---|
| Network density | 0.0000087 |
| Number of network nodes | 21347 |
| Number of network connections | 1983 |
| Connecting times | 6314 |
| Average clustering coefficient | 0.711 |
| Average path length | 3.738 |
| Number of connected subgraphs | 19885 |
| Number of nodes of the maximal connected subgraphs | 300(1.41%) |
| Number of connections of maximal connected subgraphs | 514(25.92%) |
| Connecting times of maximal connected subgraphs | 1276 |
Table 3.
Top 20 applicants by granted patents.
| Applicant | Num. |
|---|---|
| Chery AUTOMOBILE Co., Ltd. | 2101 |
| Contemporary Amperex Technology Co., Ltd. | 1865 |
| Anhui Jianghuai Automobile Group Corp.,Ltd. | 1302 |
| Eve Power Co., Ltd. | 1166 |
| FAW Group Co., Ltd. | 1153 |
| Hefei Gotion HIGH-TECH POWER ENERGY Co., Ltd. | 1109 |
| BYD Company Limited | 956 |
| Aodong New Energy Co., Ltd. | 949 |
| Guangzhou AUTOMOBILE Group Co., Ltd. | 866 |
| Zhejiang Geely Holding Group Company Limited | 847 |
| Honeycomb Energy Technology Co., Ltd. | 790 |
| PAN ASIA Technical AUTOMOTIVE Center Co., Ltd. | 729 |
| State Grid Corporation of China | 658 |
| Ford Global Technologies, LLC | 629 |
| OptimumNano Energy Co.,Ltd | 563 |
| Xiamen Hithium Energy Storage Technology Co., Ltd. | 547 |
| Chongqing Changan Automobile Company Limited | 517 |
| Huating (Hefei) Hybrid Technology Co., Ltd. | 483 |
| SINOTRUK Jinan Power Co., Ltd. | 473 |
| Dalian Institute of Chemical Physics, Chinese Academy of Sciences | 463 |
4.2.2. Temporal Evolution of the Patent Collaboration Network
During 2001–2008, the structural characteristics in Table 5 clearly reflect the nascent period of the industry: small scale, sparse collaboration, and simple structures. The network contained only 936 nodes, with the highest density across the three periods (0.0001577), but the absolute value remained extremely low, indicating merely sporadic cooperation. As many as 870 connected subgraphs existed, while the largest subgraph contained only six nodes (0.64%), highlighting the highly fragmented nature of innovation activities and the absence of a large-scale cooperative ecosystem. Table 4 shows that centrality was dominated by Toyota Motor Corporation and leading domestic universities (Tsinghua University, South China University of Technology, and the Dalian Institute of Chemical Physics, CAS). This indicates that the early-period patent collaboration network followed a typical pattern of foreign technological leadership and academic research dominance. In contrast, Table 6 reveals that domestic firms such as Chery and BYD had already started building patent portfolios (ranking first and second in granted patents), yet their activities were largely confined to independent R&D, lacking the ability to organize or lead collaborative networks—an “island-type” innovation model. Policy initiatives at the time, such as the “863 Program” EV projects, primarily stimulated basic research and early technology exploration, but failed to generate large-scale collaborative innovation. Overall, the patent collaboration network during this period can be characterized as a fragmented embryonic phase driven by foreign leadership and academic exploration.
From 2009–2017, the network entered a period of explosive growth and structural reshaping. The number of nodes increased nearly ninefold (to 8,423), with connections and collaboration frequency surging (737 and 1,828, respectively). However, network density sharply declined to 0.0000208, reflecting the influx of numerous new participants without proportionate deepening of cooperation, resulting in a “large but sparse” structure. As illustrated in Figure 6 and Table 4, a fundamental structural shift occurred. The SGCC rapidly emerged as the dominant hub, ranking first in degree, betweenness, and eigenvector centrality, thereby replacing foreign firms and becoming the sole super-hub of the network. Around SGCC, the largest collaboration community expanded significantly, with the largest connected subgraph containing 86 nodes (1.02%). Simultaneously, Zhejiang Geely, Sinopec’s Zhuhai Dongfang Gas Station, and Shanghai Jiao Tong University rose as secondary hubs. Meanwhile, foreign enterprises such as Toyota and Hyundai witnessed a relative decline in influence. This transformation reflected the acceleration of industrialization, particularly driven by large-scale demonstration projects such as the “Ten Cities, Thousand Vehicles” initiative, where state-owned giants leveraged policy advantages and infrastructure deployment (e.g., charging stations) to reshape the collaborative ecosystem, forming an emerging “one superpower and multiple strong players” structure. Table 6 further confirms this trend: domestic automakers and battery suppliers such as JAC Motors, Chery, and CATL experienced an explosive increase in patent output, becoming the backbone of innovation. This period thus represents the formation period of an industrialization-driven, state-owned-enterprise-led core–periphery patent collaboration network.
Table 4.
Key nodes of collaboration network across three periods.
| Centrality | 2001-2008 | 2009-2017 | 2018-2022 |
|---|---|---|---|
| Toyota Motor Corporation | State Grid Corporation of China | State Grid Corporation of China | |
| South China University of Technology | Zhejiang Geely Holding Group Company Limited | Zhejiang Geely Holding Group Company Limited | |
| Tsinghua University | Sinopec Sales Co., Ltd. Guangdong Zhuhai Dongfang Gas Station | China Huaneng Group Clean Energy Technology Research Institute Co., Ltd. | |
| Dalian Institute of Chemical Physics, Chinese Academy of Sciences | Xj Power Co., Ltd. | Tsinghua University | |
| Toyota Motor Corporation | Zhejiang Geely Holding Group Company Limited | Sinopec Sales Co., Ltd. Guangdong Zhuhai Dongfang Gas Station | |
| South China University of Technology | Sinopec Sales Co., Ltd. Guangdong Zhuhai Dongfang Gas Station | Gree Electric Appliances,Inc.of Zhuhai | |
| Dalian Institute of Chemical Physics, Chinese Academy of Sciences | GEM Co., Ltd. | BYD Company Limited | |
| Shanghai Xinmingyuan Automotive Parts Co., Ltd. | Baotou Yunsheng STRONG MAGNET Material Co., Ltd. | State Grid Fujian Electric Power Co., Ltd. | |
| Toyota Motor Corporation | State Grid Corporation of China | State Grid Corporation of China | |
| Tsinghua University | State Grid Hebei Electric Power Co., Ltd. | Tsinghua University | |
| South China University of Technology | Beijing Institute of Technology | Guangzhou AUTOMOBILE Group Co., Ltd. | |
| Foxconn Technology Group Co.,Ltd | State Grid Shandong Electric Power Company | South China University of Technology | |
| Toyota Motor Corporation | State Grid Corporation of China | State Grid Corporation of China | |
| The University of Tokyo | XJ Group Corporation | State Grid Electric Power Research Institute Co., Ltd. | |
| KYB Corporation | Xj Power Co., Ltd. | China Electric Power Research Institute Co., Ltd. | |
| Helmholtz-Zentrum Berlin für Materialien und Energie GmbH | XJ Electric Co., Ltd. | Tsinghua University |
Table 5.
Structural characteristics of collaboration network across three periods.
| Structural characteristic | 2001-2008 | 2009-2017 | 2018-2022 |
|---|---|---|---|
| Network density | 0.0001577 | 0.0000208 | 0.0000102 |
| Number of network nodes | 936 | 8423 | 16011 |
| Number of network connections | 69 | 737 | 1309 |
| Connecting times | 104 | 1828 | 4382 |
| Average clustering coefficient | 0.496 | 0.701 | 0.761 |
| Average path length | 1.272 | 2.469 | 2.569 |
| Number of connected subgraphs | 870 | 7867 | 15041 |
| Number of nodes of the maximal connected subgraph | 6(0.64%) | 86(1.02%) | 188(1.17%) |
| Number of connections of the maximal connected subgraph | 6(8.7%) | 171(23.2%) | 310(23.68%) |
| Connecting times of the maximal connected subgraph | 6 | 393 | 708 |
Table 6.
Top 20 applicants by granted patents across three periods.
| 2001-2008 | 2009-2017 | 2018-2022 | ||||
|---|---|---|---|---|---|---|
| Applicant | Num. | Applicant | Num. | Applicant | Num. | |
| Chery AUTOMOBILE Co., Ltd. | 222 | Anhui Jianghuai Automobile Group Corp.,Ltd. | 1096 | Contemporary Amperex Technology Co., Ltd. | 1178 | |
| BYD Company Limited | 101 | Chery AUTOMOBILE Co., Ltd. | 1034 | Eve Power Co., Ltd. | 1165 | |
| Dalian Institute of Chemical Physics, Chinese Academy of Sciences | 95 | Contemporary Amperex Technology Co., Ltd. | 687 | FAW Group Co., Ltd. | 851 | |
| Zhejiang Wanfeng Auto Wheel Co., Ltd. | 77 | OptimumNano Energy Co.,Ltd | 554 | Chery AUTOMOBILE Co., Ltd. | 845 | |
| The Yokohama Rubber Co., Ltd. | 66 | PAN ASIA Technical AUTOMOTIVE Center Co., Ltd. | 399 | Aodong New Energy Co., Ltd. | 839 | |
| Tsinghua University | 63 | Hefei Gotion HIGH-TECH POWER ENERGY Co., Ltd. | 330 | Honeycomb Energy Technology Co., Ltd. | 785 | |
| Shanghai Sinofuelcell Co., Ltd. | 58 | BYD Company Limited | 321 | Hefei Gotion HIGH-TECH POWER ENERGY Co., Ltd. | 778 | |
| Anhui Jianghuai Automobile Group Corp.,Ltd. | 56 | Zhejiang Geely Holding Group Company Limited | 305 | Guangzhou AUTOMOBILE Group Co., Ltd. | 582 | |
| Key Safety Systems, Inc. | 51 | FAW Group Co., Ltd. | 302 | Xiamen Hithium Energy Storage Technology Co., Ltd. | 547 | |
| Shenzhen BAK BATTERY Co., Ltd. | 50 | Guangzhou AUTOMOBILE Group Co., Ltd. | 284 | Zhejiang Geely Holding Group Company Limited | 540 | |
| PAN ASIA Technical AUTOMOTIVE Center Co., Ltd. | 45 | Ford Global Technologies, LLC | 277 | BYD Company Limited | 534 | |
| Suzhou Positec Power Tools (Suzhou) Co., Ltd. | 42 | SINOTRUK Jinan Power Co., Ltd. | 260 | Evergrande New Energy Technology (Shenzhen) Co., Ltd. | 459 | |
| Wuhan University of Technology | 42 | State Grid Corporation of China | 249 | Hesai Technology Co., Ltd. | 419 | |
| Autoliv Development AB | 39 | Chongqing Changan Automobile Company Limited | 232 | State Grid Corporation of China | 409 | |
| Hitachi, Ltd. | 39 | Dalian Institute of Chemical Physics, Chinese Academy of Sciences | 227 | Suteng Innovation Technology Co., Ltd. | 368 | |
| Shanghai Jiao Tong University | 37 | GM Global Technology Operations LLC | 199 | Envision Dynamics Technology(Jiangsu) Co., Ltd. | 327 | |
| South China University of Technology | 37 | Huating (Hefei) Hybrid Technology Co., Ltd. | 170 | Ford Global Technologies, LLC | 319 | |
| GM Global Technology Operations, LLC | 36 | Zhejiang Geely AUTOMOBILE Research Institute Co., Ltd. | 169 | Huating (Hefei) Hybrid Technology Co., Ltd. | 313 | |
| Harbin Institute of Technology | 34 | Harbin Institute of Technology | 165 | Envision Ruitai Dynamics Technology (Shanghai) Co., Ltd. | 303 | |
| Ford Global Technologies, LLC | 33 | Ningde Amperex Technology Limited | 163 | Jiangsu Zenergy Battery Technologies Co., Ltd. | 300 | |
During 2018–2022, the network continued to expand (16,011 nodes) with further deepening of collaborations (4,382 connections), but density dropped to the lowest level (0.0000102), reinforcing the “large but sparse” pattern with a vast number of peripheral participants (15,041 subgraphs). Nevertheless, Figure 6 and Table 4 reveal that the network core underwent accelerated integration and consolidation. SGCC further strengthened its dominance, expanding its community by absorbing top academic institutions such as Tsinghua University and South China University of Technology (the largest connected subgraph grew to 188 nodes, 1.17%). This indicates a shift in industry–academia–research cooperation from loose affiliations to tighter integration, with state-owned enterprises serving as key platforms for resource integration and technology transfer. Meanwhile, the ecosystem also became more diversified: Geely retained its importance, while new actors such as China Huaneng Group and Gree Altairnano emerged as community hubs. Notably, Table 6 shows that specialized battery manufacturers, CATL and Eve Energy, monopolized the top two positions in granted patents, far surpassing automakers. This reflects a power shift within the industry chain toward upstream components (particularly batteries), with private enterprises holding core technologies becoming increasingly significant in innovation output.
However, a striking contrast emerges: despite CATL’s dominant patent output, it does not rank among the top centrality nodes (Table 4). This once again illustrates that “high patent output does not equate to high network influence.” The collaborative ecosystem remains dominated by resource-integrating SOEs such as SGCC, while technology-driven private firms emphasize internal R&D and patent generation. These two models, resource-integration-led innovation and technology- independent-breakthrough-driven innovation, coexist, jointly driving the dual engines of industry-wide innovation.
In summary, over the past two decades, China’s NEV patent collaboration network has followed a clear evolutionary trajectory. Network centrality has shifted from foreign firms and academic institutions to SOEs, and subsequently to a coexistence of SOEs and private firms. Structurally, the network has evolved from complete fragmentation, to the emergence of an SOE-centered “one superpower and multiple strong players” core–periphery structure, and finally to partial community integration within the core layer. Innovation models have also diverged: SOEs dominate through resource integration and ecosystem orchestration, while private enterprises excel through technological breakthroughs and high patent output. Together, these dual forces form the driving engines of China’s NEV patent innovation landscape.
4.2.3. Patent Collaboration Networks Across Industrial Segments
As shown in Figure 7, the State Grid Corporation of China consistently occupies the central role within all three segments of the NEV industry, underscoring its status as a key innovation orchestrator in the industrial chain. In contrast, patent collaboration in the complete vehicle segment is extremely limited. Within the aftermarket, distinct collaboration communities have emerged, led by Guangdong Brunp Recycling Technology Co., Ltd., Nanchang Cenat New Energy Co., Ltd., and Jingmen GEM Co., Ltd., while Zhejiang Geely Holding Group Co., Ltd. has also established a notable collaboration community.
The component segment constitutes the largest (20,484 nodes) and most active (1,900 connections) network, yet its density is extremely low (0.0000091), reflecting a “large but fragmented” structure. The presence of 19,076 disconnected subgraphs indicates that most innovators operate in isolation or in small clusters. Nevertheless, the largest connected subgraph concentrates 25.11% of all ties, and the relatively high clustering coefficient (0.708) suggests the existence of a tightly-knit core circle. State Grid dominates degree, betweenness, and eigenvector centrality, making it the undisputed “innovation organizer” and “resource allocator” of the component segment. Its dominance is rooted in extensive patenting in charging infrastructure, smart grids, and battery swapping technologies. Tsinghua University plays a bridging role through its high betweenness centrality, while Sinopec’s Zhuhai Dongfang Gas Station exhibits the highest closeness centrality, reinforcing its position as a unique information hub. Table 9 further reveals that leading patent producers, such as Chery AUTOMOBILE, CATL, Jianghuai Automobile, Gotion High-Tech, and EVE Energy, are primarily battery and NEV manufacturers. This contrasts sharply with the cooperation-centered network dominated by State Grid, indicating a structural separation between “technological output” and “ecosystem power.” The component segment thus exhibits a dual structure: (i) a state-capital-driven, wide-ranging collaboration ecosystem centered on State Grid, and (ii) market-driven, R&D-intensive innovation dominated by battery and NEV firms. Together, they define the innovation dynamics of the upstream industry chain.
Table 7.
Key nodes of collaboration networks across three segments.
| Centrality | Component | Complete vehicle | Aftermarket | ||
|---|---|---|---|---|---|
| State Grid Corporation of China | State Grid Corporation of China | State Grid Corporation of China | |||
| Zhejiang Geely Holding Group Company Limited | Guangxi Liugong Machinery Co., Ltd. | Zhejiang Geely Holding Group Company Limited | |||
| Sinopec Sales Co., Ltd. Guangdong Zhuhai Dongfang Gas Station | State Grid Sichuan Electric Power Company | XJ Electric Co., Ltd. | |||
| Tsinghua University | Hangzhou West Lake New Energy Technology Co., Ltd. | Xj Power Co., Ltd. | |||
| Sinopec Sales Co., Ltd. Guangdong Zhuhai Dongfang Gas Station | State Grid Corporation of China | Guangdong Brunp Recycling Technology Co., Ltd. | |||
| BYD Company Limited | Guangxi Liugong Machinery Co., Ltd. | Hunan Brunp Recycling Technology Co., Ltd. | |||
| Gree Electric Appliances, Inc. of Zhuhai | Hangzhou West Lake New Energy Technology Co., Ltd. | Nanchang Cenat New ENERGY Co., Ltd. | |||
| Guangdong Power Grid Corporation | Liuzhou Liugong Forklifts Co., Ltd. | Jingmen GEM Co., Ltd. | |||
| State Grid Corporation of China | State Grid Corporation of China | State Grid Corporation of China | |||
| Tsinghua University | Guangxi Liugong Machinery Co., Ltd. | China Electric Power Research Institute Co., Ltd. | |||
| Northern Altair Nanotechnologies Co., Ltd. | State Grid Sichuan Electric Power Company | China Networks Shanghai Electric Power Company | |||
| GREE ALTAIRNANO NEW ENERGY INC. | Hangzhou West Lake New Energy Technology Co., Ltd. | Zhejiang Geely Holding Group Company Limited | |||
| State Grid Corporation of China | State Grid Corporation of China | State Grid Corporation of China | |||
| China Electric Power Research Institute Co., Ltd. | State Grid Sichuan Electric Power Company | XJ Electric Co., Ltd. | |||
| Tsinghua University | Sichuan Electric Power Vocational and Technical College | Xj Power Co., Ltd. | |||
| State Grid Electric Power Research Institute Co., Ltd. | Guangxi Liugong Machinery Co., Ltd. | XJ Group Corporation |
Table 8.
Structural characteristics of collaboration networks across three segments.
| Structural characteristic | Component | Complete vehicle | Aftermarket |
|---|---|---|---|
| Network density | 0.0000091 | 0.0001996 | 0.0000851 |
| Number of network nodes | 20484 | 470 | 1987 |
| Number of network connections | 1900 | 22 | 168 |
| Connecting times | 5871 | 38 | 358 |
| Average clustering coefficient | 0.708 | 0.926 | 0.82 |
| Average path length | 3.764 | 1.083 | 2.056 |
| Number of connected subgraphs | 19076 | 451 | 1873 |
| Number of nodes of the maximal connected subgraph | 290(1.42%) | 4(0.85%) | 37(1.86%) |
| Number of connections of the maximal connected subgraph | 477(25.11%) | 4(18.18%) | 68(40.48%) |
| Connecting times of the maximal connected subgraph | 1110 | 4 | 141 |
Table 9.
Top 20 applicants by granted patents across three segments.
| Component | Complete vehicle | Aftermarket | |||
|---|---|---|---|---|---|
| Applicant | Num. | Applicant | Num. | Applicant | Num. |
| Chery AUTOMOBILE Co., Ltd. | 1965 | Anhui Heli Co., Ltd. | 267 | Aodong New Energy Co., Ltd. | 552 |
| Contemporary Amperex Technology Co., Ltd. | 1855 | Hangcha Group Co., Ltd. | 71 | Chery AUTOMOBILE Co., Ltd. | 210 |
| Anhui Jianghuai Automobile Group Corp.,Ltd. | 1254 | Beidou Aerospace Automotive (Beijing) Co., Ltd. | 26 | Anhui Xinnangang Automotive Interiors Co., Ltd. | 120 |
| Eve Power Co., Ltd. | 1163 | Banyitong Science & Technology Developing Co., Ltd. | 23 | State Grid Corporation of China | 109 |
| Hefei Gotion HIGH-TECH POWER ENERGY Co., Ltd. | 1092 | Anhui Airuite New Energy Special Purpose Vehicle Co., Ltd. | 21 | Beijing Taisheng Tiancheng Technology Co., Ltd. | 93 |
| FAW Group Co., Ltd. | 1088 | China DRAGON Development HOLDINGS Limited | 20 | Shanghai Dianba New Energy Technology Co., Ltd. | 76 |
| BYD Company Limited | 943 | Luoyang Dahe New Energy Vehicle Co., Ltd. | 20 | Hunan Brunp Recycling Technology Co., Ltd. | 66 |
| Guangzhou AUTOMOBILE Group Co., Ltd. | 841 | Anhui Yufeng Equipment Co., Ltd. | 18 | Huawei Technologies Co.,Ltd. | 64 |
| Zhejiang Geely Holding Group Company Limited | 803 | FAW Group Co., Ltd. | 16 | Bozhon PRECISION Industry Technology Co., Ltd. | 62 |
| Honeycomb Energy Technology Co., Ltd. | 790 | Henan Senyuan Heavy Industry Co., Ltd. | 14 | Hunan Jinkai Recycling Technology Co., Ltd. | 60 |
| PAN ASIA Technical AUTOMOTIVE Center Co., Ltd. | 716 | Zhengzhou BAK New ENERGY AUTOMOBILE Co., Ltd. | 13 | FAW Group Co., Ltd. | 60 |
| Ford Global Technologies, LLC | 629 | Zhejiang Haoli Electric Vehicle Manufacturing Co., Ltd. | 13 | Guangdong Brunp Recycling Technology Co., Ltd. | 58 |
| State Grid Corporation of China | 556 | Anhui Jiangtian Sanitation Equipment Co., Ltd. | 13 | Shenzhen FINE Automation Co., Ltd. | 52 |
| OptimumNano Energy Co.,Ltd | 555 | Nanjing Jiayuan SPECIAL Electric Vehicles Manufacture Co., Ltd. | 12 | Anhui Jianghuai Automobile Group Corp.,Ltd. | 50 |
| Xiamen Hithium Energy Storage Technology Co., Ltd. | 547 | Hangzhou West Lake New Energy Technology Co., Ltd. | 11 | Zhejiang Jizhi New Energy Vehicle Technology Co., Ltd. | 49 |
| Chongqing Changan Automobile Company Limited | 502 | Kion Baoli (Jiangsu)Forklift Co., Ltd. | 11 | NIO Technology (Anhui) Co., Ltd. | 48 |
| Huating (Hefei) Hybrid Technology Co., Ltd. | 483 | Chongqing Bingding Electromechanical Co., Ltd. | 11 | Ningbo Shintai Machines Co., Ltd. | 48 |
| Dalian Institute of Chemical Physics, Chinese Academy of Sciences | 463 | Anhui Jianghuai Automobile Group Corp.,Ltd. | 10 | Zhejiang Geely Holding Group Company Limited | 47 |
| SINOTRUK Jinan Power Co., Ltd. | 461 | Anhui Jianghuai Heavy Construction Machinery Co., Ltd. | 10 | Chengdu Monolithic Power Systems Co., Ltd. | 45 |
| Evergrande New Energy Technology (Shenzhen) Co., Ltd. | 459 | Shanxi TianJishan Electric Vehicle and Vessel Co., Ltd. | 10 | Chengdu Iyasaka Technology Development Co., Ltd. | 41 |
The complete vehicle segment presents the weakest network structure, with only 470 nodes and 22 connections. Despite a slightly higher density (0.0001996), its maximal connected subgraph is extremely small (4 nodes, 0.85%), and collaboration is nearly absent. Yet, its clustering coefficient reaches 0.926, indicating that the very few collaborations occur in tightly closed circles, such as intra-group subsidiaries or limited university–industry partnerships. State Grid and Guangxi Liugong appear among central actors primarily due to cross-industry activities in specialized vehicles (e.g., forklifts, sanitation vehicles) rather than mainstream passenger or commercial vehicles. The lack of a unifying collaboration hub is striking. Table 9 confirms this insularity: Anhui Heli, a forklift manufacturer, ranks first with only 267 patents, far below the thousand-level counts seen in the component segment. The overall profile is fragmented and small-scale, reflecting fierce competition, dispersed resources, and a strong preference for closed, independent R&D strategies. The complete vehicle segment exemplifies an “innovation island” model, where firms erect high technological barriers and exhibit minimal willingness to collaborate, partly due to high integration complexity, confidentiality requirements, and market pressures.
The aftermarket segment is moderate in scale (1,987 nodes) but more active in collaboration (168 connections) compared to the complete vehicle segment. Its largest connected subgraph accounts for 40.48% of ties, with a high clustering coefficient (0.82), indicating the emergence of specialized innovation communities with dense internal linkages. The power structure here has shifted significantly: while State Grid remains important, battery recycling and materials regeneration firms, such as Guangdong Brunp, GEM, and Cenat, have risen to prominence in closeness centrality rankings. Geely also appears across multiple rankings due to its diversified deployment. These findings highlight that innovation in the aftermarket segment is now centered on “battery recycling, second-life applications, and materials recovery,” with specialized circular-economy firms replacing traditional giants as key collaboration hubs. Table 9 corroborates this trend: Aodong New Energy, focusing on battery-swapping, tops the list, alongside Brunp and GEM. This suggests that with the growing stock of NEVs, end-of-life battery management has become a technology-intensive and innovation-driven new frontier, attracting substantial patent activity. The aftermarket thus exemplifies a cluster-oriented innovation model driven by emerging market demand and led by specialized firms.
Overall, innovation activities in China’s NEV industry chain are marked by pronounced “segmentation across segments”: a dual structure of cooperation and independent R&D in components, a closed and inward-looking pattern in complete vehicles, and a rapidly growing, cluster-based ecosystem in the aftermarket. Bridging these segments—particularly fostering openness among complete vehicle firms and integrating them into the broader innovation ecosystem—remains a critical challenge for future industrial policy. Although State Grid plays a central role in both the component and aftermarket segments, its influence has yet to penetrate the complete vehicle core, underscoring the complexities of achieving full-chain collaboration.
4.2.4. Patent Collaboration Networks of Domestic and Foreign Applicants
Figure 8 illustrates the patent collaboration communities of domestic and foreign applicants in China’s NEV industry. Compared with the domestic collaboration communities, the communities formed by foreign applicants are significantly smaller in scale, and their central nodes are primarily automobile manufacturers. The two largest foreign applicant communities are led by entities from South Korea and Japan, with the Japanese cluster also integrating German applicants. In contrast, the domestic collaboration communities largely mirror the structure observed in Figure 1.
Table 10 presents the key nodes of domestic and foreign collaboration networks. Table 11 summarizes their structural characteristics. The domestic network is vast, with 20,716 nodes, yet extremely sparse (density = 0.0000088), exhibiting a typical core–periphery structure. The presence of 19,342 disconnected subgraphs indicates that over 93% of innovation actors remain isolated or at the periphery. However, the largest connected subgraph aggregates 27.17% of all connections, coupled with a high clustering coefficient (0.726), demonstrating the existence of a tightly integrated core power circle. Consistent with overall network analysis, SGCC dominates degree, betweenness, and eigenvector centralities, confirming its role as the absolute hub and gatekeeper of innovation resources. This core circle is composed of state-owned enterprises (e.g., State Grid, Sinopec), large private firms (e.g., Geely, Gree), and elite universities (e.g., Tsinghua University), forming a relatively closed cooperation system strongly shaped by state capital and policy influence. Sinopec Zhuhai Gas Station again emerges as a unique information hub with the highest closeness centrality.
Patent output data in Table 12 highlight the domestic network’s vitality. Leading firms such as Chery, CATL, and JAC each hold more than 1,000 granted patents, far surpassing any single foreign applicant. This indicates that, in terms of patent output volume, Chinese firms, supported by industrial policies and market-driven incentives, hold an overwhelming advantage. In summary, the domestic network can be characterized as a policy- and state-capital-driven mega-ecosystem: a powerful yet relatively closed core orchestrates resource flows, surrounded by a vast periphery of marginalized small and medium actors. Overall, patent quantity has experienced explosive growth.
In contrast, the foreign collaboration network is much smaller (629 nodes) but considerably denser (density = 0.0003949), suggesting relatively frequent collaboration among foreign entities operating in China. Nonetheless, its largest connected subgraph includes only 15 nodes, implying that collaboration is confined to small, elite circles with limited integration into the broader domestic innovation ecosystem. As shown in Table 10, network power is highly concentrated in traditional automotive giants such as Hyundai, Toyota, Kia, and Audi. Importantly, the Korea Advanced Institute of Science and Technology (KAIST) ranks high in betweenness and eigenvector centralities, reflecting South Korea’s model of close industry–university–research collaboration. The foreign network’s structure follows a “firm + core supplier (e.g., ThyssenKrupp) + leading university” configuration—a tightly knit, technology- and supply-chain-based exclusive club.
Patent output comparisons in Table 12 further reinforce this contrast. The top foreign applicant, Ford (629 granted patents), holds fewer patents than China’s 13th-ranked applicant, underscoring the scale gap. This may be related to the more selective patenting strategies of multinational corporations in the Chinese market. In sum, the foreign network constitutes a small, cohesive, high-barrier “elite club” that operates largely in parallel to, rather than integrated with, the domestic innovation ecosystem—an ecological separation that reflects limited embeddedness.
Notably, cross-ecosystem collaboration remains minimal. As shown by Table 2 and Table 11, there are only 24 collaboration links and 29 collaboration events between domestic and foreign applicants—an extremely low level given the vast sizes of the two networks (20,716 vs. 629 nodes). This provides quantitative evidence of the community segregation observed in Figure 8.
This finding indicates that, despite active foreign patent deployment in China, their innovation activities remain largely detached from the domestically dominated ecosystem. The result is a form of parallel development, with limited effective, deep, and strategic technological exchange. Such weak connectivity highlights potential “decoupling” risks in the NEV industry’s global innovation chain. For China, this suggests that while domestic firms have achieved numerical dominance in patents, future progress requires greater openness, higher-level international collaboration mechanisms, and the integration of global innovators into the core ecosystem. Strengthening such cross-boundary innovation loops will be essential to enhancing the global competitiveness and resilience of China’s NEV industry.
5. Conclusions and Future Research
5.1. Conclusions
This study develops the ISPCM for China’s NEV industry by integrating expert knowledge with the LLM. Using this classification, we systematically identify NEV patents filed between 2001 and 2022 and, for the first time, construct and analyze the patent collaboration network of China’s NEV industry across three dimensions: temporal evolution, industrial chain, and applicant nationality. The analysis reveals the structural mechanisms underpinning China’s global leadership in the NEV industry. The key findings are summarized as follows:
- 1)
- Explosive patent growth and sustained innovation dynamism
Patent filings in China’s NEV industry exhibit rapid and continuous growth, evolving through three distinct stages: the initial development stage (2001–2008), the accelerated growth stage (2009–2017), and the maturity stage (2018–2022). Both policy interventions (e.g., the “Ten Cities, Thousand Vehicles” program) and market expansion serve as critical drivers. Domestic applicants dominate the landscape, with invention patents prevailing in the early technology accumulation stage, and utility model patents prevailing during the industrialization stage. This reflects a shift from technology breakthroughs to application-driven innovation, and from autonomous exploration to large-scale iterative development.
- 2)
- A “dual-circulation” innovation ecosystem dominated by state-owned capital
The Chinese NEV industry has formed a vast but sparsely connected patent collaboration network, displaying distinct small-world and scale-free properties. The network is characterized by a highly oligopolistic “one-super, many-strong” power structure, with the SGCC at its absolute core. State-owned capital dominates the network by organizing infrastructure development (e.g., charging networks) and integrating industrial, academic, and research resources, functioning as the central “innovation orchestrator.” This demonstrates the decisive role of state strategy and policy in shaping innovation ecosystems—a hallmark of the Chinese model. Market-driven private independent innovation represents another core feature of the Chinese model.
- 3)
-
Dynamic network evolution reveals three development stages
- Initial Development Period (2001–2008): Led by foreign firms (e.g., Toyota) and universities, with fragmented collaborations.
- Rapid Growth Period (2009–2017): SOEs such as SGCC reshape the network into a “core–periphery” structure through policy leverage and infrastructure dominance.
- Mature Development Period (2018–2022): The core continues to consolidate by absorbing top university communities, while private firms such as CATL emerge as major technology contributors. This results in a “dual innovation model,” where SOEs orchestrate the ecosystem and private enterprises focus on specialized R&D.
- 4)
- Divergent innovation logics across the industrial chain
Component manufacturing serves as the main innovation battlefield, reflecting the above-mentioned dual structure. Complete vehicle manufacturing remains an “innovation island,” with highly limited collaboration and insular competition. In contrast, the aftermarket (e.g., battery recycling) fosters cluster-based innovation communities led by specialized firms such as Brunp Recycling and GEM. Notably, the influence of SGCC does not effectively penetrate the vehicle-manufacturing stage, underscoring the complexity of achieving full value-chain coordination.
- 5)
- Parallel global trajectories with insufficient Sino-foreign integration
Domestic and foreign applicants exhibit an evident “niche segregation” in China’s NEV patent ecosystem. Domestic networks, shaped by policy, represent a vast “mega-ecosystem” with overwhelming quantitative dominance. By contrast, foreign networks function as exclusive “elite clubs” centered on automotive giants, emphasizing high-quality patents (e.g., inventions). Cross-ecosystem collaboration is minimal (only 24 links, with 29 joint filings), revealing a lack of deep, strategic knowledge exchange and exposing potential “decoupling” risks.
In summary, China’s NEV leadership does not stem from a single technological breakthrough but from the successful construction of a dual-circulation development model—state-owned capital orchestrates the innovation ecosystem while market forces drive application-oriented R&D. This model has enabled efficient resource integration, rapid application iteration, and large-scale market expansion. Nevertheless, challenges remain in achieving original innovation, full industrial chain coordination, and deeper international integration.
5.2. Future Research
Building on the findings and limitations of this study, future research may advance in the following directions:
- 1)
- Dynamic modeling of collaboration networks
This study primarily employed static and stage-wise analysis. Future work could adopt temporal network analysis or advanced approaches such as Exponential Random Graph Models to more accurately simulate the mechanisms of collaboration formation and predict future structural evolution.
- 2)
- Causal mechanisms linking network structure and innovation performance
While this study identified mismatches between “ecological positions” and innovation outputs, causal relationships remain underexplored. Future research may integrate panel data regressions or longitudinal case studies to quantitatively assess how network positions (e.g., centrality) affect firms’ innovation outcomes, such as patent quality and new product revenues, thereby providing more targeted policy insights.
- 3)
- Expanding global comparative perspectives
This study focuses on China. Future work could collect patent data from the United States, Germany, Japan, and other countries to construct comparative NEV collaboration networks. Cross-national comparisons of network structures, core nodes, and evolutionary pathways would yield deeper insights into the strengths and weaknesses of different innovation systems and inform China’s global NEV strategies.
- 4)
- Integrating multi-source data to enrich analysis
Future studies could merge patent data with information on R&D investment, government subsidies, talent mobility, and market performance to build a more comprehensive framework. For example, do subsidies effectively improve network connectivity? How does university talent output correlate with corporate innovation productivity?
- 5)
- Advancing natural language processing (NLP) in patent analysis
While this study applied large-model-based classification, future work could leverage NLP techniques for in-depth patent text mining to identify key technology themes, detect technological gaps, and map technological trajectories. Incorporating such content-based insights into network analysis would enhance the predictive and strategic value of research findings.
Through these directions, future research can enrich both the theoretical understanding of complex innovation networks and the practical toolkit for policy and corporate strategy. Ultimately, this will provide deeper insights and stronger decision support for optimizing innovation ecosystems, shaping technological roadmaps, and advancing international cooperation in the NEV industry.
Funding
This research was funded by University-level Scientific Research Startup Project: grant number KYQD-2024035, Hefei City Project: grant number NO.2023SGJ014 and Joint Research Project of the National Natural Science Foundation of China: grant number U23B2031.
References
- Wu, X.; Duan, J.; Pan, Y.; Li, M. Medical Knowledge Graph: Data Sources, Construction, Reasoning, and Applications. Big Data Mining and Analytics 2023, 6, 201–217. [Google Scholar] [CrossRef]
- Henriques, R.; Ferreira, A.; Castelli, M. A Use Case of Patent Classification Using Deep Learning with Transfer Learning. Journal of Data and Information Science 2022, 7, 49–70. [Google Scholar] [CrossRef]
- Roudsari1, A.H.; Afshar1, J.; Lee1, W.; Lee, S. PatentNet: Multi-Label Classification of Patent Documents Using Deep Learning Based Language Understanding. Scientometrics 2022, 127, 207–231. [Google Scholar] [CrossRef]
- Bekamiri, H.; Hain, D.S.; Jurowetzki, R. Patentsberta: A Deep Nlp Based Hybrid Model for Patent Distance and Classification Using Augmented Sbert. Technol Forecast Soc Change 2024, Sep 1, 123536. [Google Scholar] [CrossRef]
- Li, R.; Yu, W.; Huang, Q.; Liu, Y. Patent Text Classification Based on Deep Learning and Vocabulary Network. International Journal of Advanced Computer Science and Applications 2023, 14. [Google Scholar] [CrossRef]
- Huang, Y.; Wang, H.; Ren, X.-L.; Lü, L. Identifying Key Players in Complex Networks via Network Entanglement. Commun Phys 2024, 7, 19. [Google Scholar] [CrossRef]
- Strogatz, S.H. Exploring Complex Networks. Nature 2001, 410, 268–276. [Google Scholar] [CrossRef]
- Zhao, A.P.; Li, S.; Li, Z.; Wang, Z.; Fei, X.; Hu, Z.; Alhazmi, M.; Yan, X.; Wu, C.; Lu, S.; et al. Electric Vehicle Charging Planning: A Complex Systems Perspective. IEEE Trans Smart Grid 2024, 1–1. [Google Scholar] [CrossRef]
- Brown, T.B.; Mann, B.; Ryder, N.; Subbiah, M.; Kaplany, J.; Dhariwal, P.; Neelakantan, A.; Shyam, P.; Sastry, G.; Askell, A.; et al. Language Models Are Few-Shot Learners. Adv Neural Inf Process Syst 2020, 33, 1877–1901. [Google Scholar]
- Devlin, J.; Chang, M.-W.; Lee, K.; Toutanova, K. BERT: Pre-Training of Deep Bidirectional Transformers for Language Understanding. In Proceedings of the Proceedings of the 2019 Conference of the North American Chapter of the Association for Computational Linguistics: Human Language Technologies; 2019; pp. 4171–4186.
- Xu, D.; Zhang, Z.; Lin, Z.; Wu, X.; Zhu, Z.; Xu, T.; Zhao, X.; Zheng, Y.; Chen, E. Multi-Perspective Improvement of Knowledge Graph Completion with Large Language Models. In Proceedings of the The 2024 Joint International Conference on Computational Linguistics, Language Resources and Evaluation (LREC-COLING 2024); European Language Resources Association (ELRA); 2024; pp. 11956–11968. [Google Scholar]
- Arenas, A.; Fernández, A.; Gómez, S. Analysis of the Structure of Complex Networks at Different Resolution Levels. New J Phys 2008, 10, 053039. [Google Scholar] [CrossRef]
- Yuan, Y.; Yuan, X. Does the Development of Fuel Cell Electric Vehicles Be Reviving or Recessional? Based on the Patent Analysis. Energy 2023, 272. [Google Scholar] [CrossRef]
- Liu, Z.; Xiang, X.; Feng, J. Tracing Evolutionary Trajectory of Charging Technologies in Electric Vehicles: Patent Citation Network Analysis. Environ Dev Sustain 2024, 26, 12789–12813. [Google Scholar] [CrossRef]
- Borgatti, S.P.; Mehra, A.; Brass, D.J.; Labianca, G. Network Analysis in the Social Sciences. Science (1979) 2009, 323, 892–895. [Google Scholar] [CrossRef] [PubMed]
- Huang, L.; Xu, Y.; Pan, X.; Zhang, T. Green Technology Collaboration Network Analysis of China’s Transportation Sector: A Patent-Based Analysis. Sci Program 2021, 2021, 1–12. [Google Scholar] [CrossRef]
- Liu, W.; Tao, Y.; Bi, K. Exploring Temporal and Spatial Evolution of the Patent Collaboration Network: A Case Study of Smart Grid Field in China. IEEE Trans Eng Manag 2020, PP, 1–16. [Google Scholar] [CrossRef]
- Wang, Z.; Wang, C.; Feng, T.; Wang, Y. The Influence of the Evolution of the Innovative Network on Technical Innovation from the Perspective of Energy Transformation: Based on Analysis of the New Energy Vehicle Industry in China. Sustainability 2023, 15, 4237. [Google Scholar] [CrossRef]
- Li, B.; Li, N.; Liu, Q.; Liu, X. Innovation Network for the New Energy Vehicle Industry: Analysis Based on National and Yangtze River Delta Regional Patent Data. Asian Journal of Technology Innovation 2025, 1–18. [Google Scholar] [CrossRef]
- Hu, F.; Wei, S.; Qiu, L.; Hu, H.; Zhou, H. Innovative Association Network of New Energy Vehicle Charging Stations in China: Structural Evolution and Policy Implications. Heliyon 2024, 10, e24764. [Google Scholar] [CrossRef]
- Chen, Y.; Cho, S.S. Exploring Electric Vehicle Patent Trends through Technology Life Cycle and Social Network Analysis. Sustainability 2024, 16, 7797. [Google Scholar] [CrossRef]
- Li, X.; Peng, Y.; He, Q.; He, H.; Xue, S. Development of New-Energy Vehicles under the Carbon Peaking and Carbon Neutrality Strategy in China. Sustainability 2023, 15, 7725. [Google Scholar] [CrossRef]
- Tong, T.W.; Zhang, K.; He, Z.-L.; Zhang, Y. What Determines the Duration of Patent Examination in China? An Outcome-Specific Duration Analysis of Invention Patent Applications at SIPO. Res Policy 2018, 47, 583–591. [Google Scholar] [CrossRef]
- Kunnakorntammanop, S.; Thepwuttisathaphon, N.; Thaicharoen, S. An Experience Report on Building a Big Data Analytics Framework Using Cloudera CDH and RapidMiner Radoop with a Cluster of Commodity Computers. In Proceedings of the International conference on soft computing in data science; Springer Singapore: Singapore, August 28 2019; pp. 208–222.
- Yang, A.; Li, A.; Yang, B.; Zhang, B.; Hui, B.; Zheng, B.; Yu, B.; Gao, C.; Huang, C.; Lv, C.; et al. Qwen3 Technical Report. 2025.
- Chen, J.; Bao, R.; Zheng, H.; Qi, Z.; Wei, J.; Hu, J. Optimizing Retrieval-Augmented Generation with Elasticsearch for Enhanced Question-Answering Systems. 2024.
- Yang, A.; Xiao, B.; Wang, B.; Zhang, B.; Bian, C.; Yin, C.; Lv, C.; Pan, D.; Wang, D.; Yan, D.; et al. Baichuan 2: Open Large-Scale Language Models. 2025.
- Zeng, A.; Xu, B.; Wang, B.; Zhang, C.; Yin, D.; Zhang, D.; Rojas, D.; Feng, G.; Zhao, H.; Lai, H.; et al. ChatGLM: A Family of Large Language Models from GLM-130B to GLM-4 All Tools. 2024.
- Deng, J.; Lin, Y. The Benefits and Challenges of ChatGPT: An Overview. Frontiers in Computing and Intelligent Systems 2023, 2, 81–83. [Google Scholar] [CrossRef]
- Wang, J.; Li, H.; Lyu, X.; Zhu, J.; Wang, Z. An enterprise attribution method and attribution system for industrial nodes 2024, 1–4.
- Miao, R.; Chen, X.; Hu, L.; Zhang, Z.; Wan, M.; Zhang, Q.; Zhao, C. PatSTEG: Modeling Formation Dynamics of Patent Citation Networks via The Semantic-Topological Evolutionary Graph. In Proceedings of the 2023 IEEE International Conference on Data Mining (ICDM), Shanghai,China; 2023; pp. 1229–1234. [Google Scholar]
- Sasaki, Y.; Kawai, D.; Kitamura, S. The Anatomy of Tweet Overload: How Number of Tweets Received, Number of Friends, and Egocentric Network Density Affect Perceived Information Overload. Telematics and Informatics 2015, 32, 853–861. [Google Scholar] [CrossRef]
- Li, Y.; Shang, Y.; Yang, Y. Clustering Coefficients of Large Networks. Inf Sci (N Y) 2017, 382, 350–358. [Google Scholar] [CrossRef]
- Mao, G.; Zhang, N. Fast Approximation of Average Shortest Path Length of Directed BA Networks. Physica A: Statistical Mechanics and its Applications 2017, 466, 243–248. [Google Scholar] [CrossRef]
- Singh, R.; Chakraborty, A.; Manoj, B.S. GFT Centrality: A New Node Importance Measure for Complex Networks. Physica A: Statistical Mechanics and its Applications 2017, 487, 185–195. [Google Scholar] [CrossRef]
- Tseng, C.; Lee, S. Fractional Graph Fourier Transform Centrality and Its Application to Social Network. In Proceedings of the In 2024 IEEE 4th International Conference on Electronic Communications, Internet of Things and Big Data (ICEIB), April 19 2024; pp. 105–109. [Google Scholar]
- Zhang, G.; Duan, H.; Zhou, J. Network Stability, Connectivity and Innovation Output. Technol Forecast Soc Change 2017, 114, 339–349. [Google Scholar] [CrossRef]
- Liu, W.; Tao, Y.; Bi, K. Exploring Temporal and Spatial Evolution of the Patent Collaboration Network: A Case Study of Smart Grid Field in China. IEEE Trans Eng Manag 2020, PP, 1–16. [Google Scholar] [CrossRef]
- Mullor-sebastián, A. The Product Life Cycle Theory: Empirical Evidence. J Int Bus Stud 1983, 14, 95–105. [Google Scholar] [CrossRef]
- Humphries, M.D.; Gurney, K. Network ‘Small-World-Ness’: A Quantitative Method for Determining Canonical Network Equivalence. PLoS One 2008, 3, e0002051. [Google Scholar] [CrossRef]
- Yan, C. Network Model with Scale-Free, High Clustering Coefficients, and Small-World Properties. J Appl Math 2023, 2023, 1–11. [Google Scholar] [CrossRef]
Figure 1.
Research Framework.
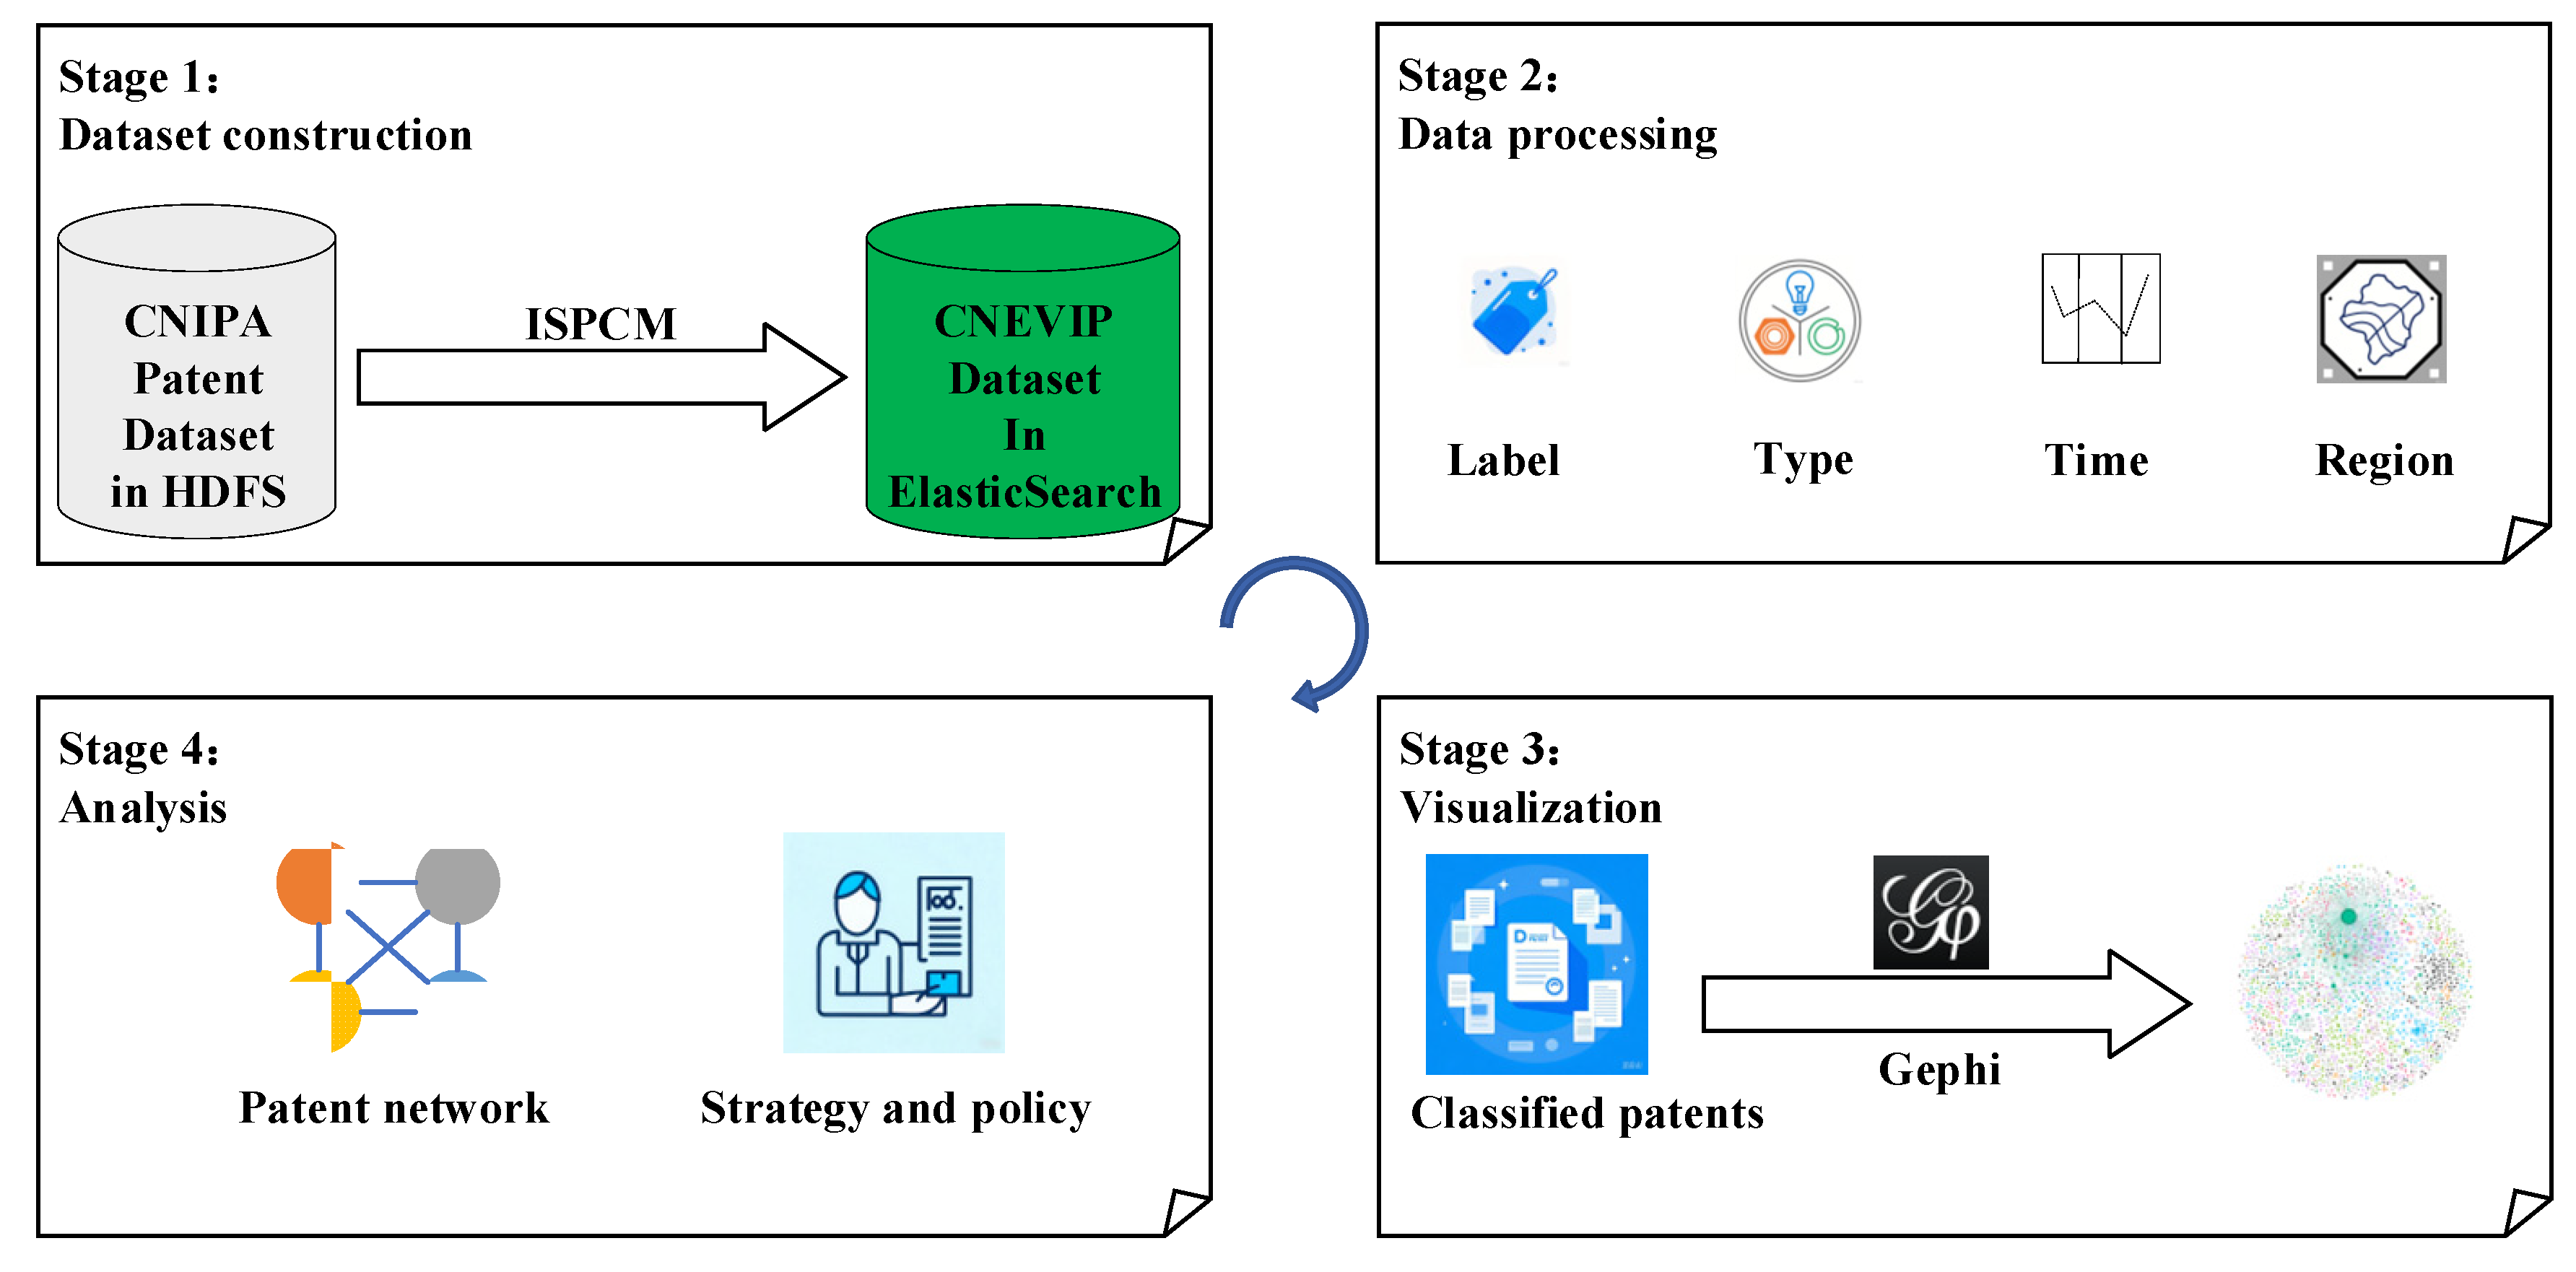
Figure 2.
Statistical overview of patents in China NEV industry.
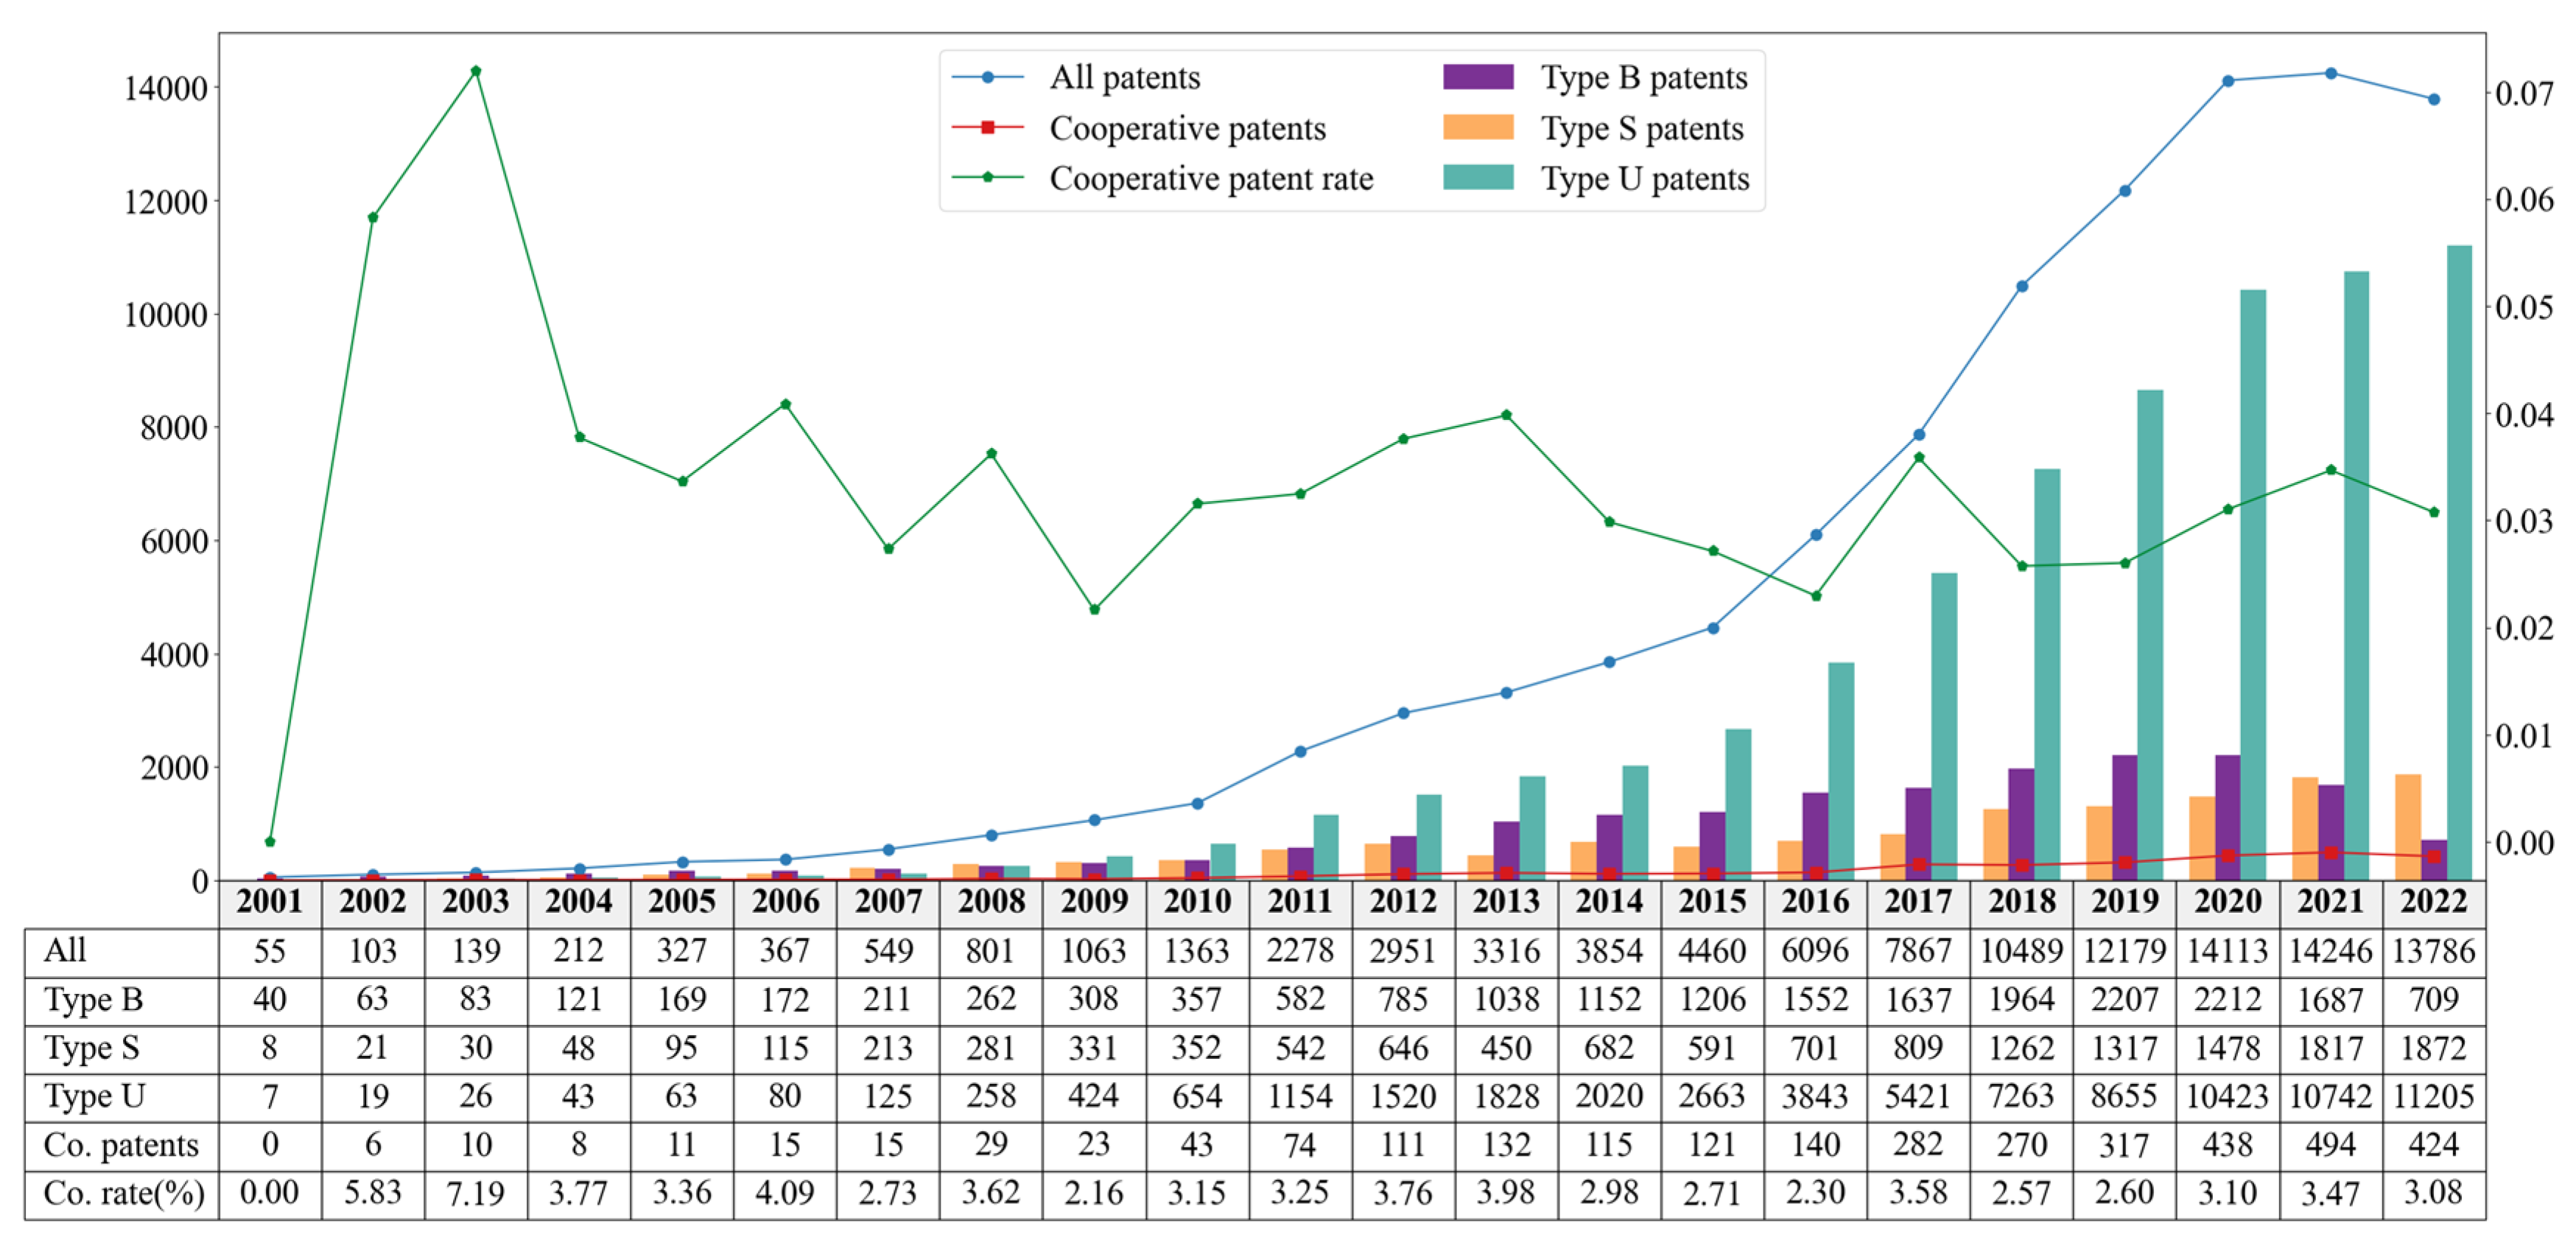
Figure 3.
Patent statistics across three segments of China NEV industry.
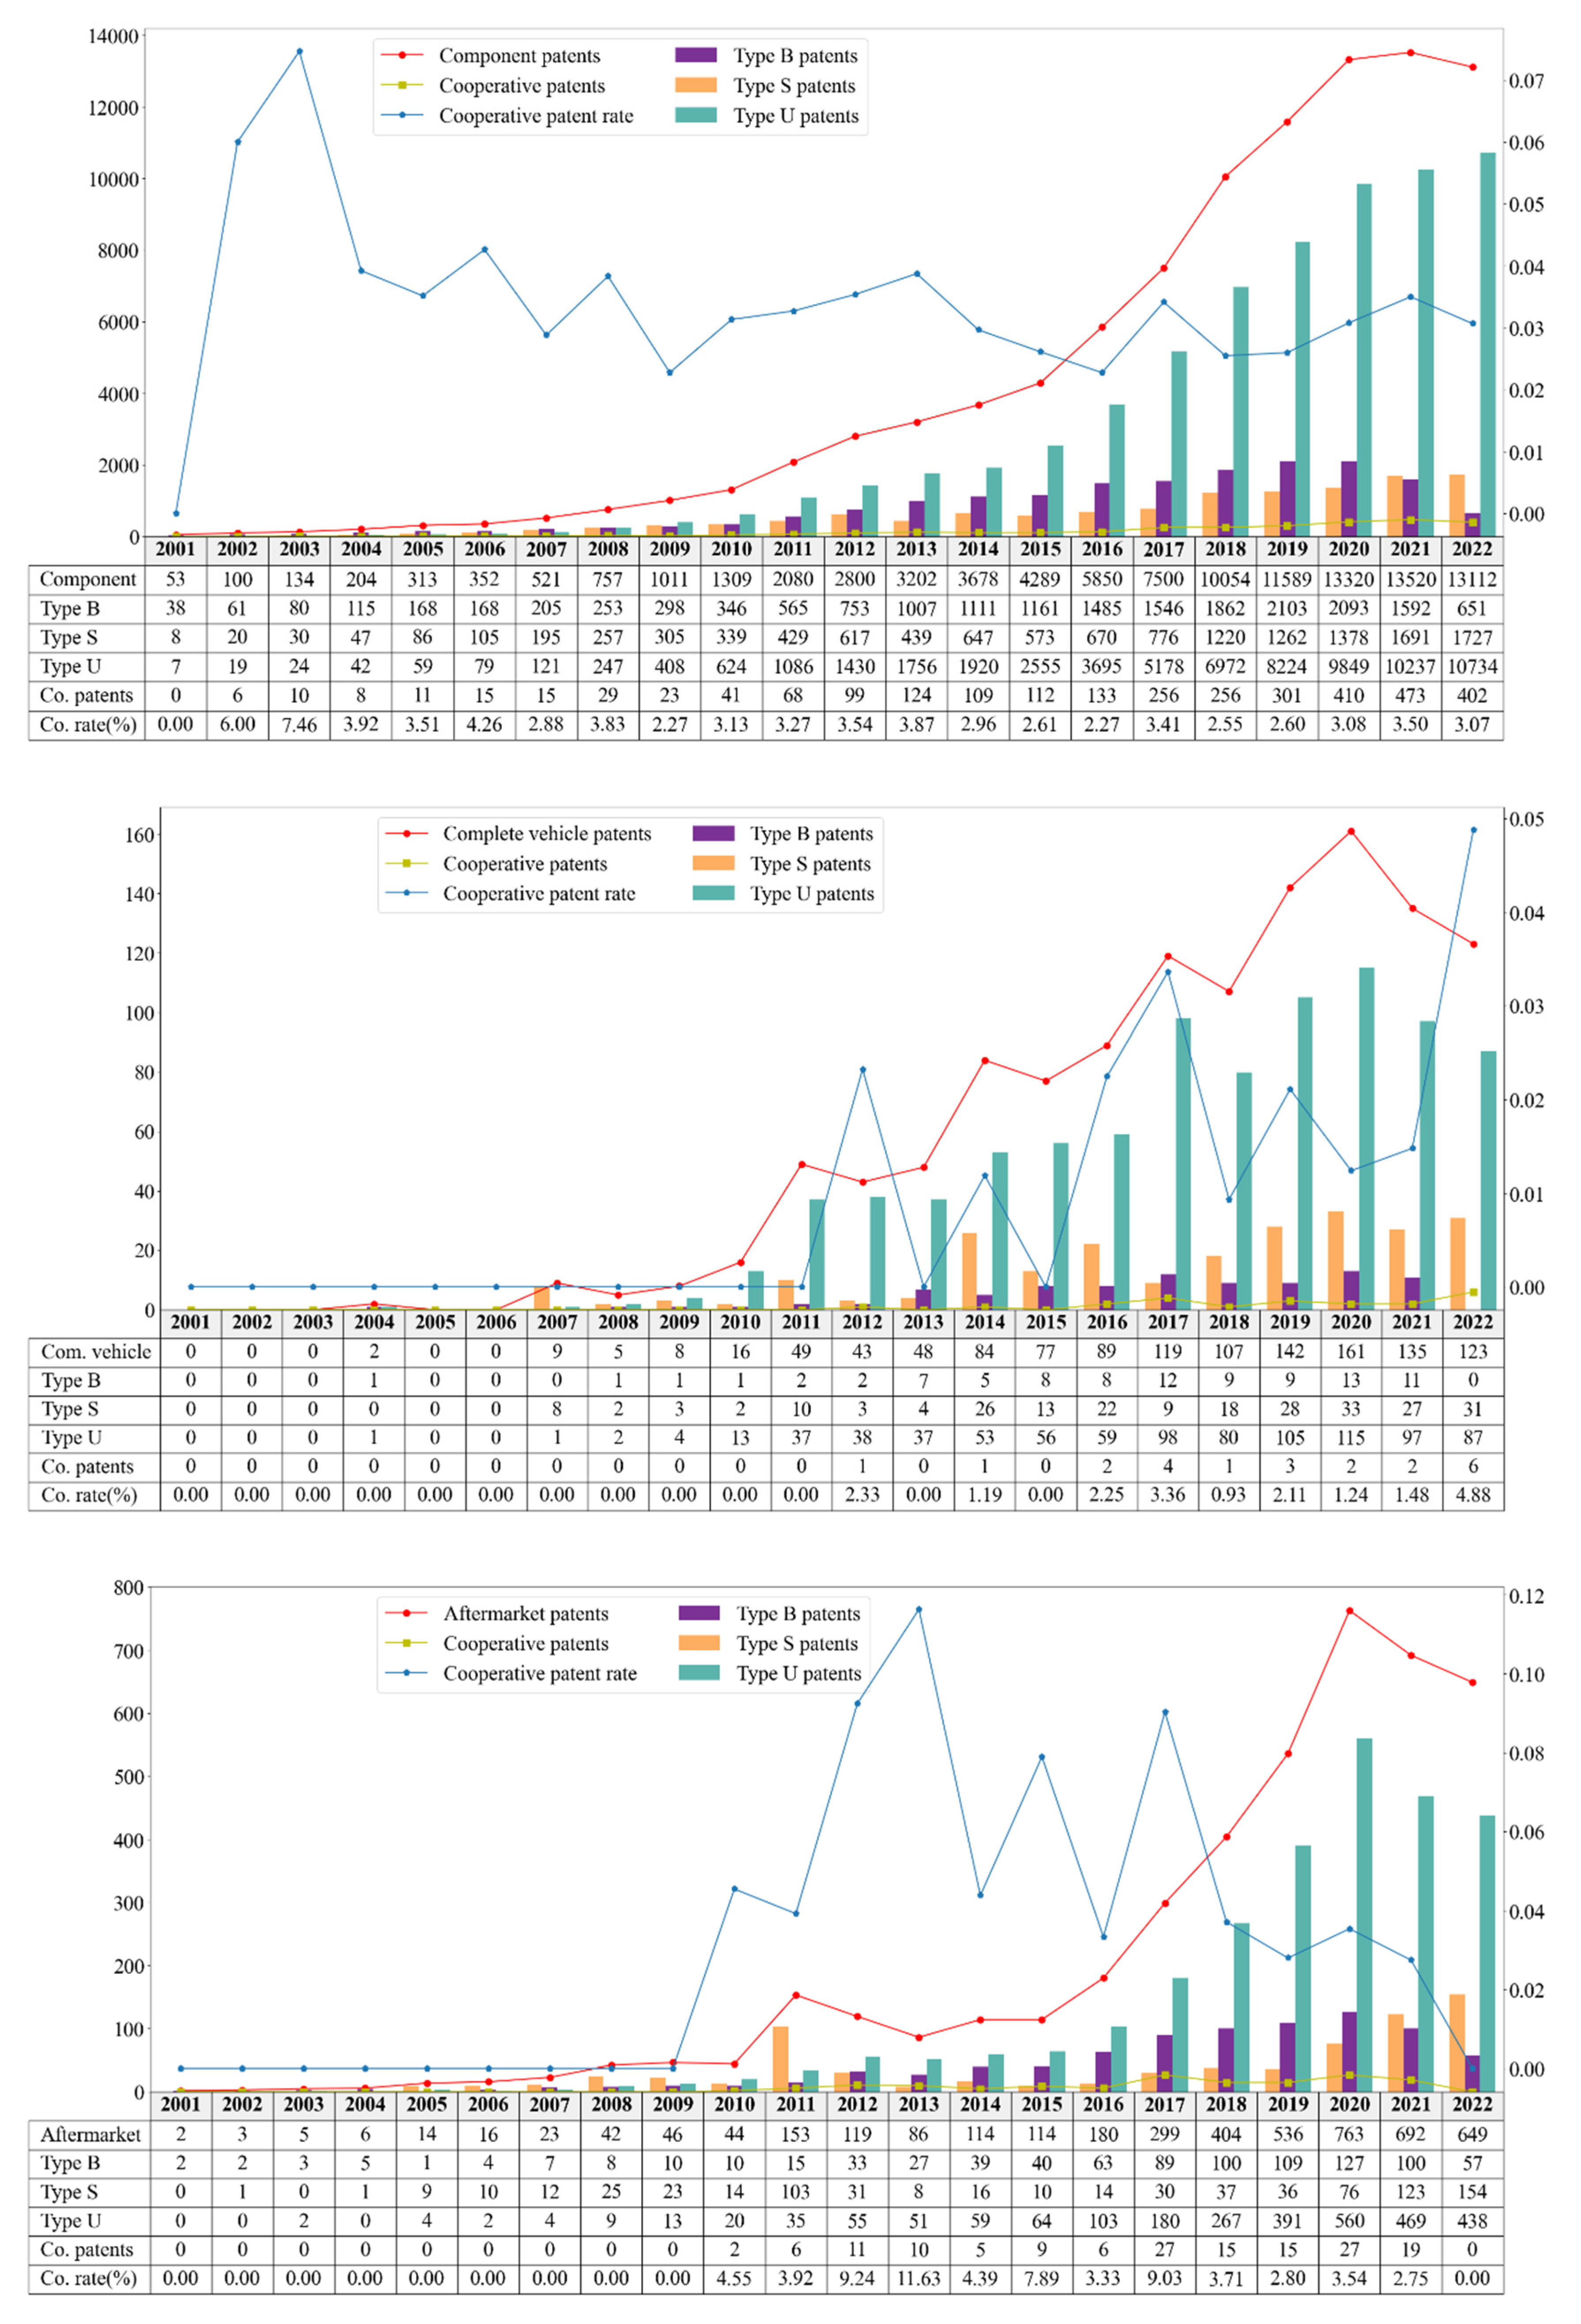
Figure 5.
Major communities in the NEV patent cooperation network.
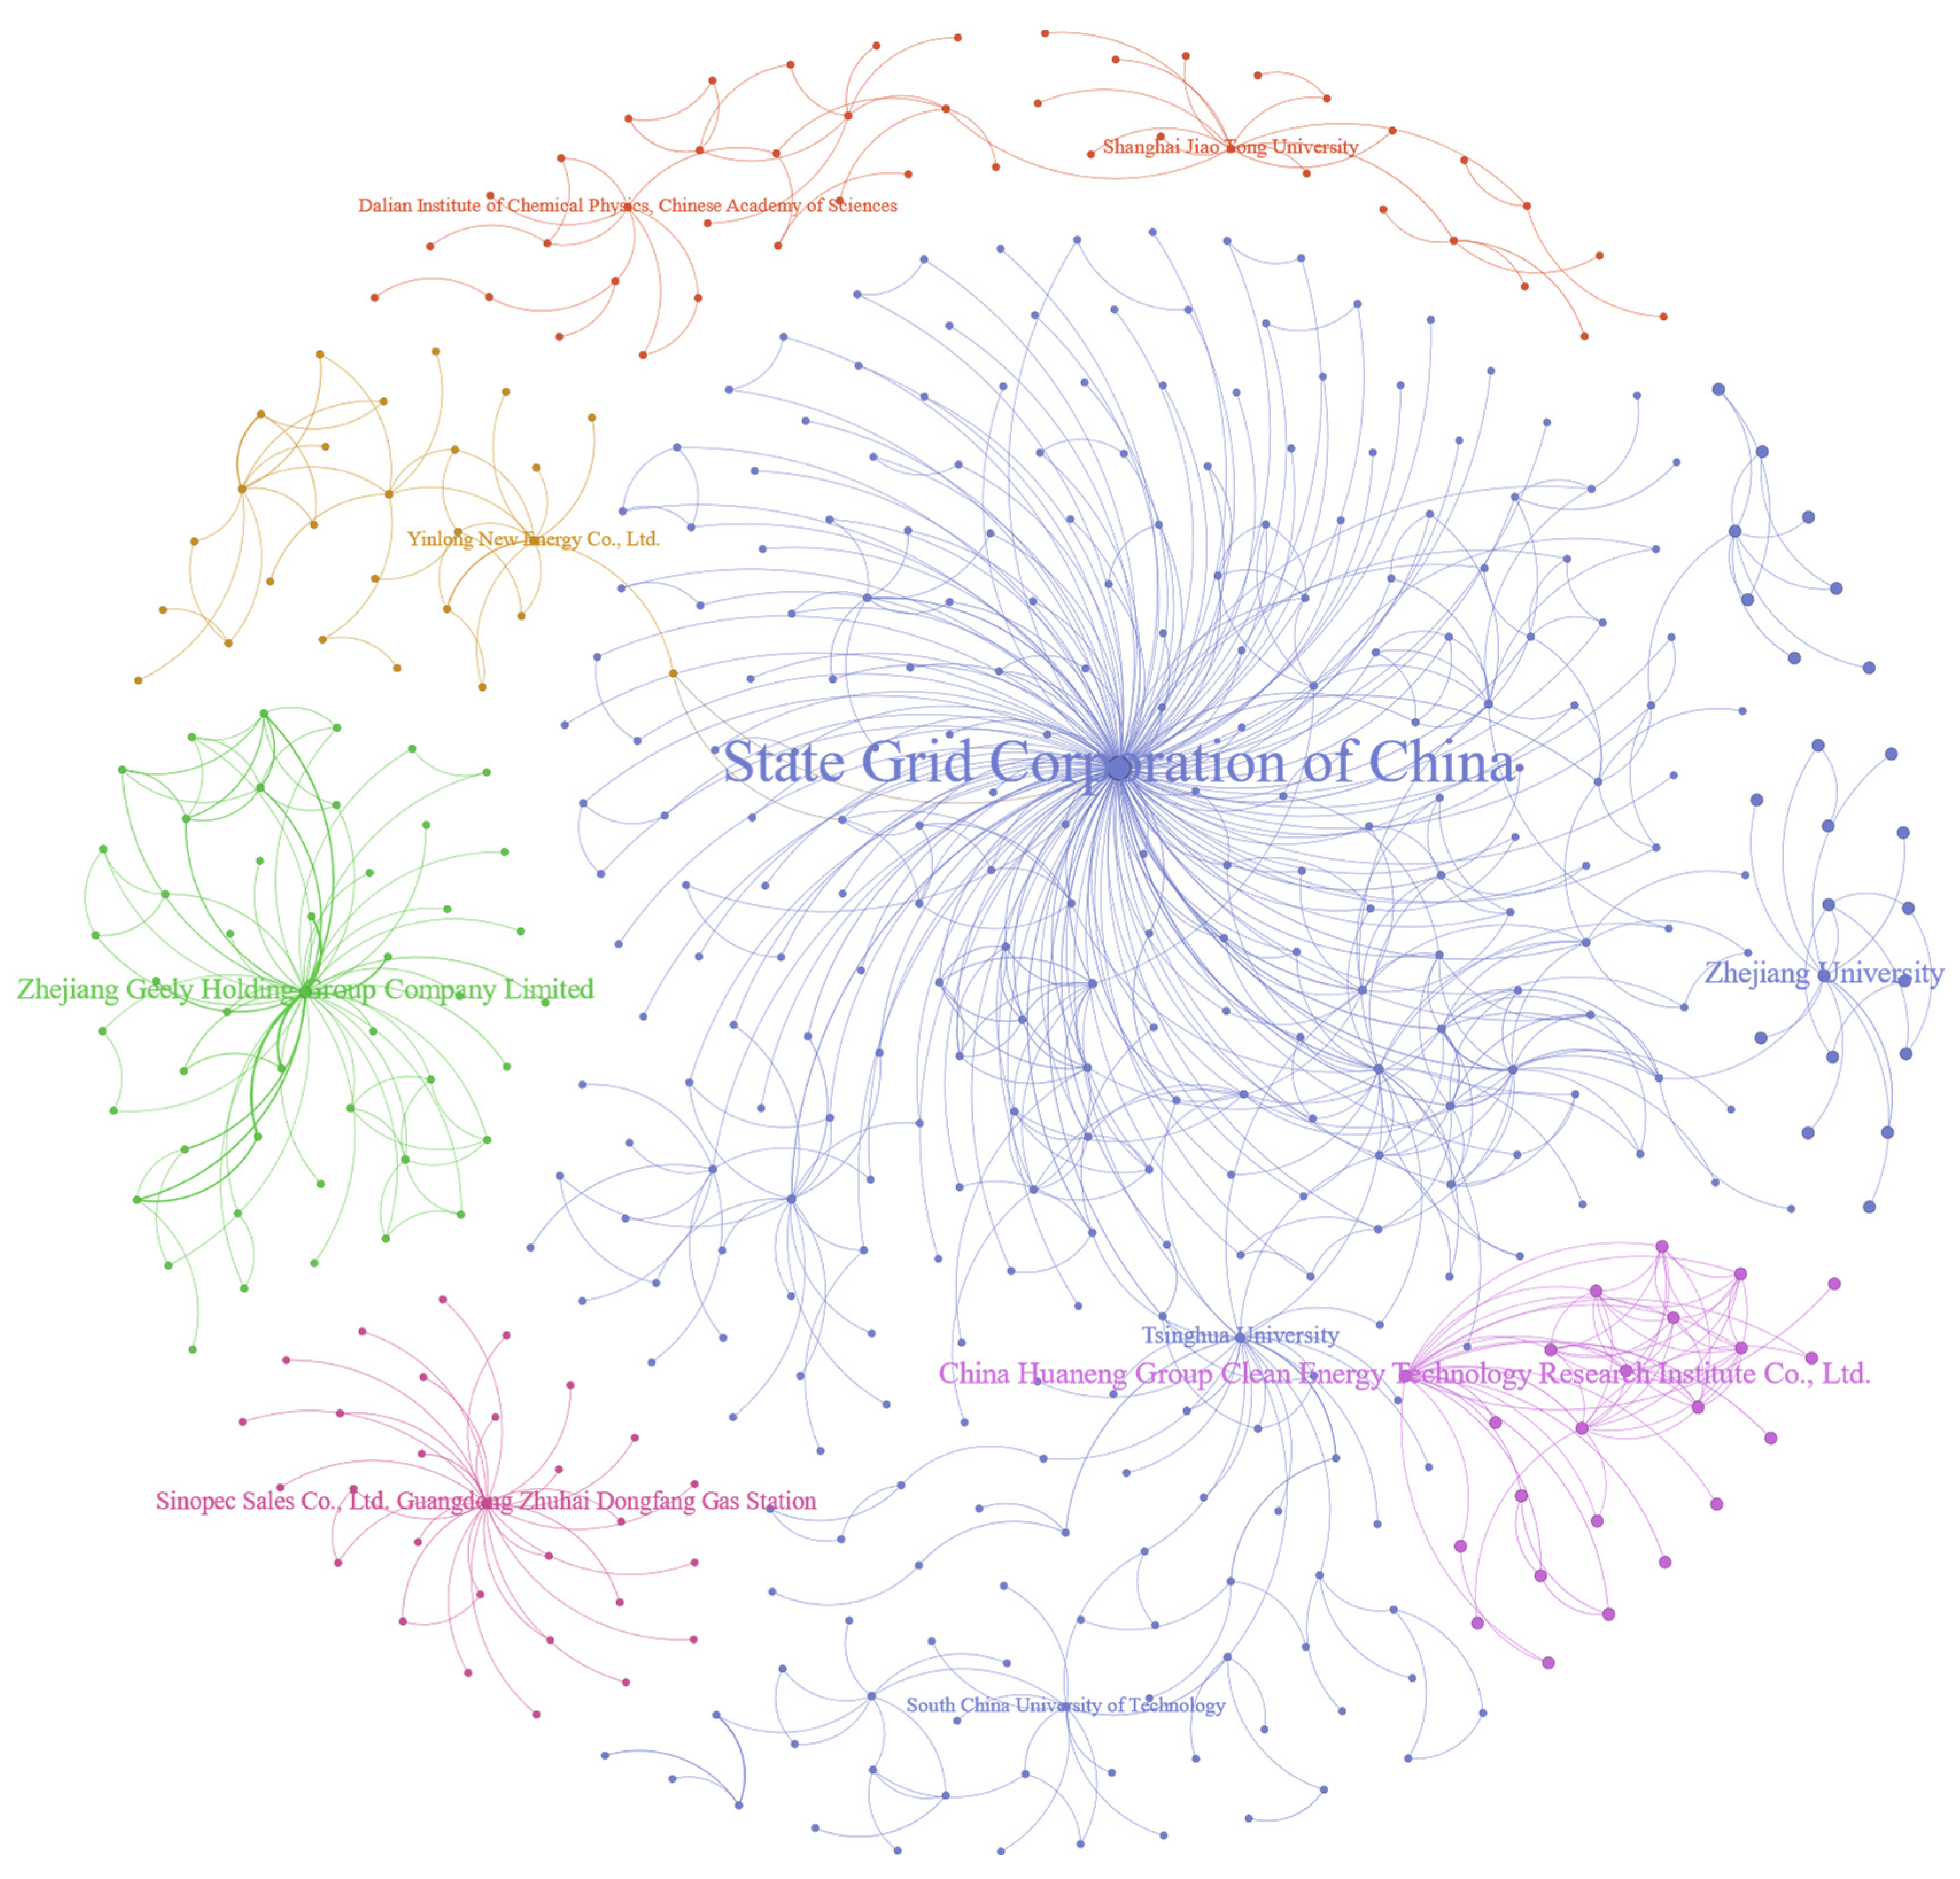
Figure 6.
Patent collaboration networks across three periods: (a) Network from 2001 to 2008; (b) Network from 2009 to 2017; (c) Network from 2018 to 2022.
Figure 6.
Patent collaboration networks across three periods: (a) Network from 2001 to 2008; (b) Network from 2009 to 2017; (c) Network from 2018 to 2022.
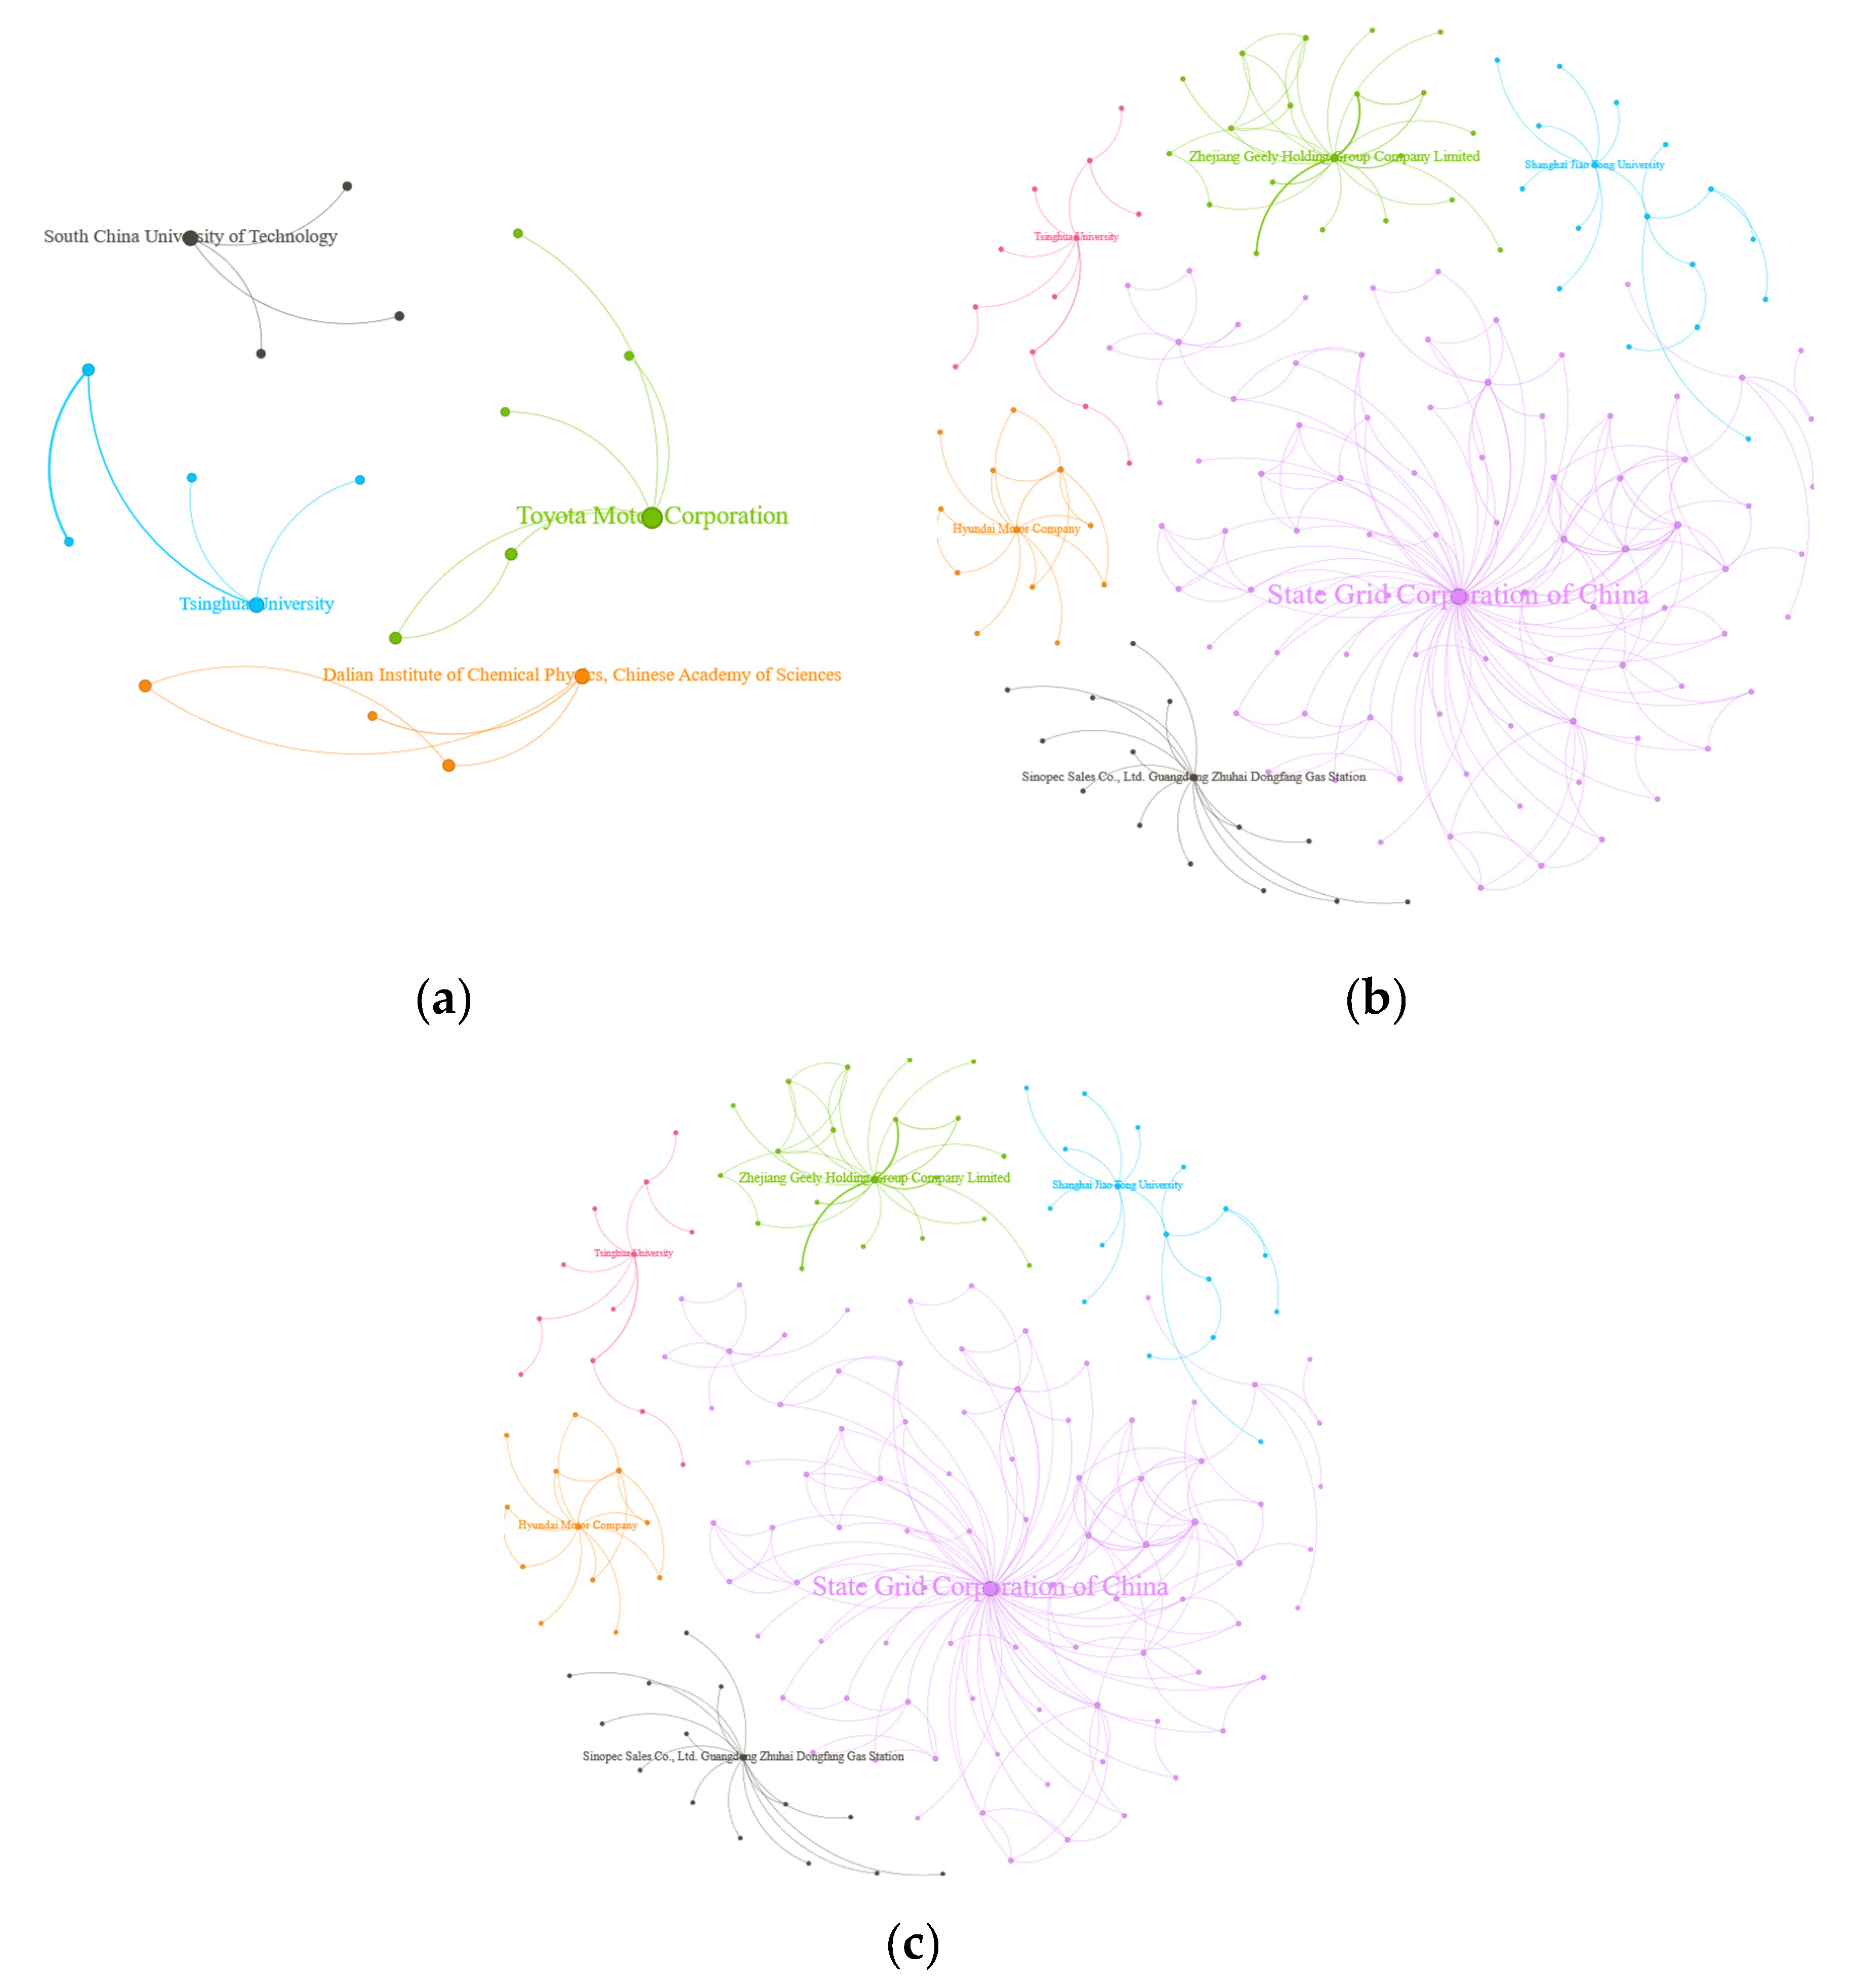
Figure 7.
Patent collaboration networks across three segments: (a) Network of the component segment; (b) Network of the complete vehicle segment; (c) Network of the aftermarket segment.
Figure 7.
Patent collaboration networks across three segments: (a) Network of the component segment; (b) Network of the complete vehicle segment; (c) Network of the aftermarket segment.
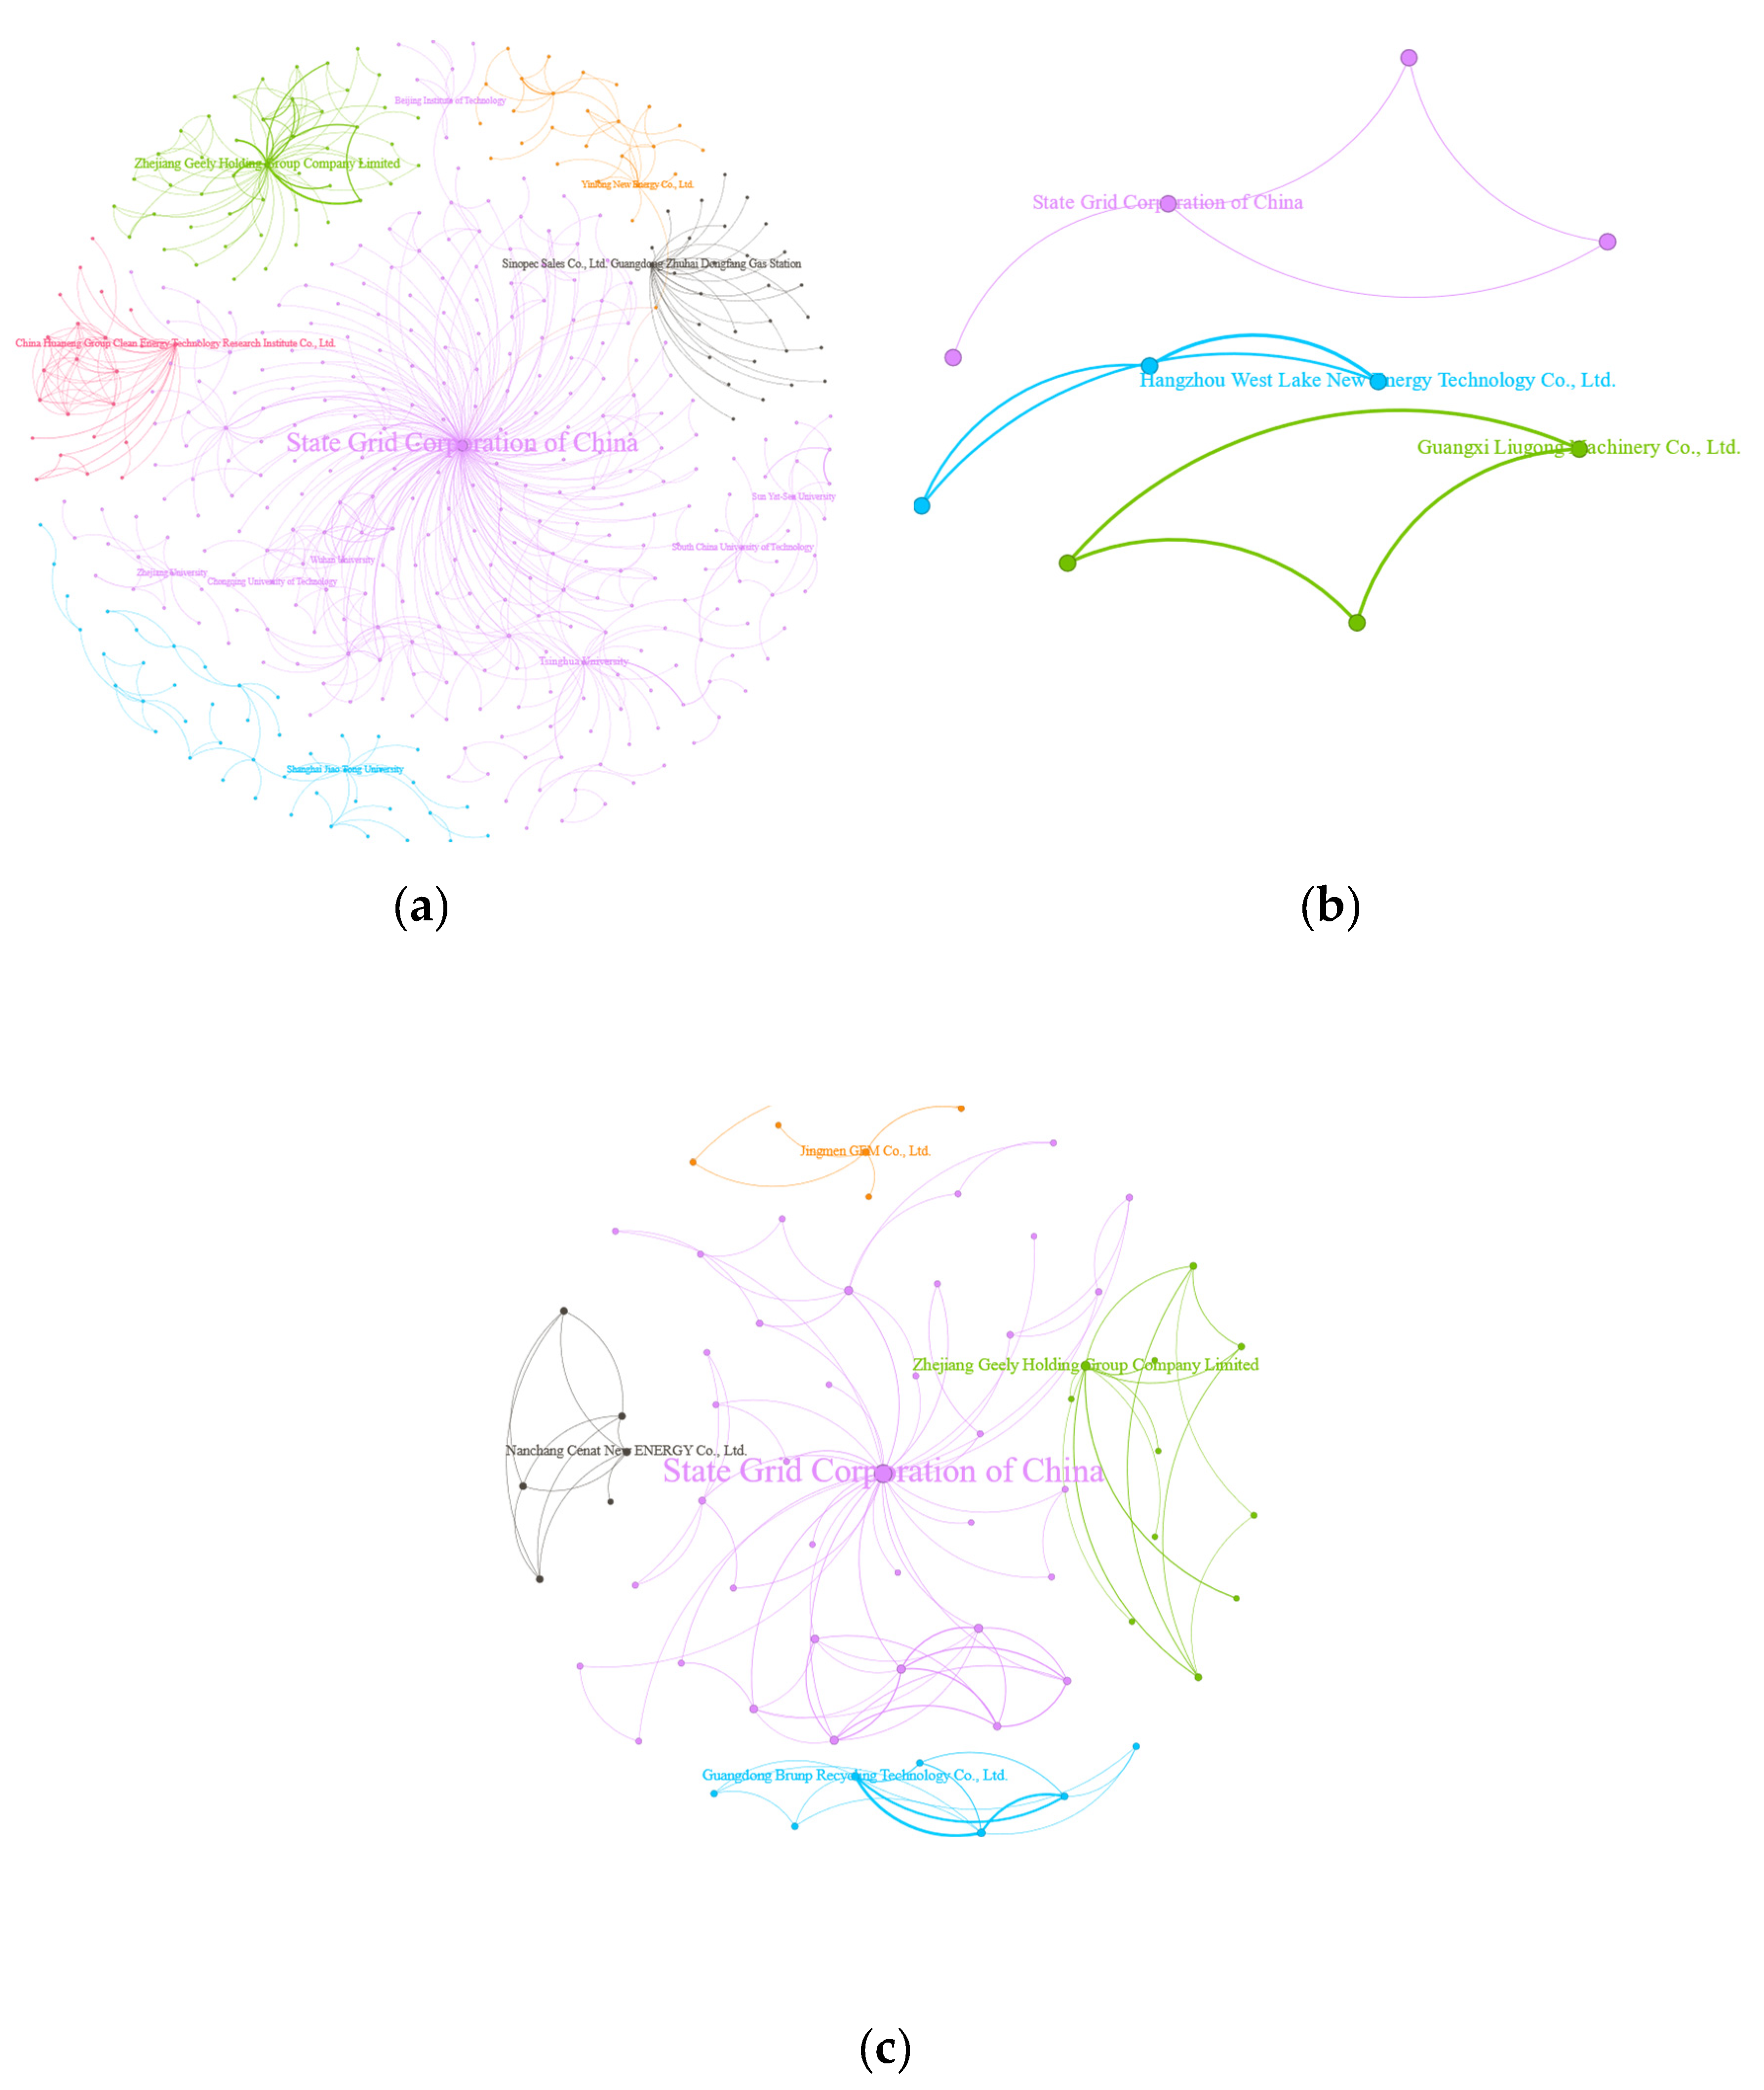
Figure 8.
Patent collaboration networks of domestic and foreign applicants: (a) Network of domestic applicants; (b) Network of foreign applicants.
Figure 8.
Patent collaboration networks of domestic and foreign applicants: (a) Network of domestic applicants; (b) Network of foreign applicants.
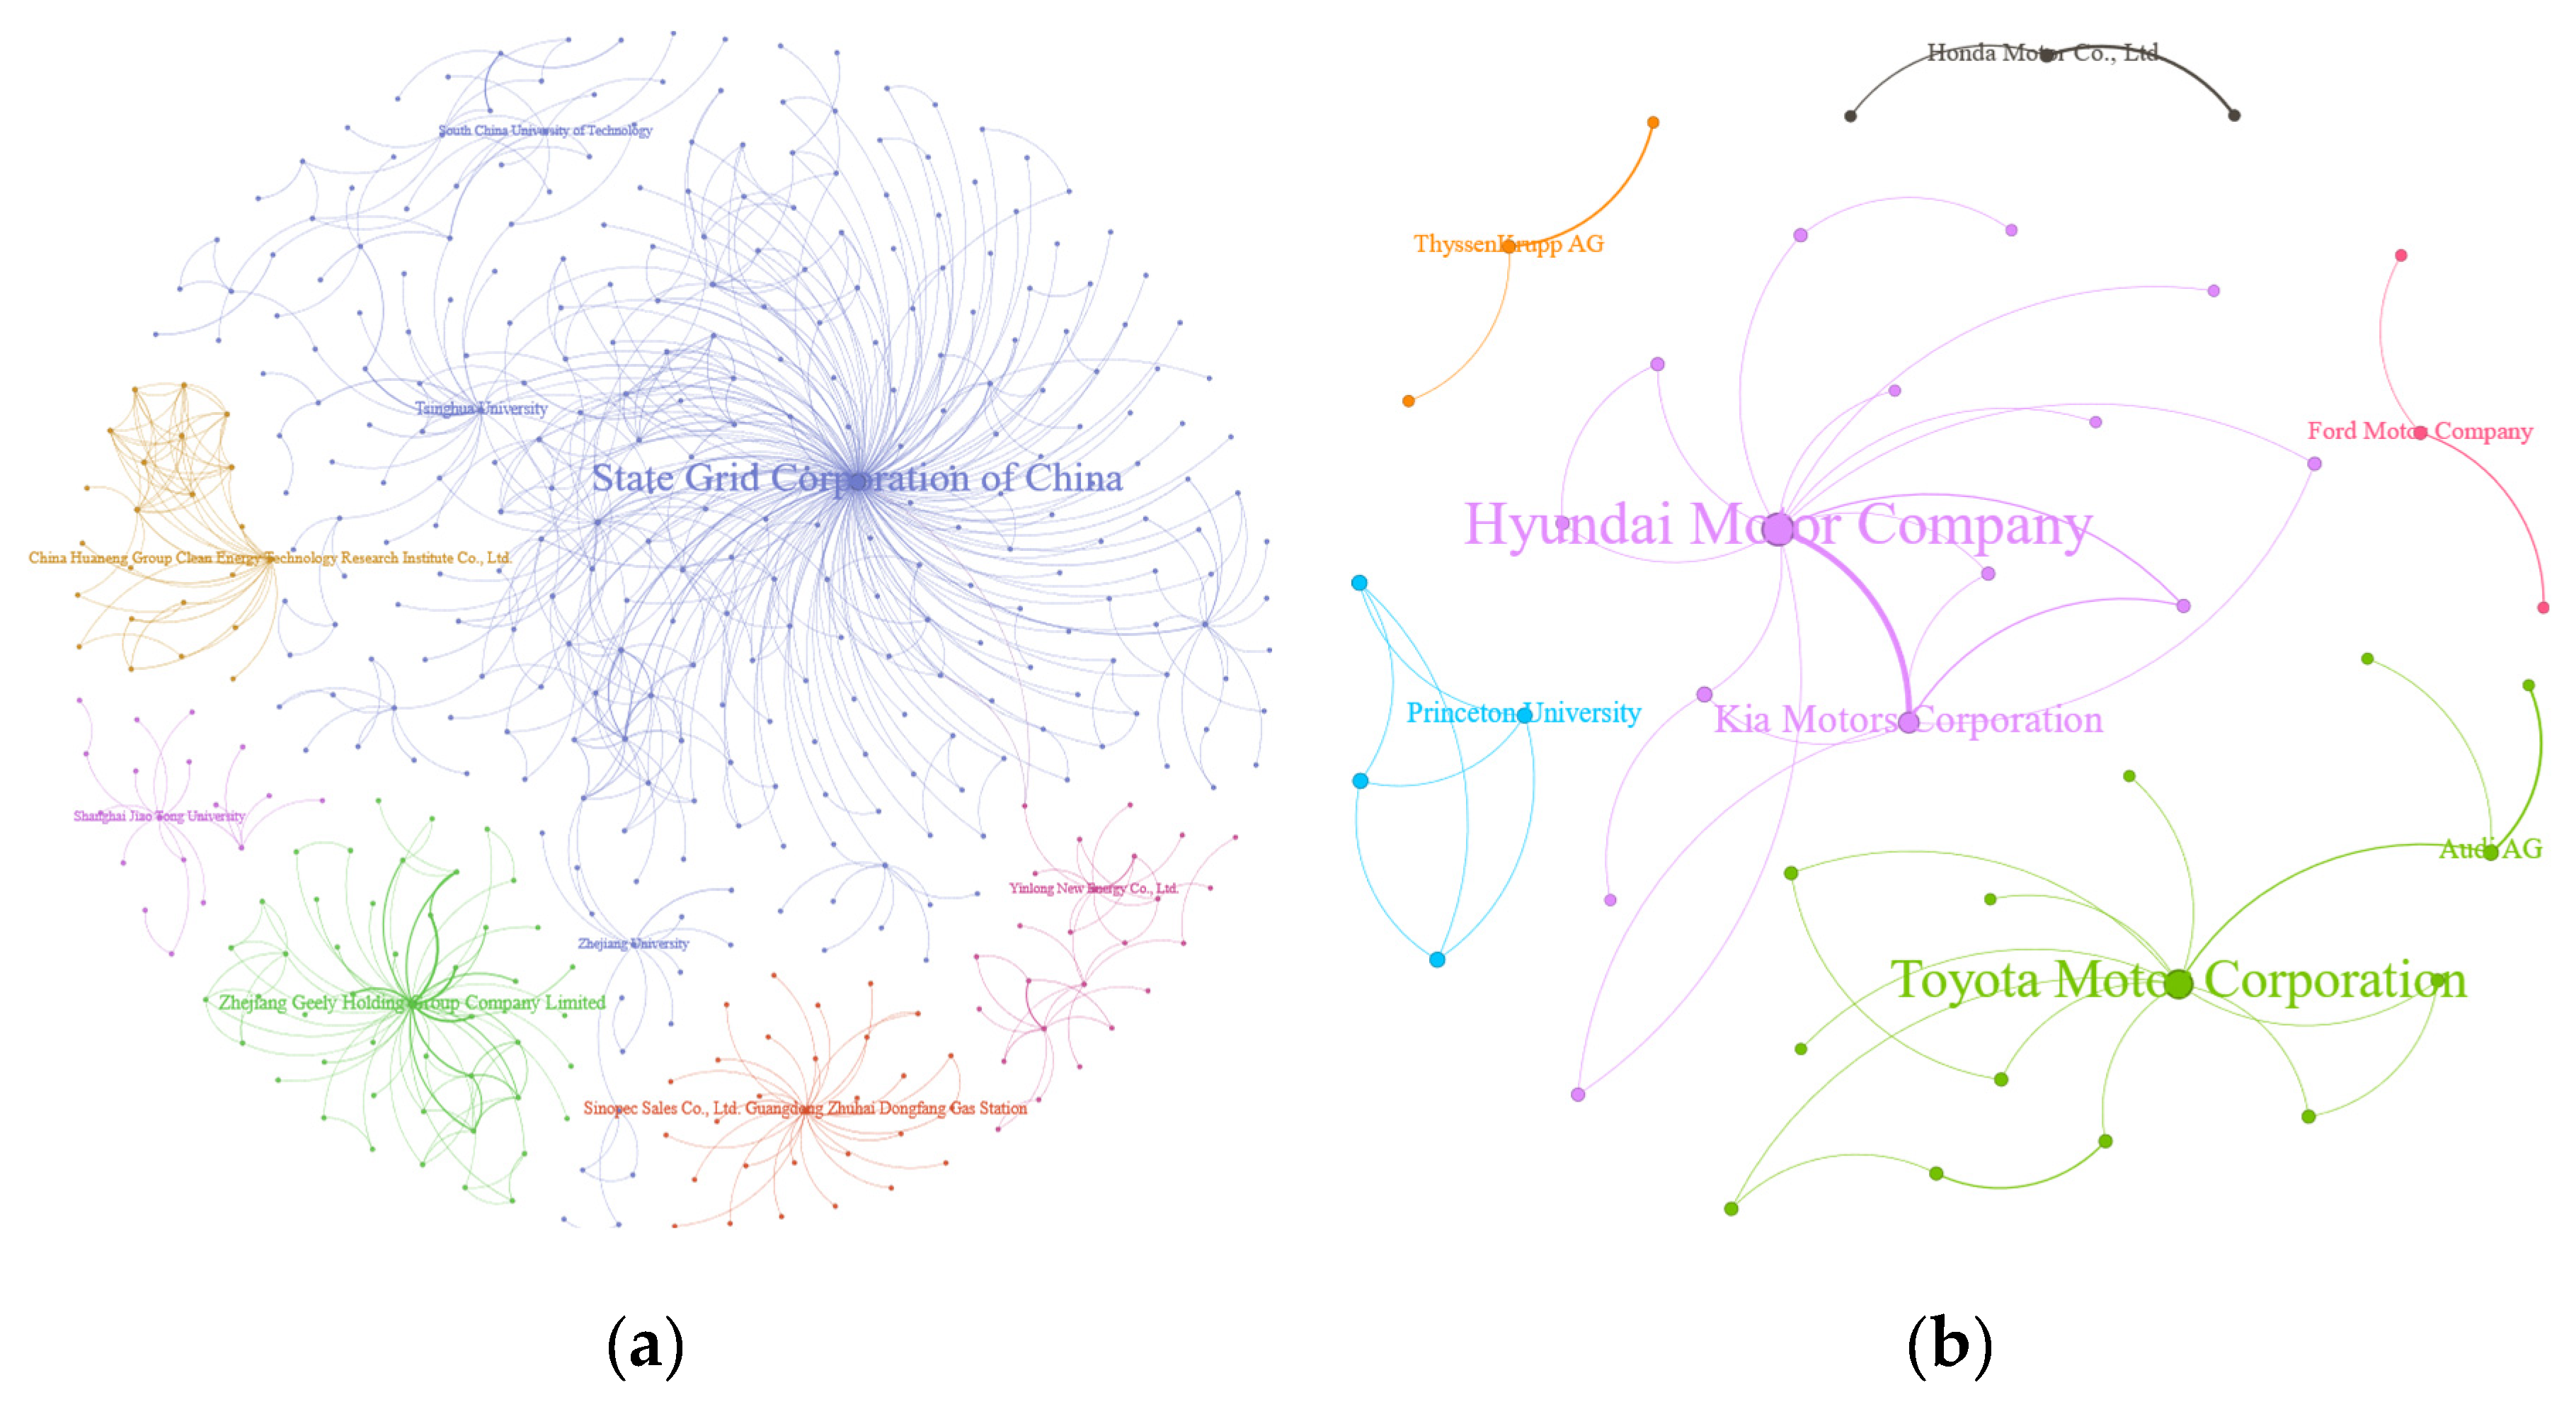
Table 10.
Key nodes of collaboration network of domestic and foreign applicants.
| Centrality | Domestic | Foreign |
|---|---|---|
| State Grid Corporation of China | Hyundai Motor Company | |
| Zhejiang Geely Holding Group Company Limited | Toyota Motor Corporation | |
| Sinopec Sales Co., Ltd. Guangdong Zhuhai Dongfang Gas Station | Kia Motors Corporation | |
| Tsinghua University | Audi AG | |
| Sinopec Sales Co., Ltd. Guangdong Zhuhai Dongfang Gas Station | Princeton University | |
| Gree Electric Appliances,Inc.of Zhuhai | Honda Motor Co., Ltd. | |
| BYD Company Limited | ThyssenKrupp AG | |
| Boe Technology Group Co., Ltd. | Ford Motor Company | |
| State Grid Corporation of China | Hyundai Motor Company | |
| Tsinghua University | Toyota Motor Corporation | |
| GREE ALTAIRNANO NEW ENERGY INC. | Audi AG | |
| Northern Altair Nanotechnologies Co., Ltd. | Korea Advanced Institute of Science and Technology | |
| State Grid Corporation of China | Hyundai Motor Company | |
| China Electric Power Research Institute Co., Ltd. | Kia Motors Corporation | |
| XJ Group Corporation | Toyota Motor Corporation | |
| Xj Power Co., Ltd. | Korea Advanced Institute of Science and Technology |
Table 11.
Structural characteristics of collaboration network of domestic and foreign applicants.
| Structural characteristic | Domestic | Foreign |
|---|---|---|
| Network density | 0.0000088 | 0.0003949 |
| Number of network nodes | 20716 | 629 |
| Number of network connections | 1881 | 78 |
| Connecting times | 6181 | 104 |
| Average clustering coefficient | 0.726 | 0.569 |
| Average path length | 3.719 | 1.896 |
| Number of connected subgraphs | 19342 | 563 |
| Number of nodes of the maximal connected subgraph | 299(1.44%) | 15(2.38%) |
| Number of connections of the maximal connected subgraph | 511(27.17%) | 20(25.64%) |
| Connecting times of the maximal connected subgraph | 1273 | 28 |
Table 12.
Top 20 domestic and foreign applicants by granted patents.
| Domestic | Foreign | ||
|---|---|---|---|
| Applicant | Num. | Applicant | Num. |
| Chery AUTOMOBILE Co., Ltd. | 2101 | Ford Global Technologies, LLC | 629 |
| Contemporary Amperex Technology Co., Ltd. | 1865 | Robert Bosch GmbH | 363 |
| Anhui Jianghuai Automobile Group Corp.,Ltd. | 1302 | GM Global Technology Operations LLC | 345 |
| Eve Power Co., Ltd. | 1166 | Autoliv Development AB | 335 |
| FAW Group Co., Ltd. | 1153 | The Yokohama Rubber Co., Ltd. | 256 |
| Hefei Gotion HIGH-TECH POWER ENERGY Co., Ltd. | 1109 | LG Chem, Ltd. | 110 |
| BYD Company Limited | 956 | TRW Automotive Inc. | 104 |
| Aodong New Energy Co., Ltd. | 949 | Subaru Corporation | 89 |
| Guangzhou AUTOMOBILE Group Co., Ltd. | 866 | GM Global Technology Operations, LLC | 87 |
| Zhejiang Geely Holding Group Company Limited | 847 | Stellantis N.V. | 81 |
| Honeycomb Energy Technology Co., Ltd. | 790 | Mercedes-Benz Group AG | 76 |
| PAN ASIA Technical AUTOMOTIVE Center Co., Ltd. | 729 | Hitachi, Ltd. | 71 |
| State Grid Corporation of China | 658 | Volkswagen AG | 65 |
| OptimumNano Energy Co.,Ltd | 563 | Key Safety Systems, Inc. | 63 |
| Xiamen Hithium Energy Storage Technology Co., Ltd. | 547 | Audi AG | 62 |
| Chongqing Changan Automobile Company Limited | 517 | Infineon Technologies AG | 62 |
| Huating (Hefei) Hybrid Technology Co., Ltd. | 483 | Automotive Technologies Licensing, LLC | 56 |
| SINOTRUK Jinan Power Co., Ltd. | 473 | Bayerische Motoren Werke AG | 54 |
| Dalian Institute of Chemical Physics, Chinese Academy of Sciences | 463 | Hyundai Motor Company | 50 |
| Evergrande New Energy Technology (Shenzhen) Co., Ltd. | 459 | Toyota Motor Corporation | 42 |
Disclaimer/Publisher’s Note: The statements, opinions and data contained in all publications are solely those of the individual author(s) and contributor(s) and not of MDPI and/or the editor(s). MDPI and/or the editor(s) disclaim responsibility for any injury to people or property resulting from any ideas, methods, instructions or products referred to in the content. |
© 2025 by the authors. Licensee MDPI, Basel, Switzerland. This article is an open access article distributed under the terms and conditions of the Creative Commons Attribution (CC BY) license (http://creativecommons.org/licenses/by/4.0/).
Copyright: This open access article is published under a Creative Commons CC BY 4.0 license, which permit the free download, distribution, and reuse, provided that the author and preprint are cited in any reuse.


