Submitted:
28 August 2025
Posted:
29 August 2025
You are already at the latest version
Abstract
Two types of bisphenol A epoxy resins, E44 and E51, were cured using 4,4’- diaminodiphenylmethane (DDM) and 4,4’-diaminodiphenyl sulfone (DDS), respectively. The curing kinetics were analyzed by means of non-isothermal differential scanning calorimetry (DSC). The apparent activation energies of the epoxy curing systems were calculated using the Starink method. Furthermore, a two-parameter autocatalytic model was employed to determine the reaction rate equations, which exhibited excellent agreement with the experimental data, thereby confirming its applicability in describing the curing behavior. The relationship between the theoretically calculated activation energy and the processing rheology was investigated to provide guidance for the forming and processing of the resin system.
Keywords:
epoxy resins
; curing kinetics
; dynamic rheology
; DSC
; aromatic amines
1. Introduction
Epoxy resin is the most prevalent and widely used thermosetting polymer material, playing a vital role in many industrial fields such as coatings, laminates, electronic devices, adhesives, machines, etc. [1]. Therefore, fully exploiting its physical and mechanical properties under varying external conditions depends not only on its inherent chemical structure but also on the molding and curing processes. In this regard, theoretical guidance on curing parameters and reaction kinetics is of critical importance [2,3].
A variety of analytical techniques-such as Fourier transform infrared (FTIR) spectroscopy, Raman spectroscopy, nuclear magnetic resonance (NMR) spectroscopy, and differential scanning calorimetry (DSC)-have been employed to study the curing kinetics of epoxy resins [4,5]. Among these, the DSC method is particularly prominent, as it accurately captures the exothermic behavior during curing as a function of temperature and enables quantitative analysis of the relationships between curing rate, time, degree of cure, and temperature. This makes it a reliable and convenient tool for optimizing processing conditions [6]. At present, the study of epoxy resin curing kinetics primarily relies on isothermal and non-isothermal DSC methods, followed by numerical fitting based on specific kinetic models to determine the relevant kinetic parameters.
Clearly, the selection of an appropriate kinetic model is crucial for analyzing the mechanism underlying the curing process of epoxy resin. Traditional kinetic modeling methods mainly fall into two categories: model fitting and non-model fitting approaches. The model fitting method is relatively straightforward but requires the introduction of empirical parameters and correction factors. Based on long-term experimental observations, its applicability is relatively limited, and it often demonstrates reduced predictive accuracy for complex reaction pathways occurring during the later stages of curing. In contrast, the non-model fitting method effectively avoids such limitations.
Therefore, this study adopts a non-model fitting approach to systematically analyze the exothermic behavior during curing and determine the kinetic parameters of the bisphenol A epoxy resin/aromatic amine system. By utilizing the differences in viscous flow temperatures across various systems, the curing mechanism is predicted and analyzed, and the corresponding kinetic equation is derived. The non-model fitting, combined with rheological properties, can obtain sufficient data to gain a deeper understanding of the curing mechanism, especially for different systems of high-temperature and low-temperature curing agents and bisphenol A resin combinations. This investigation aims to provide theoretical support for subsequent curing processes, performance evaluation, and practical applications of the system.
2. Materials and Methods
2.1. Materials
Bisphenol A glycidyl ether type epoxy resins (industrial grades E51 and E44) were supplied by Nantong Star Synthetic Material Co., Ltd.; 4,4’-Diaminodiphenylmethane (DDM), analytical reagent grade, was obtained from Sinopharm Chemical Reagent Co., Ltd.; 4,4’-Diaminodiphenylsulfone (DDS), also analytical reagent grade, was provided by Tianjin Fuyu Chemical Co., Ltd.
2.2. Sample Preparation
The curing agents DDM and DDS were added in stoichiometric ratios as follows, and the mixtures were prepared according to the specified mass (g) ratios for DSC testing: E-51:DDM = 1:0.252; E-44:DDM = 1:0.218; E-51:DDS = 1:0.316; E-44:DDS = 1:0.273.
2.3. Physicochemical Measurement and Characterization
Differential Scanning Calorimeter (DSC, NETZSCH DSC 204, NETZSCH, Germany) was employed for thermal analysis. A precisely weighed sample (7–10 mg) was placed into a crucible, which was then loaded into the instrument for programmed heating and scanning. An identical empty crucible was used as reference. The experimental conditions were set as follows: four heating rates (β) of 5, 10, 15, and 20 °C/min were applied under a nitrogen (N2) atmosphere with a gas flow rate of 50 mL/min. The temperature range for the measurements was 25–350 °C.
The viscosity of the epoxy resin and the rheological behavior of the resin-curing agent mixture were evaluated using an Anton Paar rheometer (MCR 102e) equipped with parallel plates of 25 mm diameter. The intrinsic viscosity of the epoxy resin was measured in shear mode at a constant temperature of 25 °C, with a dynamic frequency sweep ranging from 1 to 100 s. The dynamic rheological behavior of the epoxy system containing the curing agent was analyzed in oscillatory mode across a temperature range of 25–250 °C, at a heating rate of 5 °C/min, with a fixed frequency of 1 Hz.
The chemical compositions of the four cured epoxy materials were analyzed using the attenuated total reflection unit on the Thermo Scientific Nicolet iS50 infrared spectrometer (USA, ATR-FTIR).
2.4. Principles of Curing Kinetics Analysis
The curing reaction between epoxy resin and a curing agent is a highly complex process. Therefore, this paper aims to investigate the curing kinetics of the bisphenol A epoxy resin and aromatic amine system by employing the non-isothermal DSC method. The non-model kinetic approach describes the conversion rate at a given stage of the curing reaction, as expressed in Equation (1):
ΔH value represents the total enthalpy change during the curing reaction, which corresponds to the total amount of heat released.
Correspondingly, the rate of the curing reaction is then expressed as:
In relation to the curing reaction process, the rate of curing is influenced significantly by temperature (T), conversion (α), and pressure (P), then the rate of the curing reaction is expressed as:
The generation of gases is not observed during the curing process of bisphenol A epoxy resin with aromatic amine curing agent, thereby disregarding the influence of pressure. Consequently, the single-step reaction rate of the curing reaction can be formulated as:
The rate constant k(T) in this kinetic equation is closely associated with the temperature variation, as indicated by the empirical relationship embodied in the Arrhenius equation, which governs the dependence of a chemical reaction’s rate constant on temperature.
The equation (5) can be transformed by simultaneously applying logarithms to both sides, as illustrated in Equation 6:
The process of simultaneously differentiating both sides of Equation 6 with respect to (1/T) can be expressed as:
In the given equation, A represents the pre-exponential factor, E denotes the apparent activation energy of the curing reaction, R stands for the universal gas constant (8.314 J/mol-K), and T signifies the absolute temperature.
The temperature under non-isothermal conditions exhibits a linear variation with respect to time:
where the heating rate β was 5, 10, 15, and 20 °C/min, respectively.
Equation 9 is obtained from Equations (4), (5) and (8) as:
According to ICTAC [7], the model fitting for a single step cannot be applied to a coexisting multi-step curing mechanism during the curing reaction. Only temperature affects the degree of reaction in the non-isothermal method. The Equation 4 is thus converted into a logarithmic form, and the derivative of (1/T) on both sides of the formula can be expressed as:
The constant α, representing the conversion rate, is given and therefore f(α) is also a constant. Consequently, the derivative of the term becomes zero. By combining Equation 7 and Equation 10, we can derive Equation 11:
Currently, there exist numerous methods and equations for calculating the apparent activation energy under non-isothermal conditions. However, this paper advocates for the utilization of the Starink method [8], which is currently deemed more accurate, to calculate the apparent activation energy as demonstrated in Equation 12.
Tα represents the equivalent transformation temperature at various heating rates, while β denotes the specific heating rate.
3. Results and Discussion
3.1. Non-Isothermal DSC Analysis
Based on observations from Figure 1, it is evident that each epoxy resin system, when analyzed under varying rates of temperature increase, exhibited only a single peak indicative of an exothermic curing process. Furthermore, as the heating rate increased, the peak of the curing heat release gradually shifted toward higher temperature ranges. Comparative analyses across various combinations of epoxy resins and curing agents revealed that when DDS was used as the curing agent for the E51 and E44 systems, the onset curing temperatures were higher compared to those using DDM as the curing agent. This difference in reactivity between DDS and DDM is primarily responsible for the observed variation. Additionally, in cases involving identical curing agents, such as the E44/DDM system, the broader exothermic interval suggests that a higher reaction temperature is required for the interaction between the E44 resin and the DDM curing agent. Therefore, this might be attributed to the differences in polymer molecular weight (i.e., degree of polymerization), as well as dynamic rheological properties, between the E51 and E44 resins. The poorer rheological performance necessitates higher reaction temperatures.
By analyzing and calculating the aforementioned experimental results, we determined the correlation between the conversion rate (α) and temperature for each system, as shown in Figure 2. It is evident that at the same temperature, α gradually decreases with increasing β, forming S-shaped curves. A comparison of the curves in Figure 2 reveals that, regardless of whether DDM or DDS is used as the curing agent, the S-shaped curves in the E51 resin systems (E51/DDM and E51/DDS) exhibit steeper slopes than those in systems (c) and (d). This suggests that the E51/DDM and E51/DDS systems reach maximum conversion more rapidly. The accelerated reaction rate can be attributed to the higher density of reactive groups in these systems and the resulting greater cross-linking density.
3.2. Curing Kinetics Analysis
The primary objective of the kinetic analysis of epoxy resin curing is to determine the key “curing kinetic parameters” that characterize the curing reaction, specifically including the apparent activation energy (Eα), pre-exponential factor (A), and the reaction rate equation f(α). Due to the strong interdependence among these parameters, ensuring the accuracy of Eα is of particular importance. Any significant deviation in Eα will directly affect the subsequent determination of A and f(α), as reflected in the corresponding calculation equations. In this study, the exothermic temperatures (T) corresponding to different conversion degrees (at intervals of 0.10, i.e., α= 0.10, 0.20, 0.30...) were selected, and the apparent activation energy was calculated using the Starink method based on equation (12).
The apparent activation energy was determined by calculating the slope of the fitted straight line derived from plotting ln(β/T) against 1/T. As illustrated in Figure 3, the linear fitting of the data exhibited excellent correlation. The average Eα values for the four systems, E51/DDM, E51/DDS, E44/DDM, and E44/DDS, were found to be 49.85 kJ/mol, 63.63 kJ/mol, 50.21 kJ/mol, and 64.24 kJ/mol, respectively. This indicates that the resin systems incorporating the DDM curing agent exhibit significantly lower average Eα values compared to those with the DDS curing agent, which can be attributed to the higher reactivity of DDM. Furthermore, a comparison between the E51/DDM and E44/DDM systems shows that the former has a slightly lower average Eα value.
Clearly, owing to the higher reactivity of DDM compared to DDS, resin systems employing DDM as the curing agent exhibit a notable reduction in average Eα values relative to those using DDS. When comparing the E51/DDM and E44/DDM systems, only a minor difference is observed in their average Eα values. The E44/DDM system displays considerable fluctuations in Eα at different conversion rates, as illustrated in Figure 4. In contrast, the E51/DDM system shows a more gradual and stable variation in Eα across conversion rates, with a tendency to increase steadily as conversion progresses. Therefore, it can be inferred that this difference is primarily attributable to variations in viscosity within the intrinsic resins and the corresponding mixed systems.
Thus, the variation in viscosity with shear rate for the E44 and E51 pure resin systems was compared and analyzed, as shown in Figure 5. At ambient temperature (25 °C), the viscosity of the E44 pure resin system (242.4 Pa·s) was significantly higher than that of the E51 resin system (11.4 Pa·s). As can be seen from Figure 6, all four cured epoxy systems show hydroxyl peaks around 3400 cm-1, while the epoxy peaks around 913 cm-1 and 840 cm-1 disappear. Given that the molecular structures of E44 and E51 are identical, their curing reaction mechanisms should be consistent,which involve the ring-opening reaction of epoxy groups to generate a large number of hydroxyl groups. Furthermore, as illustrated in Figure 7(a), under varying temperature conditions, the complex viscosity of the E44 resin when mixed with either DDS or DDM curing agents exhibits a significantly greater rheological disparity compared to the E51/DDS and E51/DDM systems, which can be attributed to the intrinsic viscosities differences of the two epoxy resins.
The E51/DDS and E44/DDS systems display a high degree of similarity in their Eα and E values across varying conversion rates as shown in Figure 4. The similarity can be mainly attributed to the broader curing reaction temperature range exhibited by these two systems in comparison to the E51/DDM and E44/DDM systems. Although a wider temperature range typically leads to more pronounced differences in viscosity changes between systems, the relatively lower reactivity of the DDS curing agent compared to DDM results in comparable viscosity evolution trends for both the E51/DDS and E44/DDS systems, as illustrated in Figure 7(b).
The average Eα and E values under different conversion conditions are highly consistent for both the E51/DDS and E44/DDS systems, with only minor discrepancies observed, as shown in Figure 4. This consistency can be attributed to the fact that the curing reaction temperature ranges of these two systems are higher than those of the E51/DDM and E44/DDM systems. Although the viscosity of the E51/DDS and E44/DDS systems is theoretically expected to differ significantly due to variations in the matrix resin, the actual viscosity changes are minimal. This is primarily due to DDS exhibiting lower curing activity compared to DDM. As illustrated in Figure 7(b), the temperature at which the viscosity drops below 1 Pa·s for the E51 resin is lower than that of the E44/DDS system. The viscosity of the E51/DDS and E44/DDS systems remains below 1 Pa·s within the temperature ranges of 52-211 °C and 70-236 °C, respectively. Overall, variations in viscosity have a negligible impact on the curing crosslinking reactions of the E51/DDS and E44/DDS systems, which can be attributed to their similar molecular structures and corresponding comparable curing activities.
3.3. Solving the Equations of Curing Kinetics
The curing of epoxy resins involves a complex transition from a liquid state to a viscoelastic state and finally to a glassy state, which renders the curing reaction intricate and its mechanism variable [9,10,11]. Therefore, establishing accurate curing reaction models is essential for process prediction, system development, and providing theoretical support for evaluating post-molding material performance.
The relationship between the curing reaction rate (dα/dt) and the conversion rate (α) is illustrated in Figure 8. The curing reaction rate is strongly influenced by the heating rate, exhibiting an initial increase followed by a decrease at any given heating rate. As shown in the comparison of the systems in Figure 8, the curing reaction rate of E51 is higher than that of E44 under the same heating rate. This observation supports the hypothesis that variations in viscosity during the reaction process contribute to differences in curing reaction rates. Furthermore, when the same base resin is used with different curing agents, the DDM system demonstrates a faster curing reaction rate than the DDS system, suggesting a correlation between the curing reaction rate and the conversion level.
All of the investigated curing systems exhibit their maximum reaction rate at a conversion level of approximately 0.5, and this peak remains consistent regardless of the heating rate. This indicates that the curing reaction mechanism remains consistent across different heating conditions, which is characteristic of an autocatalytic reaction model. To validate this hypothesis, the present study assumes that the epoxy hybrid system follows an n-stage reaction model. The average apparent activation energy, calculated using the Starink method, is integrated into the n-stage reaction model. Additionally, the conversion rate α is sampled at intervals of 0.05. Equation (13) provides a mathematical representation of the n-stage reaction model.
The natural logarithm is applied to both sides of Equation (13) and the terms are rearranged to yield a linear Equation (14).
Figure 9 illustrates the relationship between ln(da/dt) + E/RT and ln(1-a) for various epoxy curing systems. The data points both before and after the curing peak display a non-linear trend. Therefore, the assumption that the slope n, which increases linearly according to the aforementioned equations, corresponds to the number of reaction stages cannot be validated. As a result, it can be inferred that a multi-stage reaction mechanism is not applicable to this particular curing system.
The majority of kinetic reactions in the curing process are commonly modeled using the Kissinger equation [12] and Crane’s equation [13] to investigate the curing mechanism. However, these methods do not account for the influence of the conversion rate α on activation energy(E) and the pre-exponential factor(lnA), which can result in considerable inaccuracies. In contrast, the non-model kinetic method effectively avoids errors caused by model selection and parameter fitting, and eliminates the need for introducing additional empirical parameters, thereby enabling a more comprehensive characterization of the entire curing process. Consequently, the two-parameter autocatalytic kinetic model was employed to describe the curing reaction progress of each epoxy-based resin system under non-isothermal conditions, as shown in Equation (15).
Combining equations (8), (9) and (15), the non-isothermal kinetic equations are:
Taking the logarithm of Eq. (16) gives the linear equation (17):
The equation presented in Equation (17) incorporates the independent variables lnα, ln(1-α), and 1/T. Through the application of multiple linear regression analysis and by leveraging known activation energies, we calculated the values of the pre-exponential factor A, along with the reaction orders n and m for the four aforementioned systems. The specific parameter values are summarized in Table 1. Subsequently, the average value of each parameter was substituted into Equation (16) to derive the curing kinetic equation for each system, as displayed in Table 2.
To enhance the predictive accuracy of the aforementioned rate equations, a comparative analysis was performed between the experimental data and the theoretical results derived from these equations, as shown in Figure 10. This figure presents the correlation curves illustrating the relationship between reaction rates and temperatures across all four epoxy systems. The theoretical predictions based on the selected two-parameter autocatalytic kinetic model exhibit a high degree of agreement with the experimental observations. As summarized in Table 1, the correlation between the experimental data and the theoretical calculations exceeds 99% for each epoxy reaction system. These results strongly support the conclusion that the two-parameter autocatalytic model is highly appropriate for describing the complex curing behavior of the four systems.
4. Conclusions
The curing processes of four epoxy systems (E51/DDM, E51/DDS, E44/DDM, and E44/DDS) were comparatively investigated in this study. The reaction kinetics and apparent activation energies of these systems were analyzed using the non-isothermal method and calculated via the Starink method, respectively. Furthermore, the differences in apparent activation energies among the systems were interpreted in terms of variations in resin viscosity and the overall viscosity of the reaction systems. The two-parameter autocatalytic reaction model was applied to solve the kinetic equation of epoxy curing, revealing a strong agreement between the model predictions and the experimental results, thereby offering an accurate description of the curing behavior.
Author Contributions
Conceptualization, F.L., L.X. and X.X.; methodology, L.X., X.X. and Y.Z.; software, L.X.; validation, F.L. and L.X.; formal analysis, F.L.; investigation, F.L. and X.X.; resources, F.L. and L.X.; data curation, F.L. and X.X; writing—original draft preparation, F.L., L.X., X.X. and Y.Z.; writing—review and editing, F.L., L.X., X.X. and Y.Z.; visualization, F.L. and Y.Z.; supervision, L.X. and Y.Z.; project administration, L.X. and Y.Z..; All authors have read and agreed to the published version of the manuscript.
Funding
This work was financially supported by the National Natural Science Foundation of China (No. 52106123).
Data Availability Statement
Data are contained within the article.
Conflicts of Interest
The authors declare no conflict of interest.
References
- Huo, S.; Yang, S.; Wang, J.; Cheng, J.; Zhang, Q.; Hu, Y.; Ding, G.; Zhang Q.; Song, P. A liquid phosphorus-containing imidazole derivative as flame-retardant curing agent for epoxy resin with enhanced thermal latency, mechanical, and flame-retardant performances, Journal of Hazardous Materials, 2020, 386, 121984. [CrossRef]
- Ferdosian, F.; Yuan, Z.; Anderson, M.; Xu, C. Sustainable lignin-based epoxy resins cured with aromatic and aliphatic amine curing agents: Curing kinetics and thermal properties, Thermochimica Acta, 2015, 618, 48-55. [CrossRef]
- Yi, C.; Rostron, P.; Vandati, N.; Gunister, E.; Alfantazi, A. Curing kinetics and mechanical properties of epoxy based coatings: The influence of added solvent, Progress in Organic Coatings, 2018, 124, 165-174. [CrossRef]
- Zhou, H.; Yin, G.; Zhuang, M.; Ge, J.; Lin, X. Curing Kinetics of Epoxy Resin/Activated Nanometer Aluminum Oxide Composite Materials, Journal of Chemical Engineering, 2011, 62: 1749-1755.
- Xu, H.; Tian, G.; Meng, Y.; Li, X.; Wu, D. Cure kinetics of a nadic methyl anhydride cured tertiary epoxy mixture, Thermochimica Acta, 2021, 701, 178942. [CrossRef]
- Punchaipetch, P.; Ambrogi, V.; Giamberini, M.; Brostow, W.; Carfagna C.; D’Souza, N. A.; Epoxy + liquid crystalline epoxy coreacted networks: I. Synthesis and curing kinetics, Polymer, 2001, 42, 2067-2075. [CrossRef]
- Vyazovkin, S.; Chrissafis, K.; Lorenzo, M. L. Di.; Koga, N.; Pijolat, M.; Roduit, B.; Sbirrazzuoli N.; Sunol, J. J. ICTAC Kinetics Committee Recommendations for Collecting Thermal Analysis Data for Kinetic Computations, Thermochimica Acta, 2014, 590, 1-23. [CrossRef]
- Starink, M. J.; The determination of activation energy from linear heating rate experiments: a comparison of the accuracy of isoconversion methods, Thermochimica Acta, 2003, 404, 163-176. [CrossRef]
- Lv, J.; Liu, Z.; Li, R.; Liu, Y.; Hu, J.; Zeng, K.; Yang, G.; Curing kinetic of self-promoted alicyclic-based bisphthalonitrile monomer, Thermochimica Acta, 2019, 683, 178446. [CrossRef]
- Poljansek, I.; Likozar, B.; Cuk, N.; Kunaver, M. Curing kinetics study of melamine–urea–formaldehyde resin/liquefied wood, Wood Science and Technology, 2013, 47, 395-409. [CrossRef]
- Kumar, D.; Choudhary, V. Curing kinetics and thermal properties of imide containing phthalonitrile resin using aromatic amines, Thermochimica Acta, 2020, 693, 178749. [CrossRef]
- Kissinger, H. E. Reaction Kinetics in Differential Thermal Analysis, Analytical Chemistry, 1957, 29, 1702-1706. [CrossRef]
- Tan, Y.; Shao, Z.; Yu, L.; Long, J.; Qi, M.; Chen L.; Wang, Y.; Piperazine-modified ammonium polyphosphate as monocomponent flame-retardant hardener for epoxy resin: flame retardance, curing behavior and mechanical property, Polymer Chemistry, 2016, 7, 3003-3012. [CrossRef]
Figure 1.
Non-isothermal DSC curves of different epoxy resin systems.

Figure 2.
Plots of conversion α vs. temperature T of these epoxy systems at different heating rates.
Figure 2.
Plots of conversion α vs. temperature T of these epoxy systems at different heating rates.
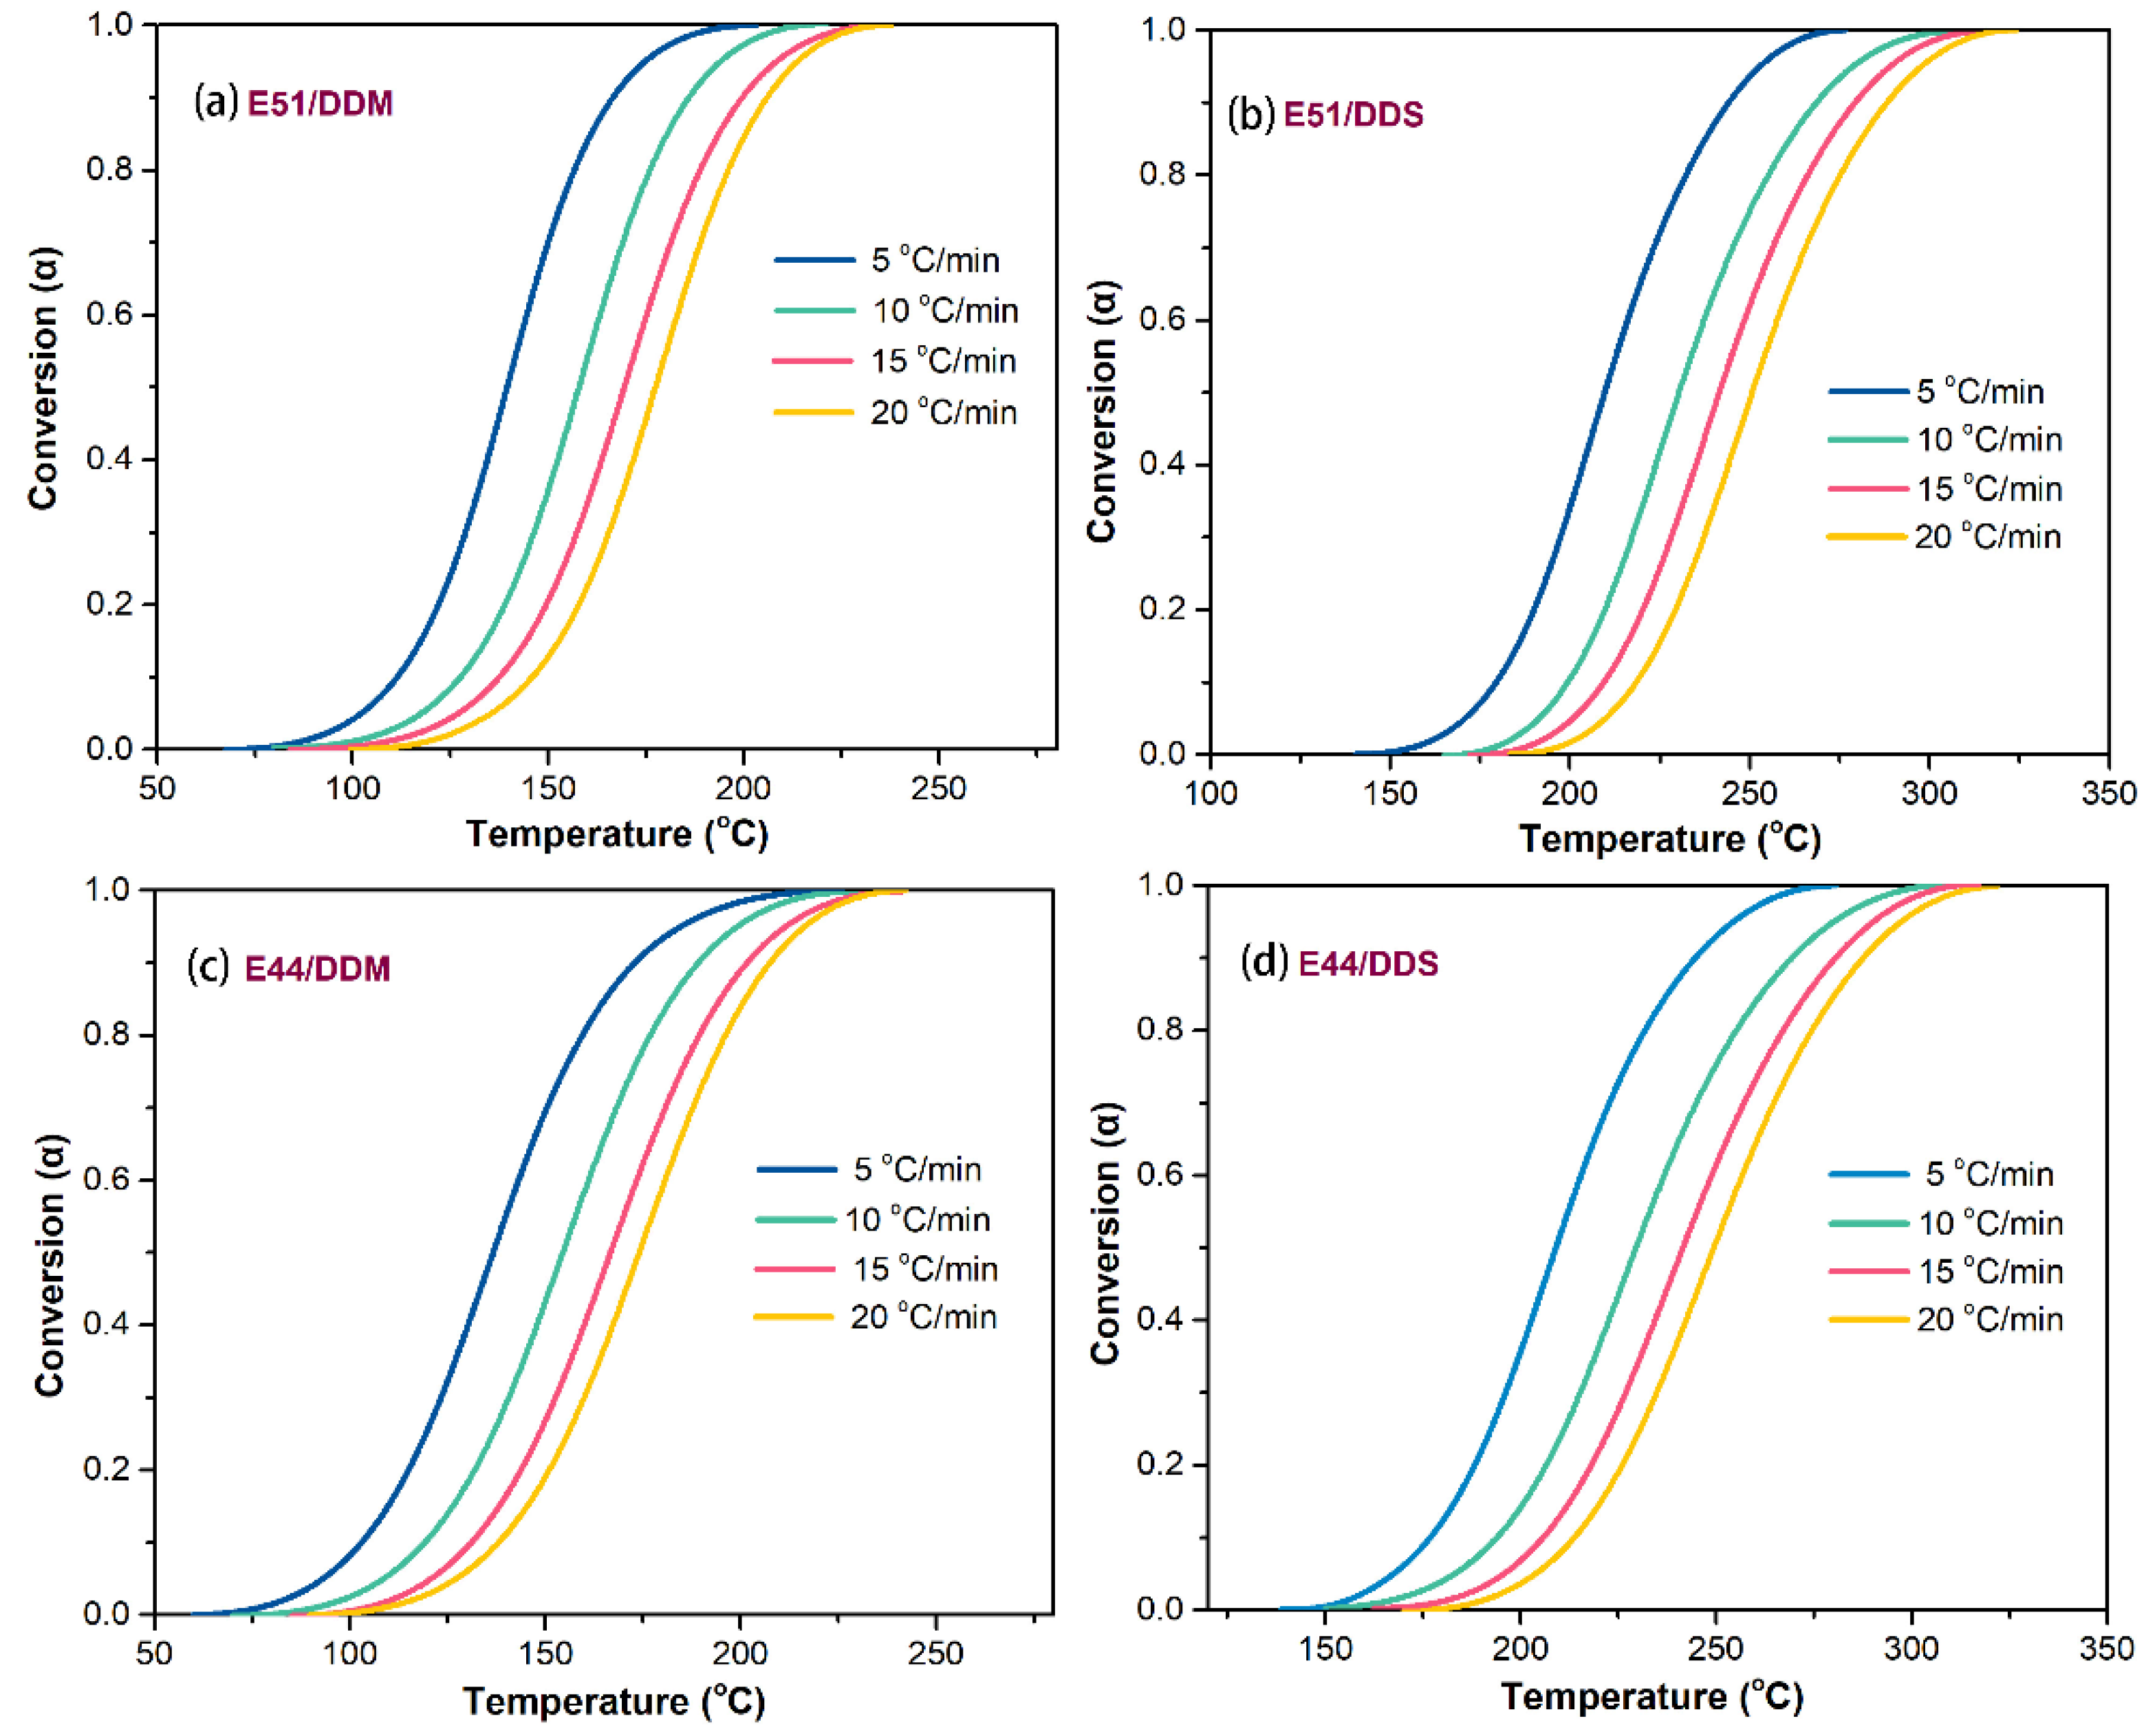
Figure 3.
Plots of ln(β/Tα1.92) vs. 1/Tα for these epoxy systems at different conversion.

Figure 4.
Plots of Eα vs. α of these epoxy systems at different conversion.
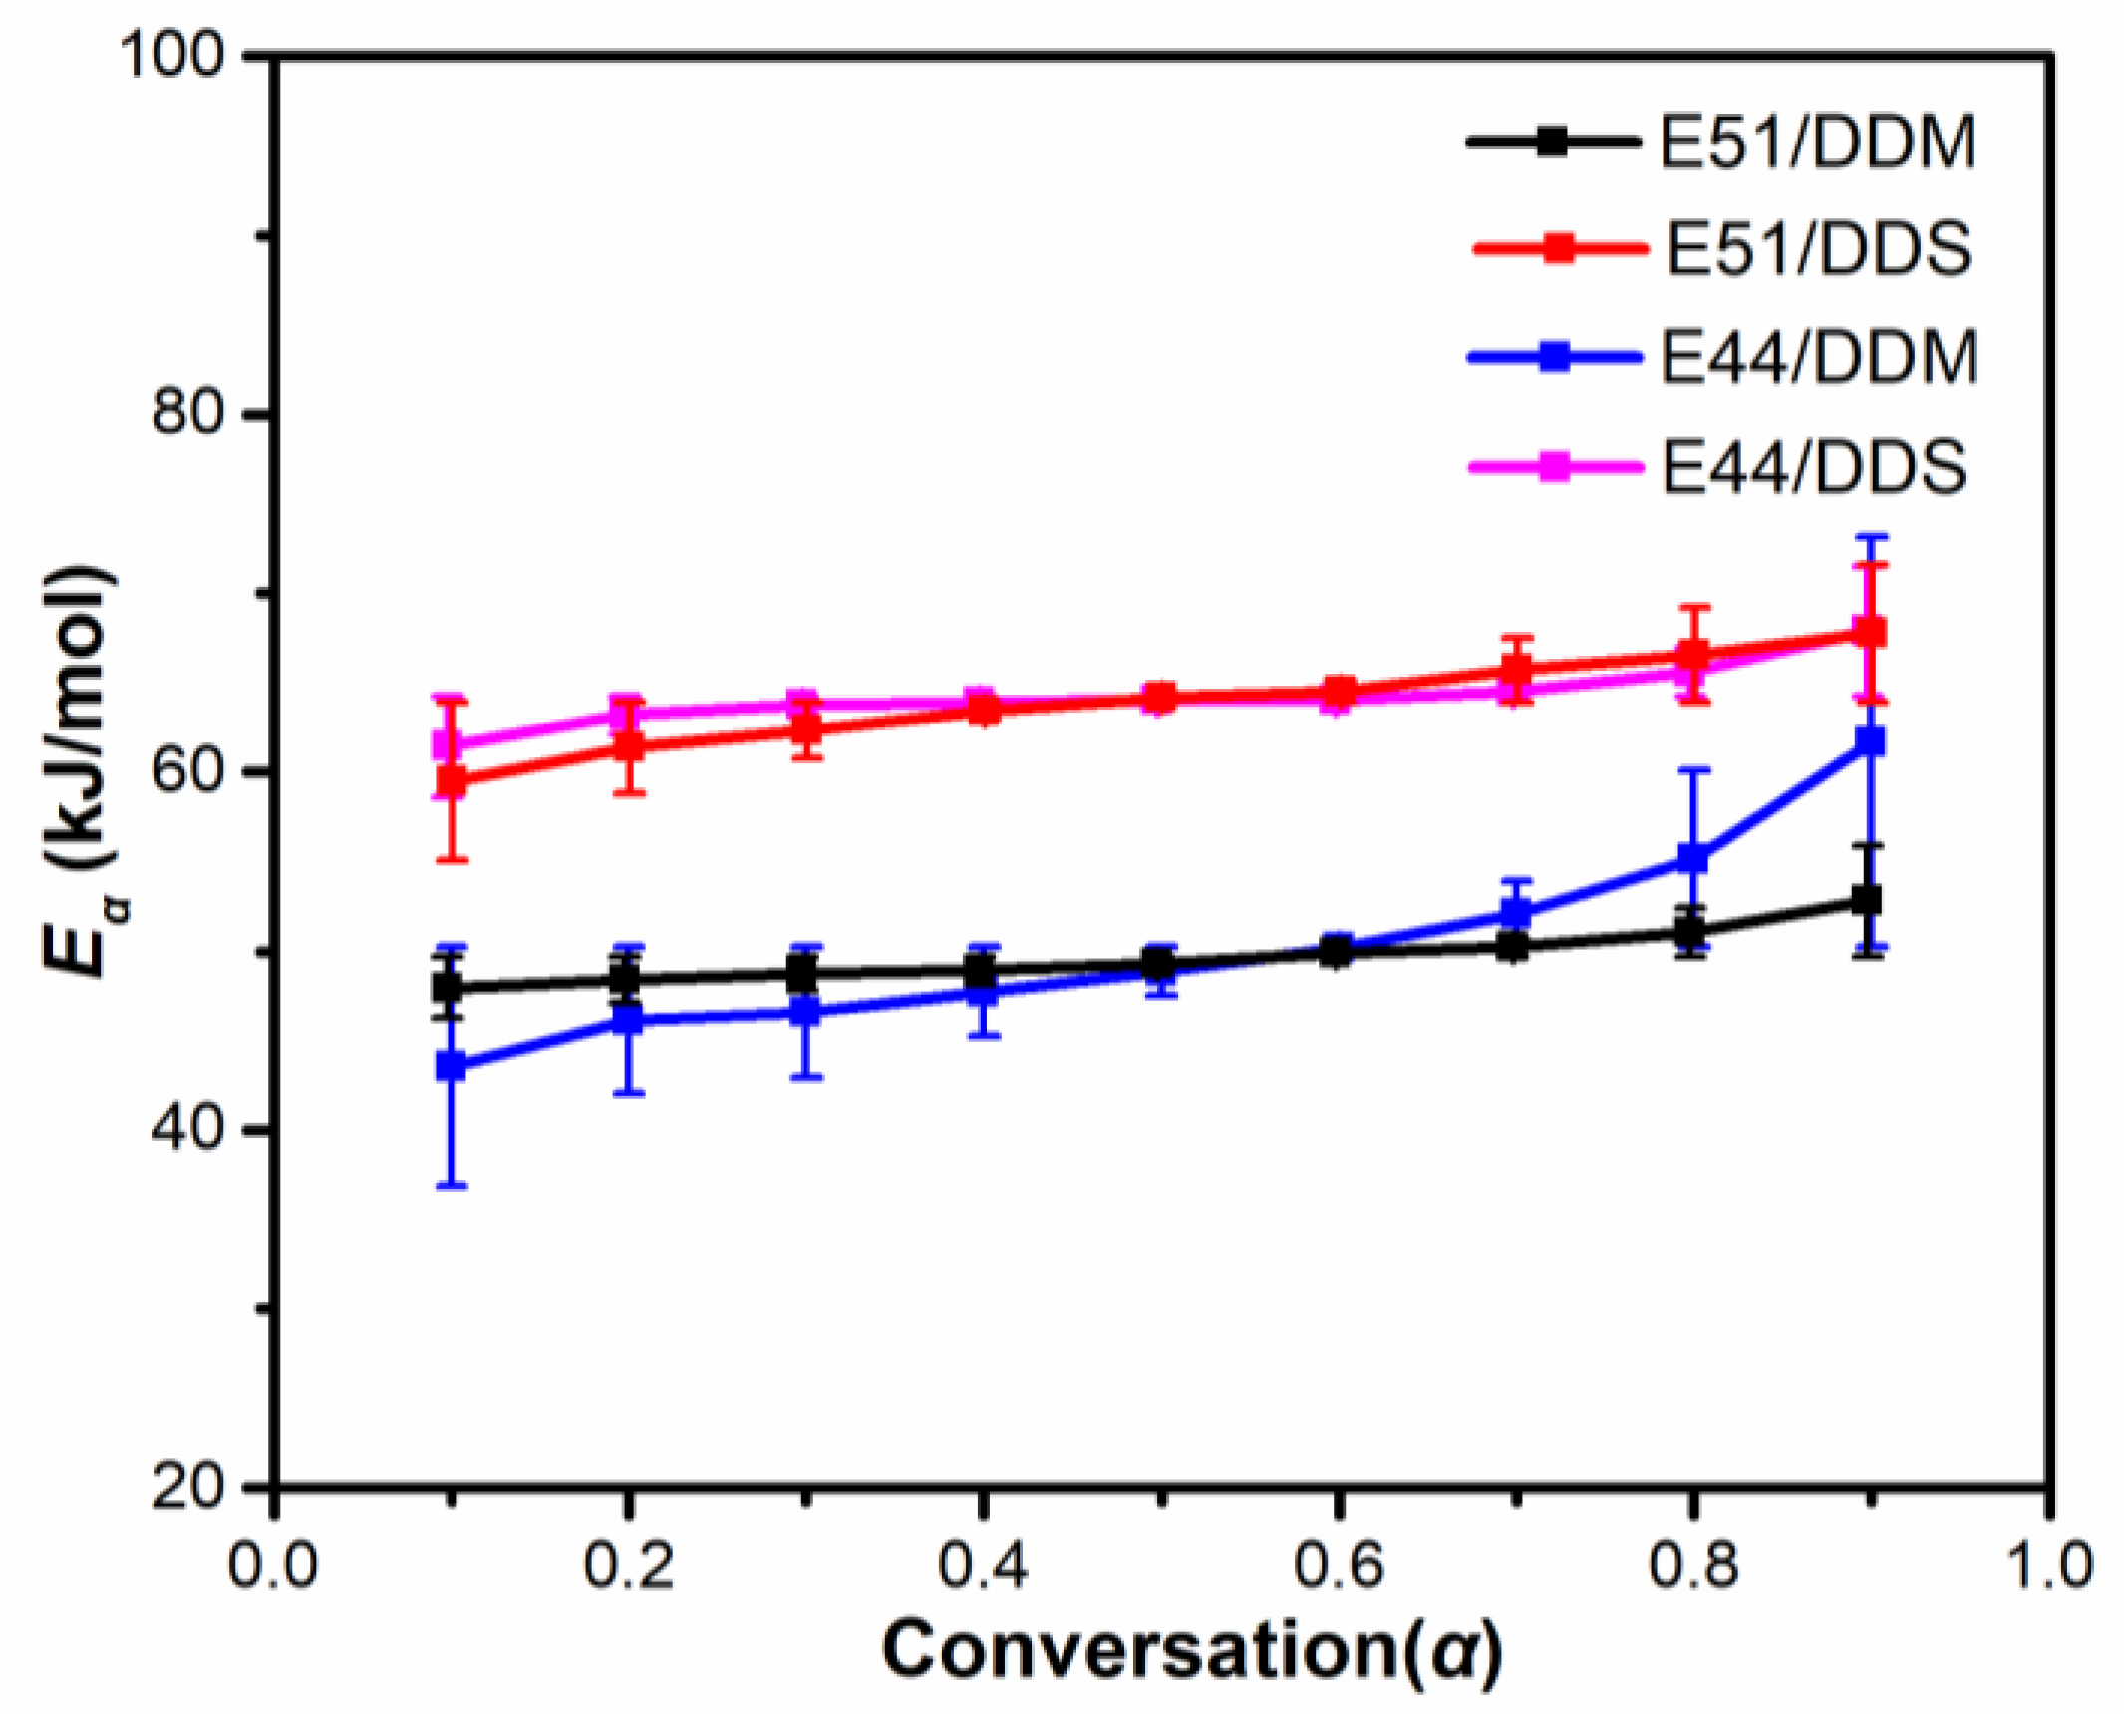
Figure 5.
Viscosity as a function of shear rate at 25 °C for pure E44 and E51 resin.
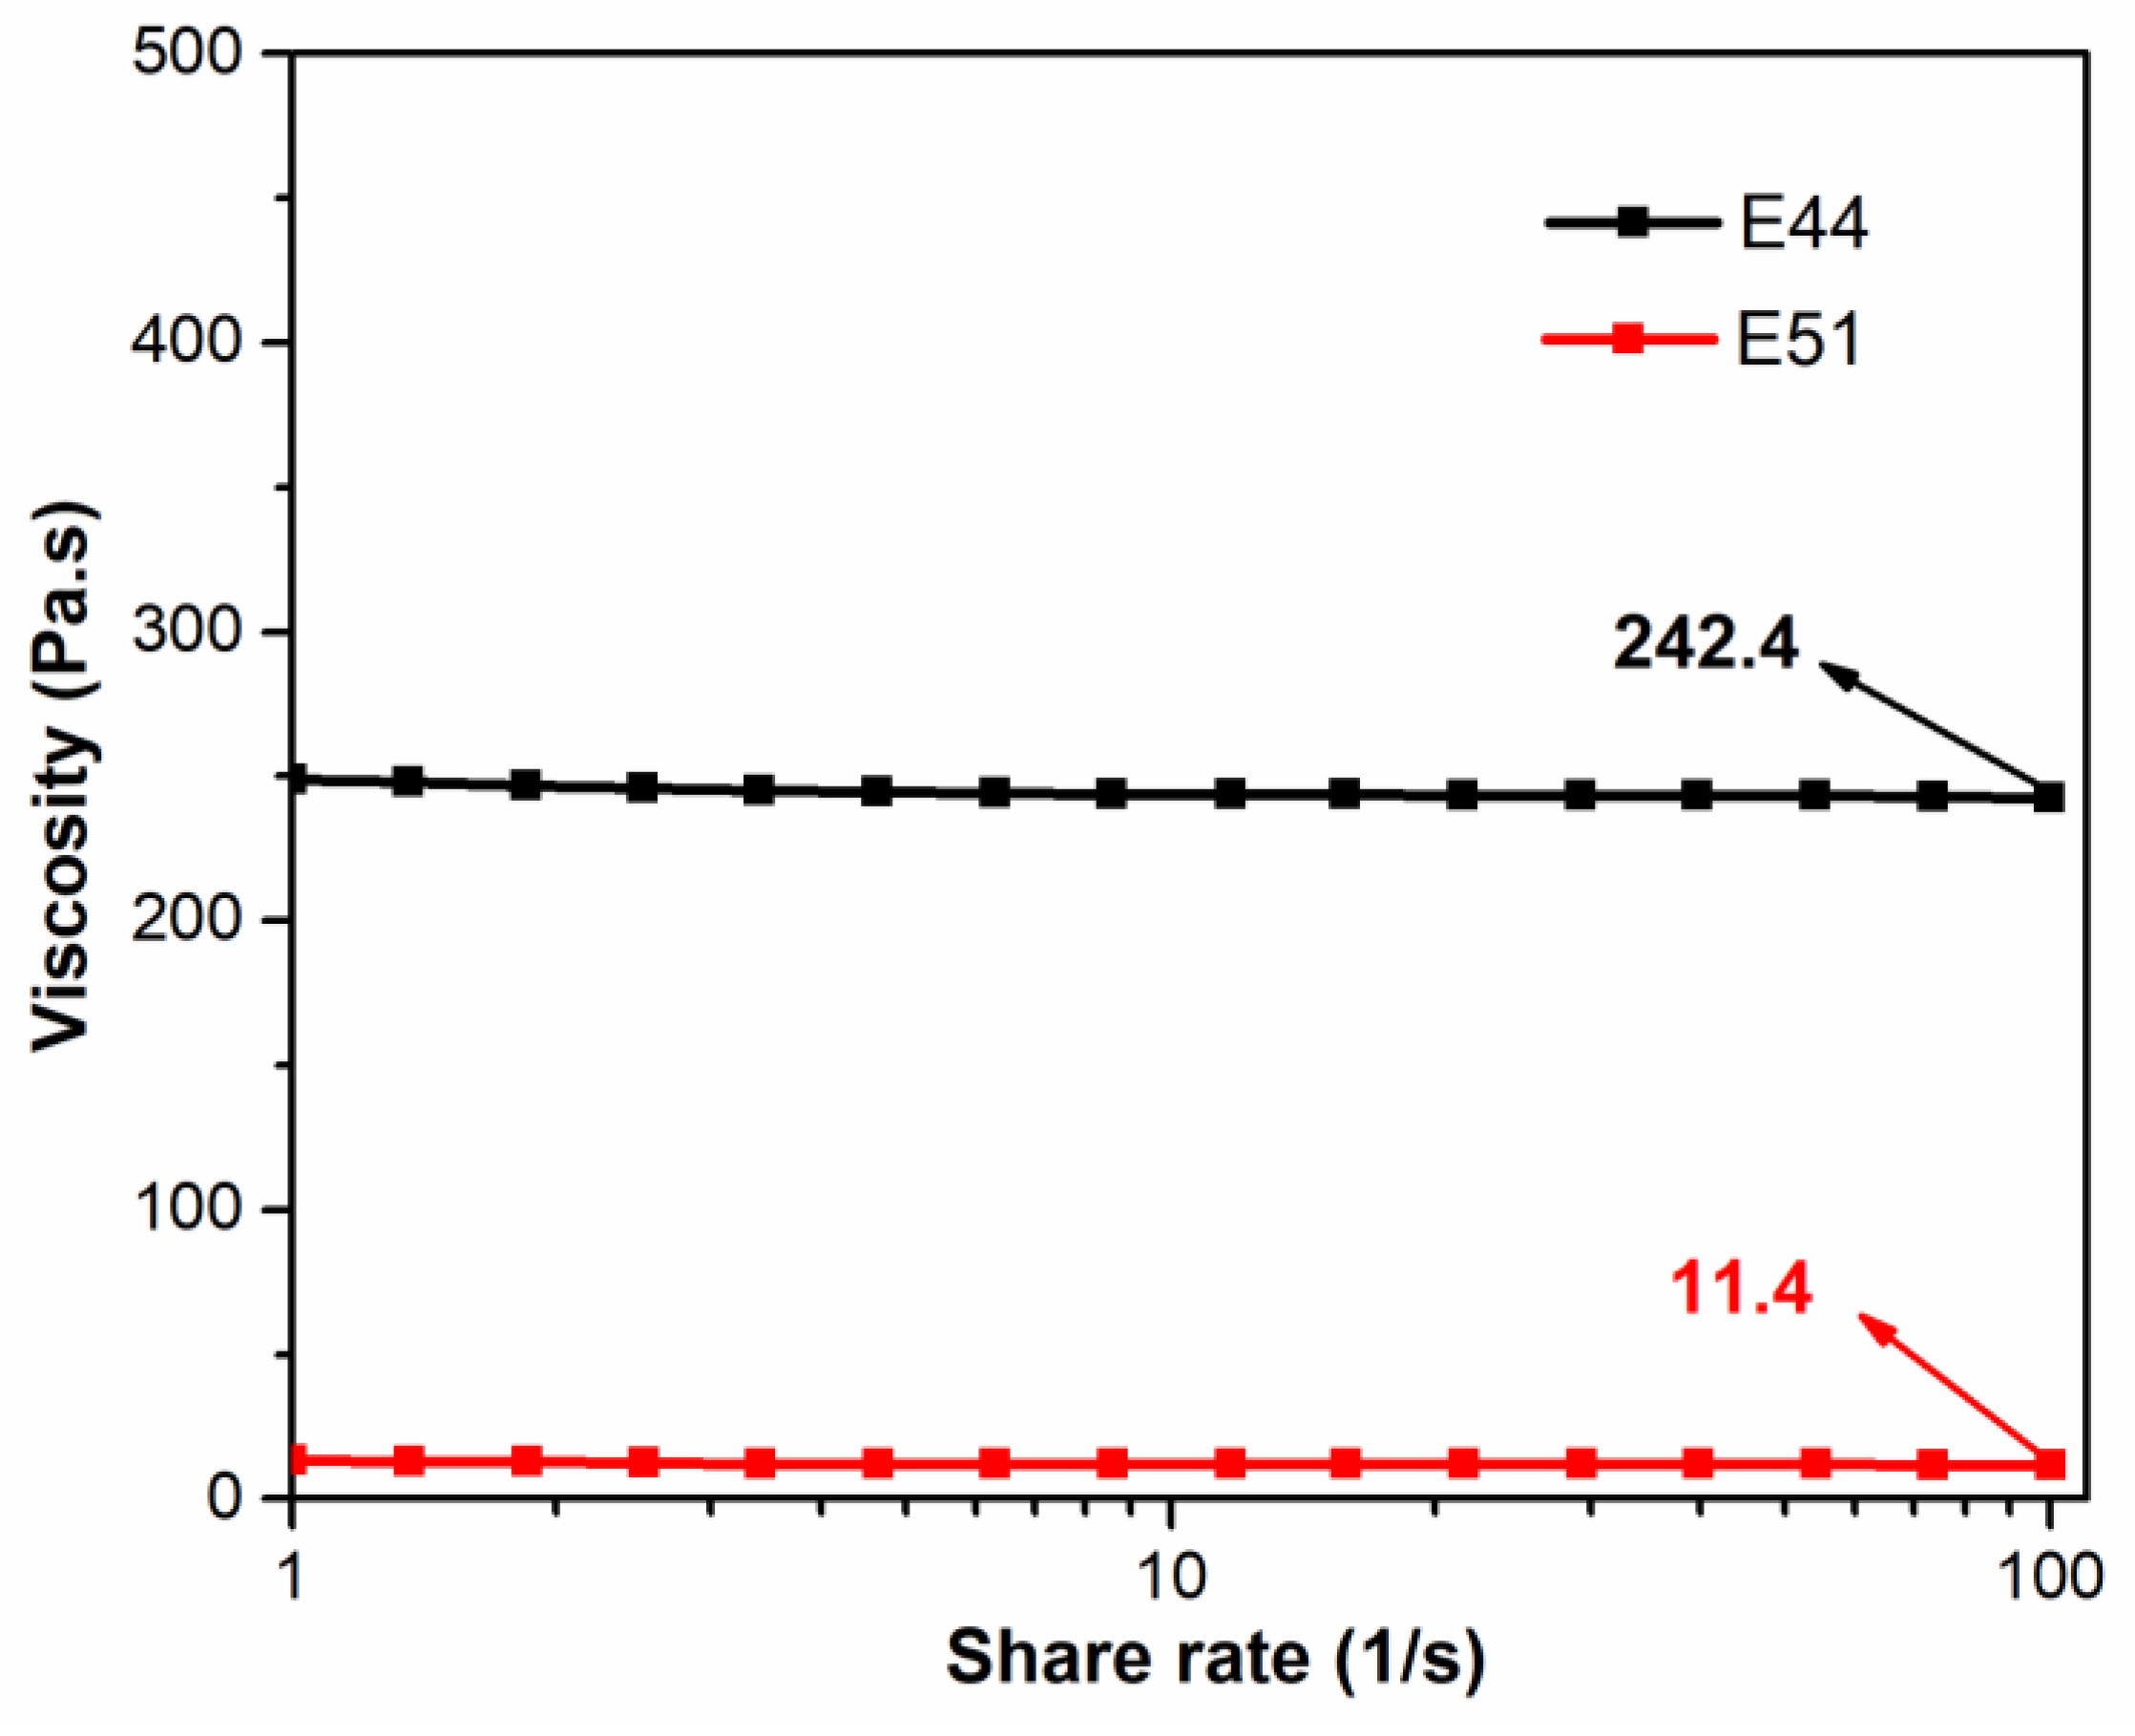
Figure 6.
ATR−FTIR spectra of the four cured epoxy system.
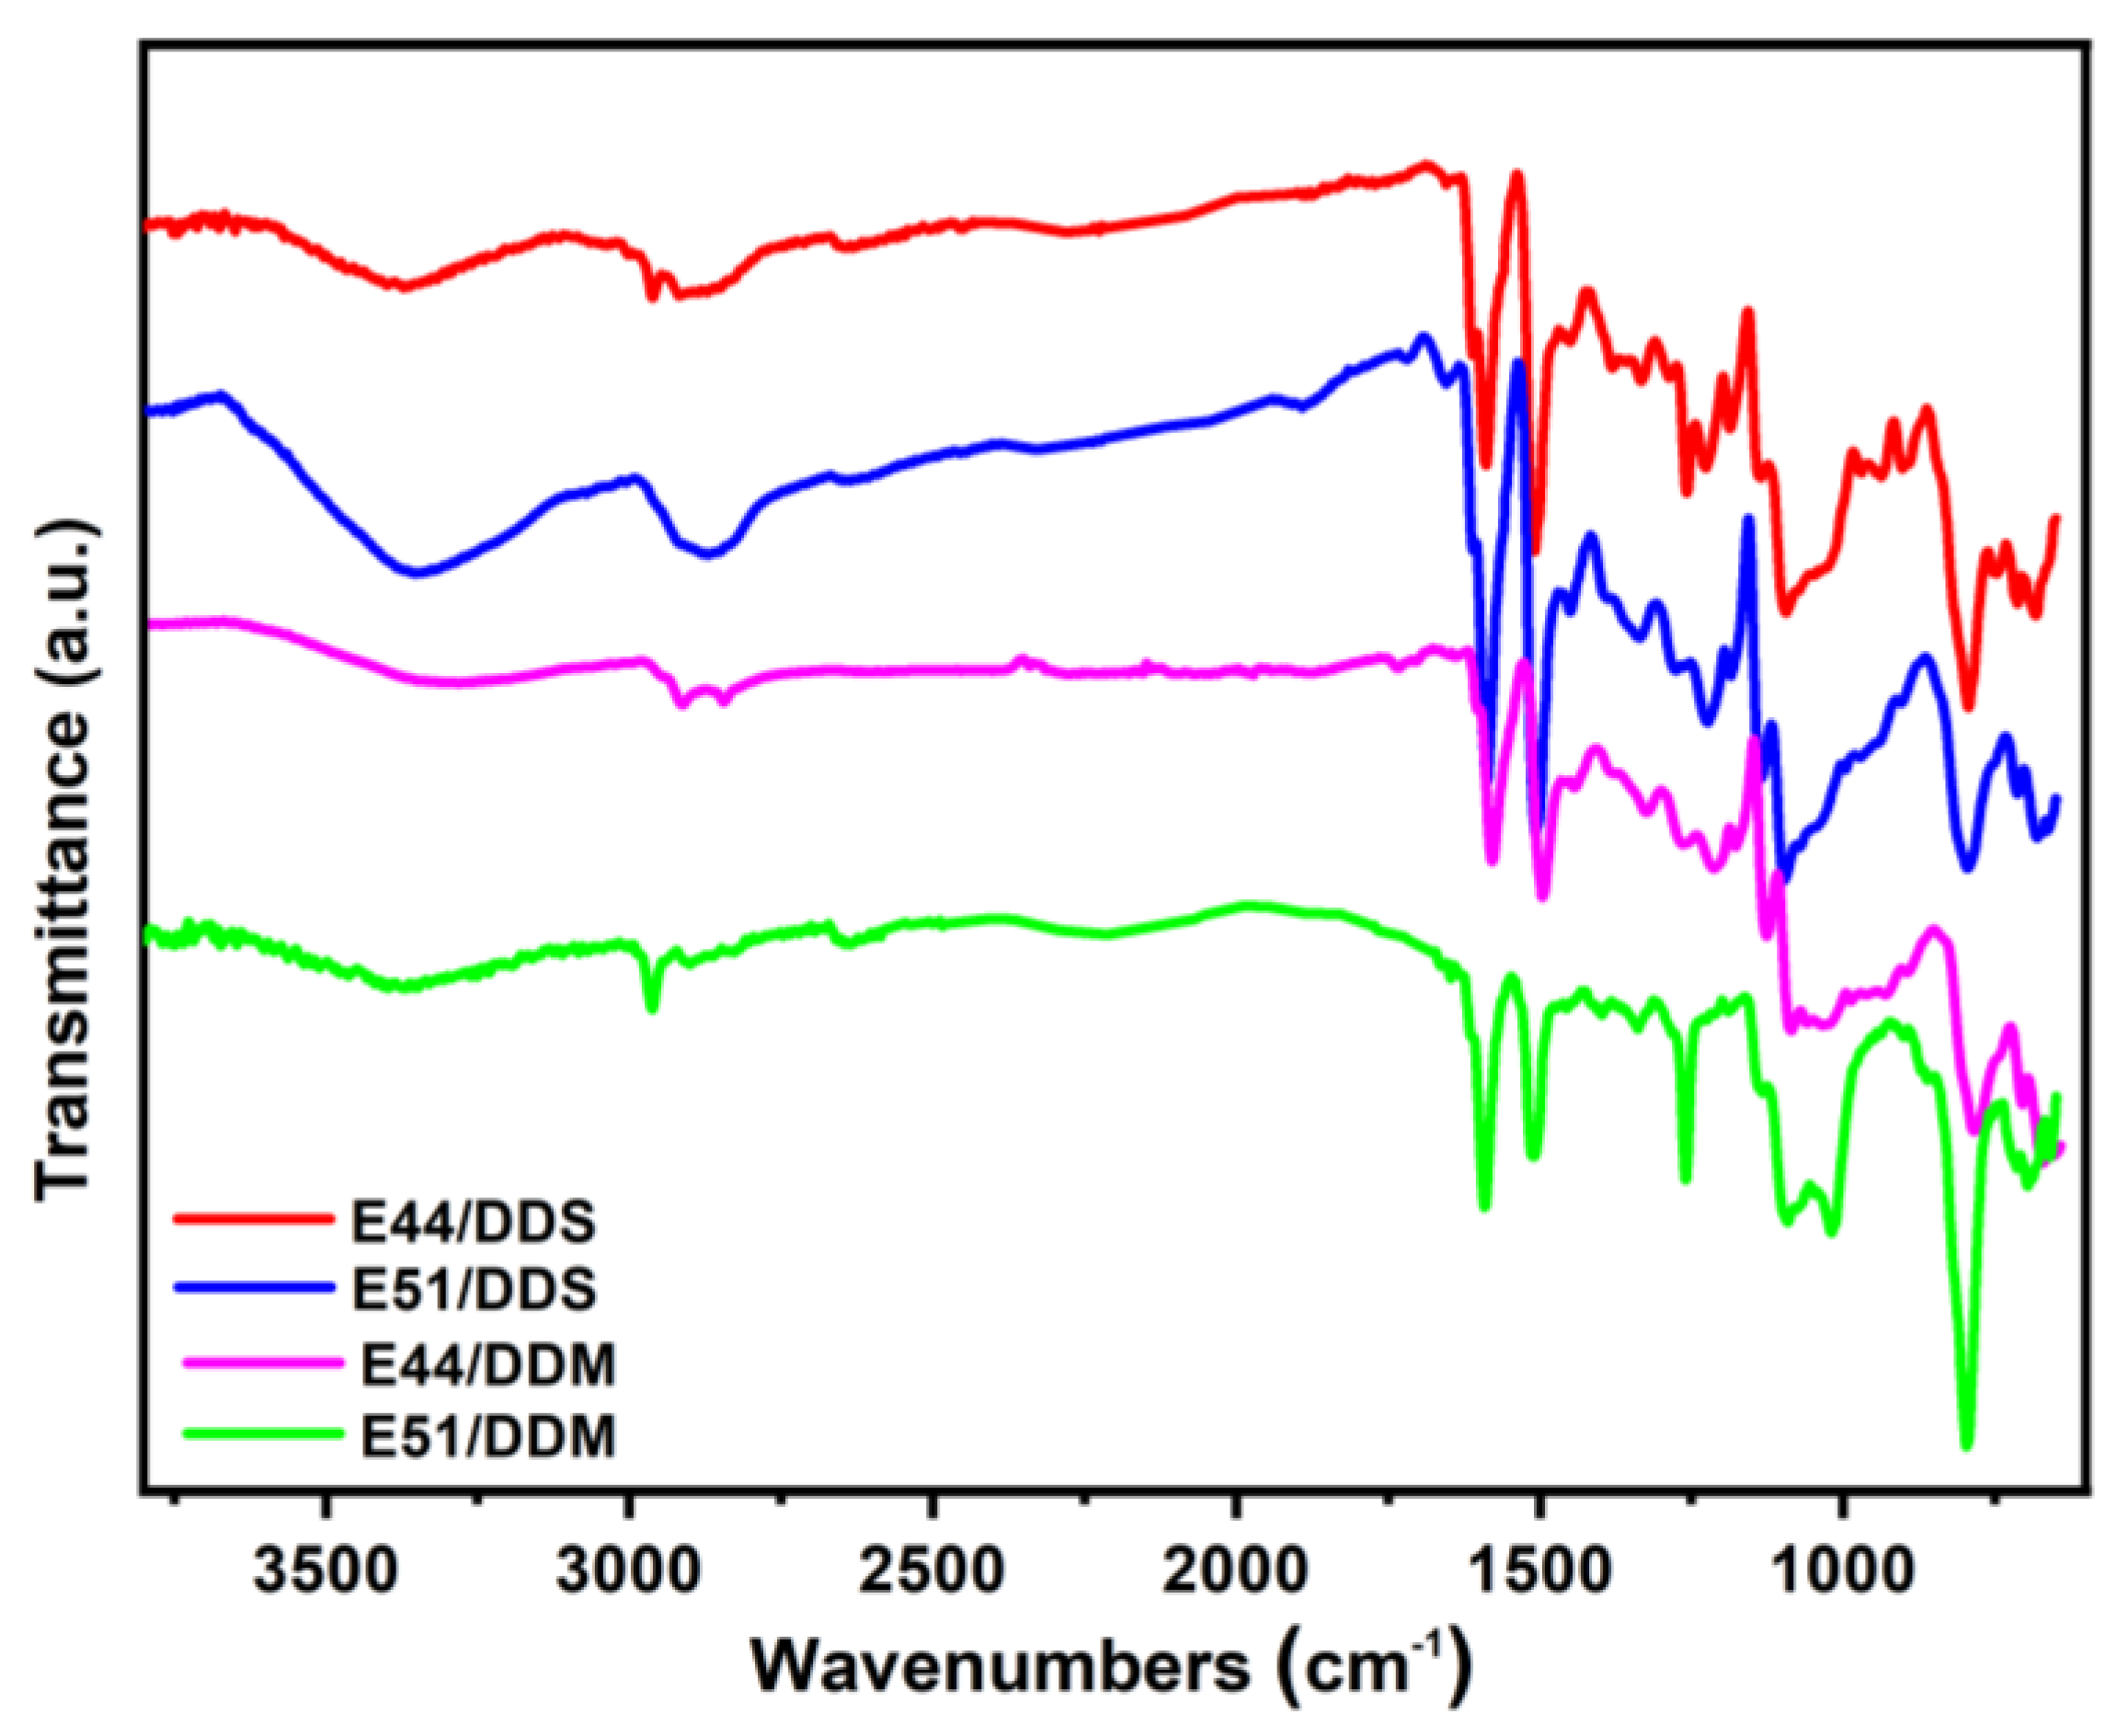
Figure 7.
Complex viscosity as function of temperature for these epoxy system.
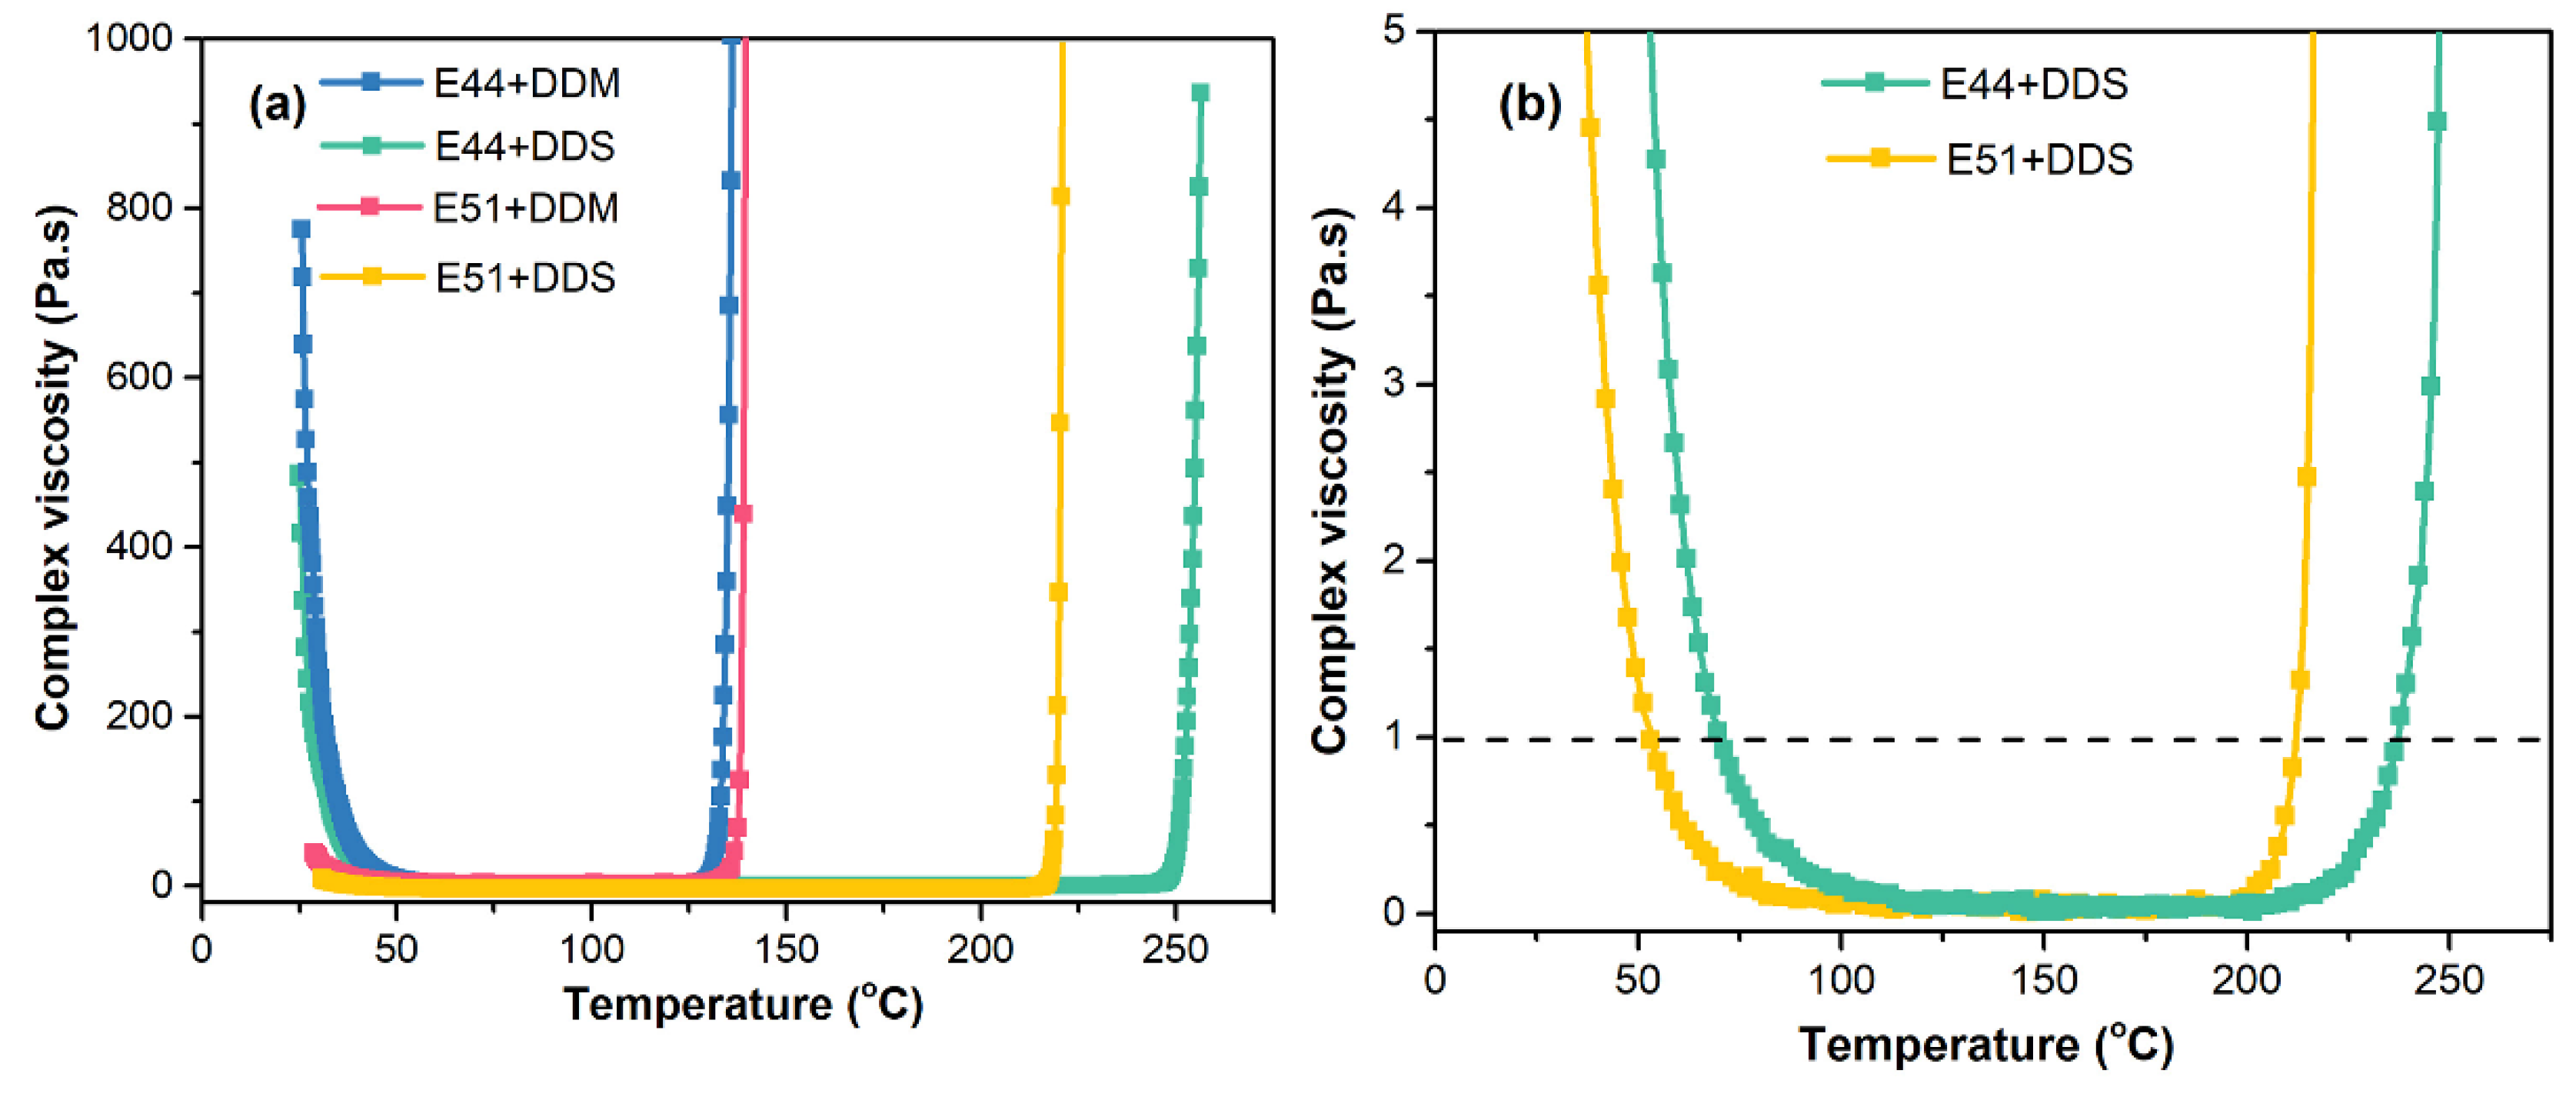
Figure 8.
Reaction rate vs. conversion of these epoxy systems at different heating rates.
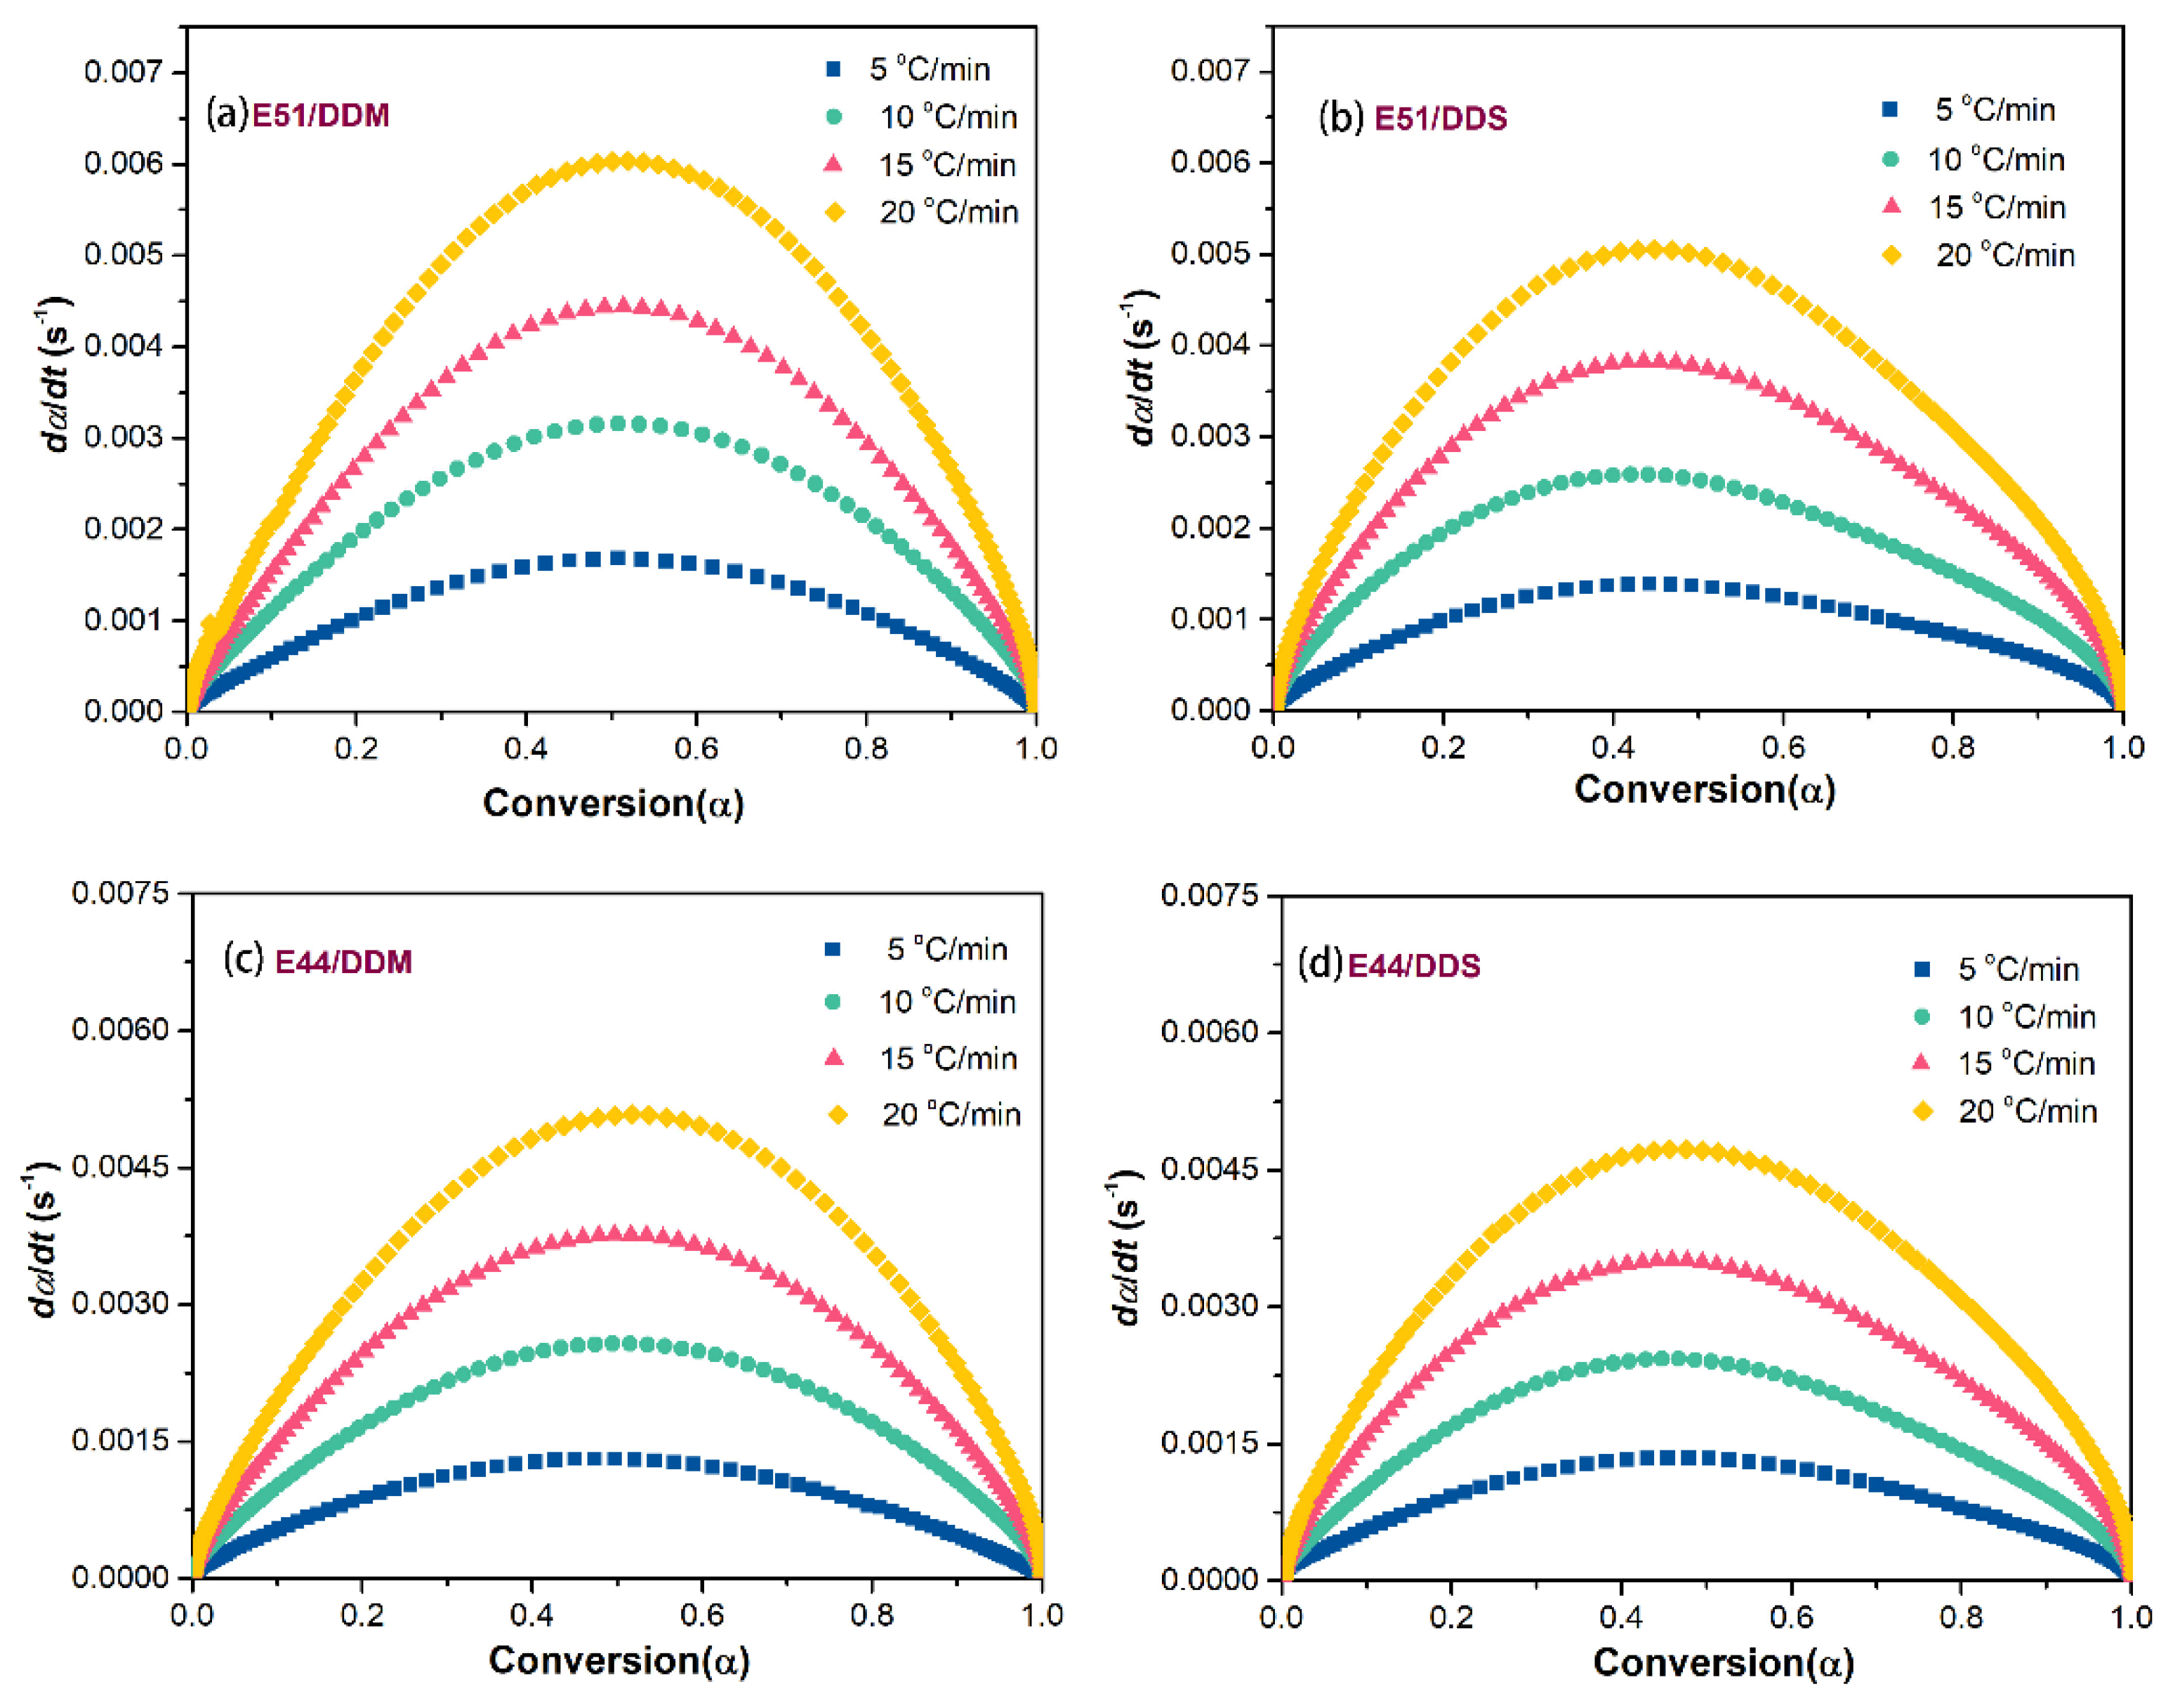
Figure 9.
Plots of ln(da/dt) + Ea/RT vs. ln(1-a) of these epoxy systems at different conversion.
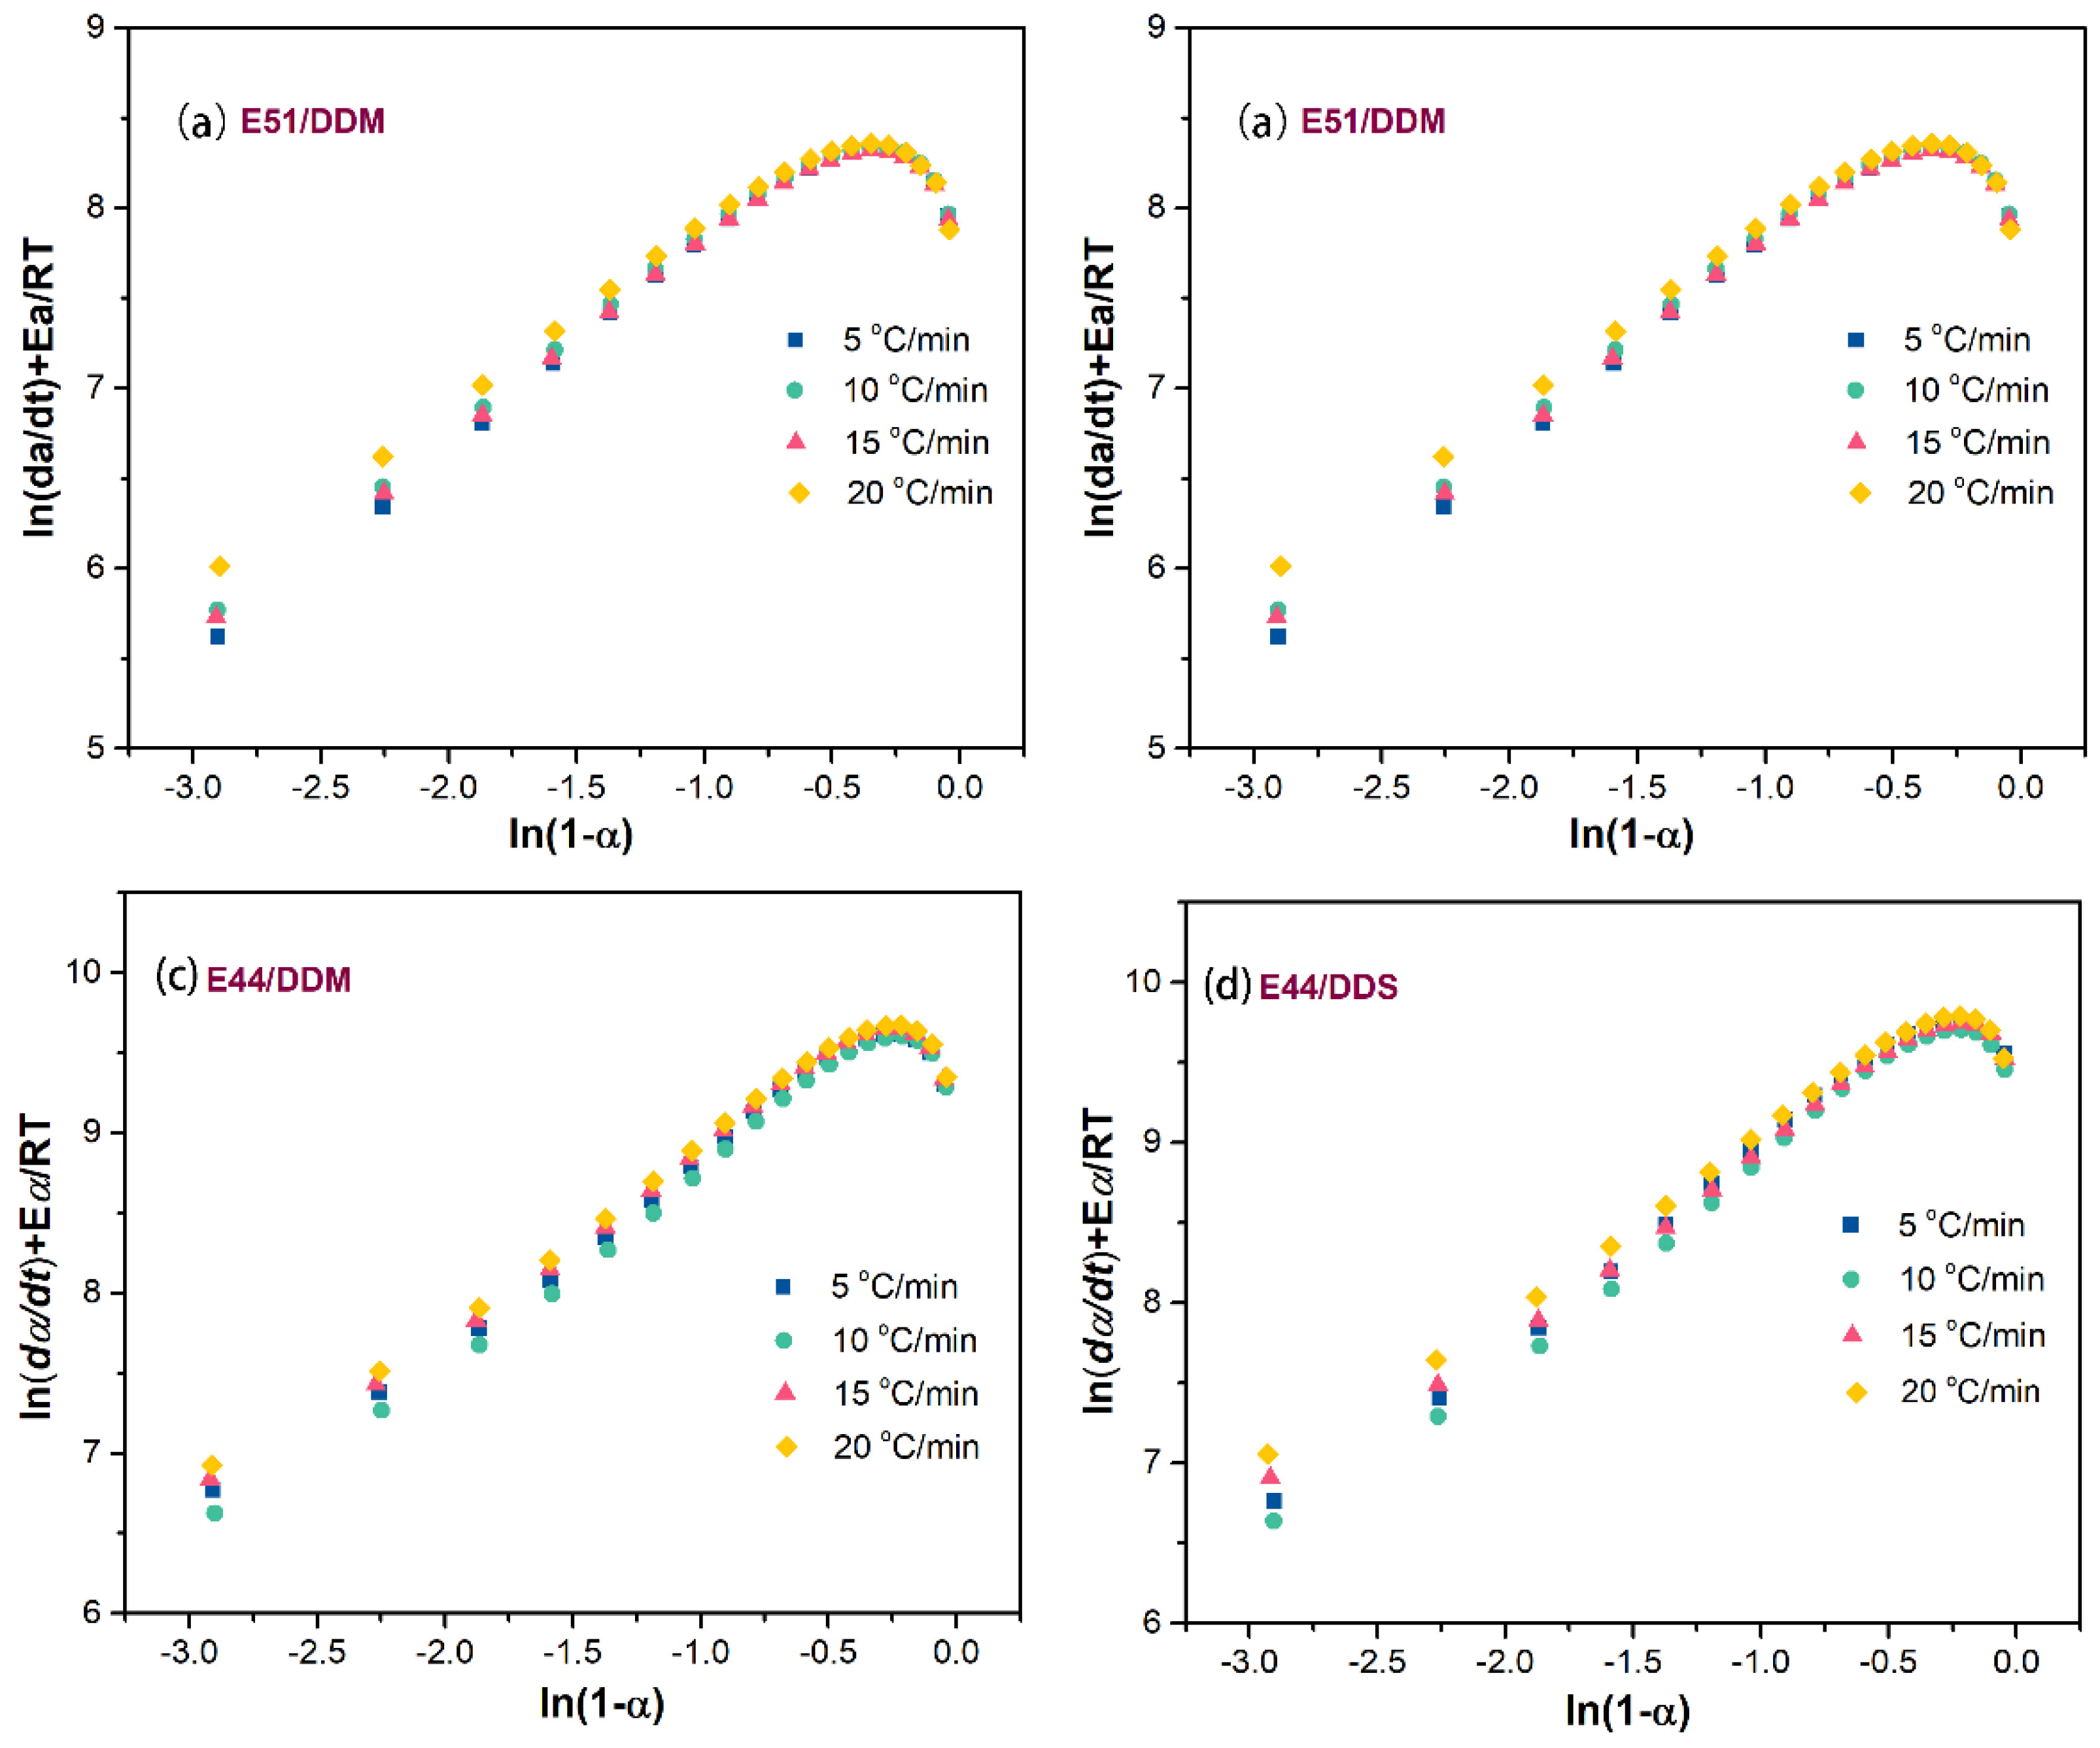
Figure 10.
Comparison of theoretical (lines) and experimental (points) values of curing reactions rate equation.
Figure 10.
Comparison of theoretical (lines) and experimental (points) values of curing reactions rate equation.
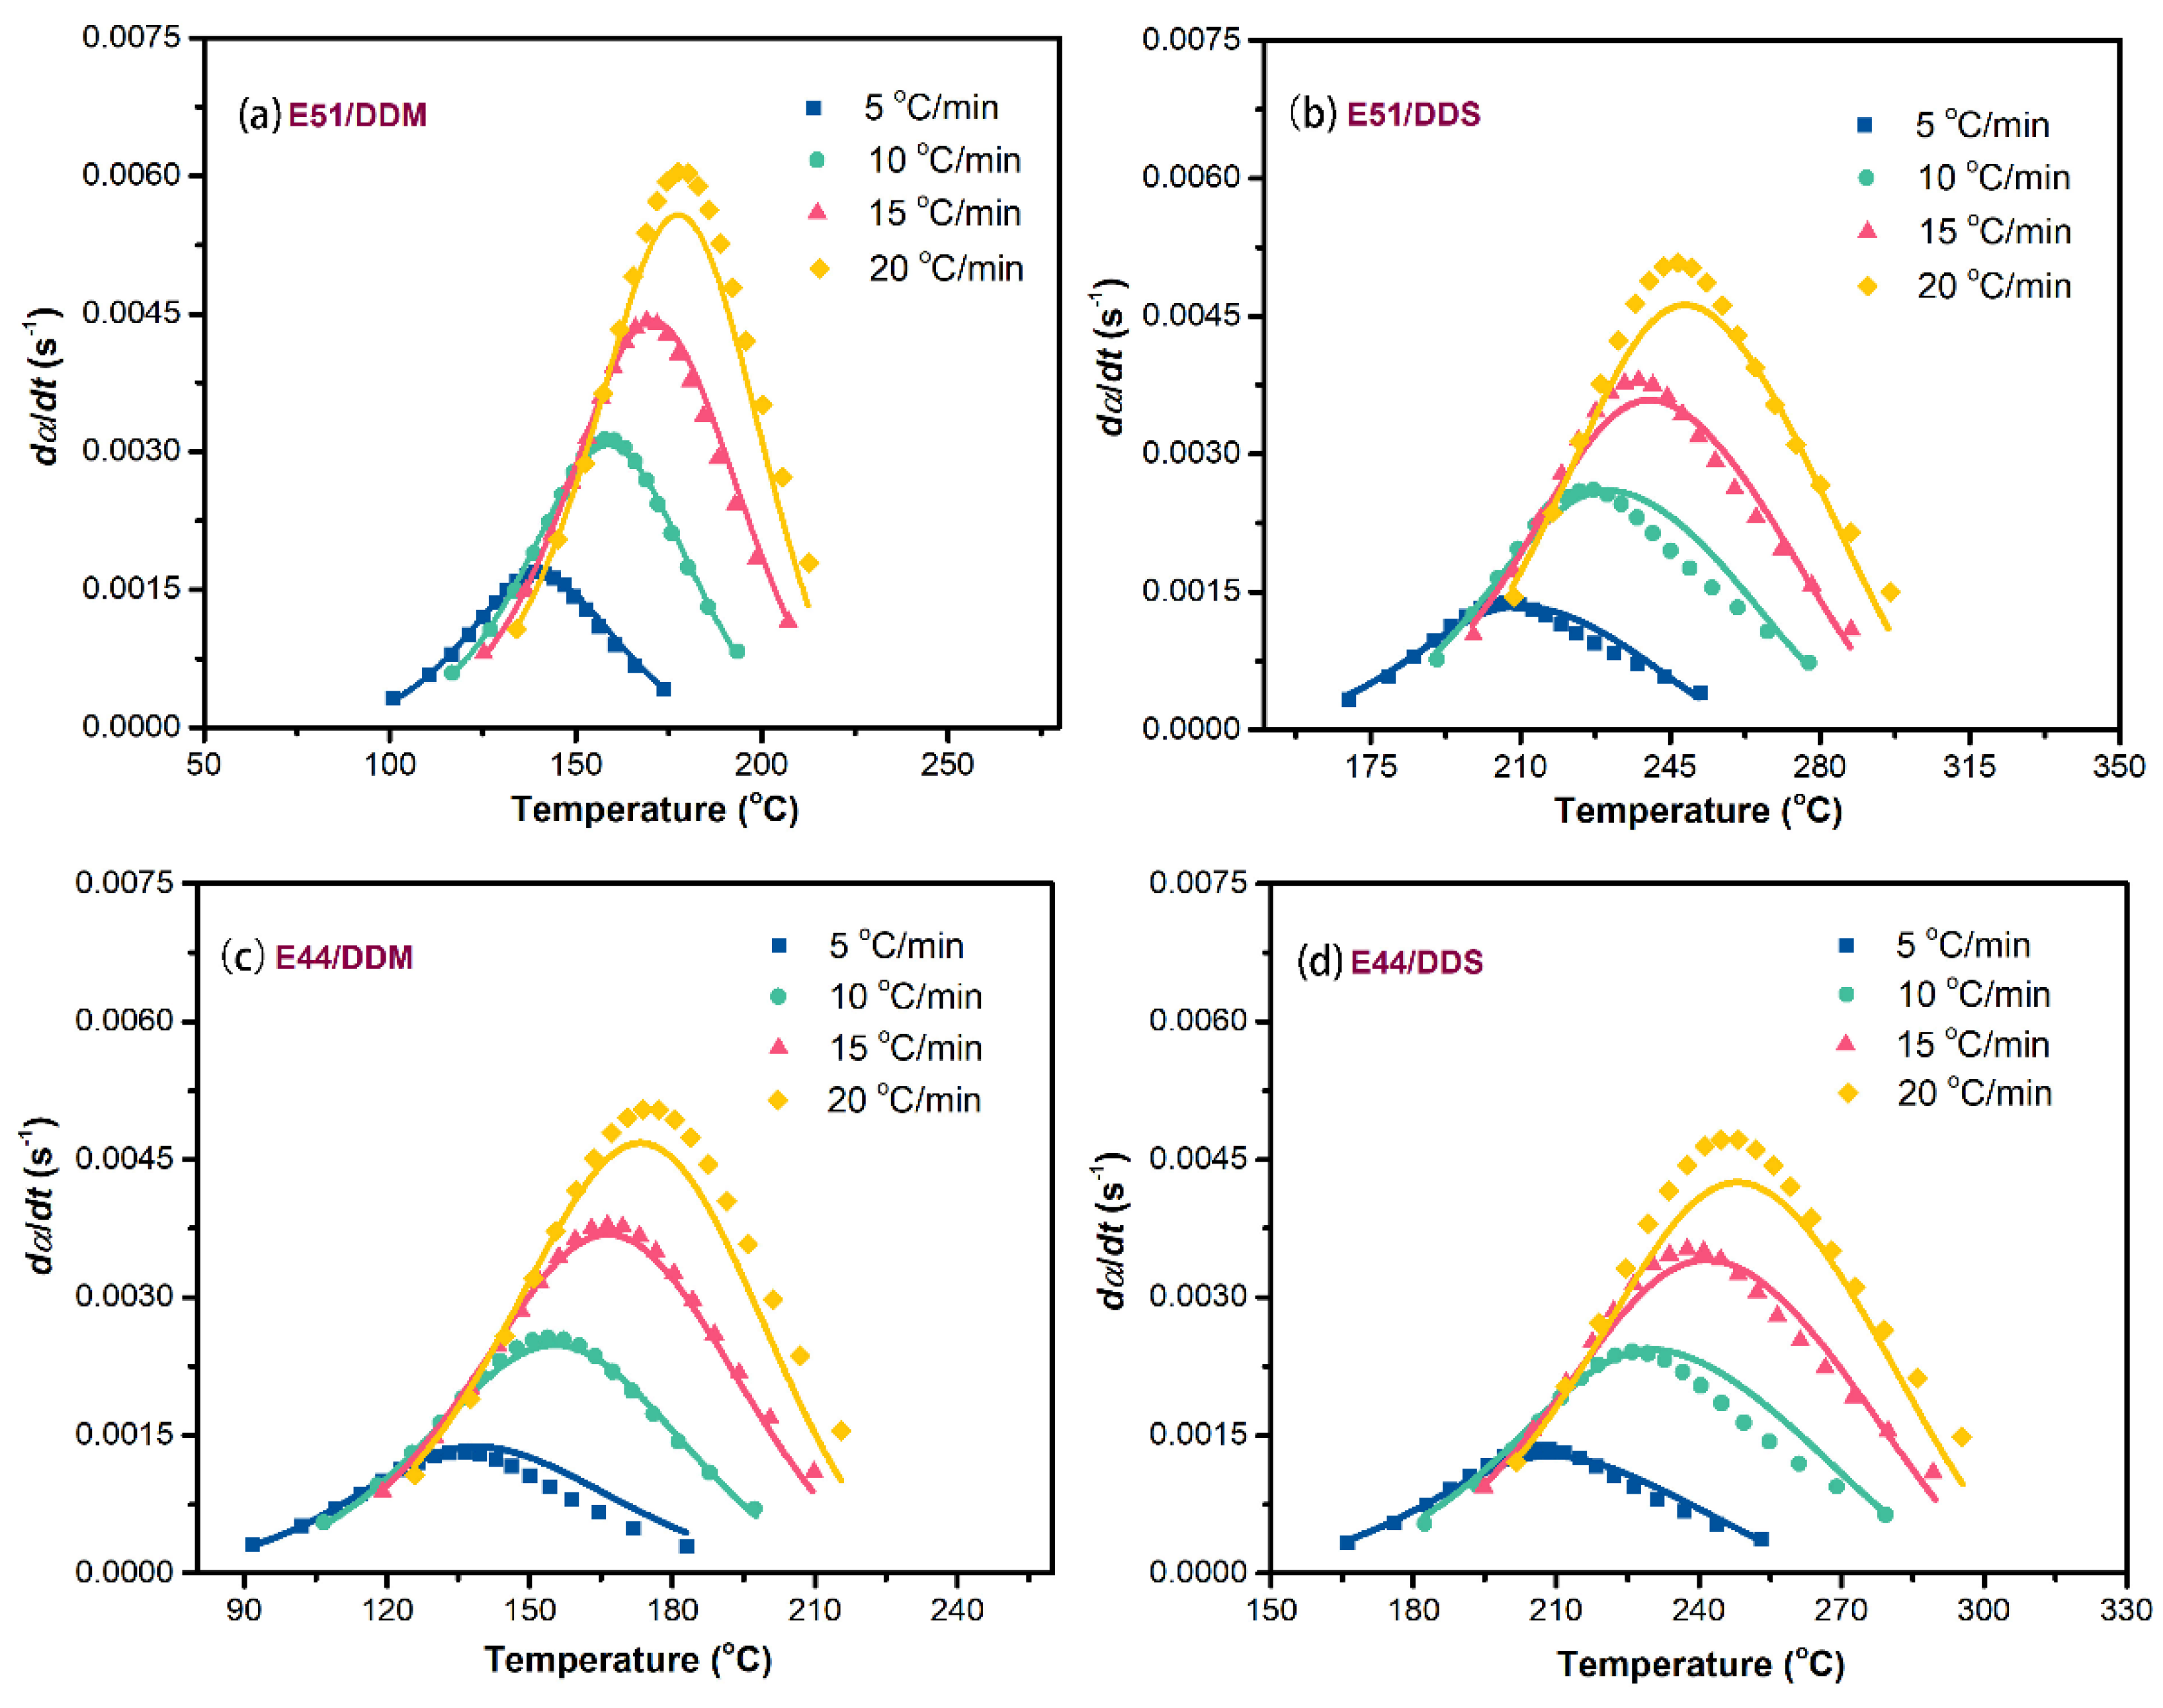

Table 1.
Kinetic parameters for these epoxy systems.
| Reaction system | β(°C /min) | lnA | n | m | Correlation coefficient(R2) |
|---|---|---|---|---|---|
| E51/DDM | 5 | 9.29 | 1.27 | 0.42 | 0.9994 |
| 10 | 9.25 | 1.21 | 0.41 | 0.9991 | |
| 15 | 9.23 | 1.22 | 0.41 | 0.9985 | |
| 20 | 9.27 | 1.14 | 0.43 | 0.9985 | |
| average value | - | 9.26 | 1.21 | 0.42 | 0.9989 |
| E51/DDS | 5 | 10.29 | 1.27 | 0.27 | 0.9987 |
| 10 | 10.27 | 1.30 | 0.26 | 0.9991 | |
| 15 | 10.31 | 1.25 | 0.27 | 0.9987 | |
| 20 | 10.33 | 1.23 | 0.27 | 0.9993 | |
| average value | - | 10.30 | 1.26 | 0.27 | 0.9990 |
| E44/DDM | 5 | 9.24 | 1.45 | 0.24 | 0.9986 |
| 10 | 9.18 | 1.26 | 0.24 | 0.9991 | |
| 15 | 9.14 | 1.22 | 0.24 | 0.9987 | |
| 20 | 9.16 | 1.14 | 0.25 | 0.9993 | |
| average value | - | 9.18 | 1.27 | 0.24 | 0.9990 |
| E44/DDS | 5 | 10.47 | 1.33 | 0.27 | 0.9956 |
| 10 | 10.41 | 1.36 | 0.27 | 0.9955 | |
| 15 | 10.33 | 1.23 | 0.21 | 0.9938 | |
| 20 | 10.40 | 1.19 | 0.24 | 0.9945 | |
| average value | - | 10.40 | 1.28 | 0.25 | 0.9950 |
Table 2.
Reaction rate equation of each reaction system.
| Reaction system | |
|---|---|
| E51/DDM | dα/dt =e9.26 e(-5995.51/T) α0.42 (1-α)1.21 |
| E51/DDS | dα/dt =e10.30 e(-7653.47/T) α0.27 (1-α)1.26 |
| E44/DDM | dα/dt =e9.18 e(-6039.13/T) α0.24 (1-α)1.27 |
| E44/DDS | dα/dt =e10.40 e(-7726.23/T) α0.25 (1-α)1.28 |
Disclaimer/Publisher’s Note: The statements, opinions and data contained in all publications are solely those of the individual author(s) and contributor(s) and not of MDPI and/or the editor(s). MDPI and/or the editor(s) disclaim responsibility for any injury to people or property resulting from any ideas, methods, instructions or products referred to in the content. |
© 2025 by the authors. Licensee MDPI, Basel, Switzerland. This article is an open access article distributed under the terms and conditions of the Creative Commons Attribution (CC BY) license (http://creativecommons.org/licenses/by/4.0/).
Copyright: This open access article is published under a Creative Commons CC BY 4.0 license, which permit the free download, distribution, and reuse, provided that the author and preprint are cited in any reuse.


