
Submitted:
26 August 2025
Posted:
28 August 2025
You are already at the latest version
Abstract
Color accuracy is both important and elusive in cultural heritage imaging. An established method for improving color accuracy is dual-RGB imaging, where RGB images of an object are captured sequentially under two different conditions, then combined. As part of an initiative to increase accessibility to color-accurate imaging, the use of lighting filters with the dual-RGB method is investigated. Gel lighting filters are low-cost and can be directly integrated into an imaging workflow by placing them in front of the existing light sources. This research found that color accuracy can be increased by using lighting filters, but can also be decreased by a poor selection of filter combinations. The identity of the best-performing filters is highly dependent on the light source and can be affected by the pixels selected to represent the color target. Current simulation approaches are insufficient to predict which filters will increase color accuracy. While lighting filters are a promising method for accessible multispectral imaging, the practical implementation is complex and requires further research and adjustments to the method.
Keywords:
multispectral imaging
; color accuracy
; dual-RGB
; optical filters
; gel filters
1. Introduction
Accurate color capture is essential in cultural heritage imaging, most obviously for documenting and digitizing visual artworks such as paintings, dyed materials, and illuminated manuscripts. Color can also be used as an analytical tool, for example, to assess fading after an artifact is placed on display, or to document changes from before and after a conservation treatment. As more art and artifacts are being made available for viewing online and in digital archives, the way that color is represented can significantly impact how large populations interact with cultural heritage.
In this article, the term color accuracy is used in the same way as it is defined in the FADGI Technical Guidelines for Digitizing Cultural Heritage Materials [1], referring to the encoded color, rather than the perceptual color of a digital or printed copy. The issue of displaying a copy to match the physical scene will not be discussed here. Color accuracy is assessed using , a metric that quantifies the perceptual difference between colors. The FADGI guidelines outline acceptable color tolerances, which vary by quality and materials. The tightest requirements (4-star) require a mean , and a 90th percentile of ≤ 4 [1].
One of the main issues that hinders color-accurate imaging is metamerism. Metamerism occurs when two objects appear to be the same color in one condition, but different colors in another condition. This can happen in two ways: 1 ) Through a change in lighting, or 2 ) Through a change in observer. In imaging, this means that when the same object is captured under different lighting conditions, the images can contain noticeably different colors, even after white balancing. Additionally, since the spectral sensitivities of nearly all cameras are not linearly related to the spectral sensitivities of the human eye, materials that match in color to the human eye can resolve as different colors in an image, and vice versa. Metamerism is especially prevalent in cultural heritage imaging because many pigments and materials are highly susceptible to metamerism [2]. Color cameras were initially designed to capture natural materials and scenes, which can differ greatly in spectral characteristics from pigments and dyes. These spectral differences are the source of metamerism.
One way to address these issues is to use multispectral imaging (MSI). MSI is not consistently defined across disciplines. Here, we define multispectral MSI as a system that captures at least two spatial dimensions and at least four spectral bands. Most MSI systems used in cultural heritage are designed to capture information in the UV, visible, and IR ranges. However, some systems are designed specifically for color reproduction and are limited to the visible spectrum. The main advantage of MSI for color reproduction is that a greater number of channels provides more information about the spectral reflectance or transmittance of the object being imaged, reducing metamerism-related issues. The color for a standard observer and under a standard illuminant can then be calculated.
MSI channels can be created in several ways [3], but can generally be divided into light-based [4,5] or filter-based technologies [6,7,8,9]. MSI methods can be further classified as either narrowband or wideband [10]. Narrowband techniques generally involve capturing small portions of the visible spectrum at a time, and interpolating as necessary to generate a direct estimation of spectral characteristics. Wideband techniques capture large portions of the visible spectrum under different conditions, and generally require an empirically fit model to estimate color or spectral reflectance.
Dual-RGB is an MSI method that utilizes a commercial DSLR camera to take two sets of RGB images under different conditions, resulting in six wideband channels, which are then transformed into a single, color-mastered image. A brief overview of dual-RGB imaging can be found in this technical report [11]. Like most wideband methods, dual-RGB fits a color transformation empirically, causing the quality of the results to depend greatly on the materials used. However, an investigation into the impact of camera brand determined that it was not a practically significant factor [4].
Previous implementations of dual RGB have used either camera filters [12,13,14] or LED light sources [4,5,15,16,17]. Camera filters are a familiar tool that can be inexpensive, depending on the material. However, with dual-RGB, the camera filters must be switched out between each image, which can cause misregistration errors due to handling. Tunable LEDs, on the other hand, can often be controlled remotely, reducing the possibility of registration error. Furthermore, small shifts in lighting have less of an impact on the final image than small movements of the camera. However, most high-quality tunable LEDs are expensive.
Much of the recent dual-RGB research has been focused on making the method more accessible [4,16]. The goal is to create a system that is low-cost, easy-to-use, easy-to-integrate, and high-quality. At the moment, it is generally intended to be used with flat, matte objects. One of the main benefits of dual-RGB imaging is that DSLR cameras are already present in most cultural heritage institutions and are familiar tools. As part of this initiative, a free, open-source software, BeyondRGB, was developed to process dual-RGB image sets, eliminating the need for expensive software [18]. Low-cost lighting is one of the few remaining barriers to a fully accessible dual-RGB imaging method.
This paper investigates the possibility of using theatre lighting filters for dual-RGB imaging. Theatre gel filters are available at very low cost and have a wide variety of spectral characteristics. They are easily integrated into an imaging pipeline, simply by attaching them to the existing lights. The quality, accessibility, and feasibility will be assessed to determine if lighting filters are a suitable solution for accessible dual-RGB imaging.
2. Materials and Methods
2.0.1. Filter Selection
To narrow the wide variety of available theatre gel filters, an exhaustive search simulation was created in Matlab to identify a small selection of filters to obtain for physical testing. Two filter datasets were used, containing spectral transmittance information for the Roscolux and Lee Designer’s Edition filters. Polarizers, neutral density filters, filters with less than a 40% transmittance, and filters that lowered any camera signals to less than 10% were excluded from the simulation [19]. To ensure that the filters would be a good selection for a wide variety of camera models, 60 camera sensitivities obtained from the open-source Image Engineering database were used [20]. The spectral power distributions of 5 lights used for imaging in cultural heritage institutions were used, all ranging between 5000K and 5600K CCT. The lights are summarized in Table 1. Spectral reflectances of three color targets were used. The X-Rite Color Checker SG (CCSG) was used as a calibration target, as it is widely available and contains a wide range of colors. The Avian Rochester Next Generation Target (NGT) and a custom artist paint target (APT) were selected for verification, as they encompass colors and reflectances common in cultural heritage documents and paintings. Since dual-RGB uses an empirically fit model, the calibration target is used to generate the model, but the verification targets are used to assess it in order to reduce issues with overfitting. Reference reflectance values for all three targets were obtained using an X-Rite i1Profiler spectrophotometer in M0 measurement mode.
The simulation pipeline is summarized in Figure 1. The spectral characteristics of the filters, cameras, color patches, and lights were multiplied wavelength-by-wavelength and integrated to obtain camera signals for each color patch. These were rescaled by the ratio between the measured luminance and average green signal for the white patch. This was completed for each combination of filter pair, light, and camera (25,878 filter pairs, 5 lights, 60 cameras). Due to the memory required for these calculations, a pseudo-inverse was used to generate the transformation matrix, rather than a non-linear optimization.
The transformation matrix for the filter selection simulation is a matrix describing the contribution of each channel to the values, fit to the reference calibration target data and simulated camera signals for each patch. When applied to a 6-channel signal, it provides estimated coordinates. values are calculated for the verification targets with a D50 whitepoint and the 1931 standard observer. The values are used to describe the color differences between the estimated and reference colors on the targets. The minimum, mean, 90th percentile, and maximum values were summed to generate a ranking index for each filter pair [5]. Nine filters were purchased based on the results. These were further supplemented with eight filters already available within the lab.
2.1. Image Capture
These 17 filters were tested in every pairwise combination, as well as paired with unfiltered light. Two different lights were used with the filters. First, Broncolor Pulso G strobes. Second, a D50 approximation with tunable LEDs. Traditional single RGB capture was used for comparison. The lights were set up in a copy stand setup with the lights at a 45° angle. The filters were attached to the lights with magnets and manually changed between images.
All images were captured with a Canon EOS 5D Mark II camera in raw, and processed in BeyondRGB. The software requires three types of images captured under the same lighting and camera settings. First, an image of a flat, white board which is used for post-camera flatfielding [21]. Second, a dark current image was captured with the lens cap on. Third, an image containing color targets, which can also contain the object to be documented. Additional images containing other objects of interest can also be processed as needed.
The exposure was set to be the highest exposure without overexposure to improve the signal-to-noise ratio. Given that the transmittance of each filter differs, it was necessary to first identify the highest exposure for each filter and the highest exposure for the unfiltered light. This was done by examining the flatfield images and ensuring the camera signals remained below saturation for all channels. For the tunable LEDs, exposure was adjusted by changing the shutter speed. For the Broncolor strobes, the exposure was adjusted by F-stop. All images were captured at base ISO.
The color target images contained the same CCSG and NGT targets that were used in the filter selection simulation. The targets were placed as close to the center of the frame as possible to minimize any specular highlights, and manually adjusted as needed to ensure that no highlights were visible in the image, as this would interfere with the color calibration. Registration targets were also placed within the scene to help the BeyondRGB software register the two captures.
2.2. Image Processing
The images for every pairwise combination of filters were processed using the BeyondRGB software. A thorough overview of the software can be found here: [22,23]. A brief overview of the pipeline can be seen in Figure 1.
The images are rescaled to fit the full 16-bit range of the output TIFF. Dark current correction is applied to account for fixed-pattern noise through pixel-wise subtraction, and post-camera flatfielding is applied by pixel-wise division to account for non-uniformities introduced by lighting and camera optics. These are rescaled to account for the luminance of the flatfield board by multiplying by the ratio of the average green channel signal for the white patch area of the flatfield compared to the color target, and multiplying by the known luminance of the white patch.
The transformation matrix is determined by minimizing the mean values for the calibration target. This matrix is a matrix, allowing for an offset for each channel,
To reduce color artifacts and visible noise, an initial matrix is predefined within the BeyondRGB pipeline as [24]:
Color differences are calculated in the same way as the filter selection simulation. A report on the color differences for the calibration and verification targets is output, along with a color-mastered TIFF in the ProPhoto gamut.
2.3. Verification
To evaluate whether the simulation can provide a good prediction of the filter performance, another simulation was run using the measured spectral characteristics of the Broncolor strobes, filters, and Canon camera. In this simulation, the transformation matrix was a matrix optimized for the minimum mean color difference using a pseudoinverse as the initial matrix to account for scaling differences. If the simulation has a good prediction, there should be a linear relationship between the simulated and physical results. Some differences in slope are expected, since the simulation does not account for the quantization of camera signals or exposure steps.
2.4. Role of Generative AI
Generative AI was used to build Matlab functions to visualize the data. It was not used in any other capacity.
3. Results
3.1. Comparison of Filter Pairs
The color accuracy of each dual-RGB lighting condition is evaluated by comparing the mean, 90th percentile, and maximum values for the verification target (NGT). A bar chart summarizing the performance of all the filter pairs with the Broncolor strobes can be found in Figure A1. They can be ranked by summing the minimum, mean, 90th percentile, and maximum values together. Figure 2 shows the five top and bottom ranked filters for the Broncolor strobes, as well as the color-accuracy of a traditional, single capture method.
Almost all of the filter pairs result in high color accuracy, as does the single capture method. All but three of the conditions meet the FADGI 4-star color accuracy parameters of a mean and a 90th percentile of . It is not surprising that the single capture method has such high color accuracy. Broncolor strobes are widely used within the cultural heritage community and are known to be excellent for color reproduction.
The top 5 filter pairs have noticeably higher color accuracy than the single capture technique, while the bottom 5 have lower color accuracy. The filter is crucial for improving color accuracy. A poor selection can not only decrease color accuracy compared to regular single capture methods, but also introduce a higher chance of misregistration errors and noise due to the higher number of channels and optical distortions.
3.2. Comparison of Lights
Given that the Broncolor strobes provide good color accuracy even with the single capture technique, it is unsurprising that most filter pairs also provide high color accuracy. To assess how the light source impacts color accuracy, the same filter pairs were combined with a tunable LED approximation of illuminant D50. In addition, because the materials were readily available, the unfiltered Broncolor strobes and the accompanying incandescent modeling light were assessed as a dual-RGB lighting pair.
Figure 3 shows the spectral power distributions of the Broncolor strobes, the tunable LEDs, and the Broncolor modeling lamp.
3.2.1. Tunable LEDs
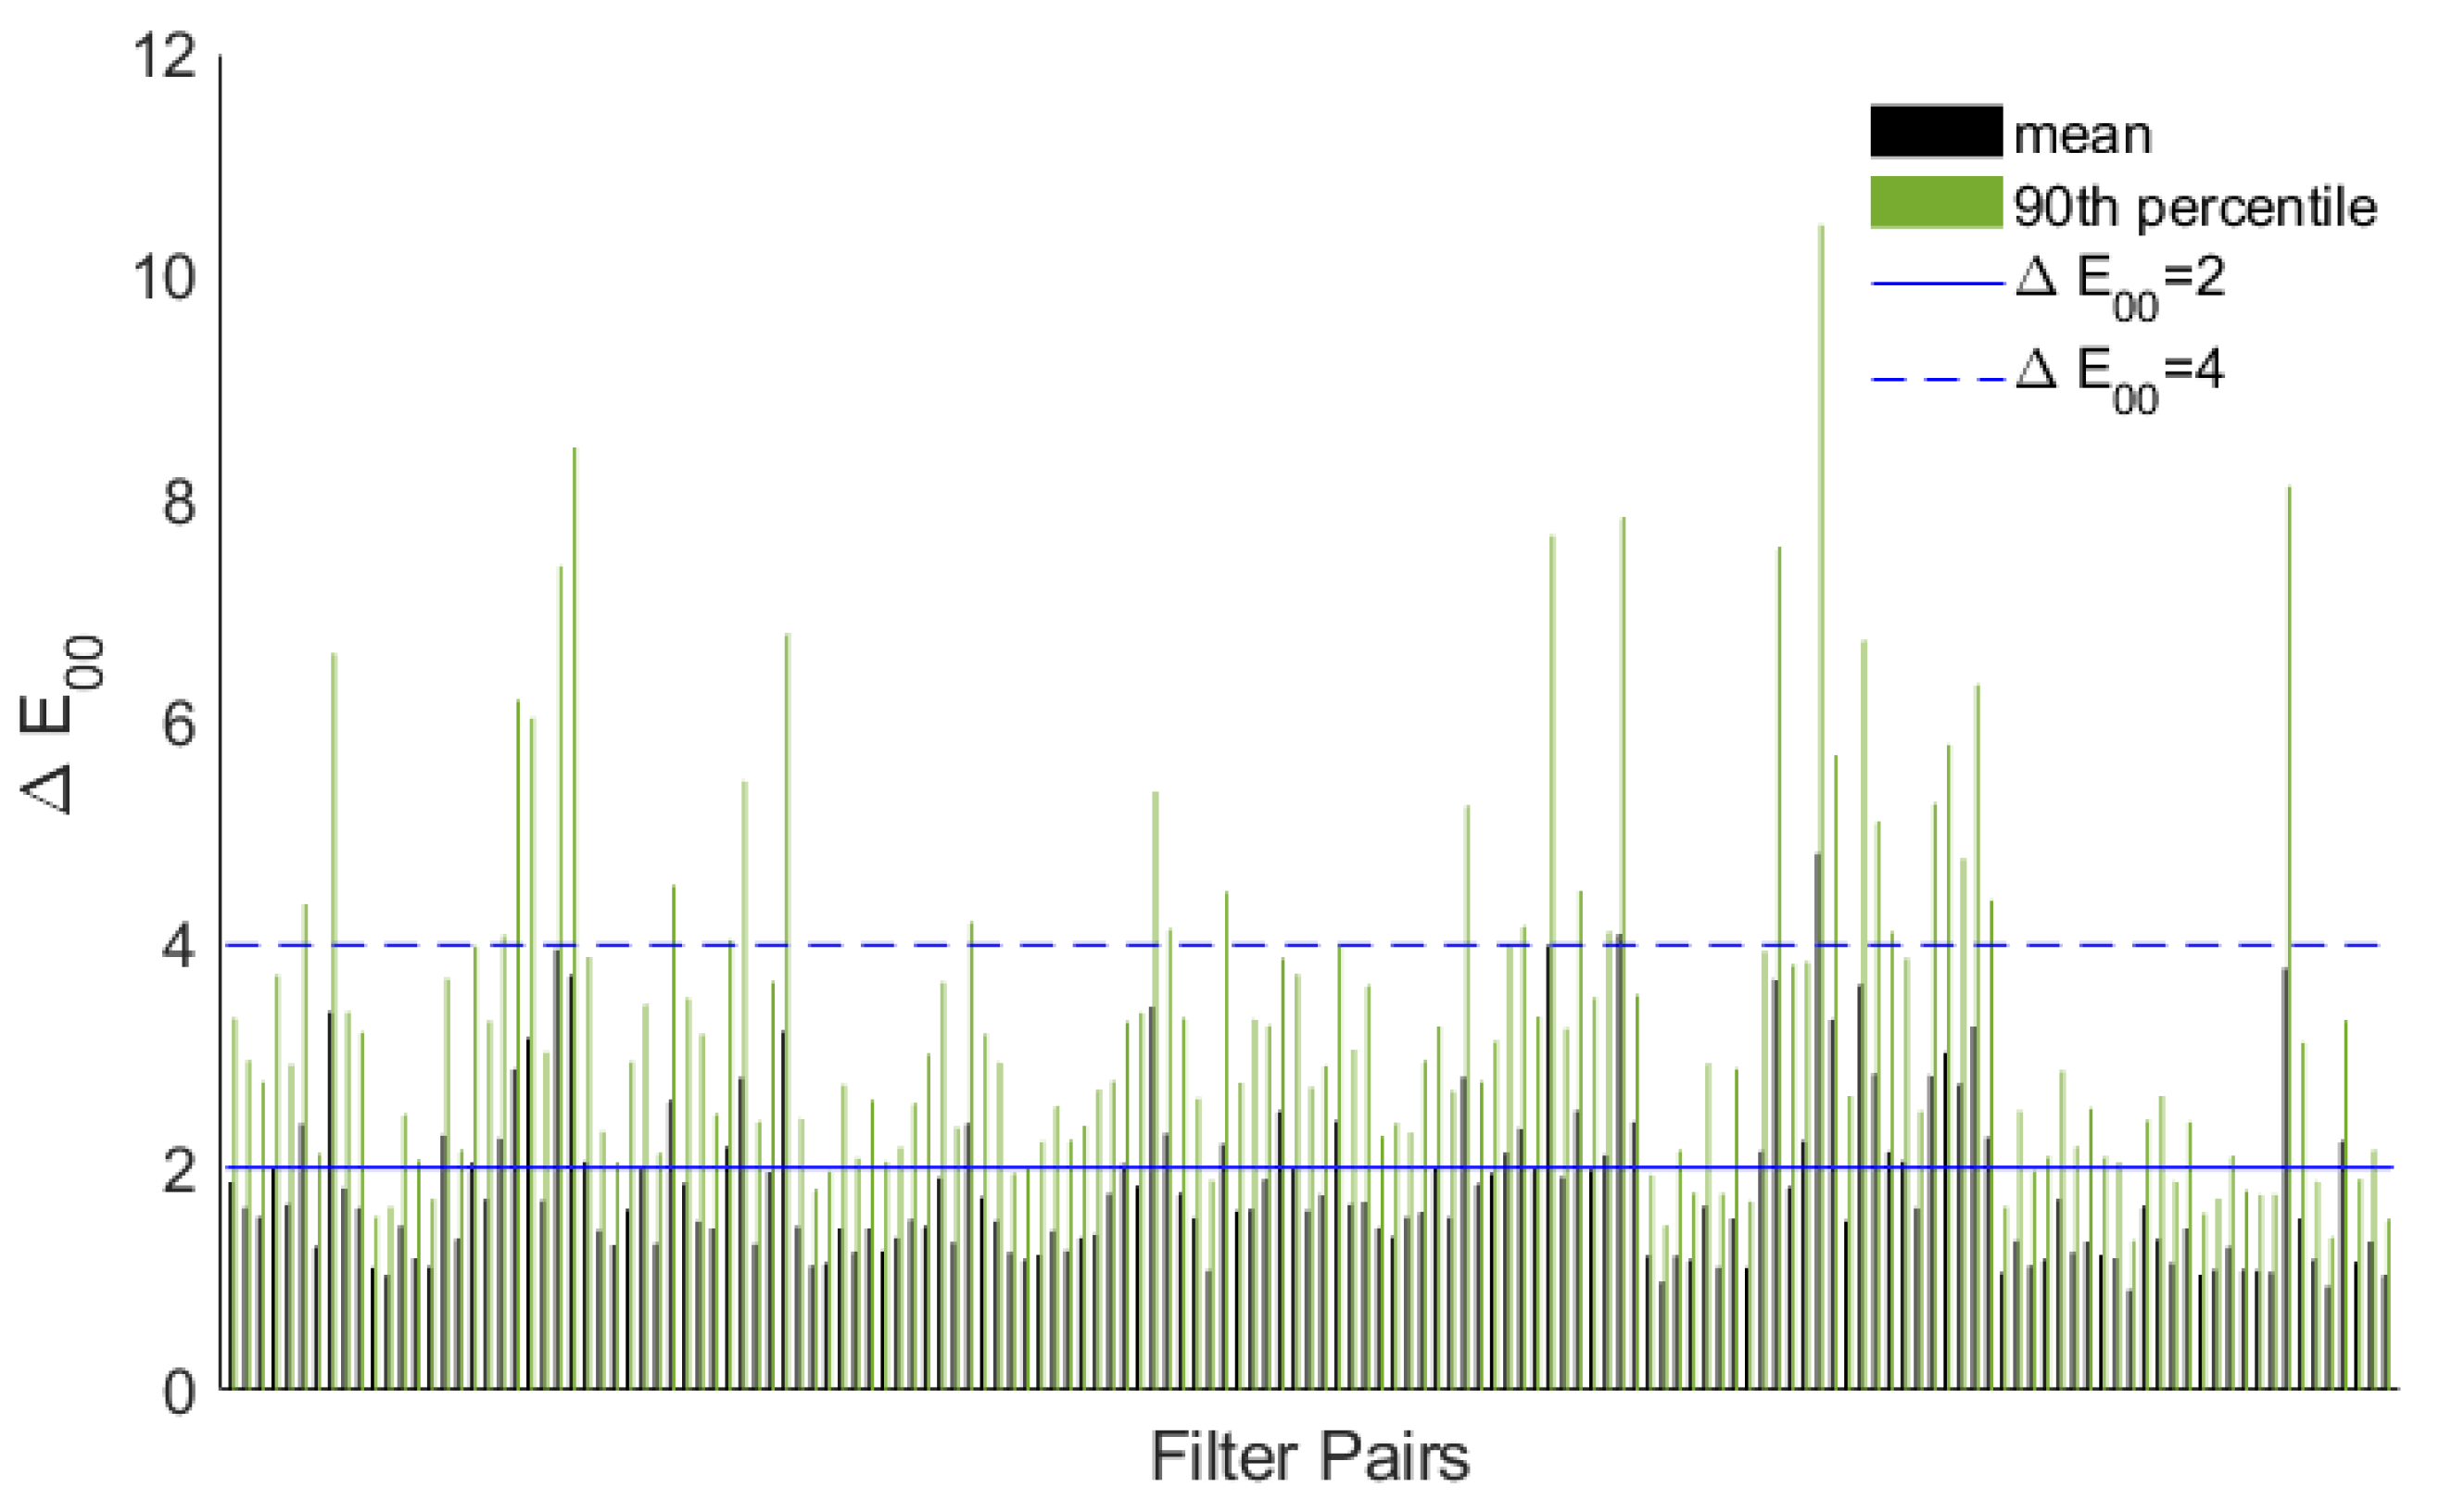
A bar chart summarizing the mean and 90th percentile values for each filter pair combined with the LED light can be found in Figure A2. A little under one-third of the filter pairs do not meet the 4-star color accuracy criteria with this light.
It should be noted that the strobe and LED image sets were taken at slightly different distances to accommodate for intensity differences between the light sources. Furthermore, the color targets are not in the exact same position between the lighting conditions, though in both cases, care was taken to minimize specular reflections. These differences in setup may be responsible for small differences in color accuracy. Large differences, however, can be attributed to the light source.
Figure 4 summarizes the color accuracy for the top and bottom ranked filter pairs and the single capture method using the tunable LED light. These filter pairs are labeled Best and Worst 1 through 5 for ease of understanding. These are not the same filter pairs ranked highest and lowest for the Broncolor strobes.
The top 5 filter pairs obtain similar color accuracy to the top 5 with the Broncolor strobes. The single capture is a little worse, just missing the 4-star color accuracy parameters with a mean . The most noticeable difference is with the bottom 5 filter pairs. With massive maximum values and large means and 90th percentiles, these bottom 5 filter pairs result in terrible color accuracy.
The selection of light greatly affects the color accuracy in the dual-RGB method. Compared to the Broncolor strobes, the choice of filters is even more crucial with the tunable LEDs. A poor selection can result in terrible color accuracy. However, a good selection can provide a significant improvement over the single capture method.
3.2.2. Strobe and Modeling Lamp
The final lighting considered was a pairing of the Broncolor strobes with the accompanying modeling lamp. One of the advantages of this condition is that the exposures are adjusted via aperture for the strobe, but shutter speed for the modeling lamp. This means that the maximum exposure without overexposure could be obtained for both lights simultaneously, despite differences in radiance, increasing the signal-to-noise ratio for all channels. Figure 5 summarizes the color accuracy using this method compared to single capture with the Broncolor strobes.
There is a slight increase in color accuracy using the dual-RGB method with the strobe and modeling light. With respect to the mean and 90th percentile , the color accuracy is similar to the fifth top-ranked filter pair using the Broncolor strobes.
3.3. Pixel Selection
In BeyondRGB, the color target patches are manually selected using a grid and coordinate system, as shown in Figure 6. These pixels are averaged, then used to fit a transformation and calculate color differences.
There is some variation in the exact pixels that a user may select while keeping the selection area within the color patches. Ideally, the variation of camera signals within a patch would be negligible, and the exact pixels would not significantly impact the results. However, this is not the case.
The top and bottom-ranked filter pairs were processed ten times each, with different pixel selections each time. Figure 7 shows the impact of selecting different pixel areas on the mean and 90th percentile values.
The pixel selection can significantly impact the final results, though the degree depends on the filter pairs. This has two major implications. First, the top- or bottom-performing filter pairs may change if the input pixels change, resulting in filters that generally perform well to perform poorly, and vice versa. Second, some filter pairs will generate very noisy images that are unsuitable for cultural heritage documentation.
In general, the bottom 5 filters are more impacted than the top 5 filters. An explanation is found in the relative camera responses for each filter pair. Figure 8 shows the relative camera responses normalized to the unfiltered Broncolor strobe.
Two apparent factors should be noted, both of which reduce the number of effective channels. First, the maximum response for each channel. While the overall camera signal can be increased through exposure adjustments, the relative signal between channels cannot be changed. A low maximum response results in a low signal-to-noise ratio, increasing the variation in digital count for that channel. Second, the similarity between channels. When two channels are nearly identical in shape, the camera signals will be highly redundant. This can cause the optimization to oscillate between the two channels, often reaching a large, but opposite contribution between the channels in the transformation matrix. This amplifies any differences between the images, resulting in high noise and other visible color artifacts. The issue is discussed in detail in Bern’s review on image quality degradation caused by color transformations in multispectral imaging [24]. While BeyondRGB does use a predefined initial matrix to reduce this effect, some of the final matrices do display these large, opposite contributions.
When both of these issues are present, they conflate, resulting in unpredictable color differences and noisy images. The worst-ranked filter pair is a good example of this. The two red channels are nearly identical, while both blue channels have a low relative sensitivity. Accordingly, the pixel selection has a very large influence on the color difference values, as shown in Figure 7. Figure 9 shows the color artifacts and noise resulting from this combination.
3.4. Verification Simulation
The filter selection simulation described in the methods used a wide variety of lights, filters, and cameras to try to locate filter pairs that would be ideal in most cultural heritage settings. The results from that simulation do not provide a good prediction of how the filter pairs perform with the Broncolor strobes or the tunable LEDs. For filters to be a reasonable solution to low-cost dual-RGB imaging, predicting the optimal filter pairs must be possible.
As described in Section 2.3, the verification simulation uses measurements from Broncolor strobes, the Canon camera, and available filters as an input. It follows the same processing steps as BeyondRGB as much as possible. This simulation is capable of predicting the camera signals very well. There are some differences in scale due to exposure steps when working with a real camera, which were not replicable in the simulation. When normalized by the maximum signal, the relationship between the simulated and average real camera signals is highly linear, as shown in Figure 10.
After the camera signals are simulated, the linear transformation matrix is fit by non-linear optimization. This transformation converts the camera signals into 1931 tristimulus values. Figure 11 shows the estimated XYZ values as calculated in the simulation, compared to the BeyondRGB output from the real images.
The relationship between the simulated and real XYZ estimates is linear but has a lot of variation. This is partly due to the factors discussed in Section 3.3. Unlike the real images, the simulation does not contain any noise, so the relative magnitude or shape of the camera responses does not generate noise in the predicted results. Some of the variation may also be caused by the scaling differences between the initial matrices for the optimization. These differences necessitated a different initial starting matrix, which could result in different local minima.
Unfortunately, this mostly linear relationship between the 1931 tristimulus estimates is insufficient to accurately predict with consistent accuracy. The calculation of between two XYZ values includes several transformations, including compression, expansion, and rotation, in order to describe a roughly perceptually uniform space. This means that the color difference depends not just on the magnitude of the differences between the tristimulus values, but also on the exact coordinates. Therefore, even small differences between the XYZ estimates compared to the reference values can result in large color differences, and vice versa. Figure 12 shows the lack of correlation between the simulated and real values.
The simulation tends to underestimate the values compared to the values obtained from the real images. This is, in part, because the simulation is not subject to noise or geometry effects such as gloss and lighting non-uniformities. Unfortunately, the simulation is the worst at predicting mean values for the filter pairs with the highest color differences in reality. Therefore, the simulation cannot be used to select optimal filters.
4. Discussion
The context of this research is within the field of accessible color-accurate imaging. The main aspects for consideration are: Ease-of-integration, ease-of-use, cost, and quality.
The dual-RGB method is inherently more accessible than most multispectral imaging methods, as almost all the materials required are already on hand in most imaging studios. The BeyondRGB software further increases accessibility by being free, open-source, and user-friendly. Gel filters can be obtained at a very low cost compared to imaging-quality tunable LEDs. Furthermore, filters can easily be incorporated into an existing workflow with minimal disruption, allowing for both traditional single capture and dual-RGB capture by simply attaching the filters to the existing lights. With tunable LEDs, the lights must be replaced entirely. Compared to camera filters, lighting filters reduce registration errors due to optics and handling. In general, gel filters can also be obtained at a lower price than camera filters. Gel filters are, therefore, a good solution for ease-of-integration, ease-of-use, and low cost. However, several issues hinder the practical implementation of this method with regard to quality.
The color accuracy of each filter pair depends greatly on the spectral characteristics of the light source used. Some filter pairs obtained high color accuracy with both the Broncolor strobes and the tunable LEDs, but the identity of these pairs was not consistent across both light sources. Knowing the spectral power distribution of the light source is essential for selecting optimal filter pairs. Unless this information has been openly published, the light must be measured using a spectroradiometer or similar instrument. Many cultural heritage institutions do not have access to such instruments. Alternatively, with further research, several combinations of filter pairs could be identified for popular or low-cost light sources. However, this approach would require that cultural heritage institutions purchase both the lights and lighting filters, increasing cost and decreasing the ease-of-integration.
A tool that can accurately identify optimal filter pairs for a given light source is necessary for lighting filters to be a feasible dual-RGB option. The results show that, while some filter pairs can provide high color accuracy, other filter pairs may greatly decrease color accuracy. Without a tool to sort through these options, cultural heritage institutions risk purchasing filter pairs that decrease color accuracy while increasing image noise. The verification simulation could not accurately predict filter performance. While the simulation could easily predict the average camera signals from the color targets, it fell short of predicting the 1931 tristimulus values and the color differences.
Another barrier to using lighting filters is the trade-off between channel redundancy and low maximum signals. Both of these issues contribute to calibration inconsistency and image noise. Since the two conditions utilize the same light source and camera, there will always be some degree of redundancy between the channels. The only way to reduce the redundancy is to reduce the light by introducing a filter, and therefore reduce the maximum signal. This issue is exacerbated when the transmittance of one filter is much higher than the other.
Despite the complications discussed above, there is still value in pursuing this method further, especially considering the very low cost associated with gel filters. Further, the results show that a greater improvement is possible for the tunable LEDs than the Broncolor strobes compared to the single capture method. This may indicate that the gel-filter dual-RGB method is the most beneficial for light sources with generally poor color rendition, which is also where an improvement in color accuracy is the most necessary.
To address the issue of finding the spectral power distribution of a light source, a resource can be created to direct cultural heritage professionals to publicly available databases or to low-cost alternative light sources with known spectral characteristics. The simulation must be adjusted to be an appropriate prediction tool. This may be done by increasing the transmittance threshold or introducing a threshold to minimize redundancy between channels. Alternatively, instead of trying to model each step of the process, thus accumulating error in each calculation, the simulation could instead identify desirable characteristics for the filters. Additionally, changes can be made to the pipeline in BeyondRGB to reduce some of the variation caused by pixel selection and increase the generalization of the math. For example, by allowing for different exposures in each condition, removing channels with low signal or high redundancy, adjusting the initial matrix based on channel characteristics, or minimizing for noise in addition to color difference.
Author Contributions
Conceptualization, S.F. and S.S.; methodology, S.S. and S.F.; software, S.S.; validation, S.S.; formal analysis, S.S.; investigation, S.S.; resources, S.F.; data curation, S.S.; writing—original draft preparation, S.S.; writing—review and editing, S.F.; visualization, S.S.; supervision, S.F.; project administration, S.F.; funding acquisition, S.F. All authors have read and agreed to the published version of the manuscript.
Funding
This research was funded by the Tongbo Chen Fellowship and the Max Saltzman Endowed Fellowship in Color Science.
Institutional Review Board Statement
Not applicable.
Informed Consent Statement
Not applicable.
Data Availability Statement
The raw data supporting the conclusions of this article will be made available by the authors on request.
Acknowledgments
We thank Leah Humenuck and Olivia Kuzio for their contributions to the BeyondRGB project and helpful feedback in designing the experiment. Thank you to Leah, Dave Wyble, and Roy Berns for help with analyzing the data. We would also like to thank Doug Peterson at Digital Transitions, Kurt Heumiller at the National Gallery of Art, Larry Spevac at ColorBurst Systems, Scott Geffert at the Museum of Modern Art, and Tucker Downs for providing spectral measurements of lights and filters used in the simulation. During the preparation of this manuscript/study, the authors used ChatGPT for the purposes of creating functions for visualizing the data. The authors have reviewed and edited the output and take full responsibility for the content of this publication.
Conflicts of Interest
The funders had no role in the design of the study; in the collection, analyses, or interpretation of data; in the writing of the manuscript; or in the decision to publish the results.
Appendix A
Figure A1.
Summary of the statistics for all filter pairs with the Broncolor strobes.
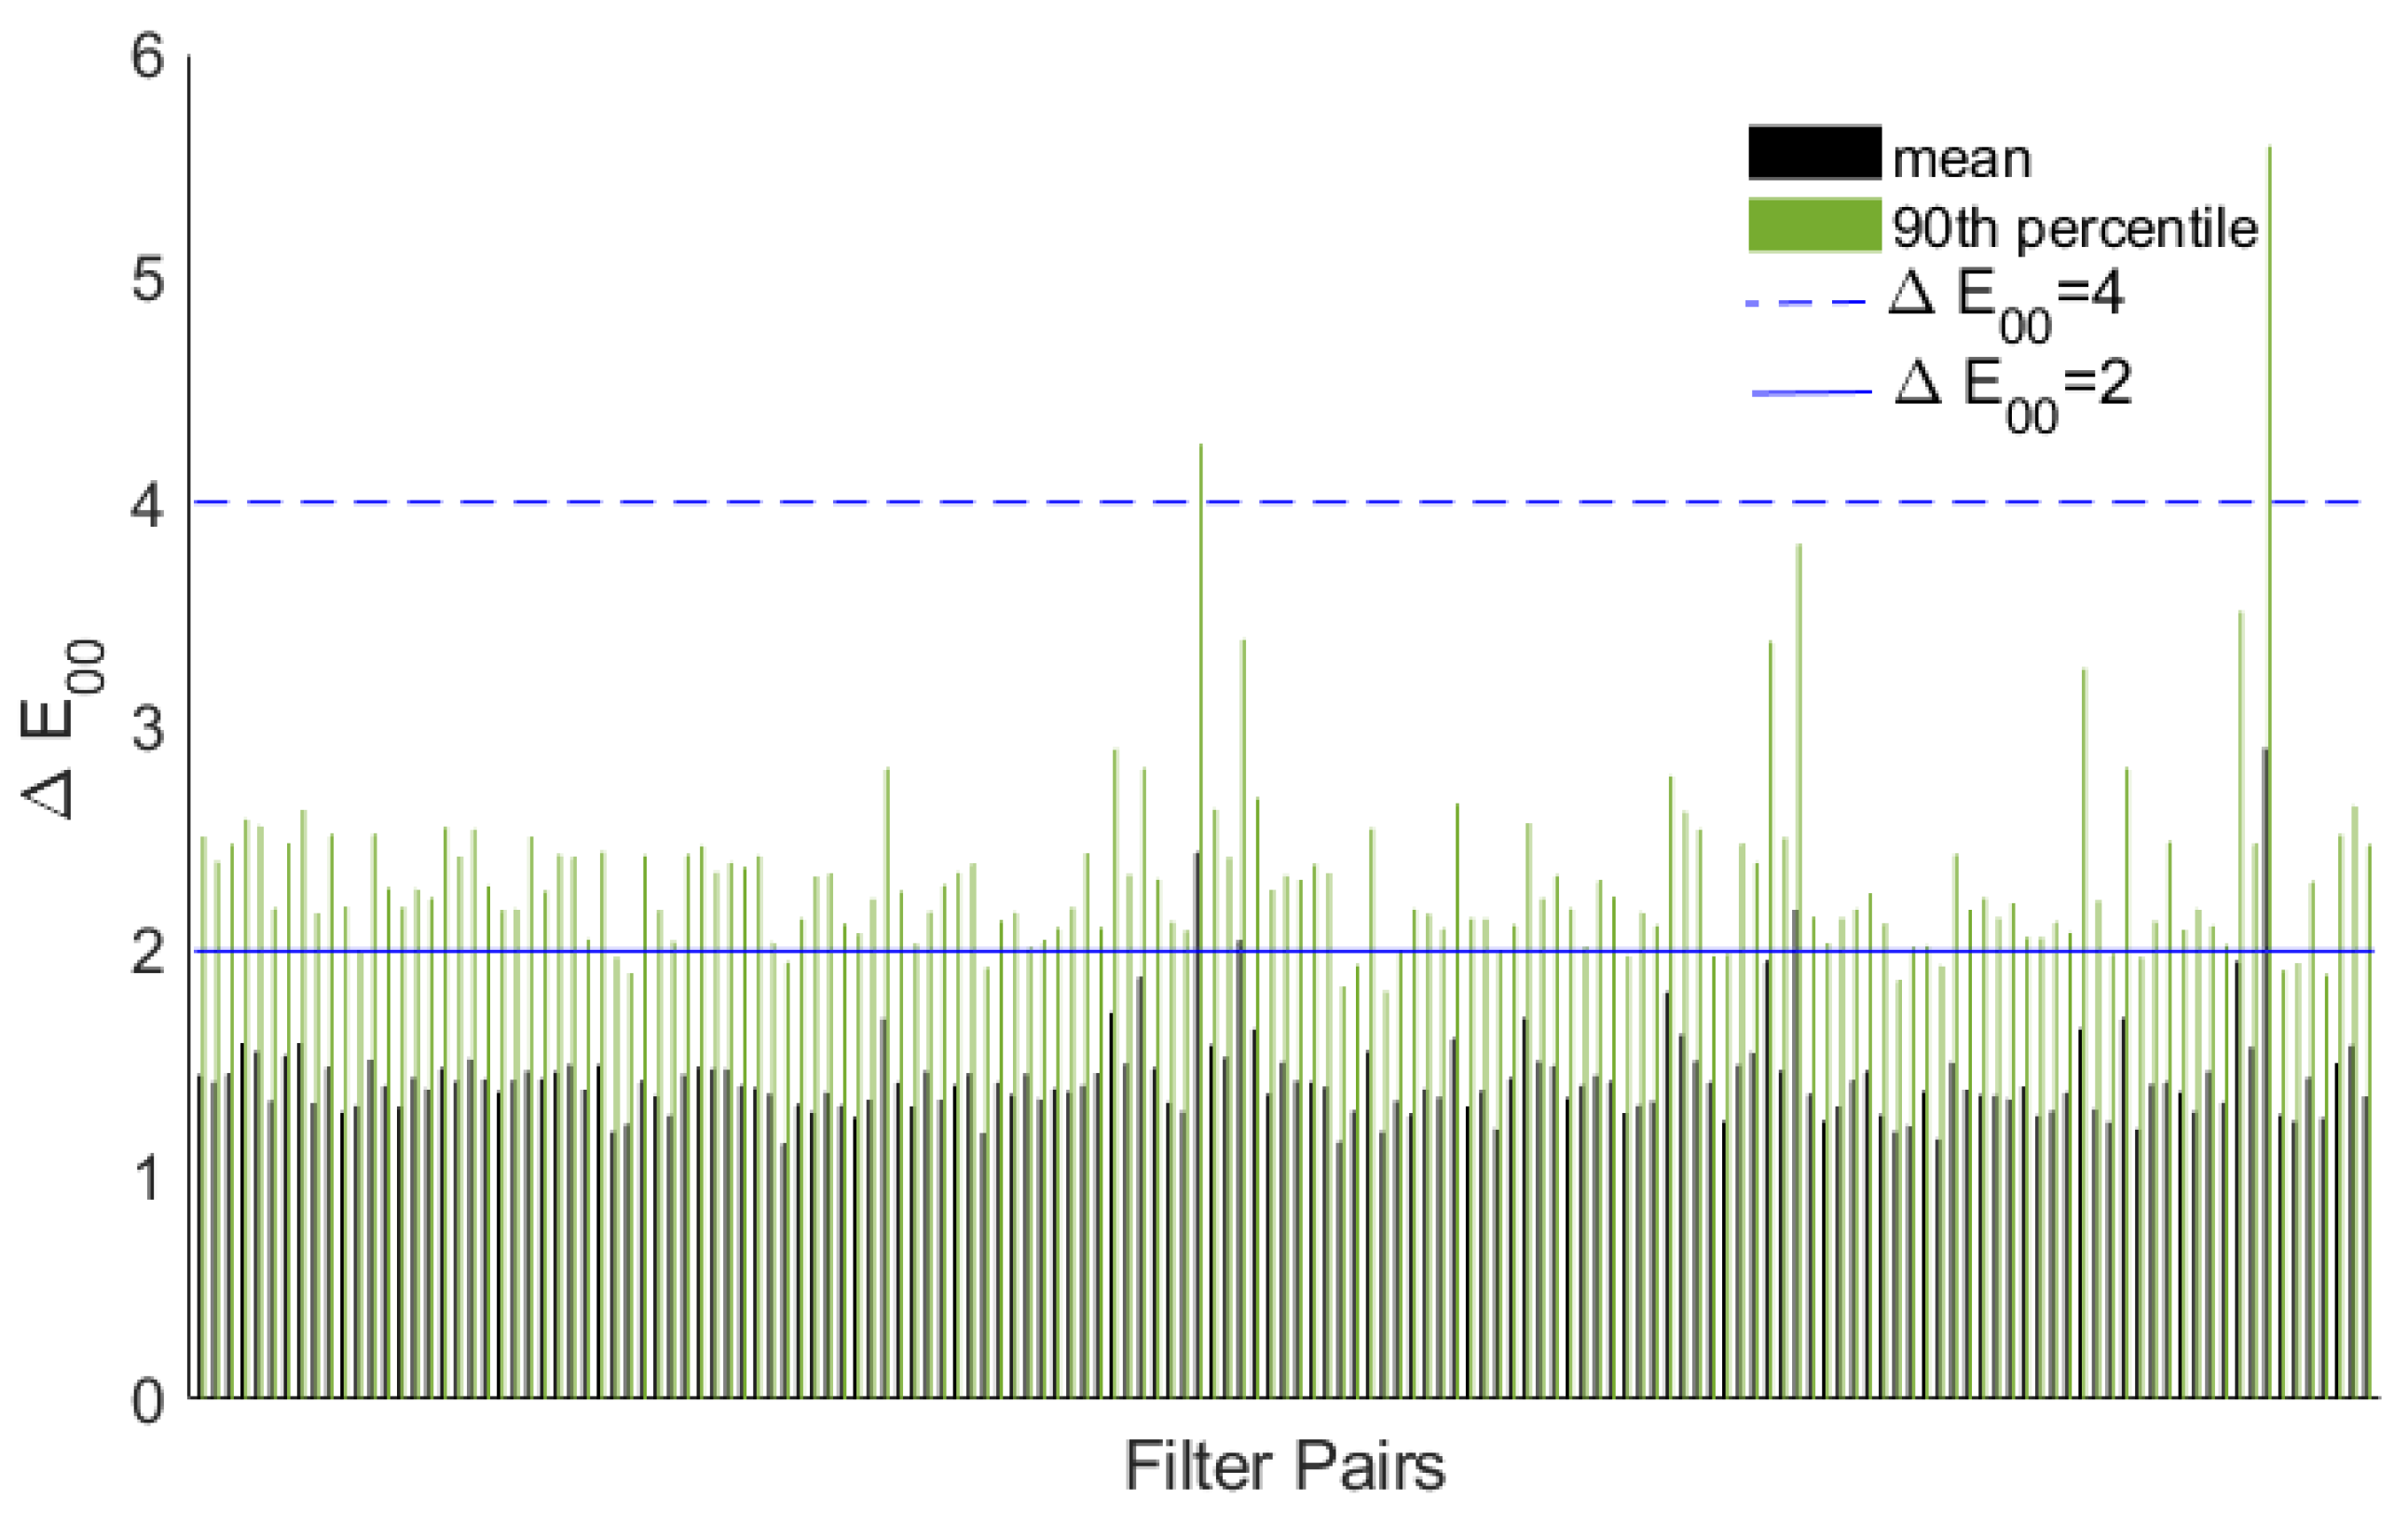
Figure A2.
Summary of the statistics for all filter pairs with the tunable LEDs.
References
- Group, S.I.W. Technical guidelines for digitizing cultural heritage materials, 2023. https://www.digitizationguidelines.gov/guidelines/digitize-technical.html.
- Berns, R.S. Color Science and the Visual Arts; The Getty Conservation Institute: Los Angeles, CA, 2016. [Google Scholar]
- Shrestha, R.; Hardeberg, J.Y. Evaluation and comparison of multispectral imaging systems. In Proceedings of the 22nd Color and Imaging Conference Final Program and Proceedings and 2nd Congress of the International Academy of Digital Pathology. Society for Imaging Science and Technology; 2014; pp. 107–112. [Google Scholar] [CrossRef]
- Kuzio, O. Practical LED-based spectral imaging for cultural heritage studio photography. PhD thesis, Rochester Institute of Technology, Rochester, NY, 2023.
- Berns, R.S.; Wyble, D.R. Improving color accuracy when imaging cultural heritage using a bi-color LED source. In Proceedings of the IS&, T Archiving Proceedings. Society for Imaging Science and Technology; 2023; pp. 57–61. [Google Scholar] [CrossRef]
- Berns, R.S.; Taplin, L.A.; Urban, P.; Zhao, Y. Spectral color reproduction of paintings. In Proceedings of the Conference on Colour in Graphics, Imaging, and Vision, Vol. 4, jan 2008; pp. 484–488. [Google Scholar] [CrossRef]
- zek, J.B.; Soukup, J.; Zitová, B.; Flusser, J.; Tichý, T.; Hradilová, J. Low-cost mobile system for multispectral cultural heritage data acquisition. In Proceedings of the 2013 Digital Heritage International Congress. Springer International Publishing Switzerland, oct 2013; pp. 73–79. [Google Scholar] [CrossRef]
- Liang, J.; Wan, X.; Liu, Q.; Li, C.; Li, J. Research on filter selection method for broadband spectral imaging system based on ancient murals. Colour Research and Application 2015, 41, 585–595. [Google Scholar] [CrossRef]
- Chi, C.; Yoo, H.; Ben-Ezra, M. Multispectral imaging by optimized wide band illumination. International Journal of Computer Vision 2010, 86, 140–151. [Google Scholar] [CrossRef]
- Novati, G.; Pellegri, P.; Schettini, R. An affordable multispectral imaging system for the digital museum. International Journal on Digital Libraries 2005, 5, 167–178. [Google Scholar] [CrossRef]
- Berns, R. Theory and practice of dual-RGB imaging. Studio for scientific imaging and archiving of cultural heritage technical report, Rochester Institute of Technology, Rochester, NY, 2016.
- Berns, R.; Taplin, L.A.; Nezamabadi, M.; Zhao, Y. Modifications of a Sinarback 54 digital camera for spectral and high-accuracy colorimetric imaging: Simulations and experiments. Studio for scientific imaging and archiving of cultural heritage technical report, Rochester Institute of Technology, Rochester, NY, 2004.
- Berns, R.; Taplin, L.; Nezamabadi, M. Spectral imaging using a commercial colour-filter array digital camera. In Proceedings of the ICOM Committee for Conservation, ICOM-CC, 14th Triennial Meeting; The International Council of Museums, C.f.C., Ed., London, UK, 14th Trienniall Meeting the Hague preprints ’05, 2005; Vol. 2; pp. 743–750. [Google Scholar]
- Sinar. Color To Match, 2025.
- Kuzio, O.; Farnand, S. Color accuracy-guided data reduction for practical LED-based multispectral imaging. In Proceedings of the IS&, T Archiving Proceedings. Society for Imaging Science and Technology; 2021; pp. 65–70. [Google Scholar] [CrossRef]
- Kuzio, O.; Farnand, S. Comparing practical spectral imaging methods for cultural heritage studio photography. Journal on Computing and Cultural Heritage 2022, 16. [Google Scholar] [CrossRef]
- Transitions, D. DT Fusion, 2025.
- of Technology, R.I. BeyondRGB, 2025.
- Shrestha, R.; Hardeberg, J.Y. Multispectral image capture using two RGB cameras. In Proceedings of the European Signal Processing Conference, aug 2010; pp. 1801–1805. [Google Scholar] [CrossRef]
- Engineering, I. Camera Spectral Sensitivity Database, 2025.
- Witwer, J.; Berns, R.S. Increasing the versatility of digitizations through post-camera flat-fielding. In Proceedings of the IS&, T Archiving Conference. Society for Imaging Science and Technology; 2015; pp. 110–113. [Google Scholar]
- Kuzio, O.; Farnand, S. Beyond RGB: A spectral image processing software application for cultural heritage imaging studio photography. In Proceedings of the IS&, T Archiving Proceedings. Society for Imaging Science and Technology; 2022; pp. 95–100. [Google Scholar] [CrossRef]
- Humenuck, L.; Farnand, S. BeyondRGB 1. 5: Improvements to a free, opensource, spectral image processing software application for cultural heritage studio photography. In Proceedings of the IS&T Archiving Conference. Society for Imaging Science and Technology, Vol. 20, jun 2023; pp. 48–52. [Google Scholar] [CrossRef]
- Berns, R.S. Image quality degradation caused by color transformations in multispectral imaging: A practical review. In Proceedings of the IS&, T Archiving Conference. Society for Imaging Science and Technology, Vol. 17, apr 2020; pp. 60–67. [Google Scholar] [CrossRef]
Short Biography of Authors
Sahara Smith is a PhD student in Color Science at the Rochester Institute of Technology (RIT). She received her BS in Chemistry at Mount Royal University in 2022, where she pursued research in chemistry education. Her current research interests include color imaging and reproduction for cultural heritage applications, image quality, and color perception.
Susan Farnand is an Associate Professor and the Graduate Program Director of the Program of Color Science at the Rochester Institute of Technology (RIT). Her research interests center around human color vision and perception and include color imaging, individual differences in color vision, visual attention, image quality metrics, color 3D printing, and color reproduction in archival applications. Prior to joining RIT, Dr. Farnand was a senior research scientist at Eastman Kodak Company working primarily on projects in perceptual image quality measurement and modeling. She holds a BS in Engineering from Cornell University and an MS in Imaging Science and a PhD in Color Science from RIT. Dr. Farnand recently completed her term as Past President of the Society for Imaging Science and Technology.
Figure 1.
A flowchart describing the color pipeline for the filter selection simulation, the image capture and processing, and the verification simulation.
Figure 1.
A flowchart describing the color pipeline for the filter selection simulation, the image capture and processing, and the verification simulation.
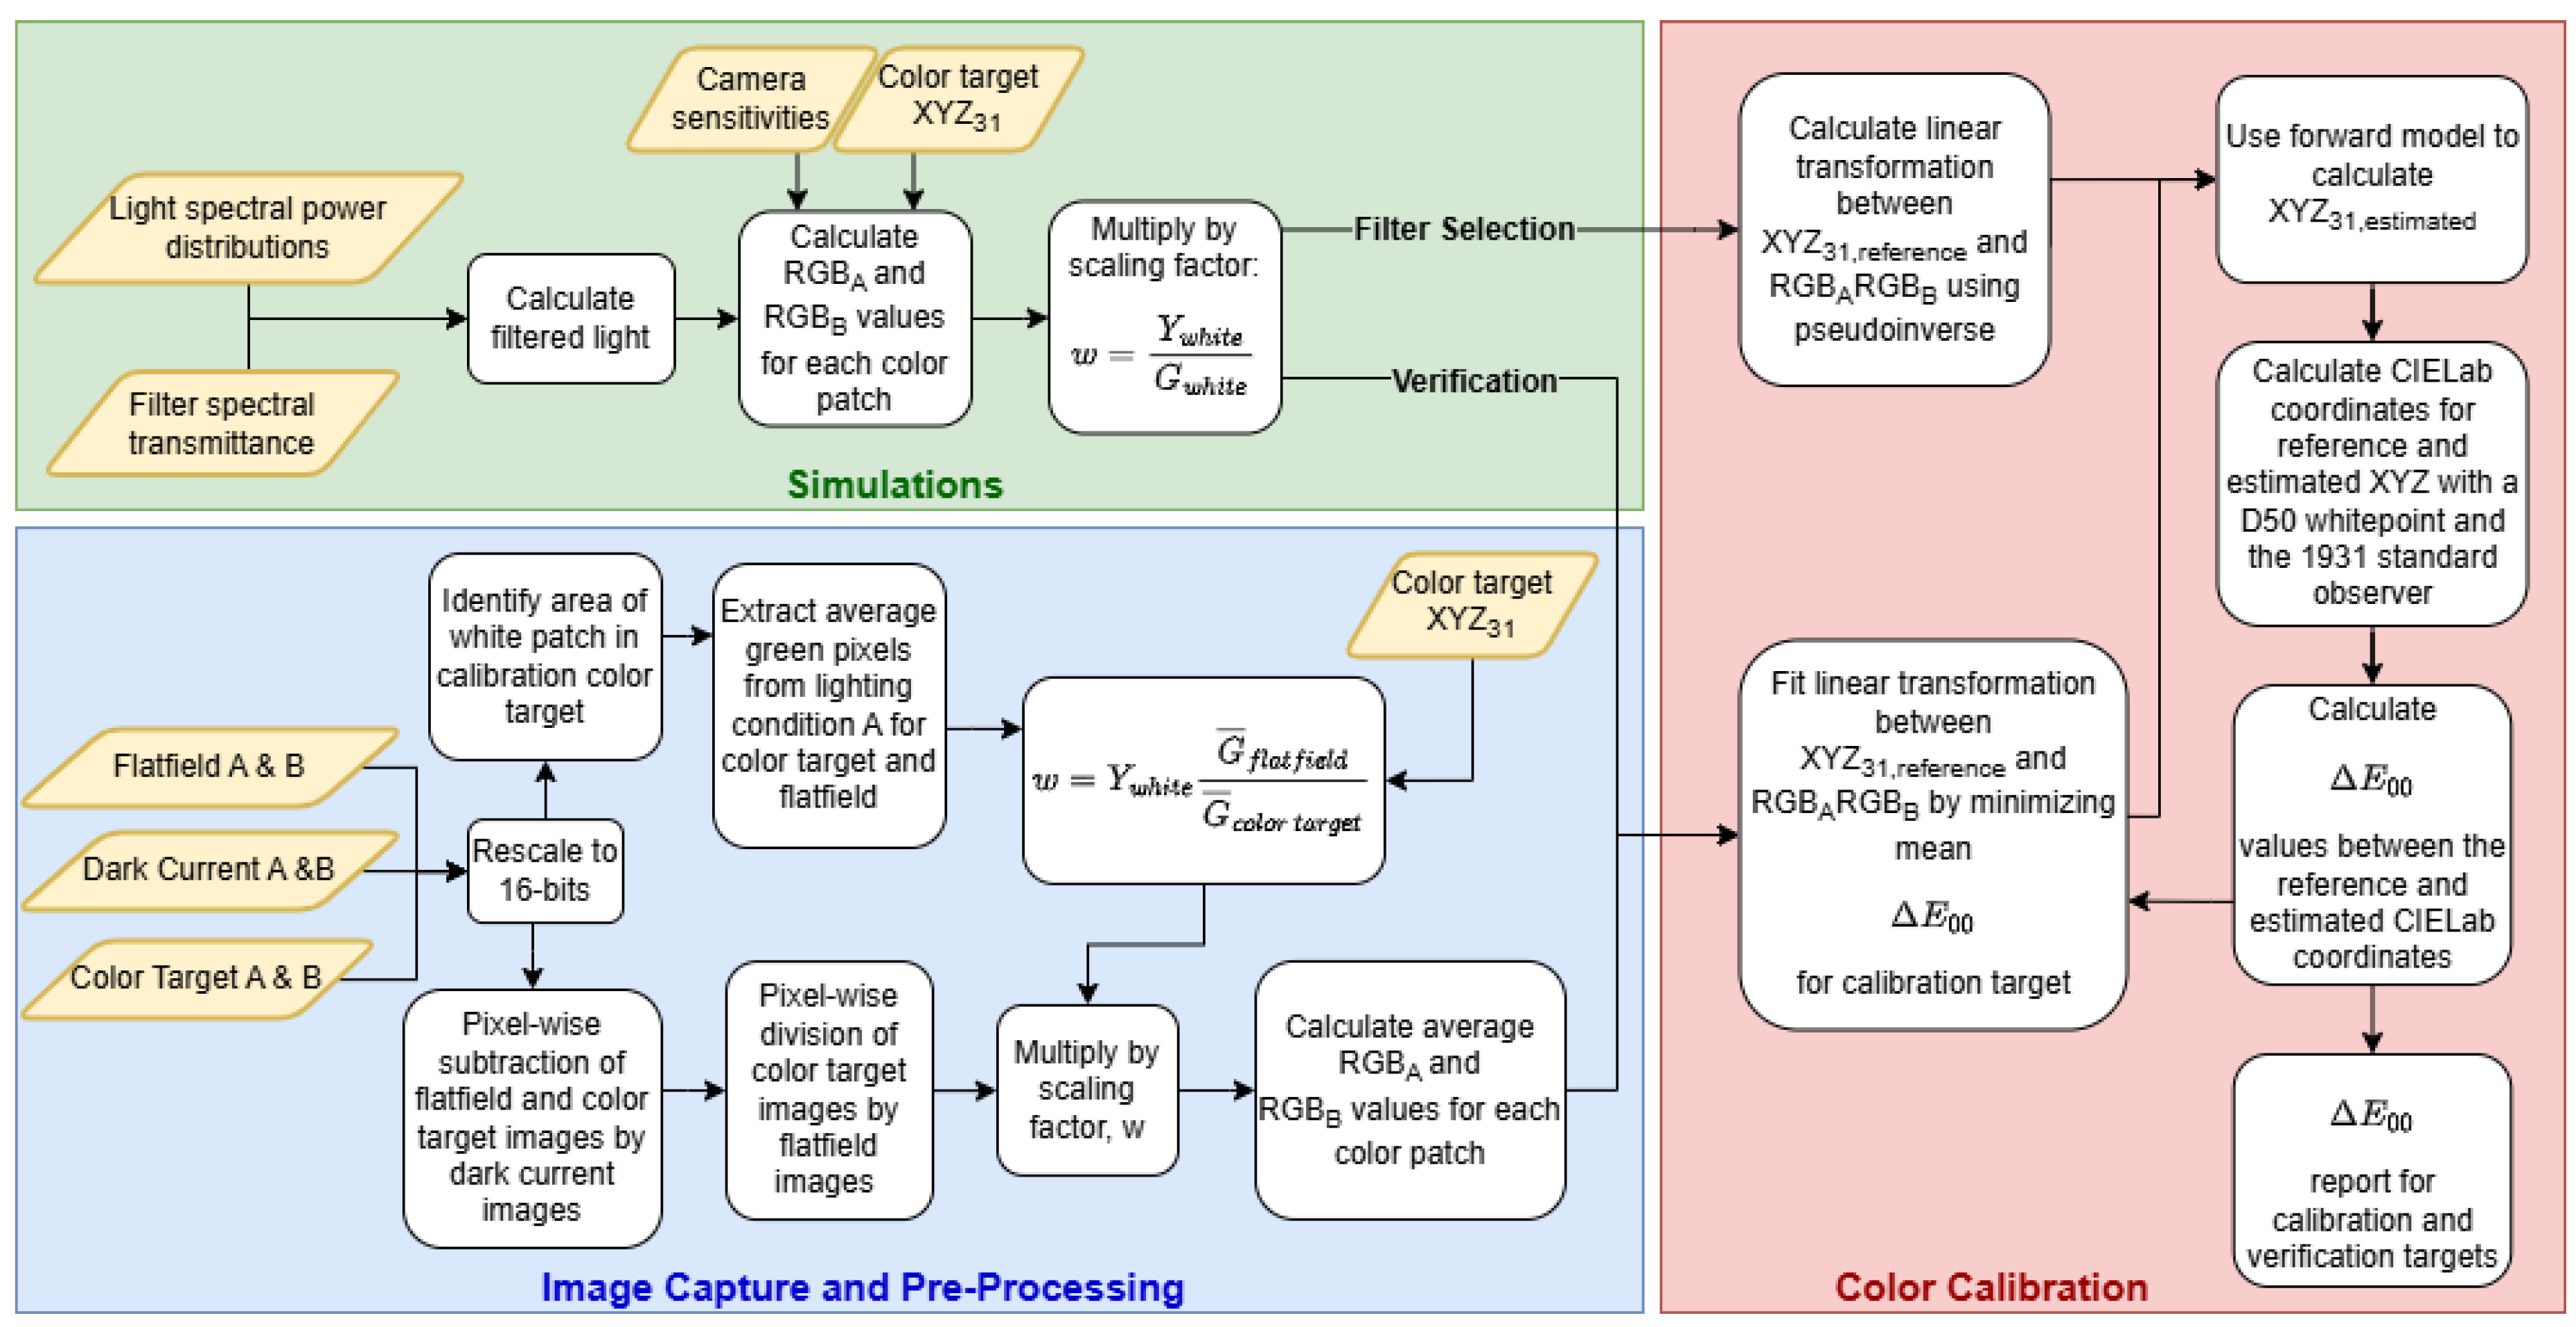
Figure 2.
statistics for the top and bottom ranked filter pairs with the Broncolor strobes. The single capture method is shown for comparison. values of 2 and 4 are 4-star thresholds in the FADGI guidelines.
Figure 2.
statistics for the top and bottom ranked filter pairs with the Broncolor strobes. The single capture method is shown for comparison. values of 2 and 4 are 4-star thresholds in the FADGI guidelines.
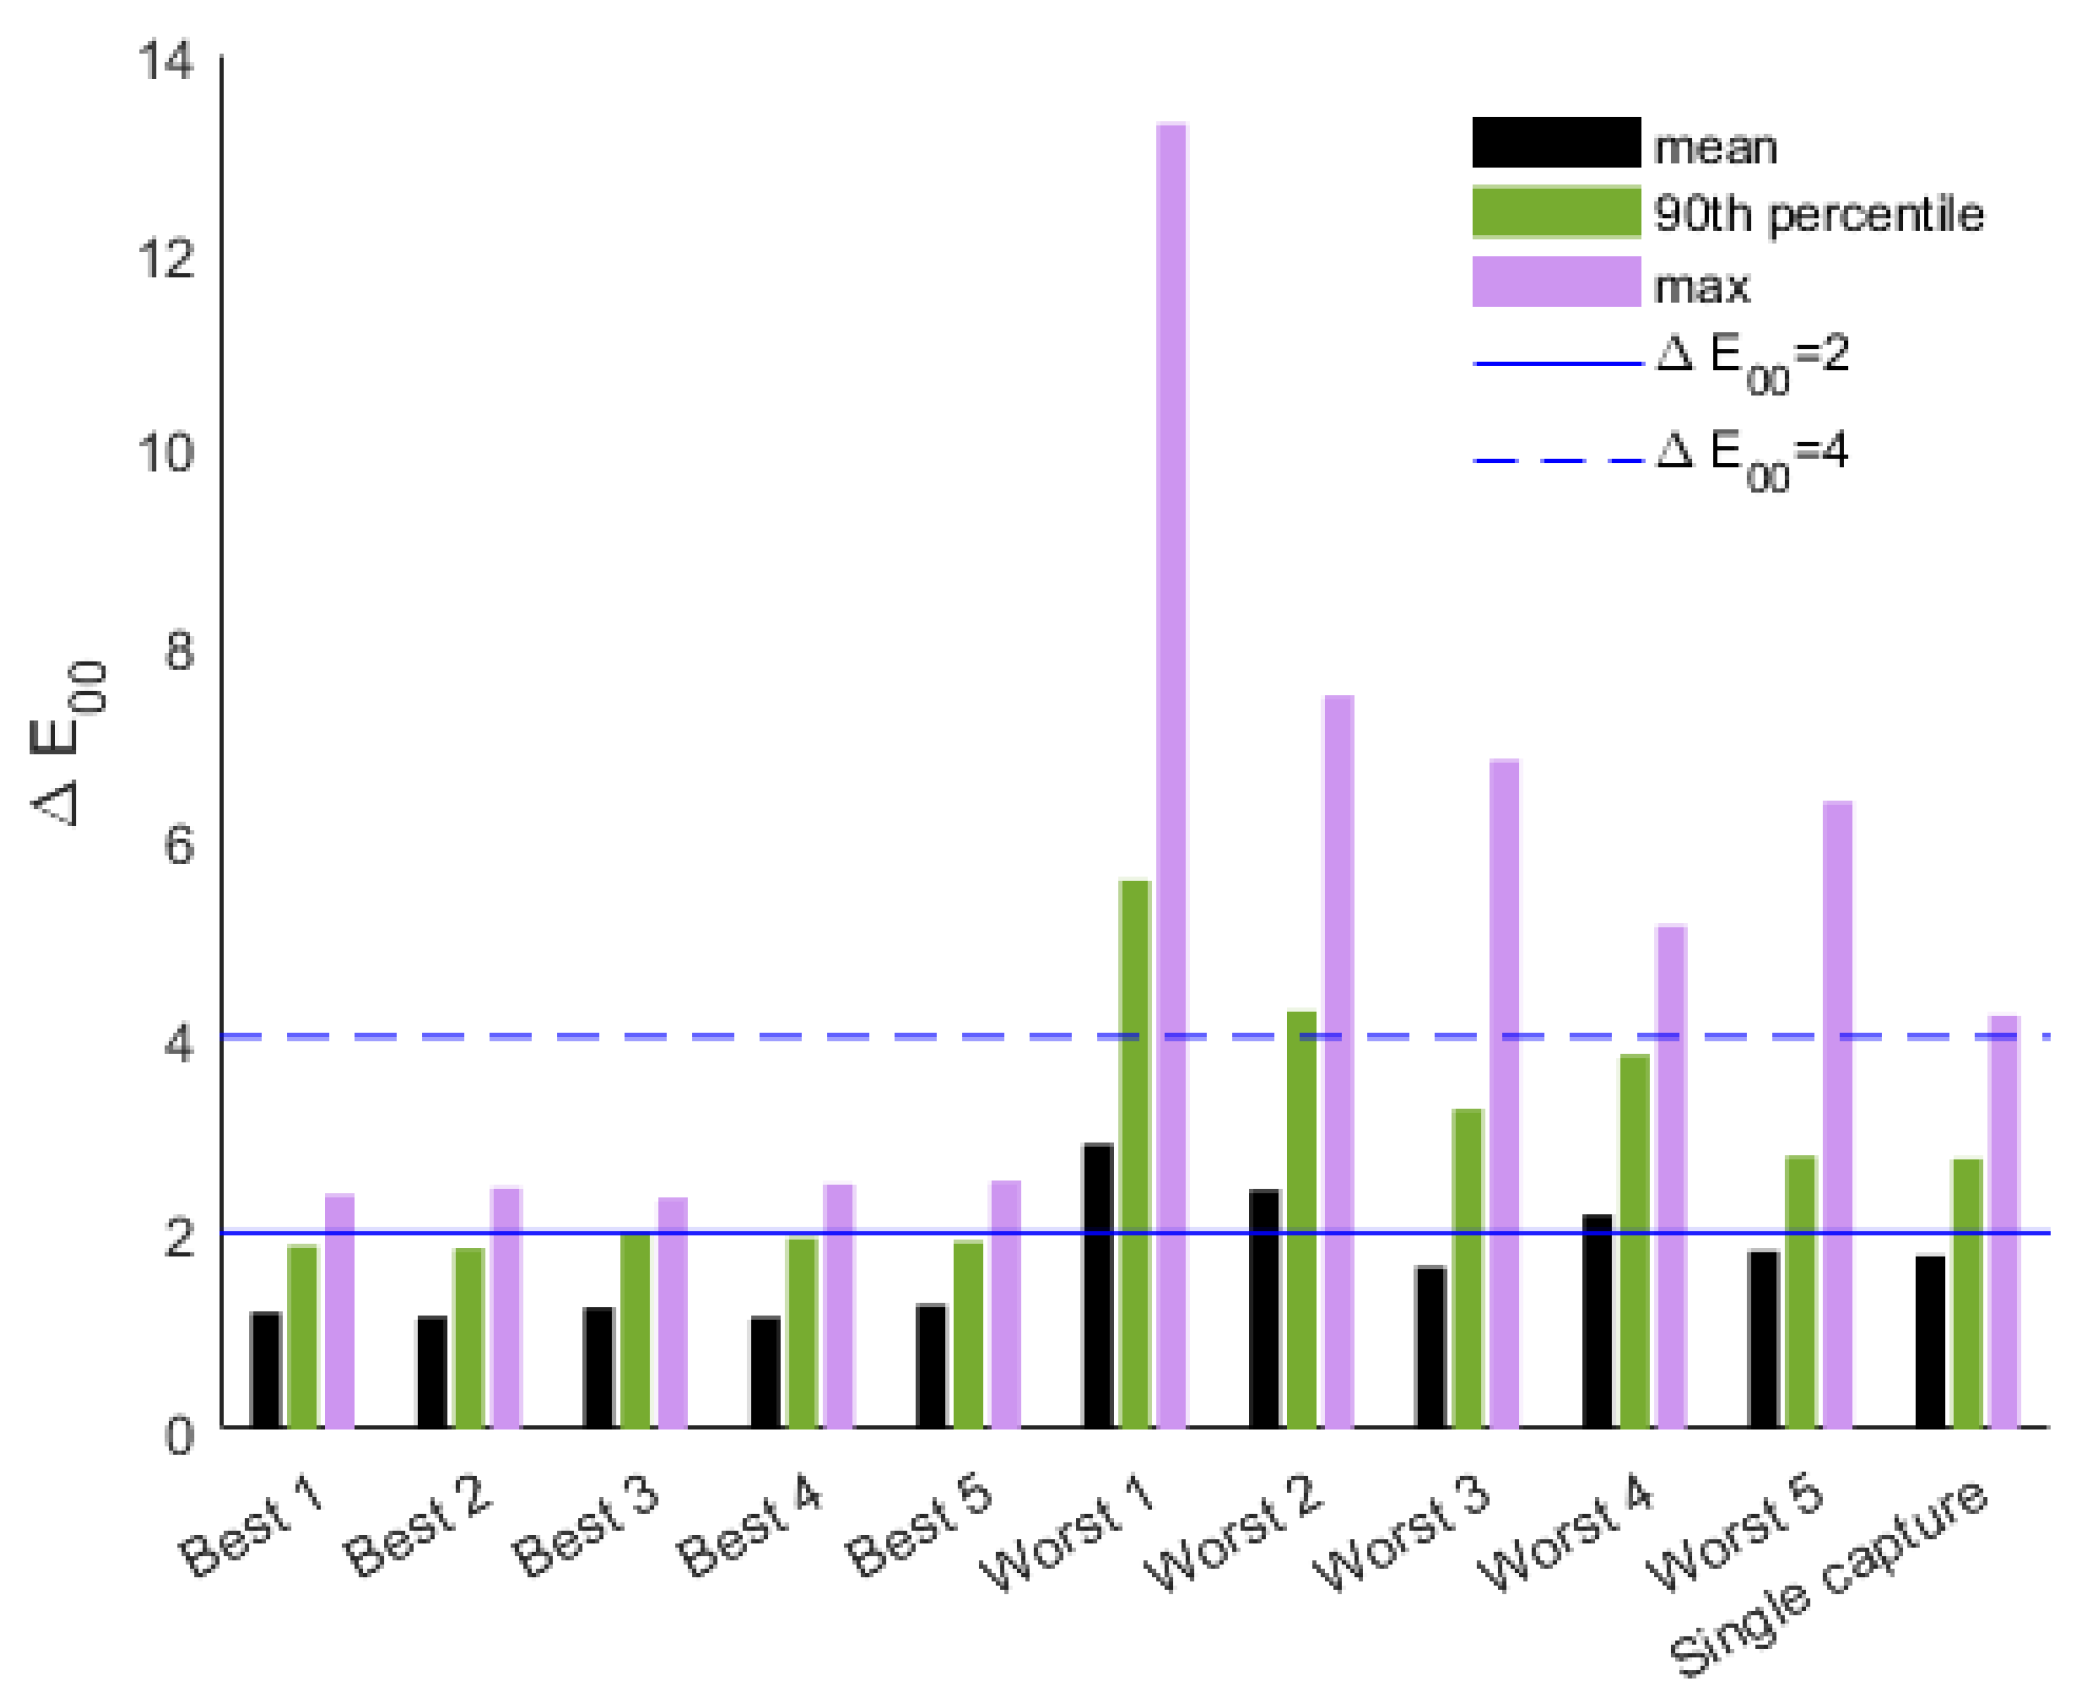
Figure 3.
Normalized spectral power distributions of the (a) Broncolor Pulso G strobe, (b) LED approximation of D50, and (c) Broncolor PulsoG modeling lamp.
Figure 3.
Normalized spectral power distributions of the (a) Broncolor Pulso G strobe, (b) LED approximation of D50, and (c) Broncolor PulsoG modeling lamp.
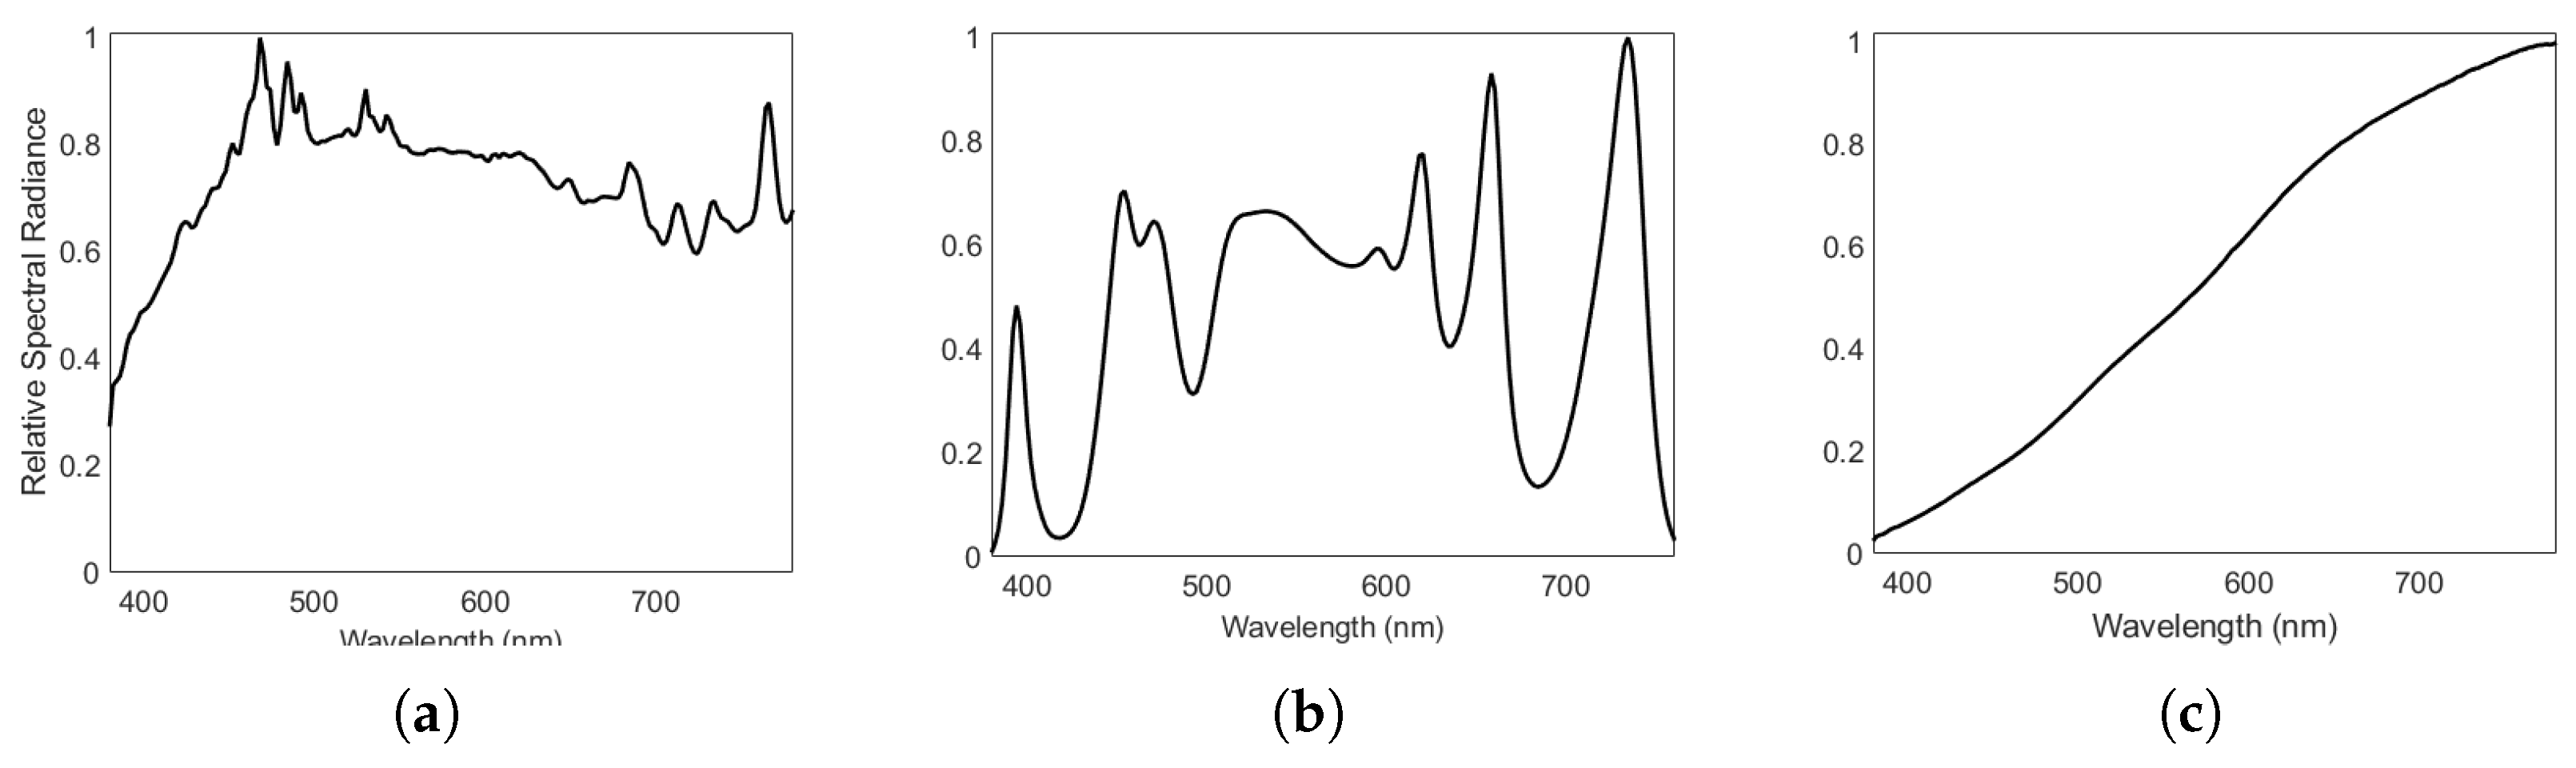
Figure 4.
statistics for the top and bottom ranked filter pairs with the LED D50 approximation. The single capture method is shown for comparison.
Figure 4.
statistics for the top and bottom ranked filter pairs with the LED D50 approximation. The single capture method is shown for comparison.
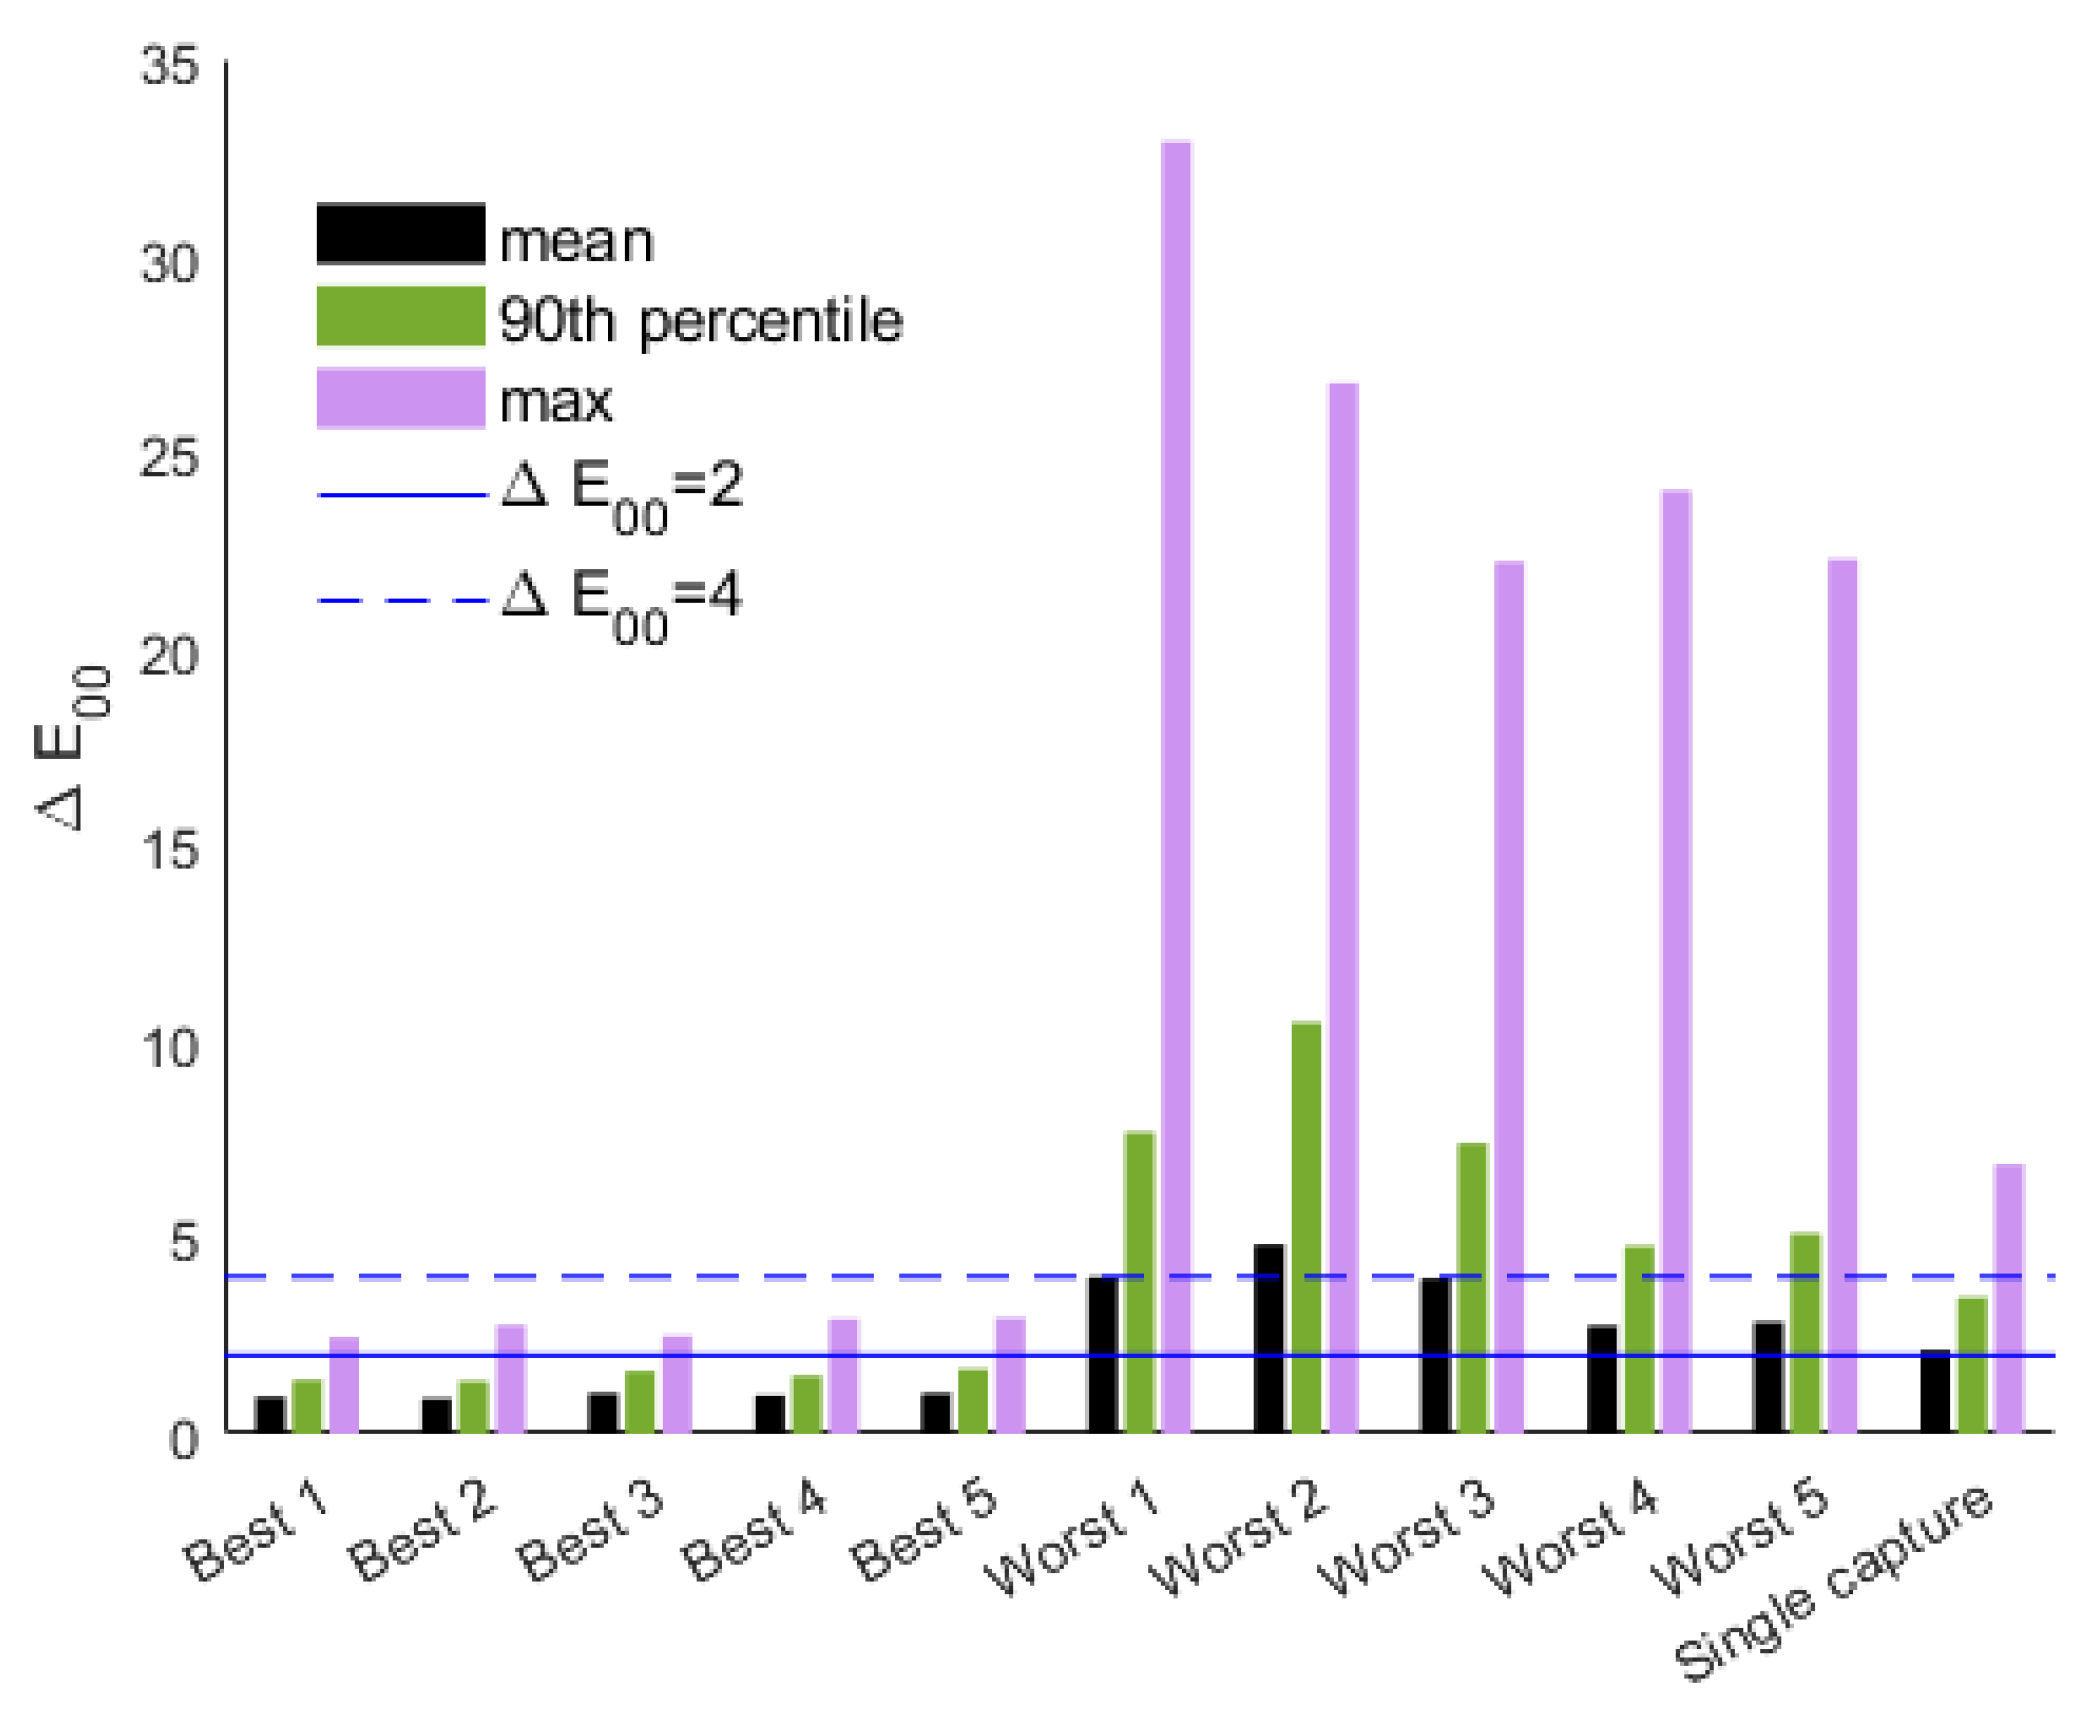
Figure 5.
statistics for the Broncolor strobe and modeling lamp compared to a single capture and the fifth top-ranked filter pair with the Broncolor strobes.
Figure 5.
statistics for the Broncolor strobe and modeling lamp compared to a single capture and the fifth top-ranked filter pair with the Broncolor strobes.
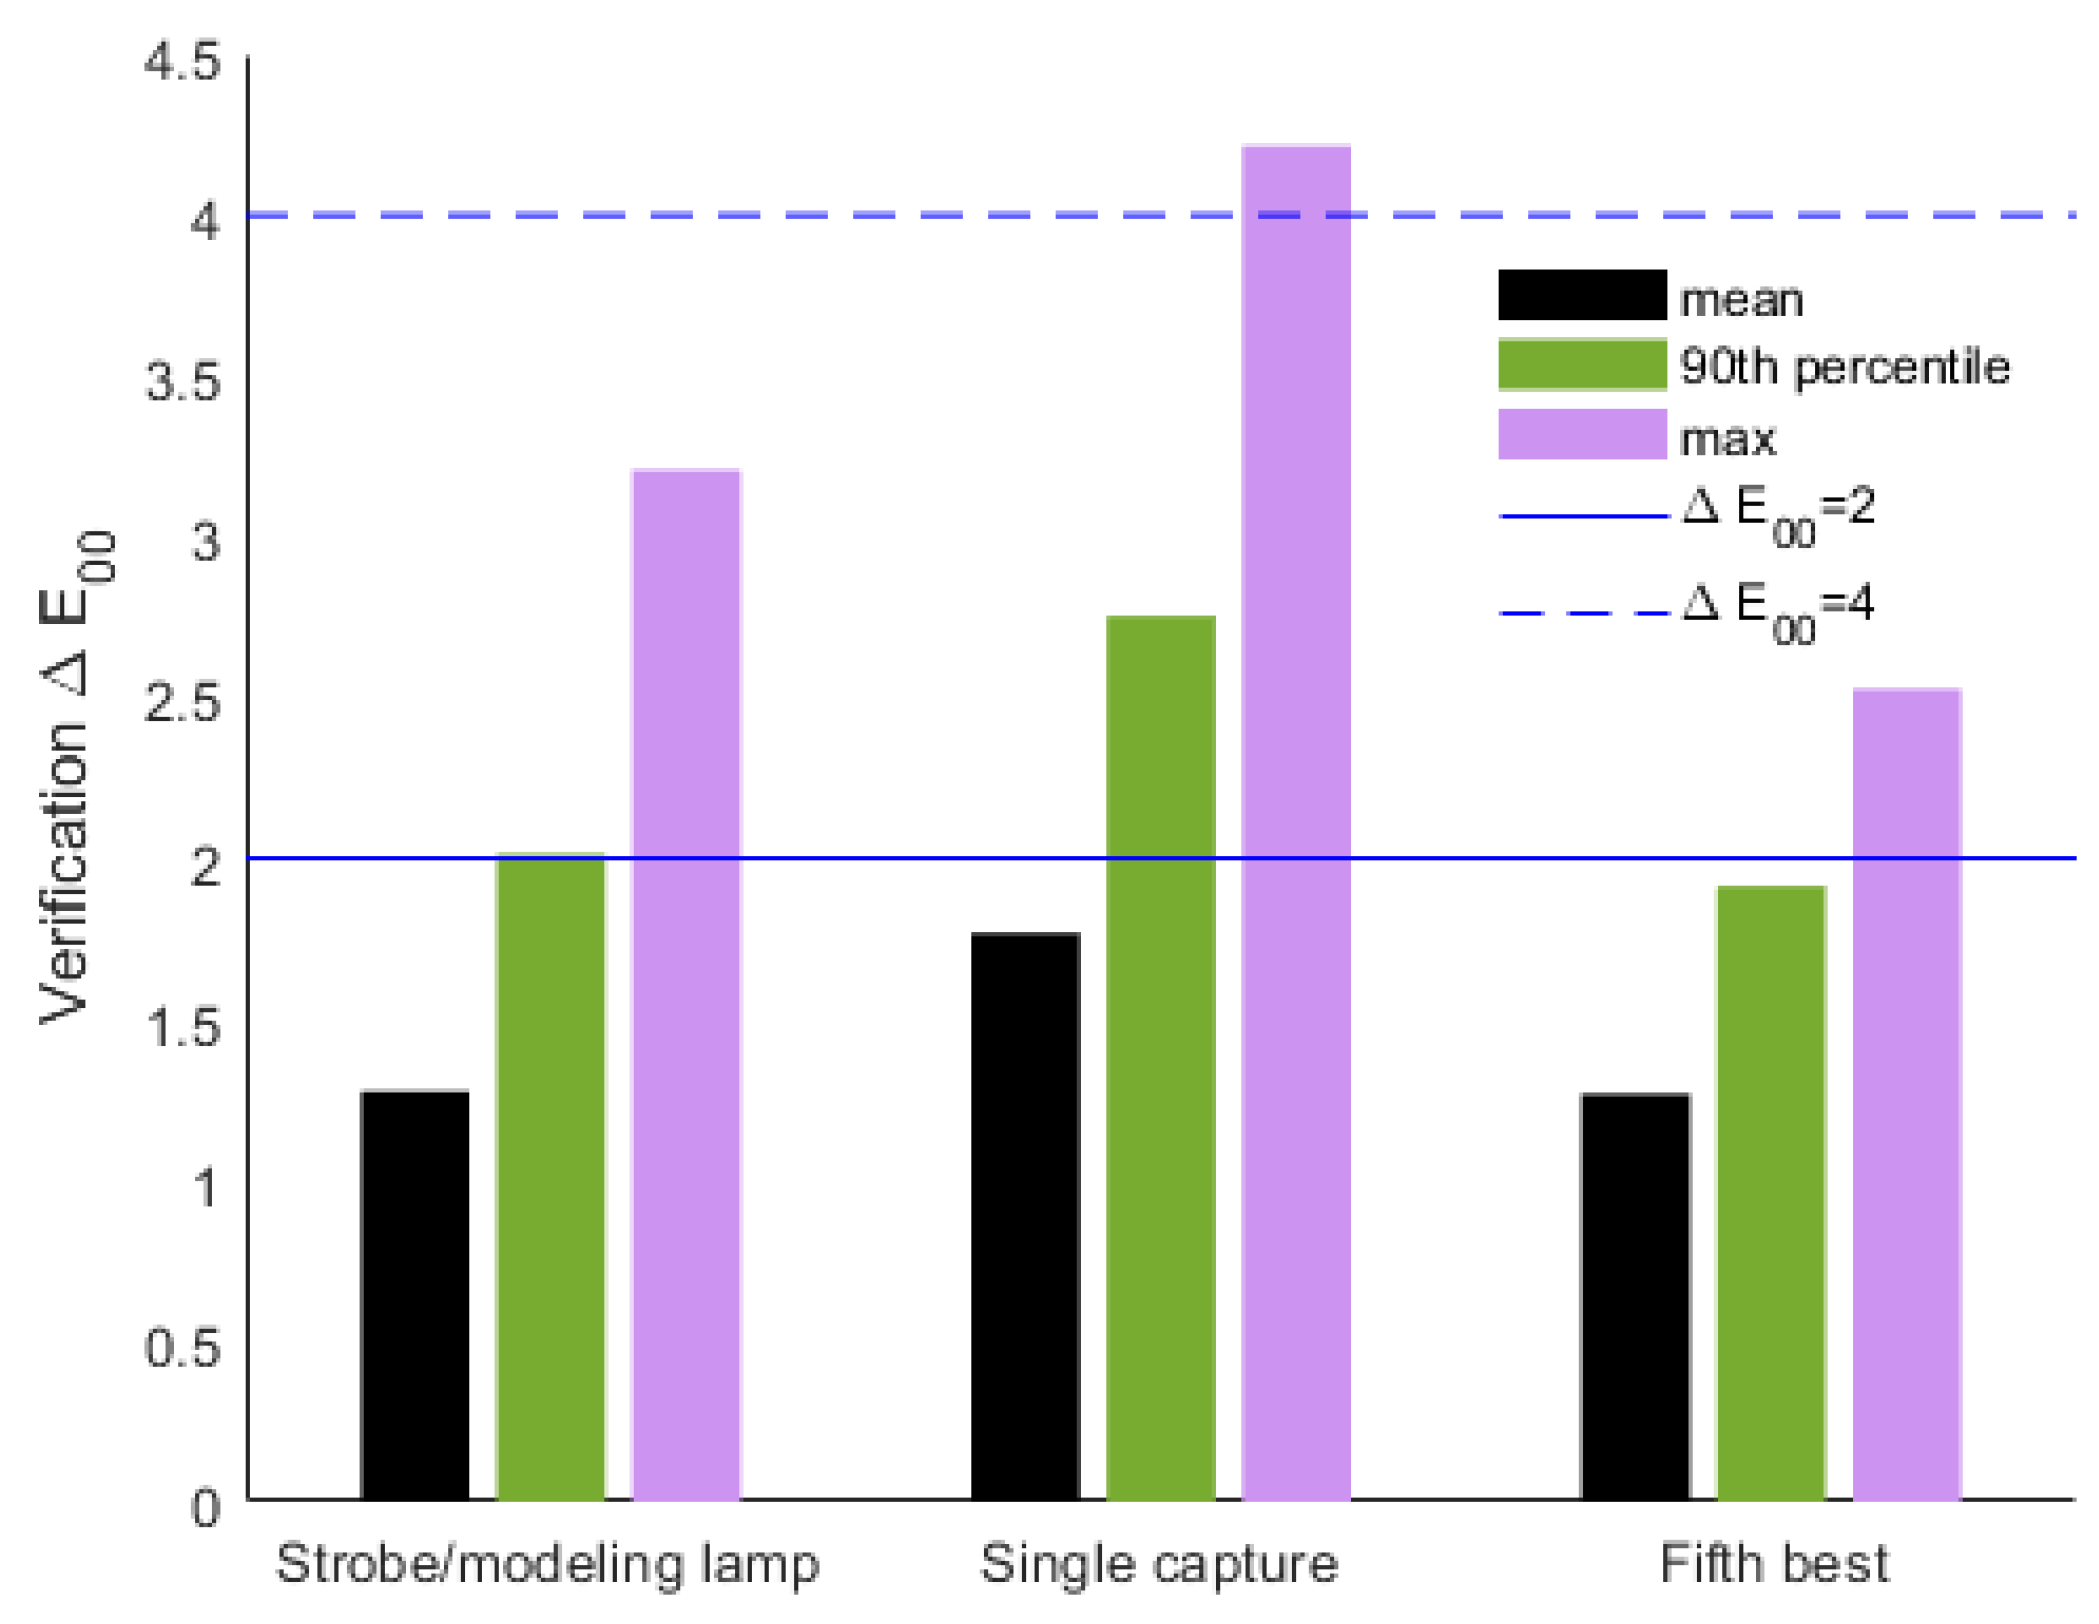
Figure 6.
Screenshot of the target patch selection page in BeyondRGB. The user manually places the grid, ensuring the inner square is completely contained within each color patch.
Figure 6.
Screenshot of the target patch selection page in BeyondRGB. The user manually places the grid, ensuring the inner square is completely contained within each color patch.
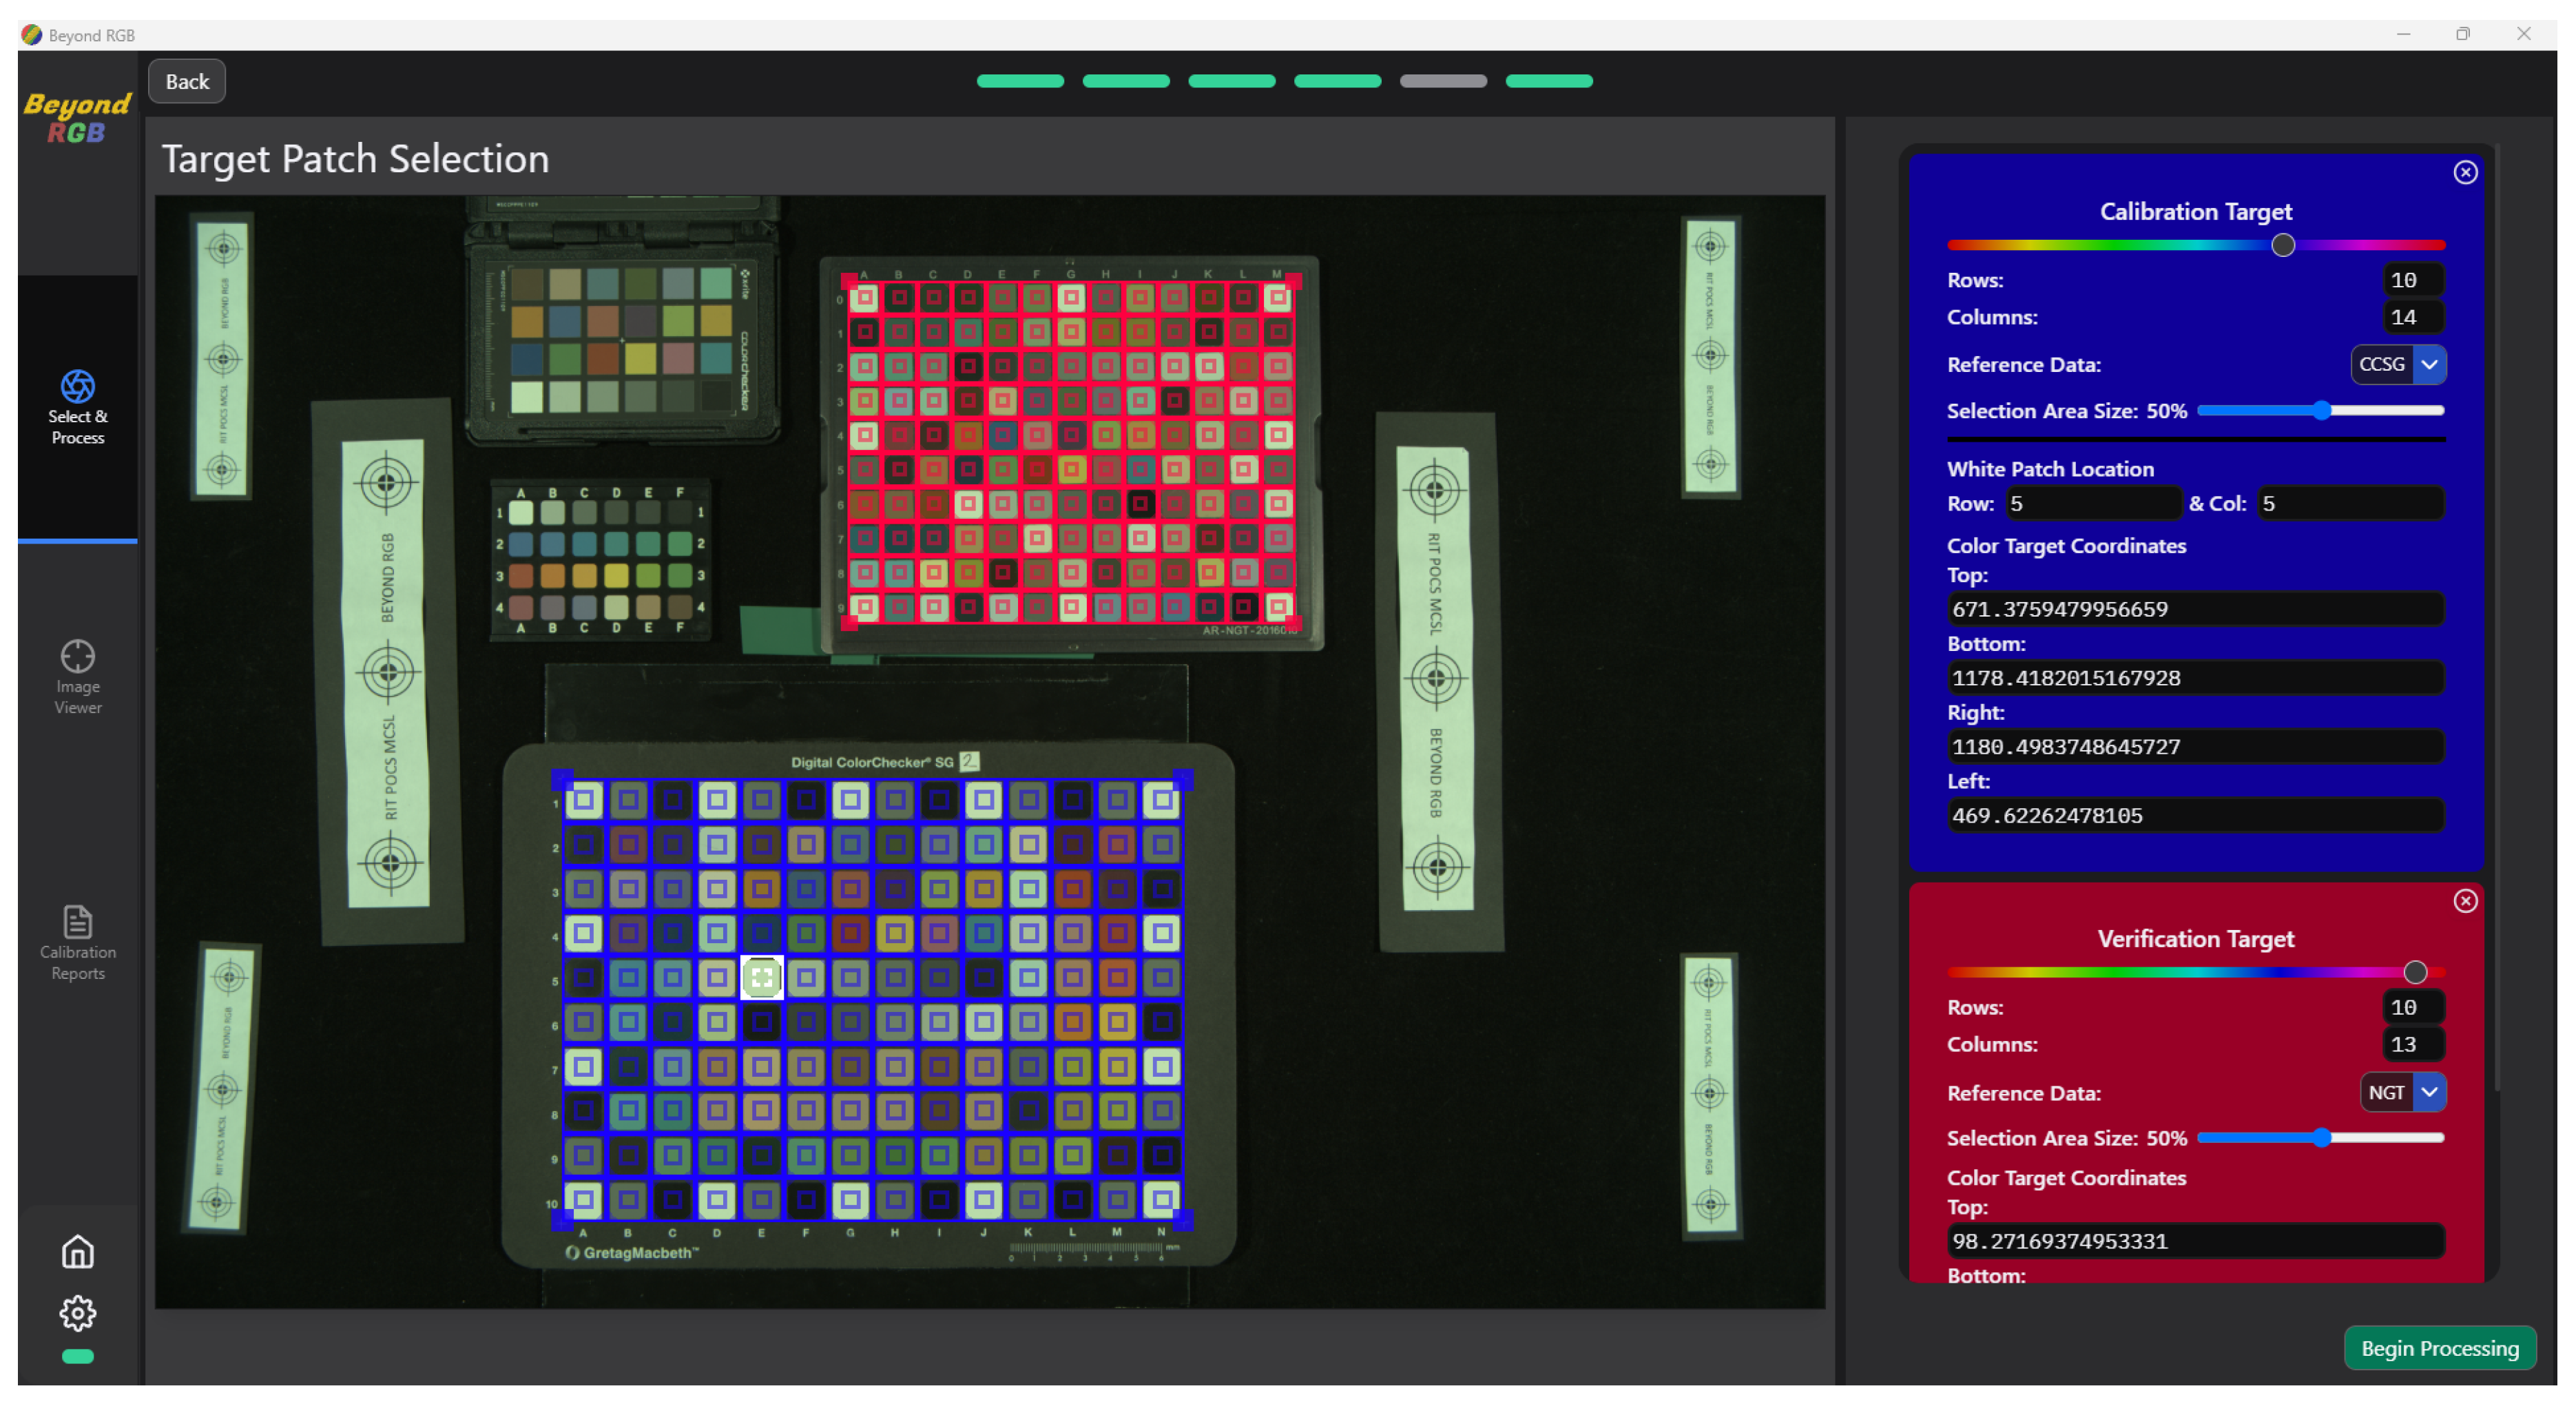
Figure 7.
Variation in the mean and 90th percentile values cause by pixel selection.
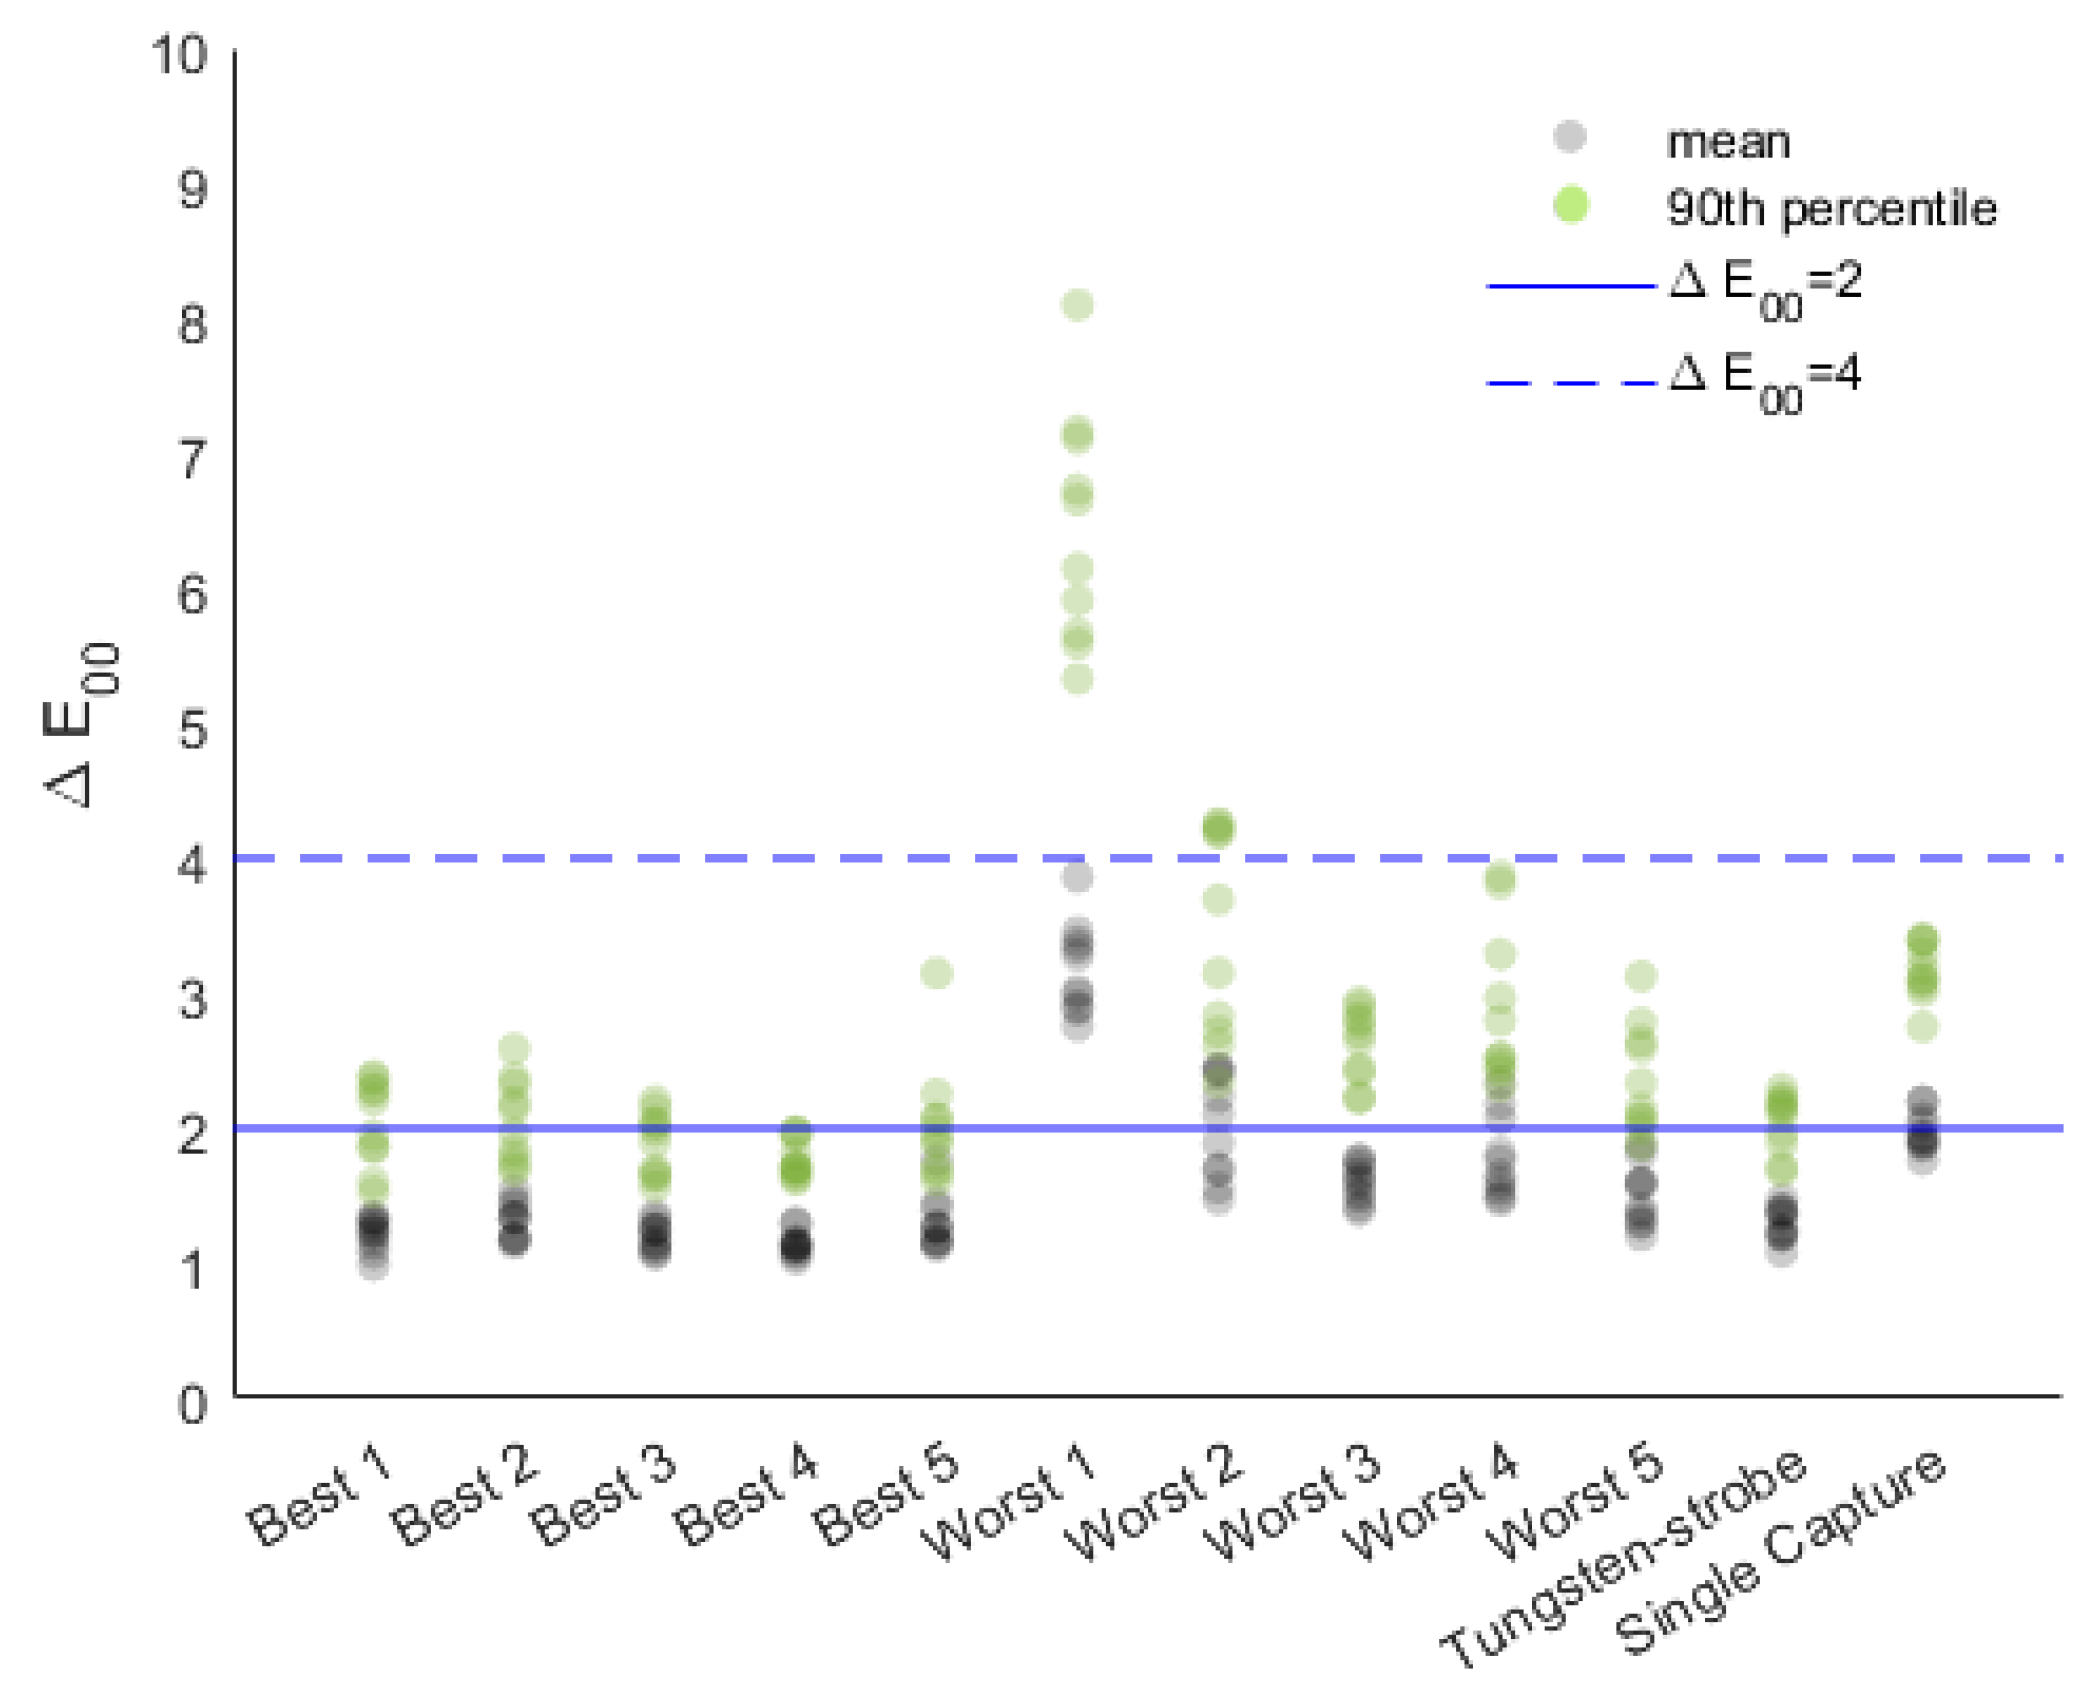
Figure 8.
Camera spectral responses relative to the unfiltered Broncolor light for the filter pairs: (a) Best 1, (b) Best 2, (c) Best 3, (d) Best 4, (e)Best 5, (f) Worst 1, (g) Worst 2, (h) Worst 3, (i) Worst 4, and (j) Worst 5.
Figure 8.
Camera spectral responses relative to the unfiltered Broncolor light for the filter pairs: (a) Best 1, (b) Best 2, (c) Best 3, (d) Best 4, (e)Best 5, (f) Worst 1, (g) Worst 2, (h) Worst 3, (i) Worst 4, and (j) Worst 5.
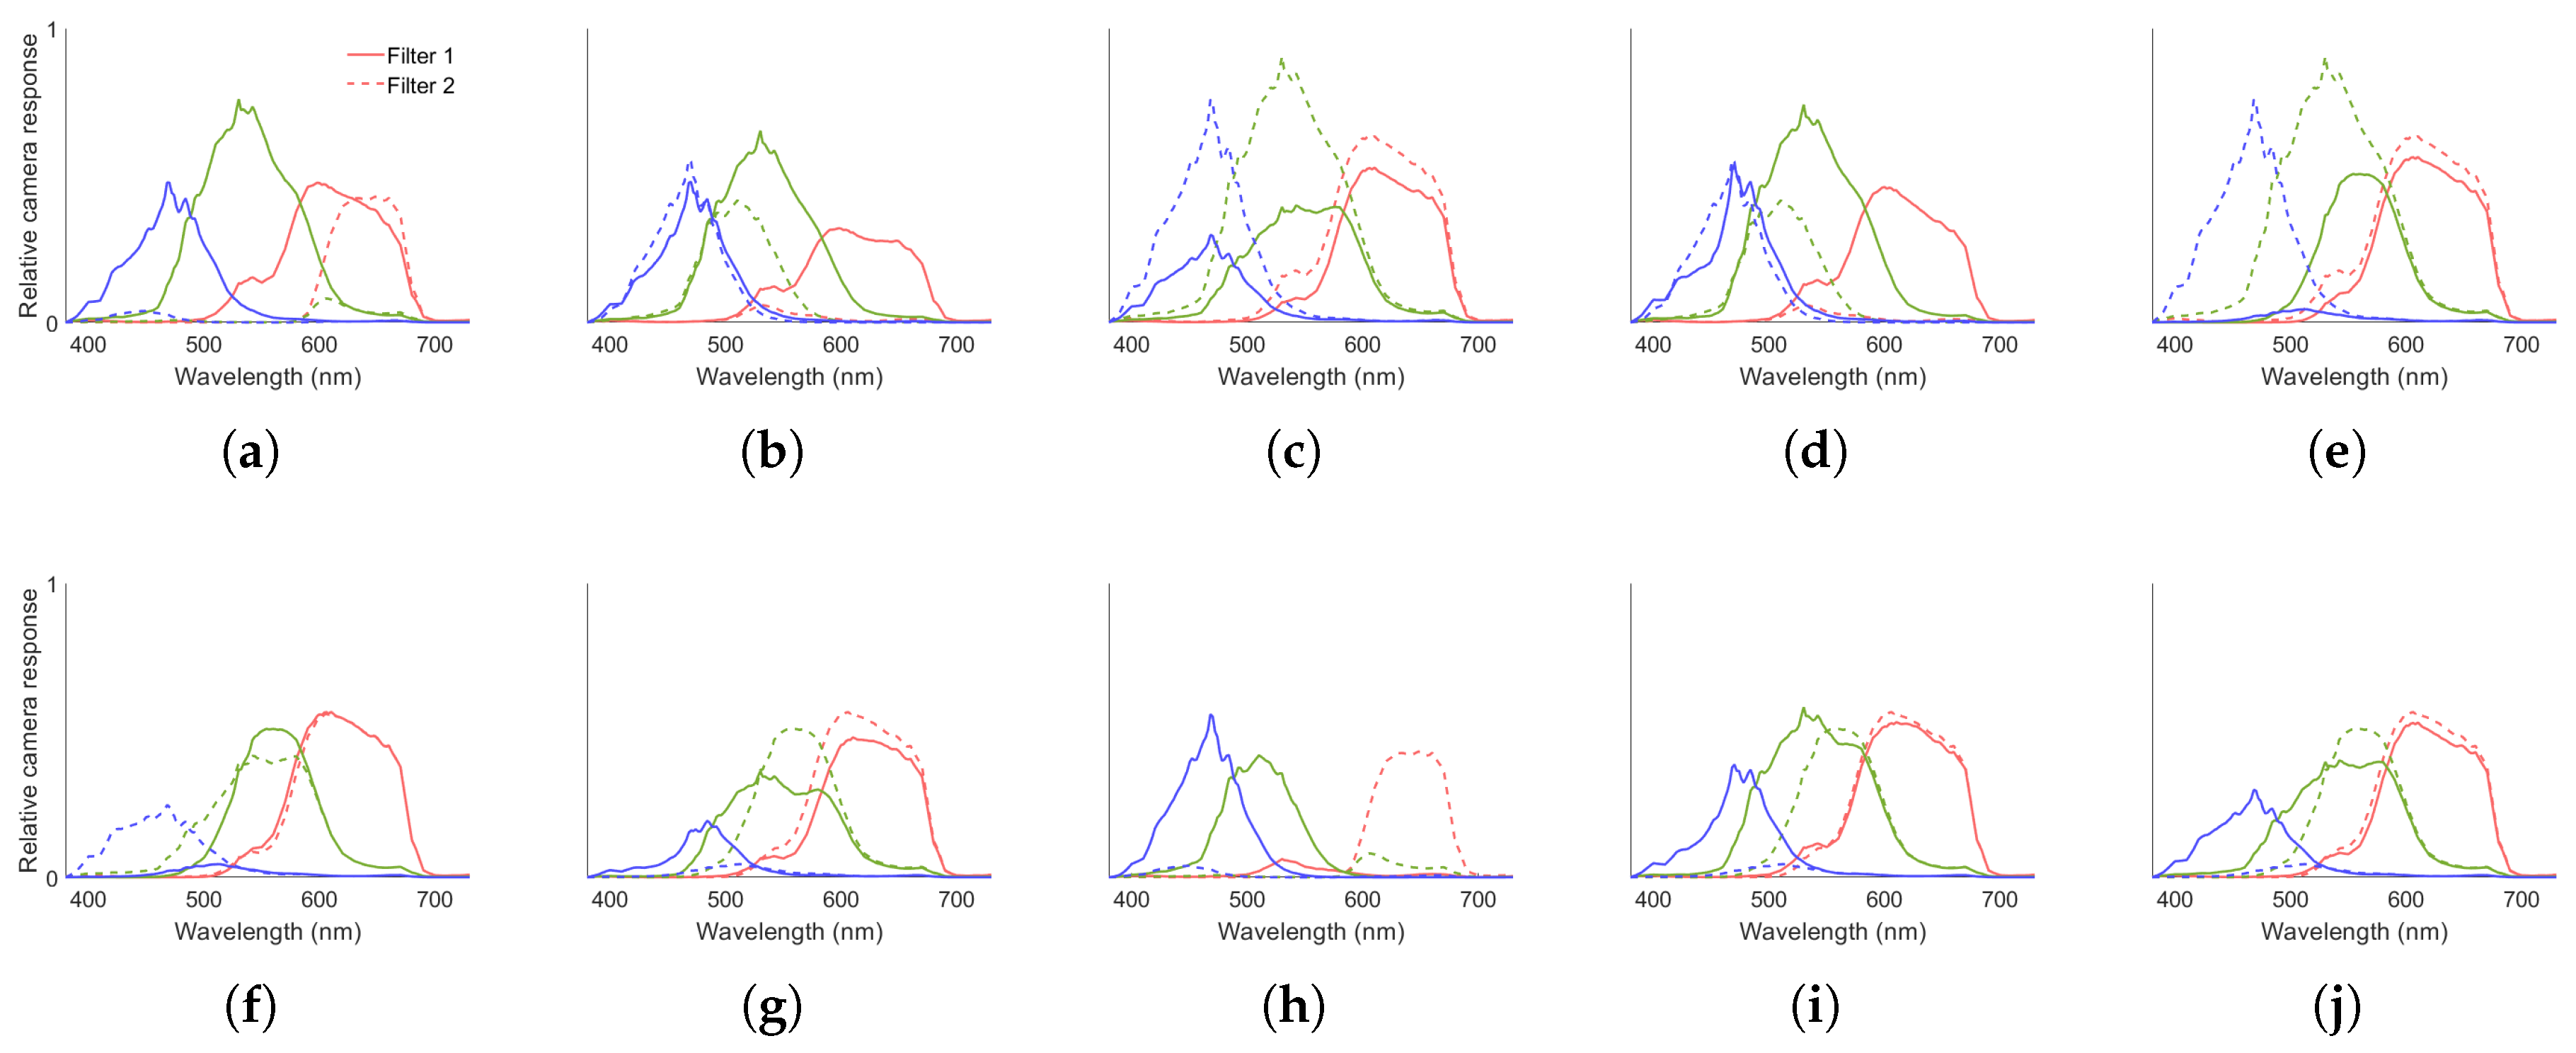
Figure 9.
(a) Final image rendered in the BeyondRGB software, and (b) a close up, for the worst-performing filter pair demonstrating the visible noise and color artifacts.
Figure 9.
(a) Final image rendered in the BeyondRGB software, and (b) a close up, for the worst-performing filter pair demonstrating the visible noise and color artifacts.
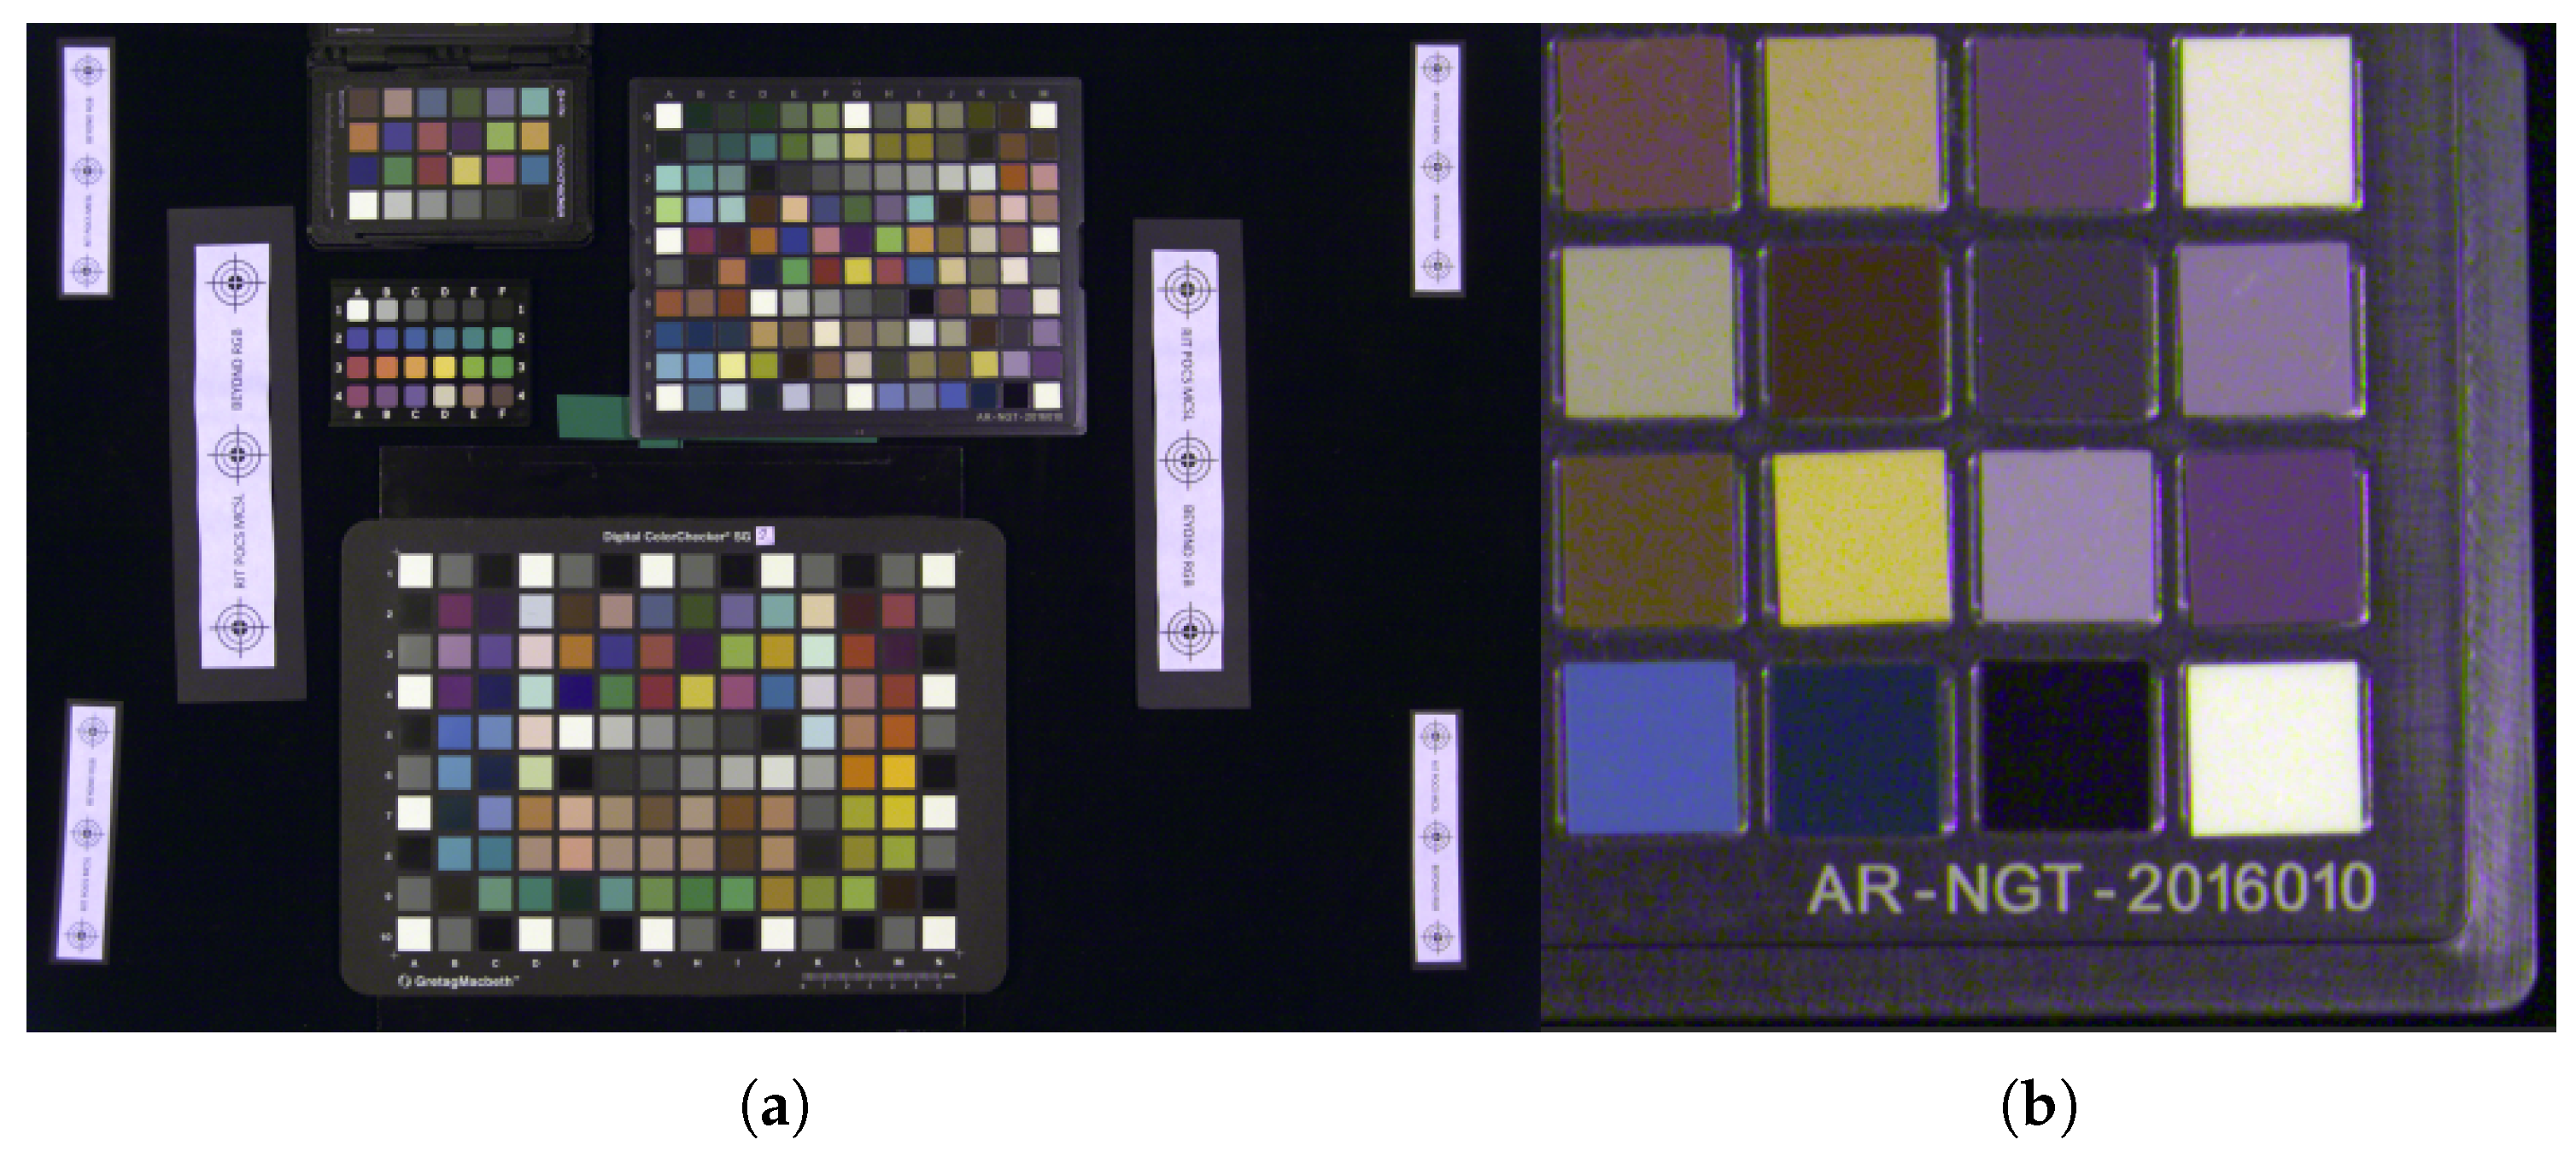
Figure 10.
A comparison of the simulated camera signals against the real camera signals, normalized by the maximum signal, for all filter pairs.
Figure 10.
A comparison of the simulated camera signals against the real camera signals, normalized by the maximum signal, for all filter pairs.
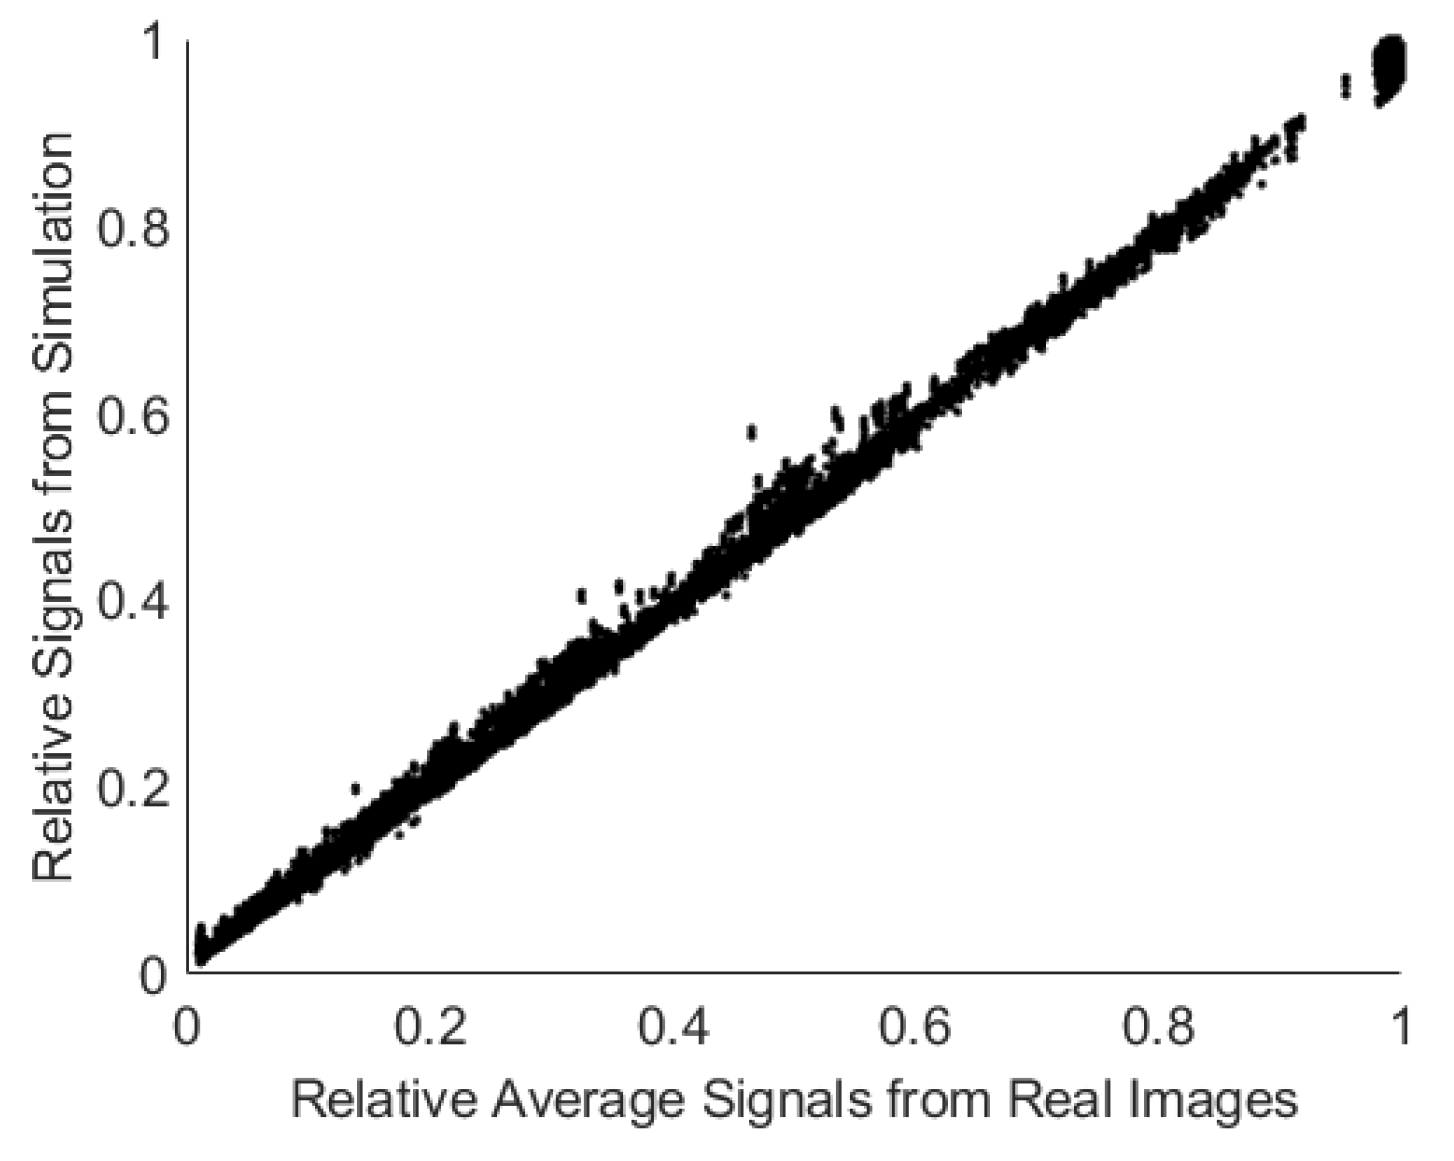
Figure 11.
Correlation between the simulated and real estimated 1931 tristimulus values (a) X, (b) Y, and (c) Z.
Figure 11.
Correlation between the simulated and real estimated 1931 tristimulus values (a) X, (b) Y, and (c) Z.
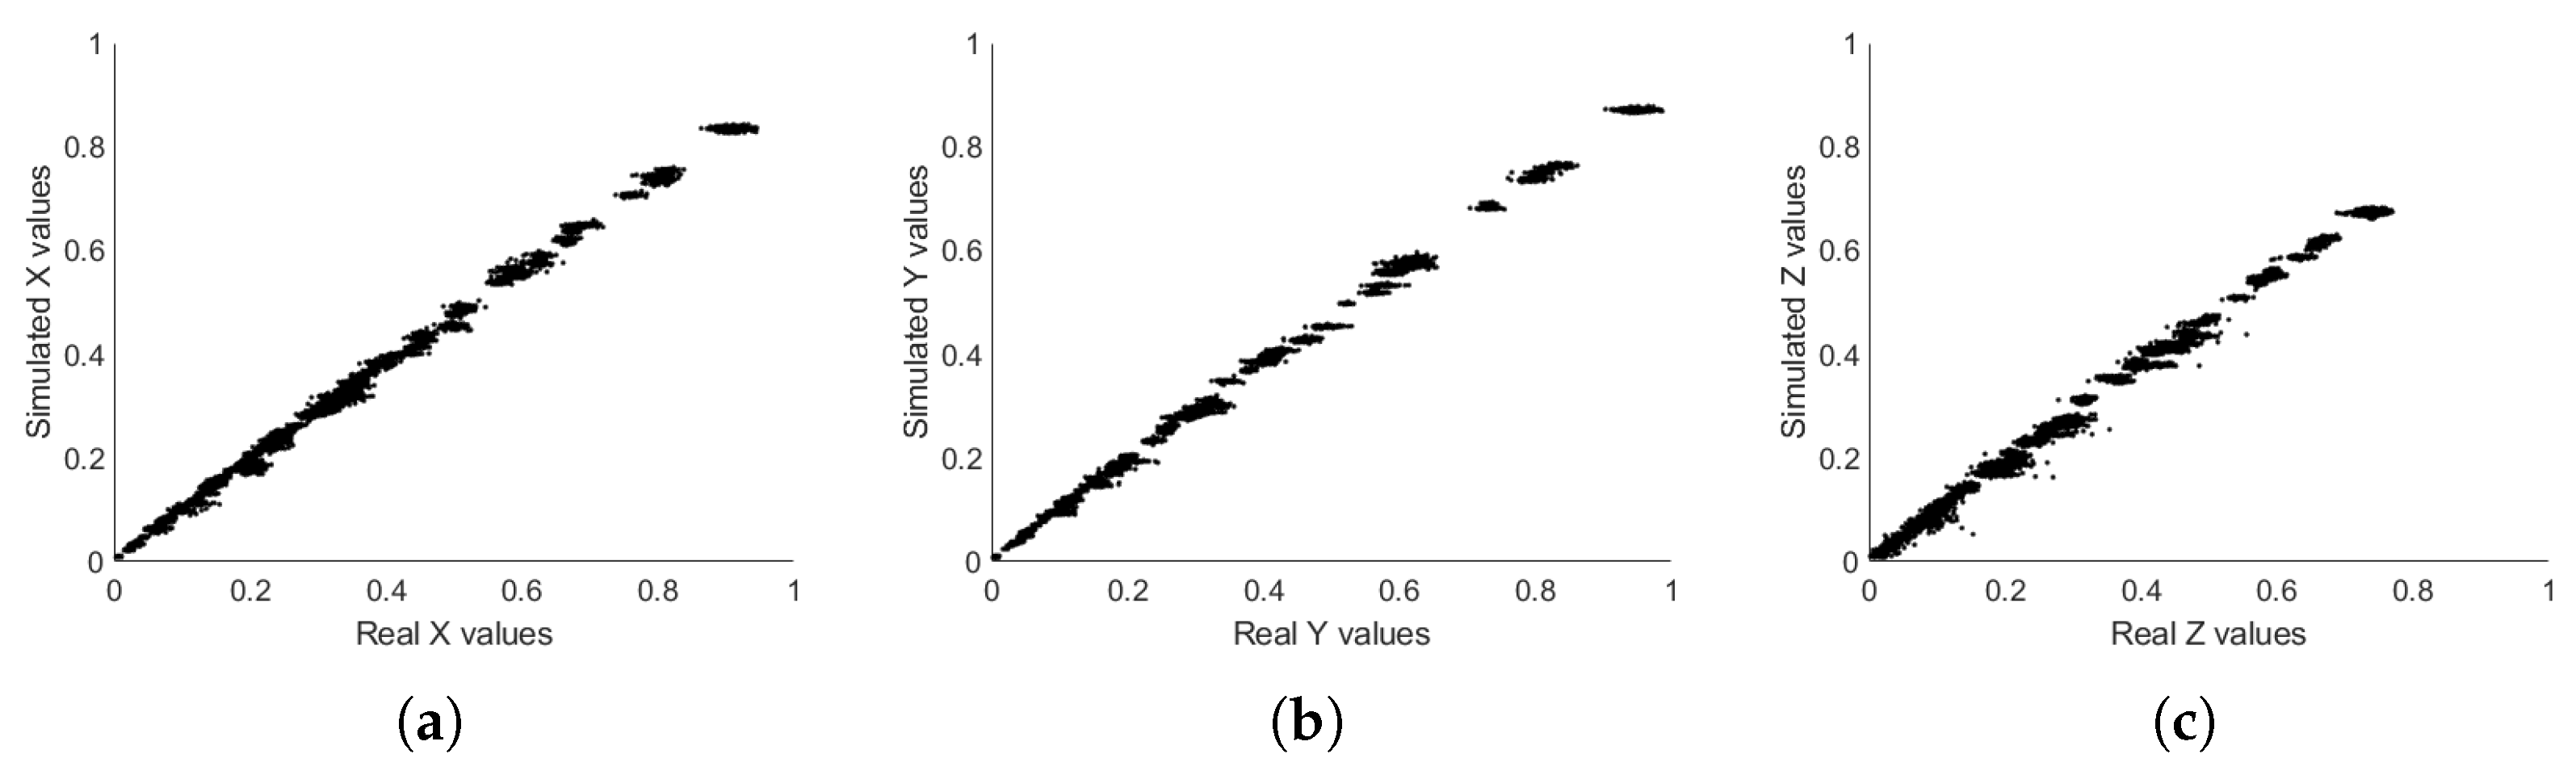
Figure 12.
Correlation between the simulated and real values, as calculated from the estimated and reference tristimulus values for (a) all individual values and (b) the mean of each filter pair.
Figure 12.
Correlation between the simulated and real values, as calculated from the estimated and reference tristimulus values for (a) all individual values and (b) the mean of each filter pair.
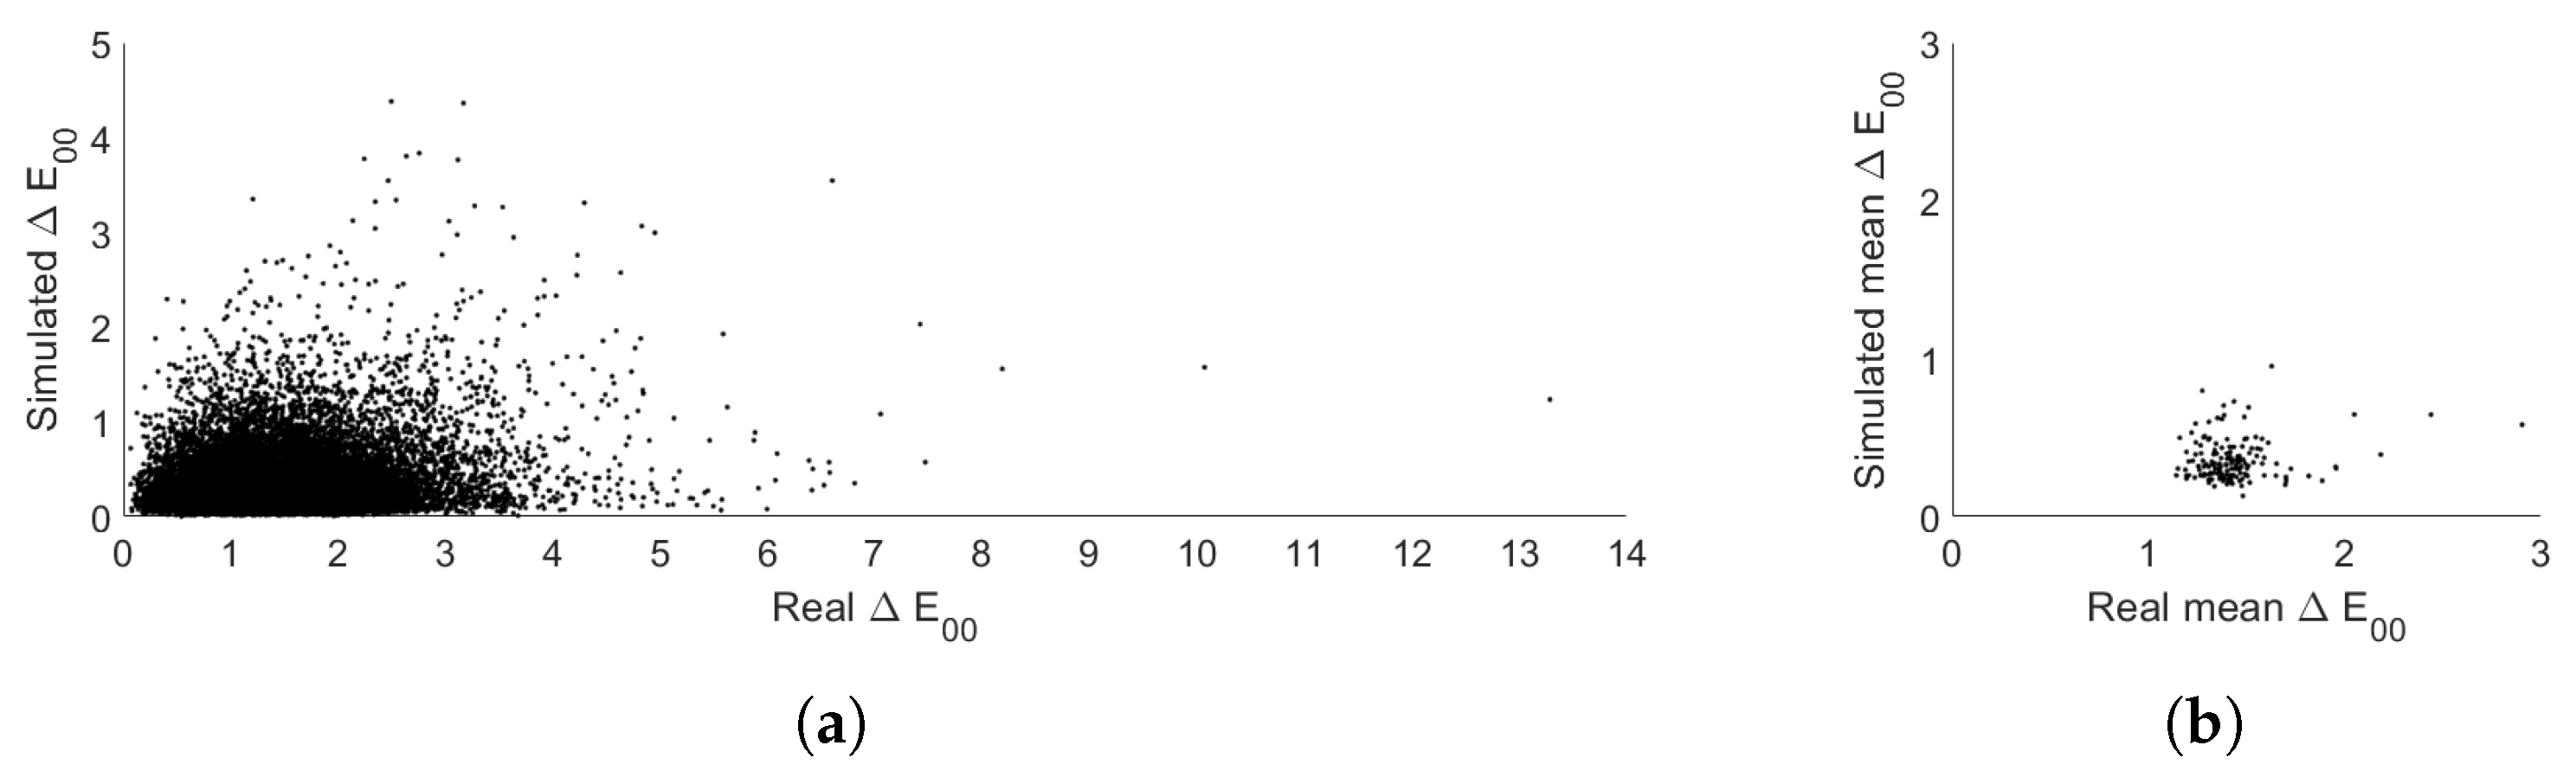

Table 1.
Description of the lights used during the filter selection simulation
| Light Brand and Model | Correlated Color Temperature |
|---|---|
| ColorBurst Systems SpectraCore 180 LED | 5000K |
| Digital Transitions Photon | 5600K |
| Godox ML60bi | 5600K |
| Broncolor Pulso F4 Strobe | 5600K |
| Genaray PortaBright Bi-ColorLED | 5000K |
Disclaimer/Publisher’s Note: The statements, opinions and data contained in all publications are solely those of the individual author(s) and contributor(s) and not of MDPI and/or the editor(s). MDPI and/or the editor(s) disclaim responsibility for any injury to people or property resulting from any ideas, methods, instructions or products referred to in the content. |
© 2025 by the authors. Licensee MDPI, Basel, Switzerland. This article is an open access article distributed under the terms and conditions of the Creative Commons Attribution (CC BY) license (http://creativecommons.org/licenses/by/4.0/).
Copyright: This open access article is published under a Creative Commons CC BY 4.0 license, which permit the free download, distribution, and reuse, provided that the author and preprint are cited in any reuse.


