Submitted:
27 August 2025
Posted:
27 August 2025
You are already at the latest version
Abstract
Microphysiological systems (MPS) have emerged as alternatives to animal testing in drug development, following the FDA Modernization Act 2.0. Double-layer channel-type MPS chips with porous membranes are versatile for modeling various organs, including the intestines, blood-brain barrier, renal tubules, and lungs. However, these chips faced challenges owing to optical interference caused by light scattering from the porous membrane, which hinders cell observation. One non-invasive method for assessing barrier integrity in these chips is trans-epithelial electrical resistance (TEER) measurement. Existing electrode-integrated MPS chips for TEER measurement have non-uniform current densities, leading to compromised measurement accuracy. Additionally, chips made from polydimethylsiloxane have been associated with drug absorption issues. This study developed an electrode-integrated MPS chip for TEER measurement with uniform current distribution and minimal drug absorption. Through finite element method simulation, electrode patterns were optimized and incorporated into a polyethylene terephthalate (PET)-based chip. The device was fabricated by laminating PET films, porous membranes, and patterned gold electrodes. The chip’s performance was evaluated using a perfused Caco-2 intestinal model. TEER levels peaked on day 5 when cells formed a monolayer, then decreased as villi-like structures developed. Capacitance increased, indicating microvilli formation. Exposure to staurosporine resulted in a dose-dependent reduction in TEER, which was validated by immunostaining indicating tight junction disruption. This study presents a TEER measurement MPS platform with uniform current density and reduced drug absorption, thereby enhancing TEER measurement reliability. This system effectively monitors barrier integrity and drug responses, demonstrating its potential for non-animal drug-testing applications.
Keywords:
microphysiological system (MPS)
; trans-epithelial electro resistance (TEER)
; microfluidic device
; gut-on-a-chip
; cell culture
; polyethylene terephthalate (PET)
Introduction
Recently, microphysiological systems (MPS) have emerged as a crucial technology in drug discovery, offering a viable alternative to animal testing [1]. The US Food and Drug Administration’s Modernization Act 2.0 has underscored the importance of addressing ethical and scientific concerns associated with animal testing, as well as the necessity for swift and accurate drug evaluation methods [2,3]. MPS enables the in vitro replication of organ and tissue functions, making it applicable to a wide range of organ models. The double-layer channel-type MPS chip, featuring a porous membrane, has garnered attention as a versatile and convenient platform for organ models like the intestinal tract, blood-brain barrier, kidneys, and lungs in the drug discovery process [4,5]. However, a key challenge lies in evaluating cell conditions and kinetics for double-layer channel-type MPS chips with porous membranes. While the porous membrane facilitates compartmental separation, it also leads to diffuse light reflection, complicating the observation of cellular conditions through optical techniques. To address this issue, an evaluation method independent of optical means is imperative. To monitor cells on porous membranes, trans-epithelial electrical resistance (TEER) emerges as a promising parameter for nondestructive and quantitative evaluation of cell barrier function.
TEER measurements, widely utilized in cell culture systems with culture inserts, are crucial for accurately assessing the state of cells on porous membranes [6,7,8]. Several studies have proposed integrating electrodes into double-layer channel-type MPS chips to measure TEER [9,10,11,12,13,14]. However, TEER measurements on MPS chips are still limited, and several problems persist with the existing methods. One issue is that the electrode geometry utilized for TEER measurement is not optimized for the cell culture area, leading to non-uniform current density during measurement, which can impact accuracy [14,15]. Achieving a uniform cell monolayer in actual cell culture is challenging owing to potential issues like aggregates and detachment. Therefore, ensuring uniform sensitivity across the entire cell monolayer area is essential. To address these issues, Kamei et al. developed an electrode pattern that enhanced current density uniformity in the cell culture area within MPS chips through computer simulations using the finite element method (FEM) [16]. While this approach shows promise in simulation, it has yet to be tested on a practical MPS chip. Therefore, the development of a highly efficient MPS chip with TEER measurement capabilities is imperative and its effectiveness should be validated. Furthermore, existing MPS chips for TEER measurement are typically made of polydimethylsiloxane (PDMS), which can lead to drug adsorption and sorption issues that compromise the reliability of drug testing [17].
In this study, we aimed to develop a double-layer channel-type MPS chip with a uniform electrode pattern of current density designed using FEM simulation. We chose polyethylene terephthalate (PET) as the material for this project owing to its low drug adsorption and sorption properties, to enhance the reliability of drug testing. Furthermore, we developed a technology to laminate and integrate PET films, porous membranes, and flow channel layers, successfully implementing an electrode pattern validated through FEM simulations on a PET-based chip. The performance of the MPS chip was then demonstrated using intestinal epithelial cells (Caco-2) as a model of the intestinal tract. By utilizing this model for drug testing, we accurately assessed cellular conditions, showcasing the potential of this device as a drug discovery platform that could potentially replace animal testing. These findings offer valuable insights for enhancing the design and functionality of MPS chips, marking a significant advancement in their role as an alternative to animal testing in the drug discovery process.
Materials and Methods
1.1. Double-Layered TEER Measurement Microfluidic Chip
The TEER measurement microfluidic chip for perfusion cell culture utilized Fluid3D-X®, a product from Tokyo Ohka Kogyo in Kanagawa, Japan [18,19]. This innovative chip features a double-layered microchannel structure separated by a porous membrane, with medium chambers in each port [19,20]. The assembly of Fluid3D-X® with TEER measurement electrode (F3D-XTR) involved laminating PET films with microchannel structures, micropatterned Au electrodes, and a porous membrane with specific characteristics (PET, pore size: 0.45 µm, 2000M12/640N453/A4, it4ip, Louvain-laNeuve, Belgium) [Figure 1(a) and Figure 1(b)]. To perfuse the culture medium, the medium reservoirs on the three F3D-XTRs in an ANSI/SLAS-compliant rectangular plate were connected to a peristaltic pump (AQ-RP6R-001, Takasago Fluidic Systems, Nagoya, JAPAN) with silicone tubes [Figure 1(c) and Figure 1(d)]. A peristaltic pump controller arbitrarily controls the flow rate of the perfusion medium.
1.2. Electrode Design Through FEM Simulations
The accuracy and uniformity of cell measurements are significantly influenced by electrode placement and geometry [14]. To accurately assess the cell condition, the uniformity of the current applied to the porous membrane surface was assessed, and utilized as the cell culture surface. Achieving uniformity of the applied current requires strategic placement of electrodes across the entire surface relative to the measurement targets. While Au electrodes offer excellent biocompatibility, stability, and electrical properties, placing electrodes across the entire surface without obstructing cell observation can be challenging. To achieve highly accurate electrical measurements while maintaining cell observability, the current densities of the two-electrode geometries (Models 1 and 2) were simulated. COMSOL Multiphysics electrochemical modules were employed to assess the current density distribution using the FEM. Models 1 and 2 had an opening (400 μm wide) in the center of the channel for cell observation [Figure 2(a)]. Only symmetrical electrode patterns along the central axis were considered in these models, as asymmetrical patterns in the longitudinal (y) direction of the cell culture areas are unsuitable for TEER measurements. Ensuring the uniformity of current passing through the cell surface is crucial for accurate TEER measurements. To evaluate the current density distribution in both the width (x) and longitudinal (y) directions of the channel at the cell surface, simulations were conducted. ΔI serves as an index of the variation in current density distribution within the evaluation range. A smaller ΔI indicates less variation in current density, signifying an ideal electrode shape.
where Imax and Imin represent the maximum and minimum current densities, respectively. The specific parameters and boundary conditions utilized in this simulation are detailed in Supplementary Tables S1 and S2. Notably, parameters other than the electrode design were the same for both models.
1.3. TEER Measurement Station
The TEER measurement system, comprising a laptop and measurement station, was developed as a dedicated measurement instrument for F3D-XTR. To measure the TEER, the F3D-XTRs were positioned on the measurement station [Figure 1(e)]. The four-terminal method was employed to measure the potential difference between the upper and lower reference electrodes by applying a current to the working electrodes of the upper and lower layers by contacting the spring pins of the TEER measurement station with the electrode pads of the F3D-XTR [Figure 1(f)]. The four-terminal method offers advantages, such as reduced susceptibility to resistance from the measurement circuit and wiring, ensuring high measurement stability even when the resistance of the measurement electrode section fluctuates owing to medium components. This system enabled the measurement of TEER (impedance) and capacitance. Further details regarding the system specifications can be found in Supplementary Table S3.
1.4. Cell Culture Using F3D-XTR
Caco-2 cells were obtained from the American Type Culture Collection (HTB-37, ATCC, VA, USA) and maintained in DMEM (12320-032, Gibco, Thermo Fisher Scientific, Waltham MA, USA) containing 10% Fetal Bovine Serum (10270106, Gibco, Thermo Fisher Scientific), MEM Non-Essential Amino Acids solution (11140-050, Thermo Fisher Scientific) and Penicillin-Streptomycin-Amphotericin B Suspension (161-23181, FUJIFILM Wako Pure Chemical Corporation, Osaka, Japan).
Prior to applying the extracellular matrix coat, F3D-XTR was cooled to 4°C. A 30× diluted Matrigel® Matrix Basement Membrane (356237, Corning, Corning, NY, USA USA) in FBS-free DMEM was then added to the top and bottom channels of F3D-XTR, followed by incubation at 4°C overnight. Caco-2 cells cultured on a petri dish covered approximately 90% were washed twice with phosphate-buffered saline (PBS) (14190144, Gibco Thermo Fisher Scientific) and treated with trypsin (T4049, Sigma-Aldrich, St. Louis, MO, USA). Cells were suspended to 2 × 10⁶ cells/mL (2 × 10⁵ cells/cm2), and 110 μL of cell suspension was seeded onto the top channel of F3D-XTR using a wide-pore tip micropipette. Subsequently, 120 µL of DMEM was injected into the bottom channel of F3D-XTR, and F3D-XTR in the plate was placed in a CO2 incubator (37°C, 5% CO2) to allow cell attachment to the porous membrane. After validating cell attachment within 4 to 5 h, a peristaltic pump was connected to the perfusion system, and 650 μL of DMEM was simultaneously added to the medium reservoirs of both the inlet and outlet using a multipipette from the top to the bottom channel. Following the initial filling of the medium in the reservoirs, medium perfusion was performed at a speed of 3.8 µL/min (pre-perfusion). On day 2, the medium was replaced, and the perfusion speed was increased to 15.2 µL/min. Subsequently, the medium was changed every 2 or 3 d.
1.5. Online TEER Measurement with Staurosporine Exposure
Caco-2 cells were cultured using the aforementioned cell culture method, and drug exposure tests were conducted on days 13-21 of the culture when the TEER values remained relatively stable. The drug exposure test involved the following steps: First, 650 μL of DMEM containing 0.1 μM or 1.0 μM staurosporine (STA: S4400, Sigma-Aldrich) was added into both the inlet and outlet of the medium reservoirs of the top channel with a multipipette. Subsequently, 650 μL of STA-free DMEM was added into the inlet and outlet of medium reservoirs with a multipipette on the bottom channel. After filling the medium on the reservoirs, the tubes were filled with the same concentration of STA-containing DMEM for the top and STA-free DMEM for the bottom, and perfusion culture was performed using a peristaltic pump. While the drug exposure study was conducted, the TEER measurement station with the F3D-XTR and perfusion setup was placed in a CO2 incubator. TEER measurements were performed at 3-min intervals until 16 h after the onset of the measurements. Lucifer Yellow (LY) permeability assays were performed 20 h after STA exposure. Subsequently, cells were fixed in 4% paraformaldehyde for immunostaining.
1.6. Lucifer Yellow Permeation Assay
Before the permeability assay, the medium in the channels, as well as the inlet and outlet reservoirs were replaced with a transport buffer (TP buffer, HBSS with Ca2+ and Mg2+, containing 10 mM HEPES, pH 7.4, phenol-red-free, FUJIFILM Wako Pure Chemical Corporation). The chips were incubated under 37°C 5% CO2 for 30-60 min. Following acclimation, the TP buffer in both the inlet and outlet reservoirs was removed using a multipipette. Subsequently, 500 µL of 100 µM Lucifer Yellow (LY, 128-06271, FUJIFILM Wako Pure Chemical Corporation) in TP buffer was applied to the inlet reservoir of the top channel. To ensure an even distribution of LY in the channel, 200 µL of the LY solution was collected from the outlet reservoir and returned to the inlet twice.
The same process was repeated with 500 µL of TP buffer for the bottom channel. Subsequently, 100 µL of the solution was collected from both the top and bottom outlets to serve as samples at 0 h. The chips were then incubated at 37°C with 5% CO2. After 30 min, the same procedure was repeated, and 100 µL of the solution collected from the top and bottom outlets served as samples at 0.5 h.
Samples collected at each time point were analyzed using a microplate reader (SH-9500Lab, CORONA ELECTRIC, Ibaraki, Japan) at Ex / Em: 485 nm / 538 nm. The transmission coefficient was calculated using Equation (2) [19,20].
where Papp (cm/sec) represents the transmission coefficient, dQ/dt (nmol/sec) represents the transmission velocity, C0 represents the initial concentration of LY on the apical side, and S represents the surface area (0.65 cm2) of the porous membrane.
1.7. Immunocytochemistry
To detect ZO-1 and phalloidin protein expression in Caco-2 cells, the cells were cultured in F3D-XTR and fixed using 4% paraformaldehyde. Following blocking with 1% bovine serum albumin in PBS, the cells were incubated overnight with rabbit anti-ZO-1 antibody (Proteintech Group, Inc., Rosemont, IL, USA). Next, the cells were incubated with a secondary antibody, Alexa Fluor 568 donkey anti-rabbit IgG (Invitrogen, Carlsbad, CA, USA) for 1 h. Subsequently, Acti-Stain 488 Fluorescent Phalloidin (Cytoskelton. Inc., DENVER, CO, USA) and DAPI solution (DOJINDO LABORATORIES, Kumamoto, Japan) were added. Finally, the cells were mounted in VECTASHIELD medium (Vector Laboratories, Burlingame, CA, USA).
Cell imaging was performed using a confocal microscope (A1R; Nikon, Tokyo, Japan) at the Tokai University Imaging Center for Advanced Research.
1.8. Statistical Analysis
All values are expressed as mean ± S.D. from at least triplicate experiments. Tukey’s t-test was performed for paired and unpaired comparisons, as appropriate, and differences were considered significant at p < 0.05.
Results and Discussion
2.1. Evaluation of Electrode Design Through FEM Simulations
To determine the optimal Au electrode design for precise TEER measurements, the uniformity of current density in two different electrode designs was assessed using FEM analysis [Figure 2 (a) and Figure 2(b)]. The ΔI value was lower in Model 2 compared with that in Model 1, with Model 2 demonstrating a more consistent current density distribution [Figure 2 (c)]. The observed outcome may be attributed to the configuration of Model 2, where the distance between the upper and lower electrodes was maximized, resulting in a lower likelihood of current flow. Conversely, the proximity between the electrodes was minimized, leading to a higher probability of current flow. As previously mentioned, electrodes should be positioned across the entire surface of the target being measured. Ideally, the ratio between the longest and shortest distances over which current flows (longest distance/shortest distance) should be as close to 1 as feasible. This ensures a more uniform current density distribution [15]. In this experiment, Model 1 had a longest/shortest distance ratio of 1.20, whereas Model 2 had a ratio of 1.05. Given that the distance ratio in Model 2 was closer to 1, a more uniform current density distribution was anticipated. Based on the findings from the aforementioned investigations, the F3D-XTR was fabricated using the electrode design from Model 2 in this study. Because the chip created in this study was made of PET, a significant reduction in drug adsorption and sorption is anticipated compared with that of PDMS.
2.2. TEER Measurement for Caco-2 Perfusion Culture
Perfusion culture on F3D-XTR revealed significant findings regarding the development of Caco-2 cells. By day 4, the cells demonstrated a nearly monolayer-like structure, which progressed to the formation of villi-like structures by day 7. These villi-like structures continued to advance over time [Figure 3 (a) and (b)] [19]. The expression of ZO-1, a tight junction protein, was first observed on day 4, particularly on the apical side of the villi-like structures as they became more developed [Figure 3a]. The TEER value peaked at 500-600 Ω•cm2 between days 4 and 5 when the cell morphology was monolayer, then decreased as the villi-like structures matured, stabilizing at approximately 150-200 Ω•cm2 [Figure 3 (c)]. The capacitance increased over time, reaching a peak on day 9 and remaining around 6 µF from day 10 to day 15, before saturating around 8-9 µF after an increase on day 17. Permeability was assessed using LY at various time points, with no significant differences observed on days 4, 7, 14, and 21 [Figure 3 (e)].
As shown in Figure 3(c), the TEER values decreased as the morphology of the Caco-2 cells transitioned from monolayer to villi-like. As reported in a previous study, TEER decreases when Caco-2 cells form villi-like structures in perfusion culture [11]. TEER reflects the ion permeability of the intercellular space. As the tight junction becomes tighter, the TEER value increases. In the small intestinal mucosa, intercellular spaces contribute over 90% to the total membrane resistance. The TEER value serves as an indicator of ion transport through intercellular spaces, which is a pathway with low resistance [21]. The TEER value of the small intestine is approximately 50-100 Ω•cm2 [6]. The TEER value of the tissue may closely resemble that of the small intestine owing to the villi-like structure formed by the perfusion culture of Caco-2 cells, mimicking the function of the small intestine wall in vivo. This is further supported by the consistent LY Papp values despite a decrease in TEER values after day 7, when Caco-2 cells began to form villi-like structures.
In this study, capacitance increased over time. The capacitance of the plasma membranes is approximately 0.5-1 μF [22]. In contrast, studies conducted using cardiomyocytes have revealed a direct relationship between cell volume and capacitance, indicating that capacitance increases as cell volume increases [23]. Additionally, capacitance is recognized as a reflection of cell surface area [24]. Nikulin et al. found that capacitance continued to rise even after TEER reached a plateau in Caco-2 cells on an insert, suggesting that this increase resulted from an expansion in cell surface area. They observed that capacitance increased post-TEER plateau, indicating cell maturation, specifically microvilli formation in Caco-2 cells. This phenomenon is attributed to the relatively constant surface area of the apical and basal sides of cells with low differentiation remains relatively constant. Therefore, the capacitance was approximately twice as high as that in the less differentiated condition [25]. Similarly, MPS studies have reported that the capacitance increases when microvilli are formed, corresponding to an increase in the surface area [26]. Therefore, the increase in capacitance over time in the present study indicates an increase in surface area and volume owing to the transformation of Caco-2 cells into a villi-like structure. The rise in capacitance post-transformation reflects the development of microvilli as cells reach a high level of differentiation. Changes in capacitance serve as a valuable indicator of morphological alterations in cells [27], such as the formation of microvilli and villi-like structures. Therefore, capacitance can be crucial in understanding and identifying changes in cell morphology.
2.3. Online TEER Measurement with Drug Exposure
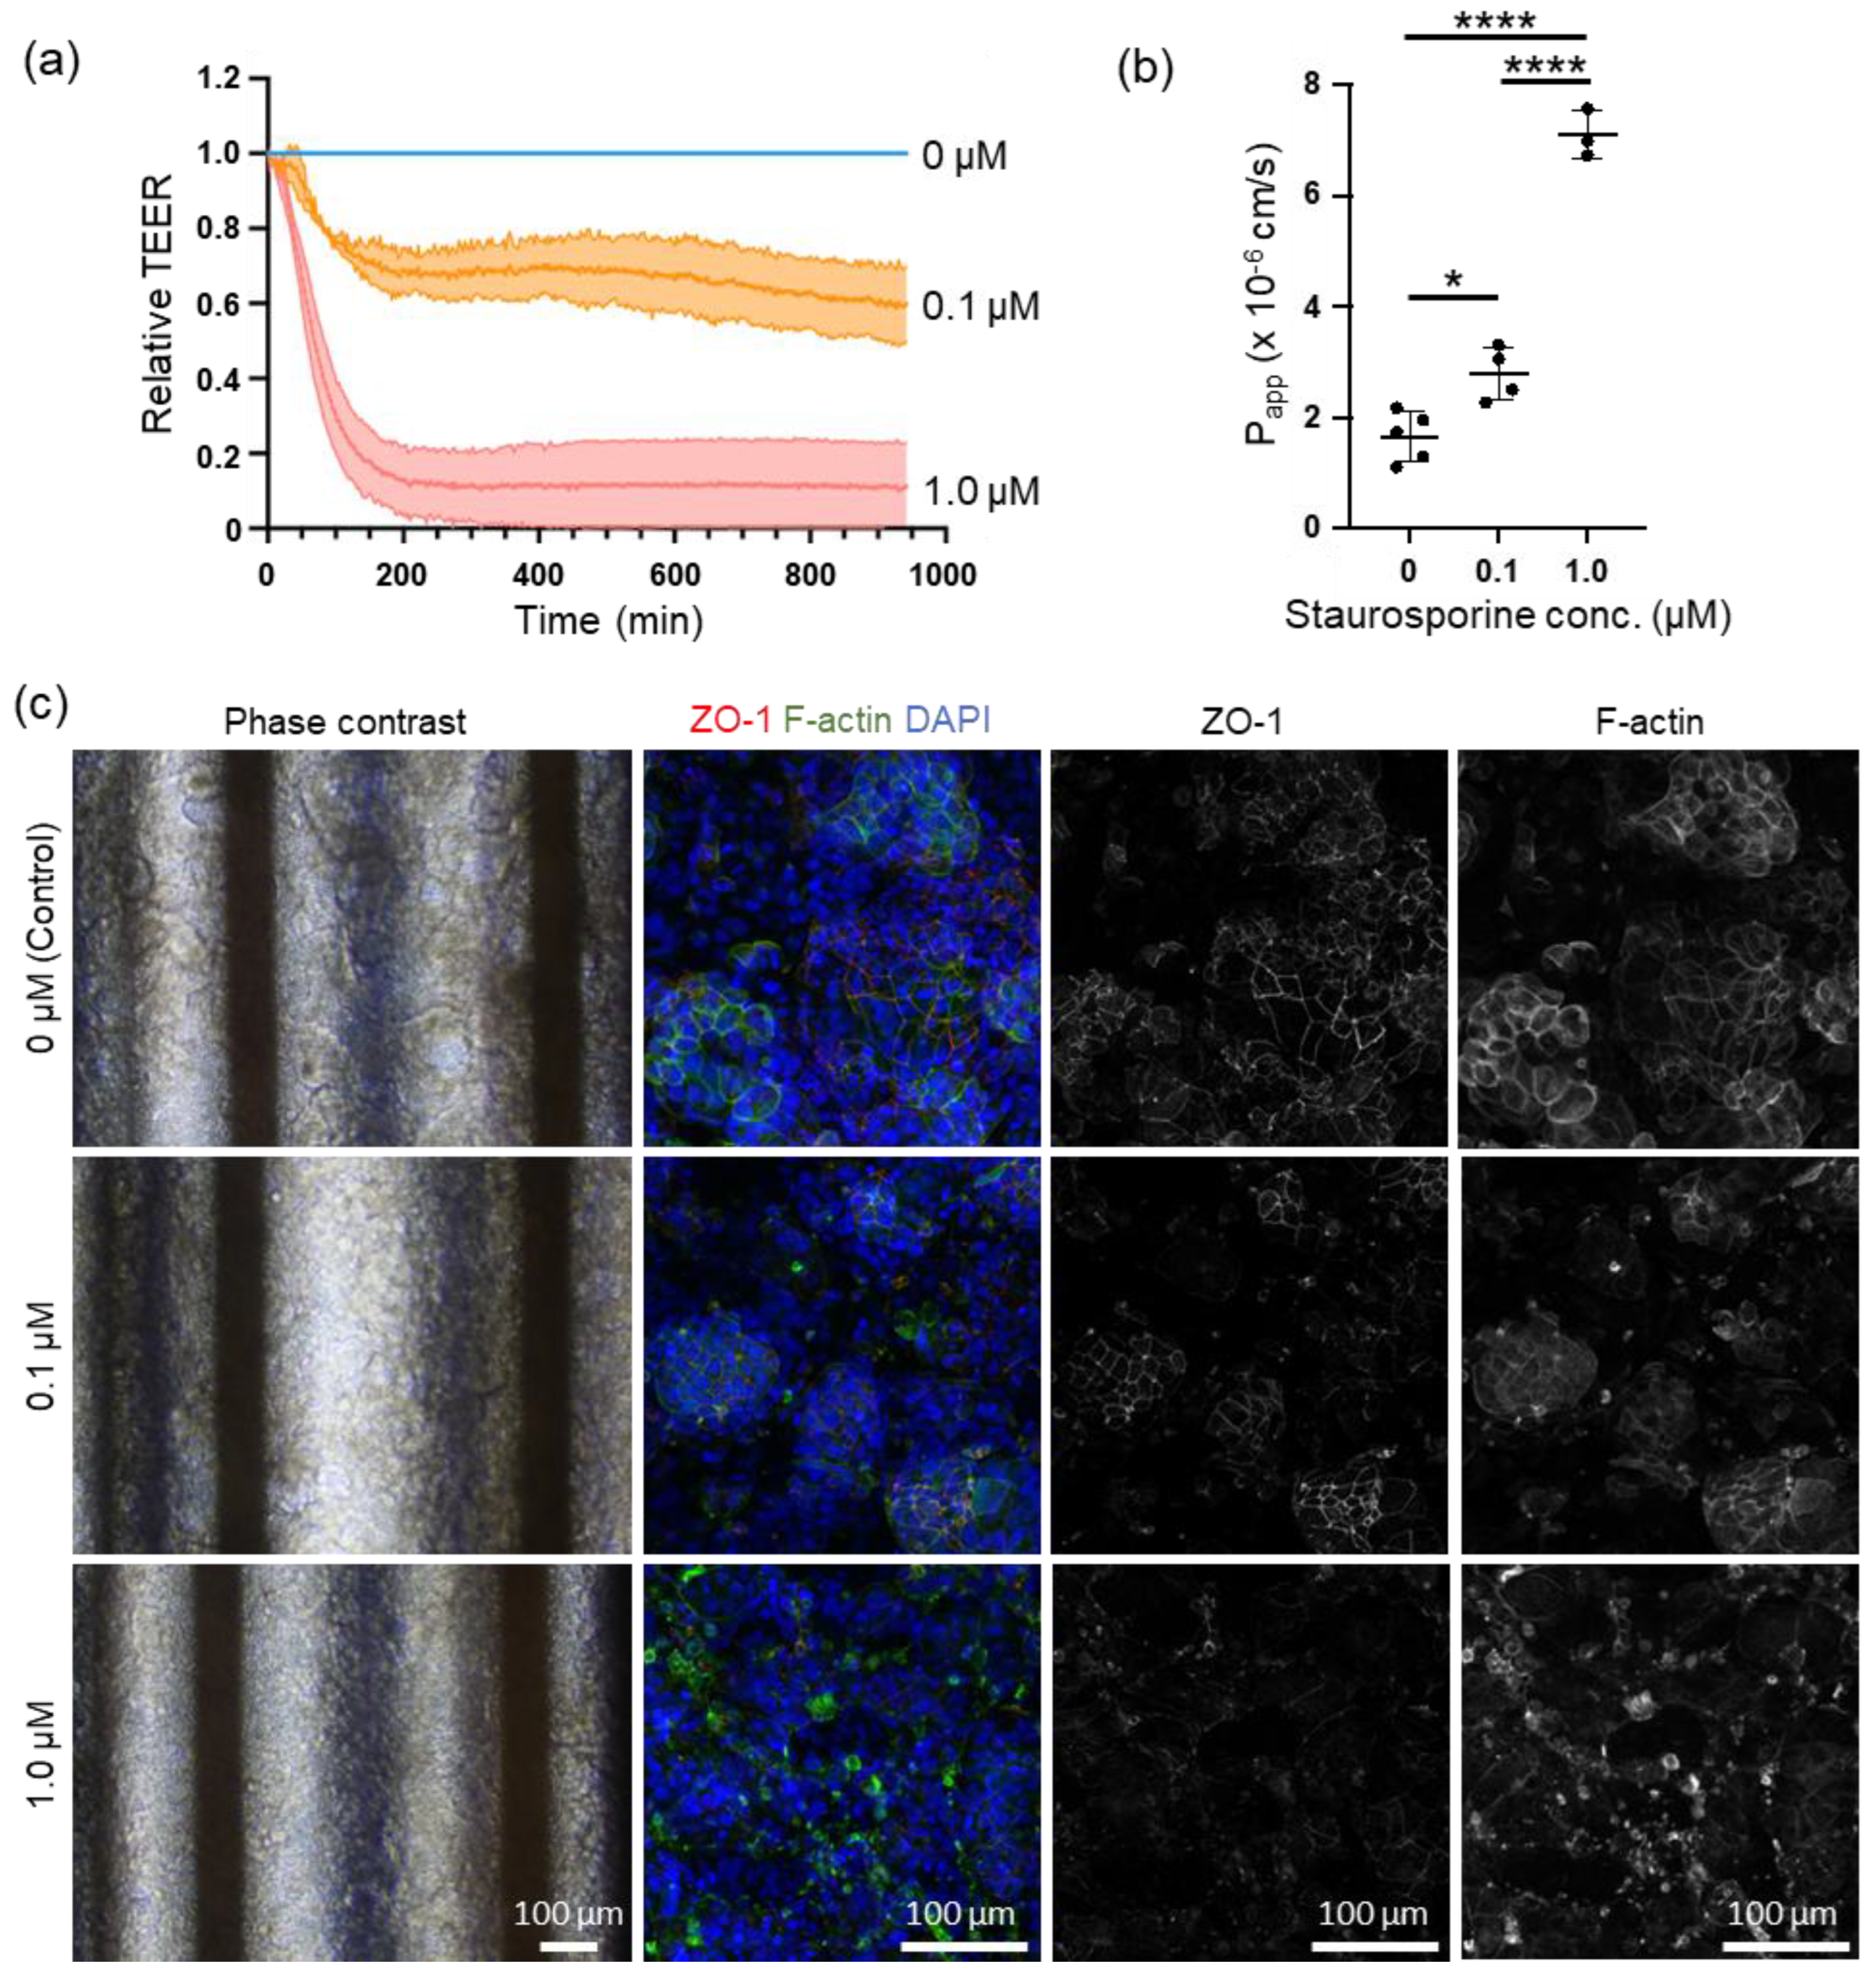
We conducted online measurements of cell motility using STA to investigate the feasibility of this system for testing drug efficacy and toxicity. In a study examining epithelial barrier damage caused by STA exposure, online measurement of TEER revealed a decrease in relative TEER compared with the control group over time following exposure to 0.1 µM and 1.0 µM of STA, peaking at approximately 4 h post-exposure. The relative TEER values dropped to 0.6-0.8 and 0-0.2 for the 0.1 µM and 1.0 µM STA exposures, respectively, before stabilizing [Figure 4 (a)]. Capacitance measurements were performed before and after STA exposure, with a noticeable decline observed at 0.1 µM of STA and an inability to measure capacitance at 1.0 µM of STA [Supplementary Figure S1 (a)]. Following exposure to 1.0 µM of STA, the capacitance was monitored online for up to 200 min at 3-min intervals, showing a gradual decrease post-exposure [Supplementary Figure S1 (b)]. LY permeability assay conducted after STA exposure demonstrated a significant dose-dependent increase in Papp [Figure 4 (d)]. Additionally, changes in cell morphology were observed following STA exposure, with alterations observed based on the concentration of STA utilized [Figure 4 (c)]. Phase-contrast images revealed a reduction in villi-like structures seen in the control group with 0.1 µM of STA, whereas these structures collapsed with 1.0 µM of STA. Immunocytochemistry analysis revealed that both ZO-1 and F-actin, which bind to ZO-1, were present in the intercellular spaces in the control. However, exposure to 0.1 µM STA resulted in a decrease in the expression intensity of ZO-1 at the intercellular spaces and a shift in the distribution of F-actin from the intercellular spaces to the cytoplasm. Exposure to 1.0 µM STA resulted in the collapse of ZO-1 expression at intercellular spaces and aggregation of F-actin.
STA, an indolocarbazole antibiotic discovered in Japan by Omura et al., possesses antibacterial, antifungal, antihypertensive effects [28,29], and antiplatelet aggregation effects [30]. Additionally, STA inhibits the activity of protein kinase C by preventing ATP from binding to the kinase [31], activating caspase-3, inducing apoptosis by causing cells to remain in the G1/G2 phase of the cell cycle [32,33]. Recently, clinical trials on hematological and solid tumors have focused on their anticancer activities [34]. In contrast, STA induces epithelial barrier disruption, and its exposure increases FITC-dextran leakage [35] and decreases TEER [36].
The findings of this experiment demonstrated a dose-dependent decrease in TEER induced by STA. Tight junction injury, caused by drugs or inflammatory cytokines, such as Tumor Necrosis Factor-alpha, resulted in a reduction in the expression level of ZO-1. ZO-1 served as an anchor for tight junction proteins, facilitating their binding to intracellular actin filaments. This decrease in ZO-1 expression caused the relaxation of tight junctions and increased permeability of the intercellular space [7], ultimately leading to a decrease in TEER.
Observations from phase contrast microscopy and immunostaining revealed that treatment with 0.1 µM STA maintained the villi-like structures of Caco-2 cells and considerably preserved tight junctions. Additionally, cellular damage caused by apoptosis was mild, resulting in a 30% decrease in TEER compared with control cells. However, treatment with 1.0 μM STA induced significant damage to tight junctions and widespread apoptosis, leading to a substantial decrease in TEER across a broad range of cells.
In a study on cell viability and capacitance induced by doxorubicin, Lee et al. reported that apoptosis decreased the capacitance [37]. In intestinal epithelial cells, the loss of blebbing and microvilli during apoptosis results in a reduction in capacitance [38]. The result was similar in this study at 1.0 µM STA exposure, which induced apoptosis. Real-time capacitance monitoring can detect cell death earlier, highlighting the effectiveness of this monitoring method [39]. Meanwhile, recent research has revealed that proximal tubular cells, when cultured in a double-layer microfluidic chip equipped with a TEER measuring device, demonstrate damage induced by cisplatin. This damage impacts both TEER and capacitance in monolayer culture systems. Additionally, an increase in capacitance was observed as a result of cell detachment from the extracellular matrix owing to epithelial barrier dysfunction [9] In our study, the cultured intestinal epithelial cells demonstrated a villi-like structure, indicating that STA exposure may have disrupted this structure, resulting in a decrease in surface area compared with monolayer culture systems.
In conclusion, our findings suggest that this system can be utilized for evaluating cell kinetics in drug efficacy and toxicity studies because it can measure cell kinetics in detail by measuring TEER and capacitance online.
Conclusions
In this research, we developed a double-layer microfluidic chip that includes an integrated TEER measurement function and thoroughly assessed its functionality. Conventional double-layer microfluidic chips have several limitations, such as light diffusion by the porous membrane hindering cell observation, inconsistent current density during TEER measurement, and the drug adsorption and sorption properties of PDMS affecting drug testing accuracy. To address these limitations, we designed an electrode pattern that ensured optimized current density uniformity through FEM simulations. Additionally, we developed double-layer microfluidic chips made of PET material and equipped them with these electrodes. To assess the performance of this system, we conducted perfusion culture experiments with Caco-2 cells to monitor changes in TEER and capacitance over time. Our findings reveal a correlation between the transformation of Caco-2 cells from a monolayer structure to a three-dimensional villi-like structure over time and changes in TEER and capacitance. Furthermore, we conducted online measurements of cell kinetics using STA to evaluate the system’s suitability for drug efficacy and toxicity studies. The TEER measurements validated that STA negatively impacts intestinal epithelial barrier function in a dose-dependent manner. Additionally, a decrease in capacitance was observed following STA exposure, suggesting a link to the induction of apoptosis. Overall, our results suggest that this system offers real-time assessment of cell barrier function and can enhance the accuracy of drug efficacy and toxicity testing in the drug discovery process.
The results of this study will significantly enhance TEER measurement technology in microfluidic chips, particularly resulting from the utilization of PET material, which minimizes drug adsorption. This advancement will significantly improve the reliability of drug testing. Moreover, this innovative system is not limited to just intestinal models but can also be applied to various organ models, such as the blood-brain barrier and renal tubules. Future studies are expected to further develop this technology and enable a more comprehensive analysis of cellular responses by integrating TEER measurements with other cellular assessment methods. This will ultimately position this method as a valuable alternative to animal testing in the drug discovery process. The results of this study will help advance MPS technology and represent a significant stride toward enhancing the precision of drug discovery and toxicity testing.
One limitation of this study is the utilization of Au as the electrode material, which hinders the observation of brightfield images and results in low throughput measurements. This issue can be addressed by utilizing transparent ITO as the electrode material, a solution that is also applicable when transitioning to ITO from another material. Improving the measurement station to increase throughput is a viable option, although it poses a trade-off between throughput and space constraints owing to the technical hurdles involved. Nonetheless, our proposed system promises to significantly expand the scope of MPS applications, potentially offering an alternative to animal experiments. Our future research will focus on exploring the practical implications of this system in the drug discovery process.
Supplementary Materials
The following supporting information can be downloaded at the website of this paper posted on Preprints.org.
Author Contributions
Conceptualization: H. K. Methodology: N. N., T. Y., and H. K. Software: R. F., S. M., and N. N. Validation: N. N. and H. K. Formal analysis: N. K., N. N., and H. K. Investigation: H.N., and L. C. Writing – original draft: N. K., N. N., and H. K. Visualization: N. K., H. N., N. N., and H. K. Supervision: H. K. Project administration: H. K. Funding acquisition: H. K. All authors reviewed the manuscript.
Data Availability Statement
The authors confirm that the data supporting the findings of this study are available within the article [and/or] its supplementary materials.
Acknowledgments
We extend our gratitude to Tomomi Goto for her invaluable assistance with cell associated experiments, Daniel Nishizawa for his invaluable assistance with hardware fabrication, and Editage (https://www.editage.jp) for their expert English language editing services. This research was partially supported by JSPS KAKENHI (Grant numbers JP18H01849 and JP24K01321) and the Japanese Agency for Medical Research and Development (Grant numbers JP17be0304204 and JP22be1004101). This study was supported by the Tokai University Imaging Center for Advanced Research (TICAR).
Declaration of Generative AI and AI-Assisted Technologies in the Writing Process
During the preparation of this work, the authors used Chat GPT and DeepL in order to translate and improve language and readability, with caution. After using these tools, the authors reviewed and edited the content as needed and take full responsibility for the content of the publication.
Conflicts of Interest
R. F., S. M., and N. N. are employees of SCREEN Holdings Co., Ltd. T. Y. is an employee of TOKYO OHKA KOGYO Co., Ltd.
References
- U. Marx, T. Akabane, T. B. Andersson, E. Baker, M. Beilmann, S. Beken, S. Brendler-Schwaab, M. Cirit, R. David, E. M. Dehne, Durieux, L. Ewart, S. C. Fitzpatrick, O. Frey, F. Fuchs, L. G. Griffith, G. A. Hamilton, T. Hartung, J. Hoeng, H. Hogberg, D. J. Hughes, D. E. Ingber, A. Iskandar, T. Kanamori, H. Kojima, J. Kuehnl, M. Leist, B. Li, P. Loskill, D. L. Mendrick, T. Neumann, G. Pallocca, I. Rusyn, L. Smirnova, T. Steger-Hartmann, D. A. Tagle, A. Tonevitsky, S. Tsyb, M. Trapecar, B. Van de Water, J. Van den Eijnden-van Raaij, P. Vulto, K. Watanabe, A. Wolf, X. Zhou and A. Roth, Altex, 2020, 37, 365-394. [CrossRef]
- J. J. Han, Artif Organs, 2023, 47, 449-450. [CrossRef]
- L. Lehman-McKeeman and M. Davis, Medicinal Chemistry Research, 2023, 32, 1235-1238. [CrossRef]
- S. Park, T. C. Laskow, J. Chen, P. Guha, B. Dawn and D. H. Kim, Aging Cell, 2024, 23, e14070. [CrossRef]
- H. Kimura, M. Nishikawa, N. Kutsuzawa, F. Tokito, T. Kobayashi, D. A. Kurniawan, H. Shioda, W. Cao, K. Shinha, H. Nakamura, K. Doi and Y. Sakai, Drug Metabolism and Pharmacokinetics, 2025, 60, 101046. [CrossRef]
- B. Srinivasan, A. R. Kolli, M. B. Esch, H. E. Abaci, M. L. Shuler and J. J. Hickman, J Lab Autom, 2015, 20, 107-126.
- N. Kutsuzawa, Y. Ito, S. Kagawa, C. Kohno, H. Takiguchi and K. Asano, PLoS One, 2023, 18, e0295684. [CrossRef]
- J. P. Vigh, A. Kincses, B. Ozgür, F. R. Walter, A. R. Santa-Maria, S. Valkai, M. Vastag, W. Neuhaus, B. Brodin, A. Dér and M. A. Deli, Micromachines (Basel), 2021, 12. [CrossRef]
- Y. Takata, R. Banan Sadeghian, K. Fujimoto and R. Yokokawa, Analyst, 2024, 149, 3596-3606. [CrossRef]
- N. Ferrell, R. R. Desai, A. J. Fleischman, S. Roy, H. D. Humes and W. H. Fissell, Biotechnol Bioeng, 2010, 107, 707-716. [CrossRef]
- O. Y. F. Henry, R. Villenave, M. J. Cronce, W. D. Leineweber, M. A. Benz and D. E. Ingber, Lab Chip, 2017, 17, 2264-2271. [CrossRef]
- R. Booth and H. Kim, Lab Chip, 2012, 12, 1784-1792. [CrossRef]
- G. S. Ugolini, P. Occhetta, A. Saccani, F. Re, S. Krol, M. Rasponi and A. Redaelli, Journal of Micromechanics and Microengineering, 2018, 28, 044001. [CrossRef]
- D. Marrero, A. Guimera, L. Maes, R. Villa, M. Alvarez and X. Illa, Lab Chip, 2023, 23, 1825-1834. [CrossRef]
- S. Grimnes and Ø. G. Martinsen, Journal of Physics D: Applied Physics, 2007, 40, 9. [CrossRef]
- T. Miyazaki, Y. Hirai, K.-i. Kamei, T. Tsuchiya and O. Tabata, Electronics and Communications in Japan, 2021, 104, e12296. [CrossRef]
- H. Kavand, R. Nasiri and A. Herland, Advanced Materials, 2022, 34, 2107876. [CrossRef]
- T. Imaoka, R. Onuki-Nagasaki, H. Kimura, K. Tai, M. Ishii, A. Nozue, I. Kaisaki, M. Hoshi, K. Watanabe, K. Maeda, T. Kamizono, T. Yoshioka, T. Fujimoto, T. Satoh, H. Nakamura, O. Ando, H. Kusuhara and Y. Ito, Sci Rep, 2024, 14, 29921.
- N. Kutsuzawa, T. Goto, H. Nakamura, M. Maeda, M. Kinehara, J. Sakagami and H. Kimura, Micromachines, 2025, 16, 327. [CrossRef]
- H. Kimura, H. Nakamura, T. Goto, W. Uchida, T. Uozumi, D. Nishizawa, K. Shinha, J. Sakagami and K. Doi, Lab Chip, 2024, 24, 408-421. [CrossRef]
- D. W. Powell, Am J Physiol, 1981, 241, G275-288. [CrossRef]
- C. Solsona, B. Innocenti and J. M. Fernández, Biophys J, 1998, 74, 1061-1073.
- H. Satoh, L. M. Delbridge, L. A. Blatter and D. M. Bers, Biophys J, 1996, 70, 1494-1504.
- X. B. Wang, Y. Huang, P. R. Gascoyne, F. F. Becker, R. Hölzel and R. Pethig, Biochim Biophys Acta, 1994, 1193, 330-344. [CrossRef]
- S. V. Nikulin, E. N. Knyazev, A. A. Poloznikov, S. A. Shilin, I. N. Gazizov, G. S. Zakharova and T. N. Gerasimenko, Molecular Biology, 2018, 52, 577-582. [CrossRef]
- M. W. van der Helm, O. Y. F. Henry, A. Bein, T. Hamkins-Indik, M. J. Cronce, W. D. Leineweber, M. Odijk, A. D. van der Meer, J. C. T. Eijkel, D. E. Ingber, A. van den Berg and L. I. Segerink, Lab Chip, 2019, 19, 452-463. [CrossRef]
- C. J. Czupalla, S. Liebner and K. Devraj, Methods Mol Biol, 2014, 1135, 415-437. [CrossRef]
- S. Ōmura, Y. Asami and A. Crump, J Antibiot (Tokyo), 2018, 71, 688-701. [CrossRef]
- N. Funato, H. Takayanagi, Y. Konda, Y. Toda, Y. Harigaya, Y. Iwai and S. Ōmura, Tetrahedron Letters, 1994, 35, 1251-1254. [CrossRef]
- C. Schächtele, R. Seifert and H. Osswald, Biochem Biophys Res Commun, 1988, 151, 542-547. [CrossRef]
- U. T. Rüegg and G. M. Burgess, Trends Pharmacol Sci, 1989, 10, 218-220. [CrossRef]
- A. Antonsson and J. L. Persson, Anticancer Res, 2009, 29, 2893-2898.
- H. J. Chae, J. S. Kang, J. O. Byun, K. S. Han, D. U. Kim, S. M. Oh, H. M. Kim, S. W. Chae and H. R. Kim, Pharmacol Res, 2000, 42, 373-381. [CrossRef]
- G. Choi, E. Y. Lee, D. Chung, K. Cho, W. J. Yu, S. J. Nam, S. K. Park and I. W. Choi, Mar Drugs, 2024, 22. [CrossRef]
- S. J. Trietsch, E. Naumovska, D. Kurek, M. C. Setyawati, M. K. Vormann, K. J. Wilschut, H. L. Lanz, A. Nicolas, C. P. Ng, J. Joore, S. Kustermann, A. Roth, T. Hankemeier, A. Moisan and P. Vulto, Nat Commun, 2017, 8, 262. [CrossRef]
- A. Nicolas, F. Schavemaker, K. Kosim, D. Kurek, M. Haarmans, M. Bulst, K. Lee, S. Wegner, T. Hankemeier, J. Joore, K. Domansky, H. L. Lanz, P. Vulto and S. J. Trietsch, Lab Chip, 2021, 21, 1676-1685. [CrossRef]
- S. M. Lee, N. Han, R. Lee, I. H. Choi, Y. B. Park, J. S. Shin and K. H. Yoo, Biosens Bioelectron, 2016, 77, 56-61. [CrossRef]
- P. Patel and G. H. Markx, Enzyme and Microbial Technology, 2008, 43, 463-470. [CrossRef]
- S. Wu, S. A. Ketcham, C. C. Corredor, D. Both, J. K. Drennen and C. A. Anderson, Biotechnol Bioeng, 2022, 119, 857-867. [CrossRef]
Figure 1.
F3D-XTR and experimental setups of perfusion culture and TEER measurement. (a) Assembled view of F3D-XTR. The chip is fabricated by PET layer bounding. (b) Top and bottom images of F3D-XTR. Reservoirs are installed in the microfluidic ports on the top layer. (c) Peristaltic pump setup for medium perfusion. (d) Actual set up perfusion culture system using F3D-XTR. (e) Photograph of the TEER measurement system. Two chips are set in the measurement station. (e) Schematic of the contact between the electrode pad on the chip and pin in the measurement station.
Figure 2.
Optimization of Au electrode design on the F3D-XTR through FEM simulation. (a) Geometry of electrode designs, Models 1 and 2. (b) Schematic of electrode arrangement in the channel. (c) Current density of the cell culture area.
Figure 2.
Optimization of Au electrode design on the F3D-XTR through FEM simulation. (a) Geometry of electrode designs, Models 1 and 2. (b) Schematic of electrode arrangement in the channel. (c) Current density of the cell culture area.
Figure 3.
Effects of perfusion culture of Caco-2 cells on the F3D-XTR on TEER, capacitance, and Lucifer yellow permeability (Papp). Caco-2 cells were cultured with medium perfusion (the perfusion rate is described in Section 2.4). (a) Representative phase contrast and immunohistostaining of Caco-2 cells at 4, 7, 14, and 21 days after seeding; magnification x100 (phase contrast) and x200 (ZO-1 immunohistostaining). (b) Representative layer thicknesses of Caco-2 cells. Blue: DAPI, red: ZO-1; magnification x200. (c) Time course of the actual TEER value of Caco-2 cells on F3D-XTR, n = 23 (eight independent experiments, triplicate or quadruplicate chips/experiment excluding chips with electrode defects or problems with cell seeding). (d) Time course of the actual capacitance value of Caco-2 cells on F3D-XTR, n=17 (six independent experiments, triplicate or quadruplicate chips/experiment, excluding chips with electrode defects or problems with cell seeding). (e) LY permeation test results The Papp results are obtained at each time point on day 4 (n = 1, one experiment, triplicate chips per experiment), 7, 14, and 21 (n = 2, two independent experiments, triplicate chips per experiment). Each dot represents the actual value of Papp.
Figure 4.
Effect of staurosporine (STA) on Caco-2 cells on real-time TEER and capacitance monitoring, and Lucifer Yellow permeability assay (Papp). Caco-2 cells are cultured using medium perfusion described in Section 2.4. (a) Real-time monitoring of the relative value of TEER. The relative TEER value was normalized twice with TEER value at the time of zero and control, blue: control (n = 4, four independent experiments); orange: 0.1 μM STA exposure (n = 3, three independent experiments); red: 1.0 μM STA exposure (n = 3, three independent experiments). (b) Result of the actual value of the capacitance at the time of zero (commencement of STA exposure) and 20 h after exposure. (c) Result of the real-time monitoring of the actual capacitance value of Caco-2 cells. Caco-2 cells were exposed with 1μM STA. (d) Lucifer yellow permeability (Papp) results obtained from Caco-2 cells exposed with each concentration of STA, n = 5 (control), n = 4 (0.1 μM STA), and n = 3 (1 μM STA). n = 4 (four independent experiments, triplicate or quadruplicate chips/experiment excluding chips with electrode defects or problems with cell seeding.) (e) Representative phase contrast and immunohistostaining of Caco-2 cells on the 16-18th day after seeding; magnification x40(phase contrast) and x200(ZO-1 and phalloidin immunohistostaining), scale bar 100 μm; values are expressed as mean ± standard deviation; *p<0.05, **** p<0.0001.
Disclaimer/Publisher’s Note: The statements, opinions and data contained in all publications are solely those of the individual author(s) and contributor(s) and not of MDPI and/or the editor(s). MDPI and/or the editor(s) disclaim responsibility for any injury to people or property resulting from any ideas, methods, instructions or products referred to in the content. |
© 2025 by the authors. Licensee MDPI, Basel, Switzerland. This article is an open access article distributed under the terms and conditions of the Creative Commons Attribution (CC BY) license (http://creativecommons.org/licenses/by/4.0/).
Copyright: This open access article is published under a Creative Commons CC BY 4.0 license, which permit the free download, distribution, and reuse, provided that the author and preprint are cited in any reuse.


