Submitted:
27 August 2025
Posted:
27 August 2025
You are already at the latest version
Abstract
Background/Objectives: A recent report from the World Health Organization (WHO) shows that more than one in every eight adults and adolescents experience a mental disorder, including depression, anxiety, and stress. Reliable measures are needed to assess these conditions in youth. This study examined the psychometric properties of the Depression Anxiety Stress Scale-Youth version (DASS-Y) using the multidimensional Rasch Model. Methods: The study used the DASS-Y data publicly available on the Science Data Base for the analysis. The DASS-Y comprises 21 items on a 4-point scale and was administered to a sample of 575 (56.2% females, 43.7% males, and 0.2% others) youths aged 19 to 29 years (average age = 23.32), with data retrieved from the Science Data Bank Database. Using the multidimensional Rasch model and the TAM package in R, the analysis focused on confirmatory factor analysis (CFA), item fit statistics (Infit/Outfit residuals), dimensionality evaluation, category threshold evaluation, and person-item targeting across the depression, anxiety, and stress subscales. Results: The findings revealed that the DASS-Y has a multidimensional structure aligning with the theoretical subscales, with most items demonstrating acceptable fit statistics (1.400.6) and ordered category thresholds under the multidimensional framework, compared to the unidimensional model. The scale showed good targeting for this youth sample, providing evidence that supports the interpretation and use of DASS-Y in assessing emotional distress in youth using Rasch Rasch-based approach. Conclusions: These findings would contribute to the understanding of the scale’s measurement properties and its suitability for clinical and research use in youth mental health assessment.
Keywords:
depression
; anxiety
; stress (DASS)
; adolescent
; mental health
; DASS-Y
; multidimensional Rasch model (MRM)
; psychometric properties
1. Introduction
The negative impact of depression, anxiety, and stress, especially among youths and adolescents, is alarming. According to the recent World Mental Health (WMH) report, as provided by the World Health Organization [1], about one billion people (more than one in eight) adults and adolescents worldwide have a mental disorder. [2] reported that an estimated 280 million people experience depression, while about 301 million live with anxiety; many others are affected by conditions such as developmental disorders, attention-deficit hyperactivity disorders, schizophrenia, bipolar disorder, and conduct disorder. [3] noted that these disorders are among the most prevalent psychiatric disorders in children and adolescents. Reports show that adolescents are the most vulnerable group, highlighting that one in every six adolescents aged 10 to 19 years is a victim of mental health problems [1]. Perhaps this is because the adolescent period is a crucial stage of development marked by the development of social and emotional habits, which are necessary for interpersonal skills, as well as learning to manage emotions. Adolescents with mental health conditions are more susceptible to social exclusion, discrimination, stigma (affecting readiness to seek help), educational difficulties, risk-taking behaviors, physical ill-health, and human rights violations. Given the foregoing, researchers have made concerted efforts to ensure that the impact of mental health does not prevail, especially among adolescents. These efforts led to the development of the psychological scale titled Depression, Anxiety, and Stress Scale (DASS) [4].
The DASS is a set of three self-report scales designed to further the process of defining, understanding, and measuring the ubiquitous and clinically significant emotional state of depression, anxiety, and stress [4]. Depression, anxiety, and stress scale, according to [5], is a psychological instrument used to assess the negative emotional symptoms on a four-point Likert scale; such that a greater score indicates higher severity of the negative symptoms of depression, anxiety, and stress. To ensure that responses from the Depression Anxiety Stress Scales (DASS) accurately reflect an individual’s mental health status, the instrument has been rigorously evaluated and shown to demonstrate acceptable psychometric properties [6,7]. Although the DASS, available in its full 42-item form and its shorter 21-item version (DASS-21), is one of the most widely used psychological measures, it was developed for adults rather than adolescents or children [8]. Because there is limited evidence that the adult three-factor structure of the DASS generalizes to younger populations, researchers developed a youth version of the scale (DASS-Y). [9,10] further highlight that, beyond questions of structural validity, it remains unclear whether symptoms of anxiety and depression manifest in the same way in youth as they do in adults, or whether the construct of tension/stress captured in the adult DASS stress scale is even experienced by children and adolescents.
The 21-item DASS-Y is a shorter version of the adult DASS, designed primarily for youths aged 7 to 18 years. It is structured on a 4-point Likert scale to measure the negative emotional states of depression, anxiety, and stress in youths. Each of the negative emotions is measured with seven items in each sub-scale of DASS-Y, where the subscales are depression, anxiety, and stress [8]. Although [8] evaluated the psychometric properties of DASS-Y using factor analysis, several studies have also presented empirical evidence on the psychometric qualities of DASS-Y to ensure its validity, reliability, and fairness [11]. [12] evaluated the construct validity of the Indonesian version of DASS-Y (IDASS-Y) using exploratory factor analysis (EFA) and confirmatory factor analysis (CFA) and reported acceptable psychometric properties of IDASS-Y. [13] used CFA, while [14] applied the Rasch model, CFA, and structural equation modeling (SEM) approaches to assess the psychometric properties of DASS-Y, and the results from their studies reported acceptable psychometric properties for DASS-Y.
Even though several studies have used various psychometric approaches to evaluate the qualities of the DASS-Y instrument, there is yet no evidence of studies that have adopted the multidimensional Rasch model (MRM) approach to evaluate the Psychometric properties of the DASS-Y. The present study employed the MRM to establish the psychometric properties of the youth version of the Depression, Anxiety, and Stress Scale (DASS-Y). The MRM was used because it captures the multidimensional nature of the DASS-Y, which other approaches adopted so far have not been able to employ [15].
The multidimensional Rasch model provides information on item-level precision by identifying misfits and biases in items and the disorder in category thresholds. [16] assert that the multidimensional Rasch model further detects construct overlap or redundancy due to the correlational nature of the factors that underlie DASS-Y. Thus, the present study applied the multidimensional Rasch model approach because it considers the strength of the factor analysis (multidimensionality structure confirmation), and Rasch measurement theory (invariance, item diagnosis, and interval scale). In specific terms, this study evaluated:
- How many dimensions are explained by the item responses to the DASS-Y?
- What is the psychometric quality of the DASS-Y?
- What is the best-fitting model for the DASS-Y?
2. Materials and Methods
Participants
The data for this study were collected from 575 medical students in Turkey between the ages of 19 and 29 (Average age of 23.32, SD=1.44), who are in their 4th, 5th, and 6th semesters. The datasets are publicly available on the Science Data Bank [17]. The data were for a cross-sectional study on brain drain from medical students with migration intentions. From the sample of 575 students, 323 (56.2%) were females, 251 (43.7%) were males, while 1 (0.2%) indicated as others. This data would help to provide insight into the internal structure of the DASS-Y.
Instrument
The Depression Anxiety Stress Scale for youth (DASS-Y), a self-report scale comprising 21 items, is a shorter version of the Depression Anxiety Stress Scale-DASS for adults [4], which has 42 items. The 21-item DASS-Y by [8] is designed on a 4-point Likert-type scale ranging from 0 (Not True) to 3 (Very True). The scale measures the negative emotional states of depression, anxiety, and stress in youths aged 7-18. Each of the negative emotions is measured with seven items on the DASS-Y
Data Analytical Framework
For the data analysis, we first conducted a confirmatory factor analysis to confirm the factor structure of the DASS-Y as reported by [8]. The Kaiser-Meyer-Olkin (KMO) measure of sample adequacy (MSA), and Bartlett’s test of sphericity were all used to assess the suitability of the data for factor analysis. The factor structure was established using the Maximum Likelihood (ML) estimation, with various fit statistics measures, such as the Root Mean Square Error of Approximation (RMSEA), the Sum of Root Square Mean (SRSM), Confirmatory Fit Index (CFI), and Tucker-Lewis Index (TLI) indices, all evaluated. The reliability of DASS-Y was estimated using Cronbach’s alpha (α) and Omega-total () to ensure internal consistency of the items. The reliability estimate, which compares the covariance among the items on the instrument to the overall variance, is expected to have indices ranging from 0.70 to 1.00 to be considered acceptable [18].
To evaluate the dimensionality further, the data were subjected to Principal Component Analysis of Residuals (PCAR) and eigenvalues. According to [19], to apply the Rasch model measurements, our data is expected to be unidimensional (the instrument should measure one dimension of the psychometric properties of participants), producing eigenvalues below 2.00 to indicate the unidimensionality of the dataset [20].
After examining the internal structure of the DASS-Y, a measurement model approach based on the Rasch measurement theory [21] was used to evaluate the psychometric quality of the scale in detail. This helps us to compare the person’s ability and item difficulty parameters on the same scale. Basically, the items on the scale were subjected to the multidimensional Rasch model to evaluate the model-data fit since the scale is reported to have three dimensions. Hence, treating the DASS-Y as unidimensional could lead one to ignore potential correlations among dimensions. Using this Rasch approach, dimensionality could easily be modeled while ensuring high standards for measurement within each dimension. This approach evaluates model requirements such as the invariance within dimensions. The multidimensional Rasch model is expressed as:
Equation 1 shows that the multidimensional model predicts the probability of response in category k(Pik), as a linear function of student location on each dimension (), and item locations, such as difficulty () of category k, specific to dimension d, as expressed on the logit scale. The difficulty, described as the delta parameter (δ), is scaled to have an average value of 0, with higher values indicating higher location on the construct, and implying that students require a higher level of depression, anxiety or stress to endorse the item, while lower values suggest lower location estimates, implying that items were more easily endorsed by students. The theta (θ) represents the location of students on the latent scale (depression, anxiety, and stress). Students with higher values reported higher levels of depression, anxiety, or stress, while students with lower locations reported lower depression, anxiety, or stress levels.
In evaluating the residual fit statistics for item-level and person fit, we focused on two fit statistics: infit and outfit. The outfit MSE for the item is the average of the squared standardized residuals associated with an individual item:
where Z2ni is the squared standardized residual for person n’s response to item i, and N is the number of responses to item i. Infit MSE is a weighted average of Z2ni for individual items or persons, where the residuals are weighted by response variance (Wni):
The standardized versions of infit and outfit MSE are also available that use a cube-root transformation to approximate a normal distribution for the purpose of evaluating statistical significance of misfit [22].
These fit statistics summarize the differences between the observed and expected model responses for a given item or student. The Infit and Outfit Mean Square Error (MSE) also have standardized versions, which are transformed versions with a mean of 0 and a standard deviation of 1. A standardized residual version of Infit/Outfit value close to 0, is an indication that the data fit the model [20]. As reported by [23], Infit/Outfit MSE close to 1.00 are considered acceptable when using the polytomous Rasch model. In this study, we used critical values of 0.60-1.40 as an acceptable range for Infit/Outfit statistics {19}. Similarly, standardized Infit/Outfit with critical values in the range of ±2 are considered acceptable, as substantial evidence of model-data fit for individual items [24].
The threshold parameter estimates (τ) show the difficulty that is associated with providing a rating in category k, rather than category k-1, specific to individual items. These thresholds are transformations of the observed ordinal-level ratings for individual items and students to an interval-level scale. This logit-scale, which is an interval scale, allows for comparison between the estimates of student location and item difficulty [25].
To evaluate the statistics for the dimensions using the multidimensional framework, the expected a posteriori (EAP) reliability, weighted likelihood estimation (WLE) reliability, and correlation coefficients were used. The EAP and WLE reliability indices and correlation coefficients close to 1.00 would suggest a better fit and a strong interrelationship between the dimensions of the DASS-Y.
In comparing the unidimensional and multidimensional models, we used the Akaike Information Criterion (AIC) and Bayesian Information Criterion (BIC) metrics. A lower value for the AIC and BIC in support of the multidimensional model would suggest a significant fit to the multidimensional model over the unidimensional model, and vice versa [28].
3. Results
The results in Table 1 show that the mean responses of the students range from 1.62 to 2.66, an indication that the items did not exhibit extreme ratings, as there appears to be a balanced distribution of responses around the midpoint. The standard error (SE) ranges from 0.94 to 1.19, suggesting that there is a higher agreement among the responses provided by the students. The skewness (-0.15 to 1.43) and kurtosis (-1.50 to 0.87) show generally acceptable distributional properties, with slight skewness and mild deviations in kurtosis, suggesting that there are no major violations of normality. The standard error (SE) between 0.04 to 0.05 suggests reasonably precise estimates, given the moderate-to-large sample size.
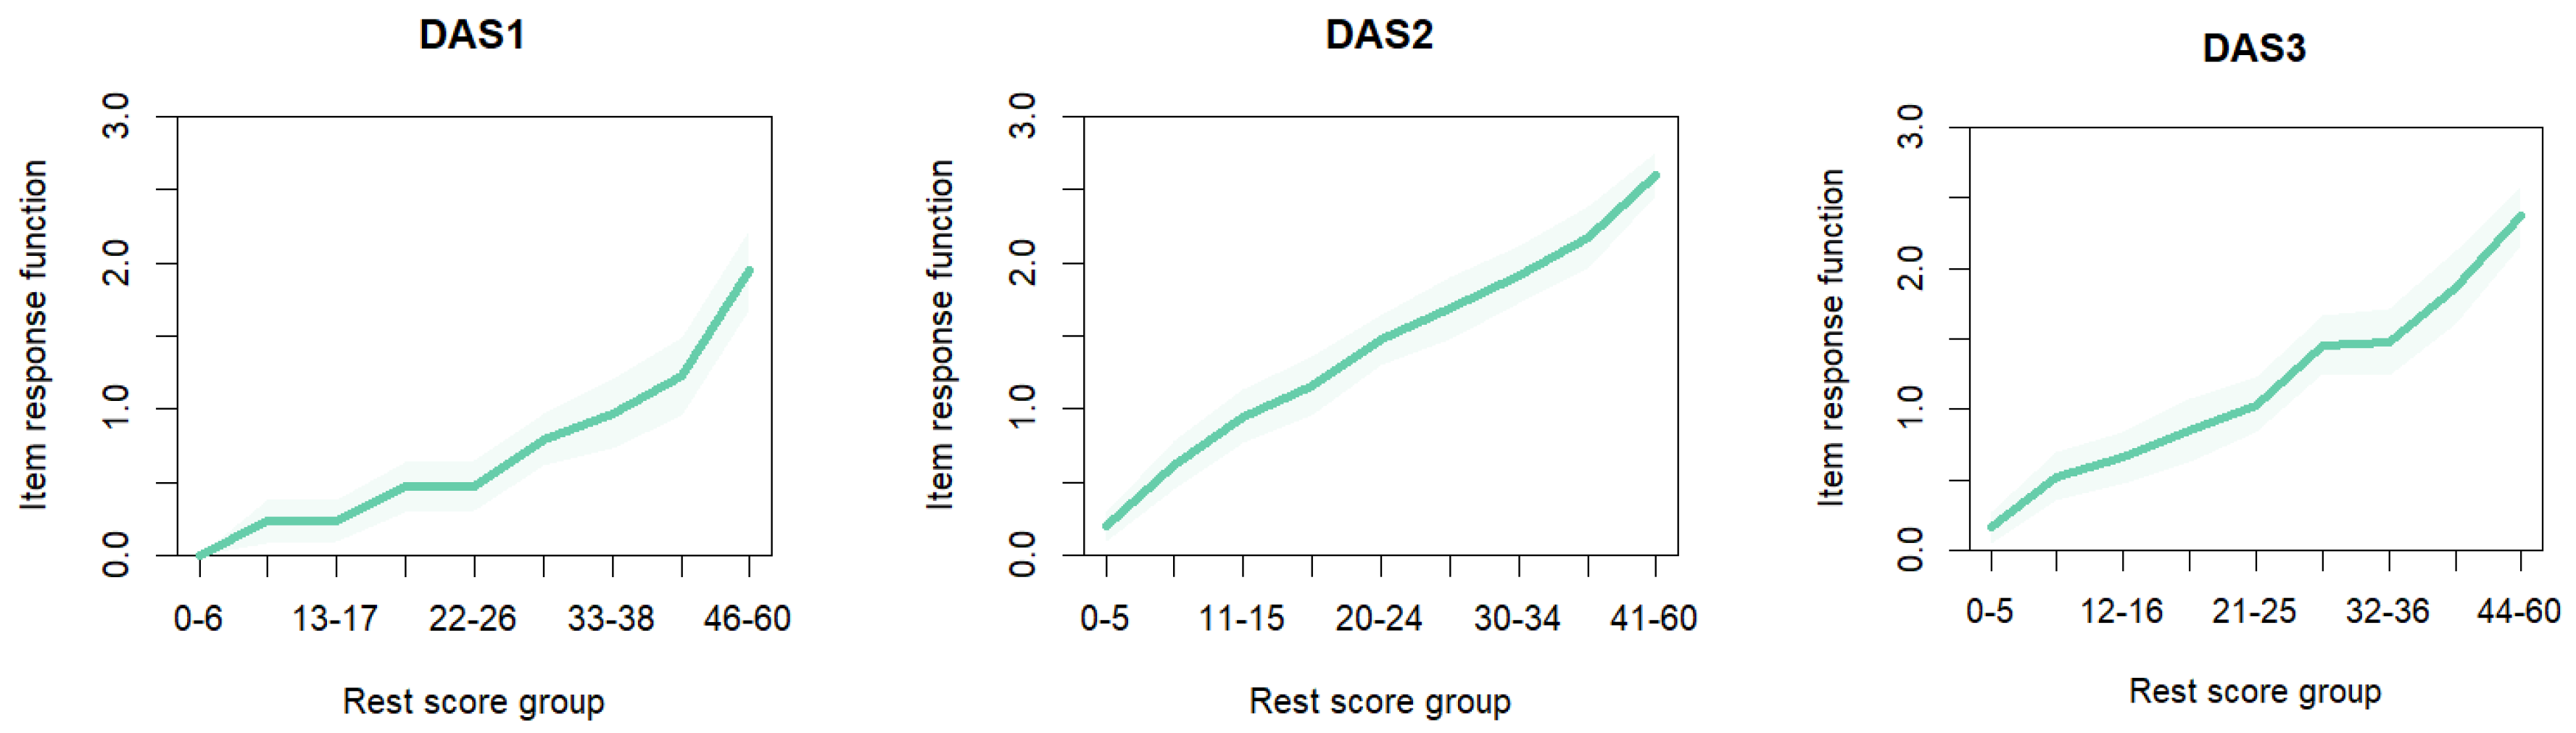
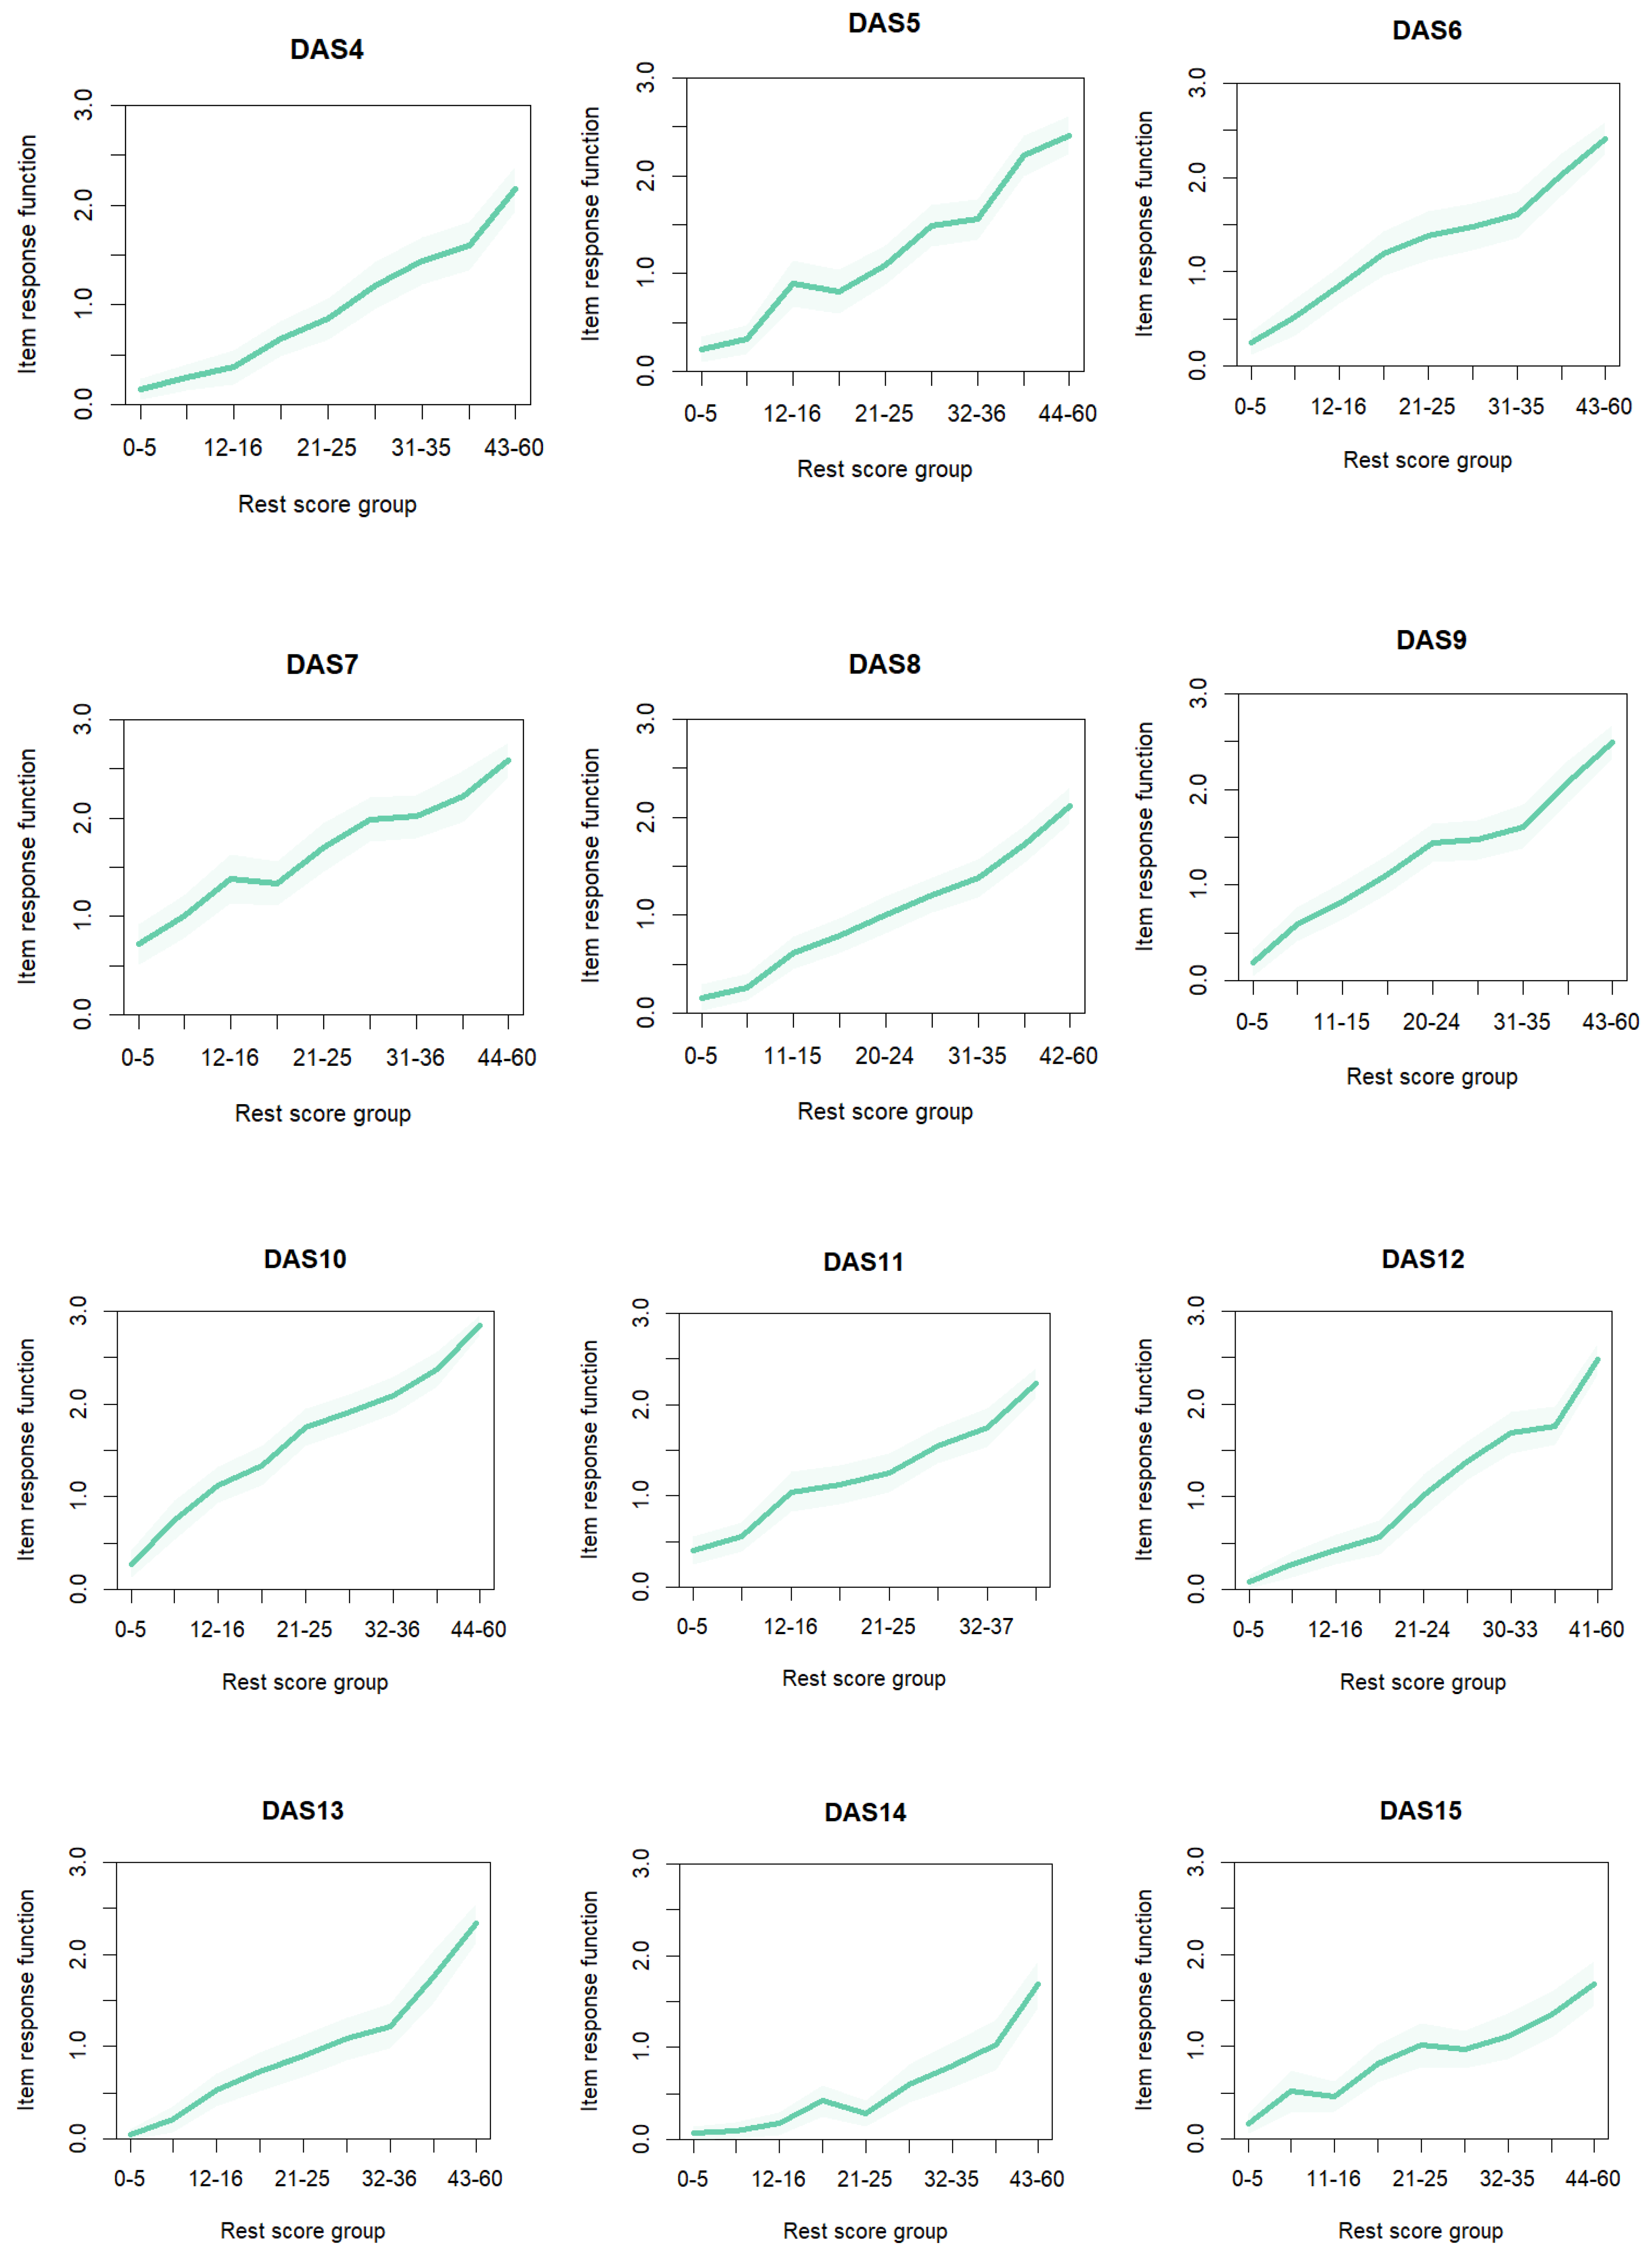
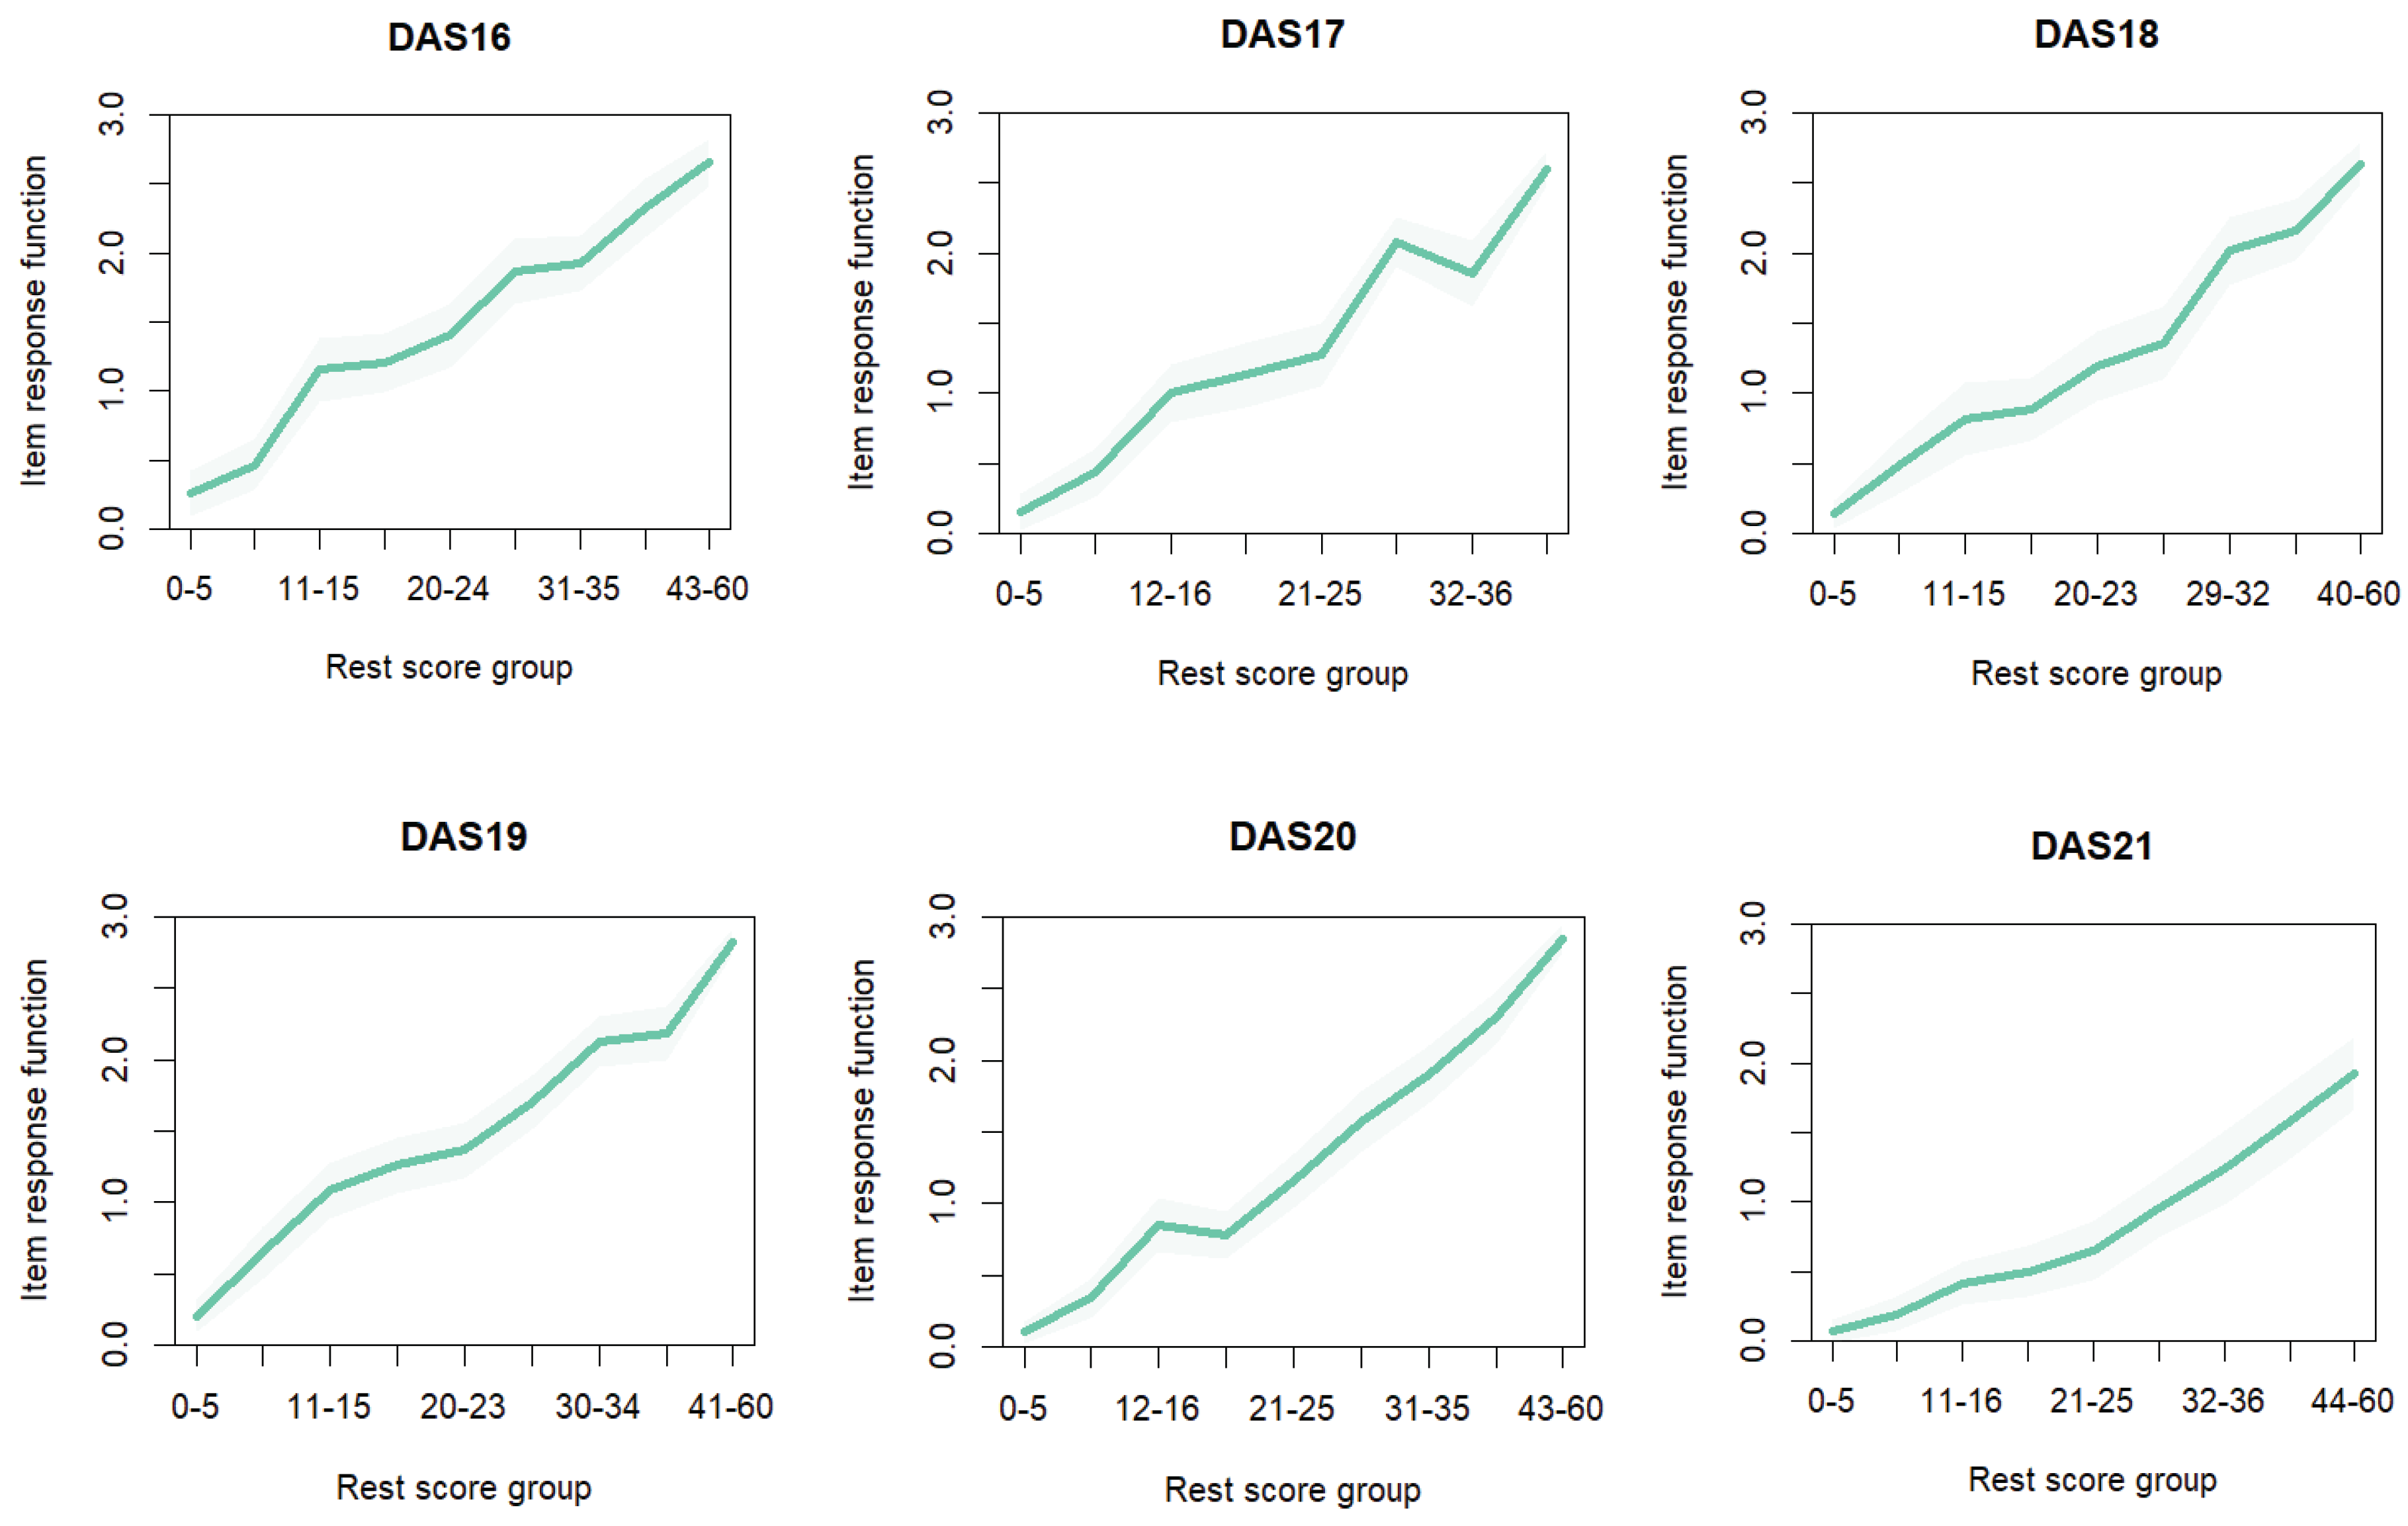
To assess the overall reliability of the DASS-Y, the item-total correlation was evaluated (Table 1), and the results show moderate (0.45) to high (0.78) and positive indices, indicating that the items are contributing substantially to the internal structure of the scale. The item-response function (IRF) for all items has positive slopes (Figure A1), implying a strong association with the construct, an indication that the items are adequately explaining depression, anxiety, and stress.
To examine the internal consistency reliability of DASS-Y, the Cronbach alpha method was used, and an index of 0.94 [90% CI=0.94, 0.95] was obtained. To further substantiate this result, the Omega-total () estimate was evaluated, and a similar index of 0.95 was obtained, demonstrating that the DASS-Y has good internal consistency estimates. We further evaluated the reliability indices for each subscale and indices of 0.83 [90% CI = 0.81, 0.83] for depression, 0.85 [90% CI =0.83, 0.87] for anxiety, and 0.87 [90% CI= 0.85, 0.88] for stress were obtained (See Table 2). In Table 1, the alpha-if-deleted for all items is 0.94, implying that deleting any item would not increase the overall alpha value, meaning that the items are all exhibiting good internal consistency. This means that all the items contribute positively and substantially to the internal consistency of DASS-Y. Hence, deleting any of the items would not improve the reliability of the scale further. These results suggest that the items are well aligned and collectively measure depression, anxiety, and stress. These results showed all alpha-values above 0.70, suggesting acceptable reliability indices as recommended by [18].
To confirm the internal structure of DASS-Y, we performed a confirmatory factor analysis (CFA) on the dataset. The results revealed a KMO measure of sample adequacy (MSA=0.96), which is in the marvelous category based on Kaiser-criterion [26], suggesting that the sample size was adequate for a factor analysis. Additionally, Bartlett’s test of sphericity shows a significant result with a chi-square of [X2(20) =80.774, p<0.00], indicating that the correlation matrix is different from an identity matrix. The determinant (det=0.00) of the matrix is positive and zero (0), meaning that the parameters can be estimated. The results of the parallel analysis using Maximum Likelihood (ML) estimation and “oblimn” rotation suggest a three-factor structure (See Figure 1 and Figure 2). To further examine the factor structure and how best the data fit the CFA model, we evaluated the common fit measures for a CFA model. The results show the overall fit statistics (χ2 =1148.916, df=186; CFI=0.860; RMSEA=0.095 [90% CI=0.090, 0.100]; TLI=0.840; and SRMR=0.055), which suggest a relatively poor fit, except for SRMR, which shows acceptable residuals (See Table 3).
3.1. Unidimensional Rasch Model
We examined the unidimensionality of the DASS-Y using the PCAR approach, and the result produced an eigenvalue above 2.00 (See Figure 3), suggesting that the data failed to match the unidimensionality requirement for Rasch analysis [27], an indication that the DASS-Y could be multidimensional.
To further substantiate these findings, we evaluated the item fit statistics of DASS-Y by fitting the data to a unidimensional model so that it can be compared to a multidimensional model to examine the best model-to-data fit. After 68 iterations using the TAM package in R [29], the results revealed an expected a posteriori (EAP) reliability measure of 0.94, with a weighted likelihood estimation (WLE) reliability of 0.92. The unidimensional analysis showed that the Outfit MSE for all items across the categories ranged from 0.00 to 7.72, suggesting that most of the items showed misfitting. In addition, the Infit MSE for the items across the categories ranged from 0.00 to 1.36, an indication that some of the items are poorly fit (See Table A1). These results show that many items exhibit misfitting statistics when we fit the data to the unidimensional Rasch model. Moreso, the item parameter (threshold) estimates for all the items show disordered thresholds (Table 4). This implies that majority of the items have irregular thresholds and appear problematic when the data is fit to a unidimensional model.
3.2. Multidimensional Rasch Model
After examining the DASS-Y using the unidimensional model, the data were subjected to the multidimensional Rasch model to find the best-fitting model. The results after 1000 iterations suggest that the data fit three dimensions, with EAP reliability values of 0.93 for dimension one (Dim 1), 0.93 for dimension two (Dim 2), and 0.93 for dimension three (Dim 3) (Table 5). The correlation between Dim 1 and Dim 2 was 0.97, while Dim 1 and 3 was 0.97, and Dim 2 and 7 was also 0.97. These results demonstrate strong internal consistency for each dimension, given the high reliability coefficients and the strong relationship between the dimensions. The strong correlation coefficient indicates substantial overlap between the dimensions of the DASS-Y. This suggests that treating the scale as unidimensional may obscure important aspects of its internal structure, whereas a multidimensional model better reflects its underlying nature. Furthermore, the Outfit and Infit MSE for the majority of the items are within the acceptable range of 0.60 to 1.40 adopted for this study (See Table A2), indicating good fit statistics for the items using the multidimensional model framework.
The two models (unidimensional and multidimensional) were compared to check which of the models is a better fit to the dataset. The results in Table 6 showed a statistically significant improvement to the model fit when moving from the unidimensional to the multidimensional model (χ2= 19.423, df=5, p<0.00). This result demonstrates that the multidimensional model captures more of the structure in the data, as the deviance information and Akaike Information Criterion (AIC=26313.92) for the multidimensional model is lower than that of the unidimensional model (AIC=26693.27). This result suggests that the multidimensional model fits significantly better than the unidimensional model, implying that DASS-Y is not unidimensional, but involves three distinguishable components, which are depression, anxiety, and stress.
The item location estimates (difficulty parameter), which provide more information about the relative difficulty of each item within the assigned dimension, are provided in Table 7. The item difficulty in dimension 1 (depression) ranges from -0.45 to 0.56, while dimension 2 (anxiety) ranges from -0.44 to 0.55, and dimension 3 (stress) ranges from -0.29 to 0.47. These results suggest low to moderate variability in item difficulty across the dimensions, indicating that the items are well aligned across the dimensions.
The threshold parameters (tau estimates, τ) for DASS-Y are presented in Table 8. The results showed that as we transition from one category to the other, there is a steady increase in the threshold estimates. These results showed ordered responses of students measured from lower (easier to endorse) to higher (difficult to endorse) categories. This is glaring as threshold 3 (τ3) is higher than threshold 2 (τ2), which, in turn, is higher than threshold 1 (τ1), indicating that the response categories on the DASS-Y are functioning as expected, with higher ability leading to higher categories. The differences between the thresholds indicate that the DASS-Y effectively distinguishes between students based on their levels of depression, anxiety, and stress.
The Wright map (Figure 4) shows three boxes indicating three subscales or dimensions: A (depression), B (anxiety), and C (stress). Items in each dimension are displayed together, but their difficulty estimates are still shown on the same logit scale. The similar clustering of thresholds across the three dimensions suggests that none of the subscales is disproportionately harder or easier overall. The diamond shapes represent the thresholds between response categories. The map shows that the item thresholds are well aligned with the majority of respondents’ abilities, indicating that the DASS-Y is well-targeted to average-ability students. The threshold cluster around 0 logits across the three dimensions, with some low thresholds suggesting sparse use of the lowest response categories. This could mean that DASS-Y may be less precise for respondents at extreme ends of the scale.
4. Discussion
This study evaluated the psychometric properties of the youth version of the Depression, Anxiety, Stress Scale (DASS-Y) using the multidimensional Rasch model approach. The preliminary analysis revealed that most of the responses to the items are clustered around the midpoint, implying a balanced distribution without extreme responses. The monotonicity check showed that all items have positive slopes, moderate to high, and positive item-total correlations, highlighting that all 21 items are contributing well to the entire DASS-Y.
The KMO measure of sample adequacy (MSA=0.96), Bartlett’s test of sphericity [X2(20) =80.774, p<0.00], and determinant (det=0.00) showed the appropriateness of the data for factor analysis. The confirmatory factor analysis (CFA) results show that the model fit values are around the borderline, suggesting a relatively poor fit (χ2 =1148.916, df=186; CFI=0.86; RMSEA=0.095 [90% CI= 0.090, 0.100]; TLI=0.840; and SRMR=0.055), except for SRMR. The reliability estimate for DASS-Y was evaluated to be 0.94, while the estimates for the sub-scales were 0.83, 0.85, and 0.87 for depression, anxiety and stress, respectively. These results support the findings of Tavakol and Dennick (2011), and Shrestha (2021) that reliability measures in the range of 0.70 or above are excellent and acceptable.
The results of the parallel analysis based on Maximum Likelihood (ML) estimation, the structural model, and the principal component analysis of residual (PCAR) show that the data has more than one dimension (Linacre, 2020), suggesting that it is multidimensional. Further analysis shows mostly out-of-range Infit/Outfit values for the unidimensional model, indicating that the data does not fit a unidimensional model. Although the EAP and WLE reliability are high, the threshold estimates showed disordered threshold categories for the majority of the items under the unidimensional framework. The data was further subjected to the multidimensional model, and the results showed acceptable infit/outfit statistics for all items. The EAP and WLE reliability indices for all three dimensions were in the acceptable range, and the threshold parameters for all the items showed that the threshold categories are well ordered, suggesting that all items are functioning as expected as we transition from one category to the other, across the three dimensions. Moreover, after subjecting the unidimensional and multidimensional models to further analysis using ANOVA, the results confirmed that the multidimensional model is a better fit for the DASS-Y, as it yielded the least AIC and BIC values. These results demonstrate that the DASS-Y is a three-factor scale measuring depression, anxiety and stress. The Wright map also suggests that the items of the DASS-Y are well-targeted to the students’ abilities, indicating that the DASS-Y is functioning as expected. The results of this study is consistent with the findings of Szabo and Lovibond (2022) who reported a three-factor structure for the DASS-Y scale. These results also agree with the study of Linacre (2022), Bond and Fox (2015) on the acceptable fit statistics using Rasch analysis, providing additional support for the psychometric quality of the DASS-Y instrument.
5. Conclusions
This study provides empirical evidence for the multidimensional structure of the DASS-Y, establishing its reliability and validity in assessing depression, anxiety, and stress among adolescents. By distinguishing these three constructs, the DASS-Y affords a more precise representation of youth mental health than would be possible with a unidimensional model. These findings underscore the value of the DASS-Y as a psychometrically sound instrument for use in both research and clinical contexts. For practitioners, the scale offers a framework for identifying distinct negative emotions in adolescents, thereby informing assessment, intervention, and treatment planning. At a broader level, the availability of a validated you-focused measure has implications for advancing mental health research, refining diagnostic practices and clinical trials, and supporting evidence-based approaches to adolescent well-being.
Author Contributions
Conceptualization, Christopher Ocheni; Formal analysis, Francis Ikeh, Samuel Nwani and Christopher Ocheni; Methodology, Christopher Ocheni; Software, Christopher Ocheni; Supervision, Basil Oguguo; Validation, Basil Oguguo and Francis Ikeh; Writing—original draft, Agnes Okeke, Samuel Nwani and Christopher Ocheni; Writing—review & editing, Agnes Okeke, Catherine Ene and Bianca Mbonu-Adigwe. All authors have read and agreed to the published version of the manuscript.
Funding
This research received no external funding
Institutional Review Board Statement
No ethical approval was required for this study.
Informed Consent Statement
Not applicable
Data Availability Statement
The data for this study are publicly available in the Science Data Bank at https://cstr.cn/31253.11.sciencedb.06194.
Acknowledgments
The authors are grateful to God Almighty and to the various sources consulted while compiling this manuscript. Specifically, our appreciation goes to Baris, S., and the Science Database for making the data for this study publicly available.
Conflicts of Interest
The authors declare no conflicts of interest.
Abbreviations
The following abbreviations are used in this manuscript:
| AIC | Akaike information criterion |
| ANOVA | Analysis of variance |
| BIC | Bayesian information criterion |
| CFA | Confirmatory factor analysis |
| CFI | Confirmatory fit index |
| CI | Confidence interval |
| DASS | Depression anxiety stress scale |
| DASS-Y | Depression anxiety stress scale-youth version |
| Dim | Dimension |
| EAP | Expected a posteriori |
| EFA | Exploratory factor analysis |
| IRF | Item response function |
| KMO | Kaiser-Meyer Olkin |
| ML | Maximum likelihood |
| MSA | Measure of sample adequacy |
| MSE | Mean square error |
| MRM | Multidimensional Rasch model |
| PCAR | Principal component analysis of residuals |
| RMSEA | Root mean square error of approximation |
| SD | Standard deviation |
| SE | Standard error |
| SRSM | Sum of root square mean |
| TLI | Tucker-Lewis index |
| WHO | World Health Organization |
| WMH | World mental health |
| WLE | Weighted likelihood estimation |
Appendix A
Figure A1.
Item Response Function for all 21 DASS-Y Items.
Appendix B

Table A1.
Summary of Infit/Outfit statistics for unidimensional model.
| parameter | Outfit | Outfit_t | Outfit_p | Outfit_pholm | Infit | Infit_t | Infit_p | Infit_pholm |
| DAS1_Cat1 | .00 | .00 | ||||||
| DAS1_Cat2 | .86 | -3.19 | .00 | .05 | .97 | -.78 | .43 | 1.00 |
| DAS1_Cat3 | 1.51 | 5.91 | .00 | .00 | 1.16 | 2.07 | .04 | 1.00 |
| DAS1_Cat4 | 3.08 | 8.95 | .00 | .00 | .86 | -1.08 | .28 | 1.00 |
| DAS2_Cat1 | .00 | .00 | ||||||
| DAS2_Cat2 | .83 | -2.76 | .01 | .15 | .87 | -1.91 | .06 | 1.00 |
| DAS2_Cat3 | .88 | -2.83 | .00 | .13 | .92 | -1.72 | .08 | 1.00 |
| DAS2_Cat4 | .61 | -7.15 | .00 | .00 | .86 | -2.19 | .03 | 1.00 |
| DAS3_Cat1 | .00 | .00 | ||||||
| DAS3_Cat2 | 1.02 | .43 | .66 | 1.00 | 1.02 | .46 | .65 | 1.00 |
| DAS3_Cat3 | 1.34 | 6.01 | .00 | .00 | 1.12 | 2.33 | .02 | .98 |
| DAS3_Cat4 | .73 | -3.77 | .00 | .01 | .91 | -1.08 | .28 | 1.00 |
| DAS4_Cat1 | .00 | .00 | ||||||
| DAS4_Cat2 | 1.15 | 3.02 | .00 | .08 | 1.02 | .39 | .70 | 1.00 |
| DAS4_Cat3 | 1.71 | 9.34 | .00 | .00 | 1.12 | 2.16 | .03 | 1.00 |
| DAS4_Cat4 | .86 | -1.89 | .06 | 1.00 | .93 | -.75 | .45 | 1.00 |
| DAS5_Cat1 | .00 | 3814831.03 | .00 | .00 | .00 | |||
| DAS5_Cat2 | 1.32 | 5.22 | .00 | .00 | .98 | -.46 | .65 | 1.00 |
| DAS5_Cat3 | 1.14 | 2.61 | .01 | .20 | 1.02 | .44 | .66 | 1.00 |
| DAS5_Cat4 | 1.25 | 2.96 | .00 | .09 | .97 | -.40 | .69 | 1.00 |
| DAS6_Cat1 | .00 | .00 | ||||||
| DAS6_Cat2 | .99 | -.14 | .89 | 1.00 | 1.00 | .01 | .99 | 1.00 |
| DAS6_Cat3 | 1.07 | 1.42 | .16 | 1.00 | 1.10 | 2.07 | .04 | 1.00 |
| DAS6_Cat4 | 1.01 | .02 | .98 | 1.00 | 1.02 | .32 | .75 | 1.00 |
| DAS7_Cat1 | .00 | .00 | ||||||
| DAS7_Cat2 | 2.36 | 13.02 | .00 | .00 | 1.20 | 2.50 | .01 | .65 |
| DAS7_Cat3 | 1.60 | 10.24 | .00 | .00 | 1.23 | 4.40 | .00 | .00 |
| DAS7_Cat4 | 1.52 | 8.02 | .00 | .00 | 1.06 | 1.20 | .23 | 1.00 |
| DAS8_Cat1 | .00 | .00 | ||||||
| DAS8_Cat2 | .99 | -.68 | .49 | 1.00 | .87 | -2.58 | .01 | .53 |
| DAS8_Cat3 | 1.08 | 1.30 | .19 | 1.00 | .98 | -.39 | .69 | 1.00 |
| DAS8_Cat4 | 6.59 | 20.44 | .00 | .00 | 1.03 | .34 | .73 | 1.00 |
| DAS9_Cat1 | .00 | .00 | ||||||
| DAS9_Cat2 | 1.18 | 2.77 | .01 | .14 | .98 | -.29 | .77 | 1.00 |
| DAS9_Cat3 | .99 | -.23 | .82 | 1.00 | 1.03 | .58 | .56 | 1.00 |
| DAS9_Cat4 | 1.33 | 3.73 | .00 | .01 | .96 | -.58 | .56 | 1.00 |
| DAS10_Cat1 | .00 | .00 | ||||||
| DAS10_Cat2 | .81 | -2.92 | .00 | .10 | .89 | -1.67 | .09 | 1.00 |
| DAS10_Cat3 | .83 | -3.74 | .00 | .01 | .94 | -1.23 | .22 | 1.00 |
| DAS10_Cat4 | 1.11 | 1.62 | .11 | 1.00 | .88 | -2.25 | .02 | 1.00 |
| DAS11_Cat1 | .00 | .00 | ||||||
| DAS11_Cat2 | 1.42 | 6.08 | .00 | .00 | 1.07 | 1.09 | .28 | 1.00 |
| DAS11_Cat3 | 1.28 | 5.45 | .00 | .00 | 1.12 | 2.56 | .01 | .55 |
| DAS11_Cat4 | 1.00 | -.10 | .92 | 1.00 | .98 | -.26 | .80 | 1.00 |
| DAS12_Cat1 | .00 | .00 | ||||||
| DAS12_Cat2 | .92 | -1.62 | .11 | 1.00 | .91 | -1.86 | .06 | 1.00 |
| DAS12_Cat3 | .68 | -7.12 | .00 | .00 | .87 | -2.71 | .01 | .38 |
| DAS12_Cat4 | .83 | -2.76 | .01 | .15 | .85 | -1.93 | .05 | 1.00 |
| DAS13_Cat1 | .00 | .00 | ||||||
| DAS13_Cat2 | 1.15 | 3.07 | .00 | .07 | 1.05 | 1.16 | .24 | 1.00 |
| DAS13_Cat3 | 1.07 | 1.17 | .24 | 1.00 | 1.08 | 1.45 | .15 | 1.00 |
| DAS13_Cat4 | 1.30 | 2.63 | .01 | .19 | .95 | -.63 | .53 | 1.00 |
| DAS14_Cat1 | .00 | .00 | ||||||
| DAS14_Cat2 | 1.08 | 1.44 | .15 | 1.00 | 1.03 | .69 | .49 | 1.00 |
| DAS14_Cat3 | 2.04 | 8.98 | .00 | .00 | 1.19 | 2.08 | .04 | 1.00 |
| DAS14_Cat4 | 1.08 | .43 | .66 | 1.00 | 1.05 | .45 | .65 | 1.00 |
| DAS15_Cat1 | .00 | .00 | ||||||
| DAS15_Cat2 | 3.45 | 33.04 | .00 | .00 | 1.17 | 3.73 | .00 | .01 |
| DAS15_Cat3 | 1.80 | 10.98 | .00 | .00 | 1.29 | 4.61 | .00 | .00 |
| DAS15_Cat4 | 5.37 | 19.36 | .00 | .00 | 1.36 | 2.88 | .00 | .22 |
| DAS16_Cat1 | .00 | .00 | ||||||
| DAS16_Cat2 | 1.14 | 2.03 | .04 | .84 | .98 | -.29 | .77 | 1.00 |
| DAS16_Cat3 | 1.13 | 2.43 | .02 | .32 | 1.06 | 1.14 | .25 | 1.00 |
| DAS16_Cat4 | 1.87 | 11.15 | .00 | .00 | .94 | -1.13 | .26 | 1.00 |
| DAS17_Cat1 | .00 | .00 | ||||||
| DAS17_Cat2 | .91 | -1.55 | .12 | 1.00 | .93 | -1.27 | .20 | 1.00 |
| DAS17_Cat3 | .80 | -4.32 | .00 | .00 | .92 | -1.73 | .08 | 1.00 |
| DAS17_Cat4 | 1.06 | .75 | .45 | 1.00 | .91 | -1.53 | .13 | 1.00 |
| DAS18_Cat1 | .00 | .00 | ||||||
| DAS18_Cat2 | .89 | -2.01 | .04 | .84 | .99 | -.18 | .86 | 1.00 |
| DAS18_Cat3 | 1.06 | 1.05 | .29 | 1.00 | 1.03 | .61 | .54 | 1.00 |
| DAS18_Cat4 | .84 | -3.11 | .00 | .06 | .91 | -1.58 | .11 | 1.00 |
| DAS19_Cat1 | .00 | .00 | ||||||
| DAS19_Cat2 | .70 | -4.66 | .00 | .00 | .86 | -2.08 | .04 | 1.00 |
| DAS19_Cat3 | .74 | -5.97 | .00 | .00 | .86 | -2.99 | .00 | .16 |
| DAS19_Cat4 | .73 | -5.27 | .00 | .00 | .84 | -2.81 | .00 | .27 |
| DAS20_Cat1 | .00 | .00 | ||||||
| DAS20_Cat2 | .69 | -6.21 | .00 | .00 | .87 | -2.39 | .02 | .86 |
| DAS20_Cat3 | .68 | -7.30 | .00 | .00 | .82 | -3.88 | .00 | .01 |
| DAS20_Cat4 | .59 | -7.45 | .00 | .00 | .78 | -3.61 | .00 | .02 |
| DAS21_Cat1 | .00 | |||||||
| DAS21_Cat2 | 1.65 | 10.28 | .00 | .00 | 1.05 | 1.12 | .26 | 1.00 |
| DAS21_Cat3 | 1.30 | 4.33 | .00 | .00 | 1.13 | 2.01 | .04 | 1.00 |
| DAS21_Cat4 | .86 | -1.55 | .12 | 1.00 | 1.08 | .79 | .43 | 1.00 |
Table A2.
Summary of Infit/Outfit statistics for multidimensional model.
| parameter | Outfit | Outfit_t | Outfit_p | Outfit_pholm | Infit | Infit_t | Infit_p | Infit_pholm |
| DAS1 | 1.20 | 4.51 | .00 | .00 | 1.17 | 3.71 | .00 | .01 |
| DAS2 | 1.13 | 3.16 | .00 | .07 | 1.13 | 3.16 | .00 | .10 |
| DAS3 | 1.25 | 5.88 | .00 | .00 | 1.22 | 5.18 | .00 | .00 |
| DAS4 | 1.32 | 7.28 | .00 | .00 | 1.28 | 6.51 | .00 | .00 |
| DAS5 | 1.09 | 2.15 | .03 | .91 | 1.04 | 1.09 | .28 | 1.00 |
| DAS6 | 1.16 | 3.92 | .00 | .00 | 1.16 | 3.92 | .00 | .01 |
| DAS8 | 1.15 | 3.13 | .00 | .07 | 1.14 | 2.81 | .01 | .33 |
| DAS9 | 1.14 | 2.88 | .00 | .15 | 1.19 | 4.05 | .00 | .00 |
| DAS10 | 1.09 | 1.95 | .05 | 1.00 | 1.13 | 2.79 | .01 | .34 |
| DAS11 | 1.28 | 5.63 | .00 | .00 | 1.30 | 6.13 | .00 | .00 |
| DAS12 | .88 | -2.72 | .01 | .23 | .98 | -.51 | .61 | 1.00 |
| DAS13 | .95 | -.99 | .32 | 1.00 | .99 | -.18 | .86 | 1.00 |
| DAS15 | 1.51 | 10.30 | .00 | .00 | 1.40 | 8.27 | .00 | .00 |
| DAS16 | 1.12 | 2.69 | .01 | .24 | 1.10 | 2.26 | .02 | 1.00 |
| DAS17 | 1.06 | 1.33 | .18 | 1.00 | 1.08 | 1.78 | .08 | 1.00 |
| DAS18 | 1.14 | 3.24 | .00 | .05 | 1.15 | 3.33 | .00 | .06 |
| DAS19 | 1.07 | 1.70 | .09 | 1.00 | 1.10 | 2.25 | .02 | 1.00 |
| DAS20 | .95 | -1.10 | .27 | 1.00 | .98 | -.36 | .72 | 1.00 |
| DAS1_step1 | 1.97 | 4.90 | .00 | .00 | .86 | -1.06 | .29 | 1.00 |
| DAS1_step2 | .86 | -4.09 | .00 | .00 | .95 | -1.30 | .19 | 1.00 |
| DAS1_step3 | 1.39 | 4.15 | .00 | .00 | 1.09 | 1.09 | .28 | 1.00 |
| DAS2_step1 | .62 | -6.89 | .00 | .00 | .88 | -1.98 | .05 | 1.00 |
| DAS2_step2 | .88 | -3.60 | .00 | .02 | .91 | -2.85 | .00 | .29 |
| DAS2_step3 | .86 | -3.75 | .00 | .01 | .97 | -.81 | .42 | 1.00 |
| DAS3_step1 | .74 | -3.64 | .00 | .01 | .91 | -1.16 | .25 | 1.00 |
| DAS3_step2 | .95 | -1.77 | .08 | 1.00 | .98 | -.71 | .48 | 1.00 |
| DAS3_step3 | 1.18 | 3.33 | .00 | .04 | 1.04 | .77 | .44 | 1.00 |
| DAS4_step1 | .87 | -1.75 | .08 | 1.00 | .91 | -.92 | .36 | 1.00 |
| DAS4_step2 | 1.02 | .60 | .55 | 1.00 | .98 | -.65 | .52 | 1.00 |
| DAS4_step3 | 1.30 | 4.24 | .00 | .00 | 1.02 | .42 | .68 | 1.00 |
| DAS5_step1 | 1.12 | 1.37 | .17 | 1.00 | .97 | -.37 | .71 | 1.00 |
| DAS5_step2 | .97 | -1.17 | .24 | 1.00 | .96 | -1.26 | .21 | 1.00 |
| DAS5_step3 | 1.12 | 2.27 | .02 | .72 | .98 | -.37 | .71 | 1.00 |
| DAS6_step1 | .99 | -.26 | .79 | 1.00 | 1.01 | .21 | .84 | 1.00 |
| DAS6_step2 | .96 | -1.34 | .18 | 1.00 | .98 | -.68 | .49 | 1.00 |
| DAS6_step3 | 1.00 | -.03 | .97 | 1.00 | 1.01 | .27 | .79 | 1.00 |
| DAS7_step1 | 1.35 | 5.85 | .00 | .00 | 1.05 | .99 | .32 | 1.00 |
| DAS7_step2 | 1.00 | .09 | .93 | 1.00 | 1.02 | .63 | .53 | 1.00 |
| DAS7_step3 | 1.26 | 5.76 | .00 | .00 | 1.04 | 1.05 | .29 | 1.00 |
| DAS8_step1 | 3.00 | 12.00 | .00 | .00 | 1.04 | .38 | .70 | 1.00 |
| DAS8_step2 | .90 | -2.74 | .01 | .23 | .92 | -2.10 | .04 | 1.00 |
| DAS8_step3 | .99 | -.44 | .66 | 1.00 | .97 | -.52 | .60 | 1.00 |
| DAS9_step1 | 1.27 | 3.03 | .00 | .10 | .94 | -.78 | .43 | 1.00 |
| DAS9_step2 | .92 | -2.52 | .01 | .38 | .94 | -1.77 | .08 | 1.00 |
| DAS9_step3 | .93 | -1.65 | .10 | 1.00 | .98 | -.38 | .71 | 1.00 |
| DAS10_step1 | 1.18 | 2.71 | .01 | .24 | .88 | -2.16 | .03 | 1.00 |
| DAS10_step2 | .85 | -5.11 | .00 | .00 | .89 | -3.87 | .00 | .01 |
| DAS10_step3 | .86 | -4.27 | .00 | .00 | .95 | -1.52 | .13 | 1.00 |
| DAS11_step1 | 1.00 | -.01 | .99 | 1.00 | .97 | -.42 | .68 | 1.00 |
| DAS11_step2 | .98 | -.59 | .55 | 1.00 | .99 | -.29 | .77 | 1.00 |
| DAS11_step3 | 1.14 | 3.00 | .00 | .11 | 1.03 | .59 | .55 | 1.00 |
| DAS12_step1 | .87 | -2.24 | .03 | .76 | .84 | -2.02 | .04 | 1.00 |
| DAS12_step2 | .87 | -4.57 | .00 | .00 | .91 | -3.20 | .00 | .09 |
| DAS12_step3 | .72 | -6.50 | .00 | .00 | .92 | -1.64 | .10 | 1.00 |
| DAS13_step1 | 1.22 | 1.83 | .07 | 1.00 | .94 | -.69 | .49 | 1.00 |
| DAS13_step2 | .95 | -1.70 | .09 | 1.00 | .99 | -.43 | .67 | 1.00 |
| DAS13_step3 | .99 | -.18 | .86 | 1.00 | 1.02 | .35 | .73 | 1.00 |
| DAS14_step1 | 1.32 | 2.04 | .04 | 1.00 | 1.07 | .64 | .52 | 1.00 |
| DAS14_step2 | .94 | -1.46 | .15 | 1.00 | .99 | -.15 | .88 | 1.00 |
| DAS14_step3 | 2.25 | 7.40 | .00 | .00 | 1.04 | .37 | .71 | 1.00 |
| DAS15_step1 | 4.98 | 18.87 | .00 | .00 | 1.34 | 2.78 | .01 | .34 |
| DAS15_step2 | 1.10 | 3.10 | .00 | .08 | 1.08 | 2.46 | .01 | .83 |
| DAS15_step3 | 1.60 | 7.80 | .00 | .00 | 1.09 | 1.45 | .15 | 1.00 |
| DAS16_step1 | 1.66 | 9.44 | .00 | .00 | .92 | -1.44 | .15 | 1.00 |
| DAS16_step2 | .91 | -3.36 | .00 | .04 | .93 | -2.48 | .01 | .81 |
| DAS16_step3 | .93 | -1.71 | .09 | 1.00 | .97 | -.63 | .53 | 1.00 |
| DAS17_step1 | .96 | -.96 | .34 | 1.00 | .90 | -1.75 | .08 | 1.00 |
| DAS17_step2 | .88 | -4.84 | .00 | .00 | .91 | -3.35 | .00 | .06 |
| DAS17_step3 | .82 | -4.04 | .00 | .00 | .95 | -1.09 | .28 | 1.00 |
| DAS18_step1 | .83 | -3.13 | .00 | .07 | .90 | -1.88 | .06 | 1.00 |
| DAS18_step2 | .94 | -2.28 | .02 | .72 | .96 | -1.44 | .15 | 1.00 |
| DAS18_step3 | 1.05 | .76 | .45 | 1.00 | 1.00 | -.03 | .98 | 1.00 |
| DAS19_step1 | .73 | -5.11 | .00 | .00 | .85 | -2.69 | .01 | .44 |
| DAS19_step2 | .86 | -4.59 | .00 | .00 | .88 | -3.78 | .00 | .01 |
| DAS19_step3 | .88 | -3.36 | .00 | .04 | .95 | -1.23 | .22 | 1.00 |
| DAS20_step1 | .57 | -8.00 | .00 | .00 | .77 | -3.76 | .00 | .01 |
| DAS20_step2 | .84 | -6.01 | .00 | .00 | .88 | -4.42 | .00 | .00 |
| DAS20_step3 | .81 | -4.14 | .00 | .00 | .94 | -1.17 | .24 | 1.00 |
| DAS21_step1 | .91 | -.98 | .33 | 1.00 | 1.07 | .76 | .45 | 1.00 |
| DAS21_step2 | .97 | -.98 | .33 | 1.00 | 1.01 | .38 | .70 | 1.00 |
| DAS21_step3 | 1.29 | 3.43 | .00 | .03 | 1.02 | .35 | .73 | 1.00 |
Table A3.
DASS-Y.
| S/No | Statement | 0 | 1 | 2 | 3 |
|---|---|---|---|---|---|
| 1 | I got upset about little things | ||||
| 2 | I hated my life | ||||
| 3 | There was nothing nice I could look forward to | ||||
| 4 | I could not stop feeling sad | ||||
| 5 | I hated myself | ||||
| 6 | I felt like I was no good | ||||
| 7 | I felt that life was terrible | ||||
| 8 | I felt dizzy, like I was about to faint | ||||
| 9 | I had trouble breathing (e.g., fast breathing), even though I wasn’t exercising and I was not sick. | ||||
| 10 | My hands felt shaky | ||||
| 11 | I felt terrified | ||||
| 12 | I felt like I was about to panic | ||||
| 13 | I could feel my heart beating really fast, even though I hadn’t done any hard exercise | ||||
| 14 | I felt scared for no good reason | ||||
| 15 | I got upset about little things | ||||
| 16 | I found myself overreacting to situations | ||||
| 17 | I was stressing about lots of things | ||||
| 18 | I was easily irritated | ||||
| 19 | I found it difficult to relax | ||||
| 20 | I got annoyed when people interrupted me | ||||
| 21 | I was easily annoyed |
References
- World Health Organization. (2024). Working for a brighter, healthier future: how WHO improves health and promotes well-being for the world’s adolescents. World Health Organization.
- Cuijpers, P., Miguel, C., Ciharova, M., Ebert, D., Harrer, M., & Karyotaki, E. (2023). Transdiagnostic treatment of depression and anxiety: a meta-analysis. Psychological Medicine, 53(14), 6535-6546.
- Lawrence, D., Johnson, S., Hafekost, J., Boterhoven deHaan, K., Sawyer, M., Ainley, J., et al. (2015). The Mental Health of Children and Adolescents. Report on the Second Australian Child and Adolescent Survey of Mental Health and Wellbeing. Canberra, ACT: Department of Health.
- Lovibond, P. F., and Lovibond, S. H. (1995a). The structure of negative emotional states: comparison of the Depression Anxiety Stress Scales (DASS) with the Beck Depression and Anxiety Inventories. Behav. Res. Ther. 33, 335–343. [CrossRef]
- Asún, R. A., Rdz-Navarro, K., & Alvarado, J. M. (2016). Developing multidimensional Likert scales using item factor analysis: The case of four-point items. Sociological Methods & Research, 45(1), 109-133.
- Lovibond, S. H. & Lovibond, P. H. (1995b). Manual for the Depression Anxiety and Stress Scale (2nd Ed). Sydney: Psychological Foundation.
- Ng, F., Trauer, T., Dodd, S., Callaly, T., Campbell, S., and Berk, M. (2007). The validity of the 21-item version of the Depression Anxiety Stress Scales as a routine clinical outcome measure. Acta Neuropsychiatr. 19, 304–310. [CrossRef]
- Szabo, M., & Lovibond, P. F. (2022). Development and psychometric properties of the DASS-youth: An extension of depression anxiety stress scales (DASS) to adolescents and children. Front. Psychol. 13:766890. [CrossRef]
- Patrick, J., Dyck, M., and Bramston, P. (2010). Depression Anxiety Stress Scale: is it valid for children and adolescents? J. Clin. Psychol. 66, 996–1007. [CrossRef]
- Szabó, M. (2010). The short version of the Depression Anxiety Stress Scales (DASS-21): factor structure in a young adolescent sample. J. Adolesc. 33, 1–8. [CrossRef]
- American Educational Research Association (AERA), American Psychological Association (APA), & National Council on Measurement in Education (NCME). (2014). Standards for Educational and Psychological Testing. AERA.
- Sarfika, R., Malini, H., Lukman, A. W., Permata, B. W., & Sarfundin, M. M. Y. (2024). Cross cultural adaptation and psychometric evaluation of the depression anxiety stress scale for youth (IDASS-Y), 10(19), 1-3.
- Sahar, O., Gaelle, K., Amira, M., A., Marie-Anne, E. K., Diana, M., Fouad, S., Mariam, D., Rabih, H., Souheil, H. & Feten, F. (2024). Psychometric validation of the Depression Anxiety Stress Scale for Youth (DASS-Y) in Arabic and development of an abridged version (DASS-Y-12). International Journal of Adolescence and Youth, 30(1), 1-20.
- Cao, C. H., Liao, X.I, Gambe, J. H., Li, L. L., Jiang, X. Y., Li, X. D., Griffith, M. D., Chen, I. H., & Lin, C. Y. (2023). Evaluating the psychometric properties of the Chinese depression anxiety stress scale for youth (DASS-Y) and DASS-21. Child and Adolescent psychology and mental health, 17(106), 1-16.
- Alexandrowicz, R. W., Jahn, R., & Wancata, J. (2018). Assessing the dimensionality of the CES-D using multi-dimensional multi-level Rasch models. PloS one, 13(5), e0197908.
- Kleppang, A. L., Steigen, A. M., & Finbråten, H. S. (2020). Using Rasch measurement theory to assess the psychometric properties of a depressive symptoms scale in Norwegian adolescents. Health and Quality of Life Outcomes, 18(1), 127.
- Barış, S. (2022). Depression, anxiety, stress levels, and five-factor personality traits as predictors of clinical medical students’ migration intention: A cross-sectional study of brain drain [DS/OL]. V1. Science Data Bank [2025-07-30]. https://cstr.cn/31253.11.sciencedb.06194.
- Tavakol, M., & Dennick, R. (2011). Making sense of Cronbach’s alpha. International Medical Education, 2, 53-55. [CrossRef]
- Bond, T. G., & Fox, C. M. (2015). Applying the Rasch model: fundamental measurement in the human sciences (Z. Yan & M. Heene (Eds.); Fourth edition). Routledge/Taylor & Francis Group.
- Linacre, J. M. (2002). What do infit and outfit, mean-square and standardized mean? Rasch Measurement Transactions, 16(2), 878.
- Rasch, G. (1960). Probabilistic models for some intelligence and attainment tests. Copenhagen, Denmark: Danish Institute for Educational Research. (Expanded edition, 1980. Chicago, IL: University of Chicago Press).
- Wilson, E. B., & Hilferty, M. M. (1931). The distribution of chi-square. Proceedings of the National Academy of Sciences of the United States of America, 17, 684–688.
- Adams, R. J., Wu, M. L., & Wilson, M. (2012). The Rasch rating model and the disordered threshold controversy. Educational and Psychological Measurement, 72, 547-573.
- Engelhard, G. (2013). Invariant measurement: Using Rasch models in the social, behavioral and health sciences. New York, NY: Routledge.
- Wind, S. A., & Mansouri, B. (2019). Student perceptions of grammar instruction in Iranian secondary education: Evaluation of an instrument using Rasch measurement theory. Journal of Applied Measurement, 20(1), 46-65.
- Kaiser, H. F. (1958). The varimax criterion for analytic rotation in factor analysis. Psychometrika, 23(3), 187-200.
- Linacre, J. M. (2020). A user’s guide to WINSTEPS MINSTEP Rasch-model computer programs (4.7.0.) winsteps.com.
- Akaike, H. (1987). Factor analysis and AIC. Psychometrika, 52(3), 317-332.
- Mair, P. & Hatzinger, R. (2007). “Extended Rasch modeling: The eRm package for the application of IRT models in R.” Journal of Statistical Software, 20. [CrossRef]
Figure 1.
Parallel analysis for the number of extractable factors.
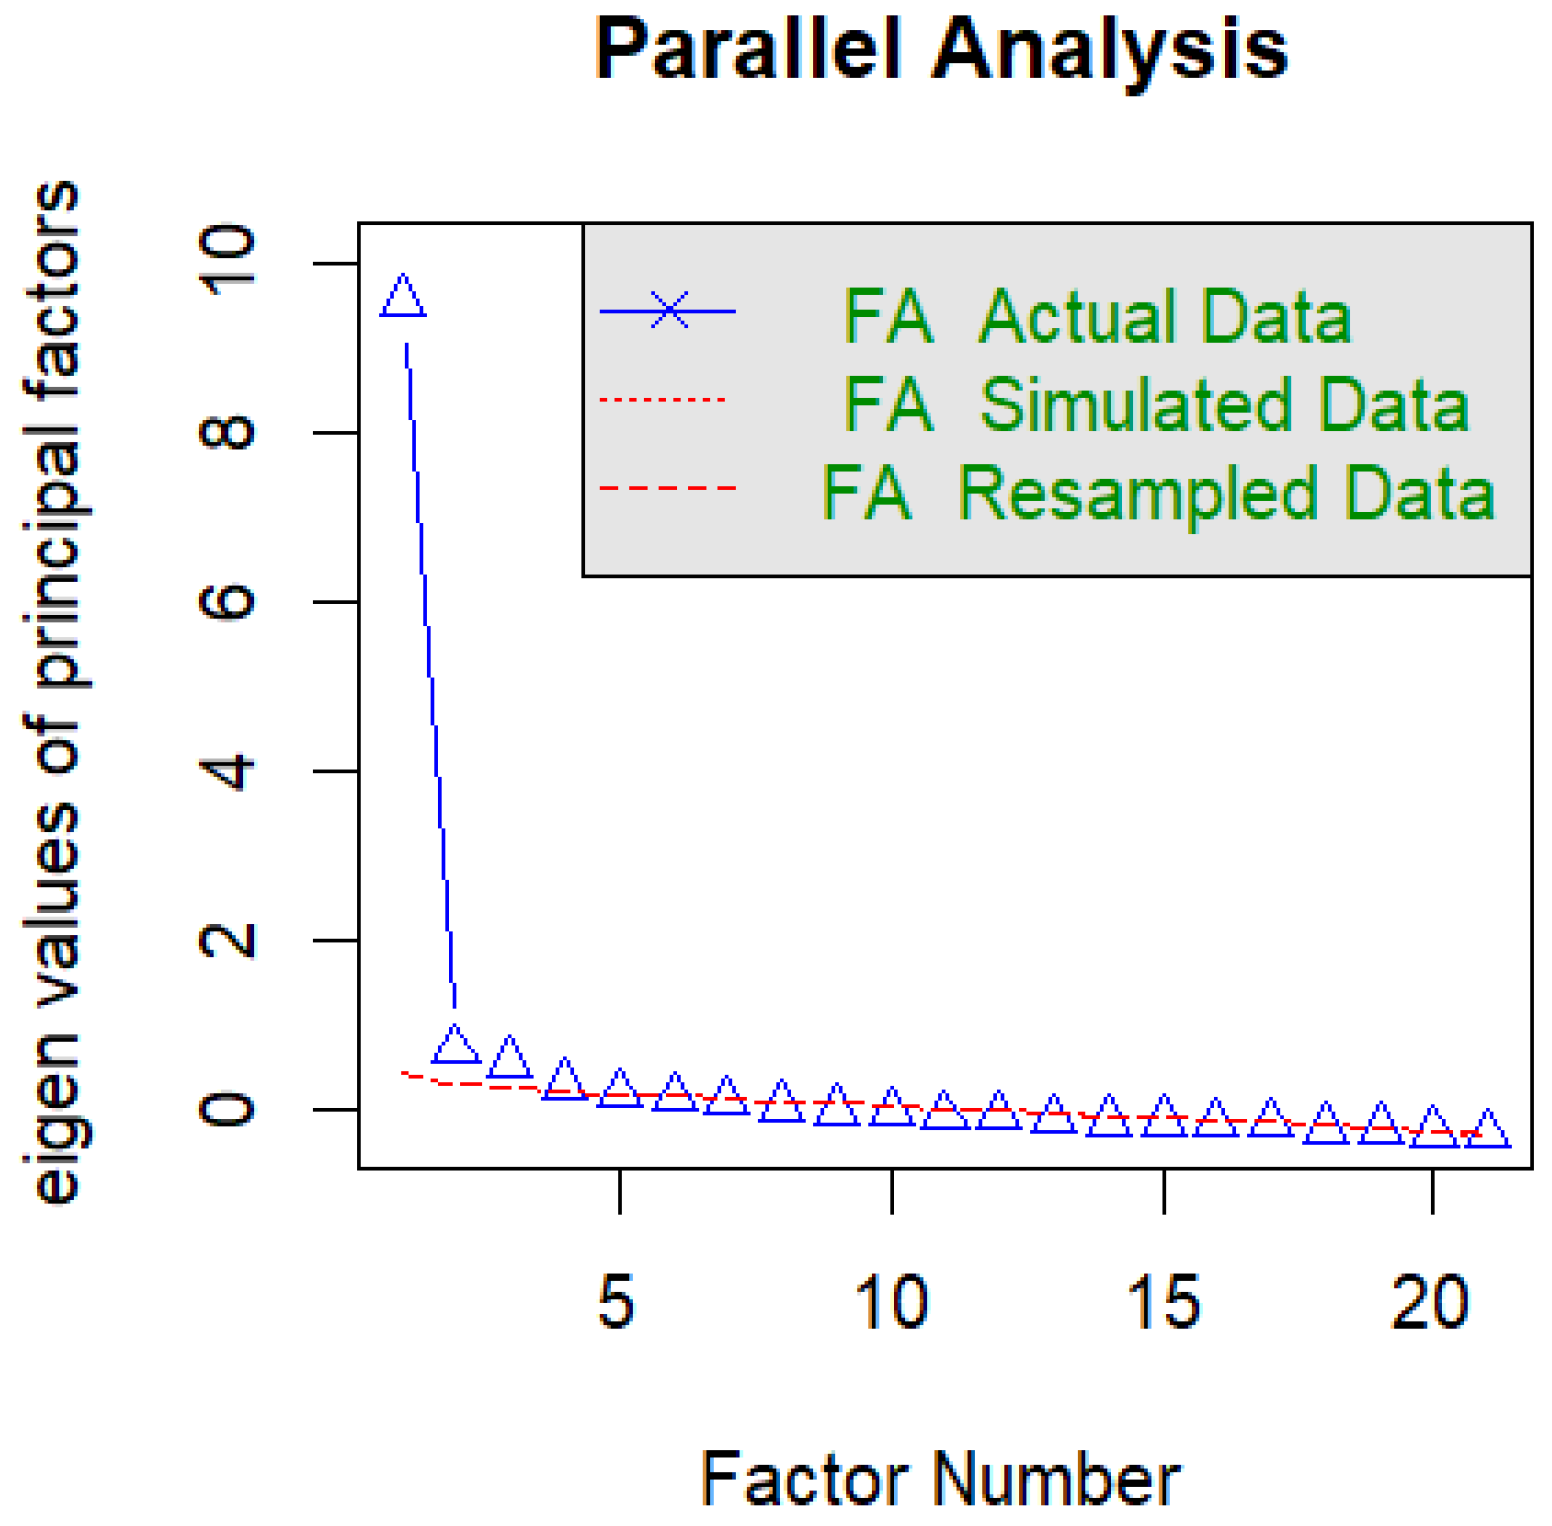
Figure 2.
Structural model for the DASS-Y using CFA.
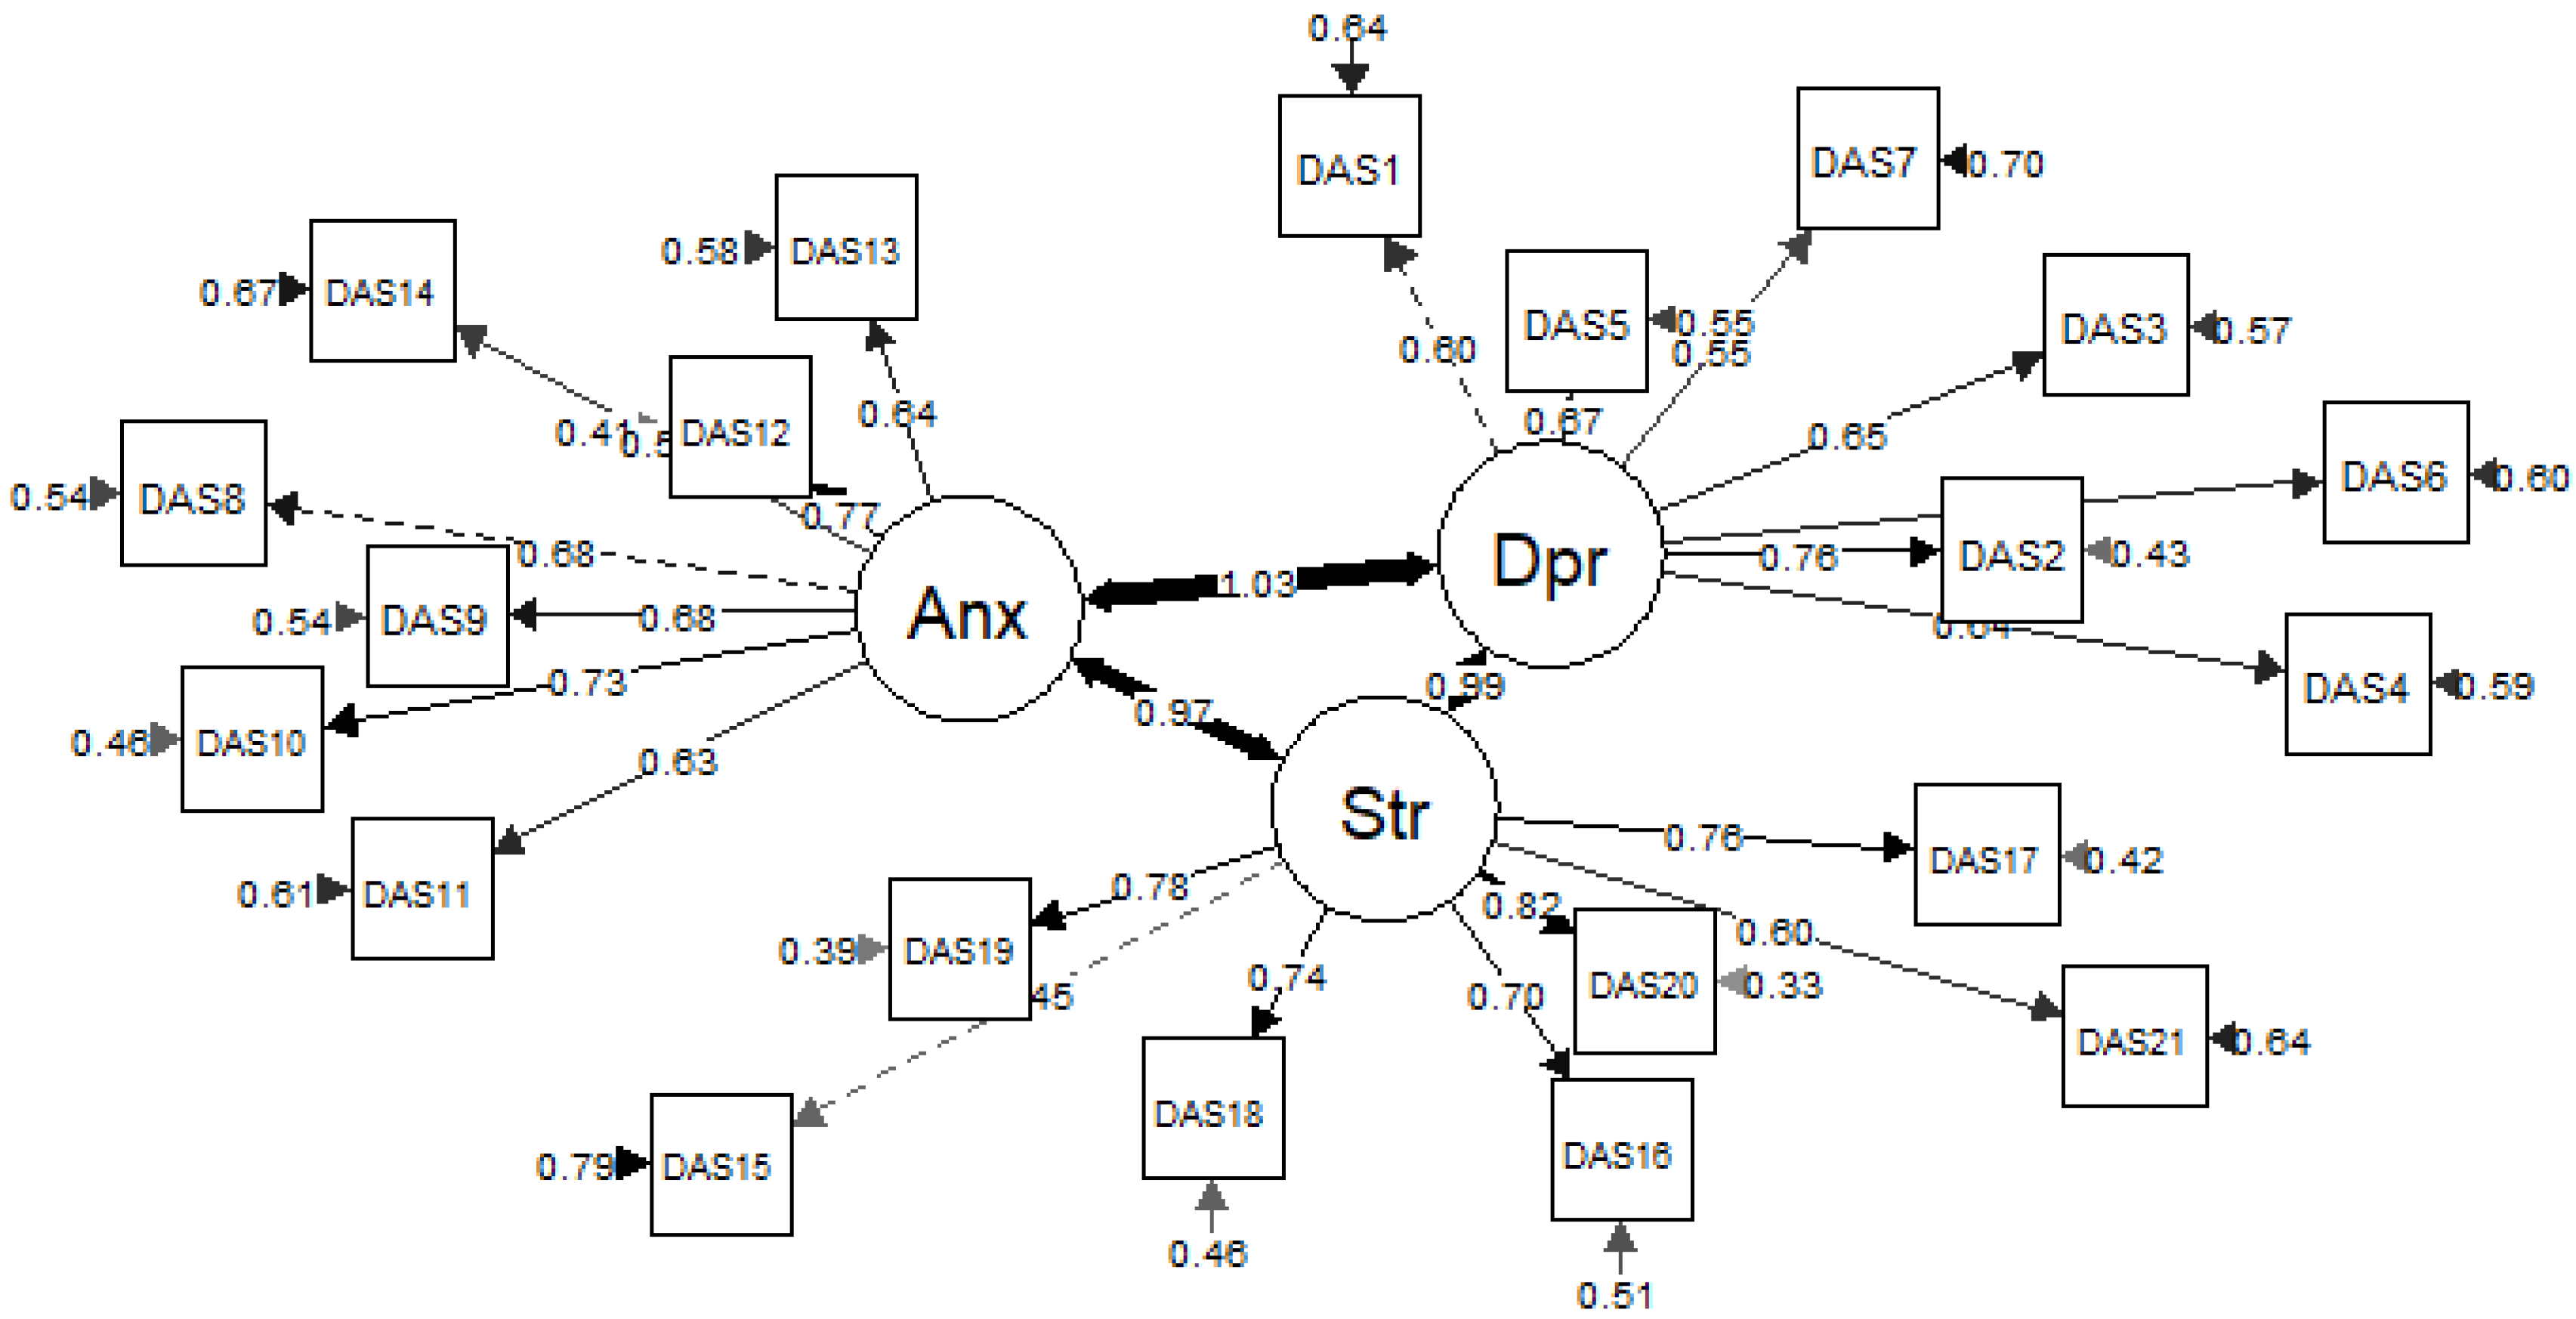
Figure 3.
Dimensionality assessment using PCAR.
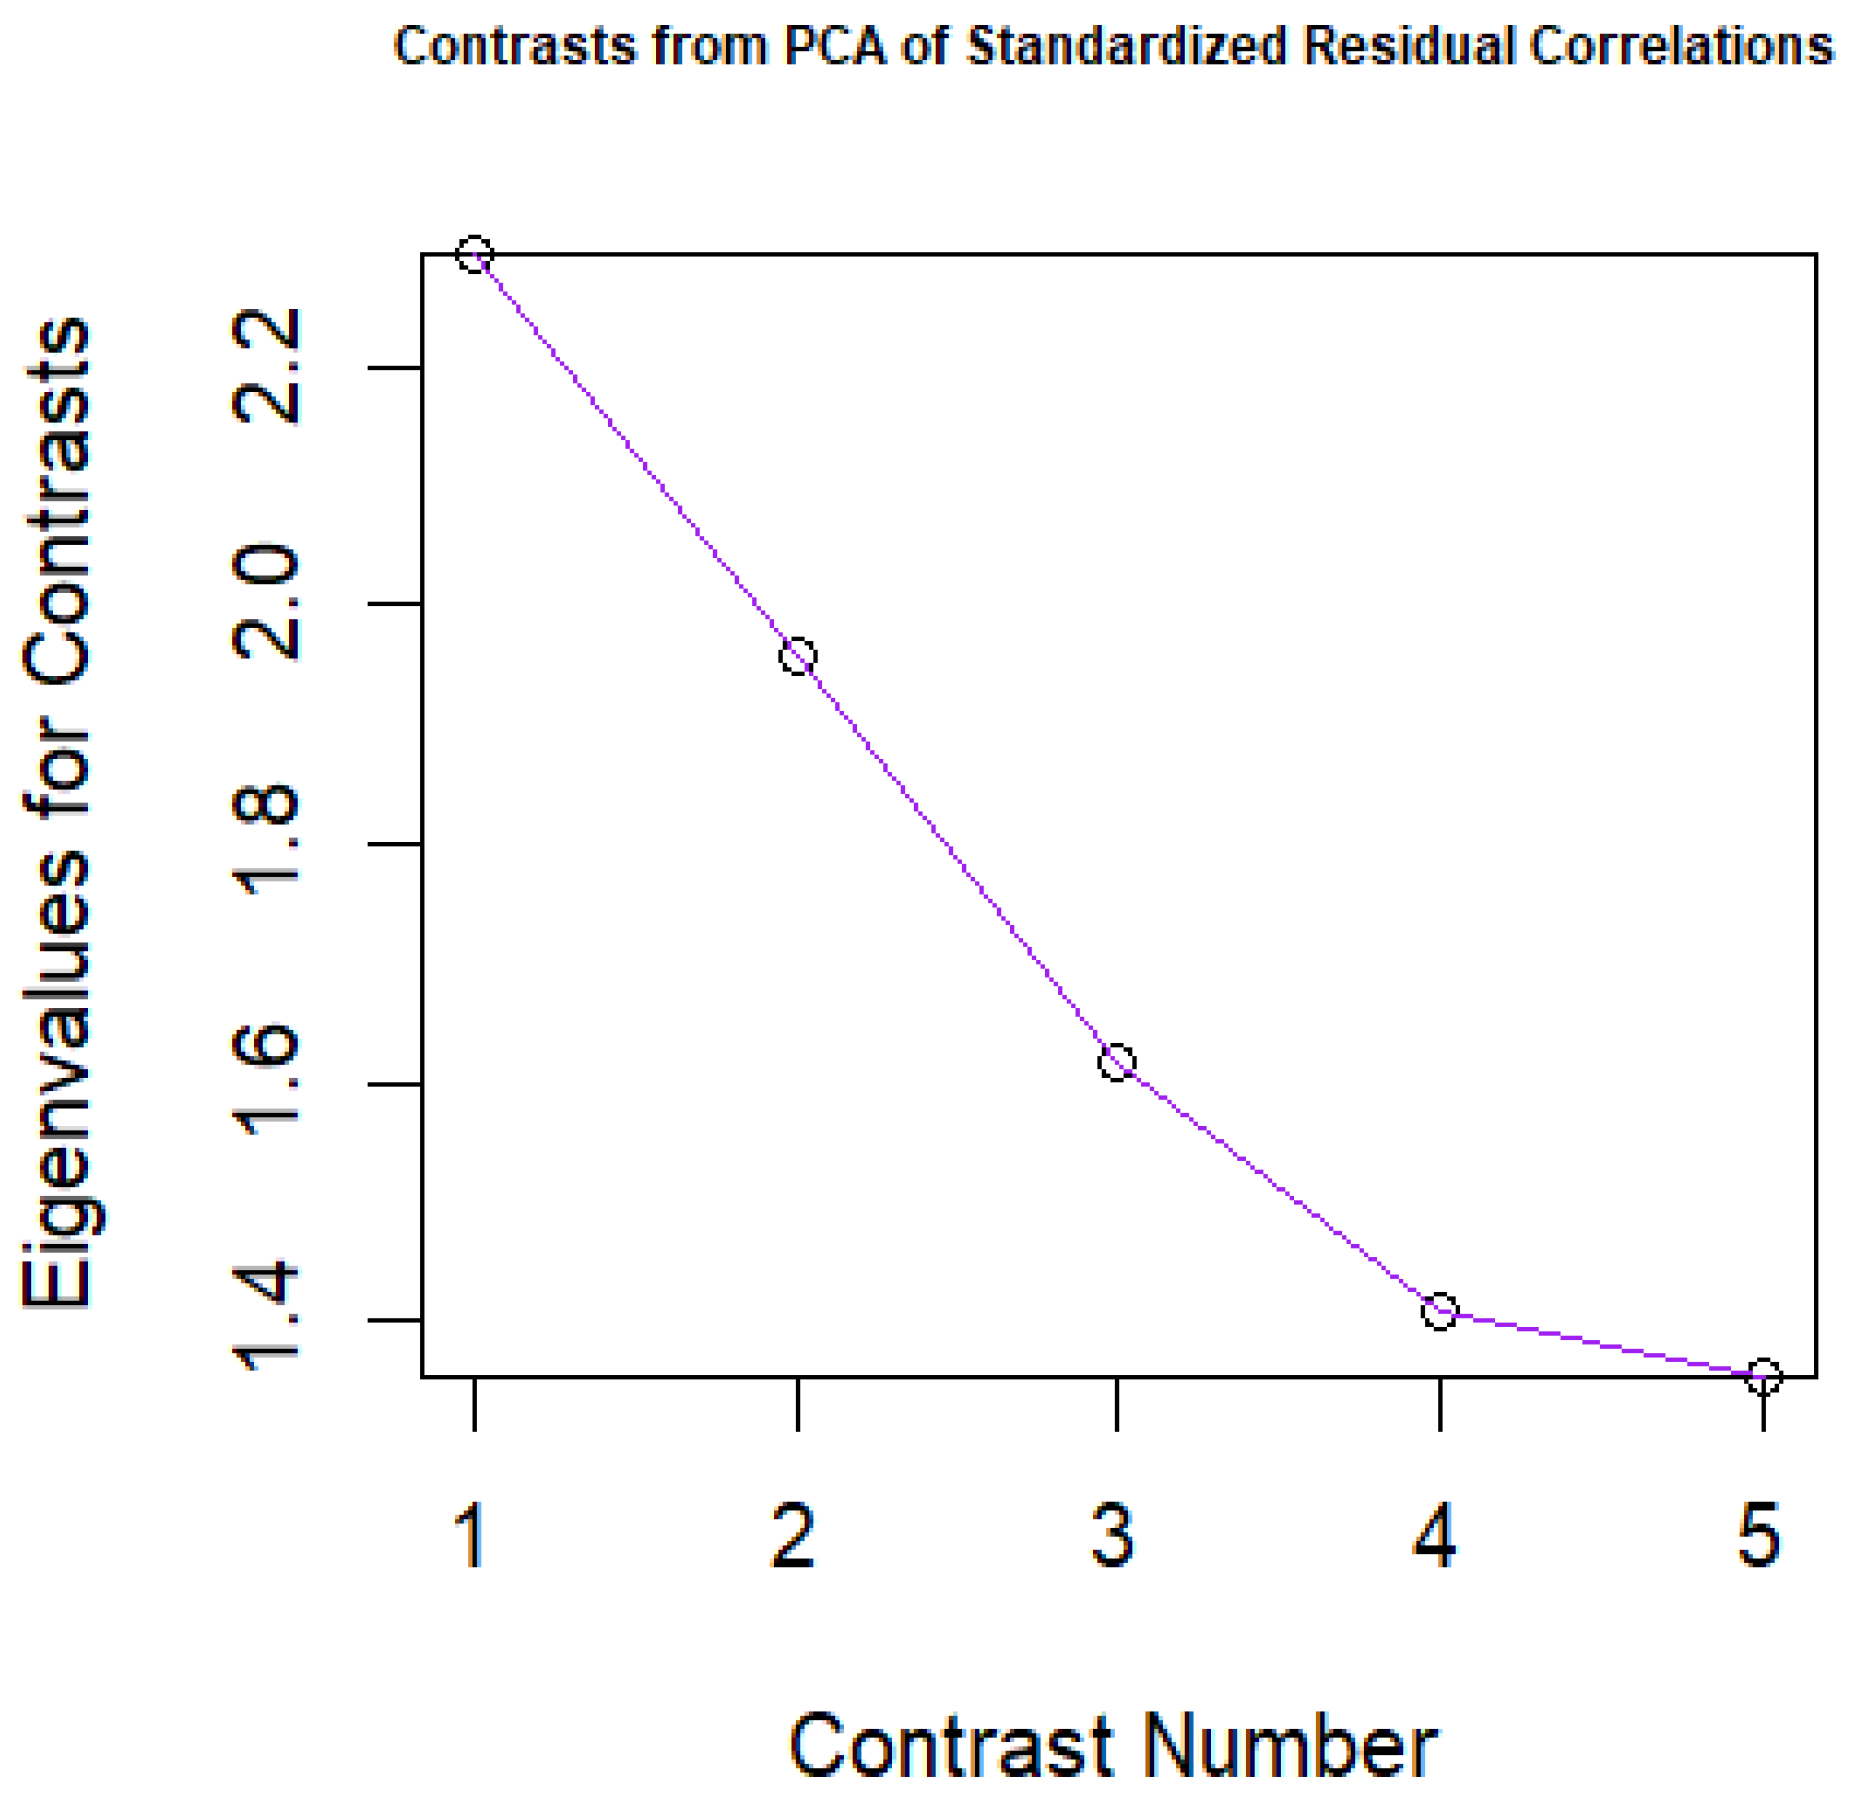
Figure 4.
DASS-Y Wright Map for person-item.
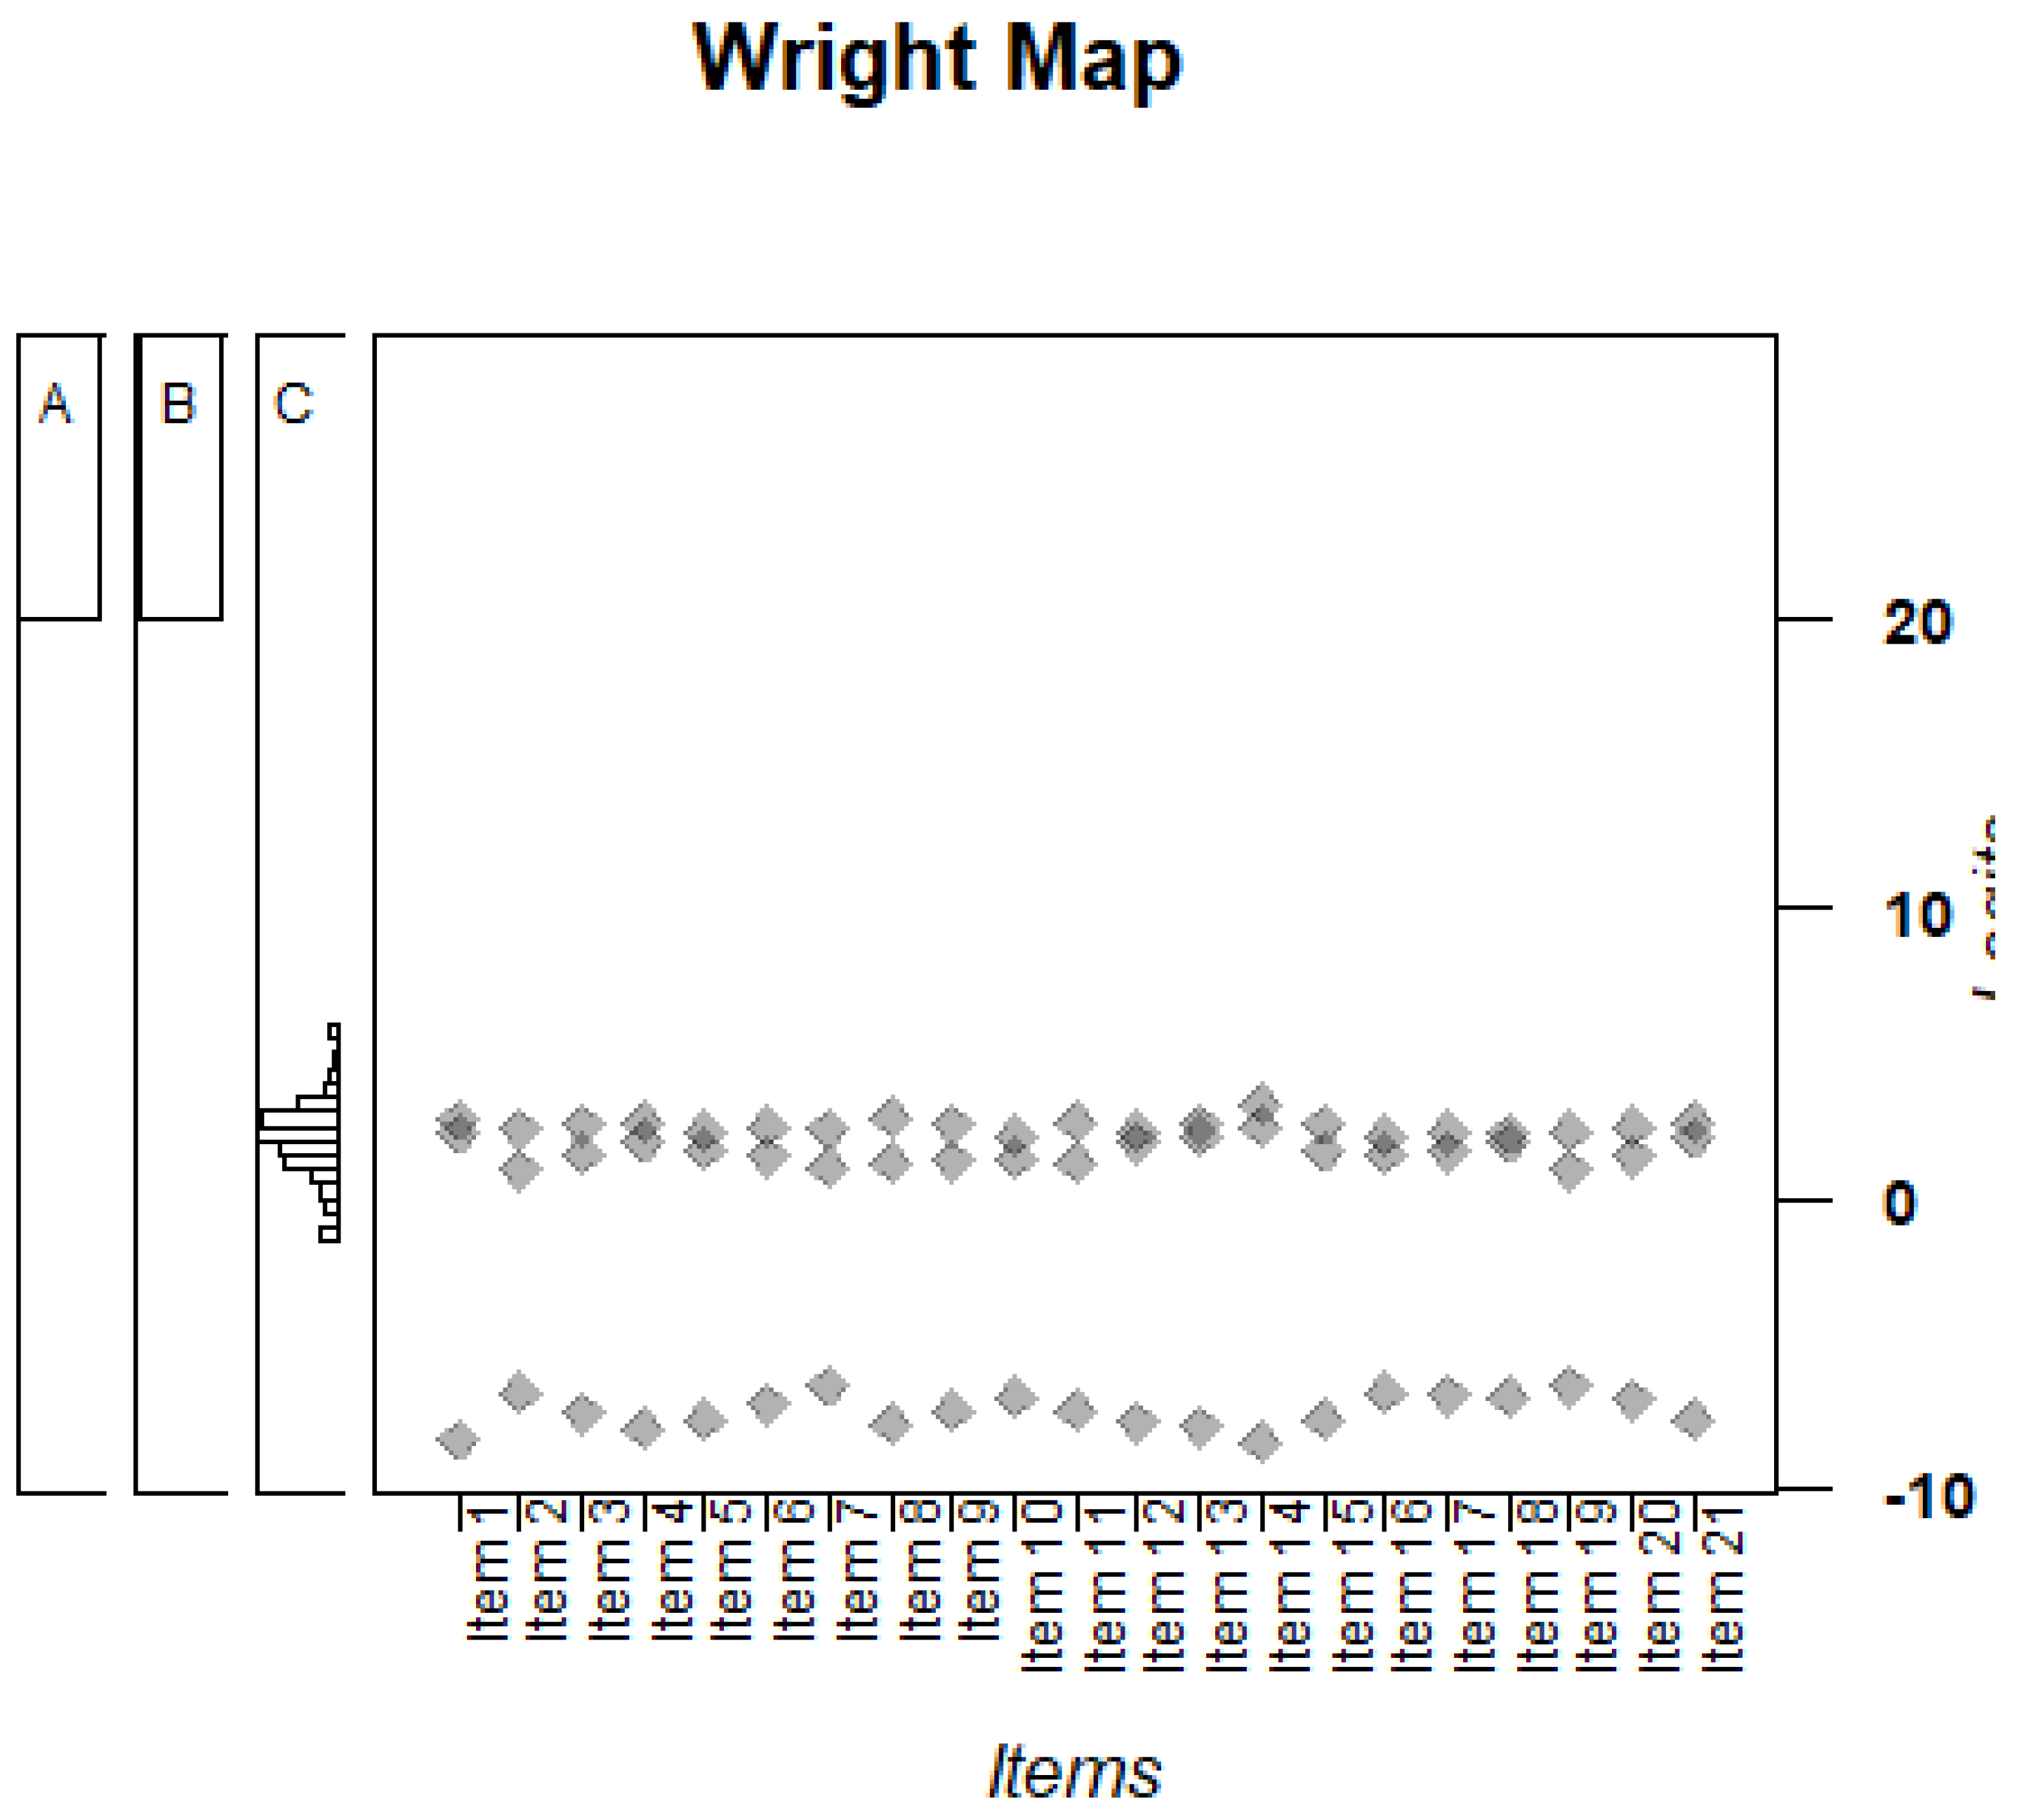
Table 1.
Item statistics for corrected item-total correlation.
| Items | n | Mean | SD | Alpha if deleted | Corrected-item total | skewness | Kurtosis |
|---|---|---|---|---|---|---|---|
| DAS1 | 575 | 1.69 | 0.94 | 0.94 | 0.60 | 1.17 | 0.23 |
| DAS2 | 575 | 2.48 | 1.03 | 0.94 | 0.72 | 0.06 | -1.15 |
| DAS3 | 575 | 2.17 | 1.06 | 0.94 | 0.63 | 0.41 | -1.08 |
| DAS4 | 575 | 2.00 | 1.05 | 0.94 | 0.63 | 0.63 | -0.88 |
| DAS5 | 575 | 2.23 | 1.08 | 0.94 | 0.66 | 0.30 | -1.21 |
| DAS6 | 575 | 2.32 | 1.09 | 0.94 | 0.63 | 0.23 | -1.25 |
| DAS7 | 575 | 2.66 | 1.08 | 0.94 | 0.55 | -0.15 | -1.26 |
| DAS8 | 575 | 2.08 | 1.95 | 0.94 | 0.67 | 0.50 | -0.73 |
| DAS9 | 575 | 2.35 | 1.05 | 0.94 | 0.65 | 0.19 | -1.17 |
| DAS10 | 575 | 2.60 | 1.08 | 0.94 | 0.71 | -0.14 | -1.24 |
| DAS11 | 575 | 2.34 | 1.03 | 0.94 | 0.61 | 0.22 | -1.11 |
| DAS12 | 575 | 2.14 | 1.08 | 0.94 | 0.74 | 0.41 | -1.18 |
| DAS13 | 575 | 2.01 | 1.10 | 0.94 | 0.63 | 0.64 | -1.00 |
| DAS14 | 575 | 1.62 | 0.95 | 0.94 | 0.56 | 1.43 | 0.87 |
| DAS15 | 575 | 1.92 | 0.98 | 0.94 | 0.45 | 0.74 | -0.59 |
| DAS16 | 575 | 2.50 | 1.12 | 0.94 | 0.66 | -0.02 | -1.38 |
| DAS17 | 575 | 2.45 | 1.14 | 0.94 | 0.72 | 0.06 | -1.40 |
| DAS18 | 575 | 2.40 | 1.19 | 0.94 | 0.69 | 0.12 | -1.50 |
| DAS19 | 575 | 2.56 | 1.05 | 0.94 | 0.75 | -0.03 | -1.20 |
| DAS20 | 575 | 2.34 | 1.10 | 0.94 | 0.78 | 0.21 | -1.29 |
| DAS21 | 575 | 1.86 | 1.04 | 0.94 | 0.59 | 0.89 | -0.52 |
Table 2.
Reliability estimates for subscales.
| Subscales | No of items | Alpha (α) | 90% CI | |
|---|---|---|---|---|
| Depression | 7 | 0.83 | 0.81, 0.83 | |
| Anxiety | 7 | 0.85 | 0.83, 0.87 | |
| Stress | 7 | 0.87 | 0.85, 0.88 | |
| Overall DASS | 21 | 0.94 | 0.94, 0.95 | 0.95 |
Table 3.
Fit measures for the CFA model.
| n | χ2 | df | CFI | TLI | SRMR | RMSEA | |
|---|---|---|---|---|---|---|---|
| DASS-Y | 575 | 1148.917 | 186 | 0.860 | 0.840 | 0.055 | 0.095 (90% CI=0.090, 0.100) |
Table 4.
Item threshold estimates from the unidimensional Rasch PCM.
| Item | Cat1 Threshold | Cat2 Threshold | Cat3 Threshold |
|---|---|---|---|
| DAS1 | -0.61 | -1.71 | -3.47 |
| DAS2 | 1.41 | 1.38 | 0.52 |
| DAS3 | 0.53 | 0.09 | -1.03 |
| DAS4 | 0.05 | -0.52 | -1.84 |
| DAS5 | 0.48 | 0.33 | -0.79 |
| DAS6 | 0.76 | 0.55 | -0.29 |
| DAS7 | 1.52 | 1.74 | 1.40 |
| DAS8 | 0.79 | 0.07 | -1.64 |
| DAS9 | 1.03 | 0.85 | -0.13 |
| DAS10 | 1.19 | 1.62 | 0.97 |
| DAS11 | 1.13 | 0.86 | -0.17 |
| DAS12 | 0.17 | 0.00 | -1.22 |
| DAS13 | -0.17 | -0.66 | -1.67 |
| DAS14 | -0.89 | -2.42 | -3.43 |
| DAS15 | 0.10 | -0.73 | -2.41 |
| DAS16 | 0.82 | 1.06 | 0.52 |
| DAS17 | 0.74 | 0.81 | 0.32 |
| DAS18 | 0.33 | 0.39 | 0.07 |
| DAS19 | 1.48 | 1.58 | 0.92 |
| DAS20 | 0.75 | 0.56 | -0.15 |
| DAS21 | -0.36 | -1.20 | -2.38 |
Table 5.
Statistics for two dimensions in the multidimensional model.
| Variables | Dim1 | Dim2 | Dim3 |
|---|---|---|---|
| EAP Reliability | 0.93 | 0.93 | 0.93 |
| WLE reliability | 0.78 | 0.79 | 0.79 |
| SD | 1.27 | 1.30 | 1.30 |
| Regression coefficient | 1.96 | 1.96 | 1.96 |
| Correlations = Dim1.2= 0.98; Dim1.3=0.97 ; Dim2.3=0.98 | |||
Table 6.
Analysis of variance (ANOVA) for model comparison.
| Model | Loglike | Deviance | Npars | AIC | BIC | Chisq | df | p |
|---|---|---|---|---|---|---|---|---|
| Uni | -13076.58 | 26153.15 | 85 | 26323.15 | 26693.27 | 19.22968 | 5 | 0.00 |
| Multi | -13066.96 | 26133.92 | 90 | 26313.92 | 26705.81 |
Table 7.
Item location estimates.
| Dimensions | Item | Average Rating | Location | SE |
|---|---|---|---|---|
| Depression | DAS1 | 1.69 | 0.56 | .04 |
| DAS2 | 2.48 | -0.23 | .04 | |
| DAS3 | 2.17 | 0.06 | .04 | |
| DAS4 | 2.00 | 0.14 | .04 | |
| DAS5 | 2.23 | 0.01 | .04 | |
| DAS6 | 2.32 | -0.09 | .04 | |
| DAS7 | 2.66 | -0.45 | .04 | |
| Anxiety | DAS8 | 2.08 | 0.14 | .04 |
| DAS9 | 2.35 | -0.21 | .04 | |
| DAS10 | 2.60 | -0.44 | .04 | |
| DAS11 | 2.34 | -0.20 | .04 | |
| DAS12 | 2.14 | 0.03 | .04 | |
| DAS13 | 2.01 | 0.13 | .04 | |
| DAS14 | 1.62 | 0.55 | .04 | |
| Stress | DAS15 | 1.92 | 0.47 | .04 |
| DAS16 | 2.50 | -0.23 | .04 | |
| DAS17 | 2.45 | -0.19 | .04 | |
| DAS18 | 2.40 | -0.14 | .04 | |
| DAS19 | 2.56 | -0.29 | .04 | |
| DAS20 | 2.34 | -0.07 | .04 | |
| DAS21 | 1.86 | 0.46 | .04 |
Table 8.
Item category thresholds for the multidimensional Rasch PCM.
| Items | Cat1 Threshold | Cat2 Threshold | Cat3 Threshold |
|---|---|---|---|
| DAS1 | -8.32 | 2.21 | 2.73 |
| DAS2 | -6.66 | 0.99 | 2.40 |
| DAS3 | -7.35 | 1.56 | 2.54 |
| DAS4 | -7.93 | 1.96 | 2.60 |
| DAS5 | -7.62 | 1.67 | 2.30 |
| DAS6 | -7.05 | 1.49 | 2.45 |
| DAS7 | -6.43 | 1.10 | 2.36 |
| DAS8 | -7.78 | 1.21 | 2.77 |
| DAS9 | -7.27 | 1.32 | 2.54 |
| DAS10 | -6.84 | 1.39 | 2.16 |
| DAS11 | -7.28 | 1.20 | 2.62 |
| DAS12 | -7.66 | 1.94 | 2.32 |
| DAS13 | -7.85 | 2.19 | 2.55 |
| DAS14 | -8.42 | 2.50 | 3.21 |
| DAS15 | -7.59 | 1.58 | 2.56 |
| DAS16 | -6.67 | 1.54 | 2.15 |
| DAS17 | -6.73 | 1.59 | 2.27 |
| DAS18 | -6.86 | 1.94 | 2.23 |
| DAS19 | -6.47 | 0.97 | 2.34 |
| DAS20 | -6.88 | 1.46 | 2.43 |
| DAS21 | -7.61 | 2.05 | 2.60 |
Disclaimer/Publisher’s Note: The statements, opinions and data contained in all publications are solely those of the individual author(s) and contributor(s) and not of MDPI and/or the editor(s). MDPI and/or the editor(s) disclaim responsibility for any injury to people or property resulting from any ideas, methods, instructions or products referred to in the content. |
© 2025 by the authors. Licensee MDPI, Basel, Switzerland. This article is an open access article distributed under the terms and conditions of the Creative Commons Attribution (CC BY) license (http://creativecommons.org/licenses/by/4.0/).
Copyright: This open access article is published under a Creative Commons CC BY 4.0 license, which permit the free download, distribution, and reuse, provided that the author and preprint are cited in any reuse.


