
Submitted:
02 October 2025
Posted:
03 October 2025
You are already at the latest version
Abstract
Rotating packed beds (RPBs) have recently gained significant attention from researchers as a promising approach to intensify the performance of traditional packed columns. Although numerous lab-scale experimental and numerical studies on RPBs are available in the literature, there is a scarcity of operational data for large-scale RPBs. In this research, high gas flow rates in large-scale RPBs are investigated using CFD simulation to predict the dry pressure drop in a rotating bed. A 2D geometry with periodic boundary condition was applied to simulate the turbulent gas flow in a rotating packed bed. The simulation results offer valuable insights into the gas flow dynamics within rotating beds, highlight-ing the pressure and velocity variations that occur at high rotational speeds. A semiem-pirical correlation successfully replicated the results obtained in this study and can be uti-lized to predict the pressure drop in large-scale RPBs under operating conditions similar to those studied in this research.
Keywords:
CFD simulation
; rotating packed bed
; dry pressure drop
; large-scale application
1. Introduction
Packed columns are widely used gas-liquid contactors in industrial applications such as distillation, absorption, desorption, and extraction, playing a crucial role in many commercial chemical processes. Their significant share of the tower equipment market is attributed to advantages such as low pressure drop, high efficiency, and excellent control sensitivity. But one of the main drawbacks of the packed columns is their large size which makes their application limited particularly when the space limitation is a concern. Recently, rotating packed bed (RPB) has gained many attentions due to its potential to intensify the gas-liquid processes. Because of the rotation, RPBs can make very thin liquid film or small droplets even in micro scale and decrease the mass transfer resistance of liquid phase. Consequently, RPBs need smaller volume in comparison to conventional packed columns to achieve the same efficiency. While numerous recent studies have sought to clarify the complex turbulent gas-liquid interactions in RPBs, still further research is needed to address their limitations, particularly for large-scale applications.
A conventional RPB includes three main parts: the eye of the rotor where the liquid injectors and gas outlet are postured, rotating packed bed and the case of RPB. Figure 1 illustrates the design of a counter current flow RPB. Liquid is injected from the inner to the outer zone of the RPB, collected in the casing, and discharged through the liquid outlet. Gas enters from the outer region, flows counter-current to the liquid under high centrifugal force, and exits through the rotor eye. A hydrodynamic study of gas-liquid flow in RPBs can provide valuable insights into the underlying mechanisms. Pressure drop and flooding point can define the process limitation of RPB. Most of gas-liquid contactors use gas blower to overcome the pressure drop and an estimation of the pressure drop can define the energy requirement of the blower. The flooding point defines the capacity of the RPB, and operation close to this point is generally preferred, similar to conventional packed beds [1]. For design purpose, the height of RPB is defined by estimation of the flooding velocity. RPB should operate close but below the flooding point and the height is calculated according to this limitation [2].
1.1. Previous Experimental and Modelling Studies of Pressure Drop in RPBs
Various researchers have studied pressure drop in RPBs. Generally, pressure drop in RPB can be affected by three different sections: eye of the rotor, rotating bed and the stationary housing. The pressure drop in the stationary housing of RPB can be considered negligible in comparison to two other sections [3,4]. Hendry et al. [1] ran an experiment to measure the pressure at different points of an RPB and identified the pressure drop in each section. Their results demonstrated that the primary pressure drop takes place within the rotating bed, with the rotor eye exhibiting a substantially higher pressure drop compared to the stationary housing.
The effect of gas and liquid flows on pressure drop in RPB was discussed by many researchers. Keyvani and Gardner [5] found that counter current liquid flow in a rotating bed can decrease the pressure drop. Some researchers have reported that liquid flow has little effect on pressure drop [6]. In contrast, Zheng et al. [3] explained that the reduction in pressure drop due to liquid flow could be attributed to the gas flow changing from tangential to radial direction in the eye of the rotor, caused by the radial injection of liquid into the bed. Liu et al. [7] showed that the pressure drop in RPB is mainly affected by the gas flow rate. Sandilya et al. [4] defined the pressure drop in the rotating bed as a combination of centrifugal drop, frictional loss and pressure drop because of the gas momentum gain in the rotor. Their results indicated that the contribution of momentum gain to the overall pressure drop was negligible compared to the effects of centrifugal pressure drop and frictional loss. They also observed no significant difference between wet and dry pressure drop in the RPB.
Researchers have also proposed various semi-empirical correlations for predicting pressure drop in Rotating Packed Beds (RPBs). Although a wide range of such correlations exist in the literature, most have been developed based on lab-scale experimental setups. For instance, Liu et al. [7] proposed semiempirical correlations for dry and wet pressure drop in RPB with rectangular and elliptic cylindrical packings. They used a rotor featuring an inner radius of 4.5 cm, an outer radius of 7 cm, and a height of 2.5 cm, with plastic grains employed as the packing medium. They developed a correlation containing seven fitting parameters, derived based on both gas and rotational Reynolds numbers. Although this correlation accurately fitted the experimental data, its applicability to industrial scale RPBs is limited due to several factors. Firstly, the RPB used in their experiments was significantly smaller than typical industrial-scale units. Secondly, the packing material—plastic grains—differed from conventional RPB packing such as wire mesh. Thirdly, the use of seven fitting parameters complicates the interpretation of how individual resistance mechanisms contribute to the total pressure drop. Zheng et al. [3] utilized a rotor with metal foam packing, having an outer diameter of 0.3 m, and developed a pressure drop model for the RPB by solving mass and momentum balance equations. Although the model provides a detailed representation, it was formulated based on a small-scale RPB and requires the solution of differential equations, which restricts its ease of application, especially in large-scale or industrial scenarios. Neumann et al. [8] proposed a modified correlation for friction loss in RPBs. To determine the regression parameters of the model, rotors with different sizes and packing configurations were utilized. Their findings indicated that the regression parameters are dependent on both the rotor size and the type of packing material. In summary, the findings indicate that relying on correlations derived from lab-scale RPBs to estimate pressure drop in large-scale systems can result in significant inaccuracies. Consequently, the development of new correlations tailored to specific rotor size ranges is essential to ensure reliable and accurate predictions.
1.2. Application of CFD Simulation in RPB Analysis
Advances in CFD have made it a valuable tool to overcome limitations of experimental methods and to analyze gas–liquid flow dynamics effectively [9]. Although the packing geometry is highly complex, various researchers have attempted to model gas and liquid flow in RPBs through a range of simplifications. 2D approach is the most used simplification for RPB simulation. In this approach, the effect of upper and lower walls of RPB is neglected and a 2D geometry is considered. For example, a wire mesh packing is represented as vertical wires, enabling the use of a 2D geometry for analysis. Zhang et al. [10] investigated the liquid maldistribution in RPBs using 2D CFD simulation and showed that 2D simulation effectively captures the primary flow characteristics in RPBs and offer significant computational savings over 3D simulations. Liu et al. [11] applied computed tomography (CT) to acquire an image of nickel foam packing. They used the image to produce a 2D geometry of the packing for CFD simulation. They successfully simulated the liquid distribution in an RPB equipped with metal foam packing, and their results showed good agreement with high-speed camera imaging experiments. Some 3D CFD simulations are also available in the literature [9,12,13,14]. Previous studies have demonstrated that performing a 3D simulation of actual wire mesh packing significantly increases the computational cost. For example, Chen et al. [13] conducted a 3D simulation of gas flow in a lab-scale rotating packed bed. With inner and outer diameters of 4 cm and 7.6 cm, respectively, the simulation required over 35 million grid cells to achieve high accuracy. Similarly, Liu et al. [12] performed a 3D simulation of an RPB, with an inner diameter of 14.5 cm and an outer diameter of 32 cm, employing about 93 million grid cells in the packing area to simulate gas flow in rotating wire mesh packing.
Porous media approach is another possible simplification of the problem that can remarkably decrease the cost of CFD investigation. In this approach, the packing zone of the RPB is regarded as a porous media with uniform porosity. The interaction forces between gas, liquid and solid are imported in the momentum equation as a source term. Some drag force models are available for RPBs, but their validity depends heavily on factors such as packing type, bed porosity, and flow Reynolds number, as the model constants are typically derived from specific experimental datasets [15]. Recently some authors have applied the porous media approach to investigate fluid flow and mass transfer in RPBs. Lu et al. [16] have proposed a new multiphase drag model for porous media approach that could improve the result of previous models particularly for wire mesh packing. Zhang et al. [15] developed three multiphase drag force models based on the porous media assumption for wire mesh packing and showed their applicability to counter-current gas–liquid flow in RPBs. Their results indicated that the modeling error was less than 30%. They also claimed that the model is suitable for calculation of the pressure drop in RPB with wire mesh packing. Zhang et al. [17] developed an Eulerian porous media model by a new form of the porous resistance for 3D simulation of gas-liquid flow in RPB. Lu et al. [18] utilized a newly developed porous media model to conduct a 2D simulation of CO2 absorption using monoethanolamine (MEA) at varying concentrations. Zhang et al. [19] applied the porous media approach to simulate the CO2 post-combustion capture in RPB. They developed a full 3D Eulerian porous medium model for RPB based on a pilot-scale system and validated the results using available experimental data. However, they also noted that additional validation may be necessary when applying the model to different RPB configurations. Llerena-Chavez and Larachi [20] derived a CFD-based Ergun-type semi-empirical correlation for pressure drop in RPB. They considered the packing section as a uniform porous media and conducted a 3D CFD simulation of turbulent flow in RPB. Three case studies were considered based on the experimental works of Zheng et al. [3], Sandilya et al. [4] and Liu et al. [7], and the simulation results were validated against their respective data. However, since the CFD simulations were restricted to rotors with characteristics matching those in the referenced studies, the applicability of the developed correlation is limited to RPBs with comparable scales and packing configurations.
In Summary, the review of prior researches on pressure drop in RPBs underscores a lack of focus on large-scale systems. Correlations derived from lab-scale studies may be unreliable for industrial RPBs, as their regression parameters are sensitive to rotor size and packing characteristics. Studies consistently showed that gas flow is the primary contributor to pressure drop, while the effect of liquid flow is generally minimal. Given the scarcity of experimental data for large-scale RPBs, CFD simulation offers a valuable alternative for exploring gas flow behavior in such systems.
In this research, high velocity gas flow in large-scale RPB is investigated by CFD simulation. As the drag force models available in the literature are based on lab-scale experimental data, it was not possible to trust them for simulation of large-scale system. Therefore, the porous media approach was deemed inappropriate for the current investigation. The wire mesh packing, widely regarded as the standard packing in RPBs, was chosen and its geometric details were incorporated into the simulation to accurately capture the gas flow dynamics. To minimize computational expense, a two-dimensional domain was utilized for the simulations. Initially, the simulation was run for a lab-scale RPB according to the available experimental data to check the validity of the result. Subsequently, simulations were extended to larger rotors with an increased number of wires. The pressure drop was calculated for different operating conditions in two different packing geometries. Finally, the parameters of an existing semi-empirical correlation were updated to improve its applicability to large-scale RPBs.
2. Geometry and Mesh Generation
There are some investigations available in the literature which have considered the detailed geometries of the packing in RPB instead of porous media approach. However, their geometries deviate significantly from those of industrial-scale RPBs, limiting applicability to large-scale systems. The packing should have high porosity while benefits from high specific surface area to improve the efficiency of the gas-liquid contactor. To accurately model wire mesh packing for industrial RPB applications, a large number of wires must be included, which significantly increases the complexity of geometry and mesh generation. The 3D simulation of gas flow in the large-scale RPB required hundreds of millions of grid cells, making the computation highly expensive. Even a thin slice of the 3D geometry, containing a single row of wires in the radial direction, demanded over one hundred million grid cells. As such a thin slice was unlikely to yield realistic results, a 2D simulation was chosen to include more wires and better capture their effects on gas flow. Under the 2D assumption, horizontal wires could not be included. The vertical wire thickness and number were calculated to match the porosity and specific surface area of the industrial packing. Equations (1) and (2) were solved together to calculate nw and Rw which are number and radius of the wires, respectively.
For example, a rotating bed with an inner radius of 0.2 m, an outer radius of 0.5 m, a porosity of 0.91, and a specific surface area of 1440 m2/m3 would require approximately 1.2 million vertical wires, each with a diameter of 0.25 mm. To simplify the geometry and reduce simulation costs, the 2D geometry was divided into 36 slices, and only a 10-degree segment of the annulus was considered for the simulation. Figure 2 illustrates the simplification of the geometry. To maintain homogeneous porosity in the bed, the pitch of the wires was set equal for all the wires. As shown in the figure, to simplify the geometry to a 10-degree segment, the distance between the wires in each row was adjusted to enable the use of periodic boundary conditions. This adjustment, however, resulted in less than 1% variation in the domain porosity. The geometry was generated using Ansys SpaceClaim 2023 R1, and a Python script was written within the software to define the position of each wire in the domain. Finally, the geometry was meshed using an unstructured grid, with a boundary mesh applied near the wire walls to enhance calculation accuracy in the wall-adjacent regions. Figure 3 shows the meshed geometry used for the simulation.
3. Simulation Method
CFD simulation was run using Ansys Fluent 2023 R1 to investigate the gas flow in a rotating packed bed. As can be seen in Figure 3, velocity inlet and periodic boundary conditions were applied. Because the outlet pressure of the rotating bed was not known, the outflow boundary condition was considered in the eye of the rotor which allows the software to calculate it according to the inlet condition.
The SIMPLE algorithm was employed to resolve the pressure-velocity coupling. The second-order upwind scheme was used for the discretization of the momentum equation, offering greater accuracy for triangular grids compared to the first-order upwind scheme. Presto was selected for pressure discretization that is suitable for high-speed rotating flows. The Realizable k-ε model has been extensively validated for a wide range of flow conditions, including rotational flows, boundary layers with strong adverse pressure gradients, flow separation, and recirculating flows. Previous studies have further confirmed its effectiveness in accurately simulating turbulent flow within RPBs [12,13,14]. Therefore, in this research, the turbulent gas flow within the rotating bed was represented using the Realizable k-ε model. The rotational motion was addressed through the rotating reference frame method. The turbulent kinetic energy and turbulent dissipation rate equations were discretized using the first-order upwind scheme, which enhances solution convergence while maintaining acceptable accuracy. The 2D unsteady-state simulation was initially run with a time step of 10-6 and as the simulation progressed, the time step was incrementally increased. For near-wall modelling of the gas flow, the enhanced wall treatment method was employed and y+ for all the simulations was checked to be around 1 and less than 5. The mesh independency of the calculation was confirmed by comparing the pressure drop results across different grid densities. This comparison ensured that further increasing the number of grids results in less than 5% variation in the calculated pressure drop. For the large-scale RPB, the geometry was meshed with grid counts of 2,872,554; 3,970,904; 4,863,787; 5,770,223; 7,023,050; and 8,499,751. Increasing the number of grids beyond 7,023,050 did not lead to any significant variation in the results.
4. Validation of the Simulation Result
The simulation was first conducted based on existing experimental data from the literature. Pressure drop in a rotating bed with wire mesh packing has been reported by Sandilya et al. [4]. They ran an experimental analysis of the pressure drop in a rotating bed with internal diameter of 6 cm and external diameter of 31 cm. The porosity and specific surface area of the packing were 0.91 and 2196 m2/m3. Figure 4 shows the comparison of the simulation result with experimental data for pressure drop variation with gas flow rate and rotating speed. As can be seen in the figure, the simulation results are able to predict the experimental trends with acceptable accuracy. The maximum deviation between the simulation results and experimental data was 27% and 20% for rotating speeds of 950 and 1420 RPM, respectively. However, this discrepancy decreased as the gas flow rate increased. The model predicted a slightly lower slope for the variation of pressure drop with increasing gas flow rate. This discrepancy can be explained by the assumptions made in the model, such as neglecting the pressure drop in the rotor eye and casing, or the use of a 2D geometry that omits the influence of horizontal wires. As demonstrated in the following section, the pressure drop in the rotor eye and casing is negligible. Therefore, the lower predicted slope of pressure drop with flow rate is primarily attributed to the 2D assumption of wire mesh packing.
To check the accuracy of the 2D model at high gas flow rates, a 3D simulation was also carried out. A thin slice of the bed with low specific surface area was chosen for the 3D case to reduce the computational cost. The corresponding 2D and 3D geometries are shown in Figure 5. The wire diameters were 4.00 mm (3D) and 4.34 mm (2D) to maintain comparable packing fractions in the two representations. The inlet velocity was 7 m/s for both geometries. The bed inner and outer diameters are 60 and 70 cm, respectively, and the bed height is 5 cm. Figure 6 compares the velocity distributions from 2D and 3D simulations. Near the vertical wires, both models show similar velocity ranges and patterns, while notable differences appear around the horizontal wires in the 3D case. The flow vectors confirm these general similarities. To address the main objective of predicting pressure drop, the overall pressure losses of the 2D and 3D geometries with equal porosity and specific surface area should be analyzed. Figure 7 presents pressure variation for 2D and 3D geometries. Although the spatial pressure distributions differ — reflecting differences in packing geometry between the two cases — the overall pressure drop across the bed is similar, with only a small difference.
5. Large-Scale RPB Simulation
Two different rotating beds were considered for simulation of the gas flow in large-scale RPBs. Table 1 explains the characteristics of each case study. The total number of vertical wires, denoted as nw, is divided by 36 to determine the number of vertical wires in the 2D segment used for the simulation. For each case study, the gas inlet velocity ranged from 4 to 10 m/s, while the rotating speed varied between 700 and 1500 RPM. Atmospheric air was selected as the working gas flowing through the RPB. The number of grids applied for simulation of case 1 and 2 were 7023050 and 4863787, respectively.
6. Result and Discussion
6.1. Dry Pressure Drop in the Case and Eye of the Rotor
To investigate the effect of gas flow within the housing of the rotating bed, an additional simulation was conducted by incorporating two free zones representing the casing and the gas outlet. The primary objective of this research is to estimate the pressure drop within the packing zone. However, to ensure that the pressure drop in the RPB’s case is negligible compared to that in the rotating bed, the gas flow within the housing was also simulated. Figure 8 shows the variation of pressure in the case and eye of the rotor in comparison with the rotating bed. As shown in the figure, the pressure drops in the casing and rotor eye are significantly lower than the rotating bed, supporting the assumption that pressure losses in these regions are negligible. In the rotor casing, the gas flow is primarily radial before reaching the rotating bed. Figure 8 also presents the variation of tangential velocity within the RPB. While the tangential velocity is low in the rotor casing, it increases significantly after the gas interacts with the initial rows of wire mesh packing. In the rotating bed, the Coriolis force increases the gas tangential velocity, while the drag exerted by the wire packing opposes this motion. Consequently, the gas closely follows the bed rotation, with angular velocity remaining nearly constant and tangential velocity decreasing as it moves through the bed. In contrast, within the eye of the rotor, the absence of drag force allows the Coriolis effect to increase the tangential velocity of the gas as it moves towards the outlet. The resulting increase in the tangential velocity contributes to a higher pressure drop in the rotor eye compared to the casing [21].
In a real RPB design, the gas flow in the eye of the rotor is more complicated because of a 90º bend of the outlet pipe and the liquid distributor. However, due to the 2D approach of the simulation it was not possible to consider the real geometry and only the Coriolis effect on the pressure drop was approximated.
6.2. Dry Pressure Drop in the Rotating Bed
In a rotating packed bed, the pressure drop is typically attributed to three primary factors: the pressure difference generated by centrifugal force, frictional loss, and the pressure reduction associated with the momentum gain of the converging flow [21]. To evaluate the impact of each resistance on the overall pressure drop, simulations were conducted on three distinct bed configurations: a rotating packed bed, a stationary packed bed, and a stationary empty bed. When the specific surface area of the packing is high, frictional loss may become significant, making it the dominant factor in the overall pressure drop. However, increasing the rotational speed can further emphasize the influence of centrifugal forces on the pressure drop.
Figure 9 presents a comparison of the pressure variations across three different bed configurations. The figure demonstrates that the pressure variation in the gas flow through a stationary empty bed, influenced solely by momentum gain due to converging flow, is minimal compared with that in the packed bed. For instance, at a rotational speed of 1100 RPM and inlet velocity of 5 m/s, the contribution of momentum gains accounts for less than 1% of the total pressure drop, whereas frictional and centrifugal pressure drops contribute approximately 82.3% and 17.7%, respectively. These findings clearly indicate that frictional loss is the dominant factor, while the influence of momentum gain is negligible. The relative contribution of frictional loss increases with radial velocity, as centrifugal loss remains constant. Figure 9 shows that increasing the gas velocity from 5 to 10 m/s significantly raises the proportion of the frictional pressure drop. At 10 m/s, frictional resistance accounts for 97.4% of the overall pressure drop. These results demonstrate that, at high gas flow rates, the overall pressure drop is predominantly controlled by frictional effects.
As the gas enters the rotating bed, it interacts with the first rows of wires, leading to a boost in kinetic energy and an increase in dynamic pressure. Figure 10a compares the variation of the total pressure by increasing the rotating speed. When the rotating speed exceeds 900 RPM, the total pressure experiences a peak near the gas inlet. At these high rotating speeds, the gas rapidly gains kinetic energy as it interacts with the wires. This increase in kinetic energy results in a significant rise in dynamic pressure that surpasses the pressure losses typically associated with the flow resistance within the rotating bed. So, total pressure variation in the high-speed rotating bed reaches a maximum after interaction with wire. Variation of the total pressure by increasing the inlet velocity is also illustrated in Figure 10b. As can be seen in this figure, the peak in total pressure is disappeared by increasing the inlet velocity. When the inlet velocity is 10 m/s, the gas enters the bed with significant kinetic energy. This energy does not increase substantially through interaction with the wires, leading to a situation where the dynamic pressure does not rise sufficiently to overcome the pressure loss within the bed. Therefore, the increase of velocity inlet minimizes the total pressure peak.
Under the opposing effects of Coriolis and drag forces, the gas has approximately the same velocity as the packing. In a stationary packed bed, gas velocity typically increases from the inlet to the outlet due to the converging flow. In contrast, within a rotating bed, the gas velocity reaches its peak shortly after interacting with the initial rows of rotating wires. Since the rotational effects significantly outweigh the momentum gain from the converging flow, the gas velocity decreases as it moves from the larger-radius section of the bed toward the rotor eye in the RPB.
Figure 11 illustrates the variation of velocity in the rotating beds in comparison to a stationary bed. As can be seen from the figure, by increasing the rotating speed the maximum gas velocity shifts closer to the gas inlet. In contrast, in the stationary bed the maximum velocity occurs in the gas outlet. The rotating speed also has a remarkable effect on the maximum velocity magnitude of the gas as it rises from 52 to 87 m/s by increasing the rotating speed from 700 to 1500 RPM.
Earlier studies have established that the gas flow within a rotating bed primarily follows a tangential pattern [12]. Researchers have also indicated that the radial injection of the liquid in the eye of the rotor can destroy the tangential pattern of the gas flow, and this effect leads to a decrease in pressure drop which is directly related to the tangential velocity of the system [3,21]. The simulations indicate that in large-scale RPBs, high-velocity gas injected radially can follow a near-radial path, especially near the outlet where the radius is smaller and centrifugal force is reduced. Figure 12 illustrates the gas flow vectors passing multiple circles in the rotating bed with various rotating speeds and inlet velocities. At an inlet velocity of 10 m/s and a rotational speed of 700 RPM, the maximum gas velocity remains close to the inlet value, indicating that the flow is primarily driven by the pressure gradient rather than centrifugal effects. In contrast, at inlet velocity of 5 m/s and rotational speed of 1500 RPM, the pressure gradient is insufficient to sustain a radial pattern, and the gas flow becomes increasingly governed by rotor motion, exhibiting predominantly tangential vectors.
Near the gas outlet, the smaller radius reduces centrifugal influence, resulting in a weaker tangential component of the flow. Comparison of maximum velocity magnitudes (Figure 12) further shows that inlet velocity has little effect on the peak velocity, which is largely determined by the rotational speed.
As the flow near the rotor eye becomes radial, liquid injection is unlikely to affect the pressure drop, aligning with prior findings that associate its reduction with suppressed tangential gas motion.
6.3. CFD-Aided Pressure Drop Correlation
To enable the use of CFD results in future RPB modelling, a correlation for pressure drop was fitted to the CFD result. This correlation provides a simplified mathematical expression that relates the key variables affecting pressure drop within the RPB, such as rotational speed, gas flow rate, and bed geometry. By fitting the correlation to the CFD results, the model captures the complex interactions within the RPB, offering a practical tool for predicting pressure drops under various operational conditions. The correlation can aid in the design and optimization of RPB systems by providing a quick and reliable method for estimating pressure losses. Table 2 shows the simulation result for pressure drop in RPB with characteristics of case 1 and 2.
Given the negligible influence of momentum gain from the converging flow in the RPB (Figure 9), the pressure drop was attributed to a combination of frictional resistance and centrifugal force as suggested in previous works. Mackowiak’s correlation [22], applicable to both random and structured packings, was used to evaluate frictional pressure drop in a static bed. Derived from the extended channel model for dry packed beds, it is expressed as:
Where K represents the wall factor, which equals 1 for structured packing. In the original work [22], the resistance factor was defined by following correlation:
Reg is the modified Reynolds number of the gaseous phase described by:
The gas capacity factor, Fg = ug is defined by radially averaging the gas velocity ug across the packing as follows [8]:
φ on Eq. (3) in the original paper was defined as a form factor, although it was used as a fitting numerical parameter. For example, Neumann et al. [8] were the first applied Eq. (3) to rotating packed beds, reporting φ values of 0.32 and 0.35 for two distinct wire mesh packing configurations.
The term
in Eq. (3) is an overall friction factor coefficient. Figure 13 illustrates how this coefficient varies with the Reynolds number for our simulation. The figure clearly shows that the calculated friction factor remains essentially constant with increasing Reynolds number, which is expected since the system operates within the inertial flow regime at high Reynolds numbers. Calculated friction factors can still be represented by a numerical expression of the type used by Neumann et al. [8], Eq. (4), even for our case. This is due to the fact that for high Reynolds numbers, let say larger than 1000, is essentially independent of Reg. However, unlike the original suggestion, the fitting value of the parameter φ had to be adjusted to 0.57, most likely due to differences in rotor size and packing characteristics.
The pressure drop due to centrifugal force is commonly evaluated through the following correlation:
which indicates a linear relationship between . The pressure drop due to centrifugal effects was estimated by subtracting the static bed pressure drop from that of the rotating bed. Figure 14 fully supports the prediction of Eq. (9), with only a marginal difference in the slope between the two cases studied. This difference can be attributed to the variation in the rotor size as also reported in [9]. An average value of parameter A equal to 1.28 was adopted to adequately represent both case studies. Neumann et al. [8] previously reported this parameter within the range of 0.85–0.89. Again, the difference in PBR size and flow regime can be invocated to justify the discrepancy.
On summary, the pressure drop in the RPB is described using a CFD-based correlation that accounts for both frictional and centrifugal effects, as follows:
Figure 15 presents a comparison between CFD results and the proposed correlation for the pressure drop in a rotating packed bed. As shown in the figure, there is an excellent agreement across various case studies and operating conditions.
It is important to note that the proposed correlation was derived from CFD simulations that incorporated certain simplifications to reduce computational cost. In particular, the geometry did not fully replicate conventional wire mesh packings containing both vertical and horizontal wires and is therefore more representative of packings composed solely of vertical wires. Nevertheless, even without explicitly accounting for packing shape, the correlation provides a reasonable estimation of pressure drop in rotating beds with porosity and specific surface area values within the studied range. Due to the absence of experimental data, the limits of valid extrapolation cannot be precisely defined. However, the correlation is expected to reliably estimate the dry pressure drop for packings with porosity in the range of 0.85–0.91 and specific surface areas between 1400 and 1800, provided that the rotor diameter does not deviate significantly from 1 m. As noted in the introduction, most authors have reported that liquid flow has an insignificant effect on the overall pressure drop. However, some studies indicated a reducing effect of liquid flow, particularly in the eye of the rotor where the liquid is injected radially and may interfere with the tangential gas flow. It is anticipated that a high liquid flow rate in the rotor eye could reduce the pressure drop, especially when the eye diameter is large. Due to the lack of experimental data, however, the applicable range of eye size and liquid flow rate cannot be defined here. This effect is therefore expected only in the rotor eye where liquid flow is radial. Once the liquid enters the rotating bed, its motion is dominated by rotation, and its influence on the pressure drop becomes negligible. Consequently, the results reported here can be considered reliable for the rotating section of the bed.
7. Conclusion
In this research, high gas flow in large-scale RPB was investigated using CFD simulation. A 2D simplification was employed to reduce computational costs and provide a practical model for industrial RPBs. In the absence of large-scale experimental data, the simulation was validated against available lab-scale measurements from the literature. Simulations were then extended to large-scale RPBs to analyze velocity and pressure distributions in the rotating bed and stationary housing. Given the negligible pressure drop in the stationary housing, the simulations focused solely on the rotating bed. CFD results showed that overall pressure drop was dominated by friction losses, with a secondary contribution from centrifugal effects. At higher gas flow rates, frictional losses intensified, making centrifugal effects negligible at rotation speeds below 1000 RPM. A two-parameter semi-empirical correlation was finally fitted to the CFD results to model the pressure drop in a rotating bed. This correlation is intended to aid future research on industrial-scale RPBs, particularly under operating conditions similar to those investigated in this study.
Author Contributions
Conceptualization, S.H. and R.D.F.; methodology, S.H.; software, S.H.; validation, S.H.; formal analysis, S.H. and R.D.F.; investigation, S.H. and R.D.F.; resources, R.D.F.; data curation, S.H. and R.D.F.; writing—original draft preparation, S.H.; writing—review and editing, R.D.F.; supervision, R.D.F.; project administration, R.D.F. All authors have read and agreed to the published version of the manuscript.
Funding
This research was funded by the Italian Ministry of University and Research within the National Operational Programme on Research and Innovation 2014-2020 (PON), Axis IV “Education and research for recovery” with reference to Action IV.4 “Doctorates and research contracts on innovation topics” and Action IV.5 “Doctorates on green topics”. DM 1061/2021.
Data Availability Statement
The data presented in this study was generated by the authors and is available on request.
Conflicts of Interest
The authors declare no conflicts of interest.
Abbreviations
The following abbreviations are used in this manuscript:
| ap | Specific surface area (m2/m3) |
| Di | Inner diameter of the rotor (m) |
| Do | Outer diameter of the rotor (m) |
| Dw | Wire diameter (m) |
| dp | Equivalent spherical diameter, particle diameter, m |
| f | Friction factor |
| Fg | Gas capacity factor, Pa0.5 |
| H | Height of the rotating bed |
| nw | Number of wires |
| P | Pressure (Pa) |
| Qg | Gas volume flow rate (m3/s) |
| Ri | Inner radius of the bed (m) |
| Ro | Outer radius (m) |
| Rw | Wire radius (m) |
| Reg | Gas Reynolds number |
| Uinlet | Inlet velocity (m/s) |
| Greek Letters | |
| ∆P | Pressure drop (Pa) |
| ε | Porosity |
| ρg | Gas density (m3/s) |
| Ψ0 | Resistance coefficient for single-phase flow for classical, non-perforated packing elements such as ceramic Raschig rings |
| ω | Angular velocity (rad/s) |
| μg | Gas Dynamic viscosity (kg/ms) |
References
- Hendry, James R., Jonathan G.M. Lee, and Pierrot S. Attidekou. 2020. Pressure drop and flooding in rotating packed beds. Chemical Engineering and Processing - Process Intensification 151. Elsevier B.V. [CrossRef]
- Agarwal, Lava, V. Pavani, D. P. Rao, and N. Kaistha. 2010. Process intensification in HiGee absorption and distillation: Design procedure and applications. Industrial and Engineering Chemistry Research 49: 10046–10058. [CrossRef]
- Zheng, Chong, Kai Guo, Yuanding Feng, Cun Yang, and Nelson C. Gardner. 2000. Pressure drop of centripetal gas flow through rotating beds. Industrial and Engineering Chemistry Research 39. ACS: 829–834. [CrossRef]
- Sandilya, Pavitra, D. P. Rao, A. Sharma, and G. Biswas. 2001. Gas-phase mass transfer in a centrifugal contactor. Industrial and Engineering Chemistry Research 40. ACS: 384–392. [CrossRef]
- Keyvani, Majid, and Nelsonc Gardner. DE92 _i9661 I OPERATING CHARACTERJSTICS OF ROTATING BEDS.
- Kelleher, Trevour, and James R Fair. 1996. Distillation Studies in a High-Gravity Contactor.
- Liu, Hwai-Shen, Chia-Chang Lin, Sheng-Chi Wu, and Hsien-Wen Hsu. 1996. Characteristics of a Rotating Packed Bed.
- Neumann, Kolja, Sira Hunold, Mirko Skiborowski, and Andrzej Górak. 2017. Dry Pressure Drop in Rotating Packed Beds - Systematic Experimental Studies. Industrial and Engineering Chemistry Research 56. American Chemical Society: 12395–12405. [CrossRef]
- Zhang, Wei, Peng Xie, Yuxing Li, Lin Teng, and Jianlu Zhu. 2021. 3D CFD simulation of the liquid flow in a rotating packed bed with structured wire mesh packing. Chemical Engineering Journal 427. Elsevier B.V. [CrossRef]
- Zhang, Wei, Peng Xie, Yuxing Li, Lin Teng, and Jianlu Zhu. 2020. CFD analysis of the hydrodynamic characteristics in a rotating packed bed with multi-nozzles. Chemical Engineering and Processing - Process Intensification 158. Elsevier B.V. [CrossRef]
- Liu, Yi, Wei Wu, Yong Luo, Guang Wen Chu, Wei Liu, Bao Chang Sun, and Jian Feng Chen. 2019. CFD Simulation and High-Speed Photography of Liquid Flow in the Outer Cavity Zone of a Rotating Packed Bed Reactor. Industrial and Engineering Chemistry Research 58. American Chemical Society: 5280–5290. [CrossRef]
- Liu, Yi, Yong Luo, Guang Wen Chu, Jiang Zhou Luo, Moses Arowo, and Jian Feng Chen. 2017. 3D numerical simulation of a rotating packed bed with structured stainless steel wire mesh packing. Chemical Engineering Science 170. Elsevier Ltd.: 365–377. [CrossRef]
- Chen, Wen Cong, Wen Hao Meng, Zhi Hao Liu, Guang Wen Chu, Liang Liang Zhang, and Jian Feng Chen. 2022. Hydrodynamics of gas flow in a rotating packed bed under floating motions: Experimental and simulation study. Chemical Engineering Journal 442. Elsevier B.V. [CrossRef]
- Guo, Tian Yu, Kun Peng Cheng, Li Xiong Wen, Ronnie Andersson, and Jian Feng Chen. 2017. Three-Dimensional Simulation on Liquid Flow in a Rotating Packed Bed Reactor. Industrial and Engineering Chemistry Research 56. American Chemical Society: 8169–8179. [CrossRef]
- Zhang, Wei, Peng Xie, Yuxing Li, and Jianlu Zhu. 2022. Modeling of gas–liquid flow in a rotating packed bed using an Eulerian multi-fluid approach. AIChE Journal 68. John Wiley and Sons Inc. [CrossRef]
- Lu, X., P. Xie, D. B. Ingham, L. Ma, and M. Pourkashanian. 2018. A porous media model for CFD simulations of gas-liquid two-phase flow in rotating packed beds. Chemical Engineering Science 189. Elsevier Ltd.: 123–134. [CrossRef]
- Zhang, Guojun, Derek Ingham, Lin Ma, and Mohamed Pourkashanian. 2022. Modelling of 3D liquid dispersion in a rotating packed bed using an Eulerian porous medium approach. Chemical Engineering Science 250. Elsevier Ltd. [CrossRef]
- Lu, X., P. Xie, D. B. Ingham, L. Ma, and M. Pourkashanian. 2019. Modelling of CO2 absorption in a rotating packed bed using an Eulerian porous media approach. Chemical Engineering Science 199. Elsevier Ltd.: 302–318. [CrossRef]
- Zhang, Guojun, Lin Ma, and Mohamed Pourkashanian. 2023. A porous medium approach to the 3D modelling of an entire rotating packed bed for post-combustion carbon capture. Chemical Engineering Science 274. Elsevier Ltd. [CrossRef]
- Llerena-Chavez, Hugo, and Faïçal Larachi. 2009. Analysis of flow in rotating packed beds via CFD simulations-Dry pressure drop and gas flow maldistribution. Chemical Engineering Science 64: 2113–2126. [CrossRef]
- Rao, D. P., A. Bhowal, and P. S. Goswami. 2004. Process Intensification in Rotating Packed Beds (HIGEE): An Appraisal. Industrial and Engineering Chemistry Research 43. American Chemical Society: 1150–1162. [CrossRef]
- Maćkowiak, J. 2009. Extended channel model for prediction of the pressure drop in single-phase flow in packed columns. Chemical Engineering Research and Design 87: 123–134. [CrossRef]
Figure 1.
Schematic view of gas-liquid flow in an RPB.
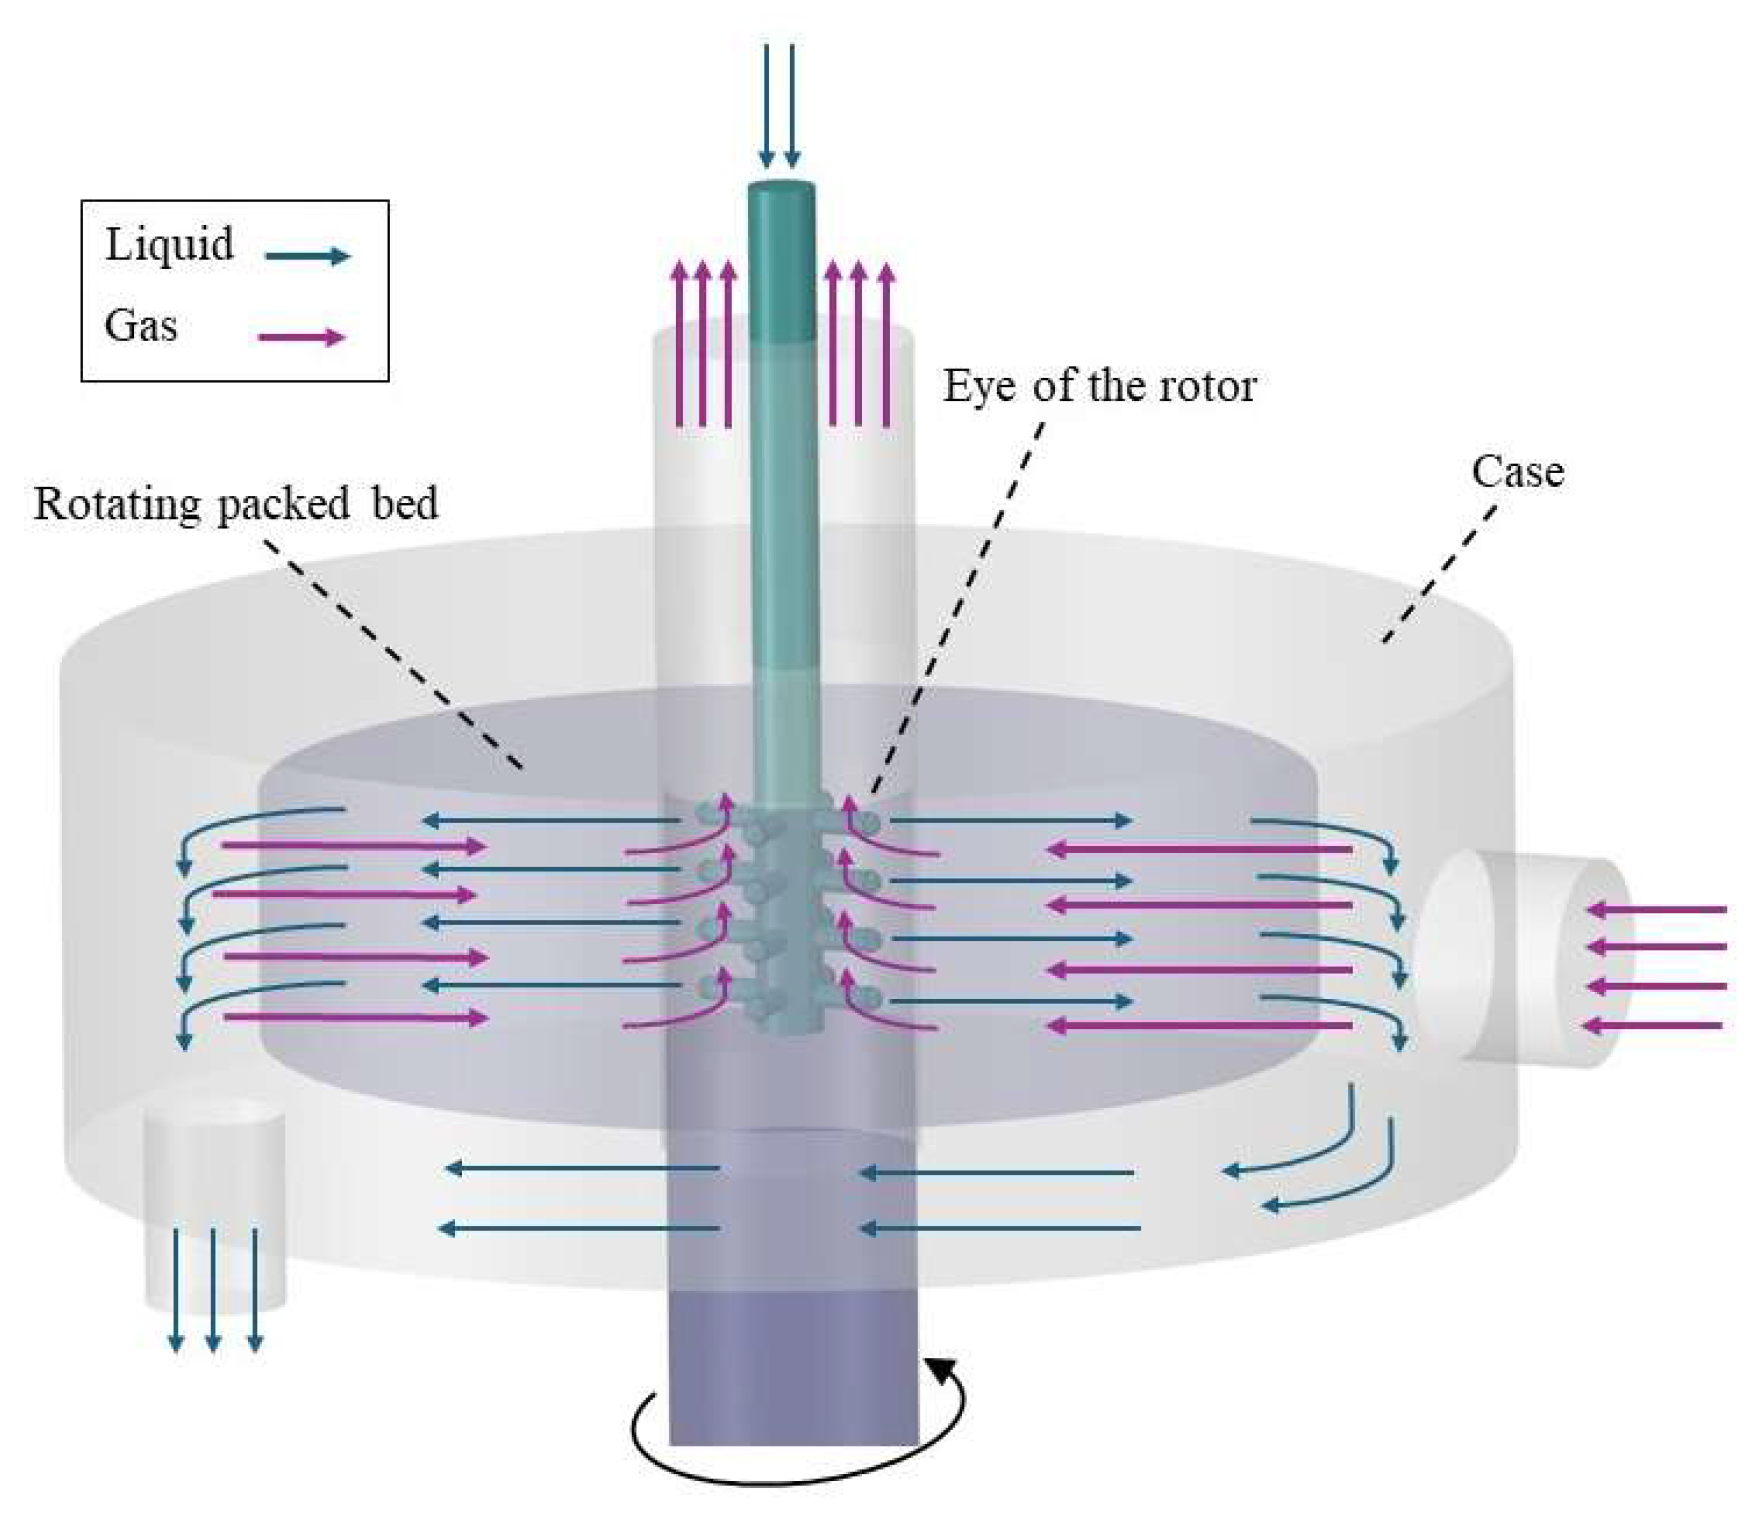
Figure 2.
Simplification of the geometry for CFD simulation: Note that the real geometry includes a much higher number of wires, and this figure is only intended to illustrate the wire arrangement.
Figure 2.
Simplification of the geometry for CFD simulation: Note that the real geometry includes a much higher number of wires, and this figure is only intended to illustrate the wire arrangement.
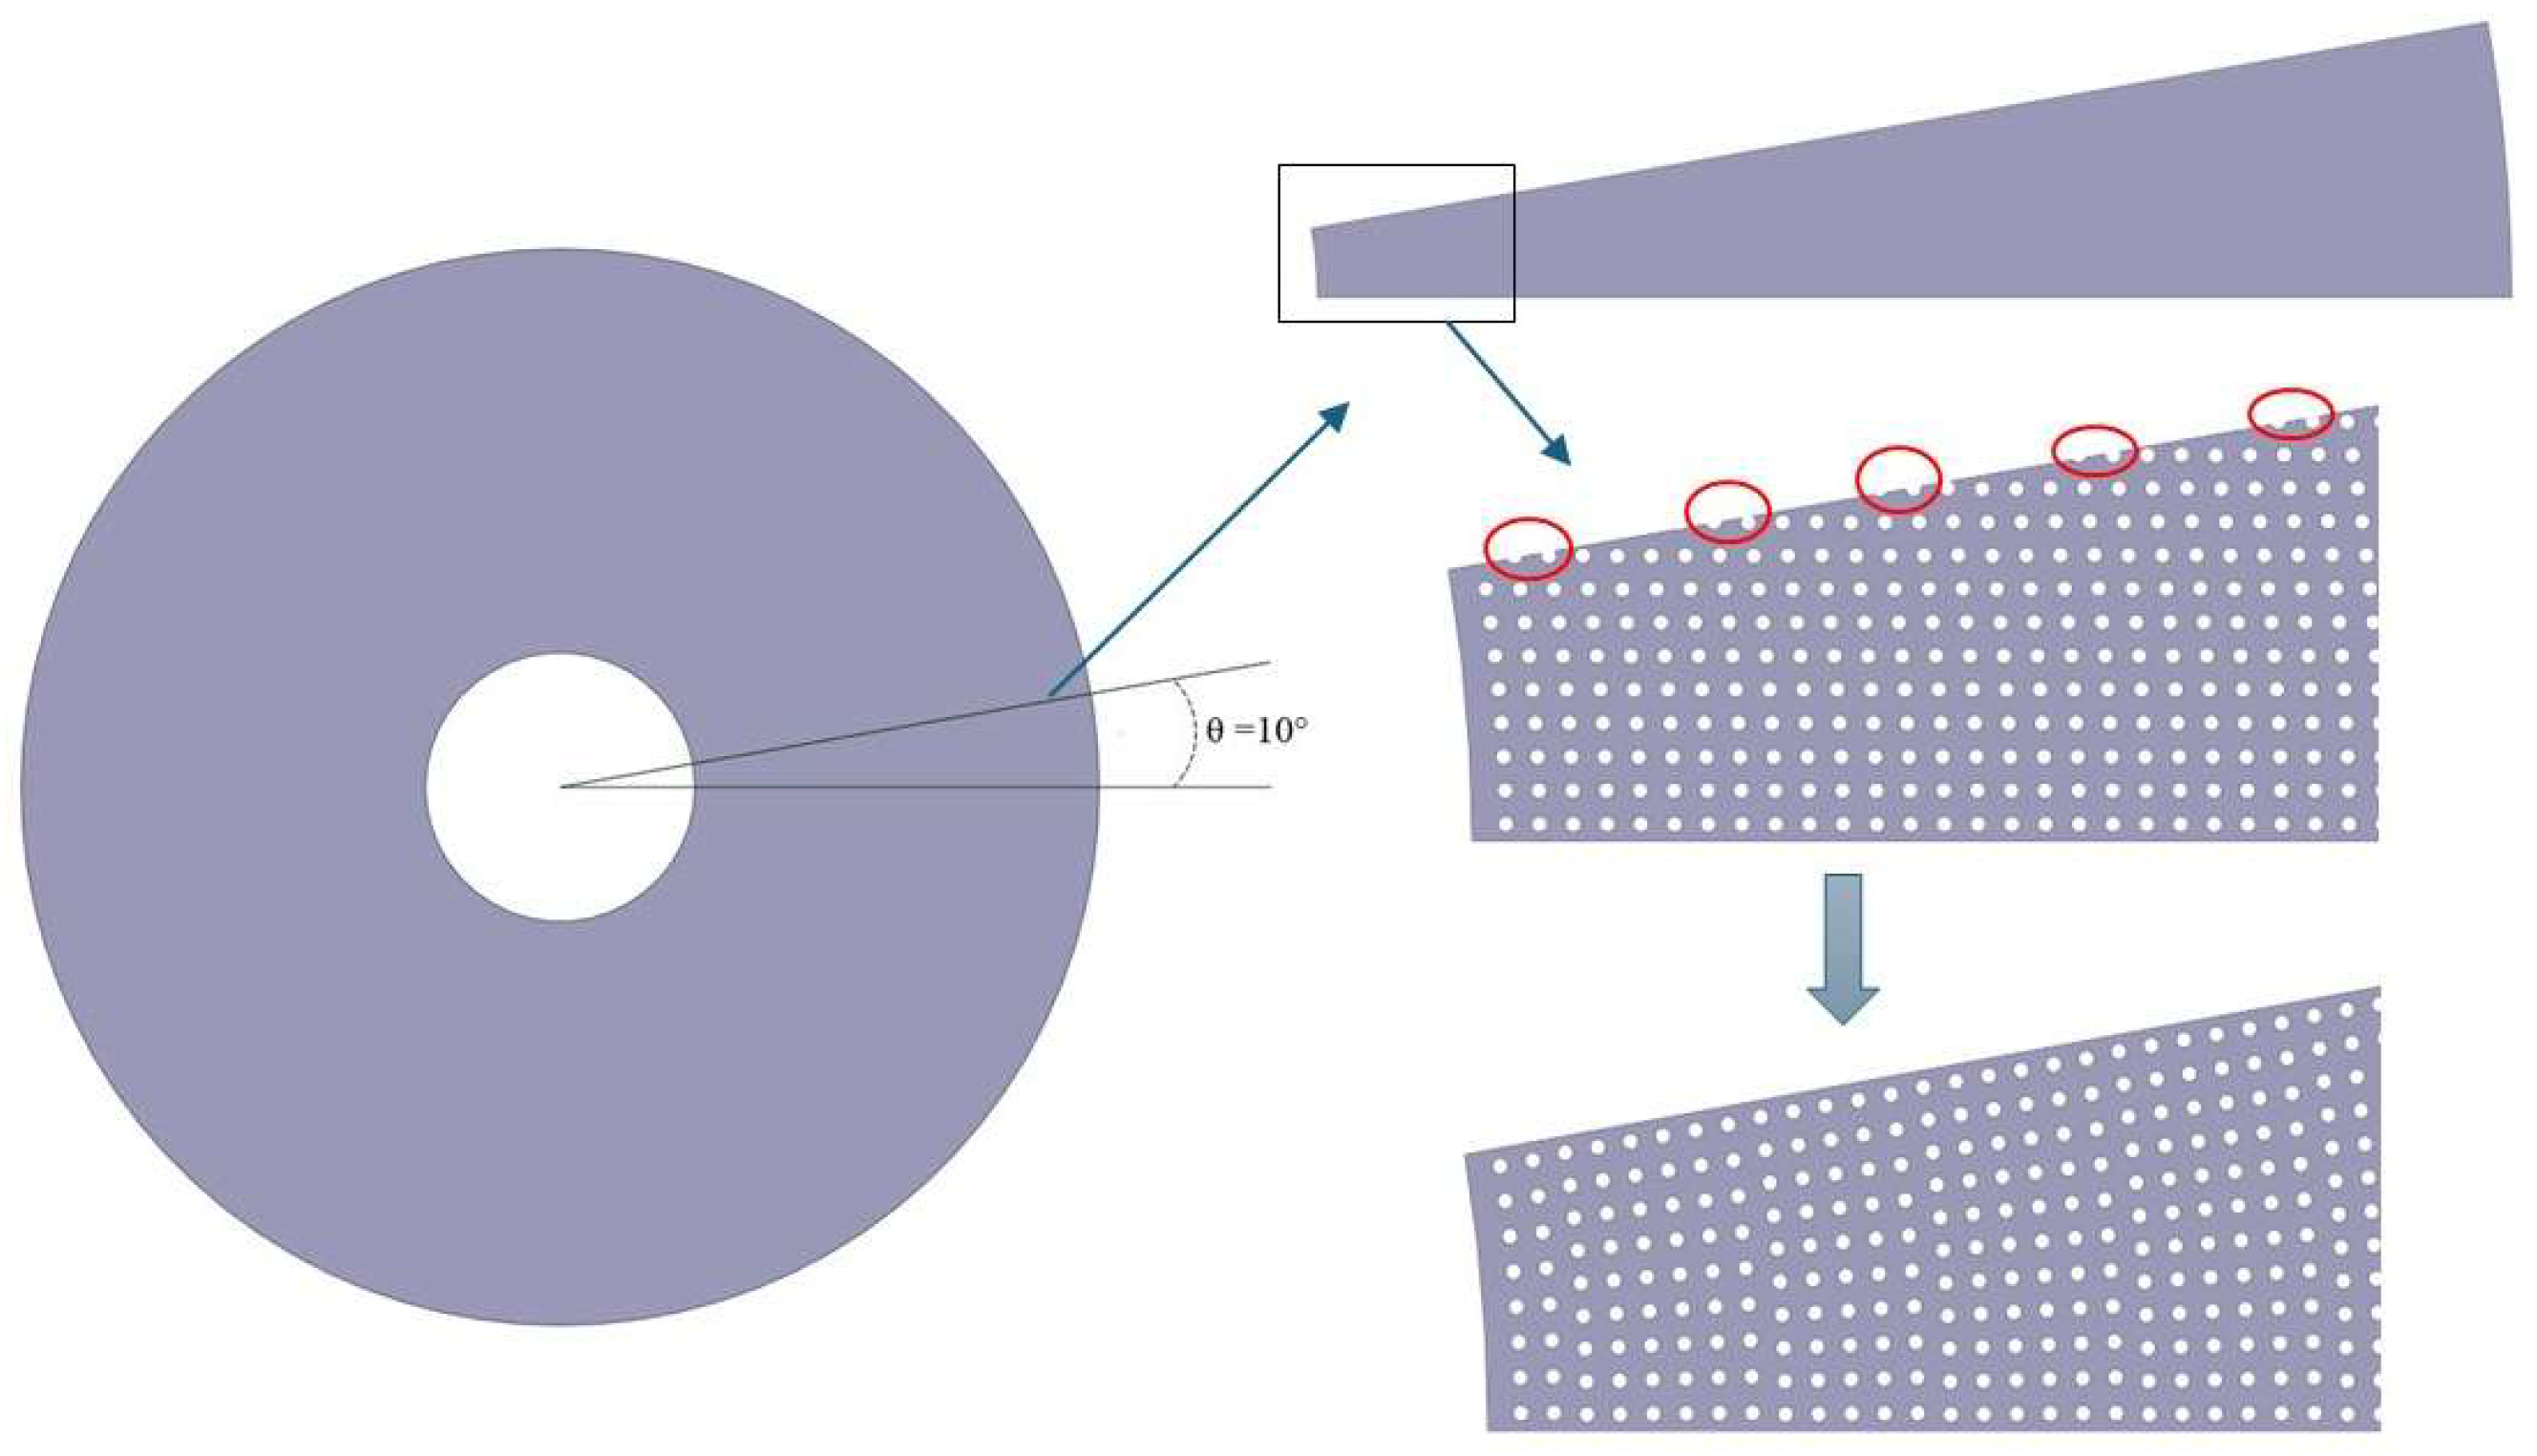
Figure 3.
Geometry and computational grid of simulation.
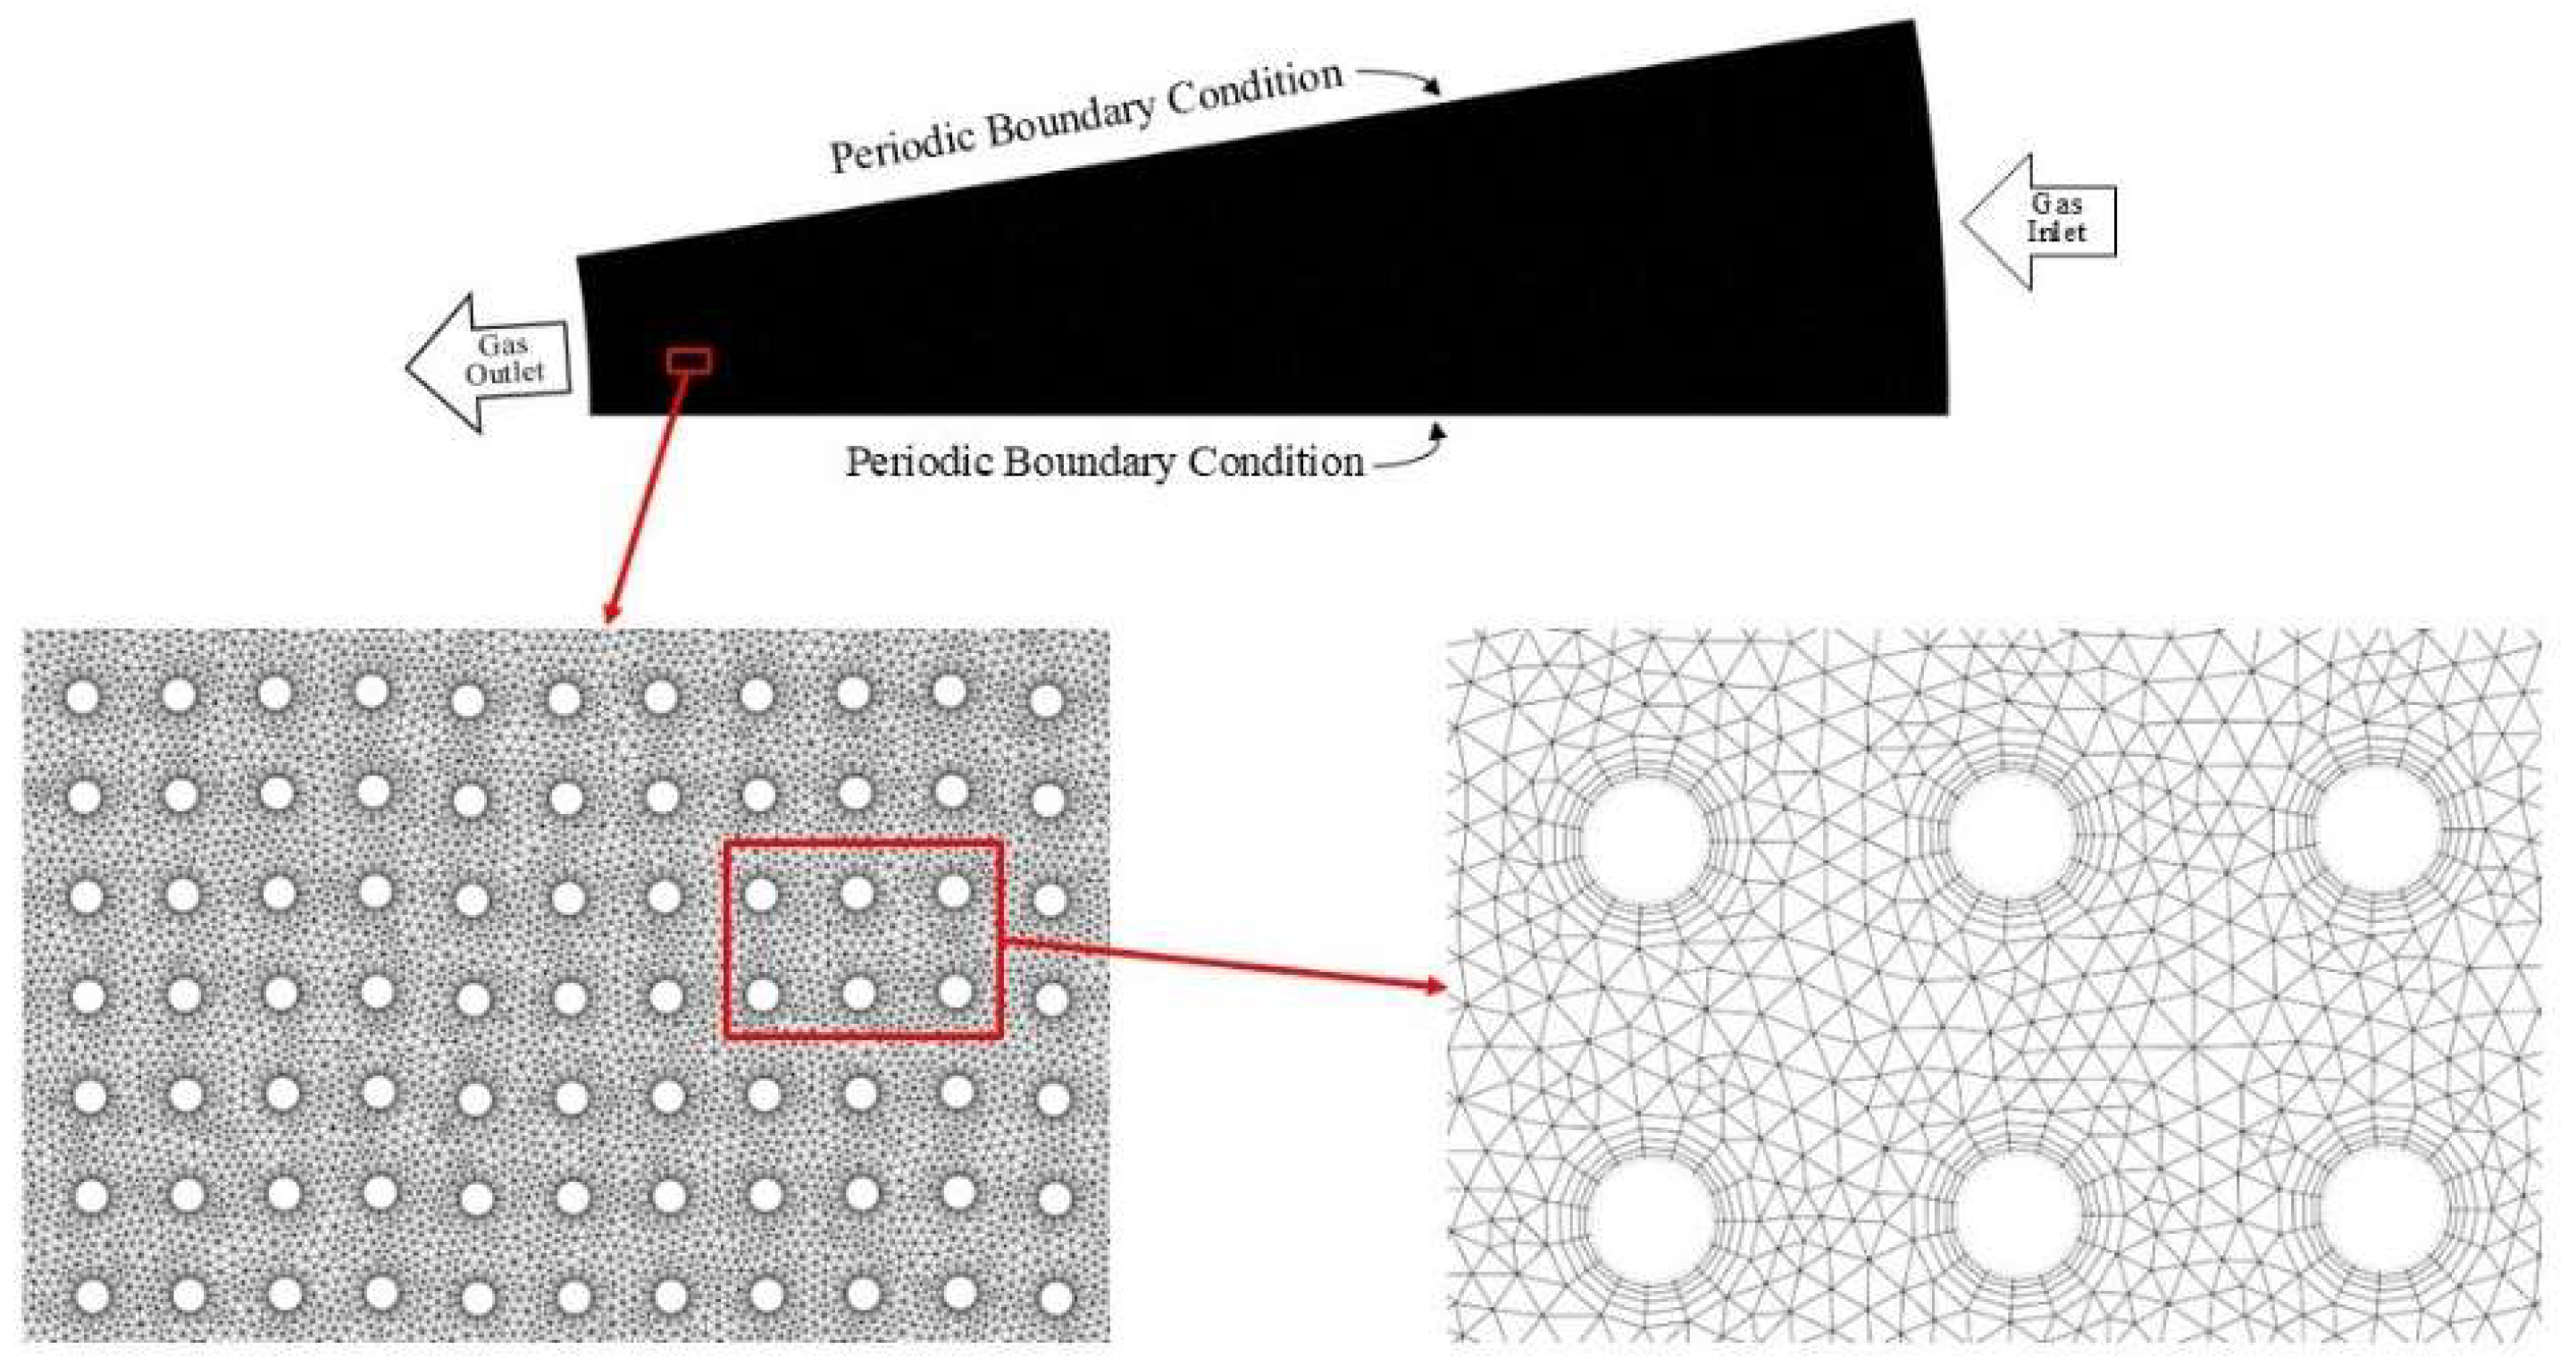
Figure 4.
Comparison of simulation result and experimental data [4] for variation of dry pressure drop with gas flow rate and rotating speed.
Figure 4.
Comparison of simulation result and experimental data [4] for variation of dry pressure drop with gas flow rate and rotating speed.
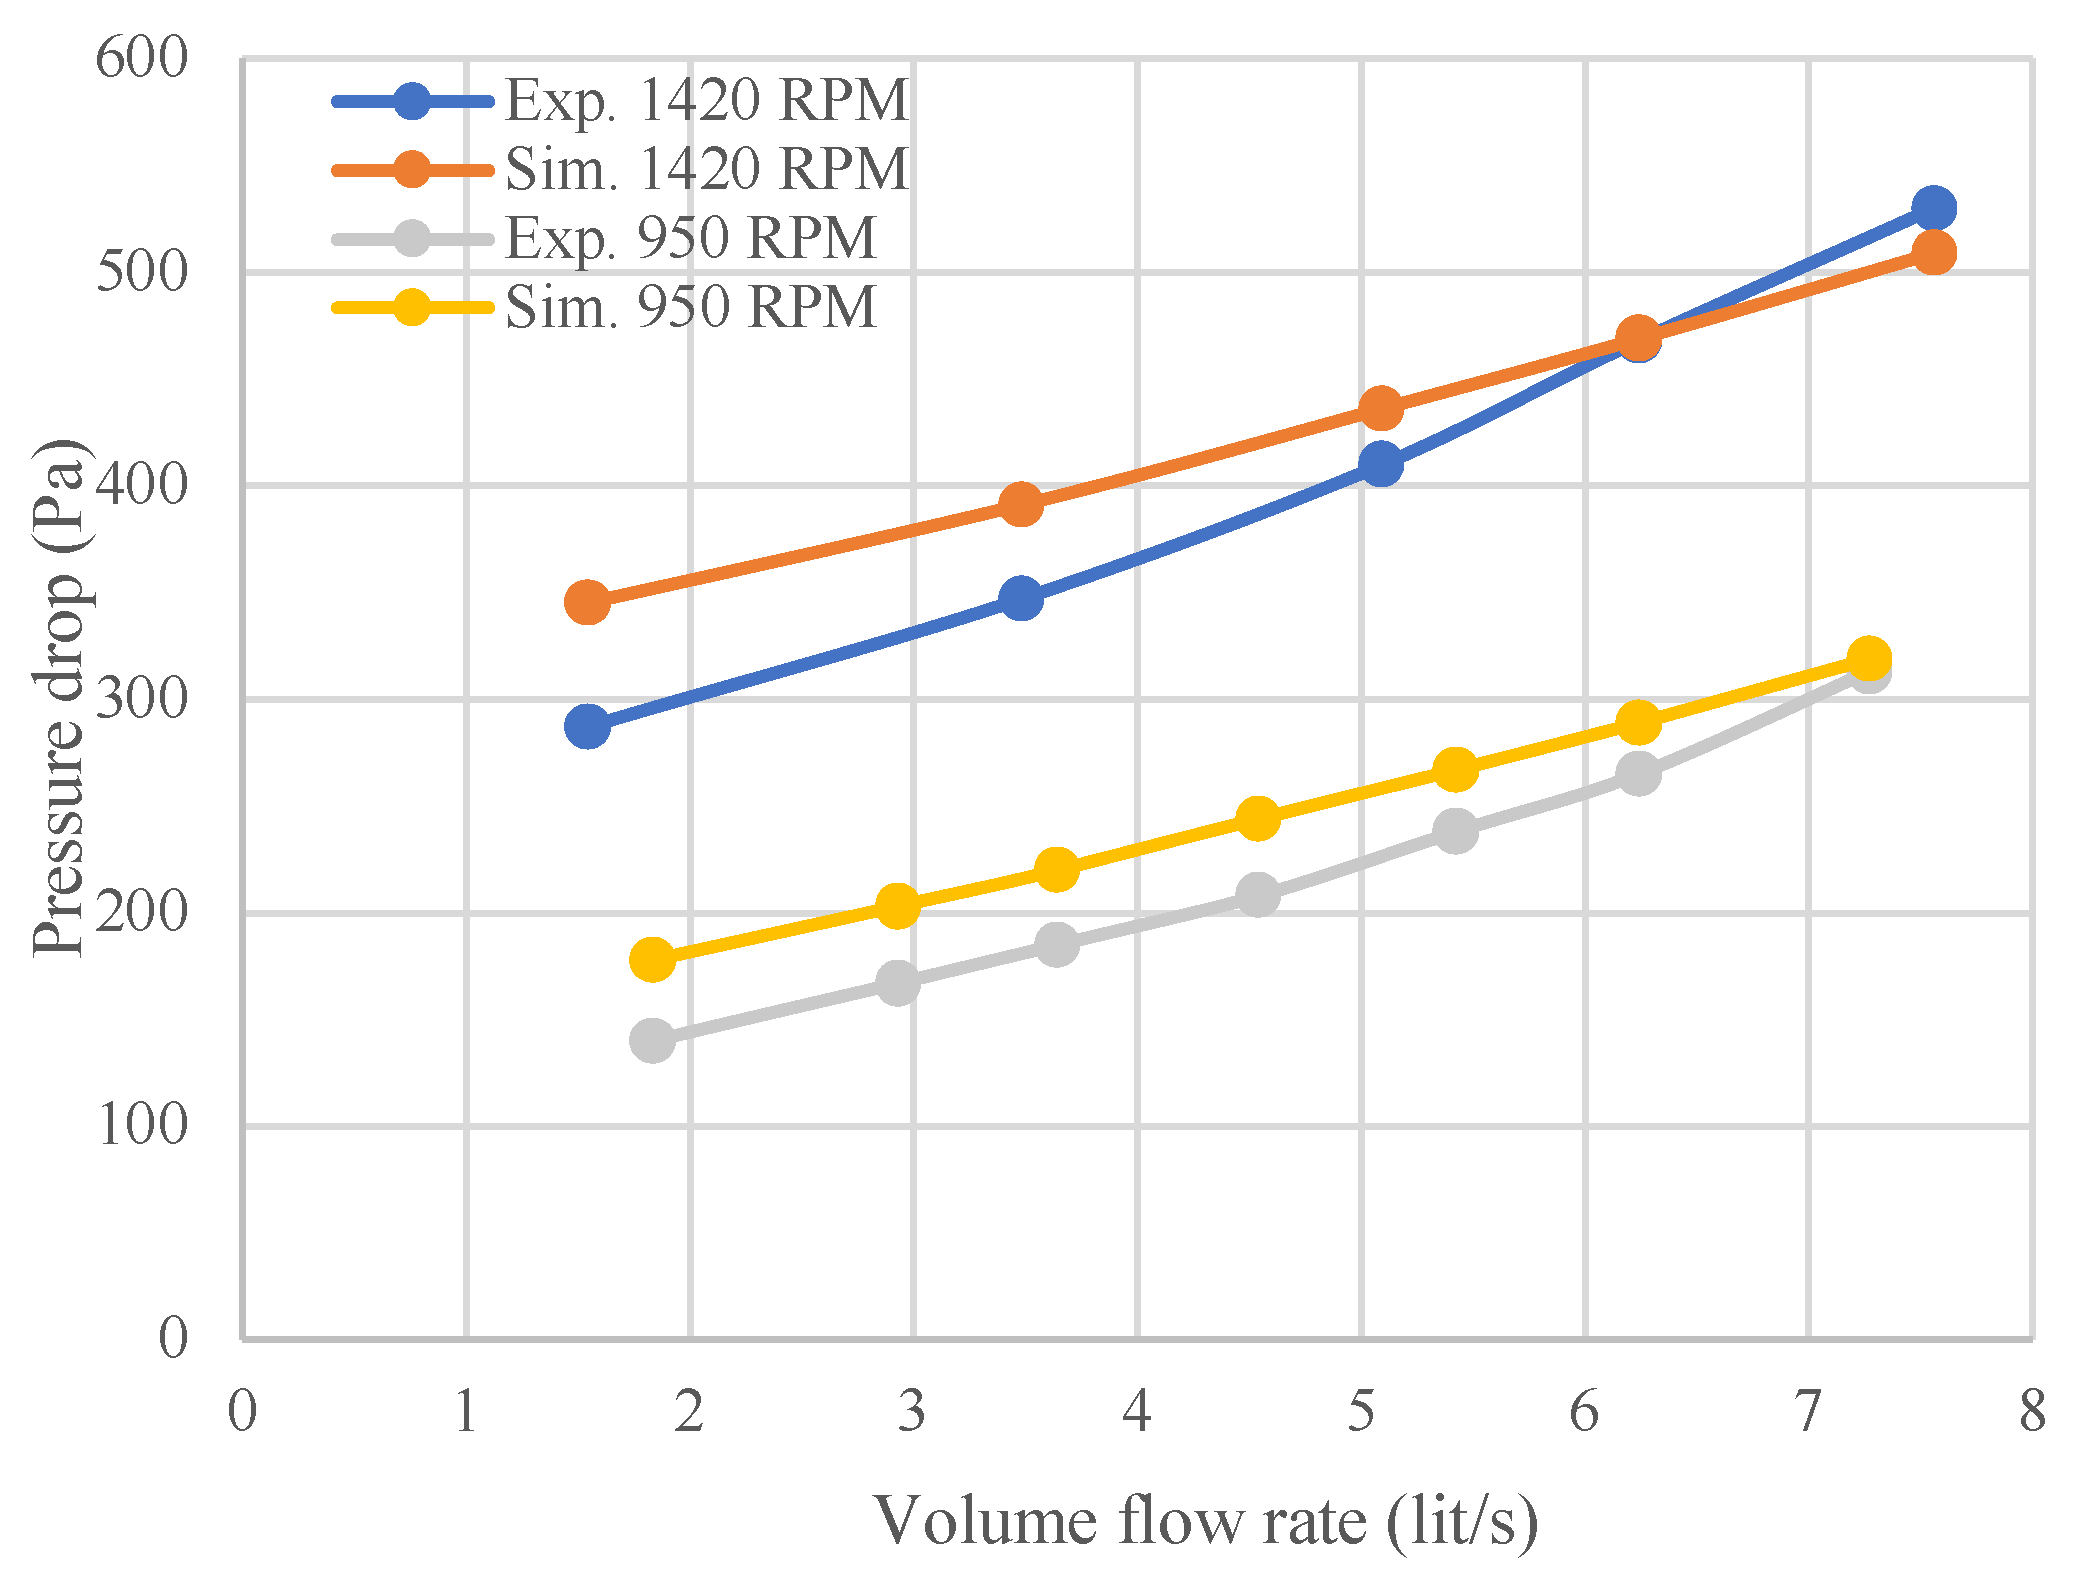
Figure 5.
2D and 3D geometries applied in the simulation, ε =0.86, ap = 133 m2/m3.
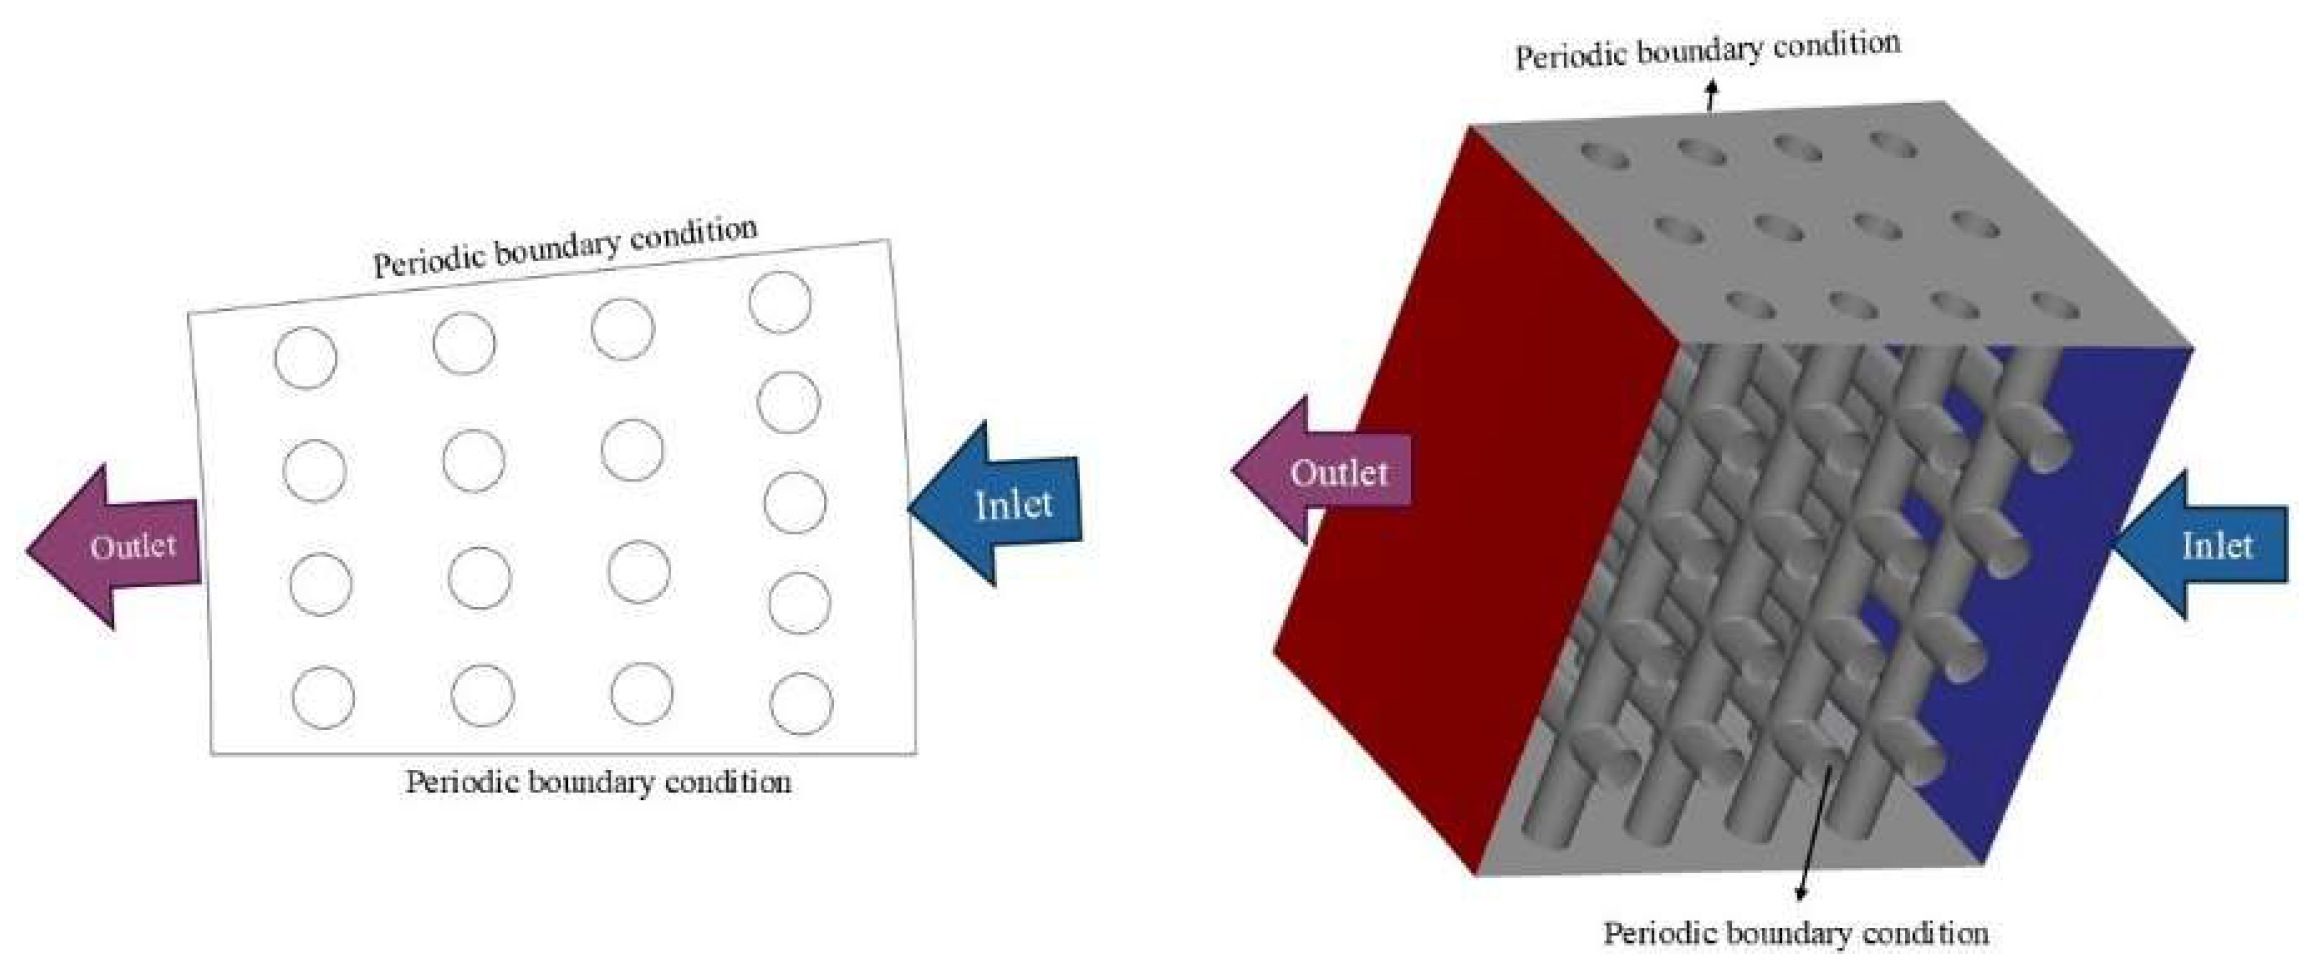
Figure 6.
Comparison of 2D and 3D simulation results for velocity magnitude, a: 2D contour, b: contour of velocity on a plane cutting vertical wires on 3D, c: contour of velocity on a plane cutting horizontal wires on 3D, d: 2D velocity vectors, e: 3D velocity vectors, inlet velocity is 7 m/s and rotating speed is 1000 RPM, the bed rotation is counterclockwise.
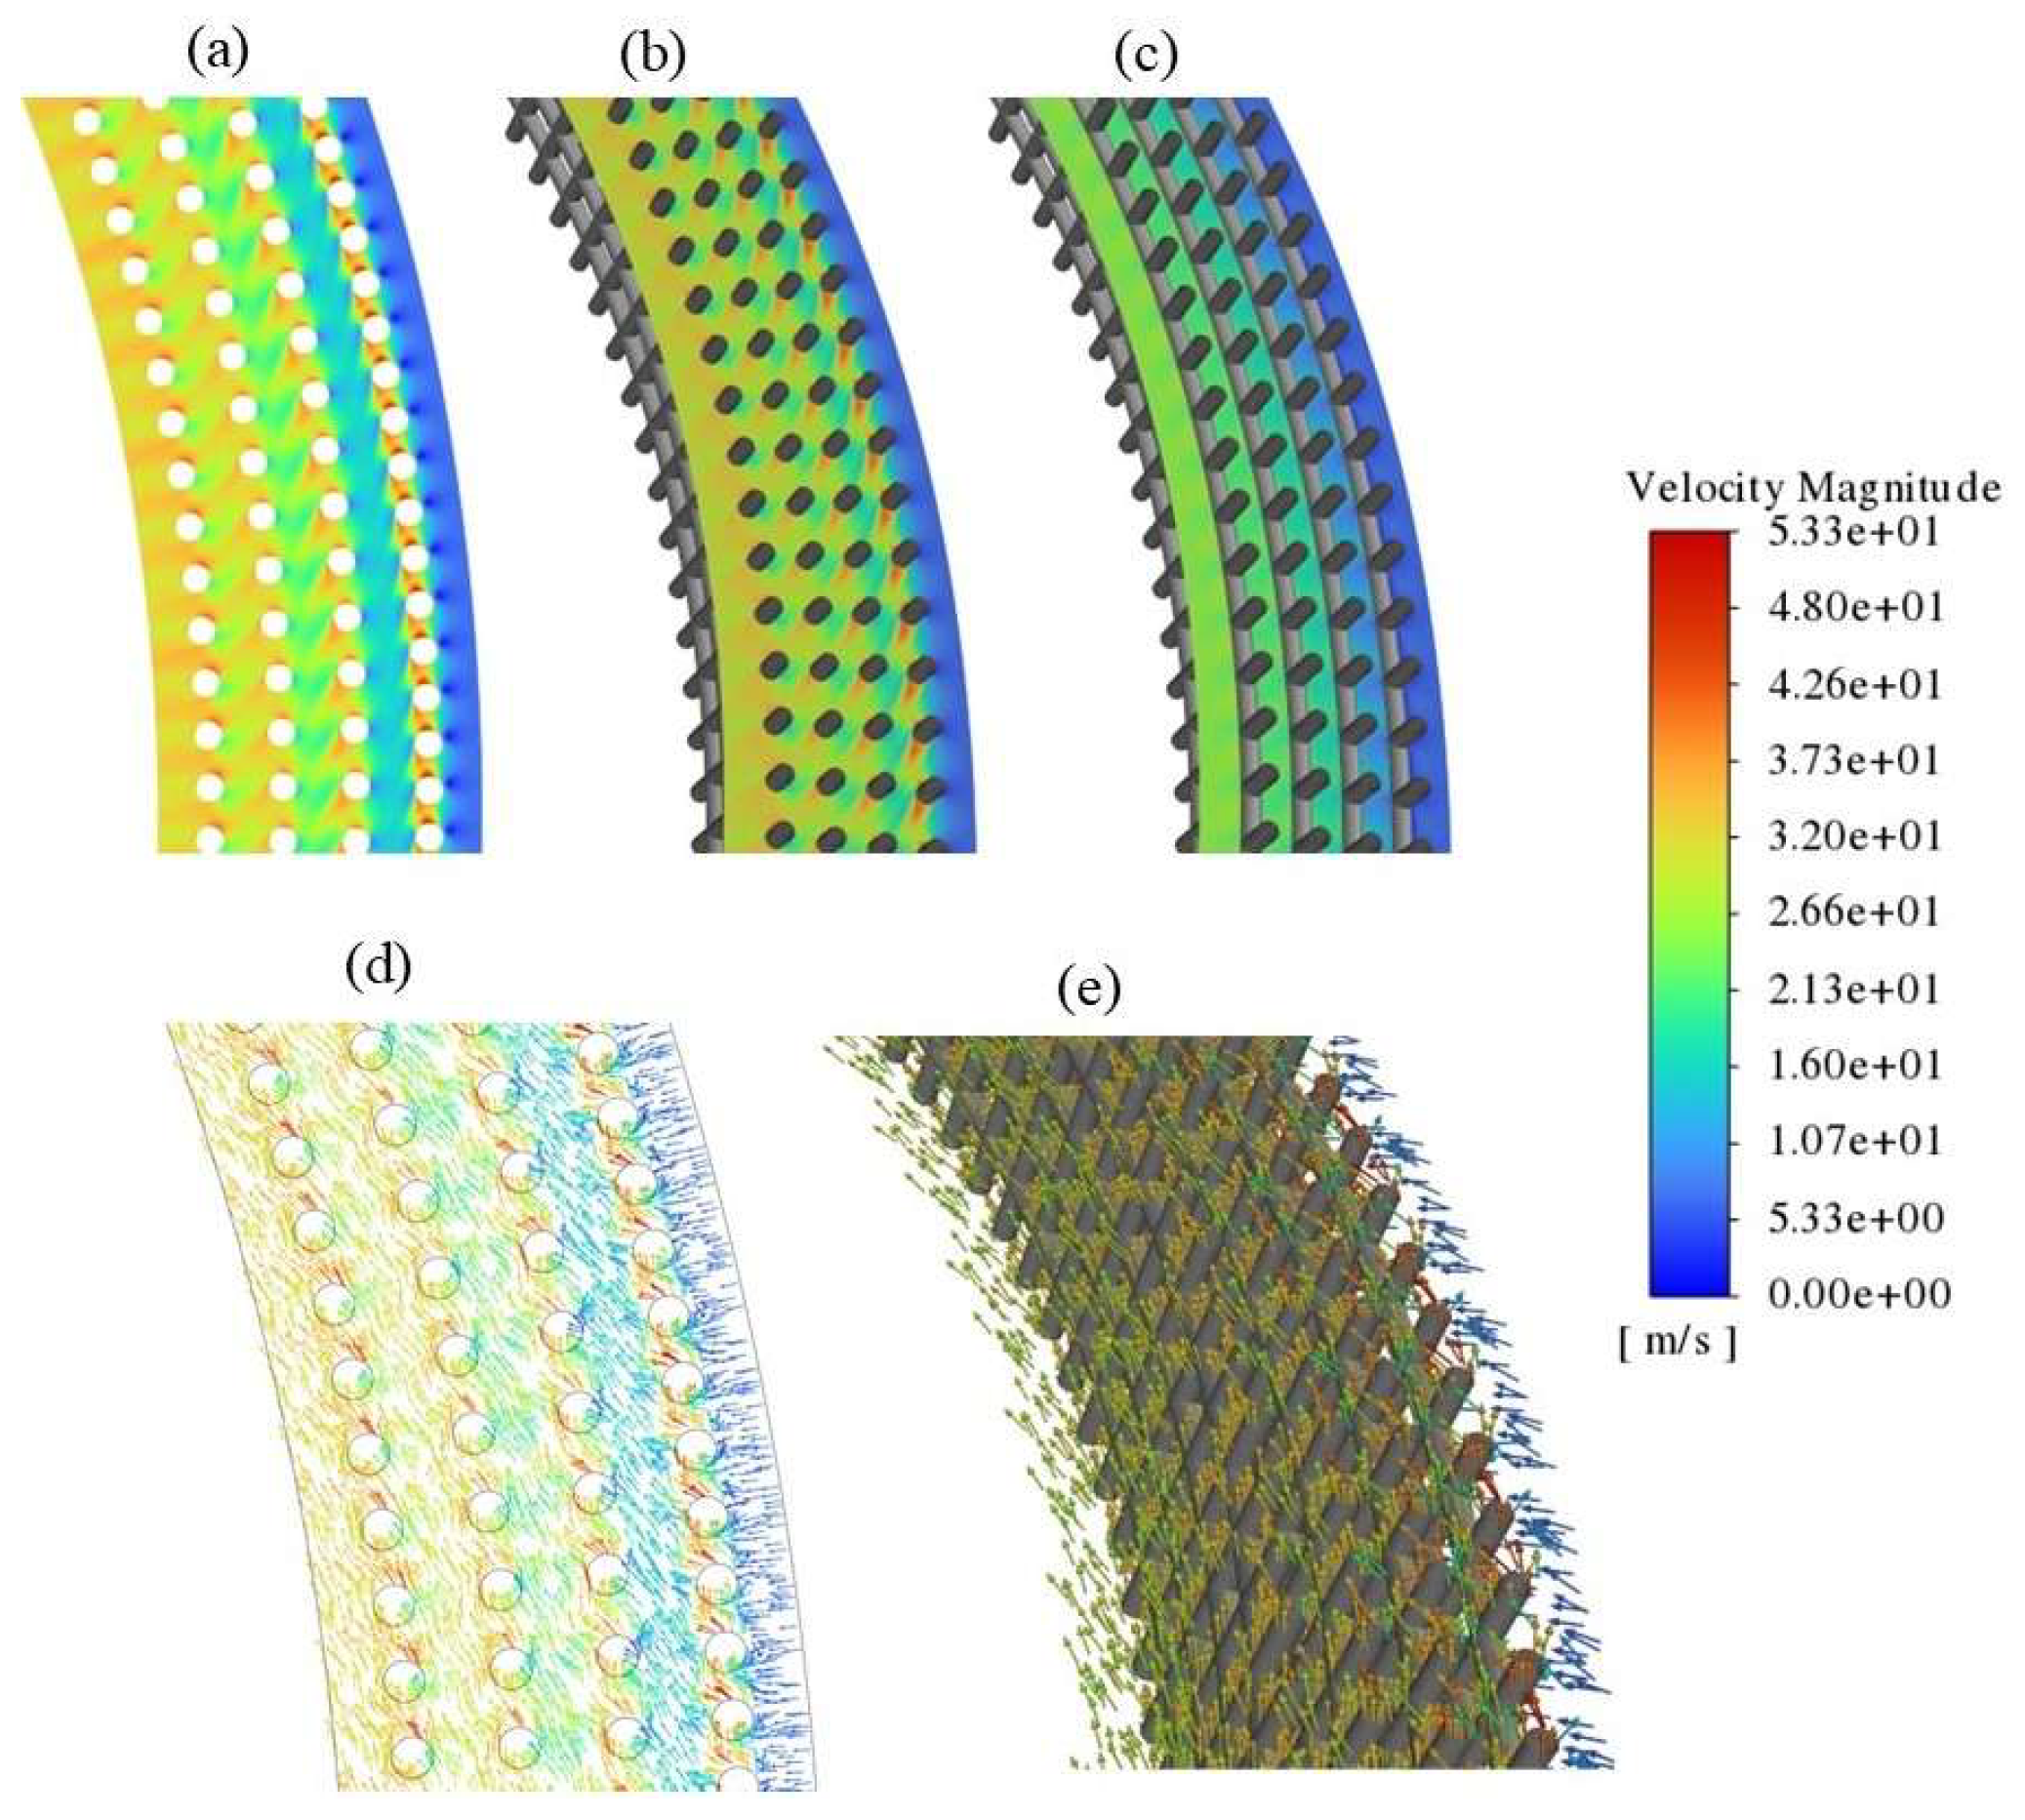
Figure 7.
Comparison of the static pressure (gauge) in different radius of the bed, inlet velocity is 7 m/s and rotating speed is 1000 RPM, each point shows the area-weighted average of pressure in a particular radius of the bed.
Figure 7.
Comparison of the static pressure (gauge) in different radius of the bed, inlet velocity is 7 m/s and rotating speed is 1000 RPM, each point shows the area-weighted average of pressure in a particular radius of the bed.
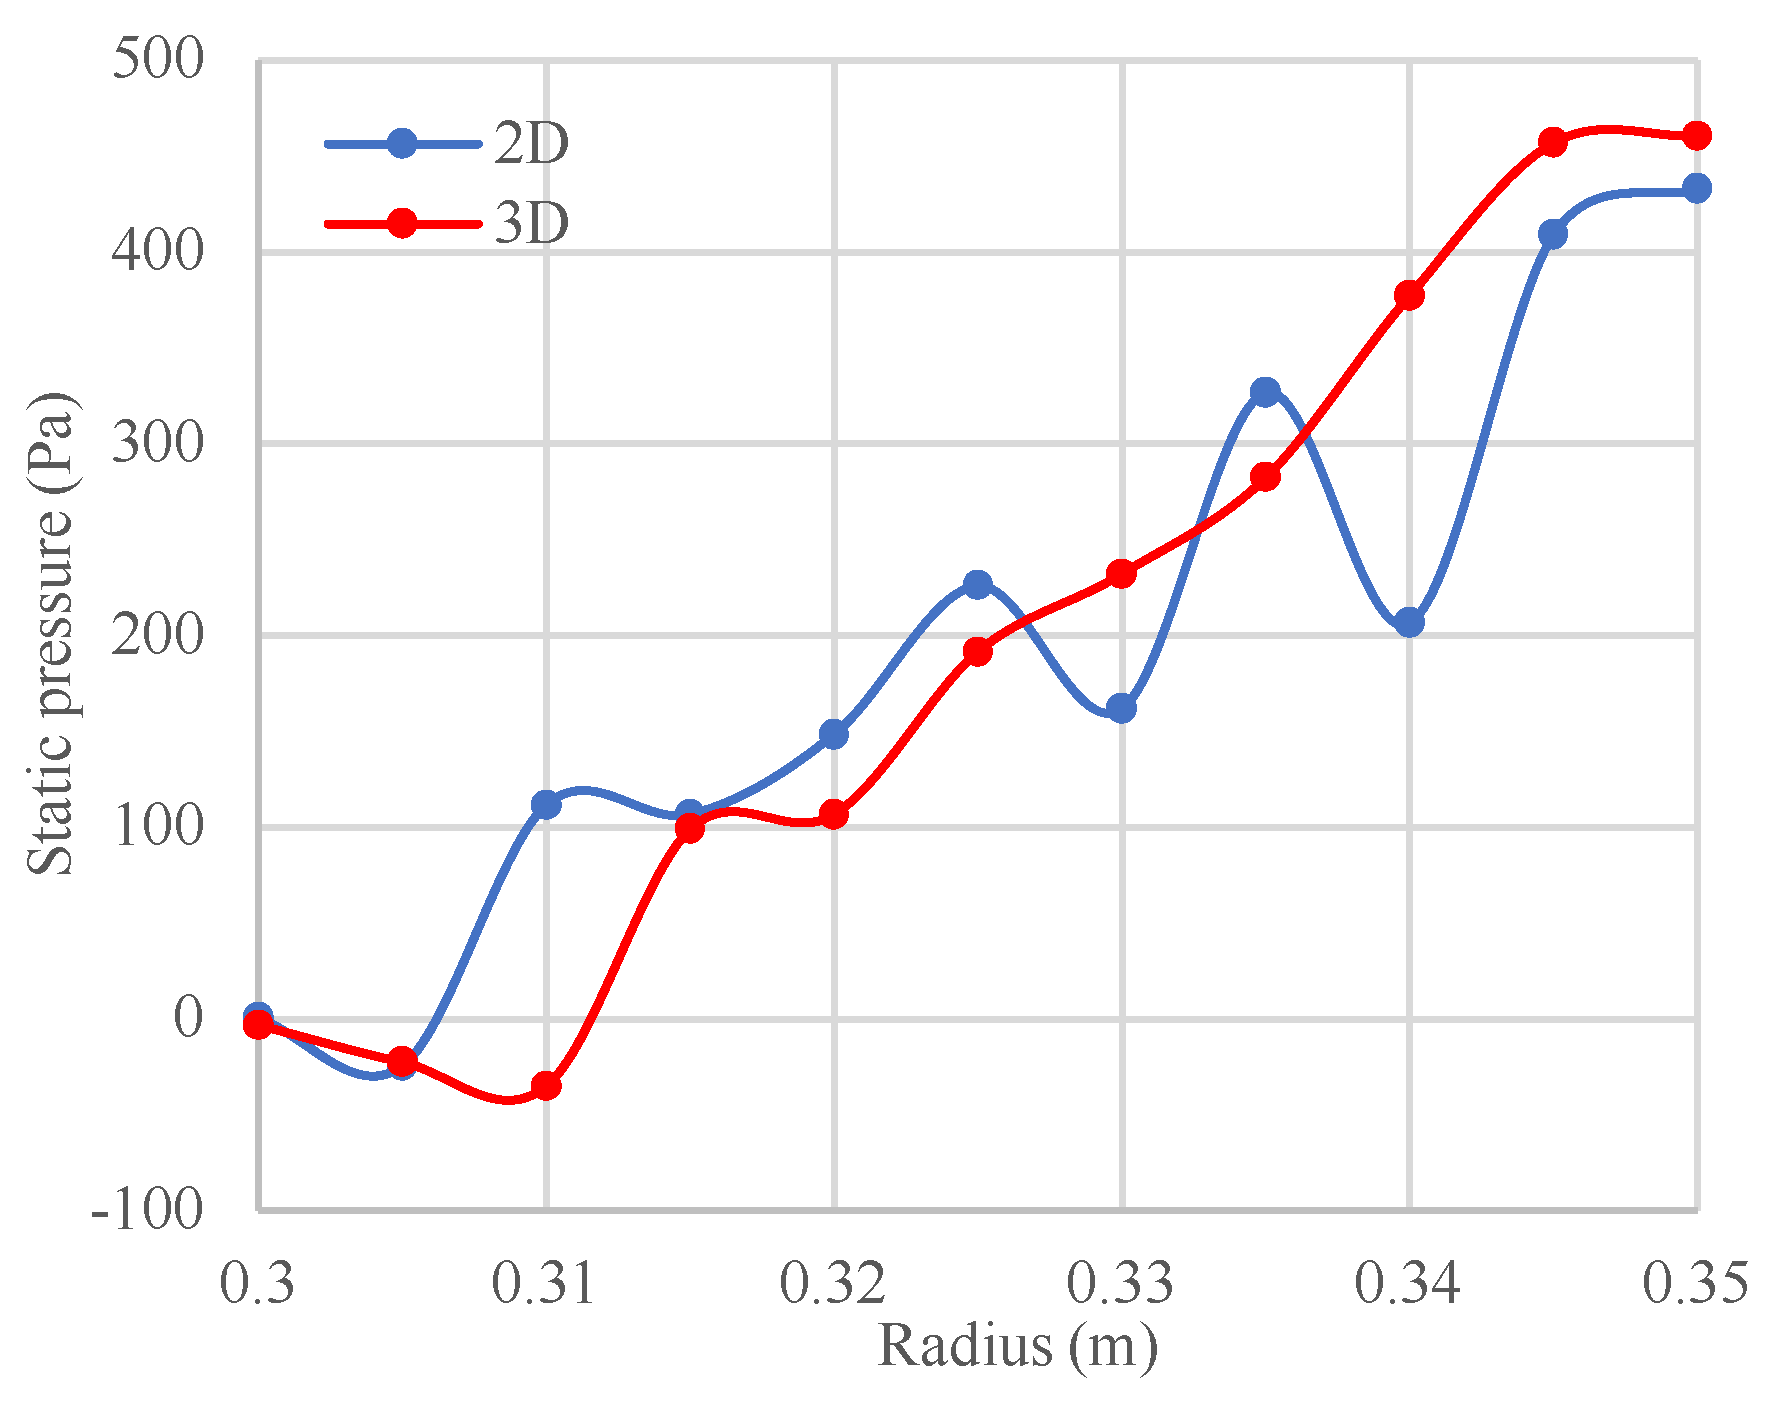
Figure 8.
Static pressure (gauge) variation and contour of tangential velocity for gas flow with different inlet velocities in a RPB with rotating speed of 1200 RPM, outer radius of the case is 0.75 m, outer and inner radius of the rotating bed are 0.55 and 0.3 m respectively, inner radius of the eye is 0.2 m.
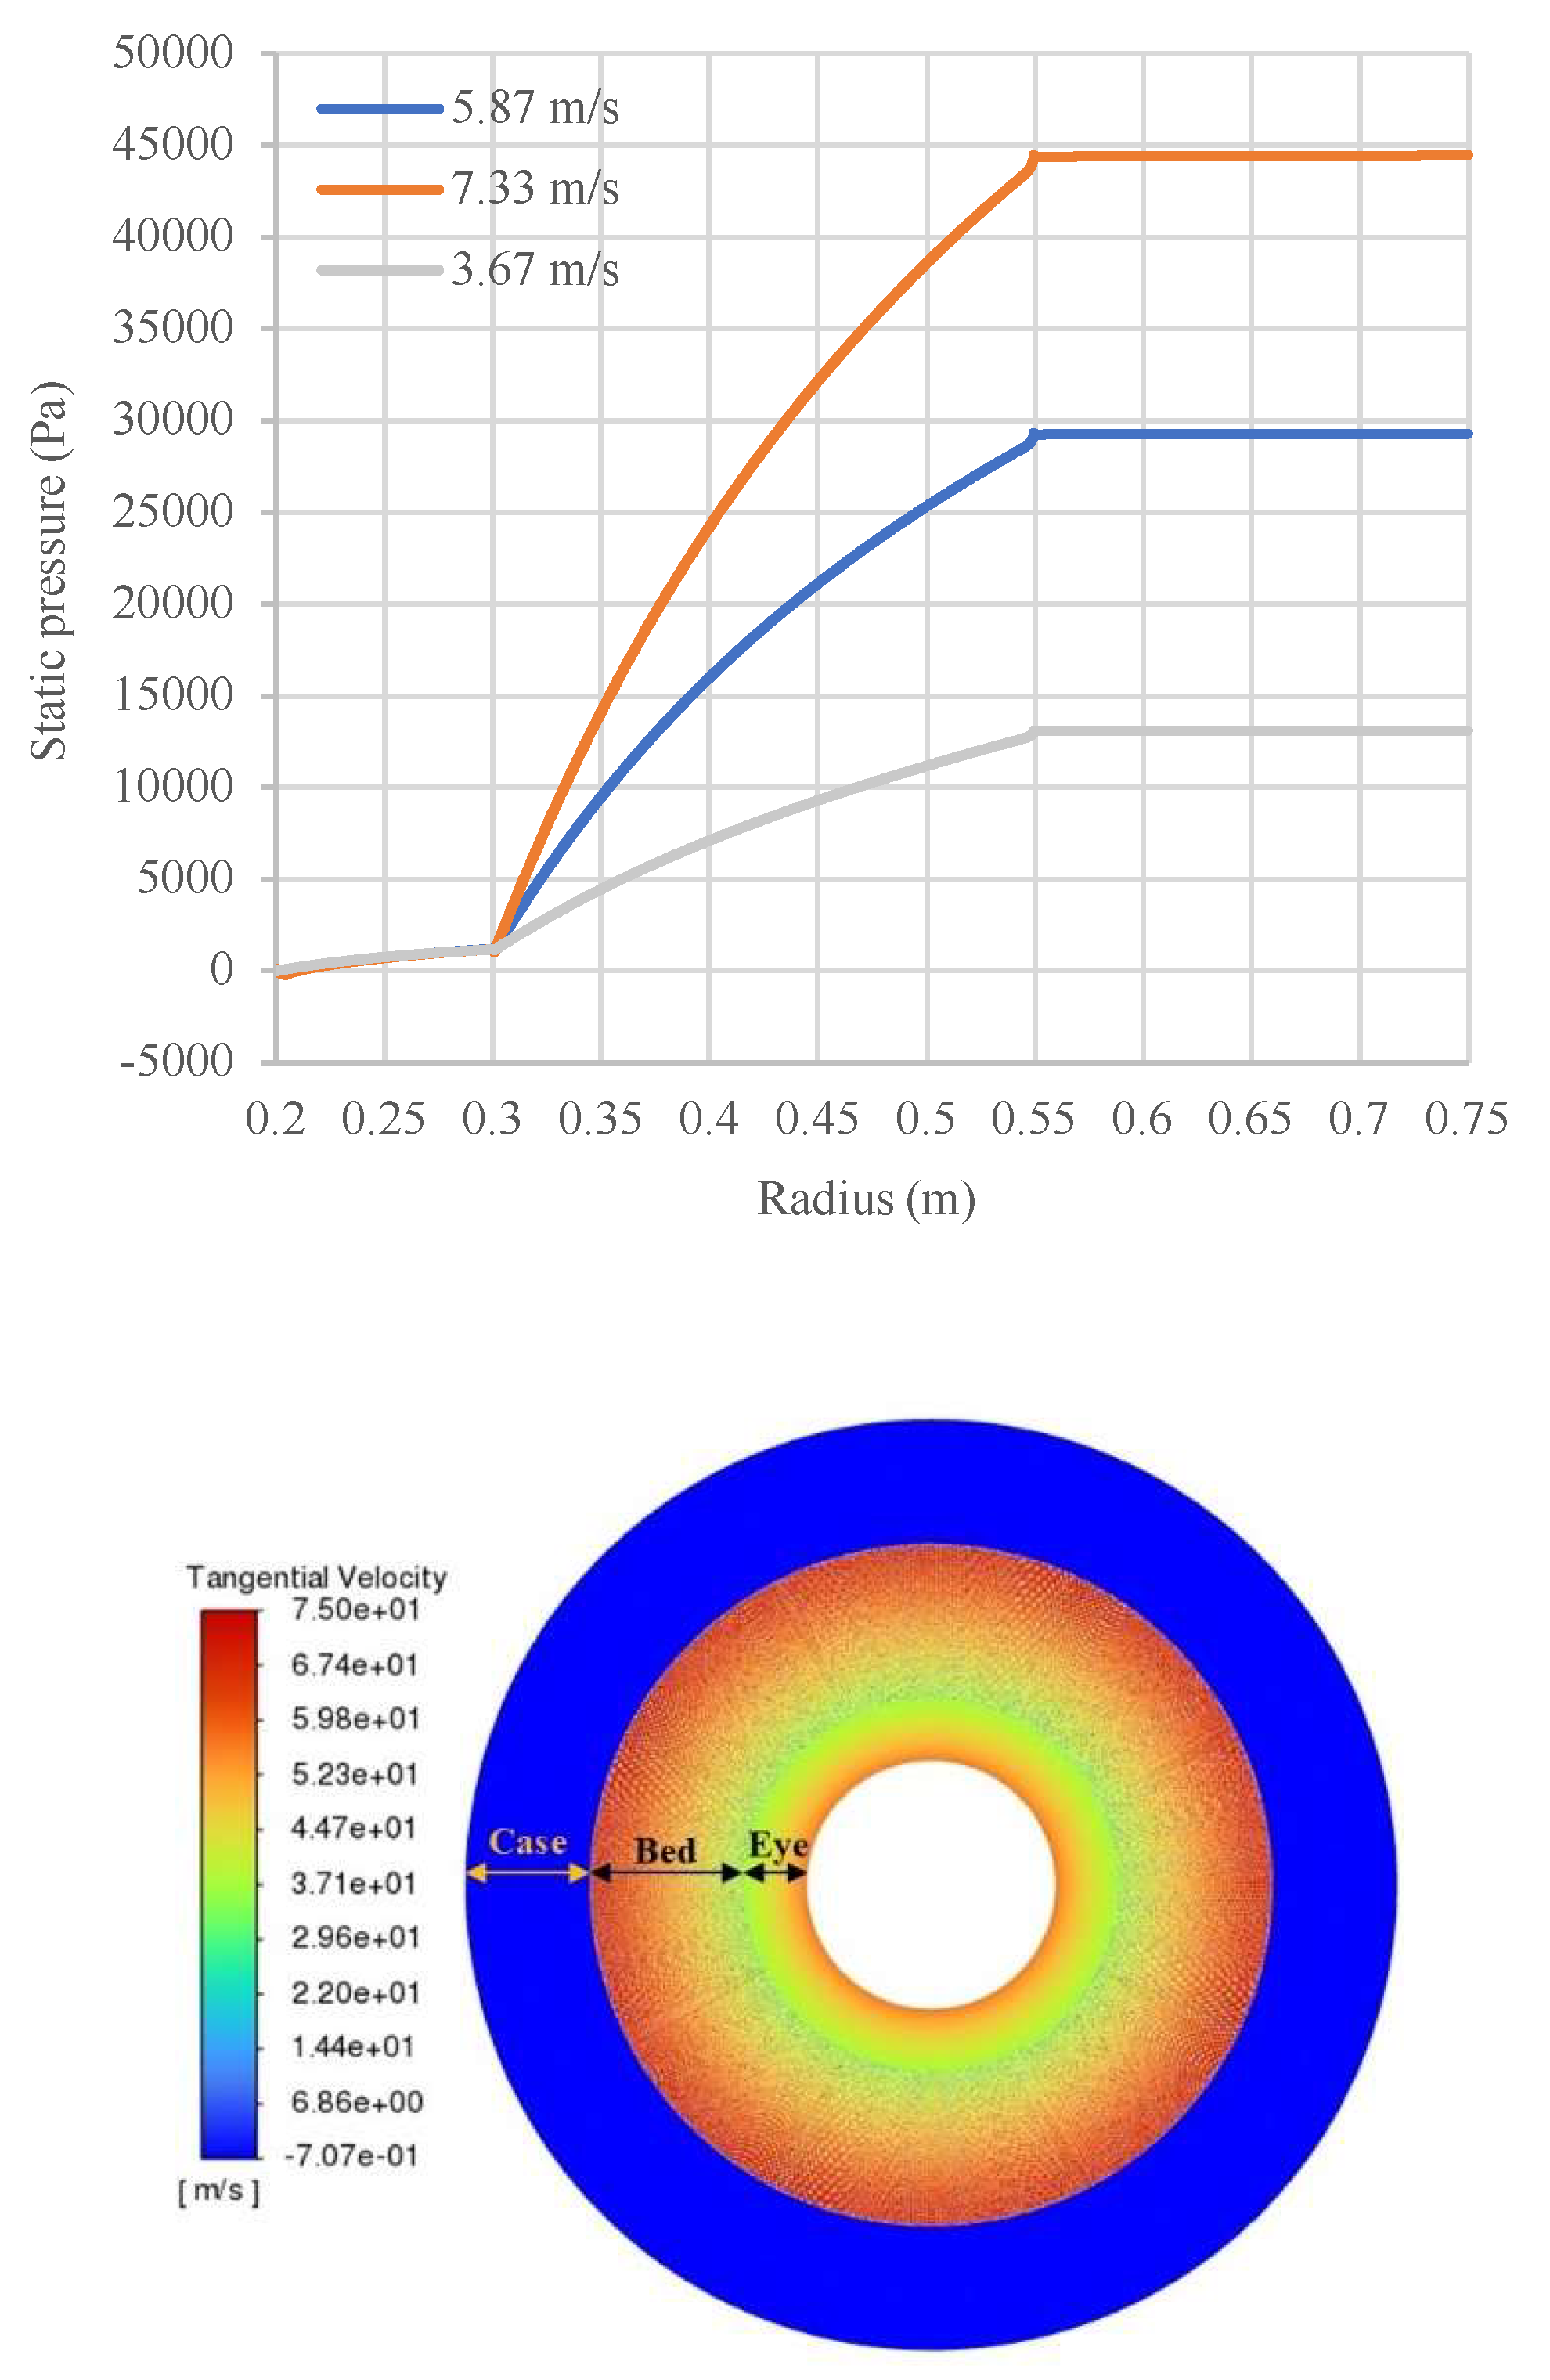
Figure 9.
Simulation result for static pressure (gauge) variation in three different beds including rotating bed, stationary packed bed and stationary empty bed, inlet velocity is 8 m/s for the flow in the bed with characteristics of case 1.
Figure 9.
Simulation result for static pressure (gauge) variation in three different beds including rotating bed, stationary packed bed and stationary empty bed, inlet velocity is 8 m/s for the flow in the bed with characteristics of case 1.
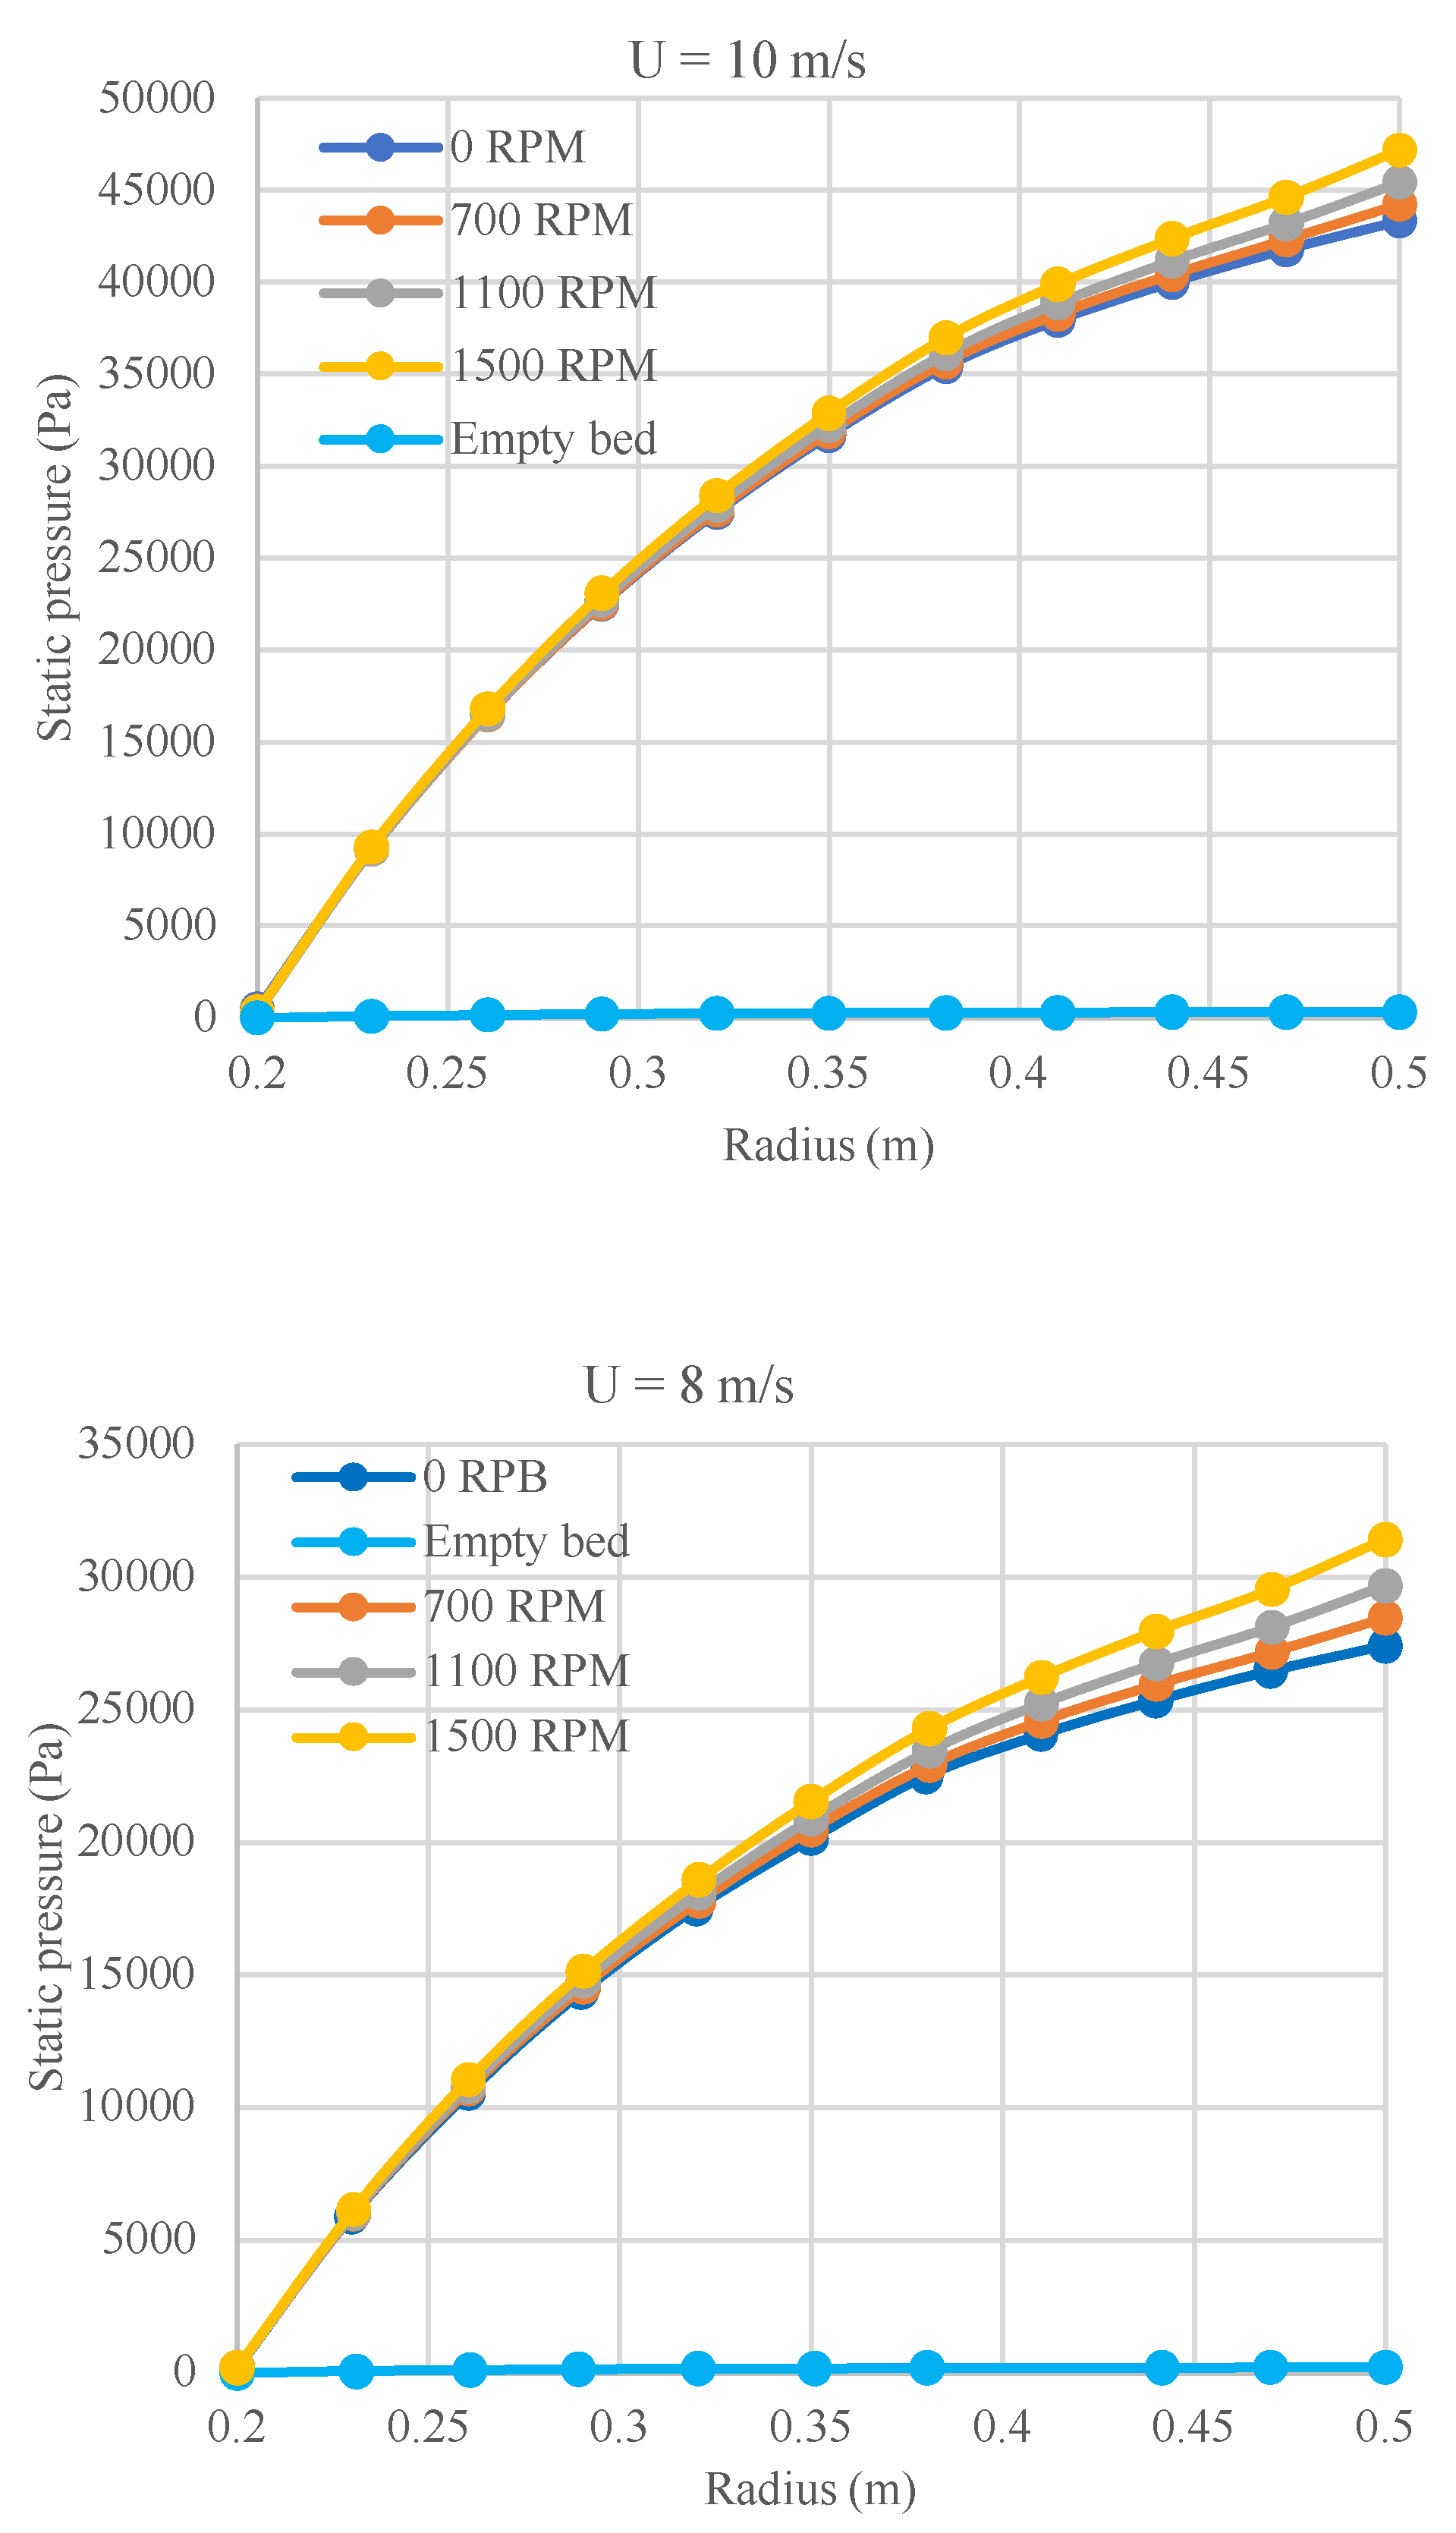
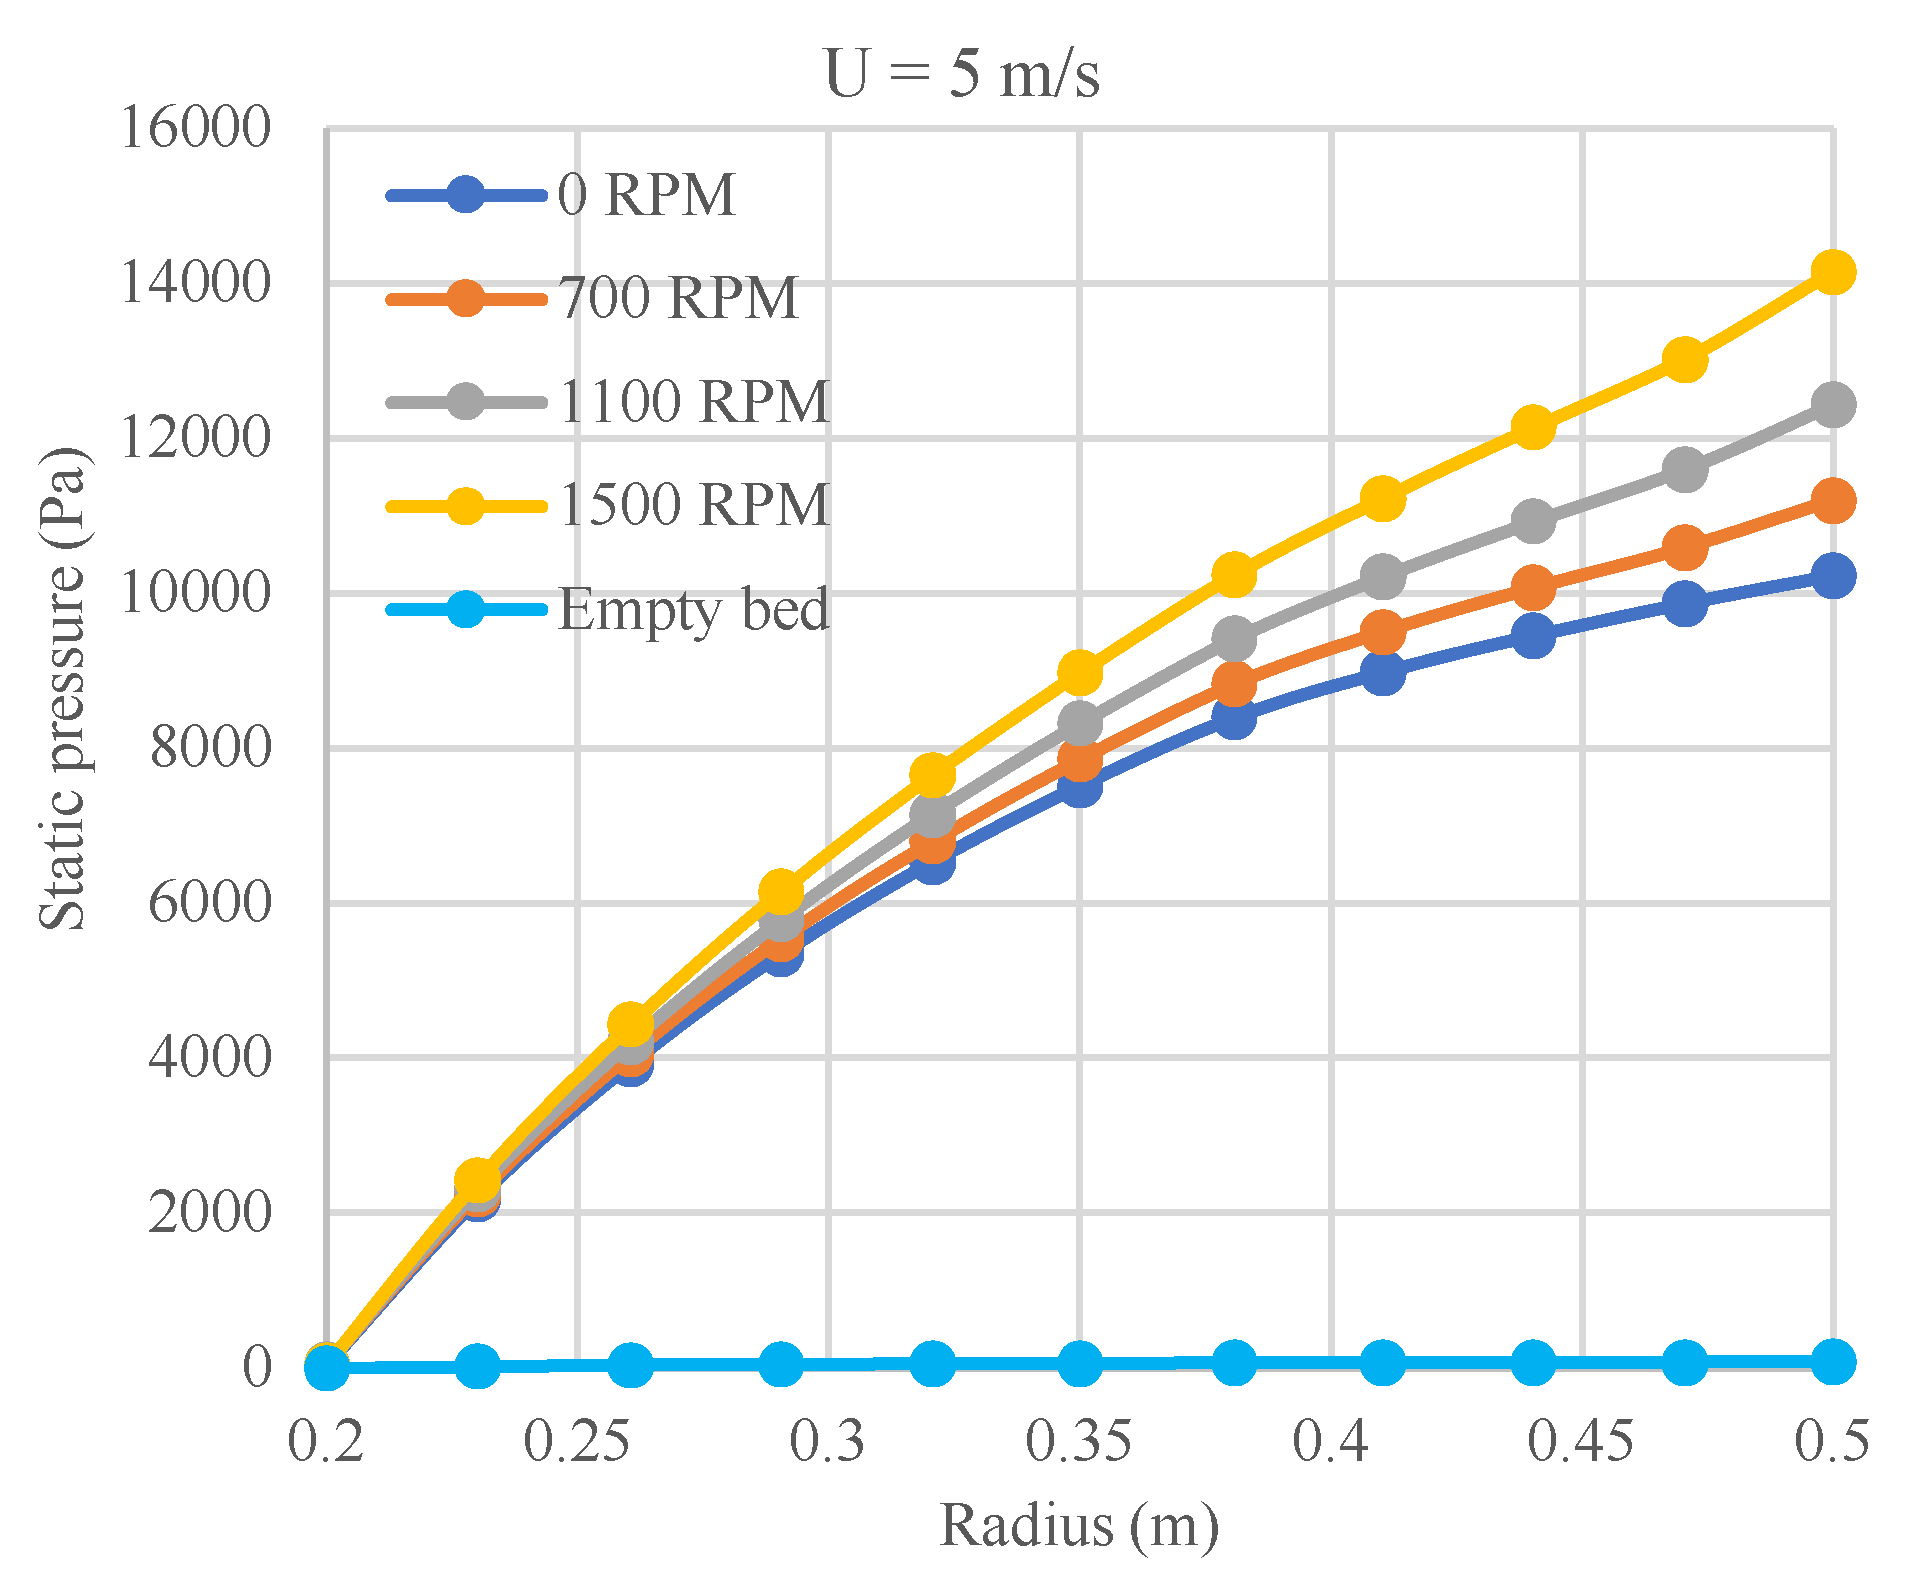
Figure 10.
Simulation result for total pressure (gauge) variation for the flow in the bed with characteristics of case 1, a) inlet velocity of 8 m/s, b) rotation speed of 1200 RPM.
Figure 10.
Simulation result for total pressure (gauge) variation for the flow in the bed with characteristics of case 1, a) inlet velocity of 8 m/s, b) rotation speed of 1200 RPM.
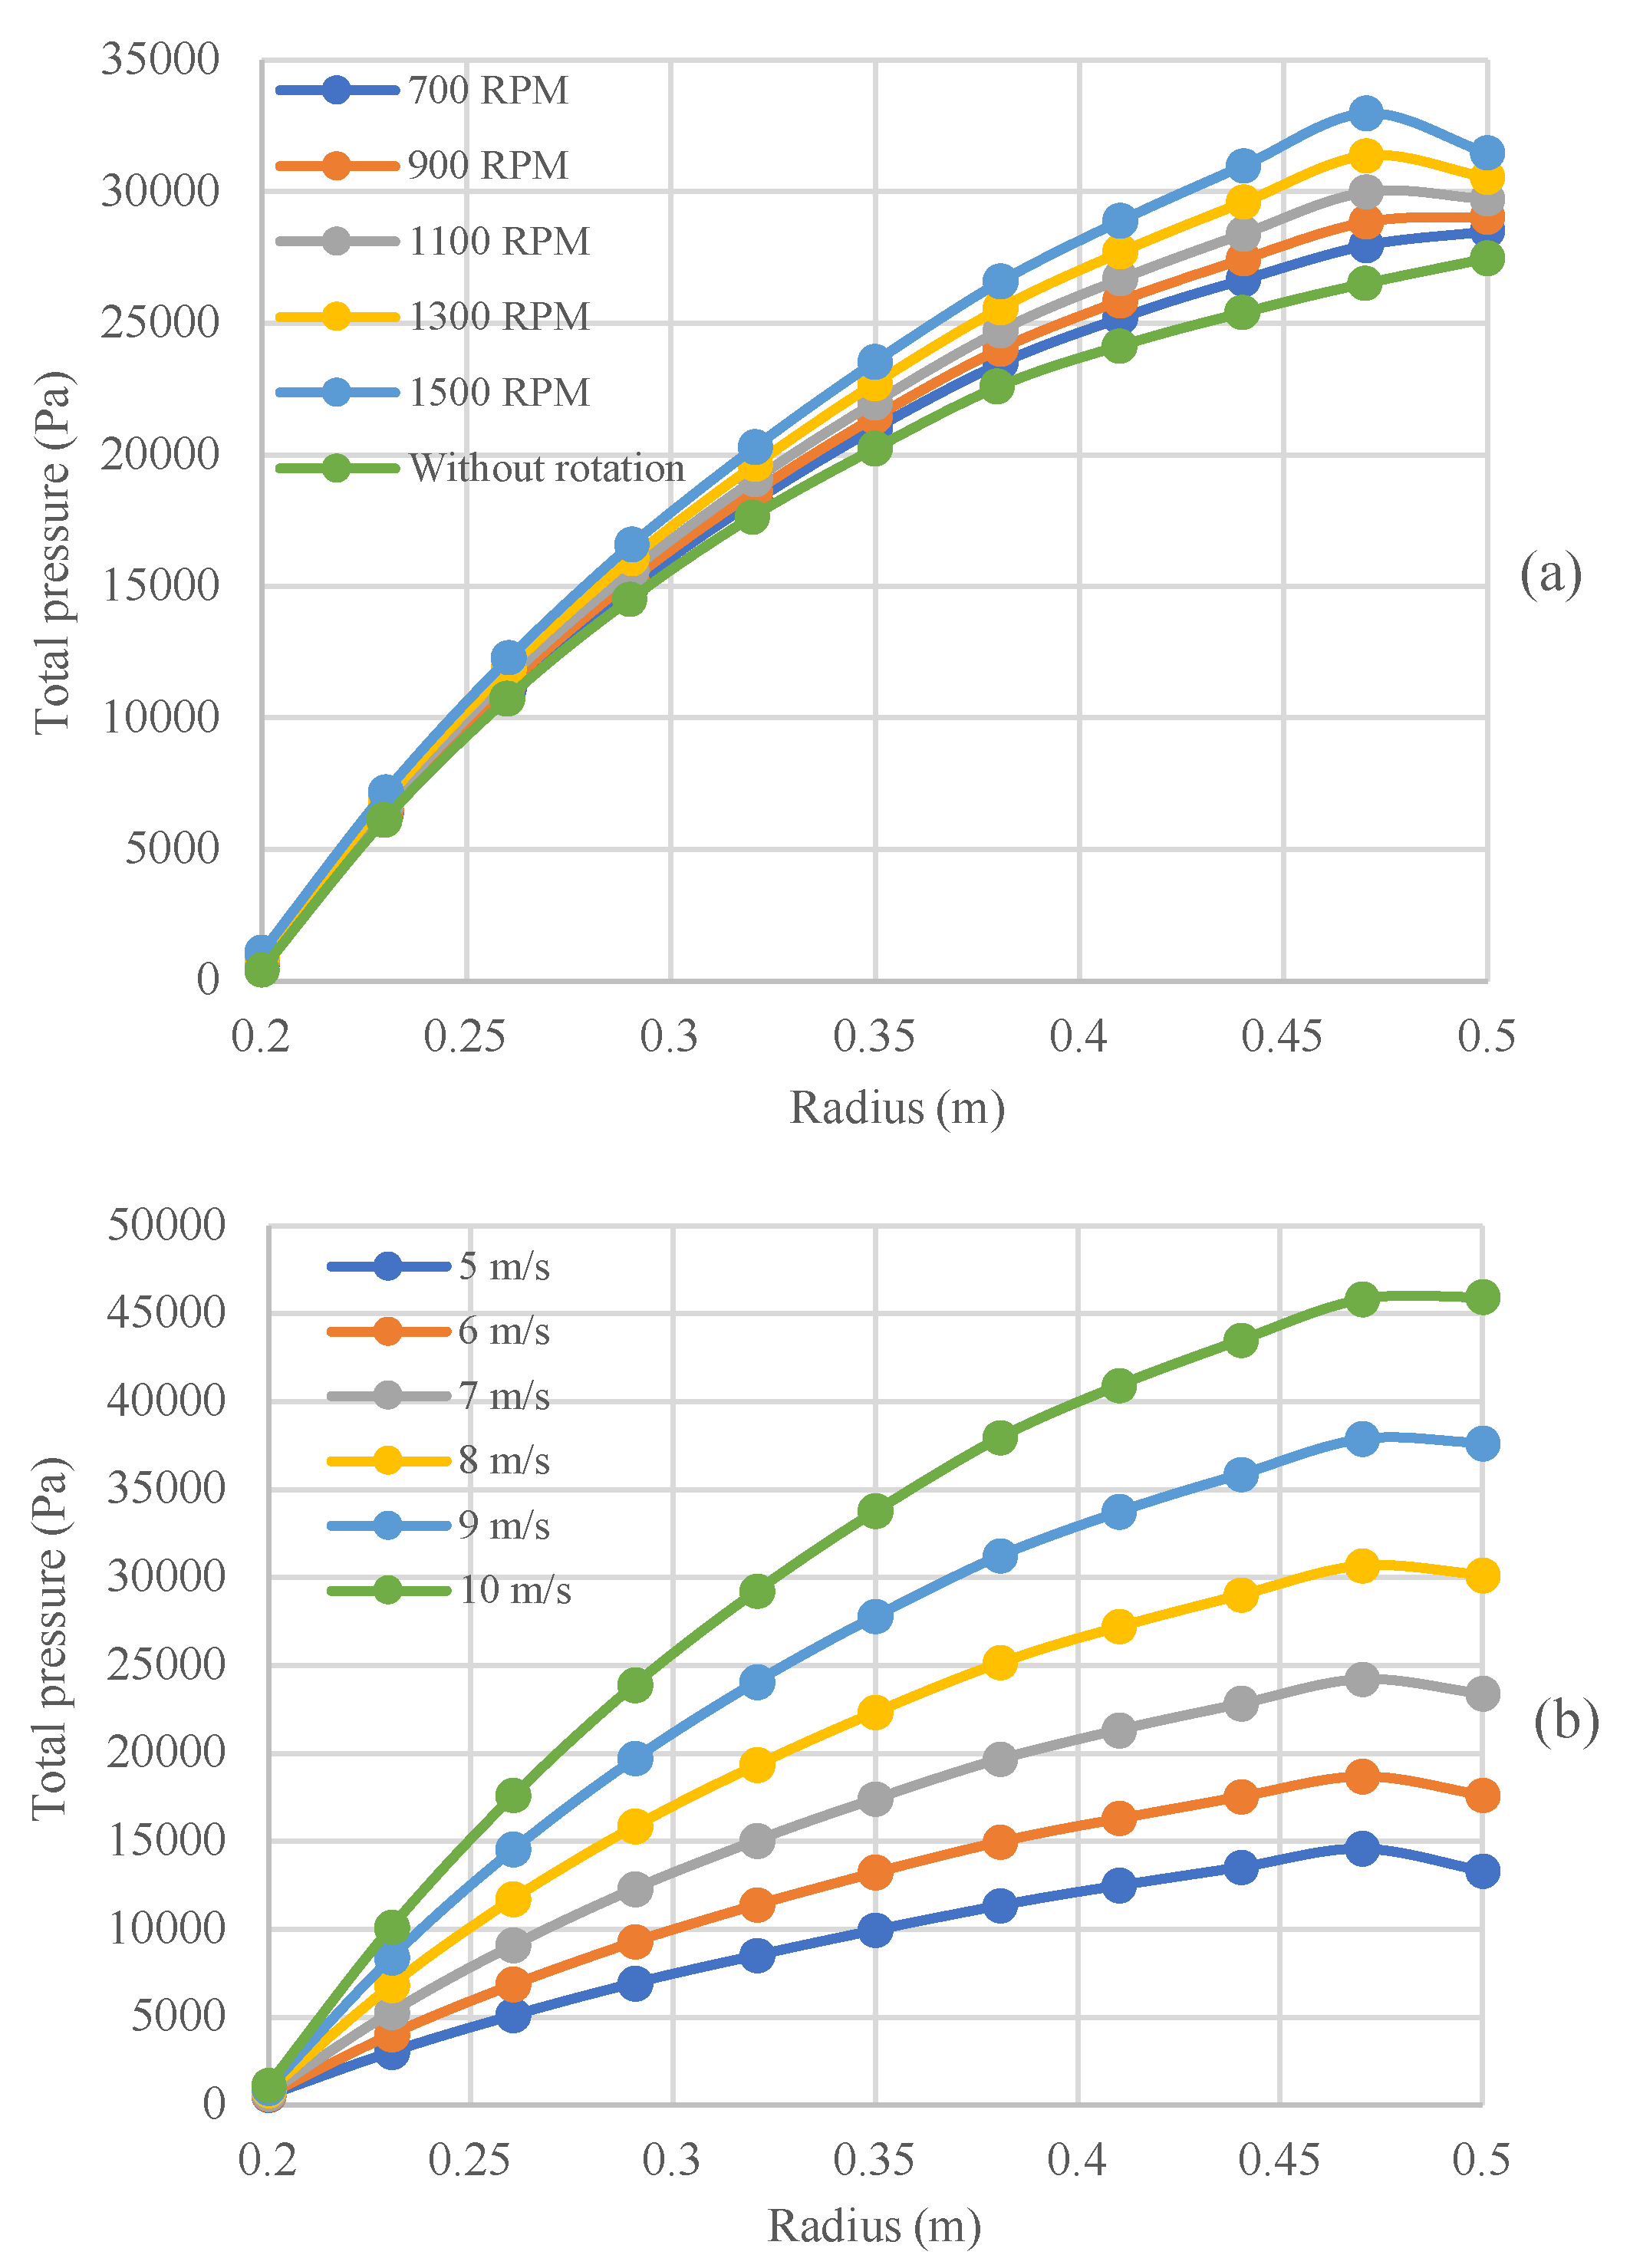
Figure 11.
Contours of velocity magnitude for gas flow in a stationary bed and the rotating beds with various rotation speeds, inlet velocity is 8 m/s for the flow in the bed with characteristics of case 1.
Figure 11.
Contours of velocity magnitude for gas flow in a stationary bed and the rotating beds with various rotation speeds, inlet velocity is 8 m/s for the flow in the bed with characteristics of case 1.
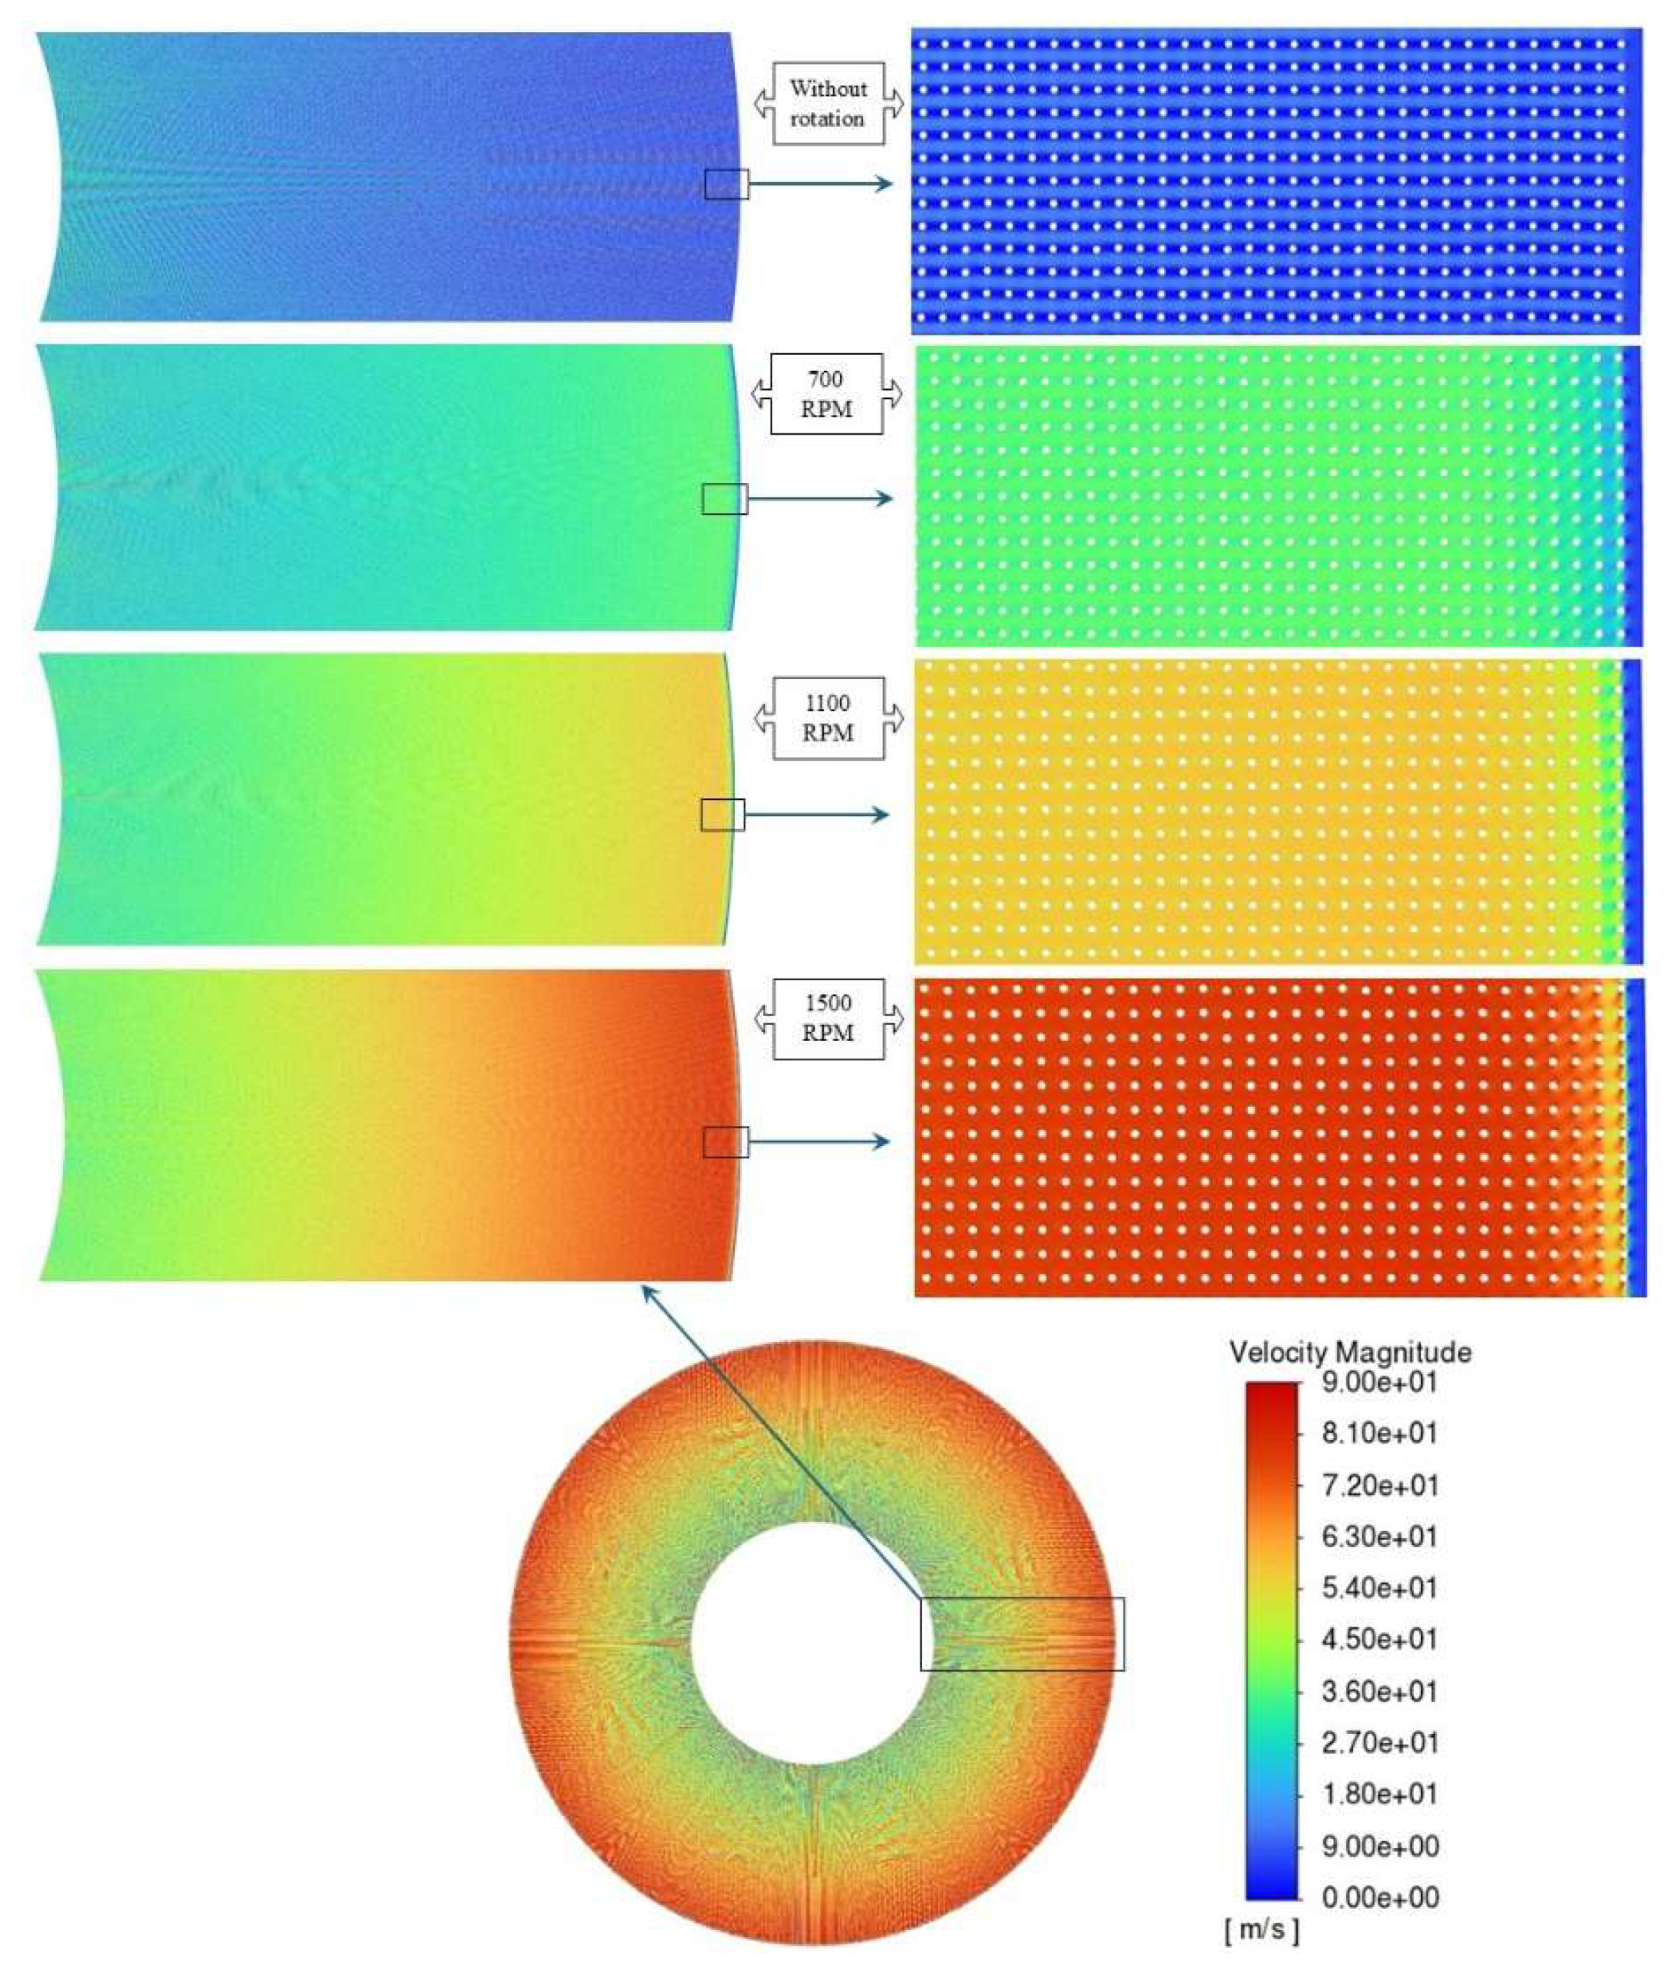
Figure 12.
Vectors of gas flow in a rotating bed with characteristics of case 1, the bed rotation is counterclockwise, and the vectors are plotted in absolute reference frame.
Figure 12.
Vectors of gas flow in a rotating bed with characteristics of case 1, the bed rotation is counterclockwise, and the vectors are plotted in absolute reference frame.
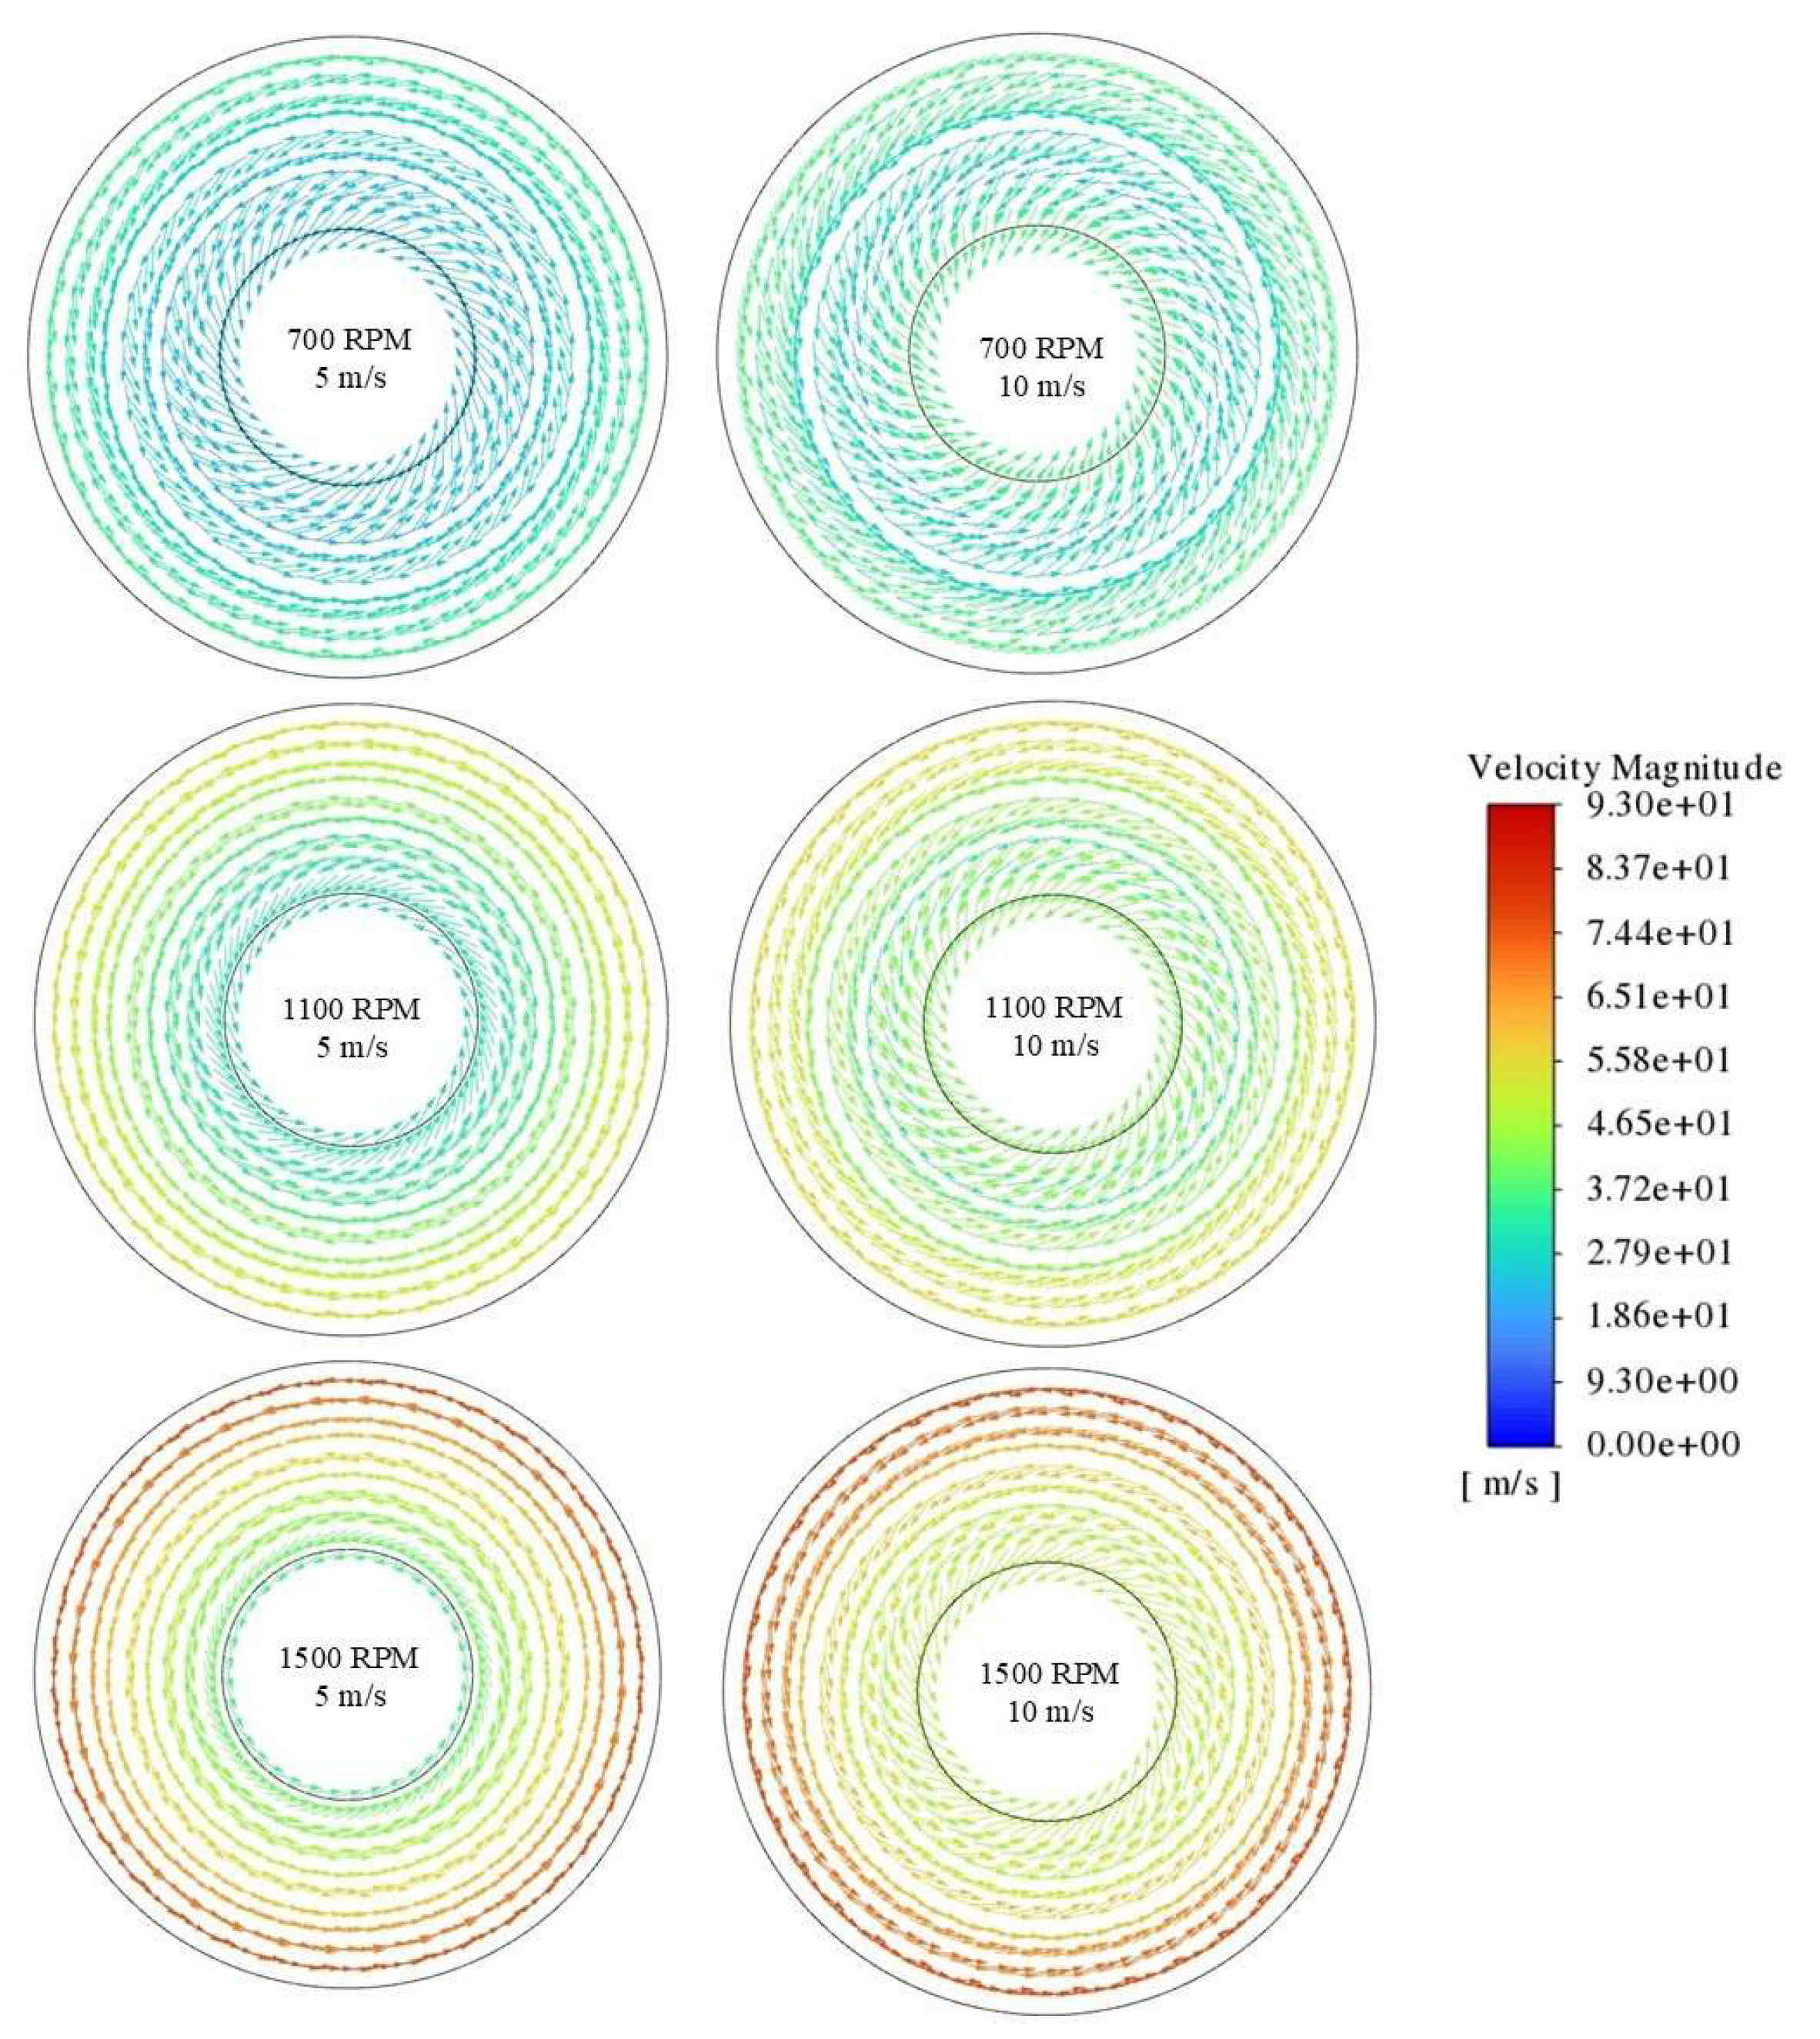
Figure 13.
Comparison of the friction factors derived from CFD result and the semiempirical correlations of current study and Neumann et al. [8].
Figure 13.
Comparison of the friction factors derived from CFD result and the semiempirical correlations of current study and Neumann et al. [8].
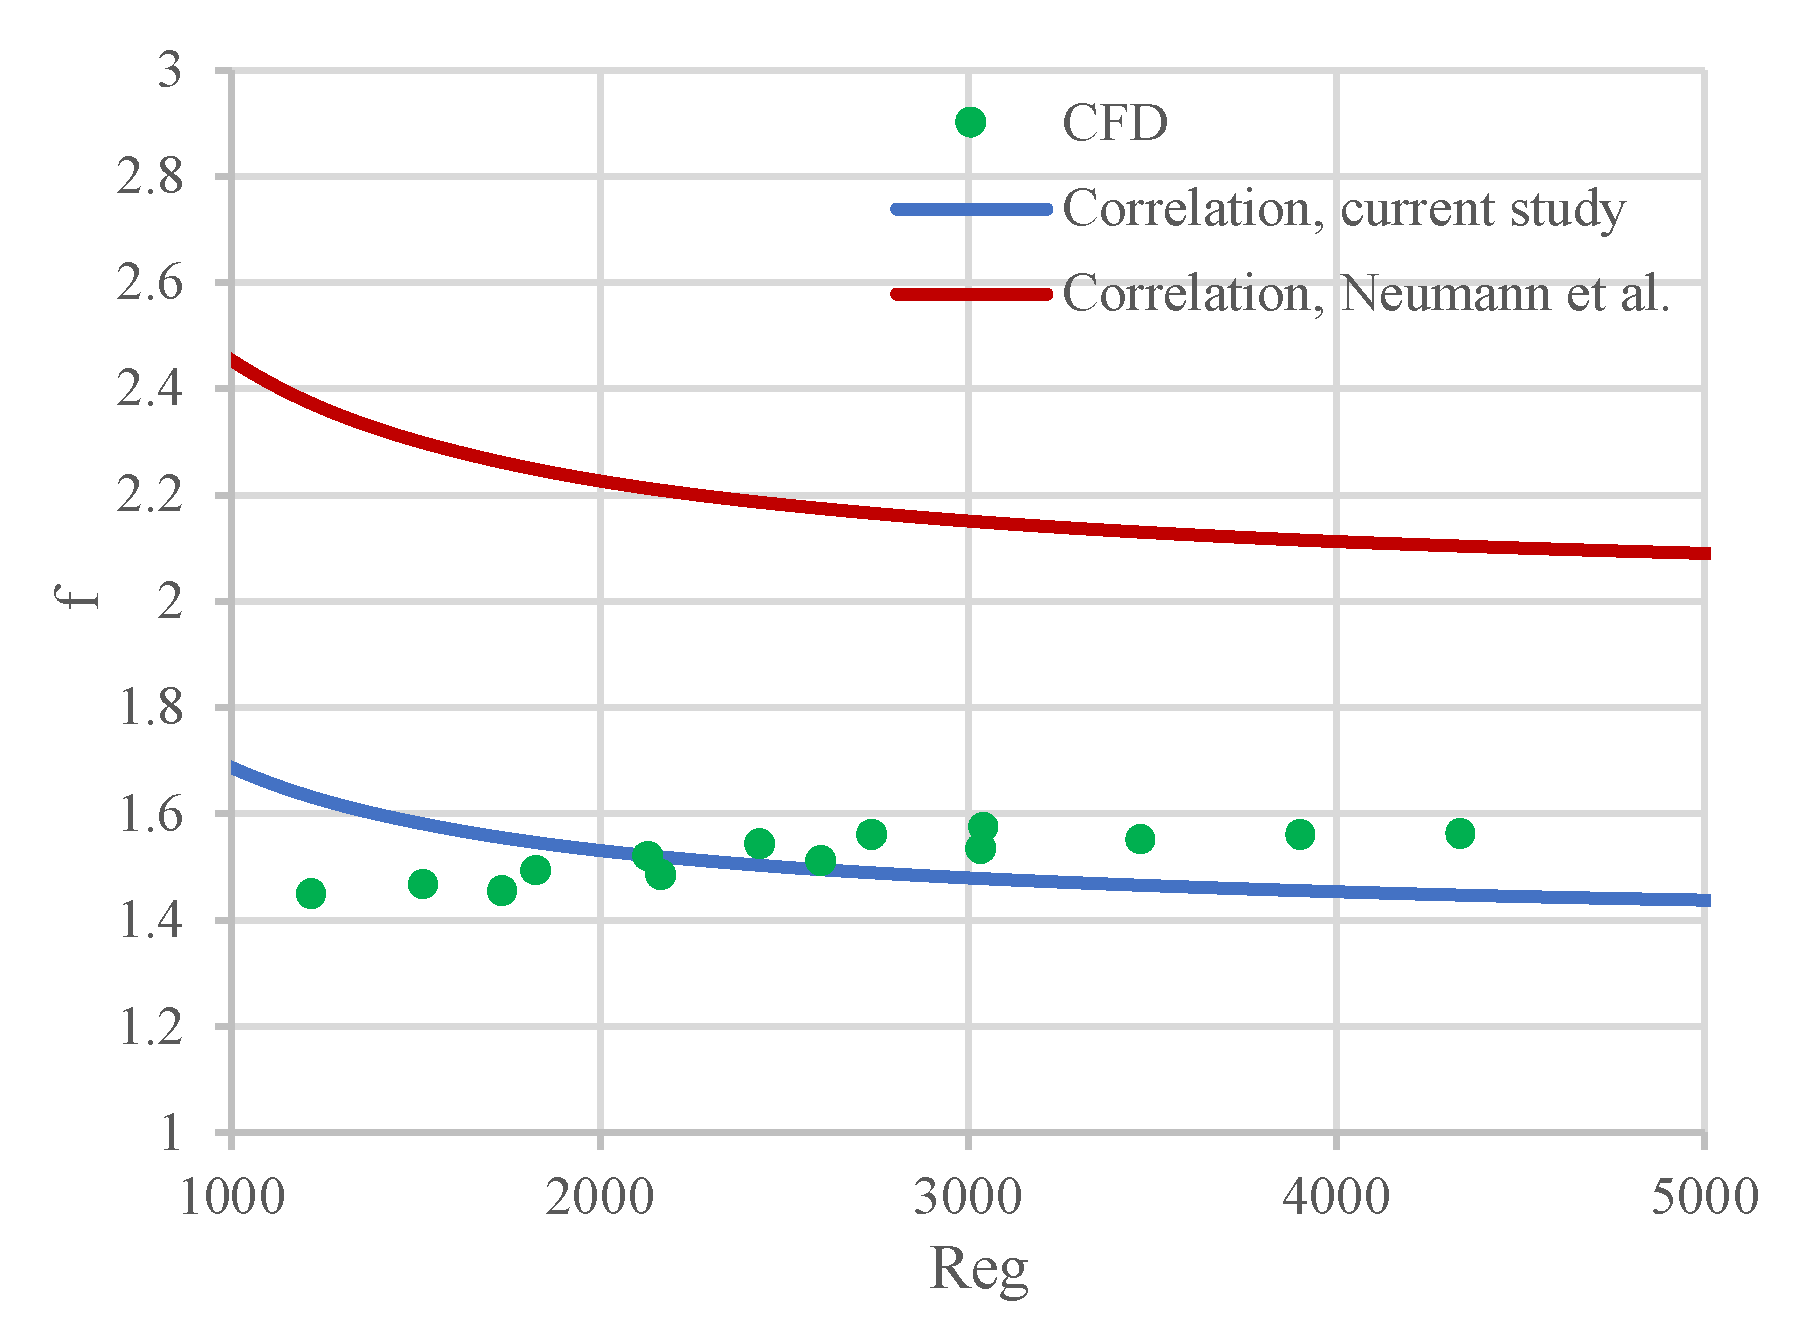
Figure 14.
Variation of centrifugal pressure drop with square of rotating speed obtained from CFD simulation and correlation.
Figure 14.
Variation of centrifugal pressure drop with square of rotating speed obtained from CFD simulation and correlation.
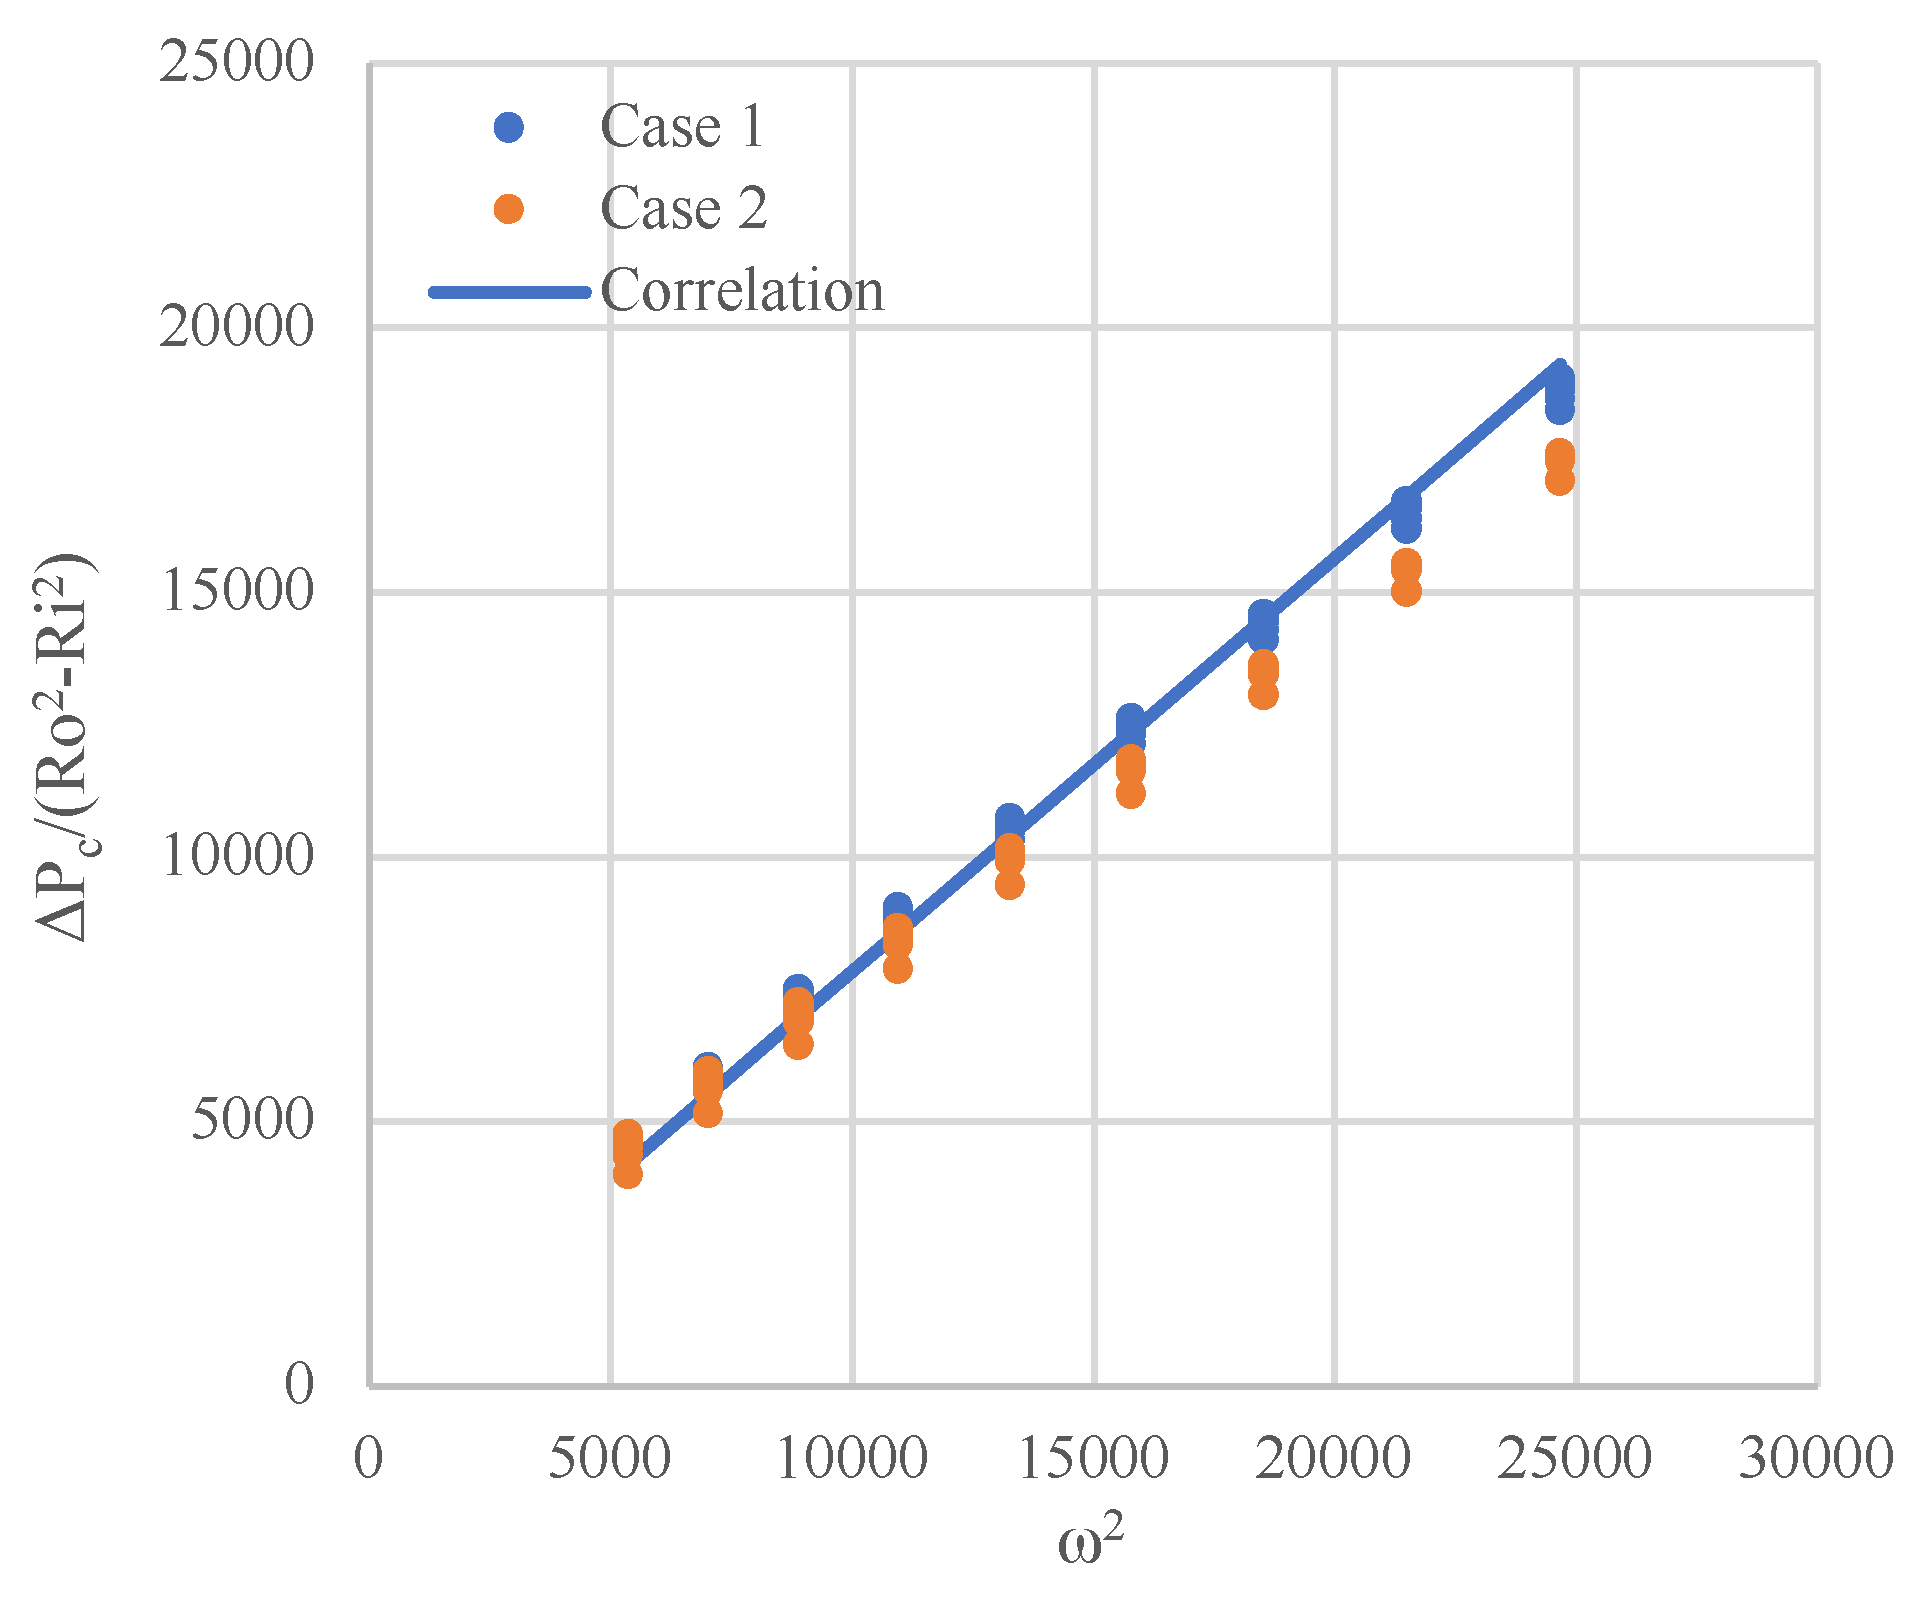
Figure 15.
Comparison of pressure drop (Pa) obtained from CFD simulation and the correlation.
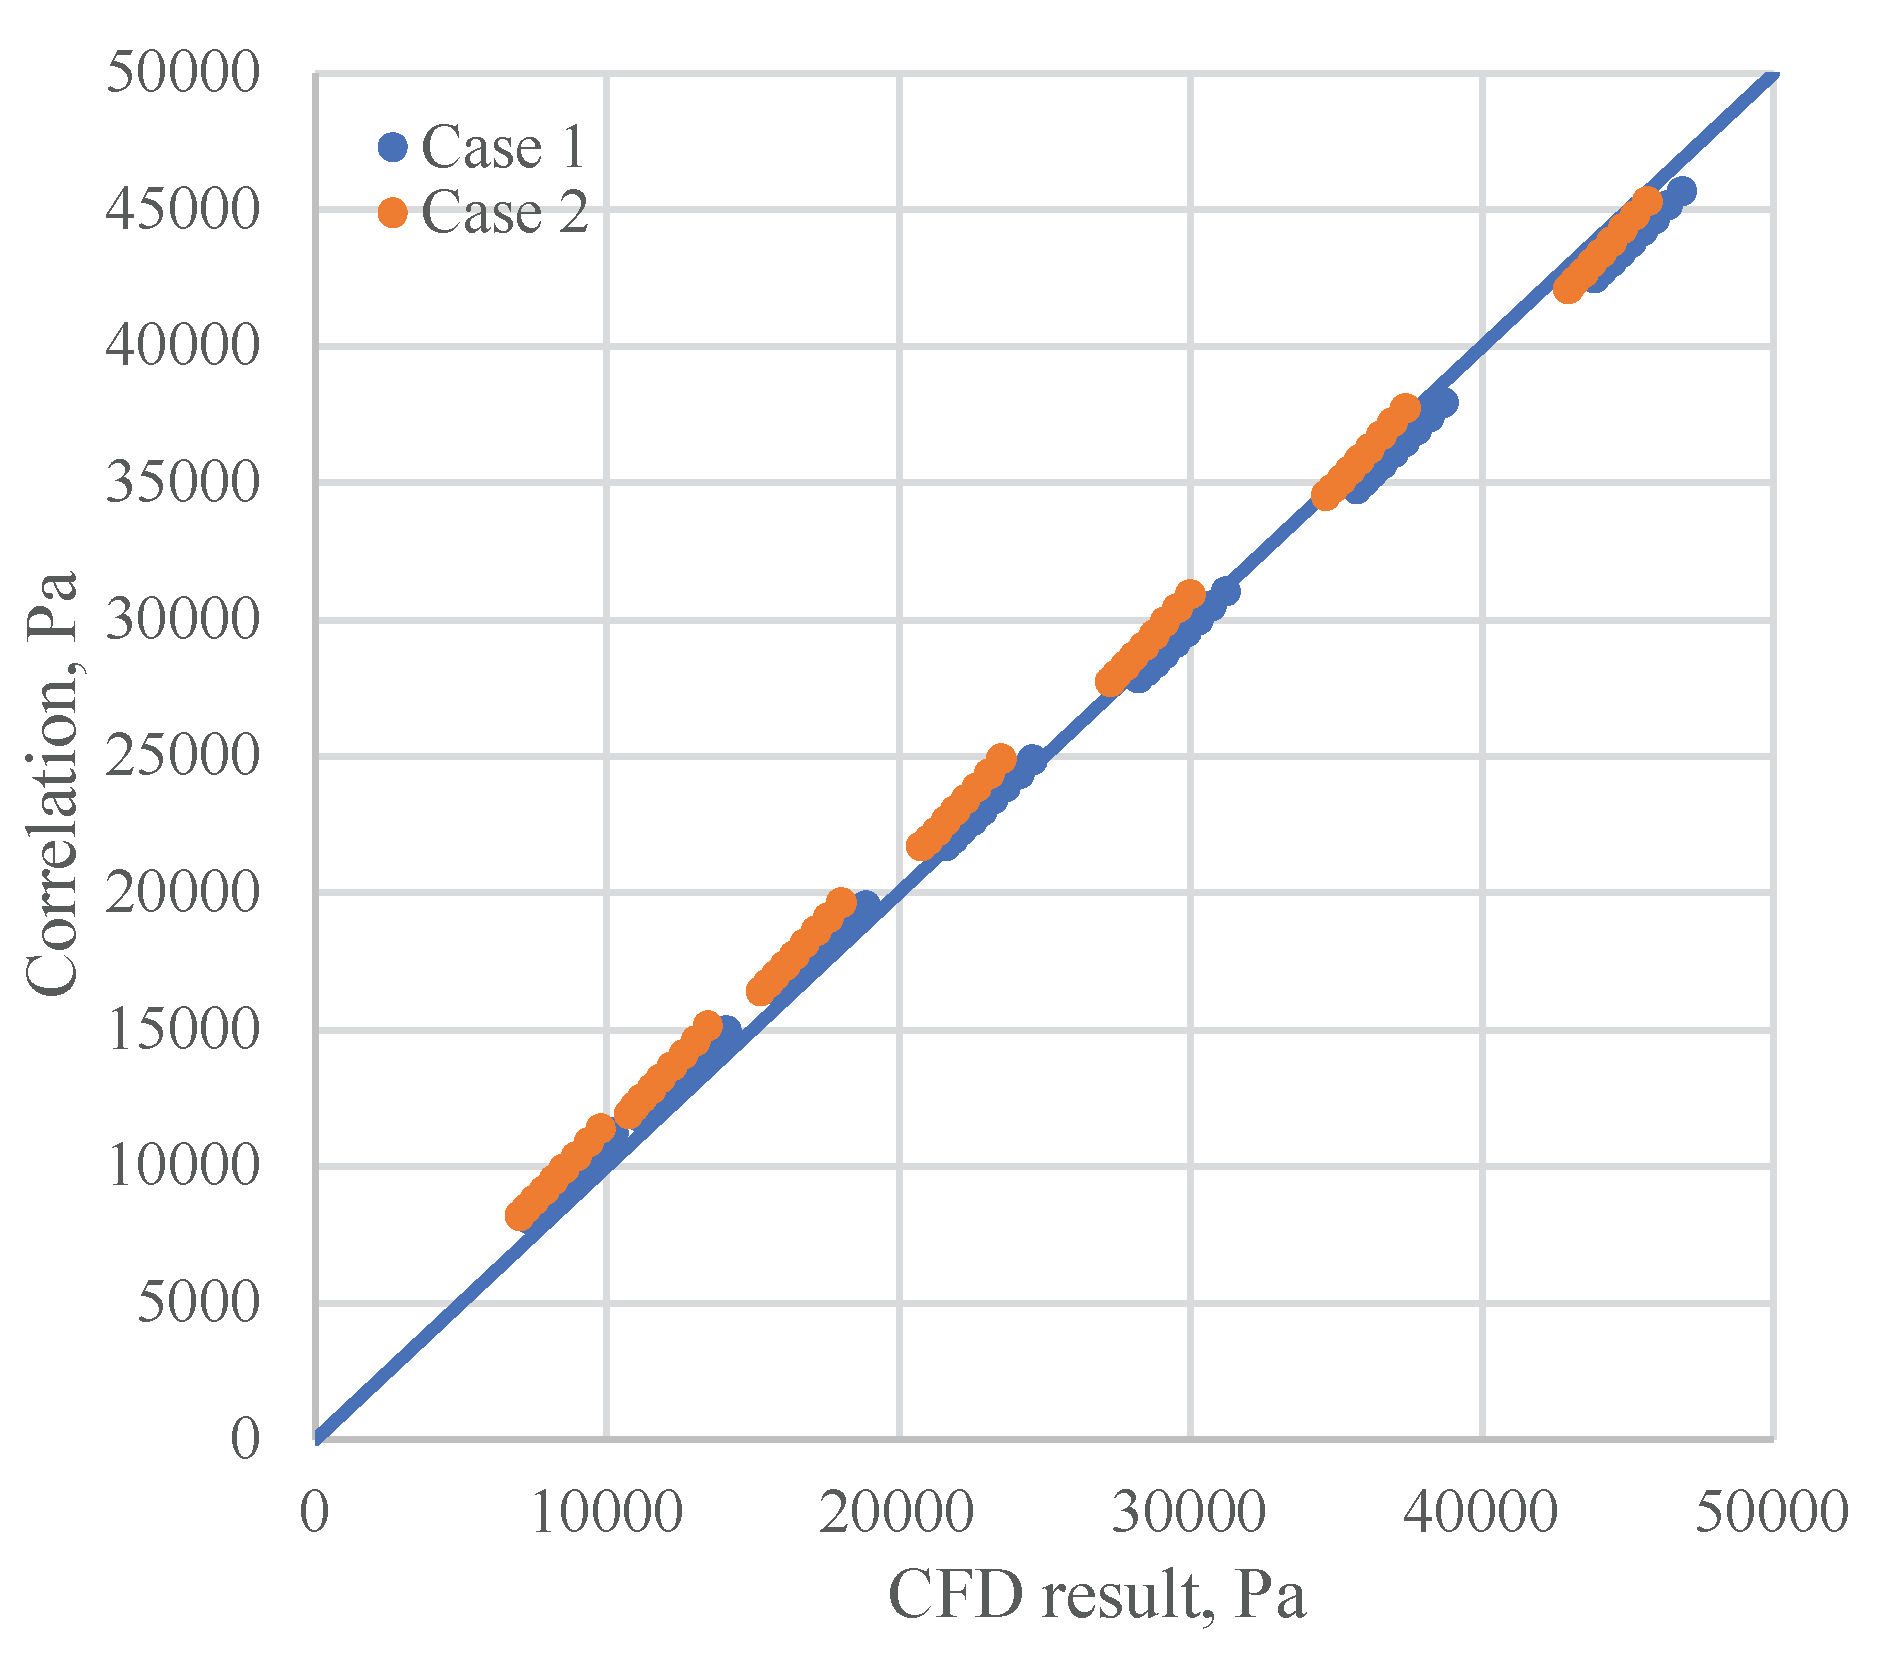

Table 1.
Characteristics of the simulation case studies.
| Case | Di (m) | Do (m) | ε | ap (m2/m3) | Dw (mm) | nw |
|---|---|---|---|---|---|---|
| 1 | 0.4 | 1 | 0.91 | 1447 | 0.2488 | 1,221,342 |
| 2 | 0.6 | 1.1 | 0.85 | 1800 | 0.3333 | 1,147,546 |
Table 2.
Simulation result for pressure drop (Pa) variation with inlet velocity (m/s) and rotating speed (RPM).
Table 2.
Simulation result for pressure drop (Pa) variation with inlet velocity (m/s) and rotating speed (RPM).
| Case 1 | |||||||||||
| Uinlet | 0 | 700 | 800 | 900 | 1000 | 1100 | 1200 | 1300 | 1400 | 1500 | |
| RPM | |||||||||||
| 4 | 6388 | 7332 | 7591 | 7880 | 8202 | 8553 | 8935 | 9348 | 9789 | 10260 | |
| 5 | 10189 | 11150 | 11412 | 11705 | 12031 | 12388 | 12773 | 13185 | 13631 | 14106 | |
| 6 | 14938.1 | 15916 | 16182 | 16477 | 16789 | 17161 | 17549 | 17968 | 18416 | 18888 | |
| 7 | 20635.4 | 21620 | 21890 | 22186 | 22514 | 22871 | 23261 | 23679 | 24129 | 24605 | |
| 7 | 27253.9 | 28249 | 28517 | 28813 | 29143 | 29503 | 29892 | 30306 | 30758 | 31233 | |
| 9 | 34705 | 35700 | 35966 | 36268 | 36601 | 36953 | 37342 | 37762 | 38215 | 38687 | |
| 10 | 42868.1 | 43866 | 44133 | 44443 | 44754 | 45120 | 45514 | 45931 | 46379 | 46866 | |
| Case 2 | |||||||||||
| 4 | 6171.2 | 7019 | 7264 | 7541 | 7847 | 8184 | 8550 | 8943 | 9362 | 9807 | |
| 5 | 9766.16 | 10778 | 10949 | 11227 | 11536 | 11871 | 12234 | 12623 | 13040 | 13480 | |
| 6 | 14317.67 | 15273 | 15521 | 15798 | 16102 | 16436 | 16796 | 17182 | 17594 | 18032 | |
| 7 | 19820.8 | 20792 | 21042 | 21322 | 21623 | 21952 | 22309 | 22690 | 23100 | 23535 | |
| 7 | 26272.76 | 27259 | 27507 | 27785 | 28086 | 28412 | 28766 | 29147 | 29556 | 29991 | |
| 9 | 33658.06 | 34652 | 34904 | 35181 | 35480 | 35806 | 36161 | 36545 | 36948 | 37385 | |
| 10 | 41941.1 | 42950 | 43204 | 43481 | 43778 | 44100 | 44453 | 44836 | 45245 | 45684 | |
Disclaimer/Publisher’s Note: The statements, opinions and data contained in all publications are solely those of the individual author(s) and contributor(s) and not of MDPI and/or the editor(s). MDPI and/or the editor(s) disclaim responsibility for any injury to people or property resulting from any ideas, methods, instructions or products referred to in the content. |
© 2025 by the authors. Licensee MDPI, Basel, Switzerland. This article is an open access article distributed under the terms and conditions of the Creative Commons Attribution (CC BY) license (http://creativecommons.org/licenses/by/4.0/).
Copyright: This open access article is published under a Creative Commons CC BY 4.0 license, which permit the free download, distribution, and reuse, provided that the author and preprint are cited in any reuse.


