
Submitted:
23 August 2025
Posted:
26 August 2025
You are already at the latest version
Abstract
Informal E-waste recycling releases complex mixtures including heavy metals that bioaccumulate in exposed populations, including e-waste workers. Emerging evidence suggests that these metals contribute to telomere attrition, leading to cellular aging and non-communicable diseases (NCDs). This study investigated the longitudinal impact of repeated metal exposures on telomere length among e-waste workers in Ghana. A total of 78 study participants (53 e-waste workers and 25 reference group) were included in the study. Blood and urine samples were used for 3- repeated measurements of telomere length using real-time polymerase chain reaction. Using restricted cubic spline modelling, the study observed shorter telomere length among the e-waste workers compared to the reference group, and this was more evident among the burners within the e-waste workers population. There was a negative association between Pb, Cr levels, and telomere length. Zn was positively associated with telomere length, while a nonlinear association was observed between Mg levels and telomere length. The consistently shorter relative telomere length among e-waste workers coinciding with higher concentrations of Cr and Pb, implicates the role of metals in telomere shortening. Future research should utilize longer follow-up longitudinal studies with a larger sample size to confirm these findings.
Keywords:
telomere length
; q-PCR
; e-waste
; metals
; restricted cubic spline
1. Introduction
Metals are ubiquitous and persistent environmental pollutants that pose a significant public health concern [1,2,3,4,5]. These metals, often released through industrial activities such as mining, agriculture, fossil fuel combustion, and electronic waste (e-waste) recycling, accumulate in the environment and can be readily absorbed by humans through inhalation, ingestion, and dermal contact [2,5]. E-waste recycling has been shown to release a complex mixture of metals, including lead (Pb), chromium (Cr), cadmium (Cd), and arsenic (As), which are known to bioaccumulate in workers and surrounding communities [6,7].
Several studies have linked metal exposure to adverse health effects, ranging from gastrointestinal, respiratory, cardiovascular, reproductive, renal, hemopoietic, neurological, diabetes, and genetic mutations that contribute to cancer risk [8,9,10,11,12]. Of particular interest is the impact of these metals on telomeres – protective structures at the ends of chromosomes that play a crucial role in maintaining genomic stability [13,14,15]. Telomeres naturally shorten with age; however, environmental factors such as metal-induced oxidative stress can accelerate this process, thereby contributing to premature cellular aging, DNA damage and increased risk for non-communicable diseases (NCDs) such as chronic kidney disease, cardiovascular disease, diabetes, and various other health conditions [16,17].
Metals such as Pb, Cr, As, and Cd have been shown to induce telomere shortening via oxidative stress by directly distorting the DNA structure. These replace essential elements in telomere-associated proteins or directly inhibit telomerase, the enzyme responsible for maintaining telomere length [18] (Lai et al., 2022; X. Zhang et al., 2013, [19,20]. Given that telomere shortening, contributes to genomic instability and apoptosis, understanding its relationship with metal exposure is essential for addressing adverse health outcomes, including specific NCD risks that are associated with derangement in the telomere region [15]
Despite some evidence of the association between metals exposures and DNA damage, most studies in this area have been mostly cross-sectional with limited or no opportunity to conduct causal inference [14,18,20,21,22,23] and do even offer clear linkage to specific markers of DNA damage. This study designed to address this gap by conducting a longitudinal study that looked at the effect of repeated exposures to metals on telomere length. In addition, while previous research has largely excluded populations in low- and middle-income countries (LMICs), this study focuses on e-waste workers in Ghana, an LMIC where environmental and occupational exposures to metals are prevalent yet under-researched in terms of their long-term health impacts. This study, therefore, aimed to add to the limited literature on this subject by examining the effect of heavy metals exposure on telomere length.
2. Methods
2.1. Study Setting, Population, and Design
The study was conducted in two locations in Ghana: The Agbogbloshie e-waste recovery site in Accra and Madina Zongo, a reference community approximately 18 kilometres northeast of Agbogbloshie with no known history of e-waste exposure. Detailed descriptions of the geographic settings of these sites have been previously published [24]. Study participants were enrolled in the West Africa-Michigan CHARTER II for Global Environmental and Occupational Health (GEOHealth), a longitudinal cohort study with four waves of data collection among e-waste recovery workers at the Agbogbloshie e-waste site in Accra, Ghana. Data for the current study were obtained from this study. Details about the GeoHealth II study design and participant recruitment have been described elsewhere [24,25]. For this study, we selected and analysed a sub-sample of the archived GEOHealth II study samples with 3-repeat measurement for each participant for telomere length analysis. In the end, a final sample size of 78 participants with 3 repeated measurements, comprising a total of 53 e-waste workers and 25 controls or reference group were included in this analysis. The study protocol for re-analyses of the archived samples was additionally approved by the College of Health Sciences Ethical and Protocol Review Committee, University of Ghana (Approval Number: CHS-Et/M.6-P4.4/2-23-2024), and the Institute of Tropical Medicine, Nagasaki University, Japan (Approval Number: 240919317).
2.2. Blood and Urinary Metal Measurements
Blood levels of metals including Arsenic (As), Chromium (Cr) Lead (Pb), Magnesium (Mg), Zinc (Zn), Gallium (Ga), and Selenium (Se), were determined by inductively coupled plasma mass spectrometry (Varian 820-MS, California, USA). The experimental method and operation procedures have been described in [26]. Briefly, all tubes and pipette tips were acid-washed (cleaned, soaked for 24 hours in 10% hydrochloric acid, and rinsed three times with Milli-Q water) prior to use. Matrix-specific reference materials (INSPQ; QM-B-Q1505, QM-B-Q1506, QM-B-Q1314 blood; QM-U-Q1109 urine) from the Institut National de Santé Publique du Québec were used to ensure analytical accuracy. In addition, analytical standards were used to derive standard curves and assess recovery for each element. To ensure precision, every 12th sample in each batch was processed in duplicate (digestion and ICP-MS analysis). Procedural blanks were included in each batch to calculate the theoretical detection limit for each element as three times the standard deviation of the mean blank value.
2.3. DNA Extraction for Telomere Length Measurement
DNAs were extracted from the whole blood using the QIAamp DNA mini kit (Qiagen, Valencia, C.A) at the laboratories of Noguchi Memorial Institute for Medical Research, University of Ghana, following the manufacturer’s instructions. Briefly, 400ul of the thawed whole blood was transferred to newly labelled Eppendorf tubes, 40ul of proteinase K and 400ul of Buffer AL were added and mixed thoroughly. The mixture was incubated at 56oC for 10 minutes, followed by a short spin using a mini centrifuge. About 400ul of absolute ethanol was added to the mixture, mixed thoroughly and short span. The mixture was then transferred into a labelled spin column with an attached collection tube and centrifuged at 6000xg for a minute. The spin column was then placed on a new collection tube and subjected to two washes using 500ul for each AW1 and AW2 wash buffer. The spin column was then transferred to a new collection tube, and 50ul elution buffer AE was carefully pipetted into the spin filter to elute the DNA. The tubes were allowed to stand for 3 minutes at room temperature, followed by centrifugation at high speed for a minute. The eluted DNA was finally pipetted out into a newly labelled screw cap tube, and its purity and quantity were assessed using Nanodrop spectrophotometer. The extracted DNA was then stored at -80oC until shipment to the Institute of Tropical Medicine, Nagasaki University, Japan, for telomere length analysis.
2.4. Telomere Length Measurement
Telomere length was measured using quantitative real-time polymerase chain reaction (qPCR) technique (Joglekar et al., 2020). The qPCR master mix included Light Cycler® 480 SYBR Green I Master (Roche Diagnostics K.K., Minato-ku, Tokyo), forward and reverse primers targeting the telomere region and the albumin gene, and nuclease-free water (Takara Bio, Kusatsu, Shiga). The mixture was dispensed into a LightCycler® 480 Multiwell Plate 96 (Roche Diagnostics K.K., Minato-ku, Tokyo), and 2 µl of template DNA was added to each well. Each DNA sample was analysed in triplicate, and the average Ct value from the three wells was used for telomere length calculation. The average telomere length per cell was determined using ∆∆Ct analysis based on the Ct values from telomere and albumin amplifications.
Control DNA (telomere length: 1.23 Mb) from the Absolute Telomere Length Quantification qPCR Assay Kit (ScienCell Research Laboratories, Carlsbad, CA) was used as a reference. Control DNA was included in each PCR run, and the telomere length of the samples was calculated as a relative ratio to the control DNA.
2.5. Statistical Analysis
Shapiro wilk test and histogram were used to assess the normality of the metals and relative telomere length. All the Metals concentrations were not normally distributed (S. wilk test; p value > 0.0001) and the distribution of the data using histogram showed skewness either to the left or right. However, relative telomere length data assumed normality. Descriptive statistics were used to summarize the participants’ socio-demographic and lifestyle characteristics for the study. Continuous normally distributed variables were presented as mean ±SD and categorical variables were presented as frequencies (percentage). Blood metal concentrations were presented as median (interquartile range). Mann whitney U test was used to compare the median blood metal levels between e-waste group and the reference group. T. Test was used to compare the mean continues variables between e-waste workers and the reference population and chi square test was used to compare the categorical variables of the e-waste workers and the reference population. Quantile regression model was used to compare the median blood metal levels for e-waste workers and reference groups across waves.
One-way Anova was used to compare mean relative telomere length of the various job task and to compare the mean relative telomere length within and between age categories, BMI, smoking and alcohol consumption status for e-waste and reference group. Restricted cubic spline (RCS) was used to determine the linear and nonlinear associations between each of the blood metal levels and rTL. All analyses were performed using STATA version 15 and p ≤ 0.05 was considered statistically significant for all analyses. For the RCS analysis p for non-linear ≤ 0.05 was considered statistically significant for non-linear association. The association between the metals and the relative telomere length were presented as graphs
3. Results
3.1. Characteristics of Study Participants
The mean age for the study population (N=78) was 27.7±7.9 years; the e-waste workers (n=53) recruited into this study were significantly younger (mean age=25.9 ± 6.5 years) than that of the reference group (n=25) (mean=31.6±9.2 years). Though the BMIs of the e-waste workers and the reference group were within the normal WHO reference range, the reference group had significantly higher BMI (24.4±4.1) compared to the e-waste workers (21.7±2.8). There was no significant difference between the educational status, biomass fuel usage, alcohol consumption and smoking status between e-waste workers and the reference group (Table 1). Over 60% of the e-waste workers slept at the e-waste recycling site while almost 40% slept less than 1km away from the site. About 18.9% of the e-waste workers did not have any formal education compared to 8% in the reference group. Further to this, more e-waste workers (37.7%) had education up to only middle school compared to 44% attaining education up to secondary school and higher of the comparison group. There were similar or comparable proportions of biomass fuel usage, alcohol consumption and smoking status among both e-waste workers and the reference group (Table 1).
The different job task for the e-waste workers were collectors/sorters representing 18.9%; dismantlers (54.7%) and burners (26.4%) (Table 1).
3.2. Blood Metal Levels for the Study Population
The median blood metal concentration for the seven (7) metals (Pb, As, Cr, Zn, Mg, Se and Ga) which were studied ranged from 1.1µg/L-31835.2µg/L (Table 2a). There was a statistically significant difference in blood metals concentrations of the e-waste workers and the reference group. For instance, the blood Pb concentration was significantly higher in e-waste workers compared to that of the reference group while the blood Se concentration was significantly higher in the reference group compared to the e-waste workers (all p < 0.05) (Table 2a)
Furthermore, blood Pb concentration was consistently significantly higher in e-waste workers across all the three repeated measurements (waves) compared to the reference group (Table 2b). However, significantly higher levels of blood Cr concentration were observed in the e-waste workers compared to reference group for only wave one but not in wave 2 & 3 (p = 0.015) (Table 2b). Also, significantly higher levels of blood Mg concentration were observed in the reference group compared to the e-waste workers for only wave one but not waves 2 & 3 (p = 0.047) (Table 2b). On the other hand, blood Se levels were significantly higher among the reference group compared to e-waste workers in wave 1&3 but not in wave 2 (P values = 0.018 & 0.025 respectively) (Table 2b)
3.3. Urine Metal Levels Across Key Groups
The median urine metal concentration for the seven (7) metals (Pb, As, Cr, Zn, Mg, Se and Ga), which we studied ranged from 1.1µg/L-53370.2µg/L (Table 3a). While urine Pb concentration was significantly higher among the e-waste workers compared with the reference group, urine As, Ga and Se concentrations were significantly higher among the reference group compared to the e-waste workers (all p < 0.05) (Table 3a).
Also, the study observed consistently higher urine Pb concentration levels among e-waste workers across all the three repeated measurements (waves) compared to the reference group (Table 3b). Yet, urine As and Se concentration levels were consistently higher among the reference group compared to the e-waste workers (Table 3b). Additionally, the study observed fluctuations in the urine levels of some metals concentrations across the three waves, for instance, urine Cr concentration levels were higher among the e-waste workers in waves 1 & 2 but lower in wave 3 compared to the reference group (Table 3b). Urine Zn and Ga levels were significantly higher among e-waste workers in only wave 2 (p = 0.011 and p = 0.022 for Zn and Ga respectively) (Table 3b) but lower urine Zn and Ga were observed among e-waste workers in waves 1& 3 compared to the reference group (Table 3b).

Table 3.
a. Urine metal concentration for the study population and their comparison between e-waste workers and the reference group. b. Urine metals concentrations across groups over time.
Table 3.
a. Urine metal concentration for the study population and their comparison between e-waste workers and the reference group. b. Urine metals concentrations across groups over time.
| (a) | |||||||||
| Metal (µg/L) | E-waste workers (n=53) | Reference Population (n=25) | p value | Study Population (N=78) | |||||
| Median (IQR) | |||||||||
| Zn | 892.75 (1091.625) | 922.725(1168.9) | 0.7037 | 903.775 (1109.5) | |||||
| Pb | 5.125(4.7225) | 3.3225(2.08) | <0.0001 | 4.4125(4.1675) | |||||
| As | 36.885(37.295) | 60.255(64.455) | 0.0001 | 42.335(54.0875) | |||||
| Mg | 53520.45(55920.33) | 50240.18(55264.42) | 0.6300 | 53370.27(55920.33) | |||||
| Cr | 8.8375(5.4975) | 8.6425(7.09) | 0.8984 | 8.7075(6.0025) | |||||
| Ga | 1.12395(.0741) | 1.1747(.1338) | 0.0012 | 1.1384(.09465) | |||||
| Se | 26.2425(24.8075) | 34.8825(28.1975) | 0.0045 | 28.6075(26.065) | |||||
| Legend: IQR=interquartile range, N= Total number of participants, n = sub study population, p-value obtained using Mann Whitney U test, bold p-values are statistically significant. | |||||||||
| (b) | |||||||||
| Wave | Metal (µg/L) | Total (N=78) | |||||||
| E-waste workers (n=53) | Reference population (n=25) | ||||||||
| Median (IQR) | Median (IQR) | Difference | p-value | ||||||
| One | Zn | 976.8(5154.05) | 1333.35(690.75) | 356.55 | 0.717 | ||||
| Pb | 6.06(5.135) | 3.54(2.29) | 2.52 | 0.024 | |||||
| As | 37.05(45.93) | 61.06(67.28) | 24.01 | 0.078 | |||||
| Mg | 66910.15(57534.95) | 76954.6(59855.86) | 10044.45 | 0.491 | |||||
| Cr | 8.495(5.38) | 8.1(1.78) | .395 | 0.706 | |||||
| Ga | 1.111(.0677) | 1.1755(.3526) | .0645 | 0.108 | |||||
| Se | 27.135(24.735) | 39.505(36.675) | 12.37 | 0.065 | |||||
| Two | Zn | 723.6(489.45) | 436.6(361.95) | 287 | 0.011 | ||||
| Pb | 4.175(3.505) | 2.465(2.305) | 1.71 | 0.034 | |||||
| As | 32.68(25.54) | 56.105(51.725) | 23.425 | 0.009 | |||||
| Mg | 64104.25(61577.71) | 44512.87(40590.24) | 19591.38 | 0.170 | |||||
| Cr | 8.17(3.28) | 6.965(4.89) | 1.205 | 0.214 | |||||
| Ga | 1.1639(.0696) | 1.1126(.1202) | .0513 | 0.022 | |||||
| Se | 24.12(15.85) | 28.81(23.995) | 4.69 | 0.330 | |||||
| Three | Zn | 1030.625(1702.6) | 1460.425(2662.1) | 431.65 | 0.378 | ||||
| Pb | 5.1625(3.92) | 4.055(1.565) | 1.2 | 0.157 | |||||
| As | 37.51(66.105) | 60.255(72.435) | 22.99 | 0.210 | |||||
| Mg | 44282.43(25635.85) | 43007.94(16955.61) | 1313.25 | 0.770 | |||||
| Cr | 12.1425(7.785) | 14.8825(8.67) | 2.945 | 0.170 | |||||
| Ga | 1.11275(.0492) | 1.2012(.0751) | .091 | <0.001 | |||||
| Se | 28.9525(30.54) | 37.175(41.215) | 9.905 | 0.282 | |||||
Legend: IQR=interquartile range, N= Total number of participants, n = sub study population, p-value and difference in median obtained using quantile regression test, bold p-values are statistically significant.
3.4. Relative Telomere Length for the Study Population
The average telomere length for the e-waste workers was shorter (1.358±0.557; mean±SD) compared to the reference group (1.464±0.630; mean±SD) (Table 3a and Figure 1a). Furthermore, telomere length for the e-waste workers at wave 2 and wave 3 (1.434±0.403 and 1.323±0.673 for wave 2 and 3 respectively) were also shorter compared to the reference group (1.663±0.571 and 1.504±0.722 for wave 2 & 3 respectively) (Table 3a). The median rTL for the e-waste workers in wave 2 was significantly shorter compared to the reference group (p = 0.019) (Figure 1b) which may indicate higher risk of premature aging and related health issues among the e-waste workers compared to the reference group
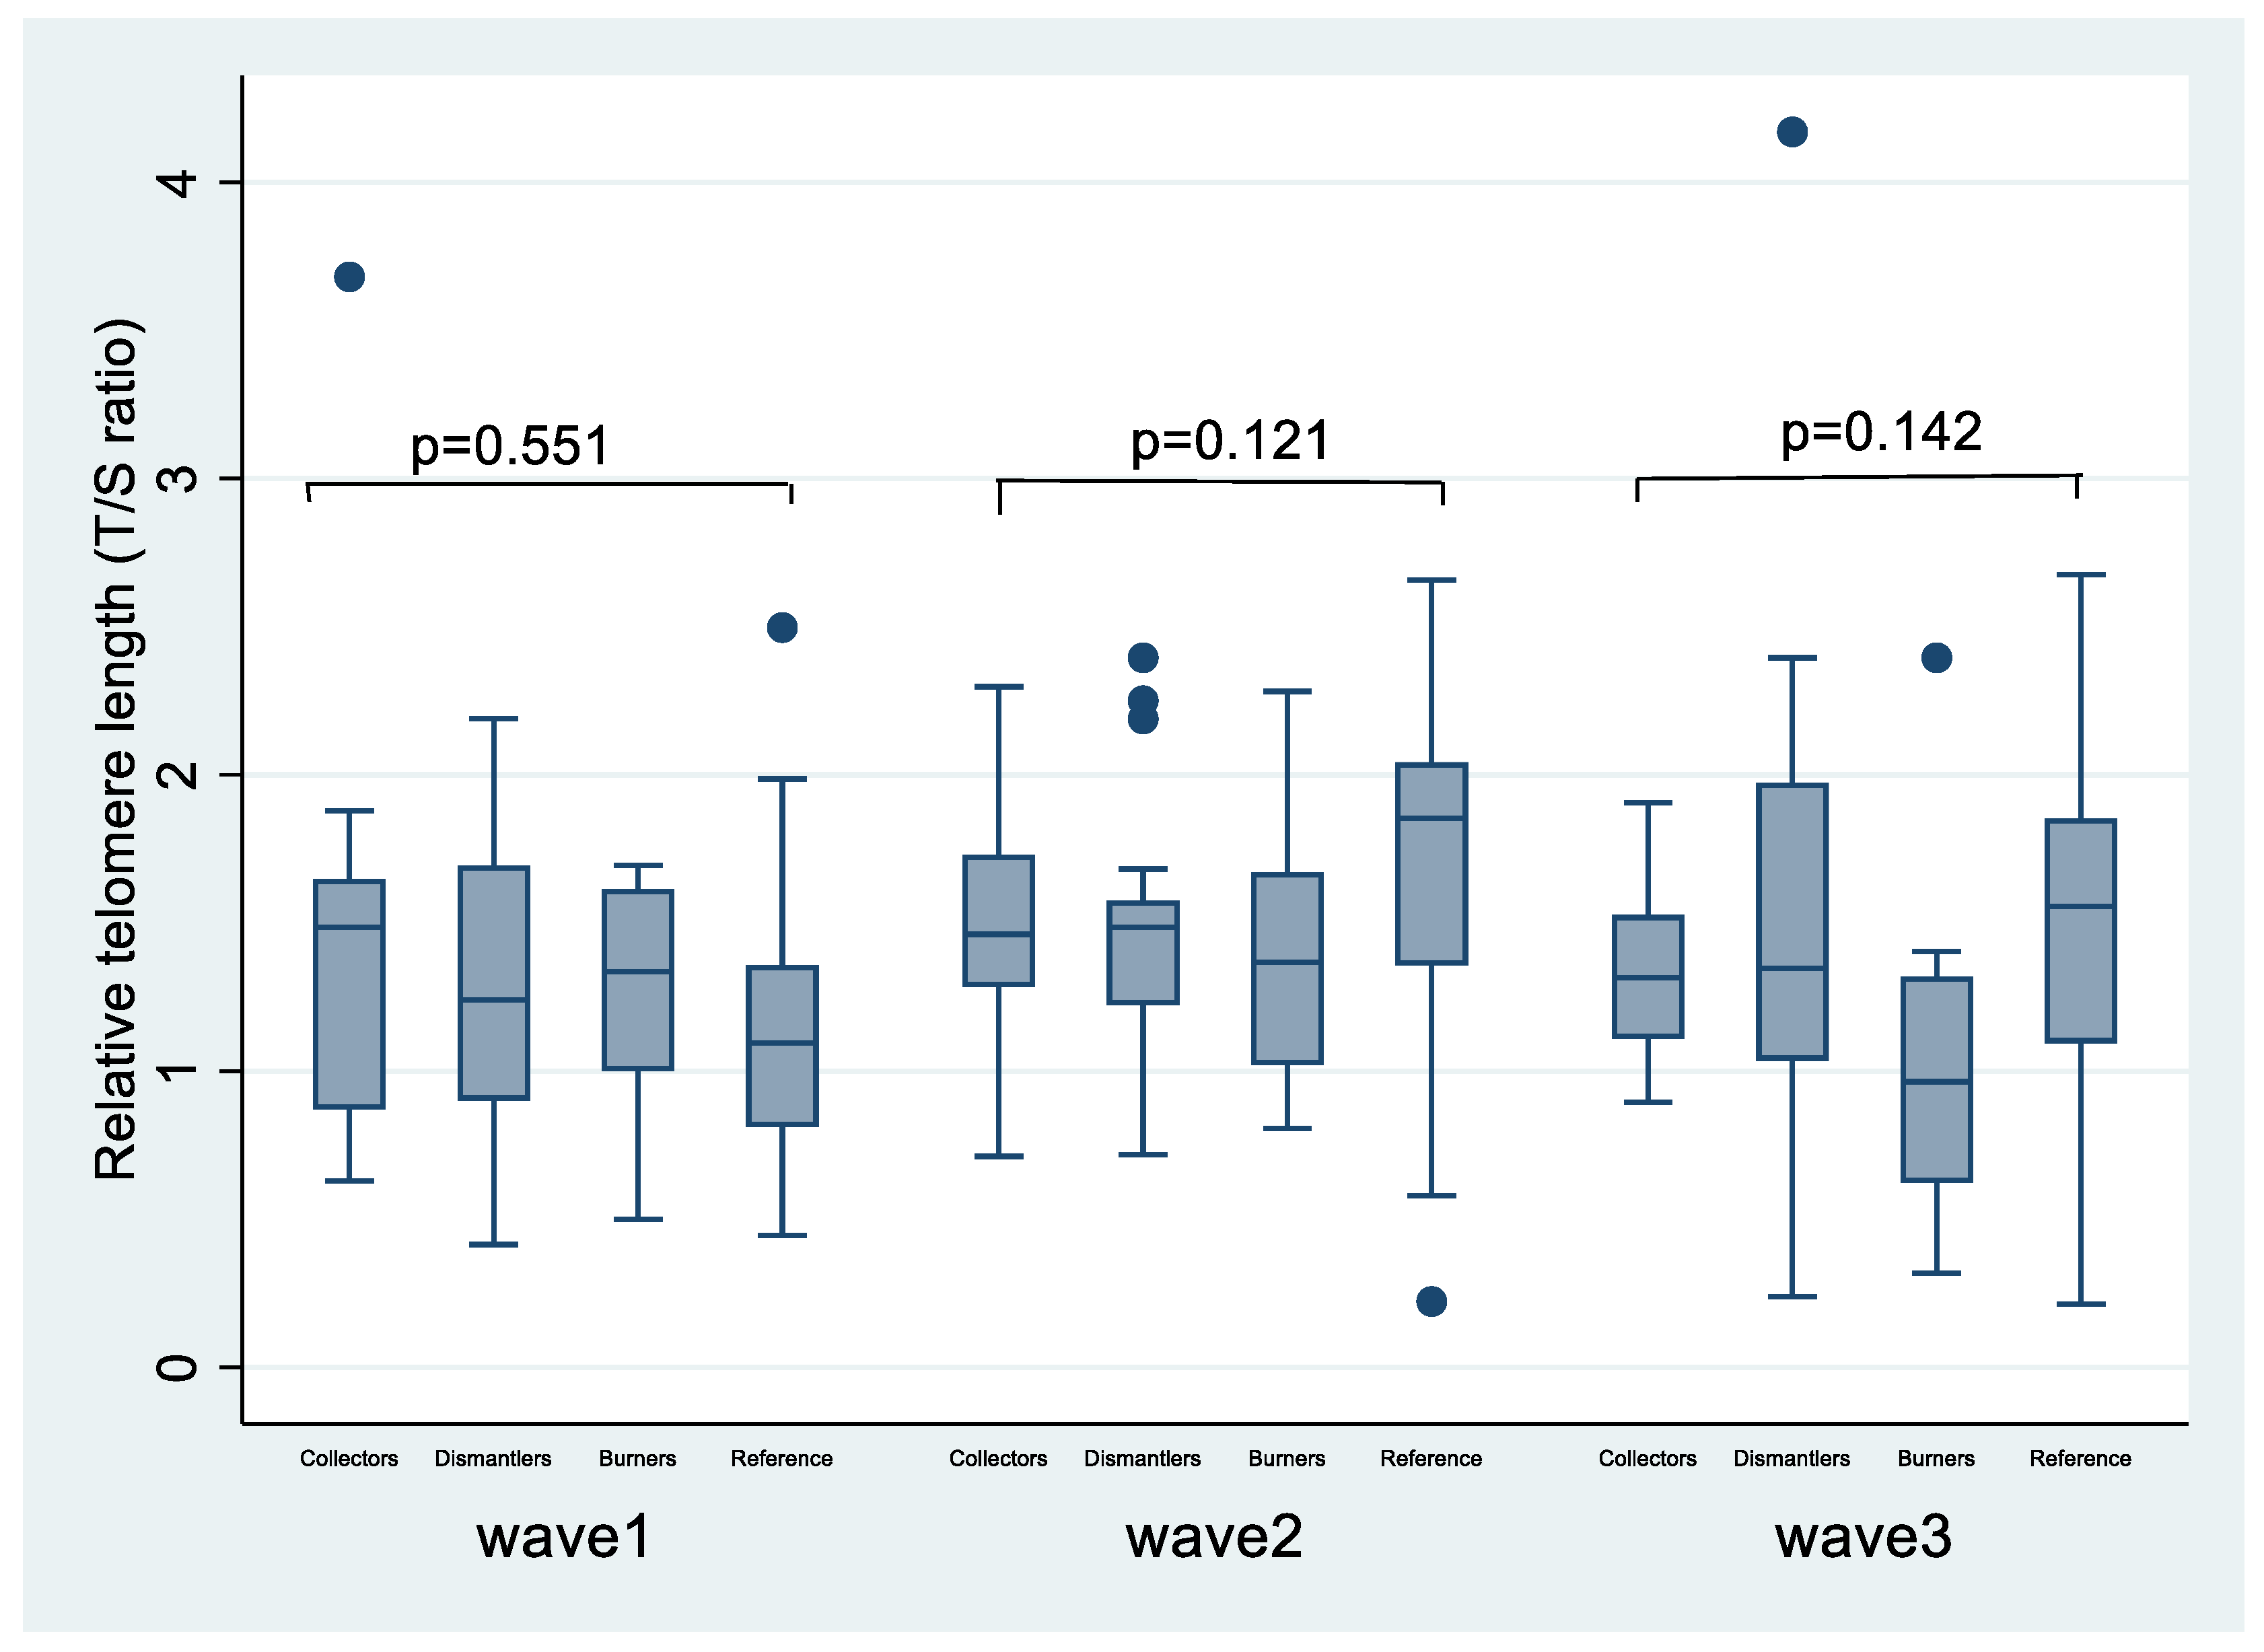
Though the study did not observe any statistically significant difference in the mean relative telomere length across the three job tasks in all the waves (p all > 0.05) (Table 3b), the mean relative telomere length among the burners were consistently but not statistically shorter across all the waves (1.2636±0.386, 1.405573±0.424 & 1.027005±0.5331 for waves 1, 2 & 3 respectively) when compared to the dismantlers ((1.2697±0.501, 1.436999±0.390 & 1.462417±0.786 for waves 1, 2 & 3 respectively) and collectors (1.531398±0.868, 1.467215±0.452 & 1.334806±0.299 for waves 1, 2 & 3 respectively) (Table 3b).
3.5. Relative Telomere Length Across Various Job Tasks
The study compared the rTL for the different job tasks among the e-waste workers with the reference group to observe whether a specific job task may have a comparable rTL with the reference group. Figure 1b showed longer rTL among the reference group when rTL was compared with the burners, dismantlers and collectors for waves 2 &3. However, the rTL among the collectors in wave 1 had longer rTL compared to the reference group (Figure 1b).
3.6. Relationship Between Relative Telomere Length and Anthropometric and Lifestyle Factors
Here we assessed rTL between e-waste workers and reference group with a focus on anthropometric and lifestyle factors such as age, smoking and alcohol consumption status, BMI and as well as indoor use of biomass fuel for cooking (Table 5). The results showed that rTL was not related to age, smoking alcohol consumption BMI or indoor use of biomass fuel for cooking amongst either group (P all > 0.05) (Table 5).
Table 3.
Relative telomere length among e-waste workers and reference group over time.
| E-waste workers (n=53) | Reference Population (n=25) | ||
| Wave | (Mean±SD) | p value | |
| One | 1.318±0.560 | 1.170±0.467 | 0.308 |
| Two | 1.434±0.403 | 1.663±0.571 | 0.051 |
| Three | 1.323±0.673 | 1.504±0.722 | 0.283 |
| Average | 1.358±0.557 | 1.464±0.630 | 0.2104 |
Legend: SD=standard deviation, n = sub study population, p - value obtained using student t-test.
Table 4.
Relative telomere length for different job task among E-waste workers across waves.
| E-waste workers (n=53) | |||
| Wave | Job task | (Mean±SD) | p value |
| One | Burners | 1.263671±0.386 | 0.4149 |
| Dismantlers | 1.269781±0.501 | ||
| Collectors | 1.531398±0.868 | ||
| Two | Burners | 1.405573±0.424 | 0.9354 |
| Dismantlers | 1.436999±0.390 | ||
| Collectors | 1.467215±0.452 | ||
| Three | Burners | 1.027005±0.533 | 0.1387 |
| Dismantlers | 1.462417±0.786 | ||
| Collectors | 1.334806±0.299 | ||
Abbreviations: SD=standard deviation, n = sub study population, p-value obtained using one way ANOVA.
Table 5.
Relationship between rTL and anthropometric and lifestyle factors.
| rTL | ||||
| Variable | Total (n=72) | E-waste workers (n=53) | Controls (n=19) | p-value |
|
Age (years) (n (%) ≤20 20-39 40+ |
9 (12.5) 57 (79.2) 6(8.3) P=0.4032 |
7(13.2) 44(83.0) 2(3.8) p= 0.4743 |
2(10.5) 13(68.4) 4(21.1) p= 0.1762 |
0.6819 0.0914 0.4649 |
|
Smoking Yes No |
15(20.8) 57(79.2) P= 0.5102 |
13(24.5) 40(75.5) p= 0.8177 |
2(10.5) 17(89.5) p= 0.0742 |
0.0883 0.5626 |
|
Alcohol intake Never Former Regular |
63 (87.5) 5 (6.9) 4 (5.6) P= 0.9645 |
45(85.0) 4(7.5) 4(7.5) p= 0.9445 |
18(94.7) 1(5.3) 0(0) p= 0.3122 |
0.4787 0.209 5 |
|
BMI (kg/m2) Low weight Normal weight Overweight Obesity |
9 (12.5) 50(69.4) 11(15.3) 2(2.8) P=0.206 |
6(11.3) 41(77.4) 6(11.3) 0(0.0) p = 0.20 |
3(15.8) 9(47.4) 5(26.3) 2(10.5) p=0.392 |
0.728 0.094 0.962 |
|
Indoor use of biomass Yes No |
15(20.8) 57(79.2) p=0.945 |
10(18.9) 43(81.1) p=0.844 |
5(26.3) 14(73.7) p=0.754 |
0.246 0.507 |
|
Job category Burners Dismantlers Collectors/sorters |
NA NA NA |
14(26.4) 29(54.7) 10(18.9) p= 0.4149 |
NA NA NA |
|
Body Mass Index (BMI) classified based on World Health Organization (WHO) categorization: low weight (≤18.5 kg/m2); normal weight (> 18.5 kg/m2 and ≤24.9 kg/m2); overweight (> 24.9 kg/m2, and ≤29.9 kg/m2), and obesity (≥30 kg/m2), P-values were obtained by the ANOVA test, NA: Not applicable. rTL presented as mean (±SD) applicable. rTL presented as mean (±SD).
Figure 2.
comparison of rTL across job categories for the various waves.
3.7. Relationship Between Metals in Blood and Relative Telomere Length
The study utilized RCS model to establish both linear and nonlinear relationship between individual metals and rTL. All models were adjusted for age, BMI, smoke and alcohol consumption status as well as indoor biomass fuel use.
The study observed a statistically significant negative relationship between rTL and Cr with a marginally significant nonlinear trend when e-workers and reference group were analysed together (p for overall = 0.016 & p for nonlinear = 0.050) (see Figure 3A). The confidence interval observed in the Cr graph (2nd quadrant of Figure 3A) was narrow across much of the Cr concentration range with small variations in the CI width indicating low uncertainty (see Figure 3A). Though the study observed no significant association between rTL and blood Cr levels for e-waste workers (p for overall = 0.161, p for nonlinear = 0175), the trend line for the association between rTL and blood Cr levels among the e-waste workers showed a nonlinear pattern. Thus, initially rTL appears to decrease (shortens) slightly then a sharp increase (elongates), followed by subsequent shortening of rTL at higher Cr concentration (Figure 4A). Furthermore, a statistically significant nonlinear relationship was observed between rTL and blood Cr levels among the reference group (p for overall = 0.003, p for nonlinear = 0.003) (Figure 5A). Initially, rTL decreases (shortens), then increases (elongates) sharply with further steady increases (elongates) again (Figure 5A), but the CI around the trend line was wider around higher Cr concentration compared to the lower Cr concentrations (Figure 5A)
The study observed a statistically significant negative relationship between rTL and Pb for the study population (p for overall = 0.032 & p for nonlinear = 0.0264) (Figure 3B). The trend line shows a general shortening in rTL as Pb concentration increases. The CI is narrow at lower log_Pb concentrations while CI widens as Log_Pb concentration increases (Figure 3B). Among the e-waste workers, the study observed a nonlinear relationship between rTL and blood Pb levels (p for nonlinear = 0.014) (Figure 4B). Initially, rTL increases sharply as the concentration of Pb increased from 12.18ug/L -33.12ug/L, followed by a plateau and then slight decline (shortening) of rTL as Pb concentration continued to increase (Figure 4B). Also, we observed wider CI at lower Pb concentrations reflecting high uncertainty, however, as Pb concentration increased, the CI narrowed, suggesting greater precision in the estimated trend at higher Pb concentration (Figure 4B). Furthermore, the study observed a nonlinear but no strong association between rTL and blood Pb concentration levels among the reference group (p for nonlinear = 0.001) (Figure 5B). We observed relatively flat trend at initial Pb concentrations with narrow CI, as Pb increased beyond approximately 90.02ug/L, the rTL sharply declined (shortened) with widening CI (Figure 5B).
There was no significant association between blood Se and rTL as the trend remain relatively flat (p for overall = 0.813 & p for nonlinear = 0.672) (Figure 3B), the CI was wide across the range of Se concentration values especially at the edges indicating high uncertainty in the estimated association/fewer datapoints at extreme low and high Se concentration levels (Figure 3B). Again, among the e-waste workers, no strong association was observed between rTL and blood Se concentration levels (p for overall = 0.361, p for nonlinear=0.535) since the trend line appears relatively flat (Figure 4B). Likewise, the study observed no association between rTL and blood Se concentration levels among the reference group with relatively narrow CI (Figure 5B).
Though not statistically significant, the study observed a positive association between rTL and Zn for both e-waste workers and reference group combined (p for overall = 0.868, p for nonlinear = 0.168) (Figure 3B). Also, wide CI was observed mostly at higher Zn concentrations (Figure 3B). Again, a positive nonlinear association was observed between rTL and blood Zn concentration levels among the e-waste workers increased (p for nonlinear = 0.034) (Figure 4B). As Zn concentration increased, rTL also elongates (Figure 4B), the CI observed was relatively narrow across Zn concentration range, but wide CI was observed at higher Zn concentration (Figure 4B). Though no strong association was observed between rTL and blood Zn concentration levels among the reference group, initial Zn concentration from approximately 2,980.9ug/L-5,431.7ug/L was associated with slight elongation of rTL, followed by slight shortening then elongation of rTL with further increase in Zn concentration (Figure 5B). However, it is noteworthy that, lower Zn concentrations had narrower CI compared with wider CI at higher Zn concentrations (Figure 5B).
A nonlinear relationship between rTL and Ga was observed (p for nonlinear = 0.001) among the population-waste workers and the reference group combined (Figure 3A). Initially, rTL decreased sharply as Ga increased from (0.135ug/L to 1ug/L) suggesting a negative association, then rTL began to rise again as Ga concentration continued to increase from 1ug/L upwards (Figure 3A). The CI was wide throughout most of the range, indicating high uncertainty in the estimated association (see Figure 3A, 3rd quadrant). In assessing the association between rTL and blood Ga levels among e-waste workers, the study observed a positive nonlinear association between rTL and blood Ga levels (p for nonlinear = 0.010) (Figure 4A). As the Ga increased, the rTL also increased followed by plateauing of rTL with further increase in Ga concentration. Also, we observed a relatively narrow CI across most of the Ga concentration range with high CI observed at the initial lower Ga concentration. Again, a nonlinear relationship between rTL and blood Ga levels was observed among the reference group (p for overall = 0.022, p for nonlinear = 0.021) (Figure 5A). Initially, rTL shortened/decreased as Ga increased from approximately 0.37ug/L-1ug/L followed by elongation of rTL with further increase in Ga (Figure 5A). The CI was relatively narrow around the central values while then widened at the extreme Ga concentrations (Figure 5A).
There was no association between blood As concentration and rTL for the population-waste workers and the reference group combined as the trend line remain relatively flat (p for overall = 0.09922 & p for nonlinear = 0.201) (Figure 3A). Though the trend line showed a slight elongation in the rTL as As concentration increased among the e-waste workers (Figure 4A), there was no statistically significant association between rTL and blood As concentration levels (p for overall = 0.121) and no strong evidence for nonlinear association (p for nonlinear = 0.215) was observed (Figure 4A). Furthermore, the study observed a wide CI across most of the range (Figure 4A). In assessing temporal relationship, the study observed a negative nonlinear association between the rTL and blood As concentration levels (p for nonlinear < 0.001) (Figure 5A). As As concentration increased, rTL shortened (decreased) (Figure 5B). The study also observed narrow CI at lower As concentrations while wider CI was observed at higher As concentrations (Figure 5A).
We observed a nonlinear relationship between blood Mg concentration levels and rTL for both e-waste workers and reference group combined (p for nonlinear = 0.001) (Figure 3A). Initially, rTL decreased (shortened) as Mg concentration increased from 22,026.5ug/L -32,859.6ug/L indicating potential negative association, beyond this point, rTL began to elongate between Mg concentration of 32,859.6ug/L - 40,134.8ug/L followed by sharp rTL shortening (Figure 3A). The CI observed in the 4th quadrant (see Figure 3A) was narrow around the trend line around the central range, indicating high certainty in the estimated association observed, however CI widened at the extremes of Log_Mg concentration values suggesting increased uncertainty at lower and higher magnesium concentrations (Figure 3A). Again, no clear association was observed between blood Mg concentration levels and rTL among the e-waste workers (p for overall = 0.267, p for nonlinear = 0.082) (Figure 4A), though the trend line showed slight downward slope suggesting weak negative association between rTL and blood Mg concentration levels. The CI observed was wider at the higher Mg concentration but relatively narrower at the lower to moderate Mg concentrations (Figure 4A). Furthermore, a nonlinear relationship between rTL and blood Mg concentration levels was observed among the reference group (p for nonlinear < 0.001) (Figure 5A). Initially, rTL appeared to shorten, followed by slight elongation and further slight shortening with increasing Mg concentration (Figure 5A). Also, wider CI was observed at lower Mg concentration but narrower as Mg concentration increases (Figure 5A).
3.8. Relationship Between Metals in Urine and Relative Telomere Length
We observed no statistically significant association between rTL and each of the seven (7) urine metals studied (Cr, As, Pb, Se, Zn, Mg and Ga) among the subjects (Figure 6A &B), among both e-waste workers (Figure 7A & B) and reference group (Figure 8 A & B).
This study observed that increasing As concentration resulted in steady elongation of rTL which was followed by shortening of rTL at higher As concentration for all subjects combined (Figure 6A) and among the e-waste workers in particular (Figure 7A). However, a general downward slope was observed among the reference group indicating weak negative association (Figure 8A)
The study also observed relatively flat trend line indicating no association between each of the urine metals (Ga, and Pb) and rTL for all the subjects combined (Figure 6A &B) and among the e-waste workers in particular (Figure 7A). Also, no association was observed between urine Ga and rTL among the reference group (Figure 8A). However, the study observed nonlinear patterns between rTL and urine Pb concentration (p for nonlinear = 0.013) (Figure 8B), thus rTL initially shortened as urine Pb increased from around 0.37ug/L to 4.48ug/L, then showed slight elongation, shortened again at around Pb concentration of 12.18ug/L and a final elongation sharply beyond 33.12ug/L 9Fig 8B).
Though no association was observed between Mg and rTL for both e-waste workers and reference group combined (Figure 6A), a nonlinear trend was observed between Mg and rTL among the e-waste workers (Figure 7A) separately and reference group (Figure 8A), thus, initial Mg concentration was associated with shortening of rTL followed by slight elongation then shortening again indicating a complex association (Figure 7A & 8A).
Interestingly, urine Cr levels were somewhat positively associated with rTL for the e-waste workers and reference group combined with lower Cr concentration coinciding with slight decrease in rTL and narrow CI and then followed by a slight elongation of rTL at higher Cr concentration with wider CI (see Figure 6A). Yet relatively flat trend line was observed between Cr and rTL among the e-waste workers (Figure 7A) and reference group (Figure 8A).
Somewhat nonlinear trend was observed between urine Zn concentration levels and rTL for the e-waste workers and the reference group combined (Figure 6B & Figure 8B). For both the e-waste workers and reference group, initially, rTL decreased slightly as Zn concentration increased from 1ug/L to around 54.6ug/L, followed by sharp increase beyond 54.6ug/L indicating yet a complex association (Figure 7B & 8B for the e-waste workers and reference group respectively). In general terms, no clear trend was observed among the e-waste workers only (Figure 7B).
Also, a nonlinear trend between rTL and urine Se was observed for crude concentrations with rTL initially remaining stable for a period followed by slight increase (elongation) and then gradual shortening (Figure 7A). Again, a slight upward trend was observed among the e-waste workers (Figure 7B). Furthermore, a nonlinear trend was observed in the association between rTL and urine Se (p for nonlinear = 0.041) (Figure 8B). The rTL initially elongated, then shortened in length, which was followed by another elongation and finally shortening again as urine Se increased (Figure 8B).
4. Discussion
This study is one of the first to the best of our knowledge to examine the relationship between metals exposure and telomere length among e-waste workers in Africa, using restricted cubic spline (RCS) analysis. The results of the study revealed intricate relationships between metals concentrations and relative telomere length (rTL). The patterns observed provide valuable insights into the complexity of the relationship between metals exposure and rTL and reveal the role of quite significant mediators in metals metabolism, which may all affect not only telomere structure and physical characteristics, but also its biologic function in a variety of ways.
The study observed significant consistently elevated blood and urine Pb levels among e-waste workers across all waves. While the higher levels of blood Pb levels may suggest continuous and on-going recent exposure to Pb-containing electronic waste, higher urine Pb may reflect long term exposure and or detoxification from the continuous Pb exposure [27,28]. These findings are consistent with those of other studies conducted elsewhere where higher blood Pb levels were found among e-waste workers and may thus exert greater impact on telomere integrity considerably compared to controls [26,27,29]
The sustained high Pb concentration levels observed over time could be attributed to chronic accumulation possibly due to several factors including repeated exposure to Pb all-year round without recourse to seasonal influences, which would otherwise likely result in periodic seasonal fluctuations in Pb levels that are known to be sensitive to seasonal variations. Indeed, accumulation of Pb in blood by fate is subsequently metabolized and stored in bones, teeth and hair and are then slowly released over time, while maintaining consistency of high blood Pb levels even if direct exposure was reduced as observed in this study [30,31].
Fluctuation in Blood and urine Cr levels observed among the e-waste workers in this current study suggests a combination of factors, including dynamic and variability in exposure levels, and seasonal variation in metals metabolism of associated with both long-term and /recent exposures. This observation may be attributed to differences in seasonal recycling activities or variability in exposure due to specific job tasks [32,33]
In this study higher blood magnesium levels were observed among the reference group compared to the e-waste workers in round (wave 1) but not in rounds (waves 2 and 3). This significant decline in Mg levels in rounds (waves 2 &3) suggests that metal absorption may vary over time or be influenced by dietary intake. A study by Emine Kocyigit (2023) observed some correlation between dietary intake of Mg and blood Mg levels, thus dietary Mg may enhance blood Mg levels.
Again, our study observed higher blood Se levels in the reference group suggesting better dietary intake or the role of other environmental exposure sources not related to e-waste. The inconsistent differences in Se levels across rounds (waves) may reflect variations in absorption or environmental or lifestyle factors affecting Se bioavailability.
This study observed a consistently shorter rTL among the e-waste workers compared to the reference group, indeed this finding reflected the higher levels of Cr and Pb observed among the e-waste workers. Furthermore, some studies have linked exposure to metals (Pb and Cr) to oxidative stress and telomere shortening [34,35,36,37]. For instance, Pb has been shown in invitro studies to induce γH2Ax foci formation and stabilize G-quadruplex structure primarily at telomeric regions, indicating telomere dysfunction/shortening synonymous to DNA damage [15].
Also, in assessing the role of job task in telomere length, we observed that average rTL for burners were shortest compared to dismantlers and collectors. Some studies have noted that burning releases metals into the atmosphere [28] while Srigboh, Basu [38] also measured higher blood and urine metals among burners. This suggest that burners possibly face higher exposure risks due to inhalation of combustion byproducts, including dioxins and heavy metals [33,39] while Dismantlers may be exposed to metallic dust and hazardous materials from breaking apart the e-waste [40] and collectors being exposed to lower levels of the pollutants through handling and transport of e-waste materials. These exposure levels resulted in the shorter rTL observed among the burners in this study.
This study observed no association between age, BMI, alcohol and smoking status, educational status and indoor cooking with biomass fuel and rTL, suggesting that our findings of the dynamics in the relationships between metals exposure and the rTL was likely closely linked to environmental and occupational exposures rather than anthropometric factors or individual lifestyle choices [31]. However, earlier studies have associated telomere shortening with aging and/or other factors such as BMI, smoking and alcohol consumption status [41,42]
Our study observed a negative nonlinear association between blood Pb levels and rTL separately for the e-waste workers and reference group as well as both groups combined. Interestingly however, the study observed a contrasting association between blood Cr levels and rTL among e-waste workers on the one hand and the association among the reference group on the other hand. While e-waste workers showed a negative association between Cr and rTL, the reference group exhibited a significantly positive nonlinear relationship. Earlier studies have shown contradictory relationships between Pb and rTL as for instance one systematic review, which the relationship between metal exposure and telomere length was examined, four (4) of the nine (9) studies observed shorter TL while five (5) did not observe any defined relationship between Pb and TL [43]. Again, while a study observed inverse relationship between Pb concentrations and TL in boys [44] another study also observed this same trend in females [45]. But it has been well established that exposure to higher Pb and Cr concentrations were associated with shorter telomere length [20,46,47]. It is noteworthy that most of these studies assessed the relationship between Pb and rTL using a linear regression model, thus limiting the options to linear dynamics in the relationships examined in this study.
Exposure to Pb is well-documented to cause reproductive health, neurologic and haematological disorders, kidney damage, deformation of cell structure including cell membrane damage and in particular its role in telomere shortening has been linked to increase inflammation and genes instability [30,31,48,49].
Also, exposure to Cr, especially its hexavalent form, is a known carcinogen and has been associated with lung function disorders such as lung cancer, lung damage, reproductive health disorder, induce telomere shortening via oxidative stress related DNA damage and impairment of cellular repair mechanisms [50,51,52].
Again, some studies comprehensively determined metals exposure on the individual metabolome among e-waste workers and observed distinct alterations in biological pathways among the e-waste workers compared to the control group. Biological pathway alterations such as lipid regulations, steroid hormones biosynthesis, drug metabolism pathways altering cytochrome p450 activity, (impair detoxification of xenobiotics), vitamin metabolism, prostaglandin Biosynthesis and Linoleate and fatty acid metabolism were distinct among the e-waste workers. Ultimately, these altered pathways has been shown to affect the homeostasis of nucleic acid leading to telomere attrition [53,54]
In addition, a systematic review conducted to study the effects of exposure to metal mixtures on adverse pregnancy and birth outcomes, the authors [55] reported associations between mixture of metals including Pb and Cr and adverse pregnancy outcomes, and in the same year Bianco-Miotto, Phillips [56] also in their studies observed an association between adverse pregnancy outcomes and shorter telomere length among their female participants, suggesting that shorter telomere length resulting from metals exposure (Pb and Cr) could result in adverse pregnancy outcomes.
Chromium six (Cr VI) is widely used in electric and electronic components such as circuit boards and coating of plates while Cr III are found in rocks, soil, plants and animals. Therefore, e-waste workers would be more exposed to Cr VI exposures compared to members of the reference group (who are not exposed to the e-waste). As indicated, Cr (VI) is a known cytotoxic specie and can be found in e-waste, however Cr (III) is an essential metal which plays a role in glucose, protein and fat metabolism, thus by extension reducing telomere shortening. Though the study did not characterise the blood Cr, it is possible from the association that the positive association between Cr and rTL among the reference group emanates from Cr (III) while the negative association between Cr and rTL among the e-waste workers emanates from Cr (VI).
Though no clear association was observed between Mg levels and rTL among e-waste workers, there was a negative association among the reference group.
Interestingly, though magnesium is known for its protective role in reducing oxidative stress, yet in certain exposure conditions, deficiency or excess Mg levels may interact with telomere in complex ways [57]. For example, excessive levels of blood Mg can disrupt the balance of calcium signalling pathways, indirectly affecting telomere regulation [57]. In certain conditions, excessive Mg may contribute to abnormal metabolic reactions, potentially increasing oxidative damage rather than reducing it [58].
Also, some studies suggest Mg influences telomerase, the enzyme responsible for maintaining telomere length, but excessive amounts may interfere with its optimal function [59]. In the case of the e-waste workers, the effects of Mg on telomeres may depend on the individual’s baseline oxidative stress, genetic predisposition, and environmental exposure to other toxicants like heavy metals which might interact differently due to co-exposure effects with other metals like Pb and Cr [59,60].
In addition, we observed a positive association between Zn and rTL confirming the potential protective role of Zn (antioxidant properties) in mitigating oxidative stress induced telomere damage. Also, Zn has been shown to play critical role in DNA integrity and repair, which may contribute to maintaining telomere stability [61,62].
Gallium (Ga) demonstrated a consistent positive nonlinear relationship with rTL across the study population, suggesting possible biological interactions that may enhance telomere preservation. Though the direct effects of Ga on telomere length remain an emerging research area, its role in oxidative stress modulation suggests potential interactions with telomere maintenance. Ga has been studied for its impact on oxidative stress, particularly in relation to free radical generation and antioxidant defence mechanisms. Some studies suggest that Ga can reduce oxidative damage by inhibiting Fe-dependent free radical formation. However, excessive Ga exposure may disrupt cellular redox balance, leading to unintended oxidative stress [63]
Finally, Arsenic exhibited a positive linear association with rTL among e-waste workers but a negative nonlinear relationship in the reference group. Previous studies have reported conflicting findings on As exposure and telomere length, suggesting dose-dependent effects or potential adaptation mechanisms [43,64].
5. Conclusion
First, the fluctuation in Blood and urine Cr levels observed among the e-waste workers suggested a combination of factors, including dynamic and variability in exposure levels, and seasonal variation in metals metabolism that were associated with both long-term and/or recent exposures.
Secondly, the higher blood magnesium levels, which were observed among the reference group compared to the e-waste workers in round (wave 1) but not in rounds (waves 2 and 3) as well as the significant decline in Mg levels in rounds (waves 2 &3) probably pointed to the fact that metal absorption may vary over time or be influenced by dietary intake contribution or the role of other important metabolic factors.
Despite the uncertainty in the nature of the relationships, the observed consistently shorter rTL among the e-waste workers compared to the reference group coinciding with higher concentration levels of Cr and Pb probably implicates the role of metals in shortening the relative telomere length as with the observed shorter average rTL among the burners compared to dismantlers and collectors. Future research should incorporate mixture analyses with a well characterized and larger sample sizes and longitudinal studies over a longer follow-up period to determine whether persistent exposure accelerates TL attrition over time.
Author Contributions
“Conceptualization, M.S.D. and J.N.F.; methodology, M.S.D., I.I., S.V.S., S.I., H.A. and J.N.F.; validation, J.N.F. and H.A.; formal analysis, M.S.D., I.I.,D.D. and J.N.F; investigation, M.S.D., I.I., S.V.S., S.A.B., J.K.H.B., S.I., N.B. and H.A.; resources, S.V.S., J.K.H.B., T.R., N.B., H.A. and J.N.F.; data curation, M.S.D., I.I., S.V.S., D.D.,N.B.,H.A. and J.N.F; writing—original draft preparation, M.S.D.; writing—review and editing, I.I.,S.V.S.S.A.B., D.D., J.K.H.B., S.I., T.R., N.B., H.A. and J.N.F; visualization, M.S.D.; supervision, J.N.F. and I.I.; funding acquisition, J.N.F. All authors have read and agreed to the published version of the manuscript.”.
Funding
This study was funded by the West Africa-Michigan CHARTER II in GEOHealth from the United States National Institutes of Health/Fogarty International Center (US NIH/FIC) (paired grant no 1U2RTW010110-01/5U01TW010101), Canada’s International Development Research Center (IDRC) (grant no. 108121-001), and Norwegian NORHED/NORAD Water Essence Africa, grant # QZA-21/0162. Except for providing financial support, the funders played no role in the design of the study, collection, analysis, and interpretation of data and in writing the manuscript.
Institutional Review Board Statement
The study was conducted in accordance with the Declaration of Helsinki. The study protocol for re-analyses of the archived samples was additionally approved by the College of Health Sciences Ethical and Protocol Review Committee, University of Ghana (Approval Number: CHS-Et/M.6-P4.4/2-23-2024), and the Institute of Tropical Medicine, Nagasaki University, Japan (Approval Number: 240919317).
Data Availability Statement
Due to ethical restrictions, data for the study would be made available upon request via the corresponding author.
Acknowledgments
The authors thank Mr. Karim at the School of Public health, UG for his immerse support during archive samples sorting and transfer to the Noguchi memorial research institute.]. The authors have reviewed and edited the output and take full responsibility for the content of this publication.
Conflicts of Interest
The authors declare no conflicts of interest.
Abbreviations
The following abbreviations are used in this manuscript:
| TL | Telomere Length |
| rTL | Relative telomere length |
| E-waste | Electronic waste |
| qPCR | Quantitative polymerase chain reaction |
References
- Lee, W.K., F. Thevenod, and E.J. Prenner, Global threat posed by metals and metalloids in the changing environment: a One Health approach to mechanisms of toxicity. Biometals, 2024. 37(3): p. 539-544.
- Das, S. , et al., Heavy Metal Pollution in the Environment and Its Impact on Health: Exploring Green Technology for Remediation. Environ Health Insights, 2023. 17: p. 11786302231201259.
- Tchounwou, P.B. , et al., Heavy metal toxicity and the environment. Exp Suppl, 2012. 101: p. 133-64.
- Mitra, S. , et al., Impact of heavy metals on the environment and human health: Novel therapeutic insights to counter the toxicity. Journal of King Saud University - Science, 2022. 34(3).
- Briffa, J., E. Sinagra, and R. Blundell, Heavy metal pollution in the environment and their toxicological effects on humans. Heliyon, 2020. 6(9): p. e04691.
- Dodd, M. , et al., Human health risk associated with metal exposure at Agbogbloshie e-waste site and the surrounding neighbourhood in Accra, Ghana. Environ Geochem Health, 2023. 45(7): p. 4515-4531.
- Issah, I. , et al., Health Risks Associated with Informal Electronic Waste Recycling in Africa: A Systematic Review. Int J Environ Res Public Health, 2022. 19(21).
- Althomali, R.H. , et al., Exposure to heavy metals and neurocognitive function in adults: a systematic review. Environmental Sciences Europe, 2024. 36(1).
- Zhang, D. , et al., Urinary essential and toxic metal mixtures, and type 2 diabetes mellitus: Telomere shortening as an intermediary factor? J Hazard Mater, 2023. 459: p. 132329.
- Witkowska, D., J. Slowik, and K. Chilicka, Heavy Metals and Human Health: Possible Exposure Pathways and the Competition for Protein Binding Sites. Molecules, 2021. 26(19).
- Liu, S. and M. Costa, Carcinogenicity of metal compounds, in Handbook on the Toxicology of Metals. 2022. p. 507-542.
- Domingo, J.L. and M. Marques, The effects of some essential and toxic metals/metalloids in COVID-19: A review. Food Chem Toxicol, 2021. 152: p. 112161.
- Wong, J.Y. , et al., The association between global DNA methylation and telomere length in a longitudinal study of boilermakers. Genet Epidemiol, 2014. 38(3): p. 254-64.
- Milne, E. , et al., Plasma micronutrient levels and telomere length in children. Nutrition, 2015. 31(2): p. 331-6.
- Pottier, G. , et al., Lead Exposure Induces Telomere Instability in Human Cells. PLoS One, 2013. 8(6): p. e67501.
- Srinivas, N., S. Rachakonda, and R. Kumar, Telomeres and Telomere Length: A General Overview. Cancers (Basel), 2020. 12(3).
- Niehoff, N.M. , et al., Hazardous air pollutants and telomere length in the Sister Study. Environmental Epidemiology, 2019. 3(4).
- Pawlas, N. , et al., Telomere length, telomerase expression, and oxidative stress in lead smelters. Toxicol Ind Health, 2016. 32(12): p. 1961-1970.
- Zhang, X. , et al., Environmental and occupational exposure to chemicals and telomere length in human studies. Occupational and Environmental Medicine, 2013. 70: p. 743 - 749.
- Pawlas, N. , et al., Telomere length in children environmentally exposed to low-to-moderate levels of lead. Toxicology and Applied Pharmacology, 2015. 287(2): p. 111-118.
- Lai, X. , et al., Individual and joint associations of co-exposure to multiple plasma metals with telomere length among middle-aged and older Chinese in the Dongfeng-Tongji cohort. Environ Res, 2022. 214(Pt 3): p. 114031.
- Wai, K.M. , et al., Protective role of selenium in the shortening of telomere length in newborns induced by in utero heavy metal exposure. Environmental Research, 2020. 183: p. 109202.
- Mizuno, Y. , et al., Telomere length and urinary 8-hydroxy-2’-deoxyguanosine and essential trace element concentrations in female Japanese university students. Journal of Environmental Science and Health - Part A Toxic/Hazardous Substances and Environmental Engineering, 2021. 56(12): p. 1328-1334.
- Amoabeng Nti, A.A. , et al., Personal exposure to particulate matter and heart rate variability among informal electronic waste workers at Agbogbloshie: a longitudinal study. BMC Public Health, 2021. 21(1).
- Laskaris, Z. , et al., Derivation of Time-Activity Data Using Wearable Cameras and Measures of Personal Inhalation Exposure among Workers at an Informal Electronic-Waste Recovery Site in Ghana. Annals of Work Exposures and Health, 2019. 63(8): p. 829-841.
- Takyi, S.A. , et al., Biomonitoring of metals in blood and urine of electronic waste (E-waste) recyclers at Agbogbloshie, Ghana. Chemosphere, 2021. 280: p. 130677.
- Grant, K. , et al., Health consequences of exposure to e-waste: a systematic review. Lancet Glob Health, 2013. 1(6): p. e350-61.
- Frazzoli, C. , et al., Diagnostic health risk assessment of electronic waste on the general population in developing countries’ scenarios. Environmental Impact Assessment Review, 2010. 30(6): p. 388-399.
- Julander, A. , et al., Formal recycling of e-waste leads to increased exposure to toxic metals: an occupational exposure study from Sweden. Environ Int, 2014. 73: p. 243-51.
- Collin, M.S. , et al., Bioaccumulation of lead (Pb) and its effects on human: A review. Journal of Hazardous Materials Advances, 2022. 7.
- Needleman, H.L. , Low level lead exposure and the development of children. Southeast Asian J Trop Med Public Health, 2004. 35(2): p. 252-4.
- Amoabeng Nti, A.A. , et al., Personal exposure to particulate matter and heart rate variability among informal electronic waste workers at Agbogbloshie: a longitudinal study. BMC Public Health, 2021. 21(1): p. 2161.
- Okeme, J.O. and V.H. Arrandale, Electronic Waste Recycling: Occupational Exposures and Work-Related Health Effects. Curr Environ Health Rep, 2019. 6(4): p. 256-268.
- Jomova, K. and M. Valko, Advances in metal-induced oxidative stress and human disease. Toxicology, 2011. 283(2-3): p. 65-87.
- Barnes, R.P., E. Fouquerel, and P.L. Opresko, The impact of oxidative DNA damage and stress on telomere homeostasis. Mech Ageing Dev, 2019. 177: p. 37-45.
- M. Valko, H. Morris2 and M.T.D. Cronin, Metals toxicity and oxidative stress. Current Medicinal Chemistry, 2005, 12, 1161–1208, 2005, 12: p. 1161-1208..
- Ahmed, W. and J. Lingner, Impact of oxidative stress on telomere biology. Differentiation, 2018. 99: p. 21-27.
- Srigboh, R.K. , et al., Multiple elemental exposures amongst workers at the Agbogbloshie electronic waste (e-waste) site in Ghana. Chemosphere, 2016. 164: p. 68-74.
- Jack Caravanos, E.C. , 2 Richard Fuller,3 Calah Lambertson1, Assessing worker and environmental chemical exposure risk jack caravanous J Health Pollution 1:16-25 (2011), 2011. 1: p. 16-25.
- Sepúlveda, A. , et al., A review of the environmental fate and effects of hazardous substances released from electrical and electronic equipments during recycling: Examples from China and India. Environmental Impact Assessment Review, 2010. 30(1): p. 28-41.
- Espinosa-Otalora, R.E. , et al., Lifestyle effects on telomeric shortening as a factor associated with biological aging: A systematic review. Nutrition and Healthy Aging, 2020. 6(2): p. 95-103.
- Shammas, M.A. , Telomeres, lifestyle, cancer, and aging. Curr Opin Clin Nutr Metab Care, 2011. 14(1): p. 28-34.
- Beddingfield, Z. , et al., Review of Correlations Between Telomere Length and Metal Exposure Across Distinct Populations. Environments, 2024. 11(12).
- Herlin, M. , et al., Exploring telomere length in mother-newborn pairs in relation to exposure to multiple toxic metals and potential modifying effects by nutritional factors. BMC Med, 2019. 17(1): p. 77.
- Tang, P. , et al., Associations between prenatal multiple plasma metal exposure and newborn telomere length: Effect modification by maternal age and infant sex. Environ Pollut, 2022. 315: p. 120451.
- Zhang, Y. , et al., Cellular senescence mediates hexavalent chromium-associated lung function decline: Insights from a structural equation Model. Environ Pollut, 2024. 349: p. 123947.
- Wu, Y. , et al., High lead exposure is associated with telomere length shortening in Chinese battery manufacturing plant workers. Occup Environ Med, 2012. 69(8): p. 557-63.
- Wenlong Huang, X.S.a.K.W. , Human body burden of HM and health consequences International Journal of Environmental Research and Public Health, 2021. 18(1 2428).
- Zhang, B. , et al., Elevated lead levels from e-waste exposure are linked to decreased olfactory memory in children. Environ Pollut, 2017. 231(Pt 1): p. 1112-1121.
- Costa, M. and C.B. Klein, Toxicity and carcinogenicity of chromium compounds in humans. Crit Rev Toxicol, 2006. 36(2): p. 155-63.
- Monga, A., A. B. Fulke, and D. Dasgupta, Recent developments in essentiality of trivalent chromium and toxicity of hexavalent chromium: Implications on human health and remediation strategies. Journal of Hazardous Materials Advances, 2022. 7.
- Yan, G. , et al., Toxicity mechanisms and remediation strategies for chromium exposure in the environment. Frontiers in Environmental Science, 2023. 11.
- Hui, F. , et al., Integrative modeling of urinary metabolomics and metal exposure reveals systemic impacts of electronic waste in exposed populations. metabolites, 2025. 15: p. 456.
- Pang, Z. , et al. Comprehensive Blood Metabolome and Exposome Analysis,.
- Annotation, and Interpretation in E-Waste Workers. metabolites, 2024. 14: p. 671.
- Issah, I. , et al., Exposure to metal mixtures and adverse pregnancy and birth outcomes: A systematic review. Sci Total Environ, 2024. 908: p. 168380.
- Bianco-Miotto, T. , et al., Adverse pregnancy outcomes are associated with shorter telomere length in the 17-year-old child. J Dev Orig Health Dis, 2024. 15: p. e26.
- Barbagallo, M. and L.J. Dominguez, Magnesium and aging. Current Pharmaceutical Design, 2010. 16(7): p. 833.
- Costello, R.B. and F. Nielsen, Interpreting magnesium status to enhance clinical care: key indicators. Curr Opin Clin Nutr Metab Care, 2017. 20(6): p. 504-511.
- Maguire, D. , et al., Telomere Homeostasis: Interplay with Magnesium. Int J Mol Sci, 2018. 19(1).
- Fernandes, S.G., R. Dsouza, and E. Khattar, External environmental agents influence telomere length and telomerase activity by modulating internal cellular processes: Implications in human aging. Environ Toxicol Pharmacol, 2021. 85: p. 103633.
- Chasapis, C.T. , et al., Recent aspects of the effects of zinc on human health. Arch Toxicol, 2020. 94(5): p. 1443-1460.
- Maret, W. and H.H. Sandstead, Zinc requirements and the risks and benefits of zinc supplementation. J Trace Elem Med Biol, 2006. 20(1): p. 3-18.
- Todorov, L., I. Kostova, and M. Traykova, Lanthanum, Gallium and their Impact on Oxidative Stress. Curr Med Chem, 2019. 26(22): p. 4280-4295.
- Sanyal, T. , et al., Recent Advances in Arsenic Research: Significance of Differential Susceptibility and Sustainable Strategies for Mitigation. Front Public Health, 2020. 8: p. 464.
Figure 1.
a. Comparison of the rTL between E-waste workers and the reference group. 1b. compare rTL between Agbogbloshie and Madina for wave 1, 2, and 3.
Figure 1.
a. Comparison of the rTL between E-waste workers and the reference group. 1b. compare rTL between Agbogbloshie and Madina for wave 1, 2, and 3.
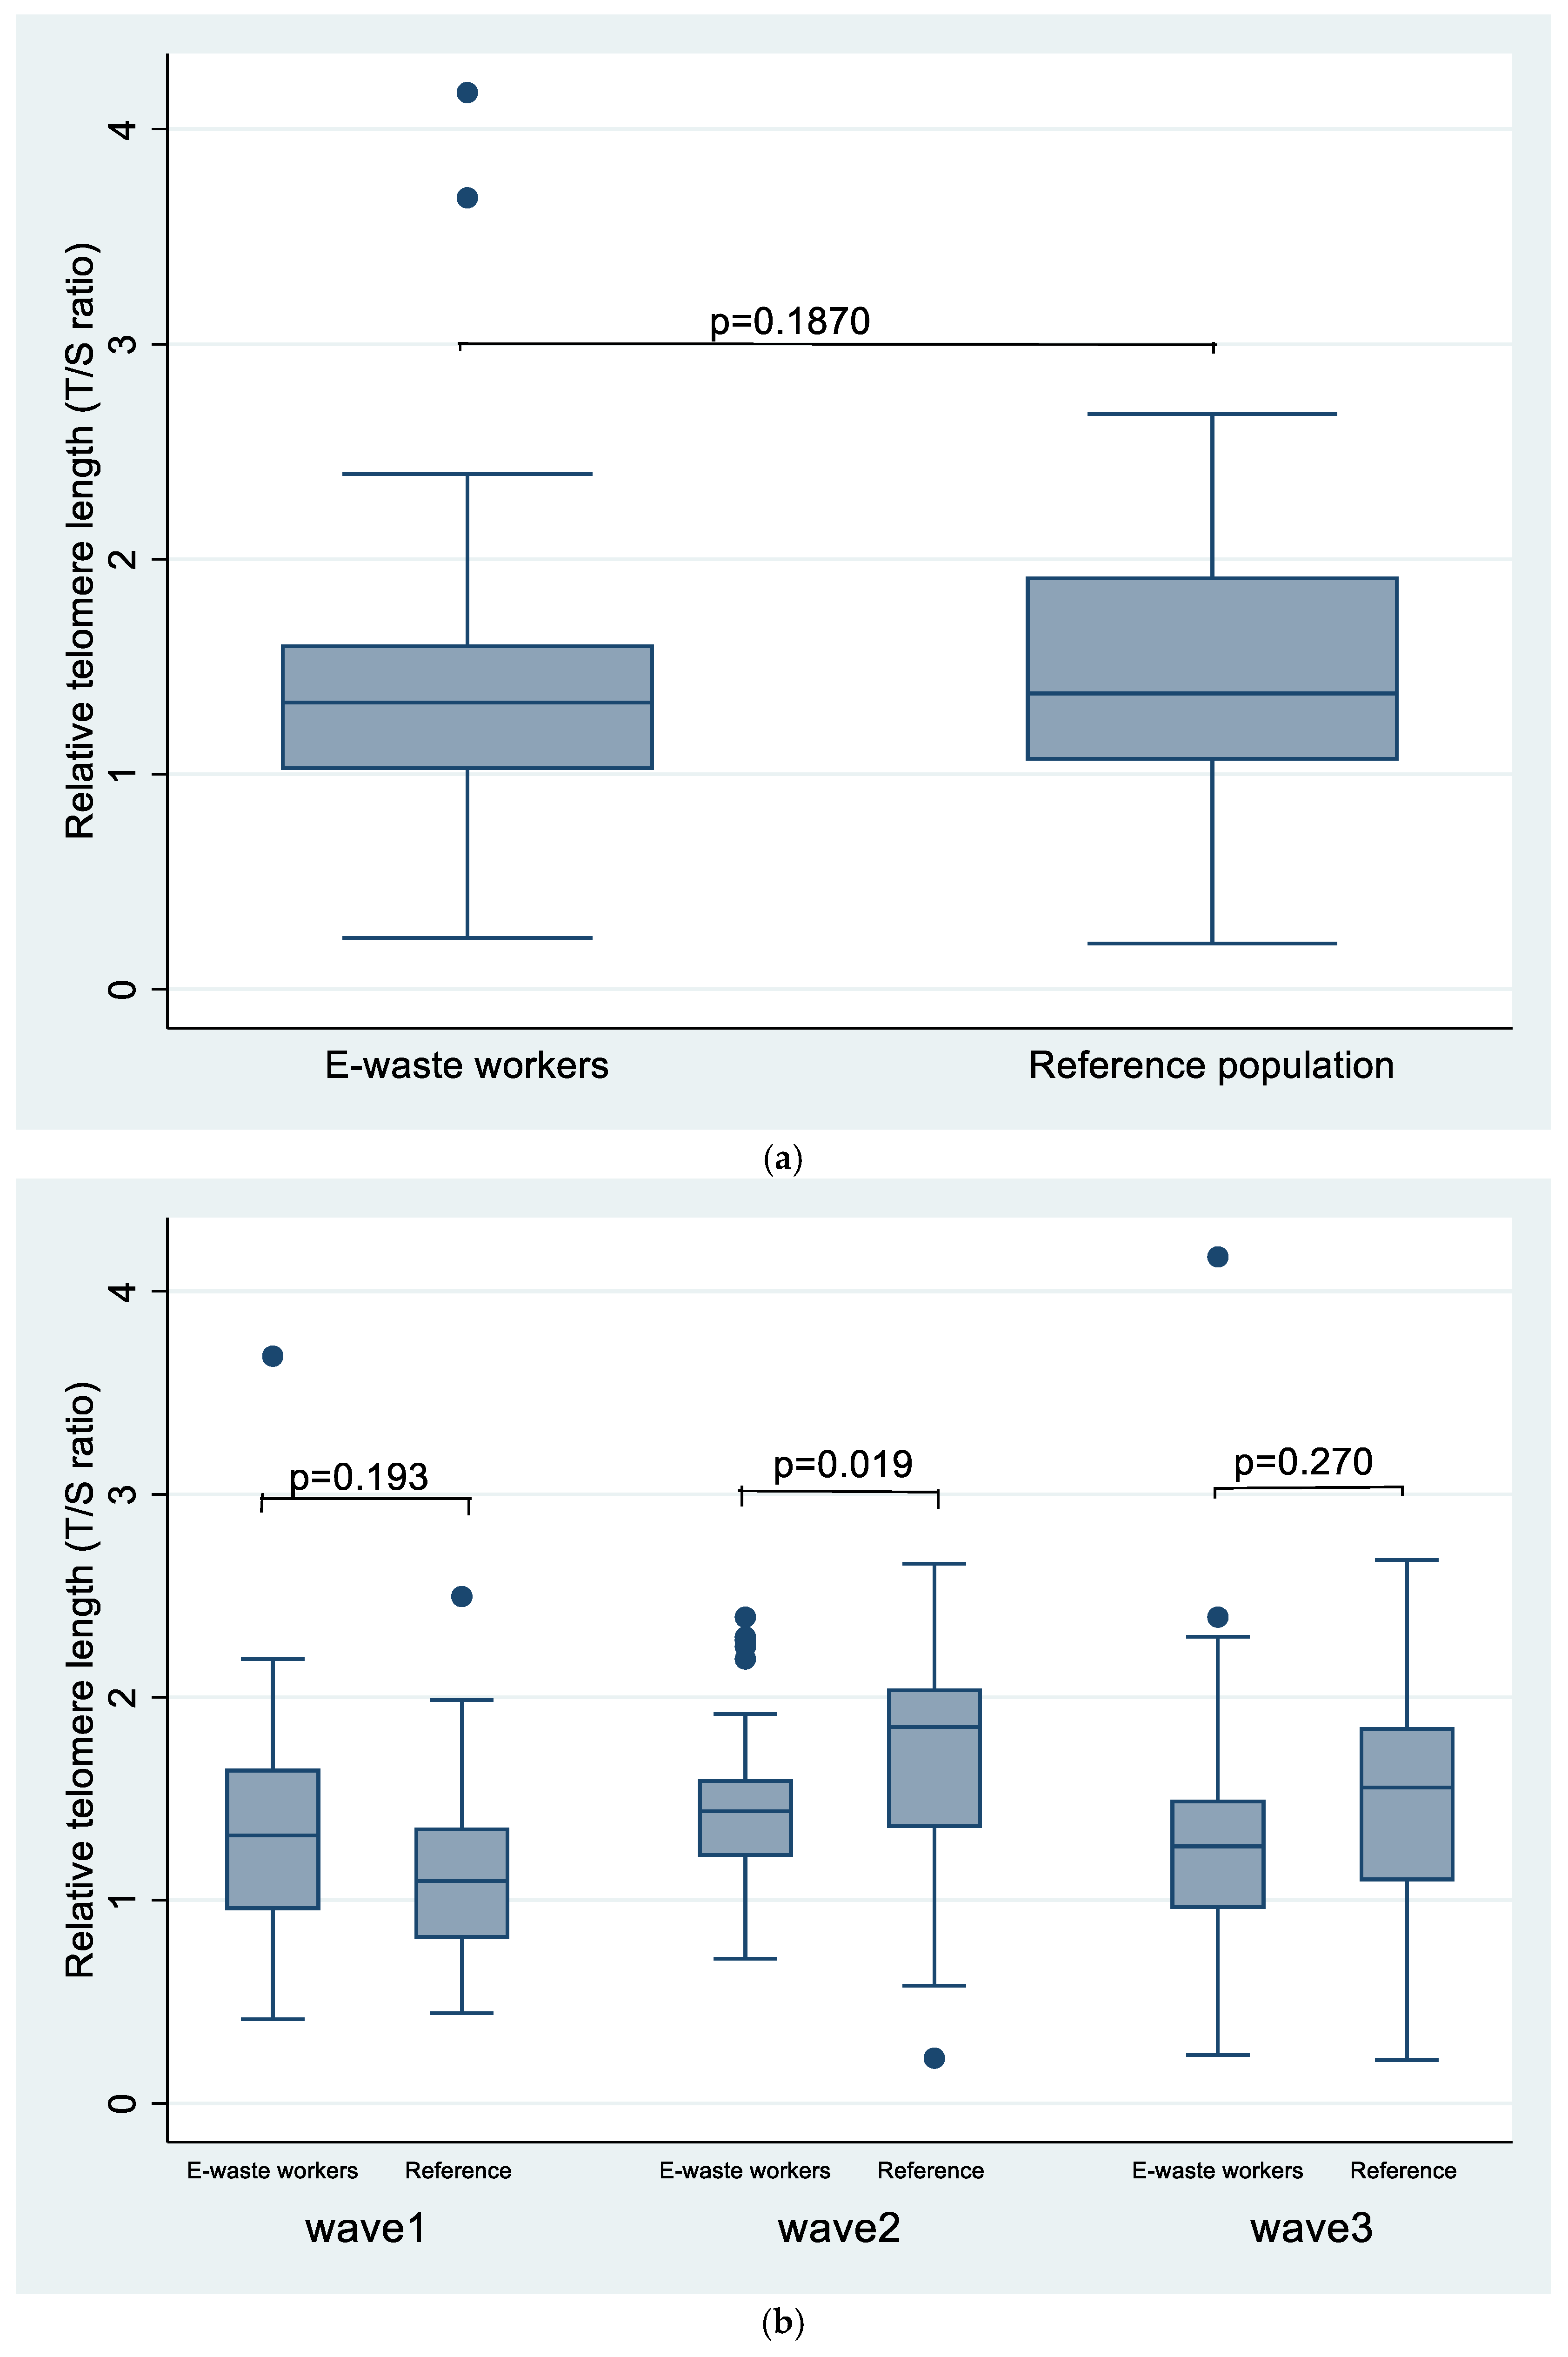
Figure 3.
A &B: The association between metal exposure and rTL for the study population using restricted cubic spline (RCS).
Figure 3.
A &B: The association between metal exposure and rTL for the study population using restricted cubic spline (RCS).
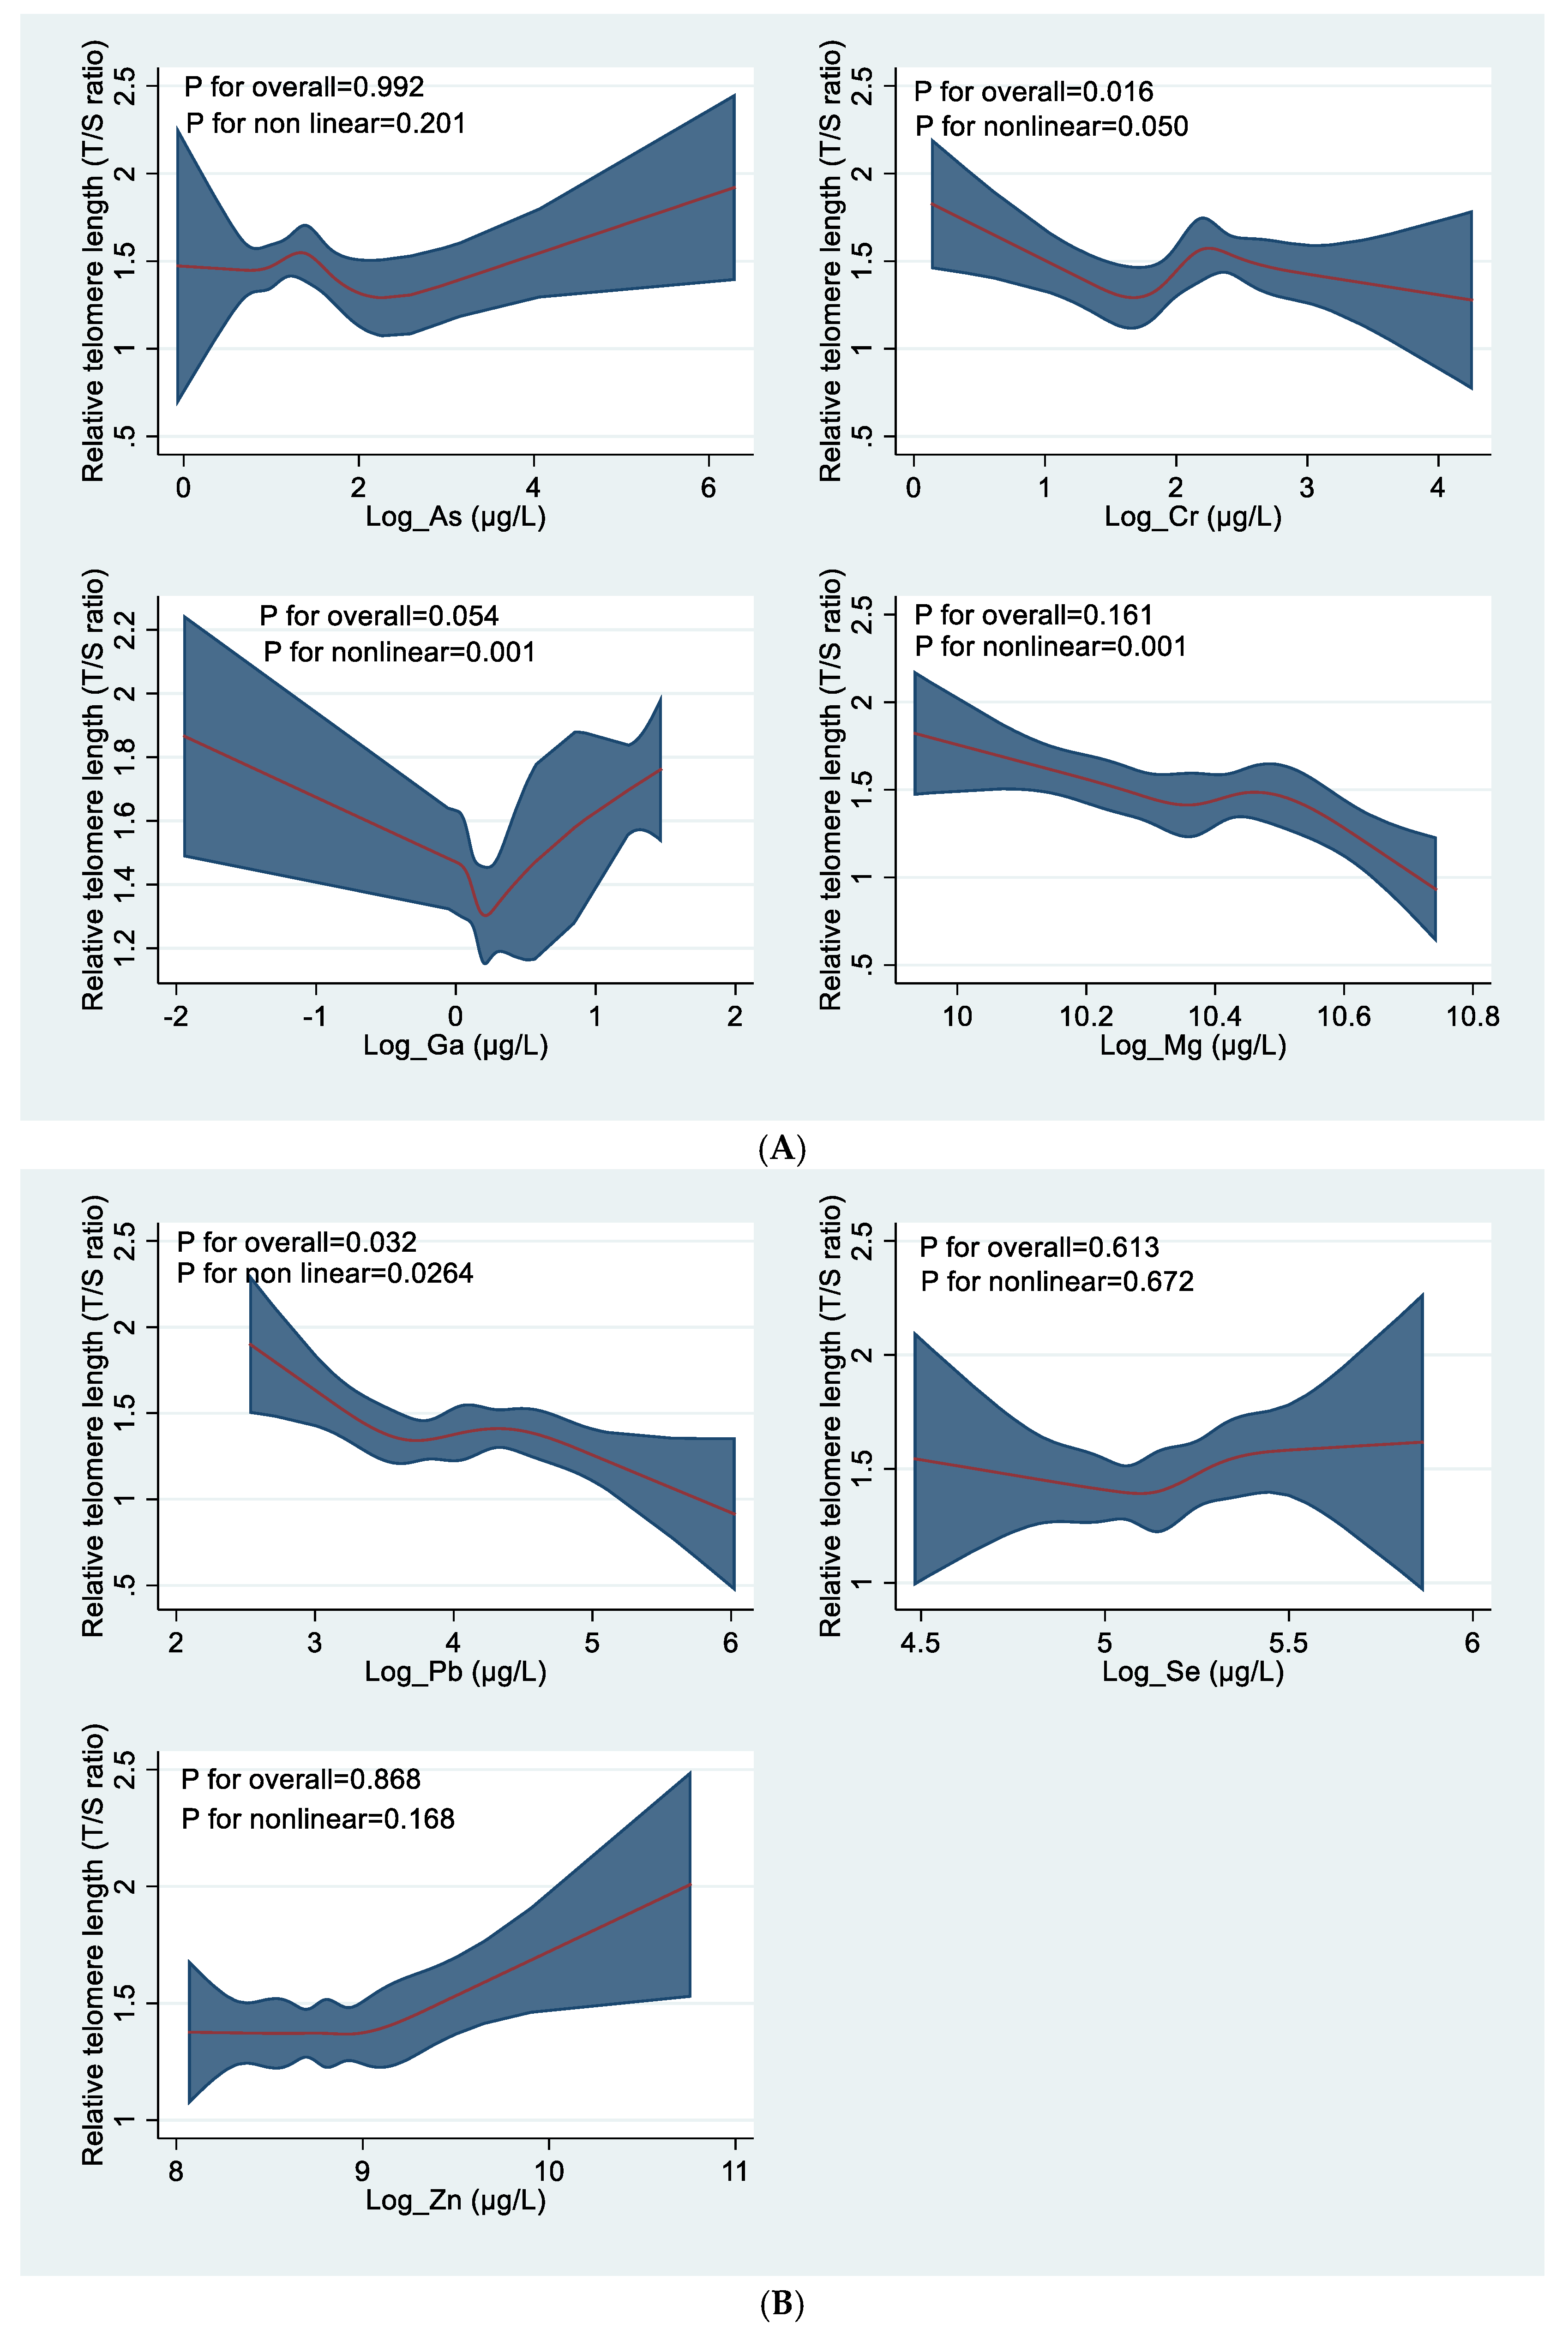
Figure 4.
A & B: Association between blood levels metal concentration among e-waste workers and relative telomere length using RCS.
Figure 4.
A & B: Association between blood levels metal concentration among e-waste workers and relative telomere length using RCS.
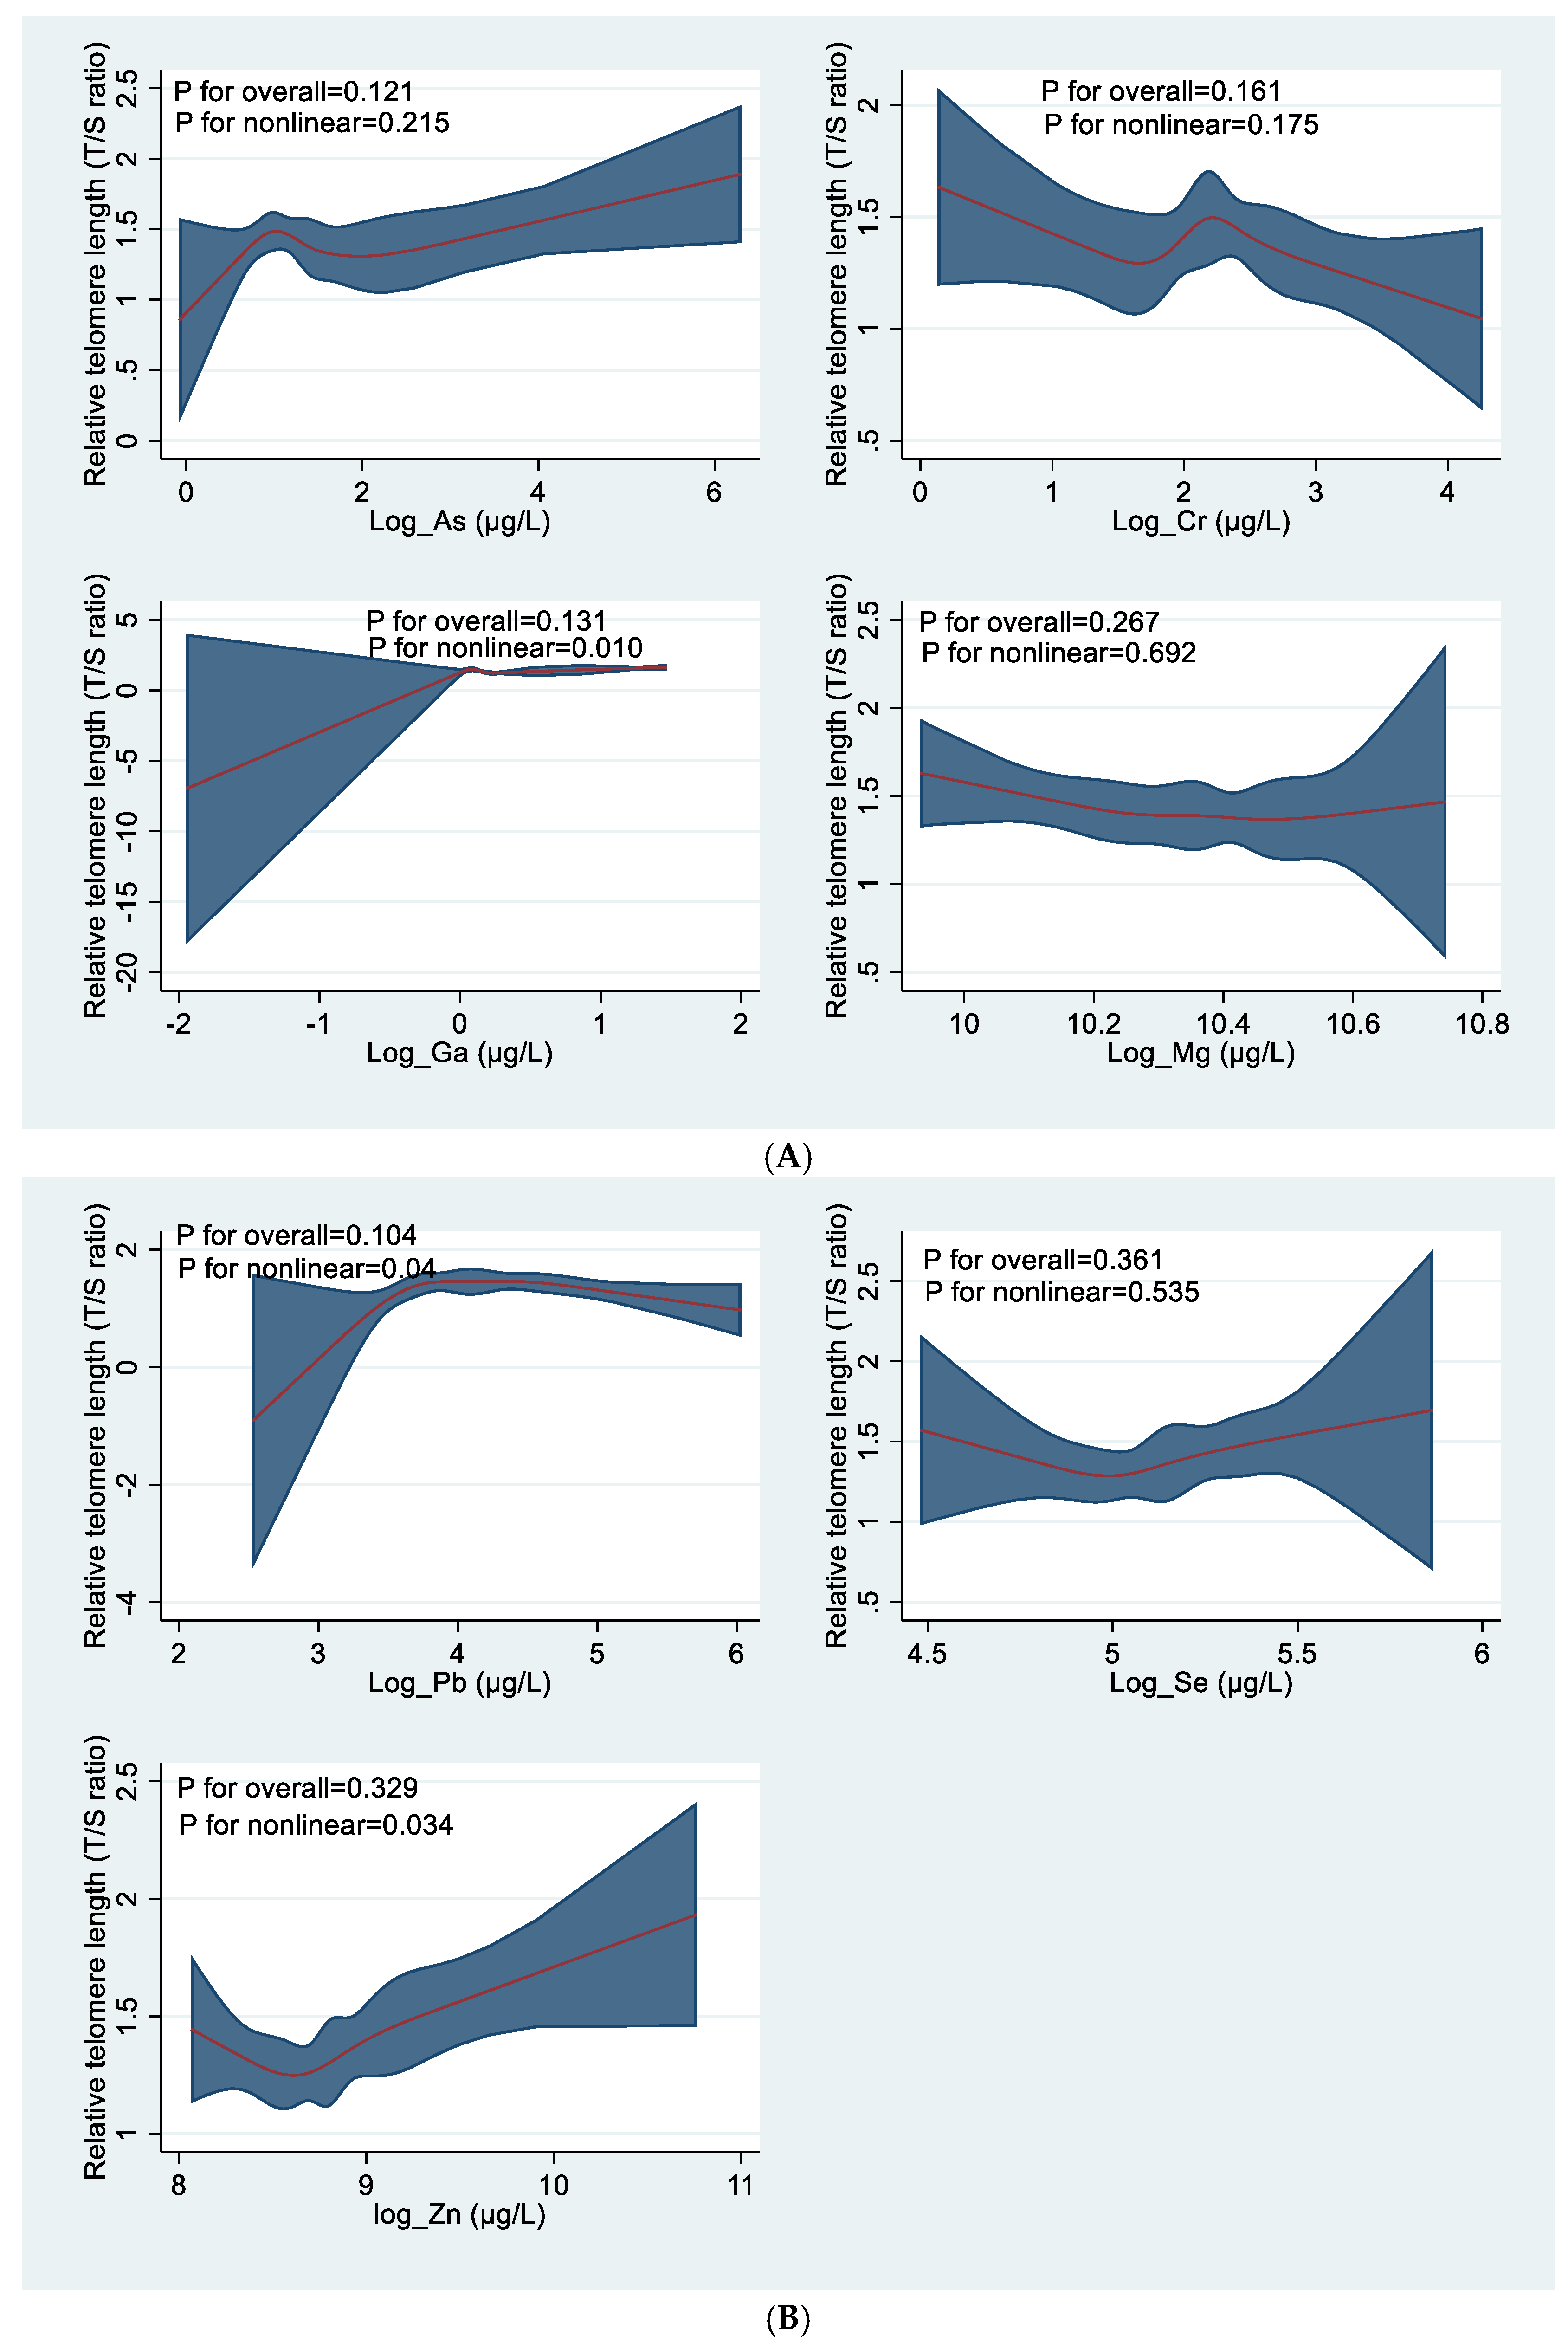
Figure 5.
A&B: Association between blood metal levels concentrations and relative telomere length using RCS.
Figure 5.
A&B: Association between blood metal levels concentrations and relative telomere length using RCS.
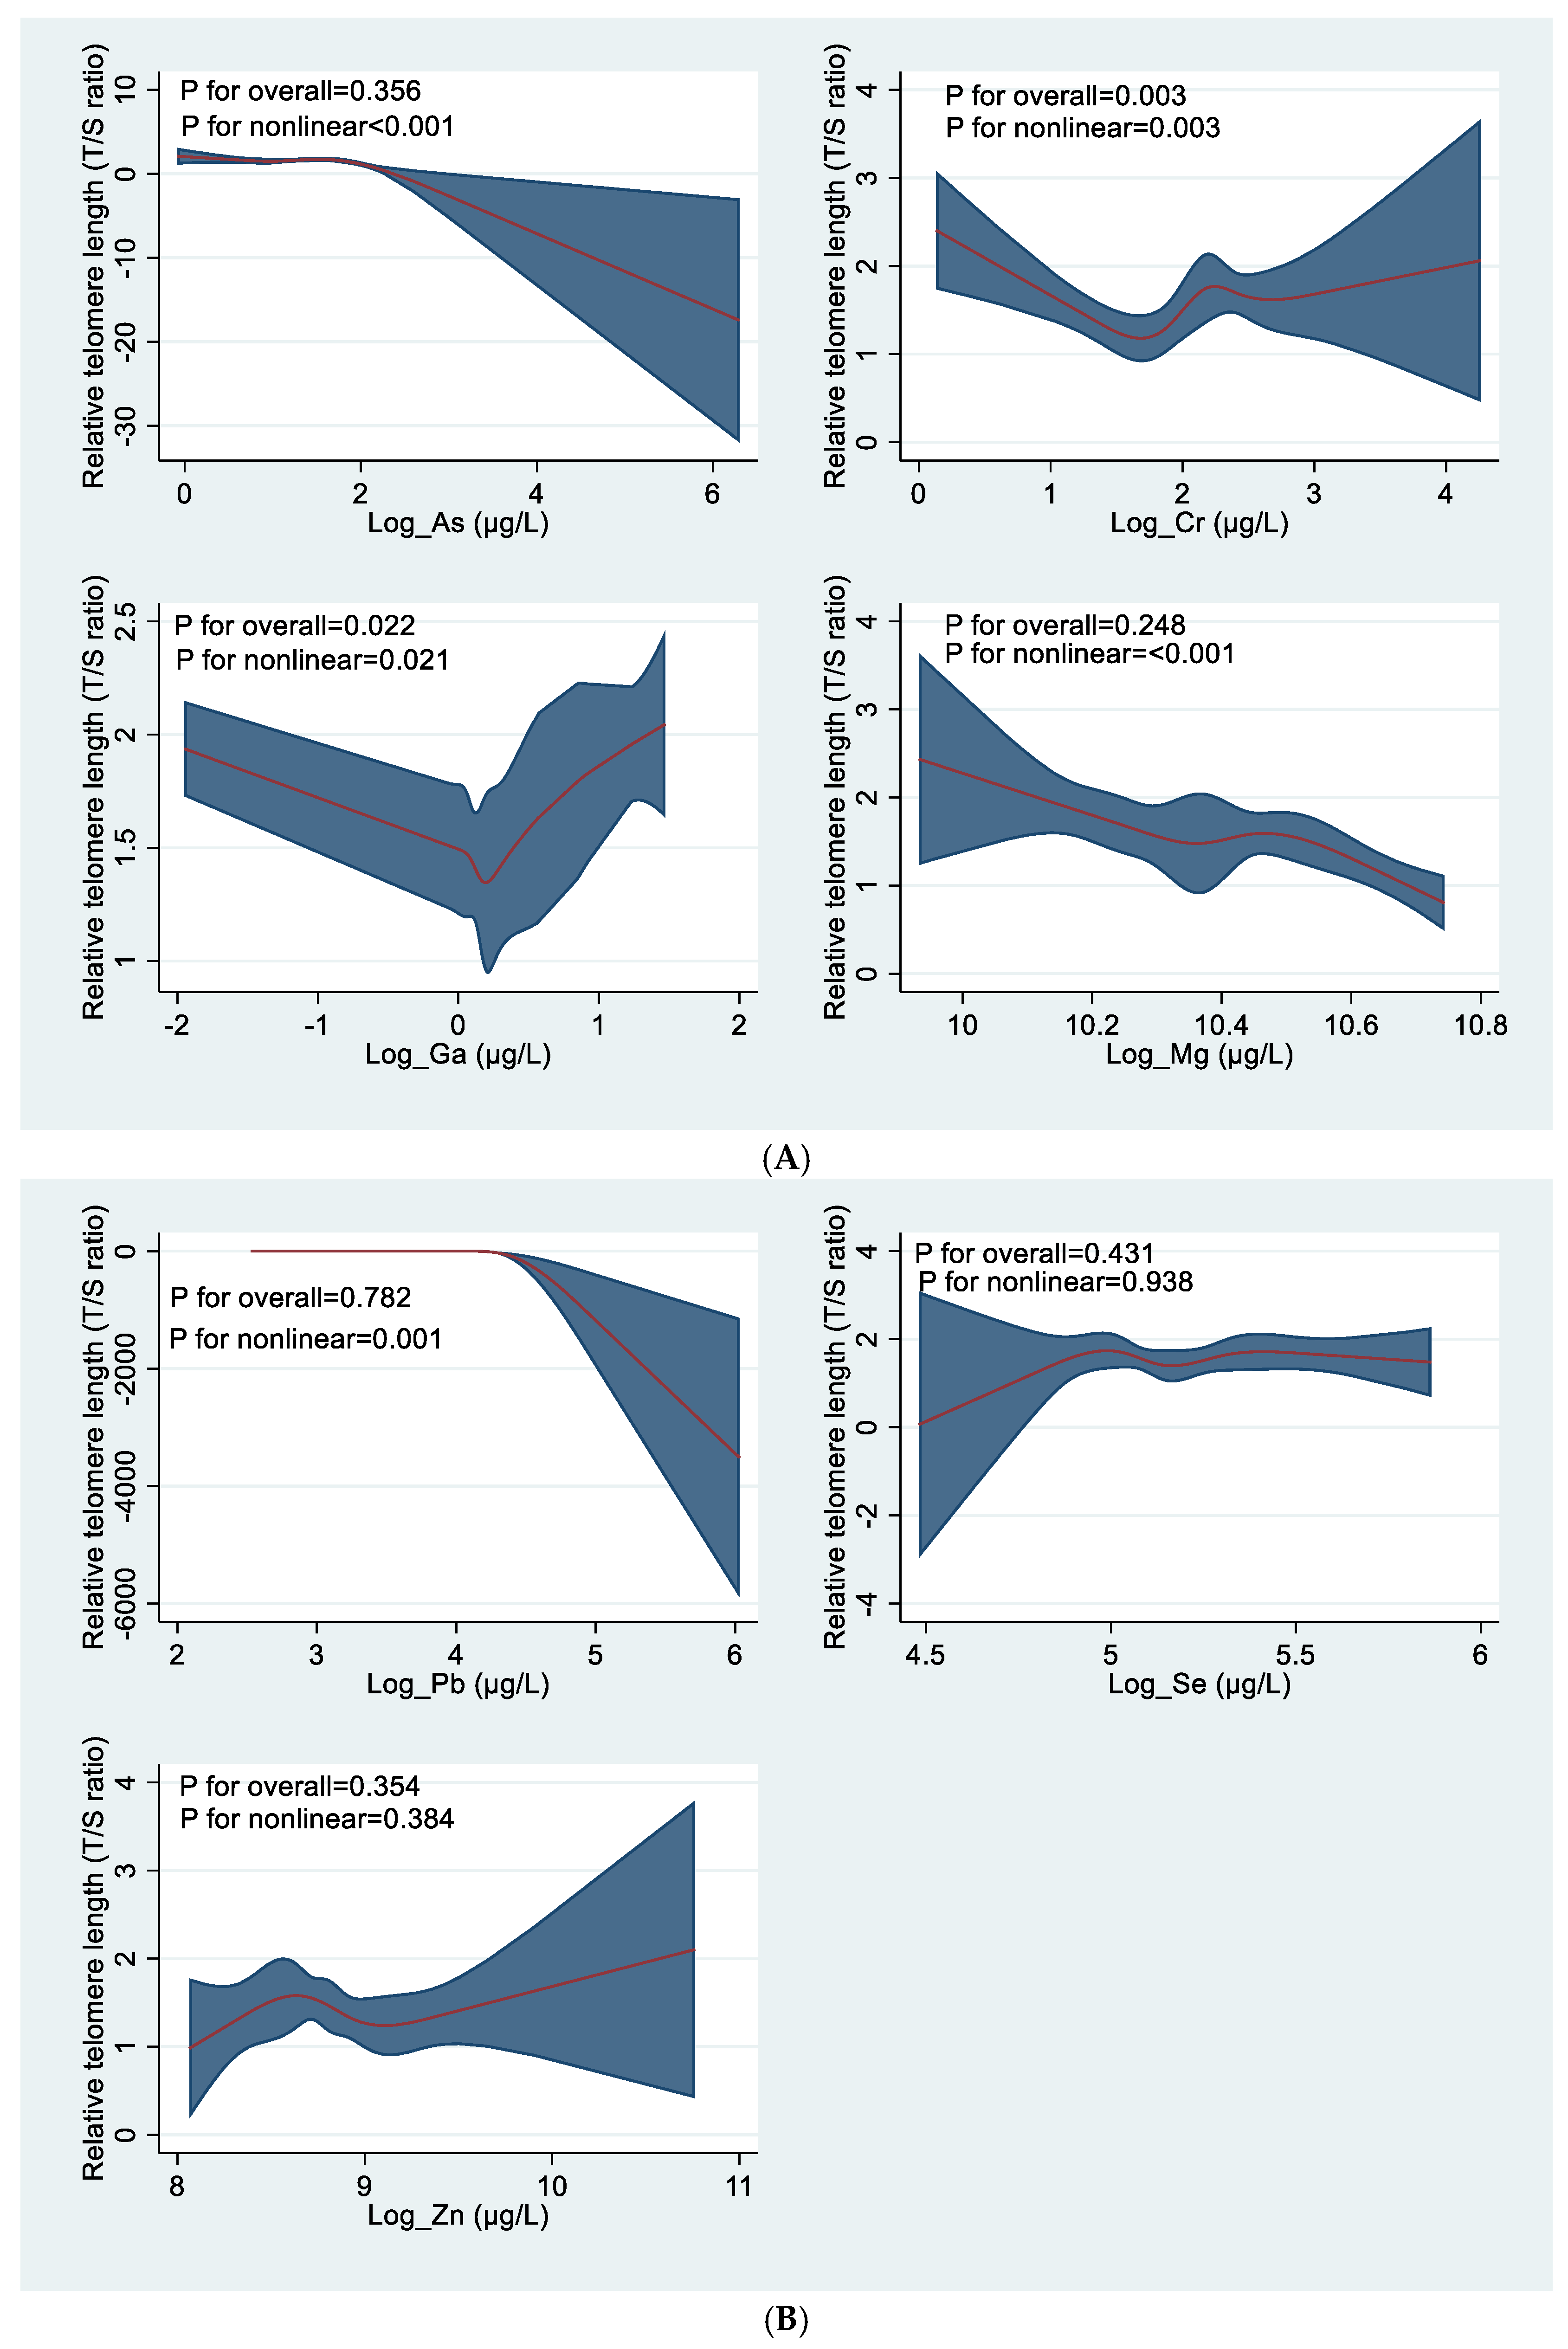
Figure 6.
A & B: The association between metal exposure in urine and rTL for the study population using restricted cubic spline (RCS).
Figure 6.
A & B: The association between metal exposure in urine and rTL for the study population using restricted cubic spline (RCS).
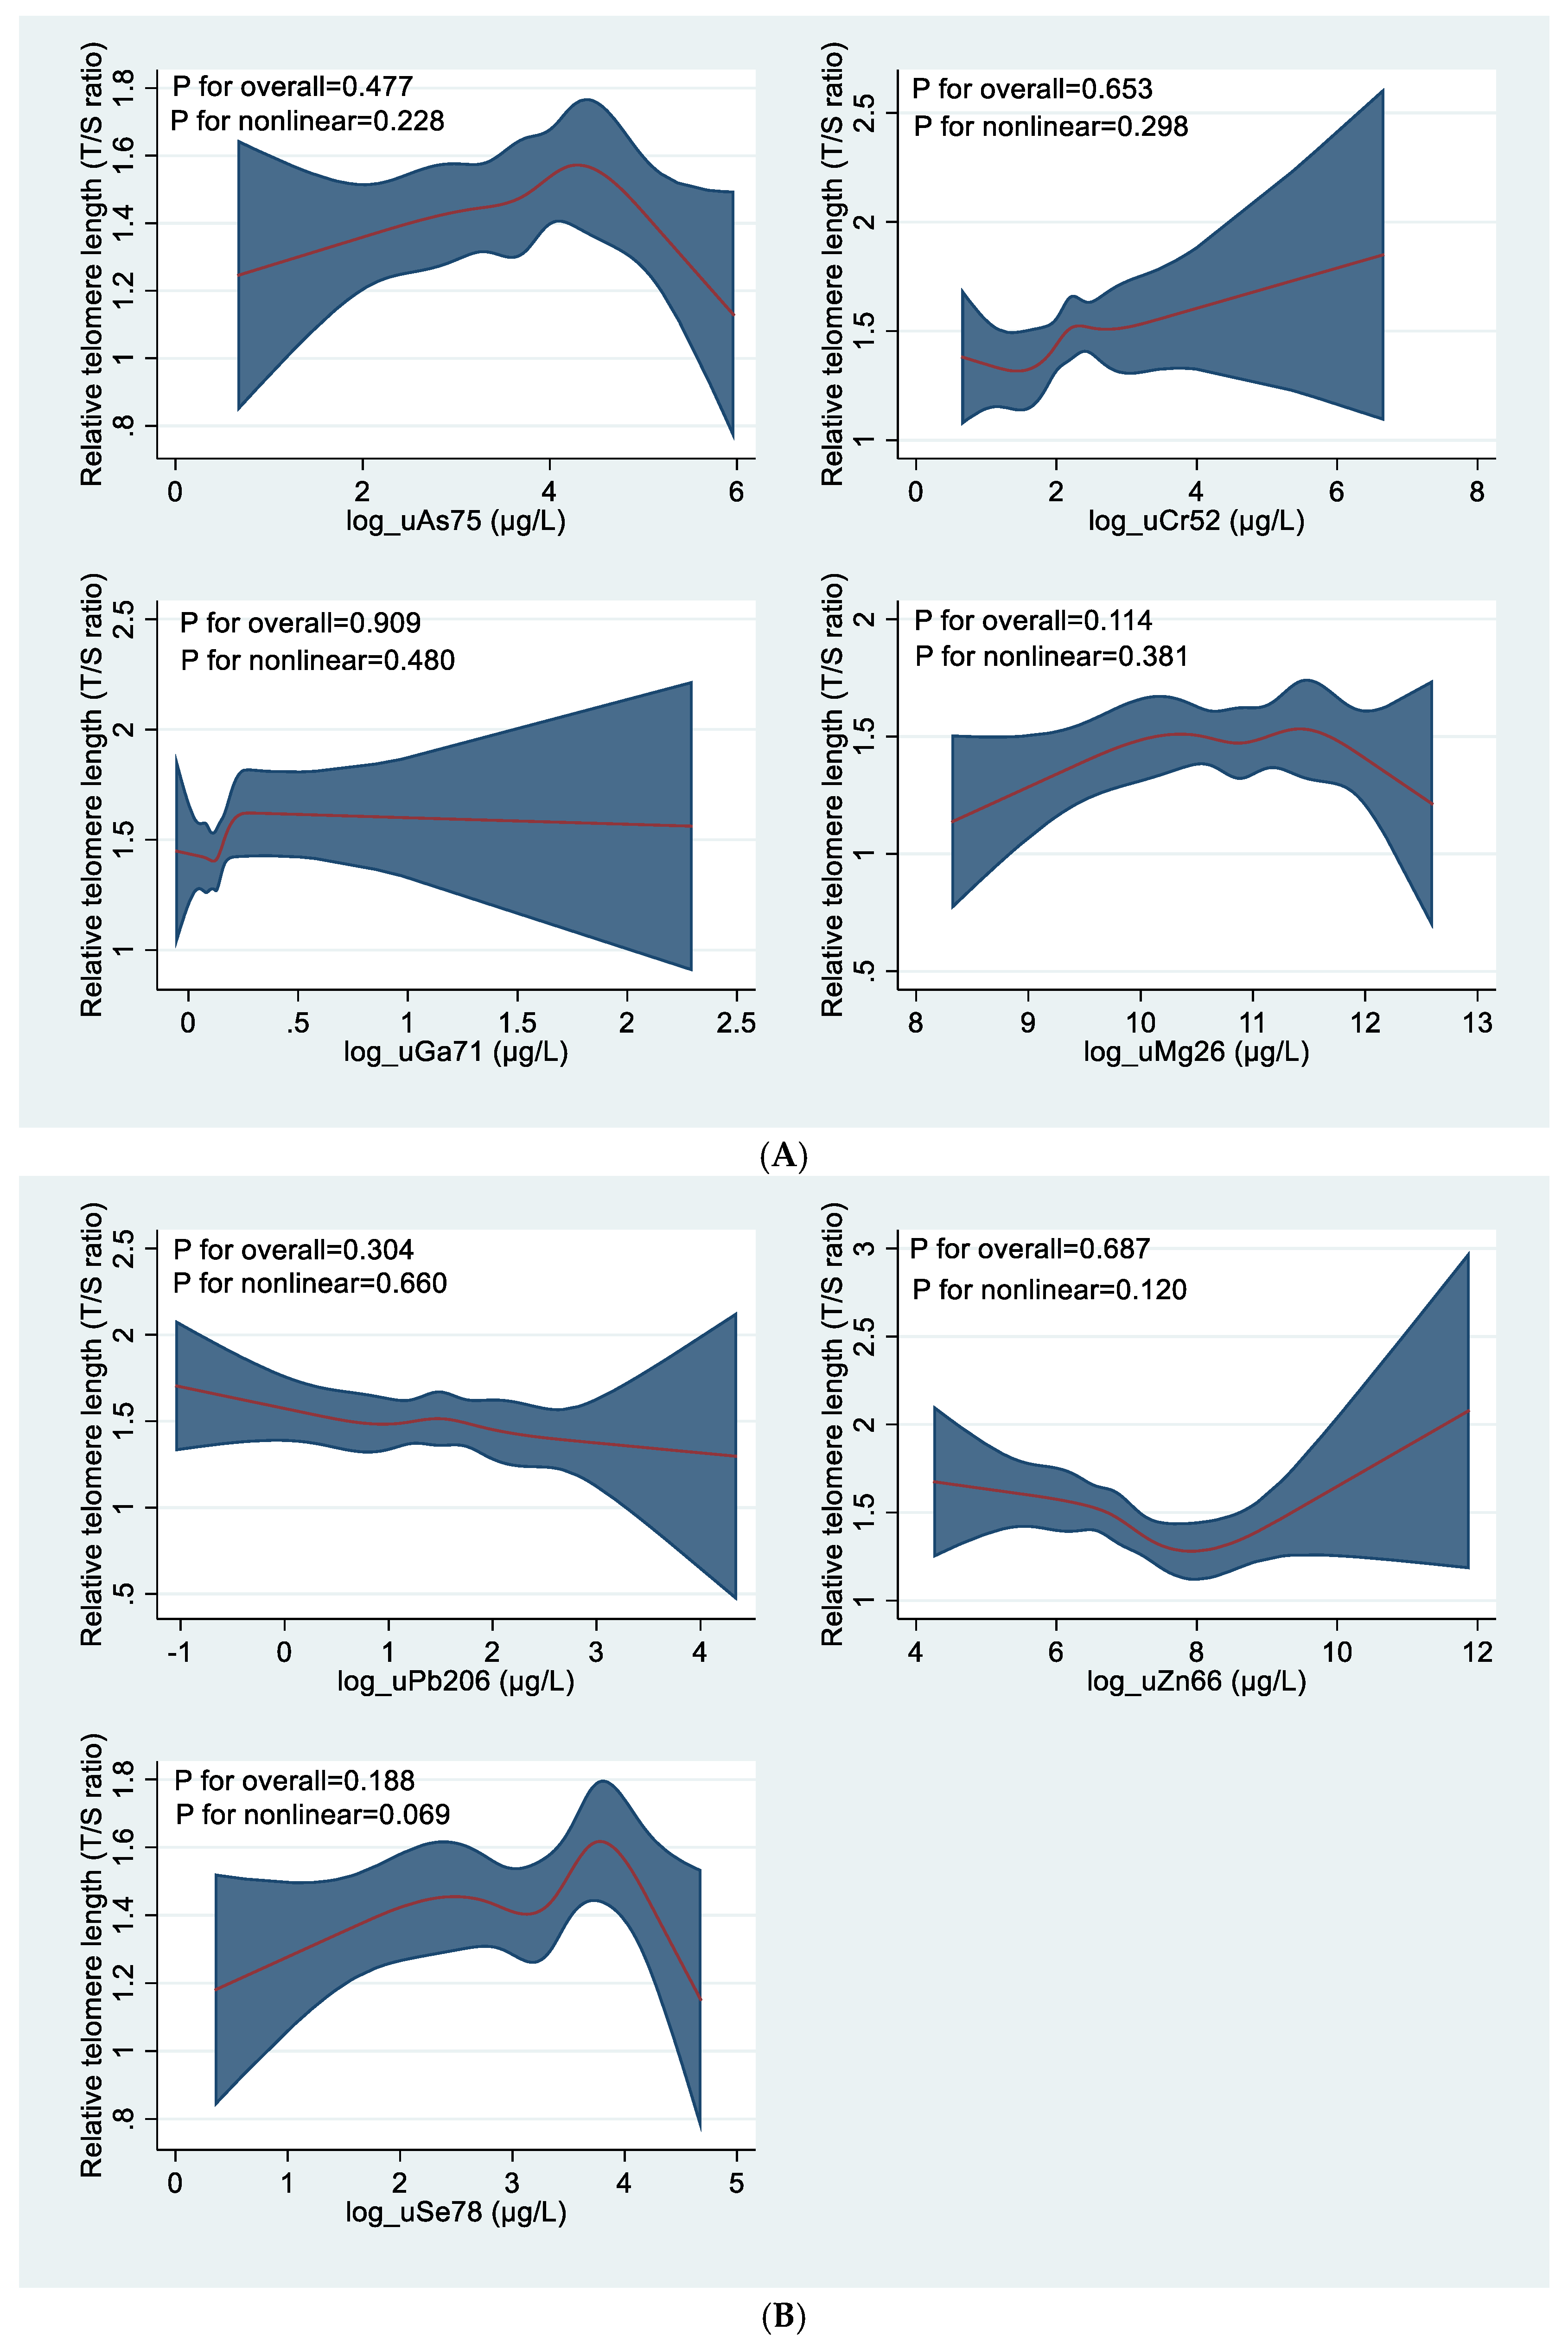
Figure 7.
A & B: Association between metal urine levels among e-waste workers and relative telomere length using RCS.
Figure 7.
A & B: Association between metal urine levels among e-waste workers and relative telomere length using RCS.
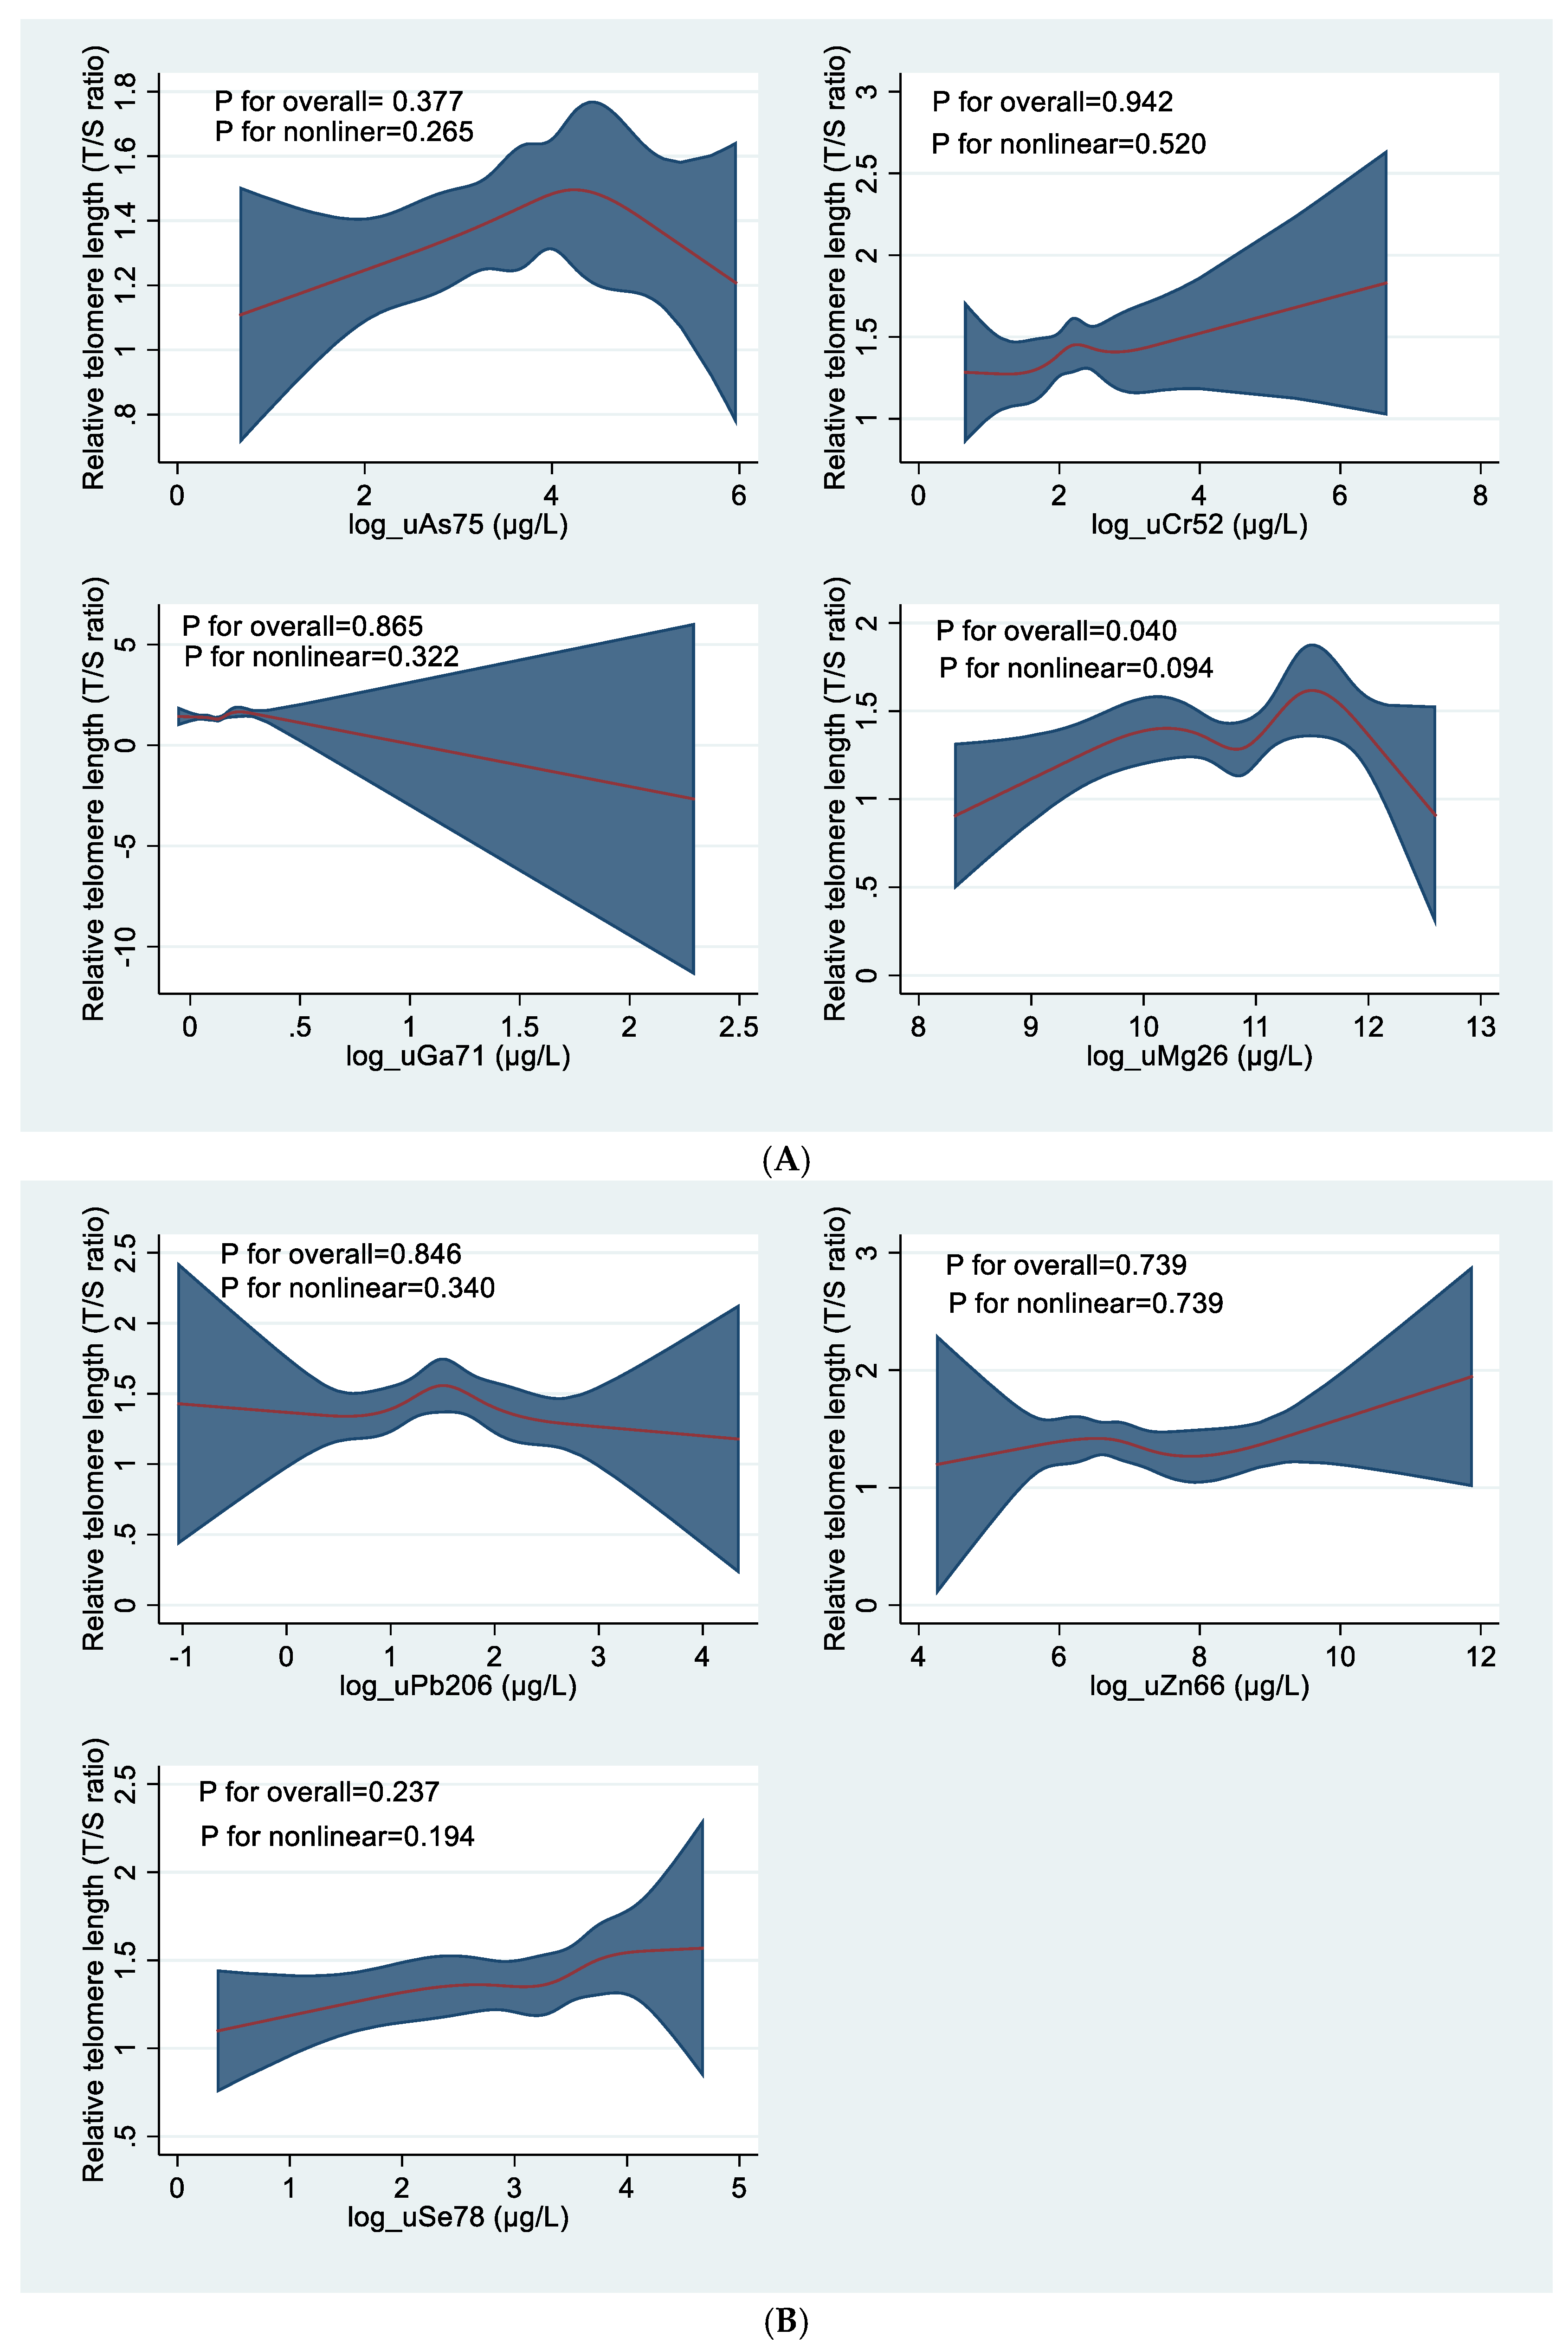
Figure 8.
A &B: Association between metal urine levels among the reference population and relative telomere length using RCS.
Figure 8.
A &B: Association between metal urine levels among the reference population and relative telomere length using RCS.
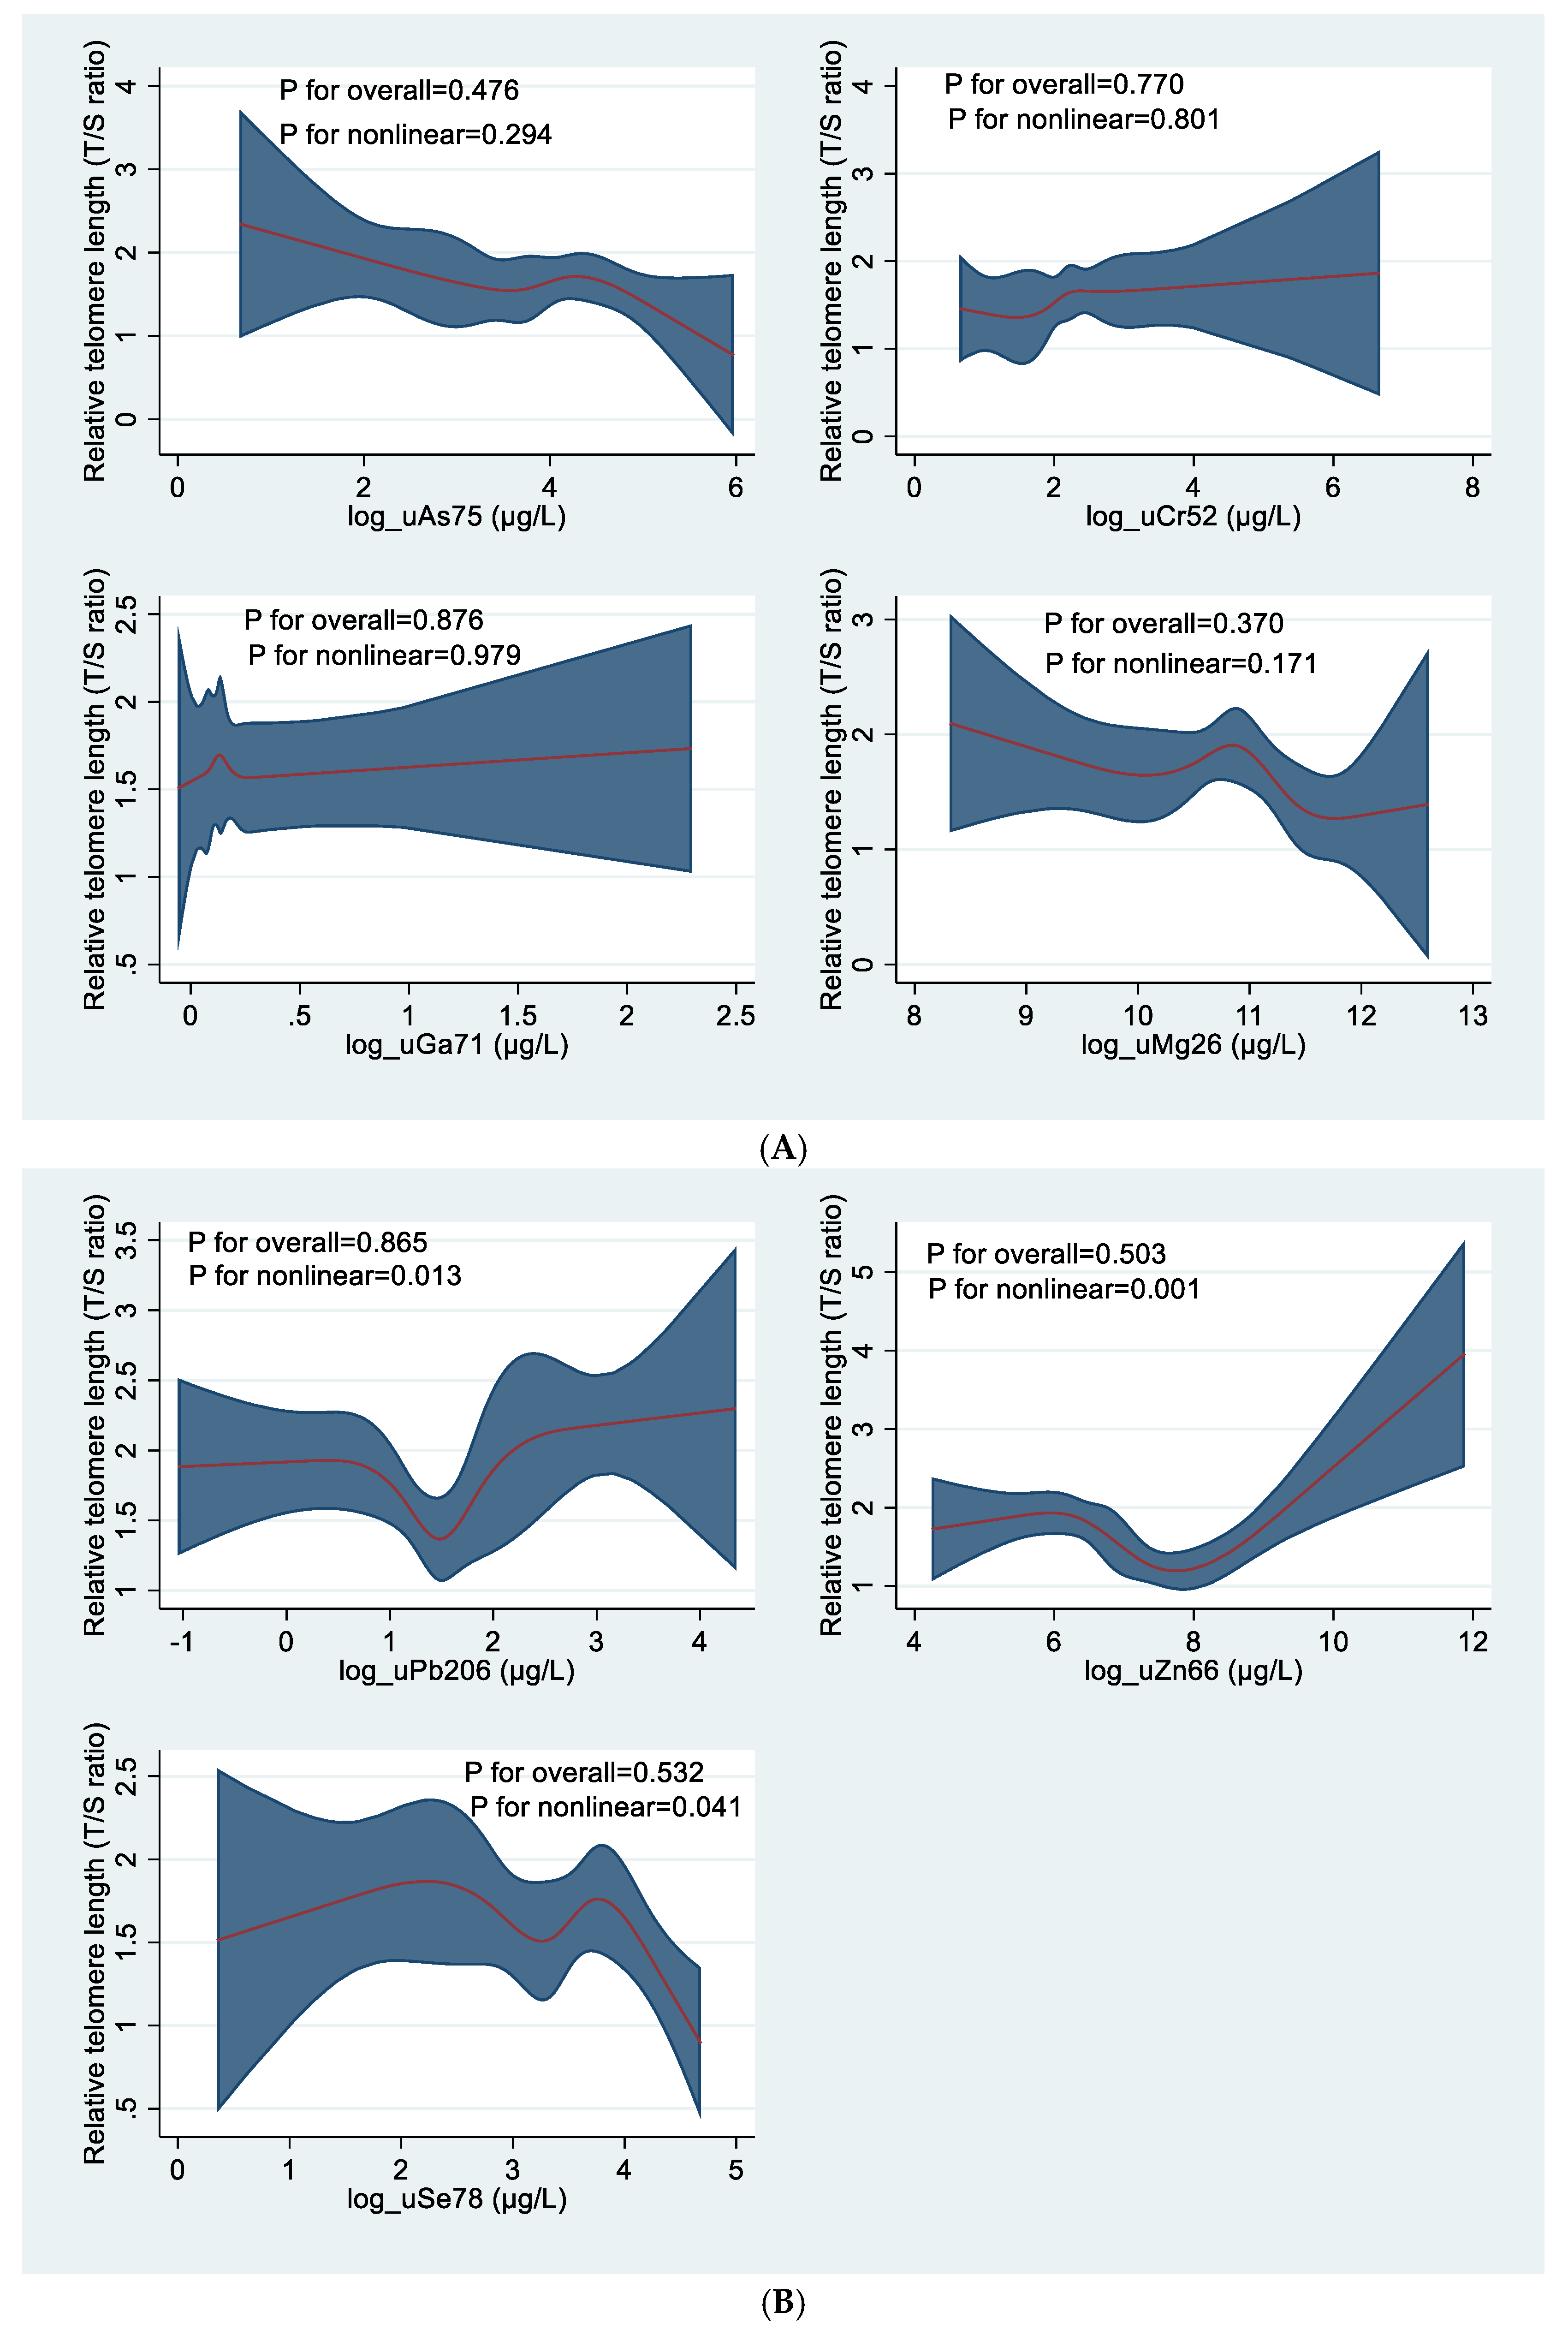
Table 1.
Baseline characteristics of e-waste workers (n=53) and Reference group (n=25) enrolled in the study.
Table 1.
Baseline characteristics of e-waste workers (n=53) and Reference group (n=25) enrolled in the study.
| Total | E-waste workers | Reference group | p-value | |
| Characteristics | N=78 | n=53 | n=25 | |
| BMI (kg/m²), mean(±SD) | 22.5(3.5) | 21.7(2.8) | 24.4(4.1) | 0.002a |
| Age (years), mean(±SD) | 27.7(7.9) | 25.9(6.5) | 31.6±9.2 | 0.001a |
| Sleep location, n (%) | ||||
| On the site | NA | 32(60.4) | NA | |
| ≤1km off-site | NA | 21(39.6) | NA | |
| Education, n (%) | 0.116b | |||
| No formal | 12(15.38) | 10(18.9) | 2(8) | |
| education Primary | 18(23.08) | 13(24.5) | 5(20) | |
| Middle/JHS | 27(34.62) | 20(37.7) | 7(28) | |
| Secondary/SHS+ | 21(26.92) | 10(18.9) | 11(44) | |
| Indoor biomass use | 0.60b | |||
| Yes | 16(20.5) | 10(18.9) | 6(24) | |
| No | 62(79.5) | 43(81.1) | 19(76) | |
| Alcohol use, n(%) | 0.37b | |||
| Regular | 4(5.1) | 4(7.6) | 0(0) | |
| Former | 6(7.7) | 4(7.6) | 2(8.0) | |
| Never | 68(87.2) | 45(84.9) | 23(92) | |
| Smoking, n(%) | 0.08b | |||
| Yes | 15(19.2) | 13(24.5) | 2(8.0) | |
| No | 63(80.8) | 40(75.5) | 23(92) | |
| E-waste job category, n(%) | ||||
| Collectors/sorters | NA | 10(18.9) | NA | |
| Dismantlers | NA | 29(54.7) | ||
| Burners | NA | 14(26.4) | NA |
Abbreviations: SD=standard deviation, N= Total number of participants, n (%) = frequency (percent frequency), JHS = junior high school, SHS = senior high school. a p-value obtained by t-test, b p-values obtained by chi-square test, bold p-values are statistically significant.
Table 2.
a. Blood metal concentration across groups. b. Blood metals concentrations across groups over time.
Table 2.
a. Blood metal concentration across groups. b. Blood metals concentrations across groups over time.
| (a) | |||||||||
| Metal (µg/L) | E-waste workers (n=53) | Reference Population (n=25) | p value | Study Population (N=78) | |||||
| Median(IQR) | |||||||||
| Zn | 6606.2 ( 2287.1 ) | 6636.05 (2092.1 ) | 0.5936 | 6607.4 (2210.7 ) | |||||
| Pb | 72.215 ( 43.065 ) | 31.395 (16.745 ) | <0.0001 | 57.87 (47.045) | |||||
| As | 3.745 (2.845 ) | 4.14 ( 2.68 ) | 0.1303 | 3.99 (2.88 ) | |||||
| Mg | 31535.18 (5503.385) | 32769.81 (7794.19 ) | 0.2178 | 31835.23 (5974.465 ) | |||||
| Cr | 8.9 ( 4.875) | 8.99 ( 6.38 ) | 0.8947 | 8.91 (5.325 ) | |||||
| Ga | 1.1897 ( .2826 ) | 1.1528 (.4424 ) | 0.6558 | 1.1774 (0.2993 ) | |||||
| Se | 166.03 ( 57.08 ) | 181.325 (42.305 ) | 0.004 | 170.47 (52.025) | |||||
| Legend: IQR=interquartile range, N= Total number of participants, n = sub study population, p - value obtained using Mann Whitney U test, bold p-values are statistically significant. | |||||||||
| (b) | |||||||||
| Wave | Metal (µg/L) | Total (N=78) | |||||||
| E-waste workers (n=53) | Reference population (n=25) | ||||||||
| Median (IQR) | Median (IQR) | Difference | p-value | ||||||
| One | Zn | 7235.2(3320.8) | 7907.4(1520.55) | 672.2 | 0.261 | ||||
| Pb | 82.735(42.325) | 36.51(17.57) | 46.225 | <0.0001 | |||||
| As | 6.405(8.76) | 6.085 (1.84) | 0.32 | 0.763 | |||||
| Mg | 34574.89(5849.49) | 37939.5(7544.565) | 3364.605 | 0.047 | |||||
| Cr | 6.155(2.245) | 4.8(1.89) | 1.355 | 0.015 | |||||
| Ga | 1.082(0.1292) | 1.1108(.1471) | 0.0288 | 0.407 | |||||
| Se | 146.01(50.405) | 172.94 (40.365) | 26.93 | 0.018 | |||||
| Two | Zn | 5985.15(1910.75) | 6169.95(1558.4) | 184.8 | 0.672 | ||||
| Pb | 71.57(40.37) | 31.12(13.07) | 40.45 | <0.0001 | |||||
| As | 2.77(1.335) | 3.21(1.51) | 0.44 | 0.2 | |||||
| Mg | 30430.01(5174.93) | 30116.43(5624.045) | 313.58 | 0.817 | |||||
| Cr | 9.27(3.61) | 9.985(3.345) | 0.715 | 0.42 | |||||
| Ga | 3.4426(2.3553) | 2.5292(2.3362) | 0.9134 | 0.144 | |||||
| Se | 179.015(45.115) | 169.03(35.7) | 9.985 | 0.347 | |||||
| Three | Zn | 6650.75(1857.8) | 6275.3 (1769.6) | 332.1 | 0.44 | ||||
| Pb | 70.135(36.22) | 28.445(9.475) | 41.8 | <0.0001 | |||||
| As | 3.0925(2.2825) | 3.855(2.105) | 0.67 | 0.194 | |||||
| Mg | 30616.94(4204.567) | 28978.04(4757.895) | 1558.385 | 0.129 | |||||
| Cr | 11.205(3.75) | 12.115(3.995) | 0.78 | 0.377 | |||||
| Ga | 1.1613(0.1235) | 1.116(0.0765) | 0.0458 | 0.097 | |||||
| Se | 170.055(48.405) | 193.53 (38.49) | 23.06 | 0.025 | |||||
Legend: IQR=interquartile range, N= Total number of participants, n = sub study population, p-value and difference in median obtained using quantile regression test, bold p-values are statistically significant.
Disclaimer/Publisher’s Note: The statements, opinions and data contained in all publications are solely those of the individual author(s) and contributor(s) and not of MDPI and/or the editor(s). MDPI and/or the editor(s) disclaim responsibility for any injury to people or property resulting from any ideas, methods, instructions or products referred to in the content. |
© 2025 by the authors. Licensee MDPI, Basel, Switzerland. This article is an open access article distributed under the terms and conditions of the Creative Commons Attribution (CC BY) license (http://creativecommons.org/licenses/by/4.0/).
Copyright: This open access article is published under a Creative Commons CC BY 4.0 license, which permit the free download, distribution, and reuse, provided that the author and preprint are cited in any reuse.


