
Submitted:
26 August 2025
Posted:
26 August 2025
You are already at the latest version
Abstract
This paper presents a data-driven flexible hybrid architecture which explore the use of a Specific Energy Consumption (SEC) index for predicting the Remaining Useful Lifetime (RUL) of spare mechanical parts of an industrial electric machine. The architecture carries out a hybrid process between a physics-based and data-driven deterioration model, and a similarity model based on a recursive database continuously enriched with real data on current used electrical power and the flow of raw material. The architecture enriches the production database with both synthetic and real data through continuous improvement based on the extraction of features from new incoming real data. This recursive process of database construction is carried out to improve the robustness, accuracy and precision of estimations. The integration of this architecture aims to enhance predictive maintenance. As an example to illustrate the architecture, the case of an industrial shredder machine is analyzed from real data. The proposed architecture successfully predicts the RUL of sugarcane shredder spare parts from the recursive database and a defined threshold condition. The RUL prognosis converges toward a representative trajectory of the database after a given early time with respect to the total useful life.
Keywords:
Condition monitoring
; data-driven fault detection
; deterioration model
; hybrid architecture
; industrial equipment maintenance
; predictive maintenance
; Prognostics and Health Management (PHM)
; real-time diagnostic systems
; Remaining Useful Life (RUL)
; RUL prognostics
1. Introduction
This paper has two main technical motivations. Firstly, to develop a prognostic architecture that dynamically assesses the current deterioration condition of spare parts of machinery, predicts their Remaining Useful Life (RUL), and could include various methods of deterioration estimation, whether data-based or model-based, that is, a hybrid and flexible prognostics architecture. Secondly, to improve the operational performance of high-power industrial machinery by calculating the Specific Energy Consumption (SEC) in real time. This approach is intended not only to improve maintenance strategies but also to contribute to energy saving.
The prognostics of RUL of assets for industrial machinery and its relationship with the reliability of systems is a widely studied topic in Prognostics and Health Management (PHM). PHM is a computation-based paradigm that elaborates physical knowledge, information, and data of structures, systems and components (SSCs) operation and maintenance, to enable detecting equipment and process anomalies, diagnosing degradation states and faults, predicting the evolution of degradation to failure so as to estimate the RUL [1].
In the literature, several types of models are used to estimate the RUL of components, namely: i) knowledge-based models, ii) deterioration models, and iii) survival models. Knowledge-based models, also known as similarity models, are used for prognostics through an expert system considering various evolution trajectories from a healthy state of the component up to its failure or safety threshold [2]. Deterioration models are used especially when the final data up to failure is not known but up to a safety threshold, and when the process of deterioration gives significant information on usage, source of variation, faults, etc. [3,4]. Survival models are used when there is mainly knowledge about the failure times of several components rather than the process (see some examples in [4]). In general, RUL estimation models focus on exploiting existing knowledge about resource performance. Then, various techniques, from statistical applications to applications using Artificial Intelligence (AI), have been developed to accurately estimate the end-of-life time and/or its precision with its respective probability distribution characteristics. In the work [5], several algorithms about his topic are considered.
The open challenges in last years on RUL prognostics modeling [4,6] are mainly related to ensuring the robustness, reliability, and applicability of predictive models. Robustness refers to the ability of a model to maintain consistent performance despite inherent variations in input data. Reliability involves the ability of a model to produce accurate and consistent predictions when faced with new or unknown data. Applicability refers to the practical implementation of the prognostic approach within real industrial constraints, including aspects such as failure definition, complexity, computational demands, ease of integration into existing systems and flexibility. Addressing these challenges simultaneously remains difficult because they are interconnected: Enhancing one aspect can sometimes compromise another. Consequently, developing models that are simultaneously robust, reliable, and applicable in diverse and unpredictable industrial environments remains an open and pressing issue in the field of tool wear prognostics.
Conventional model-based methods are hampered by limitations or inability to handle the nonlinearities, measurement uncertainty, fault coupling, and other application problems. For example, successful models can be highly complex, and others are too dependent on historical calculations rather than the current system [7]. Similar new approaches seek to analyze how few degradation parameters can absorb all possible sources of degradation, see, for instance [8]. In recent years, other methods have sought to use data-driven technologies to reduce the complexity of the RUL prognosis as in [9,10].
Here, hybrid approaches combine all the available sources of knowledge, model-based and data-driven information. See for instance [10,11]. They bring the advantages of robustness and interpretability of model-based, and the specificity and accuracy of data-driven methods.
Then, a common problem lies in the lack of development of global architectures that allow the management of various types of model, i.e., model-based, data-driven, and hybrid methods, so that various techniques can be tested within the same architecture. We can say that such architectures are more adaptable and less method-dependent. See, for example, [12] where an ensemble prognostics method with degradation-dependent weights is proposed, to improve prediction accuracy by combining multiple learning algorithms. See also [13], which illustrates how the fusion of data from multiple sensors and the combination of different modeling paradigms can lead to more accurate and reliable RUL estimation, demonstrating the flexibility of an architecture that does not rely on a single model type. Furthermore, see [14], which presents the flexibility of integrating information from multiple sources (sensors) and applying fusion techniques for more robust RUL prediction, which is essential for an architecture less dependent on a single data type or model.
In this paper, authors intend to address the uncertainties in the framework of a agile enough hybrid architecture focused on online prediction, considering the current condition of the deterioration and its dynamic behavior, as well as the current and future operating conditions.
The general problem is illustrated in the context of high-power industrial machines. A case study of an industrial shredding machine in a sugarcane mill is used. This shredding machine, or shredder, plays a crucial role in the preparation of the harvested sugarcane stalks. Preparation is the first stage of the global production process. It consists of an electric motor coupled to a longitudinal shaft, on which a set of tilting hammers is mounted. These hammers impact the cane stalks at high speed, breaking the cane stalks and facilitating the extraction of juice in the mills. This juice is then processed to produce white sugar, alcohol, energy, and other by-products such as organic fertilizers. In addition, several sugar mills generate electricity from the combustion of sugarcane waste, which contributes to sustainable energy practices.
Hammers are the most critical spare parts of a shredder, performing the primary work of breaking down materials. Due to their crucial role, they are also subject to the most significant wear. The deterioration of hammers is a process characterized by the progressive loss of their ability to perform their task effectively within a specified range. Deterioration affects the overall performance process and energy consumption of the shredder, therefore, it is essential to monitor and manage the condition of the hammers in real time.
The operation of industrial shredders, particularly in sugarcane mills, is significantly linked with the Specific Energy Consumption (SEC), which in turn is related to the hammers deterioration. Usually, hammers are replaced on the basis of visual observation. However, the evolution of Specific Energy Consumption (SEC), calculated from the power required, during the deterioration of hammers appears to follow a consistent increasing pattern, correlating with the decreasing hammers’ lifespan. Several critical issues highlight the need for improved management and monitoring of SEC: High impact of SEC usage on maintenance decisions; high cost of spare parts; limited availability; large amount of SEC data not used systematically; low number of frames with complete information linked to maintenance; and not enough plots to make a statistical analysis.
Therefore, one of the primary goals of shredder management is to extend the lifetime of the hammers, thus prolonging the service time of the shredder while maintaining its nominal performance. See the previous work [15]. Achieving this goal requires continuous estimation of the hammers’ RUL. RUL is defined as the time remaining from the current moment until the hammers no longer perform their intended function. Accurate, precise, online (in-operation), and noninvasive diagnostics of the hammers’ current state of deterioration are essential for predicting their RUL. This type of RUL prognosis can facilitate informed decision-making regarding machine health, with the aim of: Extend mean time to failure, improve maintenance strategies, reduce energy costs, minimize downtime, manage assets more effectively, increase profitability, and efficiency of production. These tasks are particularly valuable within the framework of intelligent and sustainable resource management.
Given these challenges, in this paper, a general architecture for RUL estimation is proposed. Several strategies are taken: Exploiting incomplete data; real-time comparison of new production information; conservative real testing; simulating input data; probabilistic certification; and progressive data integration. To accurately calculate the SEC linked to the hammers in real time, we incorporate machine learning techniques into the monitoring and analysis of the shredding process. Dynamic estimation of the current deterioration state of the hammers and dynamic prediction of their future condition are performed. This enables the system to detect possible anomalies and predict the hammers’ RUL.
By analyzing historical data and generating synthetic data through a novel data-driven model, we can characterize zones of behavior and establish a comprehensive mapping of production dynamics. Similarity techniques can be used to perform real-time comparisons of production data with respect to this historical mapping. As an example, Cumulative Euclidean Distance algorithm is used. In addition, dynamic feature extraction of production trajectories, provides insights into the operating performance and energy consumption of the shredder. As an example, slope extraction technique is used to represent the extraction process and, at the same time, for monitoring the health condition of the spare parts.
The integration of these techniques aims to improve predictive maintenance strategies, optimize energy usage, and improve overall energy production use in sugarcane mills. Using the power of machine learning, we can achieve a more sustainable and cost-efficient industrial process.
To the authors’ knowledge, there was no similar general schema of such architecture, nor a solution focused on the spare parts of an industrial machine as the sugarcane shredder, under the framework of the described scenario. There, the power consumption per ton of cane was understood as an indicator of machine deterioration; however, the corrective maintenance decision was made based on its increase and the preventive satisfaction of the nominal work. Moreover, for the characteristics of the system input, as described, there were no studies on the type of probabilistic distribution that the RUL would have.
The paper is organized as follows: Section 1, Introduction; Section 2, Deterioration considerations on the case study system, which includes the general characteristics of the case study, the analysis of deterioration phenomena of an industrial sugarcane shredder, and considerations and definitions for the general problem. Section 3, Problem statement for the case study: Industrial Shredders, describes in a general and systematic way the architecture proposed as a solution. Section 4, Data-driven deterioration model, describes the data sources for the case study (sugarcane flow and power) are analyzed. A model is performed, tested, and validated from real data, to estimate the deterioration and subsequently the RUL of hammers. In Section 5, Hybrid architecture for RUL estimation, the blocks and process of the proposed architecture are explained. Finally, in Section 6, Architecture application for RUL prediction, by means of a numerical example, the integration of RUL prognostics architecture is evaluated from real data.
2. Deterioration considerations on the case study system
This paper analyzes the case of an industrial machine that progressively deteriorates as a direct result of raw material being processed; for instance, by a continuous and rotating action of milling, cutting, or crushing of the raw material flow. In this case, it is assumed that there is a continuous measurement of the raw material flow and the electrical power used in the process. Thus, the raw material flow is considered as the input to the system. The motion control actions and the characteristics of the input are seen as a source of stress that deteriorates the actuator, see, for instance, [16,17,18]. Complementarily, in [19,20], the authors assume a relationship between the degradation and the control input of the system to perform Model Predictive Control, MPC, techniques. Therefore, one can assume that managing the RUL of a component could be achieved by modifying in a suitable way the input, including also a feedback action.
Note that these types of approach are based on the component level because the deterioration of the spare parts of the machine that come in contact with the processed material is clearly the cause of the decrease in service time. For other systems where it is necessary to first identify the critical component and how to identify it in a complex dynamic system, recent developments can be found, for instance, in [21].
In this paper, we take as a case study an electric industrial sugarcane shredding machine, hereafter referred to as shredder, which by means of a continuous rotary action of a set of hammers prepares the sugarcane flow by progressively hitting the stalks, in order to extract useful juice for successive stages.
In the sugarcane preparation process, the deterioration D of the hammers can be considered as a measure of the loss of their ability to perform shredding action adequately within a given range. The deterioration D can then also be considered as an image of the heat and the worn material on the contact surface of the hammers during their lifetime. In this process, the deterioration of the materials is assumed to increase monotonically, i.e. always increasing.
The deterioration D can be modeled as a function of the energy dissipated by the shredder machine and transferred through the hammers to the sugarcane stalks. This assumption is consistent with the Archard equation that is commonly used in the railway industry to predict wear (see, for example, [22,23]).
Then, the deterioration process of the spare parts (i.e. the hammers) is related to the increasing Specific Energy Consumption (SEC) of the machine, for a direct mechanical energy transfer process. That is, for an industrial machine, whose spare parts are the ones in charge of coming in direct contact with a given raw material, it can be inferred that the increasing SEC of the machine reflects in some sense its deterioration.
Consider to be the power required by the sugarcane preparation process when the hammers of the shredder machine impact the cane. Thus, consider the deterioration to be proportional to the energy consumption of the sugarcane preparation process for a given interval from time 0 to time t namely:
where c is a constant.
Table 1 at the end of the paper shows the nomenclature (acronyms, symbols for variables, parameters, units, and their meaning) used in the paper.
The sugarcane flow , is considered an input to the system and is defined in this case as the mass of sugarcane per unit of time. is assumed to be a random, bounded, exogenous input, assumed to be continuously measured and manipulable at each time step. In this paper, units used for are tonnes (metric tons) per hour, i.e. [t/h] for convenience within the field of application.
Moreover, according to the initial assumptions and the definition of , it can be assumed that is a function of the sugarcane flow as
Therefore, it is possible to find a function g that links the derivative of the deterioration in Equation (1), noted as with :
Equation (3) indicates that the rate of deterioration of the hammers is a function of the sugarcane flow, i.e., by manipulating the sugarcane flow, the rate of deterioration of the hammers can be increased or decreased.
Note also that it is assumed that the power required for the cane preparation process and the cane flow are measured. Therefore, the real deterioration at a current time, can be predicted on-line (i.e. during work) from the measured data.
It is also assumed that can be estimated at any time from the estimation of the current deterioration, here noted as , and its simulated trajectory within a horizon until an acceptable threshold before failure.
For this simulation, (estimation of current deterioration) and a prediction model are needed. From this point on, the model can run with a regular input such as a step input. This regular input must be a representation of a feature extracted from the data. For example, the amplitude of the step can be the average of the past data, or the minimum value, or the maximum value, or all three values (see the example in [24]). It is also assumed that, in the prediction of the trajectory of , the operation conditions remain unvarying along the given horizon from to .
At a given current time , the predicted , denoted by , is the predicted remaining period of time from , until a threshold time (the estimated threshold time), before the system can no longer perform its intended function. The time is estimated and is calculated as
Generally, the RUL is a random variable, that can be characterized, for example, by a probability distribution. Variables such as the type of cane fiber, the climate, the type of cane crop terrain, and the humidity of the cane, among others, could influence wear. Consequently, there are several sources of uncertainty in the estimation of deterioration and RUL. However, in this paper, firstly RUL is studied from the point of view of control systems theory, therefore a deterministic analysis of RUL is carried out first. Subsequently, stochastic analysis is performed.
3. Problem Statement for the Case Study: Industrial Shredders
The performance of industrial shredders is significantly related with the Specific Energy Consumption (SEC), namely, linked to the hammer’s health state. Several critical issues highlight the need for improved management and monitoring of SEC:
- Monitoring complexity. The deterioration of the hammers is not directly measurable; this must be estimated from reliable indicators of the state of health.
- High impact of SEC usage on maintenance decisions. Increasing energy consumption directly affects when and how maintenance is performed.
- High-cost spare parts. Hammers are the most critical components and expensive to replace because of the materials, tools, and scale.
- Limited availability. Spare set of hammers are commonly rarely available, leading to potential downtime.
- Deficient use of SEC data. Despite the abundance of SEC data, it is often not utilized effectively for maintenance and operational decisions.
- Low number of complete information frames. There is a scarcity of comprehensive data sets that link SEC information directly to maintenance activities.
- Not enough plots to perform statistical analysis. The limited data available hampers the ability to perform robust statistical analyzes.
Given these challenges, several strategies are proposed in the paper:
- Exploiting incomplete data. It is crucial to utilize available data as much as possible, even if the data sets are incomplete.
- Real-time comparison of new production information. Systematically comparing new SEC data in real time can help identify high production and low energy consumption zones.
- Conservative real testing. Real testing would require modifications to current production, which could surely be significant. Therefore, scenarios should be conservative to minimize costs.
- Probabilistic certification. The process can be probabilistically certified to ensure reliability.
- Progressive data integration. New real information can be progressively added to the built database to improve it.
4. Data-Driven Deterioration Model
This section describes the data sources for the case study and the resulting deterioration model. In this context, real production data of sugarcane flow , and the power required in the cane preparation process , are analyzed as input and output signals respectively. Figure 1 shows the real pre-processed data and (blue lines) for a lifetime of hammers. A moving average of 6 h was used for processing all raw data sets (green lines). According to the assumptions to define equation 1, power data corresponding to moments where there is no cane flow are removed. The lifetime is defined as the period between the change of shredder hammers. Note that in this case, the life cycle of the hammers is approximately 580 h, which is equivalent to approximately 24 duty days.
Figure 1 shows the sugarcane flow and the demanded power for the period LT1 (Acronym LT is used for Lifetime). As seen in the Figure 1, the sugarcane flow is a random variable bounded between 200t/h and 350t/h approximately.
is measured directly using the instrumentation on the shredder motor. The energy consumed by the process is calculated every 1 h. Therefore, 1 h is taken as the step time for data analysis. The cumulative energy consumed by the preparation process stage for the lifetime is approximately 805.51 MWh.
4.1. Validation of the deterioration model
In [15] an Autoregressive model with Exogenous inputs (ARX) is presented and validated from real data for the shredder of the case study. The use of an ARX (AutoRegressive with Exogenous Input) model to represent the relationship between energy used and the amount of raw material offers several advantages, such as: a) simplicity and ease of implementation, because ARX models are linear models that have a relatively simple structure; b) they are built directly from historical input-output data of the process (raw material flow and required power), which means that they do not require in-depth knowledge of the underlying physics of the process, which is very important; c) the "autoregressive" nature of the ARX model allows it to capture the dependence of the current energy used on the energy used at previous times, which is crucial in industrial processes where energy consumption often has an inertia or "memory" effect; d) the inclusion of the exogenous input (amount of raw material being processed) allows modeling how this external variable influences energy consumption; e) consideration of delays; and f) practicality for inclusion in control systems,
To find the model, the first half of the real data frame was used, which corresponds to the lifetime of the hammers in the period LT1. The resultant model equations for and are, respectively,
According to [15] from the results of the model validation with the second half of the data batch LT1, a NRMSE of 84.41% was found, which is considered enough fit.
Figure 2 shows the input and output data for the later period LT2. Note that this particular dataset is shorter; however the overall input and output value characteristics are similar.
Figure 3 shows the fitting results for the full period LT2 with the model obtained with the period LT1. The model fits the real data with a NRMSE of 91.91%. This shows that the model is a sufficiently adequate fit to other data sets. The model was also tested with additional data sets to validate it.
4.2. Specific Energy Consumption (SEC)
Consider the Specific Energy Consumption (SEC) measurable by means of the index , the ratio of power per raw material flow (here sugarcane flow) , which is equivalent to the energy consumed to prepare the total mass of raw material (here sugarcane) , which passes through the shredder per hour. Then, the index can be defined as
where the units of are [kWh / t], the units of are [kWh].
Here, it is assumed that is always available and that there are no delays in the weighing process. In this process, it is assumed that the sugarcane is weighted before entering the conveyor as in real life. For this life cycle, the cumulative sum of the mass of cane processed is 175.210 t (tonnes or metric tonnes).
Figure 4 shows the evolution of throughout the lifetime of the hammers. Variant values can be observed, since the calculation is carried out per hour, and a clear increasing trend. This means that as resource usage time progresses (and its lifetime decreases), the machine consumes more energy for similar quantities of raw material being processed. The figure also shows the cumulative sum as a reference. This cumulative value is, of course, monotonically increasing and can be useful to observe the growth slope and reference numerical values to establish a safety threshold. Alternatively, the cumulative energy used up to the current time can be used as a reference.
Furthermore, Figure 4 shows the calculation (cian curve) of the accumulated demanded power, divided by the accumulated processed material up to current time, as . This latter figure is useful because it is in the same numerical range of values, which facilitates its interpretation, and its final value tends to the total value of power demanded divided by the total value of processed material. Finally, its appearance is directly smoothed.
Until now, it has been confirmed that the ARX model of the power demand was validated with an NRMSE of 91.91% for different real data sets of processed material (sugarcane in the case study). This model is useful because it allows the power demand for any given input of processed material to be obtained quickly and directly. In addition, it was verified that the or index of SEC related to spare parts (hammers in the case study) is a consistent and useful indicator of their deterioration. If increases, it might indicate that the machine needs maintenance or that it is operating under less-than-ideal conditions. In addition to viewing the current absolute value, it is also possible to observe the dynamic aspects linked to the performance behavior.
5. Hybrid Architecture for RUL Estimation
The increasing data evolution of SEC of the machine (the shredder, in the case study) is related to index (in the case study, demanded power vs. processed material). Then, the aging process seems to be systematically similar for several datasets. In this type of phenomena, for which a consistent pattern has been identified, in spite of possible deficiencies in the data recording, there are many data plots that contain useful information, even if only partial. It is also emphasized that each data frame for industrial power systems is notoriously valuable, given the costs involved in obtaining it. Thus, it is desirable to exploit the information in the data sets to the maximum, even if the batches are possibly incomplete.
The previously developed model is useful for replicating the current behavior of the and could be improved to increase its accuracy against real data. However, in this work, we prefer to evaluate how real data (changing and diverse) affect the system and the model rather than making it more accurate. This architecture design criterion is preferred because the variability in real data could provide process characteristics that can be progressively included in the collected information. Similarly, conclusions are more reliable with different sets of real data. Then, reliable current data from a few cycles can serve as a basis for creating various scenarios.
However, real tests would not be feasible because they involve modifying current production. In the latter case, the scenarios would have to be very conservative or would be too costly.
In this paper, an architecture is proposed to dynamically estimate the RUL from both real and current data, and from synthetic data. The architecture design was made from the two described criteria: c1) Maximum use of complete or partial use of existing information, and c2) Continuous evaluation of the effect of current production data on the system and on the model. Figure 5 shows the proposed architecture.
The architecture includes a constant reading of the current information from the raw material flow , (sugarcane flow for the case study). Under the assumption that it is possible to measure the electrical power P demanded by the machine, it is also possible to calculate progressively. The information of , P, and is stored in a database. All individual databases are represented by a rectangle.
In parallel, can be estimated with the model from the information of P, and also . Of course, the model is used to predict the behavior in an agile way from the first instants of time of real information. This information is also stored. The model data are useful for building a synthetic database; this is symbolized by the Database Builder block.
The Database Builder builds the synthetic database with which the current actual information is compared in the Comparator block. By means of this comparison it can be determined with which of the existing trajectories in the database the current trajectory is temporally most similar. As a result, it is assumed that the RUL of the components will temporarily be the one corresponding to this stored trajectory. If over time the trajectory becomes more similar to another stored trajectory, the prognosis is updated. In addition, the comparator is responsible for extracting particular features from the current frame, from which it obtains criteria that are taken to the Feature Extraction block.
Feature extraction can be structured or unstructured, and can include features such as progressive slope, amplitude, frequency, among others. Feature extraction helps to improve the construction of the comparison database. This database will then initially have a mostly synthetic weight, and over time will be enriched with information from the real system. This means that the database becomes more reliable over time.
The Database Builder block internally provides information on similarities and anomalies, and therefore, it is this information from which derived information can be extracted such as safe working zones.
This new database can be used recurrently to compare current production data and estimate the RUL and particular characteristics of the deterioration process. Then, the synthetic data can be progressively compared with the new measured data to build a more reliable database. Thus, model performance could be probabilistically certified from a database that progressively includes current and possibly better obtained data.
Finally, the RUL predictor block, uses the information of the comparator for the prognosis of RUL. In this case, RUL can be predicted in a deterministic way or including some criteria on confidence bounds.
Generally speaking, note that the global architecture proposed in this Section 5 is therefore hybrid in two senses: first, in terms of diversity of techniques, since various data analysis techniques can be used in feature extraction and in comparing the historical data set with the current one, performing a continuous evaluation of current production on the system and on the model. Second, the architecture is also hybrid in the topological sense, as it involves the parallel use of input information (with the model and with the system), and a feature extraction feedback loop. This latter loop is intended to use all existing historical information to improve the prognosis. For instance, the architecture is useful for involving similarity models in the comparison for RUL prognosis, as well as a physics-based deterioration model for generating synthetic data.
6. Architecture Application for RUL Estimation
This section explains how the architecture works by means of a numerical example. As a model we choose the one described in Section 4; as a comparator technique we use the Cumulative Euclidean Distance; as an example of feature extraction we take the slope of on a moving horizon; and in the construction of the database: synthetic data is created by means of normal distribution around a real dataset, all new information is assumed to be better than the previous one and is added to the synthetic data, and the previously extracted slopes are stored.
6.1. Synthetic Database Generation
As suggested in [25,26], the number of simulations which guarantee a confidence parameter = 0.001 (i.e., 99.9% of the reliability of the estimation procedure) can be computed as
where , in this case chosen equal to 95 %, represents the complement percentage of time series population that fails to meet the condition (e.g., 5% of the time series population can not be considered as enough-real).
Figure 6 shows the synthetic data created for the incoming raw material flow . In [15] a normal distribution of was found. The gray lines are the synthetic data and the blue line is a real dataset of . A standard deviation of 23.7 was used.
Figure 7 shows the resultant Power for synthetic data. The gray lines are the calculated synthetic data , and the blue line is the corresponding to the real dataset.
Figure 8 is the resultant dataset. Figure shows a typical increasing evolution of for the real trajectory (blue line) and for the synthetic ones (gray lines), from around 4 kWh/t to around 5.5 kWh/t.
Generally, data vary considerably, and the same is expected for . An smoothing process is recommended for , mainly because the slope estimation of the dataset is defined. Figure 9 shows the smoothed trajectories of using a moving average of 48h, which is considered as an appropriate window for the case study.
Figure 10 shows the distributions of the synthetic data. The maxima, minima, median, quartile 1 and quartile 3 trajectories of the full dataset are shown. This information could be useful for the data analysis of the database.
Figure 11, shows the resultant data. Synthetic data show more dispersion at the very beginning of the trajectories. The dispersion decreases with time. The trajectories merge to a 4.6 kWh/t at the end of life. As expected, this is considered a useful progressive deterioration metric.
Figure 12 shows the histogram of the corresponding RUL values for the synthetic data set. For the numerical example, RUL is estimated from the current state up to a threshold of 700 MW. A mean value of 541 h was found.
6.2. Comparator
Progressive comparison of a new behavioral trajectory to a set of time series can be done by using the Cumulative Euclidean Distance between a given current new data and a continuously updated data set of .
Figure 13 shows the dynamic comparison between a new real trajectory of of a period labeled as LT3 (blue line) until 50h, with respect to the database constructed previously. For the first 50 h, the most similar trajectory (red dotted line) is chosen from the database. At this point, it can be assumed that the useful lifetime of the current trajectory will be the one of the most similar series until a given threshold or condition defined by operator. Then RUL can be calculated with Equation 4.
Figure 14, in the same way that for Figure 13, shows the comparison until 300 h. Here, a new most-similar trajectory is found. This shows the updating capability of the architecture.
The database contains the growth trajectories of . The total useful life associated with each trajectory can be established after meeting a threshold condition; for example, in this paper, it is established as an example that the useful life is taken when 622MW is reached. This value can be established based on historical behavior. Alternatively, the indices described in the figure could be used. Then, the progressive comparison of current data with the database results in finding the most similar trajectory and its associated total useful lifetime value. This value is then considered as the spare parts RUL from the current moment.
Figure 15 shows that using continuous similarity analysis, the RUL prognosis successfully converges toward the mean value of the database after approximately 180 h, which represents around 31% of a typical total useful life. This shows that, from a certain early point onward, the comparator identifies that the trajectory most similar to the new one is the one considered the mean one in the previous database. This suggests that, from that point onward, the prognosis is more reliable with respect to recursive database.
Summarizing, the RUL prognostics is successfully carried out by means of a similarity analysis based on historical data and, at the same time, on the fulfillment of a state condition, in this case the defined energy threshold of the most similar trajectory.
6.3. Feature Extraction
As an example of feature extraction we use here the slope of on a moving horizon. Although other characteristics can be chosen (for instance, amplitude, frecuency, among others), for this example the progressive extraction of the slope is used since the positive variation of the slope is linked to increases in the deterioration processes.
Figure 16 shows the evolution of a real trajectory. The feature extraction block in this case is designed to extract the slope over a 1 h moving horizon. To do this, the trajectory is smoothed over a 48 h moving horizon. Each time a slope threshold is exceeded, the system generates an alert. The threshold chosen in this case corresponds to twice the total slope of evolution (4.3 x ), for a threshold equivalent to 8.5 x , which can also be derived from the analysis of previous real trajectories. The lower part of the figure shows the points at which the slope exceeds the threshold. The first alert occurs around 134 h.
Figure 17 shows the changepoints for which the slope has significant changes. The used metric is the RMSE. In this case 10 change points are chosen. Significant slope changes were detected at hours: 44, 109, 128, 181, 201, 250, 306, 350, 397, and 446. Furthermore, there are 67 data points where the slope exceeds the threshold.
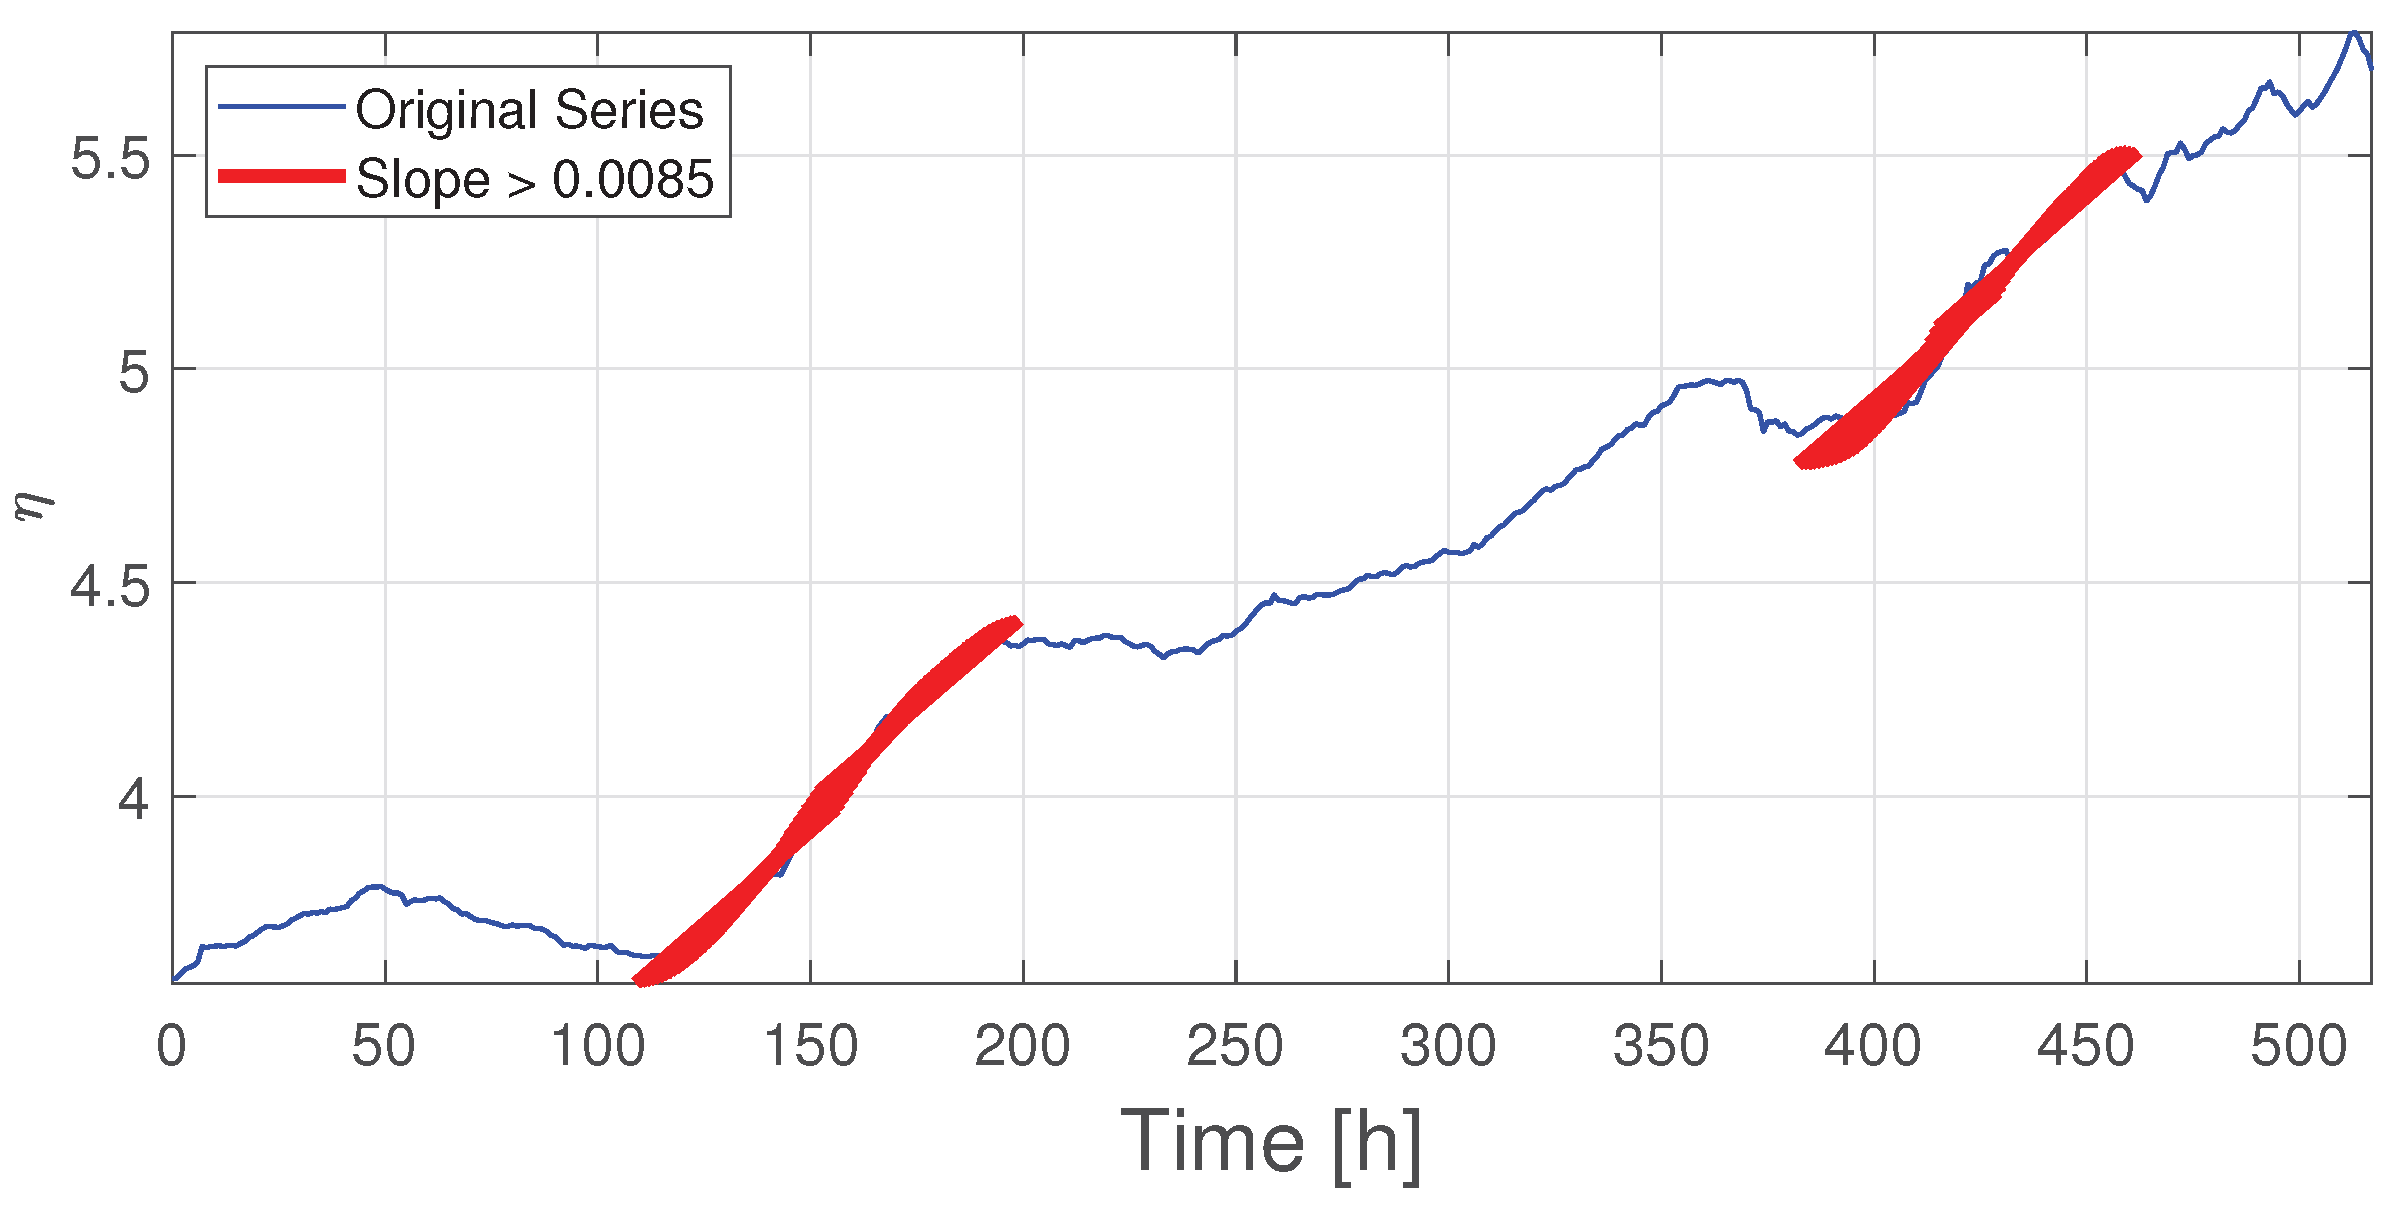
Figure 18 shows also the estimation of the slope for a moving window of 48 h. Each time a slope threshold is exceeded, the system generates an alert. The threshold is the same as for the slope of 1 h. In this case, significant positive changes in the slope are shown (red lines). Finally, all extracted slopes are stored in the database and could be used by the database generator. The feature extractor is exemplified by slope extraction. The results show 471 windows of 48 hours each were analyzed; 78 windows where the slope exceeded the threshold of 0.0036 were found.
Note that there are two areas where critical slope windows (red areas) are detected. Note in particular the final window between 400 h and 450 h, where the threshold is consistently exceeded. The latter process reflects a decreasing performance. This critical persistence at the end may alert the operator to the need for an earlier change of hammers, which is consistent with the previous prognosis that established a useful life of 450 h.
The numerical example shown in Section 6 shows that the similarity of new growth trajectories of progressively converge on the most representative one in the database, reflecting the consistency of the architecture, which enables a reliable prognosis. It can also be observed that the extraction of a single characteristic from the growth trajectory of allows to characterize objectively and dynamically the deterioration of the components or, equivalently, their increasing energy consumption. These two processes are carried out during the service of the machine in question.
7. Conclusions
The proposed hybrid architecture successfully predicts the Remaining Useful Life (RUL) of sugarcane shredder spare parts, the industrial electric machine used as a case study. The architecture enables the recursive use of SEC data (Specific Energy Consumption per quantity of sugarcane processed), even though these data may be incomplete or show differences in terms of their length between successive periods. The ARX deterioration model used, which is based on physics and its association with energy consumption, fits new time series with an NRMSE over 91%. This data correctly feeds a recursive database that contains both synthetic and real data. From the numerical example, the similarity analysis, which uses the Cumulative Euclidean Distance method, shows that the RUL prognosis successfully converges toward the mean value of the database after approximately 180 h, which represents around 31% of a typical total useful life and considered an early detection. The calculation of the RUL of the case study machine is probabilistically certified with a confidence margin of 95%. In addition, the slope extraction enables the characterization of work zones. Here, 78 windows, i.e. 10.8 % of the total windows, were found with slopes that exceeded the threshold of 8.5 x . Work zones where analysis windows with high slopes persist, i.e. more power used to process the material flow, suggest a detrimental effect on spare parts performance. The model-based feature analysis shows lower performance, namely at the end of the useful life, with values close to the prognosis of the similarity analysis. The architecture presented is flexible, i.e. can be configured for other types of model than the ones used in this paper. In general, results show that a hybrid analysis can be a consistent basis for early RUL prognostics, and in turn, a help for operator decision-making on the replacement of spare parts of the industrial machine.
Author Contributions
Conceptualization, D.R.-O. and E.R-G.; methodology, D.R.-O. and E.R-G.; software, D.R.-O.; validation, D.R.-O.; formal analysis, D.R.-O., E.R-G. and J.R.-G.; investigation, D.R.-O., J.R.-G. and E.R-G.; resources, J.R.-G. and E.R-G.; data curation, D.R.-O.; writing—original draft preparation, D.R.-O., J.R.-G. and E.R-G.; writing—review and editing, D.R.-O., J.R.-G. and E.R-G.; visualization, D.R.-O.; supervision, J.R.-G.; project administration, J.R.-G.; funding acquisition, J.R.-G.. All authors have read and agreed to the published version of the manuscript.
Funding
This research was supported by Electrical Machines and Drives (EM&D) research group from Universidad Nacional de Colombia,
Data Availability Statement
Data supporting the conclusions of this article may be made available by the authors upon request to them and with permission from Grupo Agroindustrial Riopaila Castilla, Colombia (GARC). Other aspects concerning the collection of another data and more specific characteristics, as well as complementary data could be requested to GARC, being at its discretion the provision of the same, as it is a private company.
Acknowledgments
The authors would like to thank Grupo Agroindustrial Riopaila Castilla, Colombia (GARC), for their support in providing some data to validate the model.
Conflicts of Interest
The authors declare no conflicts of interest.
Abbreviations
The following abbreviations are used in this manuscript:

Table 1.
Nomenclature: used acronyms, symbols for variables, parameters, units, and their meaning.
| Symbol | Units | Physical meaning |
|---|---|---|
| A | – | Autoregressive polynomial |
| B | – | Input polynomial |
| D | – | Deterioration |
| kW* | Power of motor, Output of system | |
| t** | Mass of cane | |
| t | h*** | Time |
| t/h | sugarcane flow, Input of system | |
| kWh | Energy | |
| kWh/t | Energy consumption per tonne of cane | |
| ^ | – | Superscript for estimations |
| ˙ | – | Superscript for derivative |
| ref | – | Superscript for reference |
| NRMSE | – | Root Mean Squared Error |
| PHM | – | Prognostics and Health Management |
| RUL | h | Remaining Useful Life |
Note: * kilowatt, ** tonne (metric ton), *** hour.
References
- Zio, E. Prognostics and Health Management (PHM): Where are we and where do we (need to) go in theory and practice. Reliability Engineering & System Safety 2022, 218, 108119. [Google Scholar] [CrossRef]
- Sikorska, J.Z.; Hodkiewicz, M.; Ma, L. Prognostic modelling options for remaining useful life estimation by industry. Mechanical systems and signal processing 2011, 25, 1803–1836. [Google Scholar] [CrossRef]
- Nicolai, R.P.; Dekker, R.; Van Noortwijk, J.M. A comparison of models for measurable deterioration: An application to coatings on steel structures. Reliability Engineering & System Safety 2007, 92, 1635–1650. [Google Scholar] [CrossRef]
- Heng, A.; Zhang, S.; Tan, A.C.; Mathew, J. Rotating machinery prognostics: State of the art, challenges and opportunities. Mechanical systems and signal processing 2009, 23, 724–739. [Google Scholar] [CrossRef]
- Sayyad, S.; Kumar, S.; Bongale, A.; Kamat, P.; Patil, S.; Kotecha, K. Data-driven remaining useful life estimation for milling process: sensors, algorithms, datasets, and future directions. IEEE access 2021, 9, 110255–110286. [Google Scholar] [CrossRef]
- Javed, K.; Gouriveau, R.; Li, X.; Zerhouni, N. Tool wear monitoring and prognostics challenges: a comparison of connectionist methods toward an adaptive ensemble model. Journal of Intelligent Manufacturing 2018, 29, 1873–1890. [Google Scholar] [CrossRef]
- Si, X.S.; Wang, W.; Hu, C.H.; Zhou, D.H. Remaining useful life estimation–A review on the statistical data driven approaches. European Journal of Operational Research 2011, 213, 1–14. [Google Scholar] [CrossRef]
- Martinez, J.J.; Spinola Félix, M.; Kulkarni, C.; Orchard, M.; Bérenguer, C. A novel dynamical model for diagnosis, prognosis and health-aware control of Lithium-ion batteries. IFAC-PapersOnLine 2024, 58, 658–663. [Google Scholar] [CrossRef]
- Li, J.; Huang, F.; Qin, H.; Pan, J. Research on remaining useful life prediction of bearings based on MBCNN-BiLSTM. Applied Sciences 2023, 13, 7706. [Google Scholar] [CrossRef]
- Berghout, T.; Benbouzid, M. A systematic guide for predicting remaining useful life with machine learning. Electronics 2022, 11, 1125. [Google Scholar] [CrossRef]
- Remadna, I.; Terrissa, S.; Sayah, M.; Ayad, S.; Zerhouni, N. Boosting RUL prediction using a hybrid deep CNN-BLSTM architecture. Automatic Control and Computer Sciences 2022, 56, 300–310. [Google Scholar] [CrossRef]
- Li, Z.; Wu, D.; Hu, C.; Terpenny, J. An ensemble learning-based prognostic approach with degradation-dependent weights for remaining useful life prediction. Reliability Engineering & System Safety 2019, 184, 110–122. [Google Scholar] [CrossRef]
- Xie, Z.; Du, S.; Lv, J.; Deng, Y.; Jia, S. A hybrid prognostics deep learning model for remaining useful life prediction. Electronics 2020, 10, 39. [Google Scholar] [CrossRef]
- Li, N.; Gebraeel, N.; Lei, Y.; Fang, X.; Cai, X.; Yan, T. Remaining useful life prediction based on a multi-sensor data fusion model. Reliability Engineering & System Safety 2021, 208, 107249. [Google Scholar] [CrossRef]
- Rodriguez-Obando, D.; Rosero-García, J.; Rosero, E. Dynamic Data-Driven Deterioration Model for Sugarcane Shredder Hammers Oriented to Lifetime Extension. Mathematics 2024, 12, 3507. [Google Scholar] [CrossRef]
- Rakowsky, U.K. Modelling Reliability-Adaptive multi-system operation. International Journal of Automation and Computing 2006, 3, 192–198. [Google Scholar] [CrossRef]
- Meyer, T.; Sextro, W. Closed-loop Control System for the Reliability of Intelligent Mechatronic Systems. In Proceedings of the European Conference of the Prognostics and Health Management Society - 2014 - Paderborn, Germany; ASME., Ed., number 265 in 2003-TRIB-265; 2014; pp. 53–57. [Google Scholar] [CrossRef]
- Langeron, Y.; Grall, A.; Barros, A. Joint maintenance and controller reconfiguration policy for a gradually deteriorating control system. Proceedings of the Institution of Mechanical Engineers, Part O: Journal of Risk and Reliability 2017, 231, 339–349. [Google Scholar] [CrossRef]
- Grosso, J.M.; Ocampo-Martínez, C.; Puig, V. A service reliability model predictive control with dynamic safety stocks and actuators health monitoring for drinking water networks. In Proceedings of the Decision and Control (CDC), 2012, 2012 IEEE 51st Annual Conference on. IEEE; pp. 4568–4573. [Google Scholar] [CrossRef]
- Pereira, E.B.; Galvão, R.K.H.; Yoneyama, T. Model predictive control using prognosis and health monitoring of actuators. In Proceedings of the Industrial Electronics (ISIE), 2010, 2010 IEEE International Symposium on. IEEE; pp. 237–243. [Google Scholar] [CrossRef]
- Gong, Y.; Huynh, K.T.; Langeron, Y.; Grall, A. Degradation index construction and learning-based prognostics for stochastically deteriorating feedback control systems. Reliability Engineering & System Safety 2023, 238, 109460. [Google Scholar] [CrossRef]
- Bevan, A.; Molyneux-Berry, P.; Eickhoff, B.; Burstow, M. Development and validation of a wheel wear and rolling contact fatigue damage model. Wear 2013, 307, 100–111. [Google Scholar] [CrossRef]
- Cremona, M.A.; Liu, B.; Hu, Y.; Bruni, S.; Lewis, R. Predicting railway wheel wear under uncertainty of wear coefficient, using universal kriging. Reliability Engineering & System Safety 2016, 154, 49–59. [Google Scholar] [CrossRef]
- Rodriguez-Obando, D.J.; Martinez Molina, J.J.; Berenguer, C. Deterioration estimation for remaining useful lifetime prognosis in a friction drive system. IFAC-PapersOnLine 2017, 50, 12785–12790. [Google Scholar] [CrossRef]
- Alamir, M. On probabilistic certification of combined cancer therapies using strongly uncertain models. Journal of theoretical biology 2015, 384, 59–69. [Google Scholar] [CrossRef]
- Alamo, T.; Tempo, R.; Camacho, E.F. Randomized strategies for probabilistic solutions of uncertain feasibility and optimization problems. IEEE Transactions on Automatic Control 2009, 54, 2545–2559. [Google Scholar] [CrossRef]
Figure 1.
Pre-processed data of sugarcane flow (raw material) , and used power, P for the period LT1. Moving averages of 48h are used to smooth curves.
Figure 1.
Pre-processed data of sugarcane flow (raw material) , and used power, P for the period LT1. Moving averages of 48h are used to smooth curves.
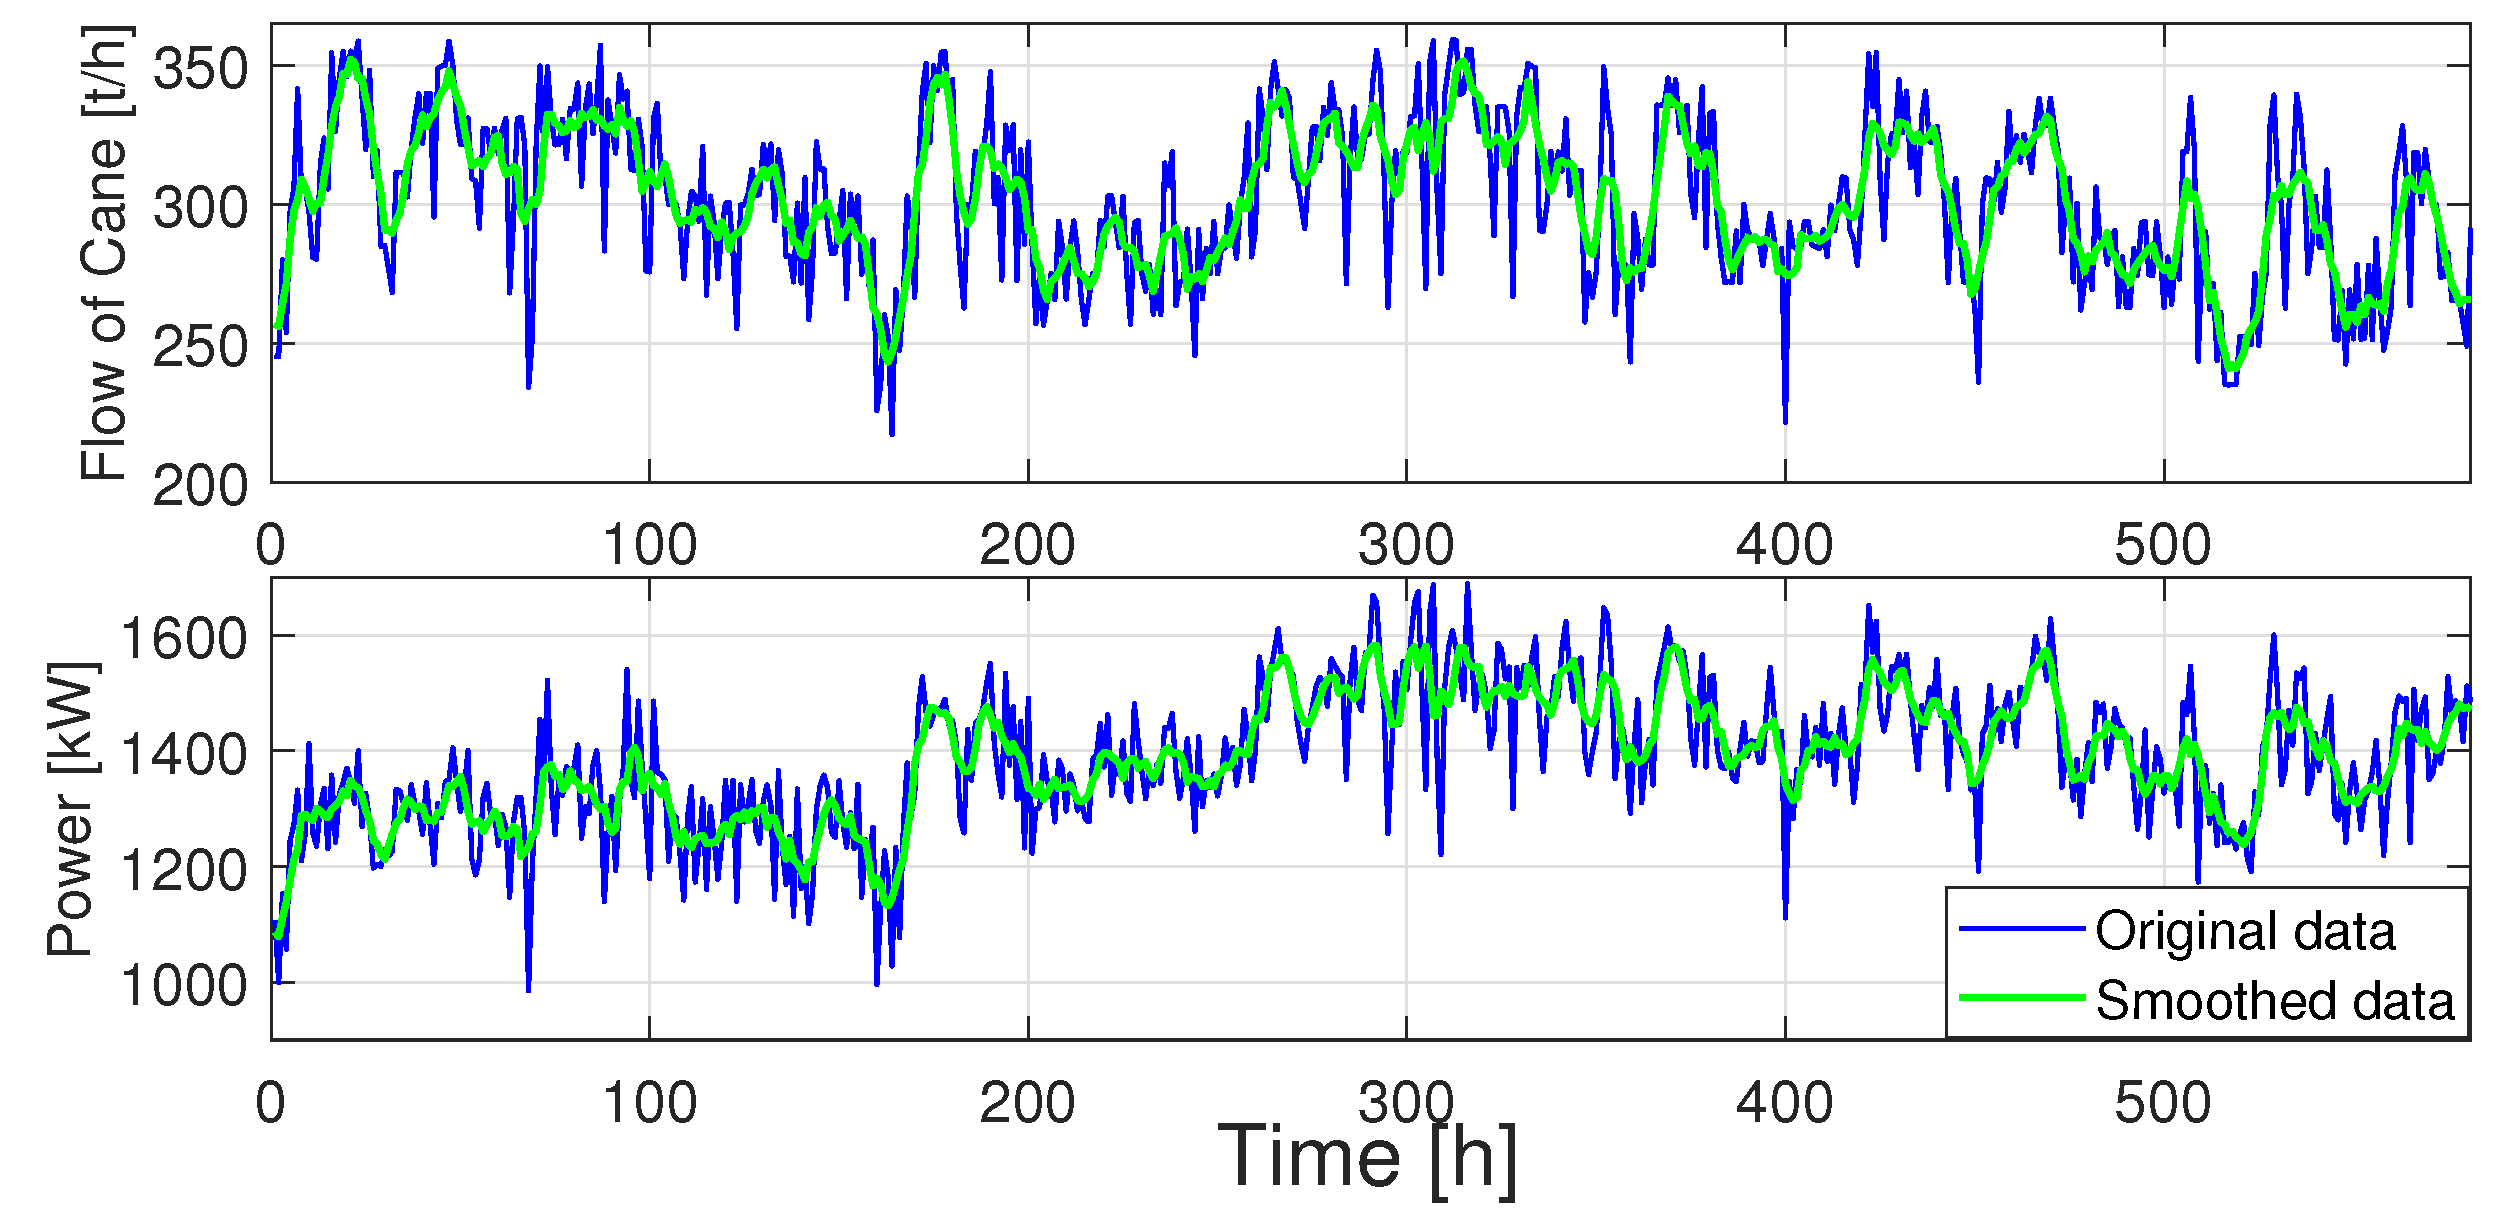
Figure 2.
Pre-processed data of Flow of cane and power for the period LT2. Moving averages of 48 h are used to model the process.
Figure 2.
Pre-processed data of Flow of cane and power for the period LT2. Moving averages of 48 h are used to model the process.
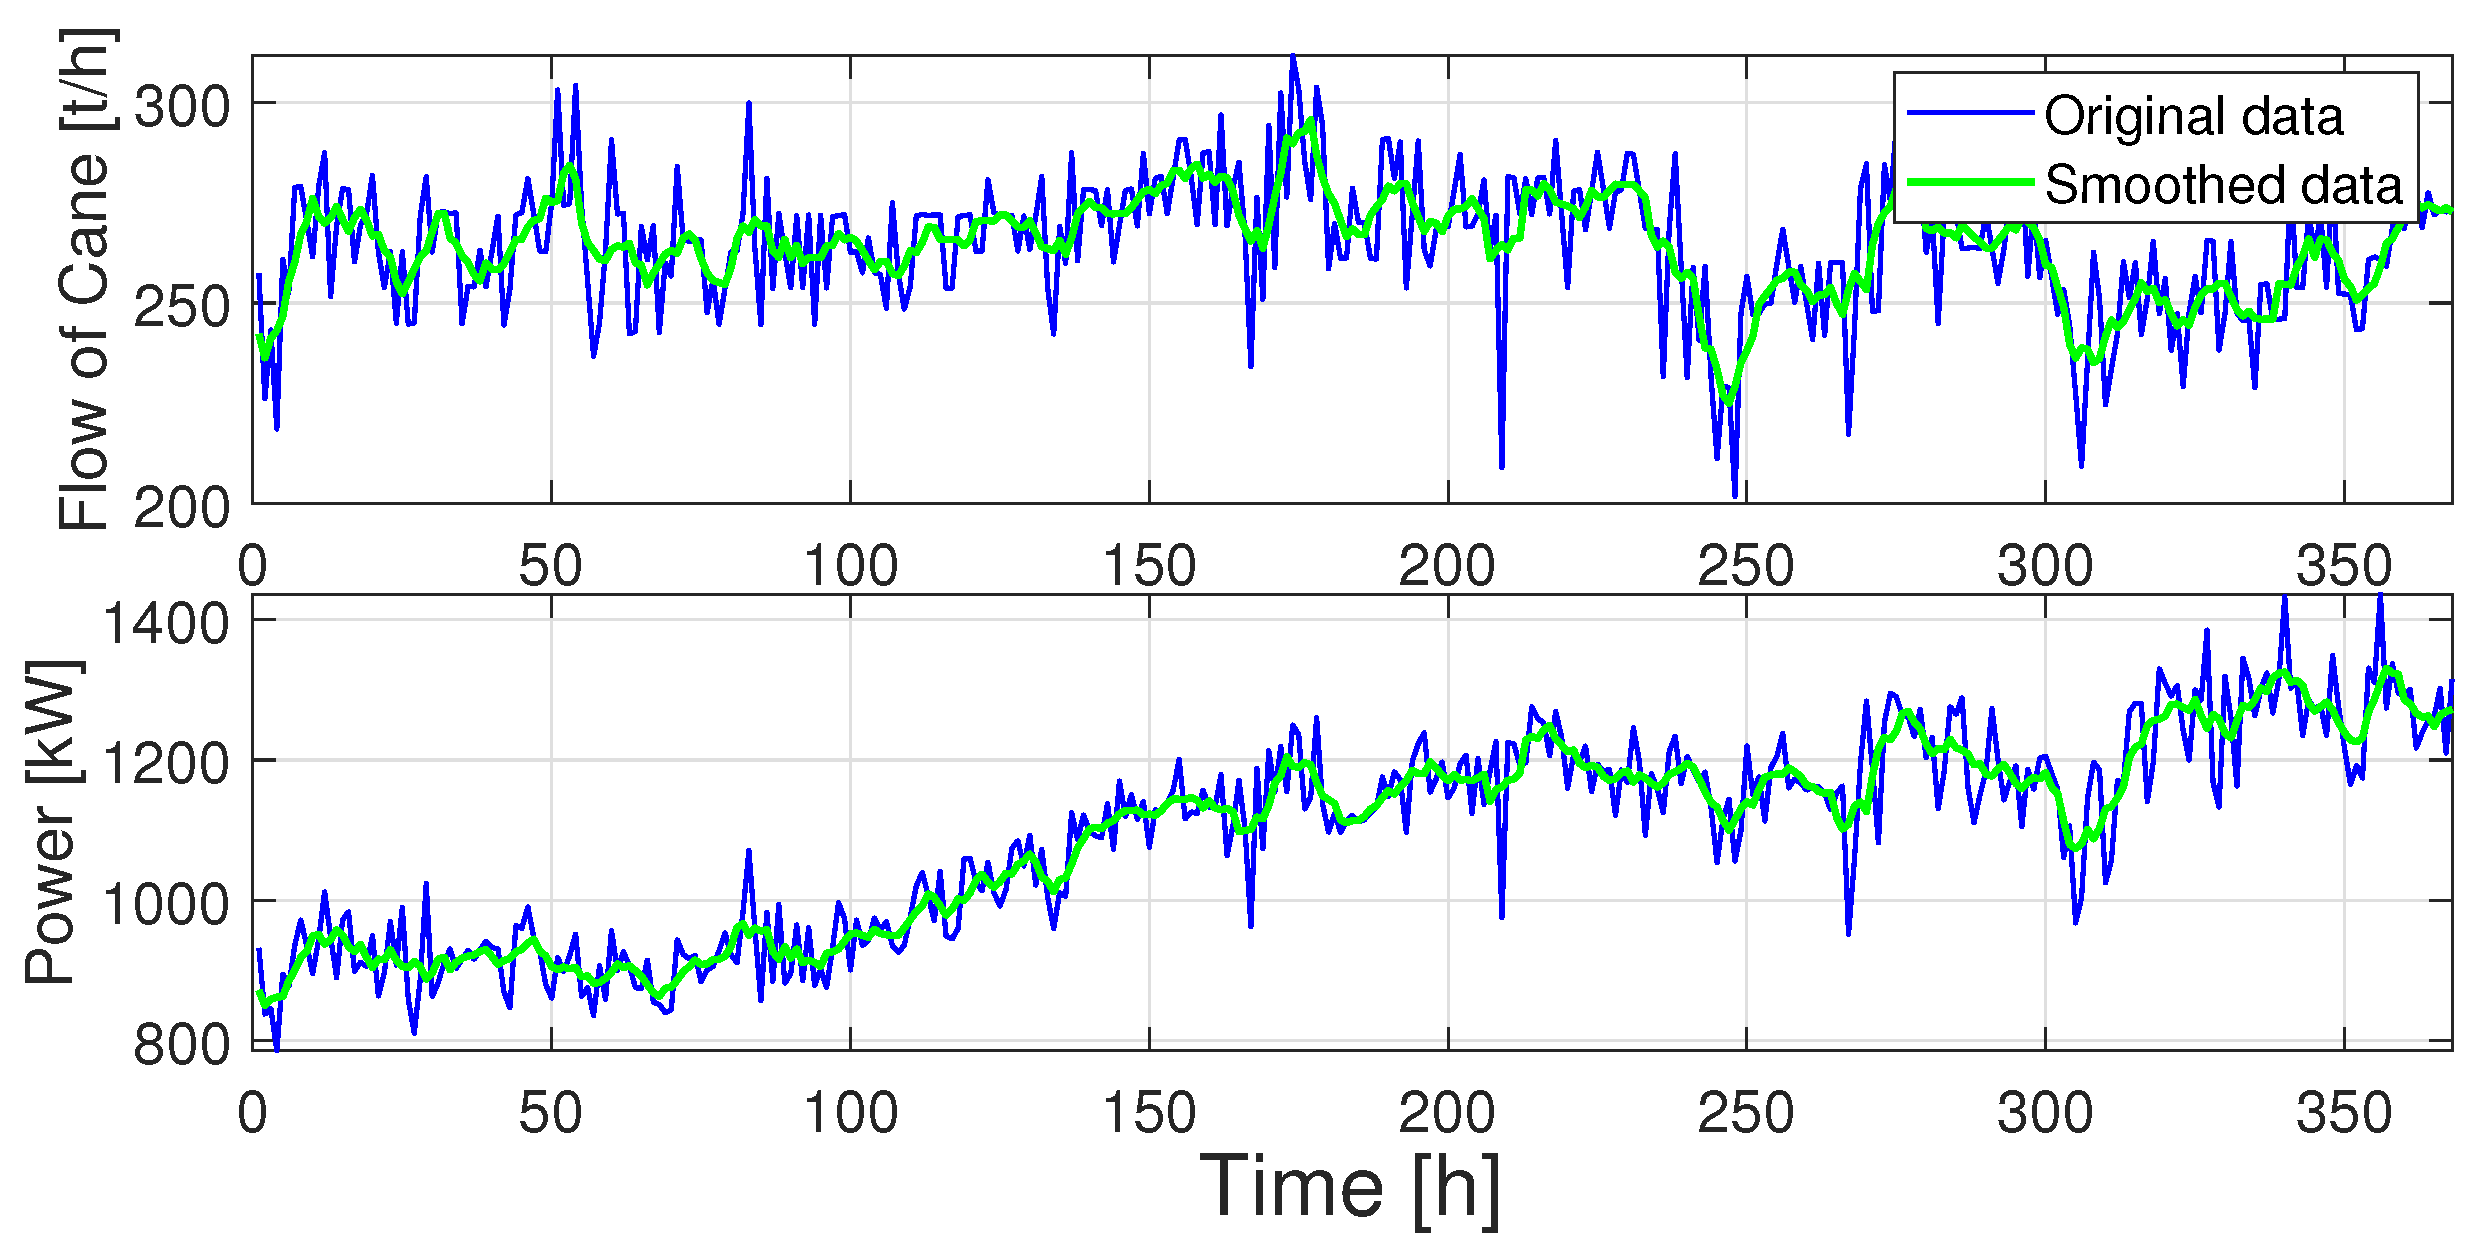
Figure 3.
Comparison between the model ARX response (1-step predicted) and the original data for LT2 period. The model follows the real data with a NRMSE of 91.91%.
Figure 3.
Comparison between the model ARX response (1-step predicted) and the original data for LT2 period. The model follows the real data with a NRMSE of 91.91%.
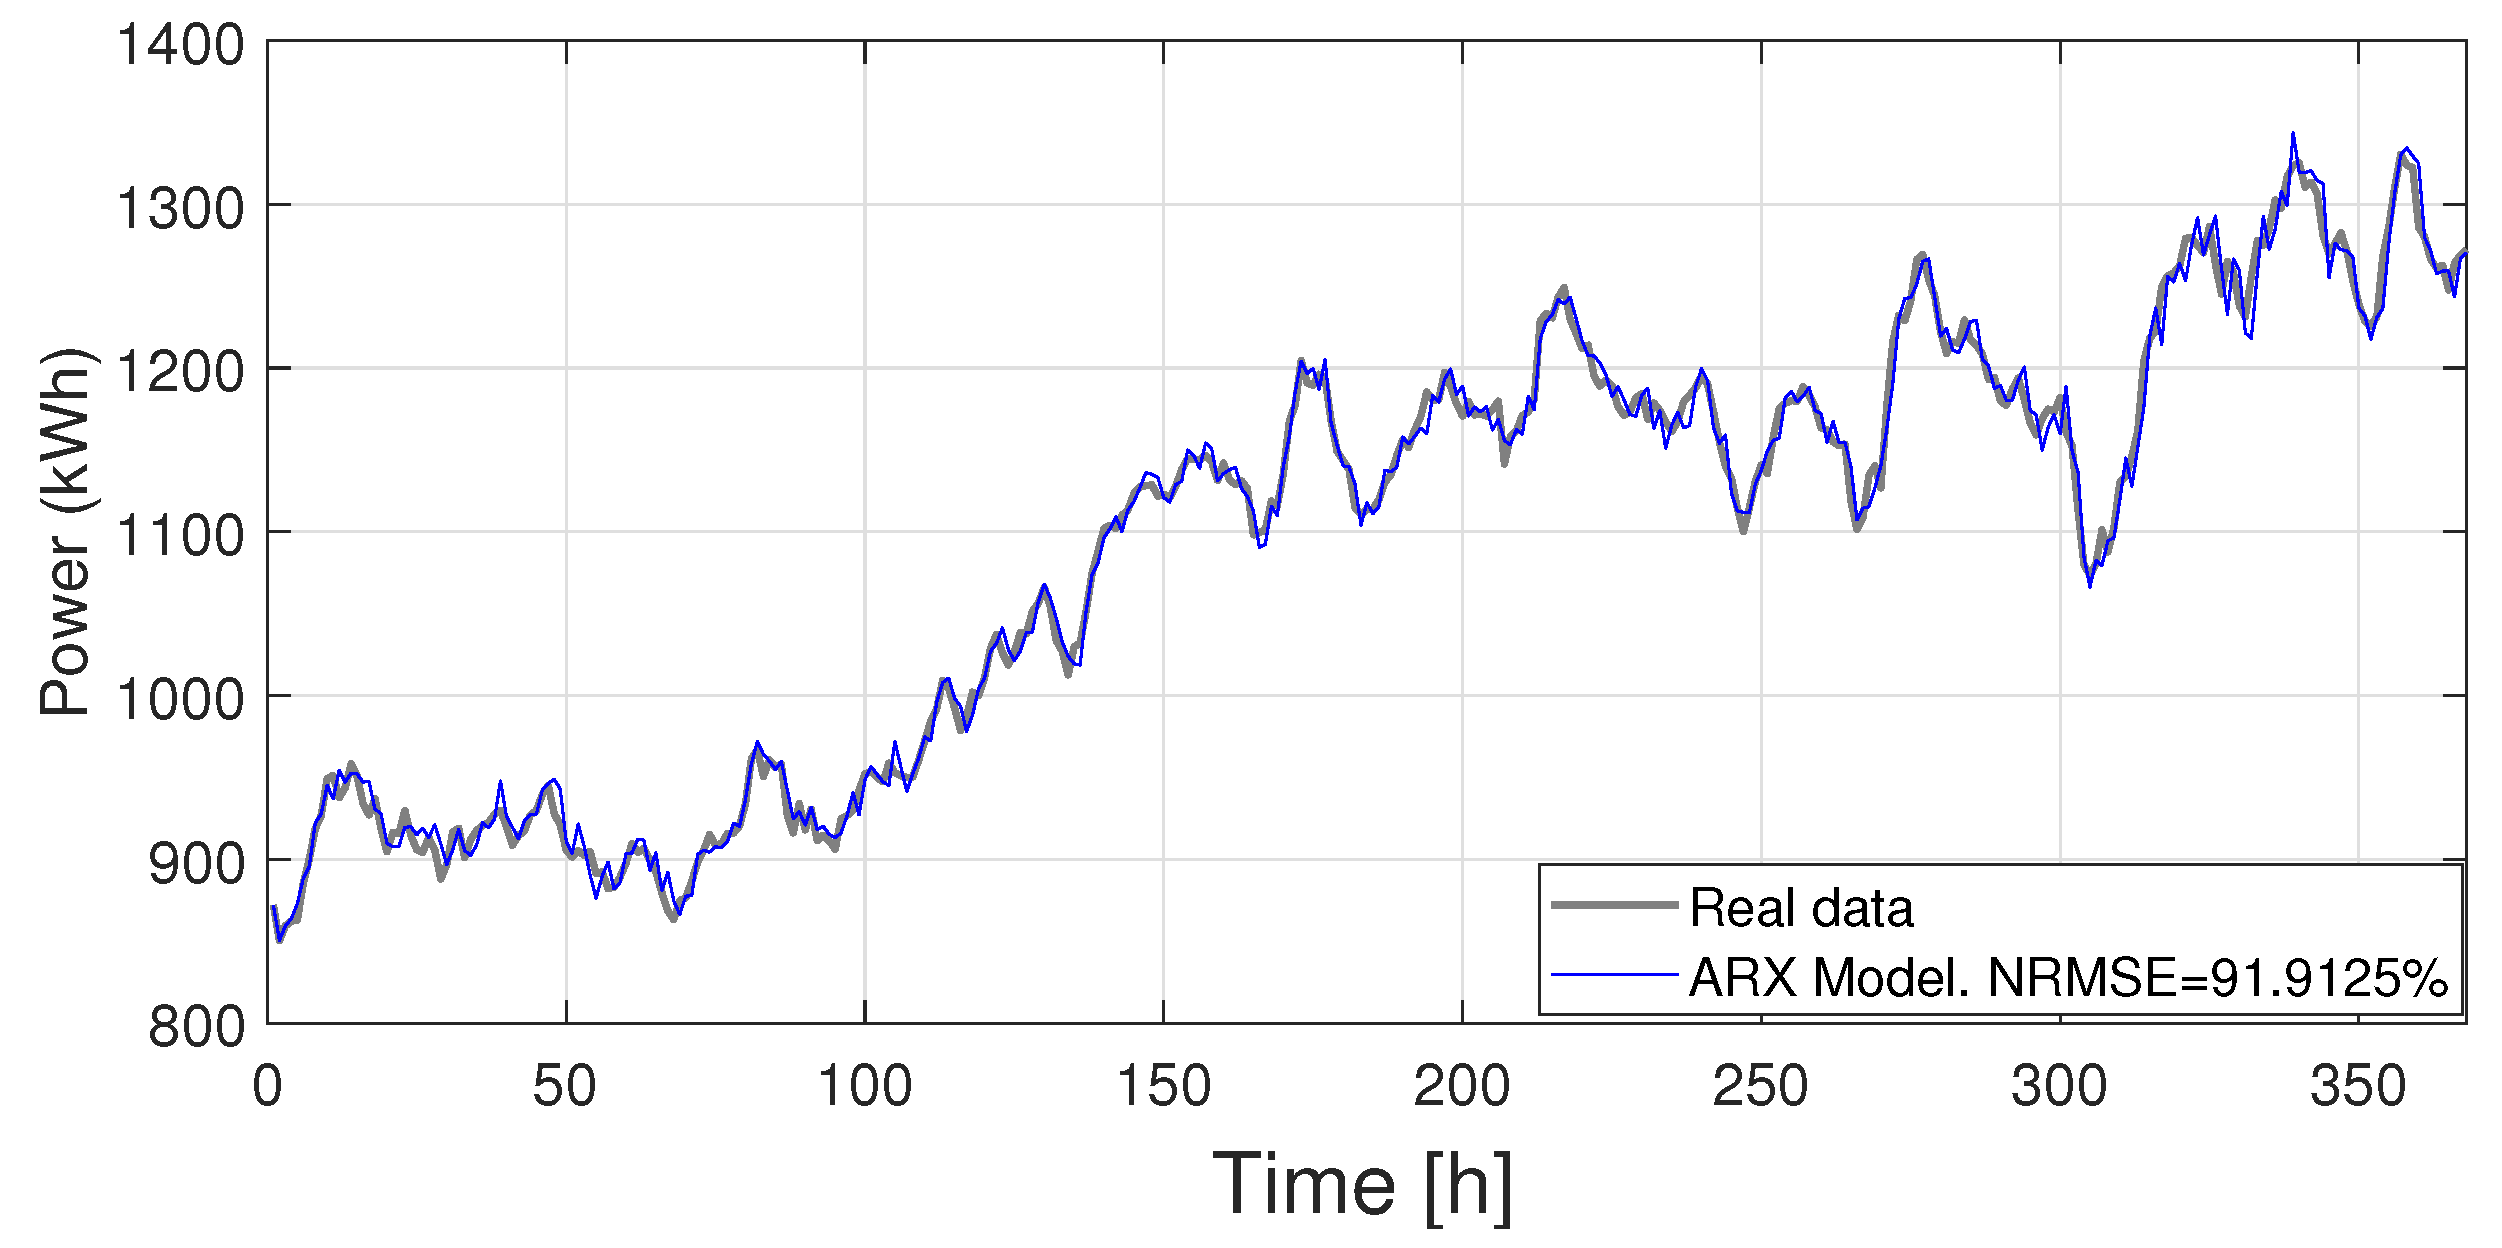
Figure 4.
Specific Energy Consumption index , smoothed , cumulative and .
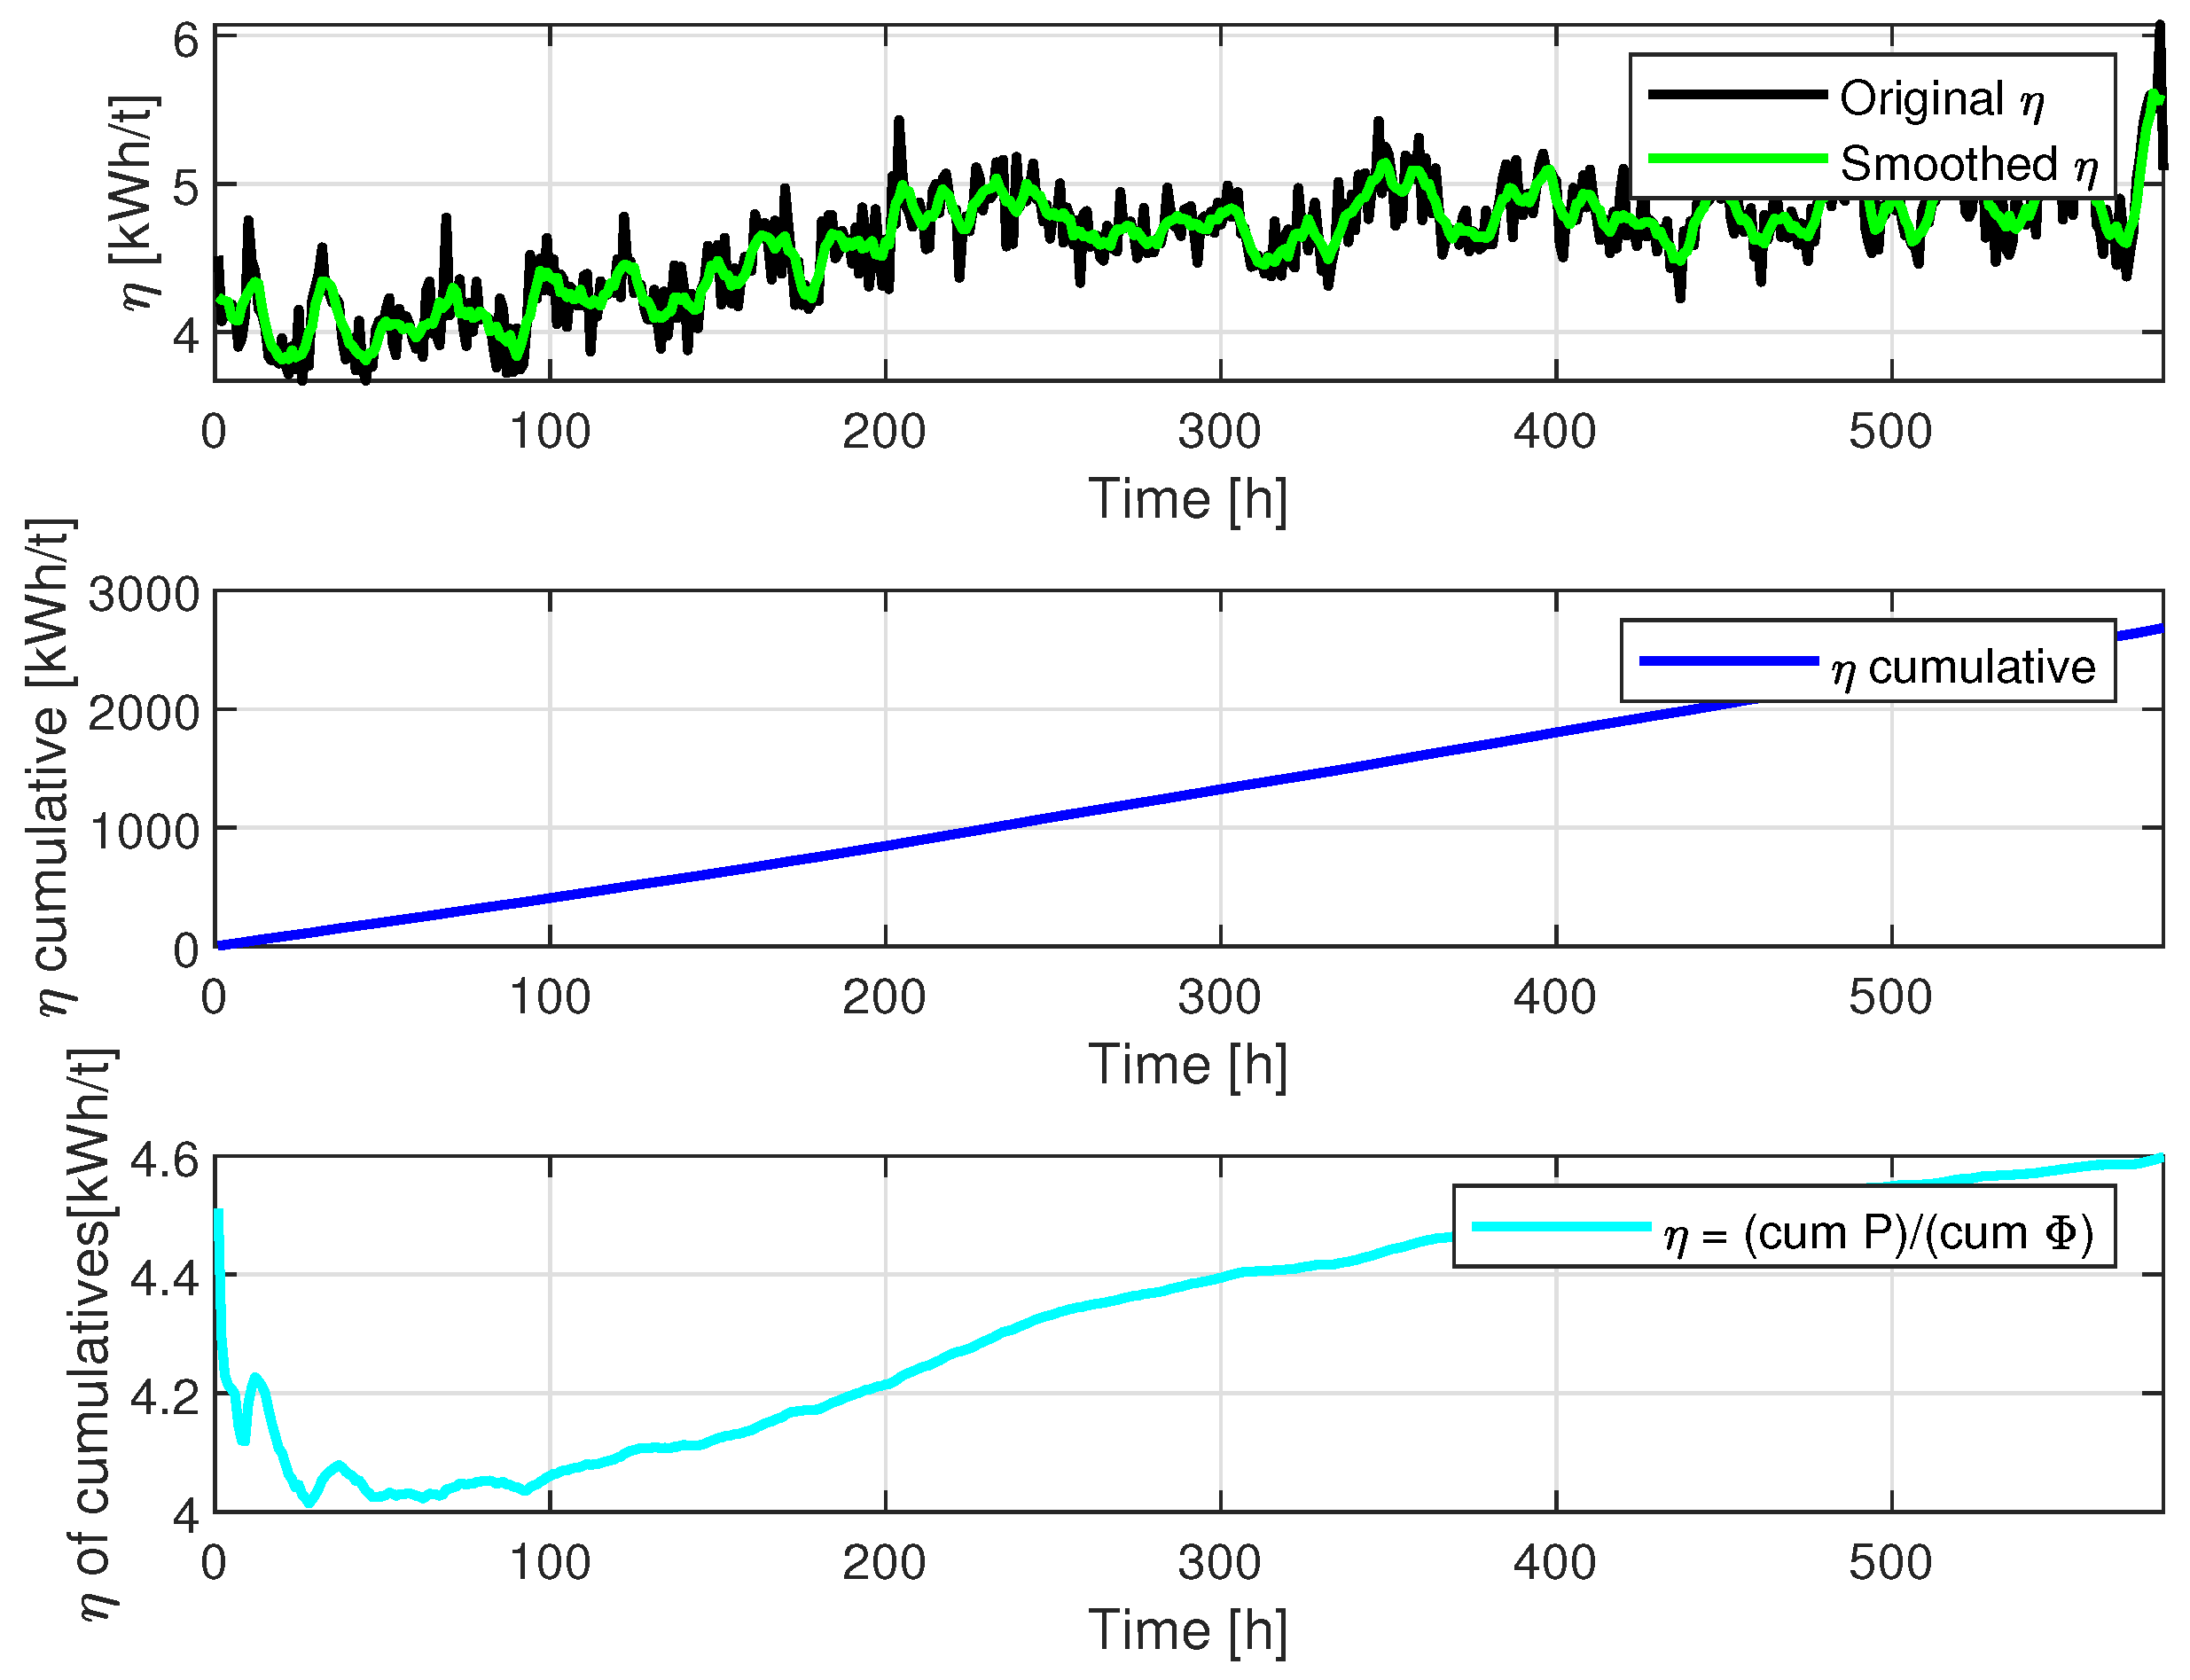
Figure 5.
Proposed architecture. A database is created from real data and the model. The current data is compared with the current database and improves the comparison database. Feature extraction is performed to improve the database. Finally, the RUL is obtained by means of a similarity comparison.

Figure 6.
Synthetic data of . Synthetic data (gray lines) and real dataset (blue line).
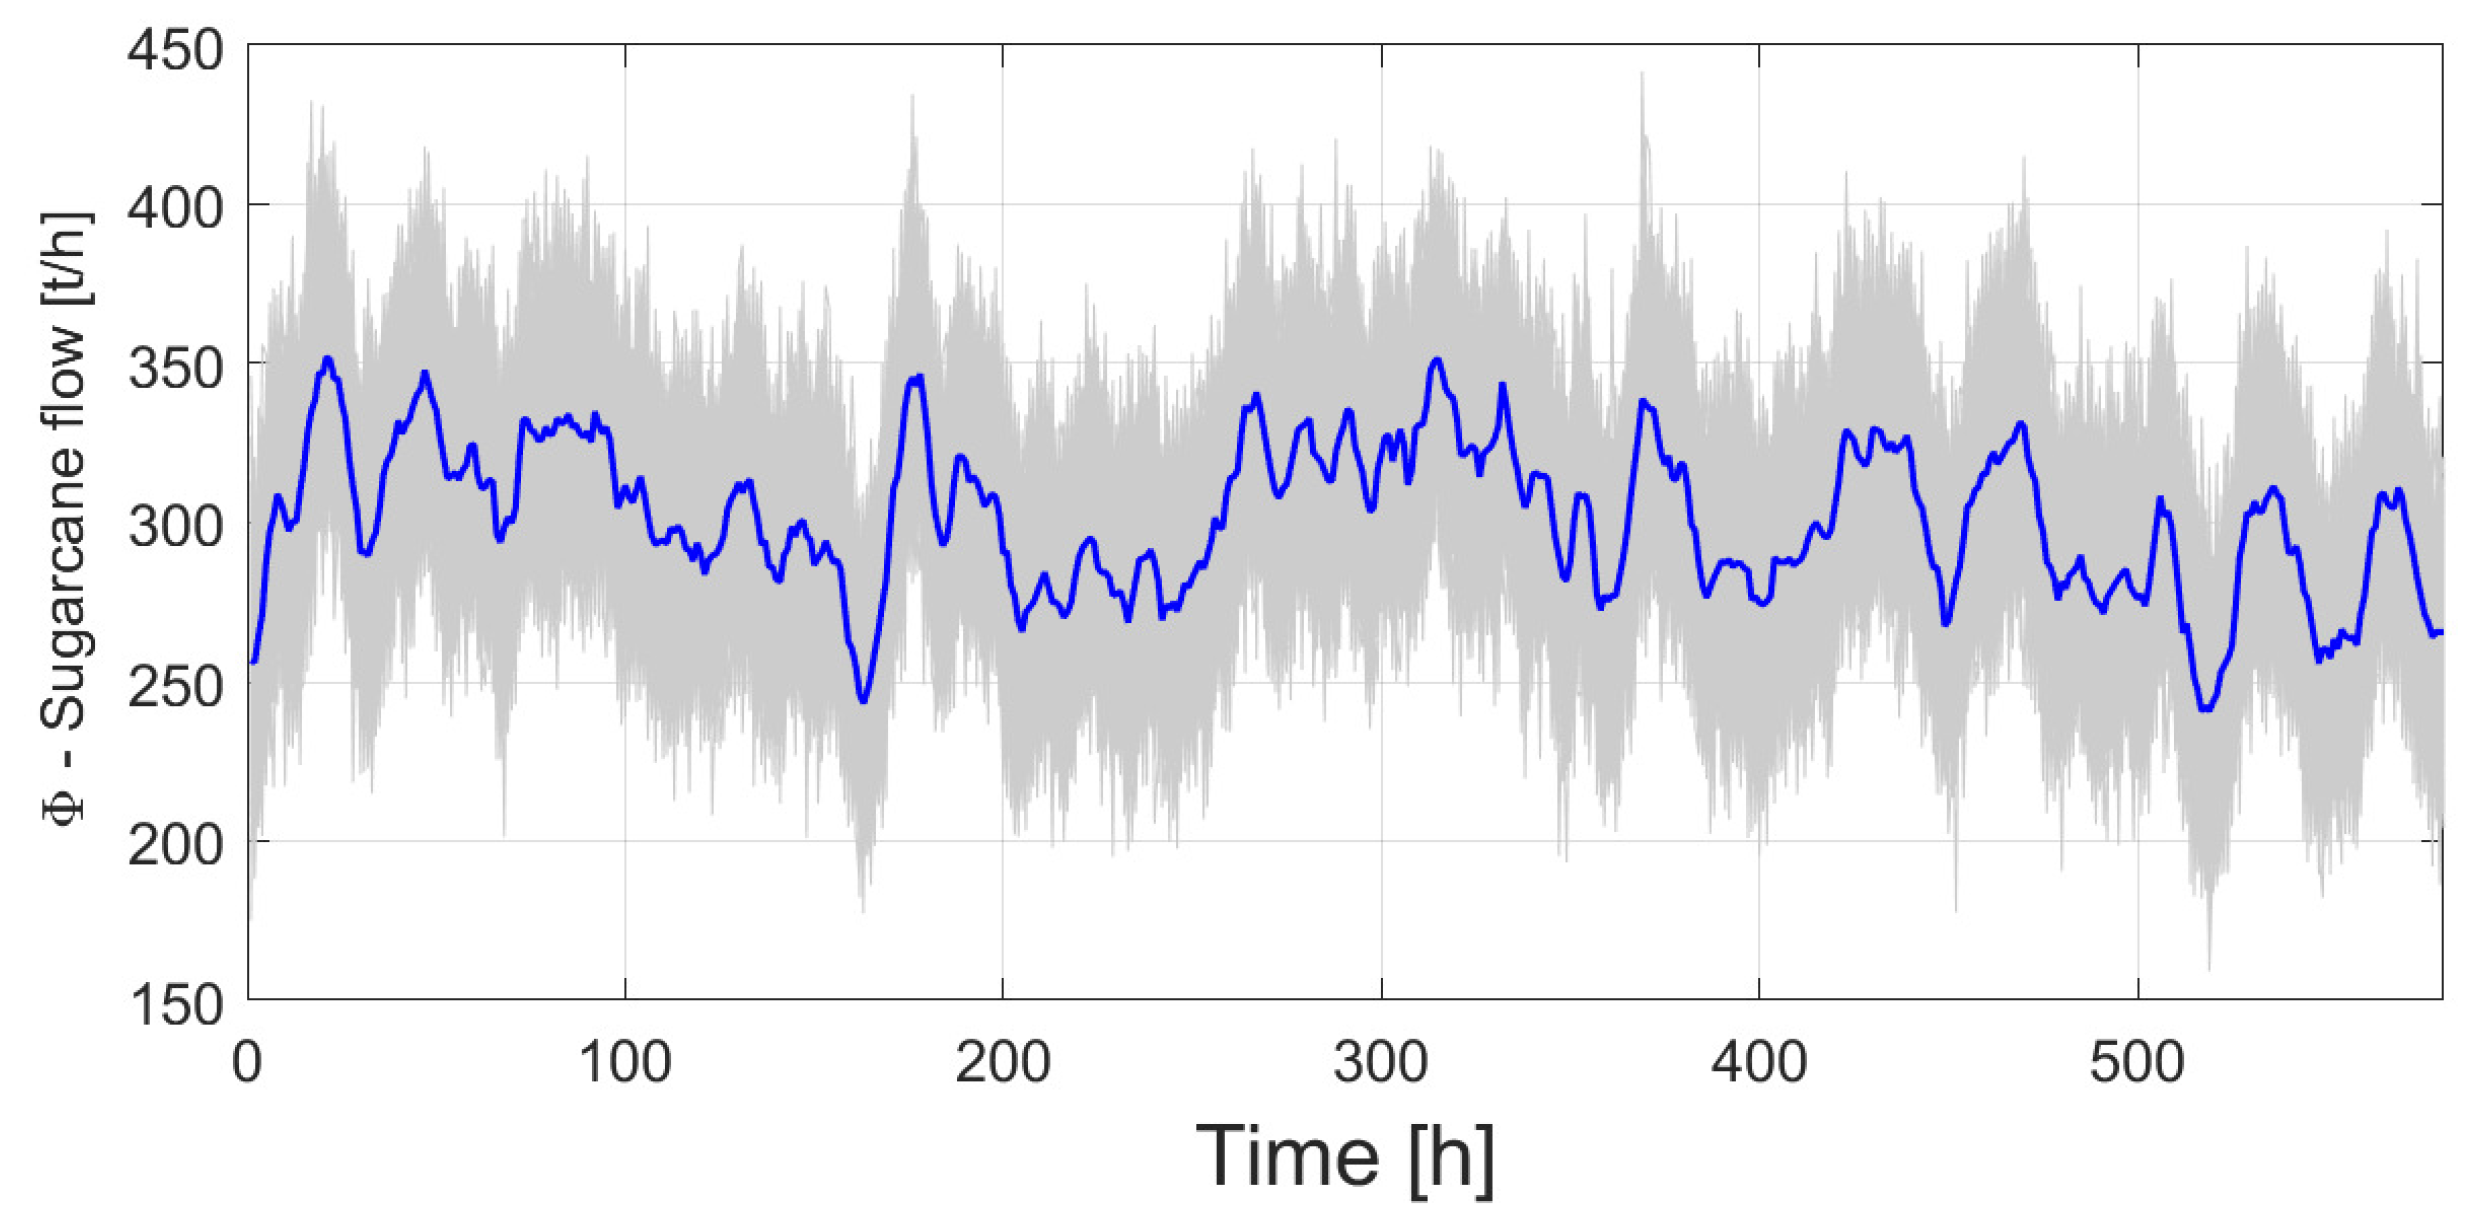
Figure 7.
Resultant Power for synthetic data. The gray lines are the calculated synthetic data , and the blue line is the corresponding to the real dataset.
Figure 7.
Resultant Power for synthetic data. The gray lines are the calculated synthetic data , and the blue line is the corresponding to the real dataset.
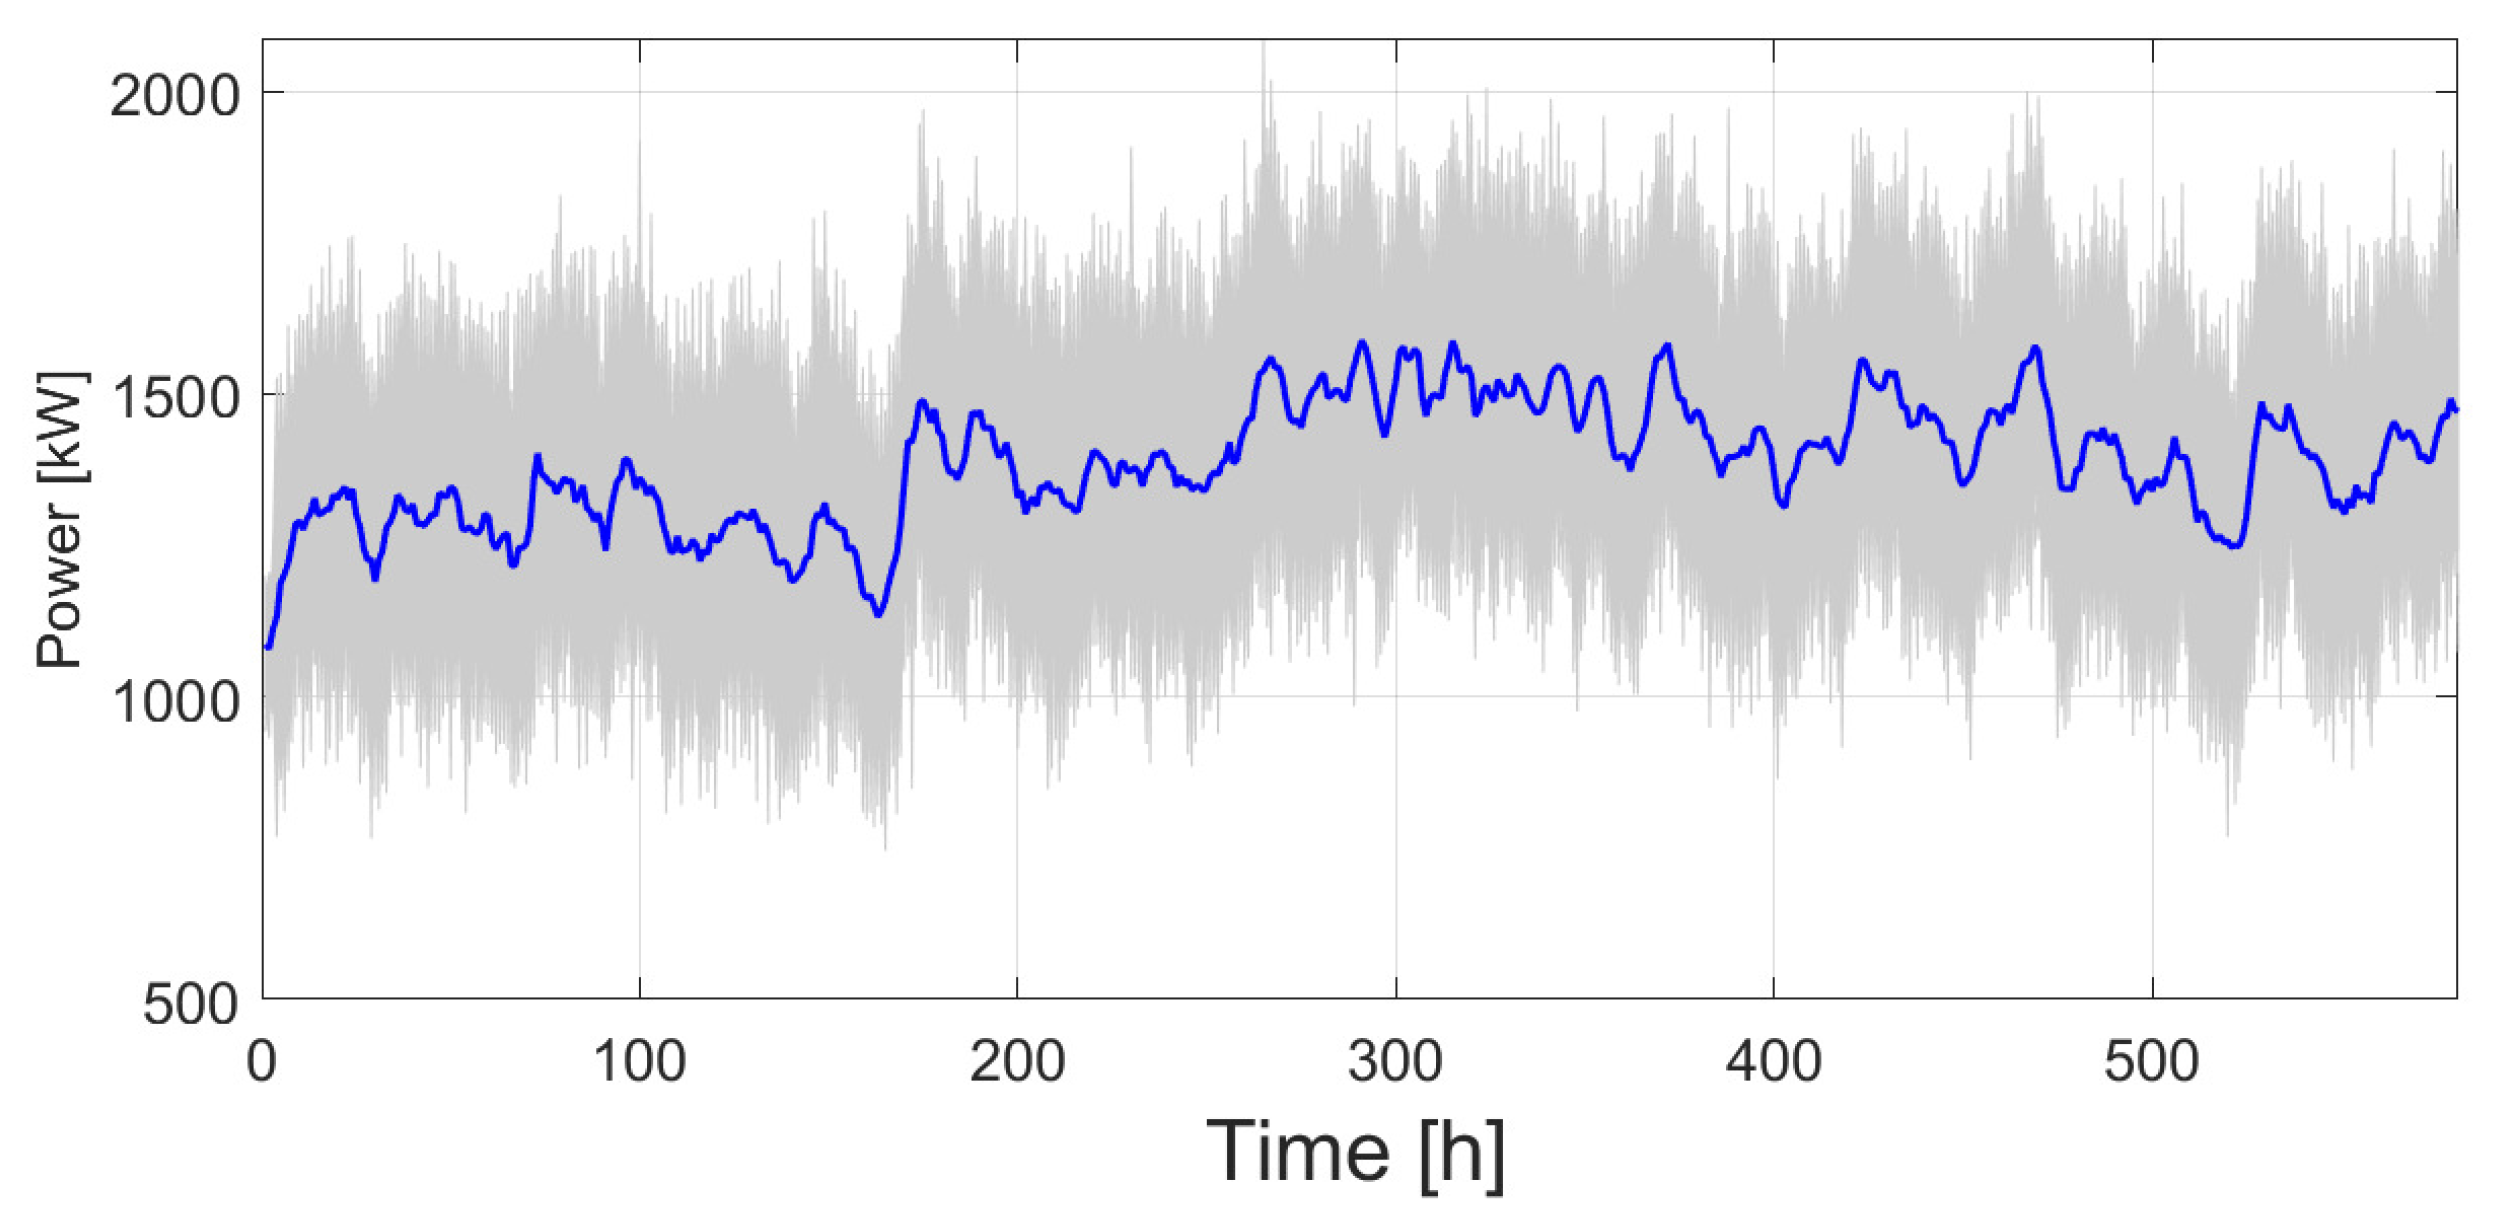
Figure 8.
Full dataset of . Synthetic data (gray lines) and from real dataset (blue line).
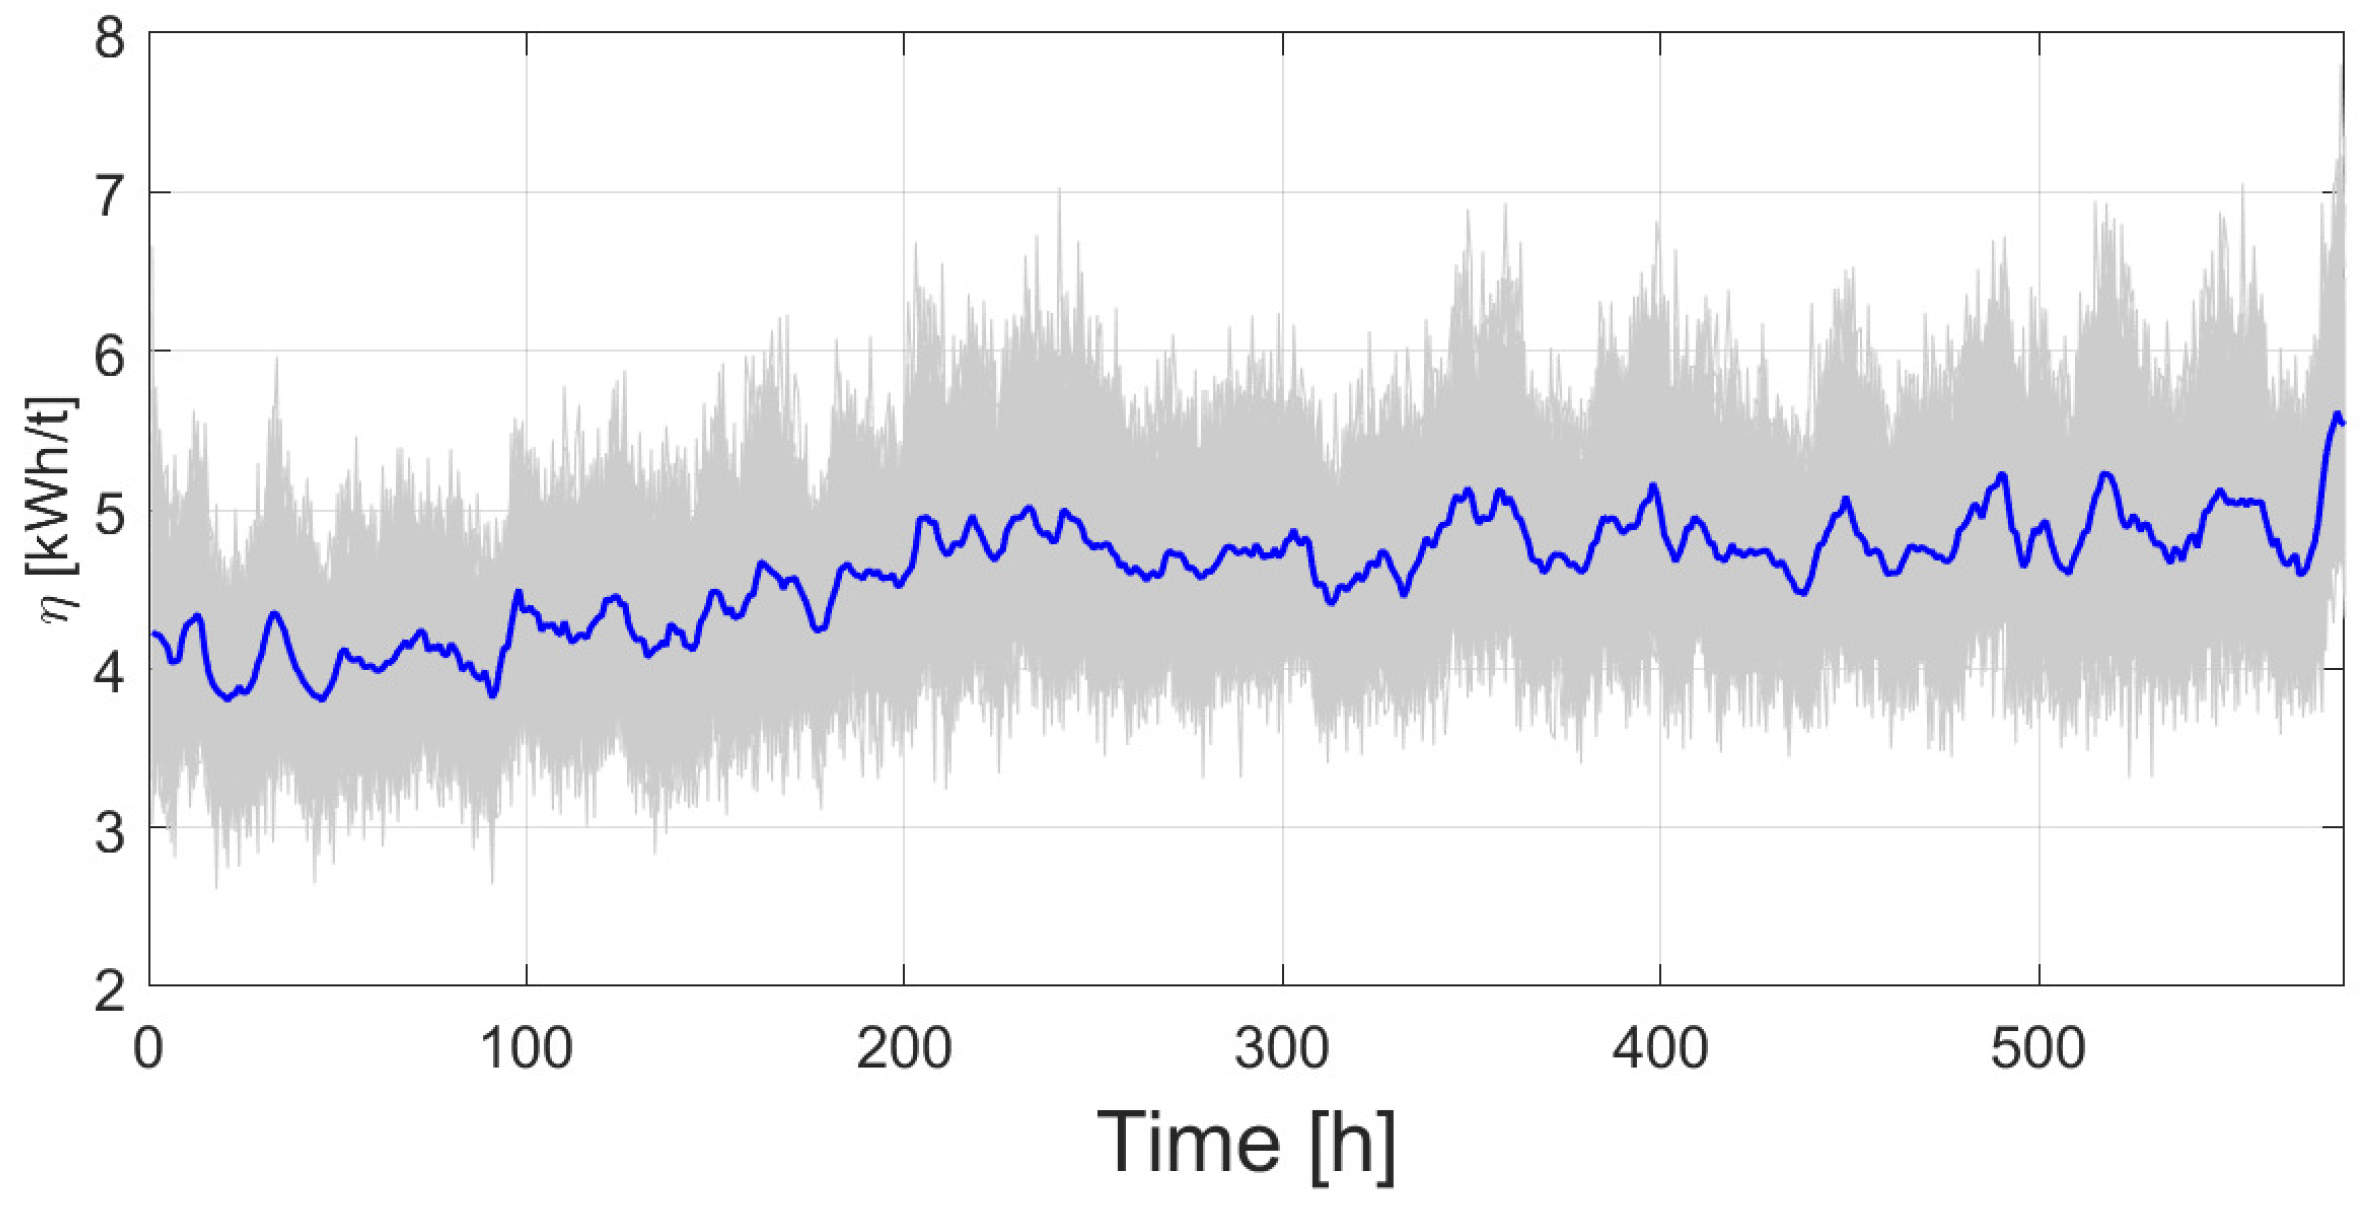
Figure 9.
smoothed with moving average of 48h.
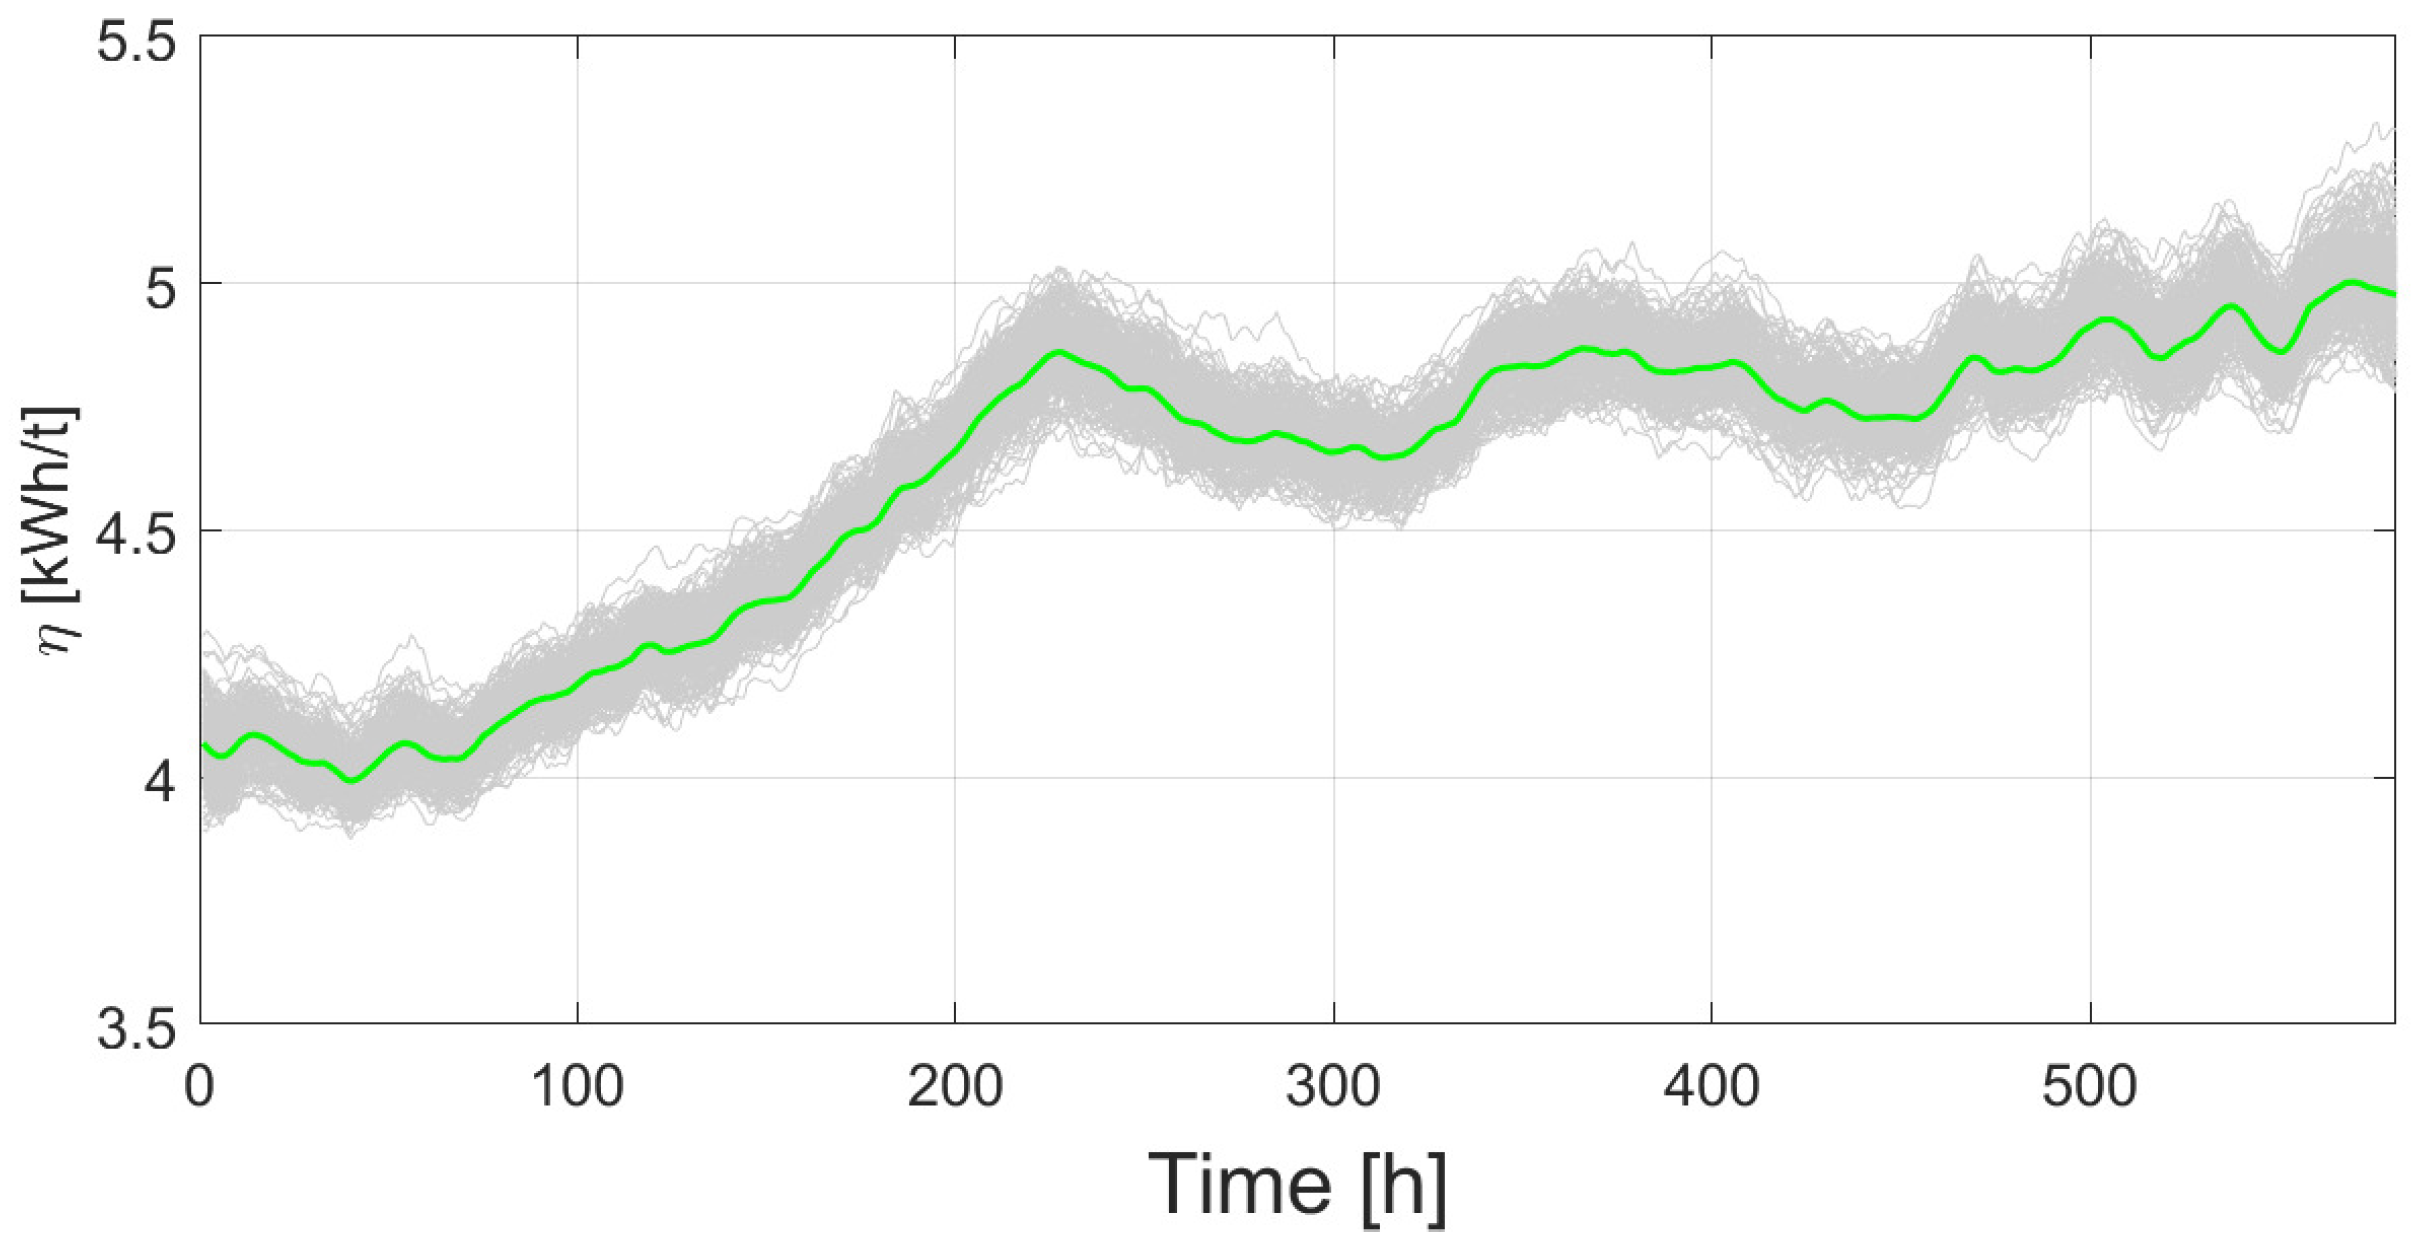
Figure 10.
Distributions of smoothed with moving average of 48h.
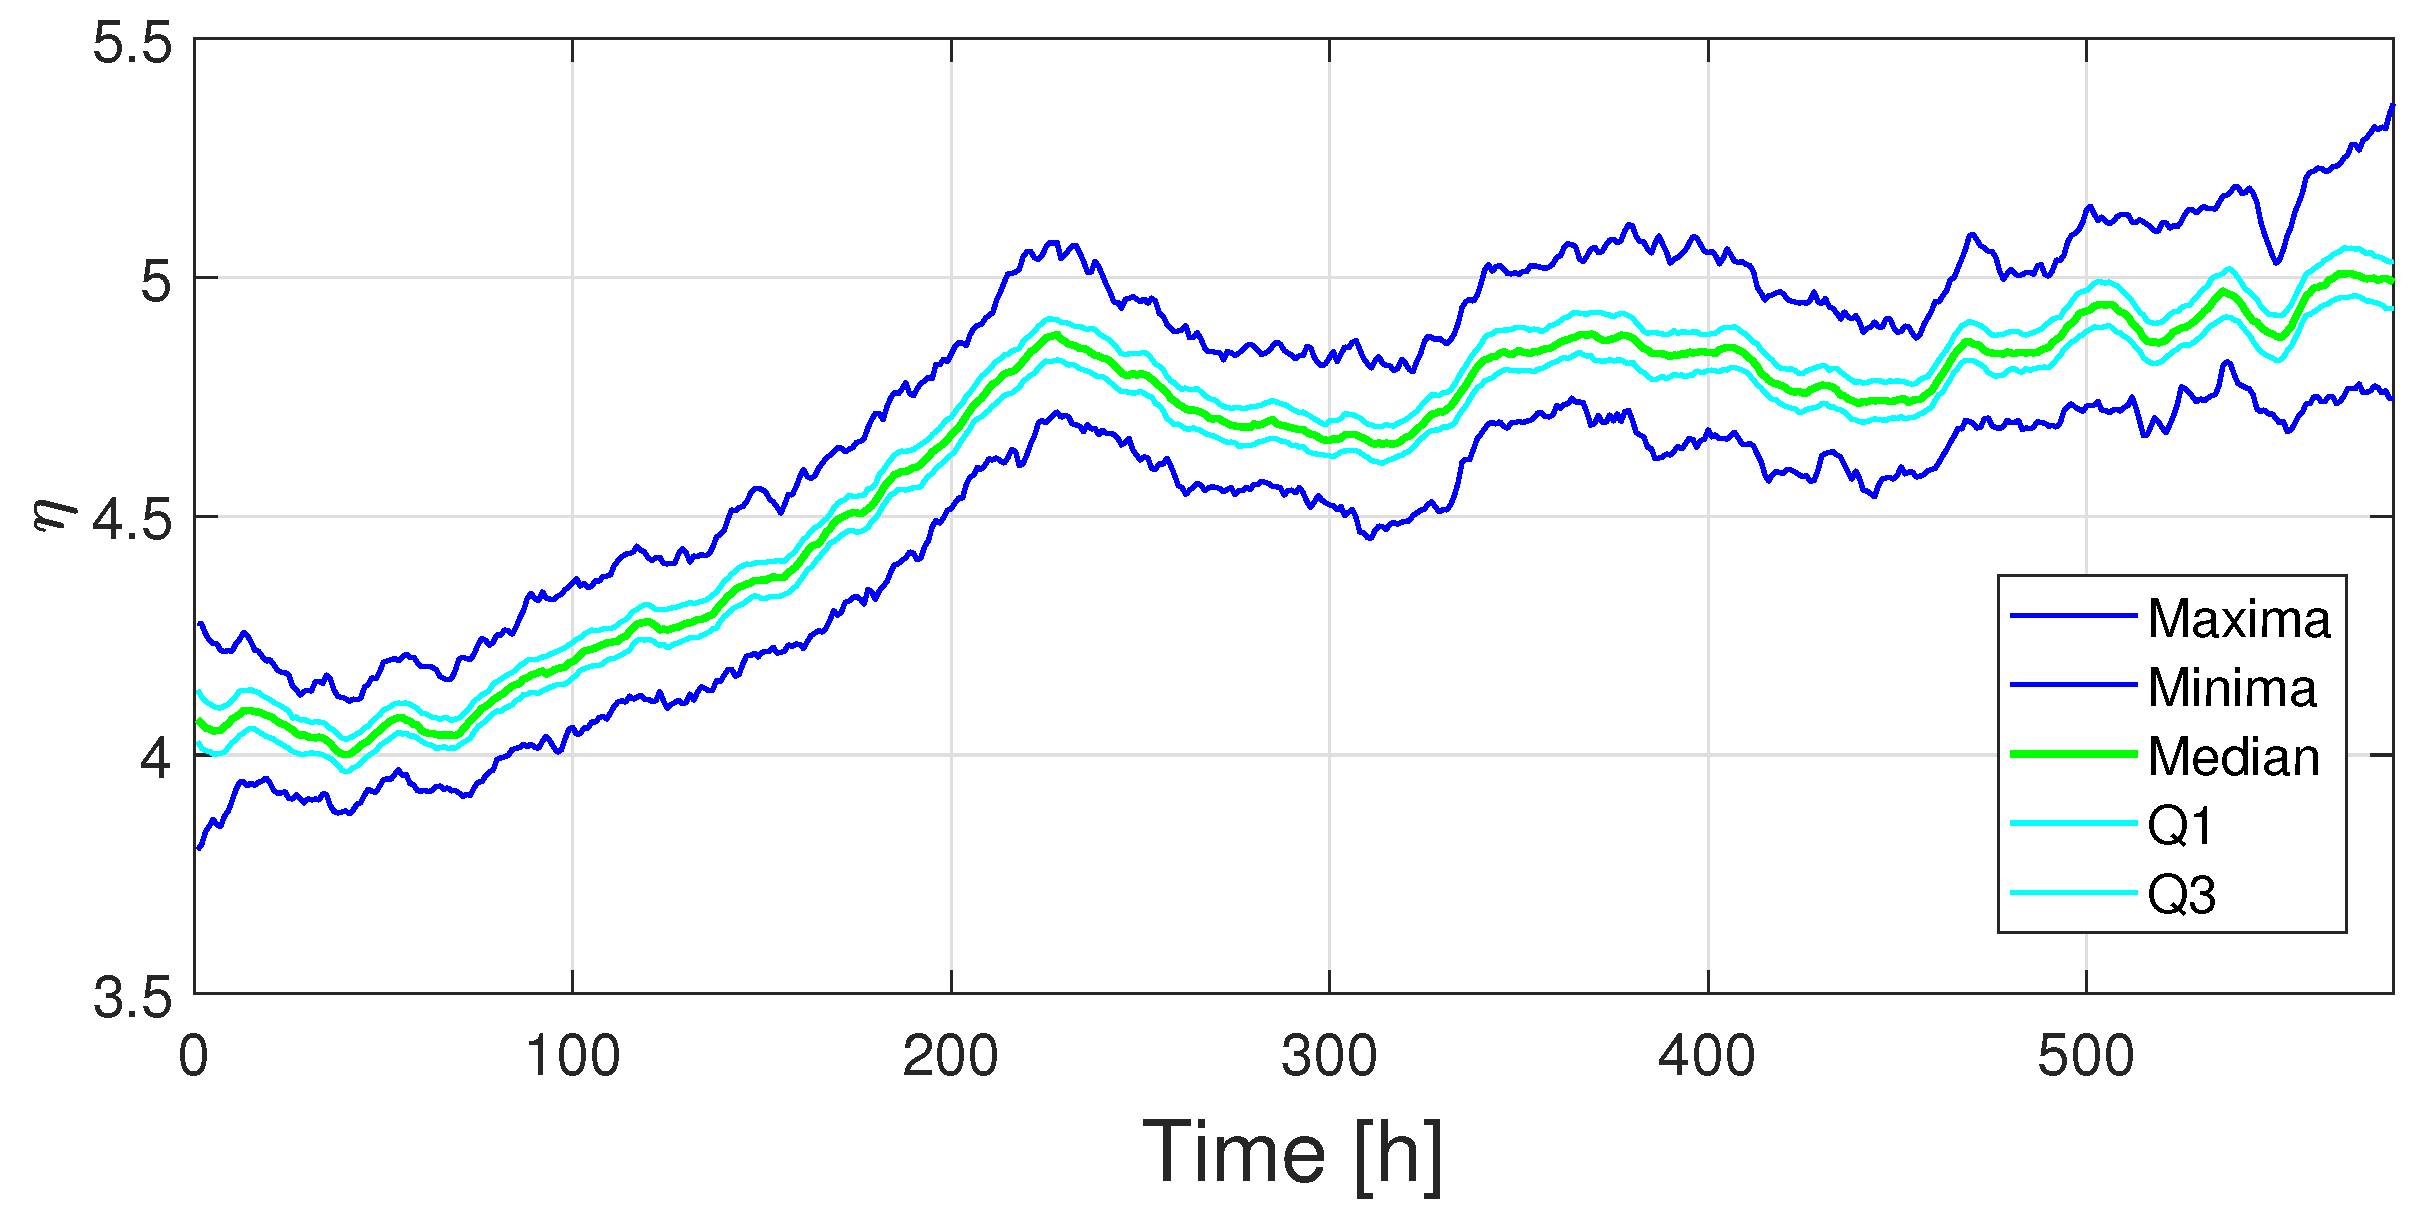
Figure 11.
for synthetic data.
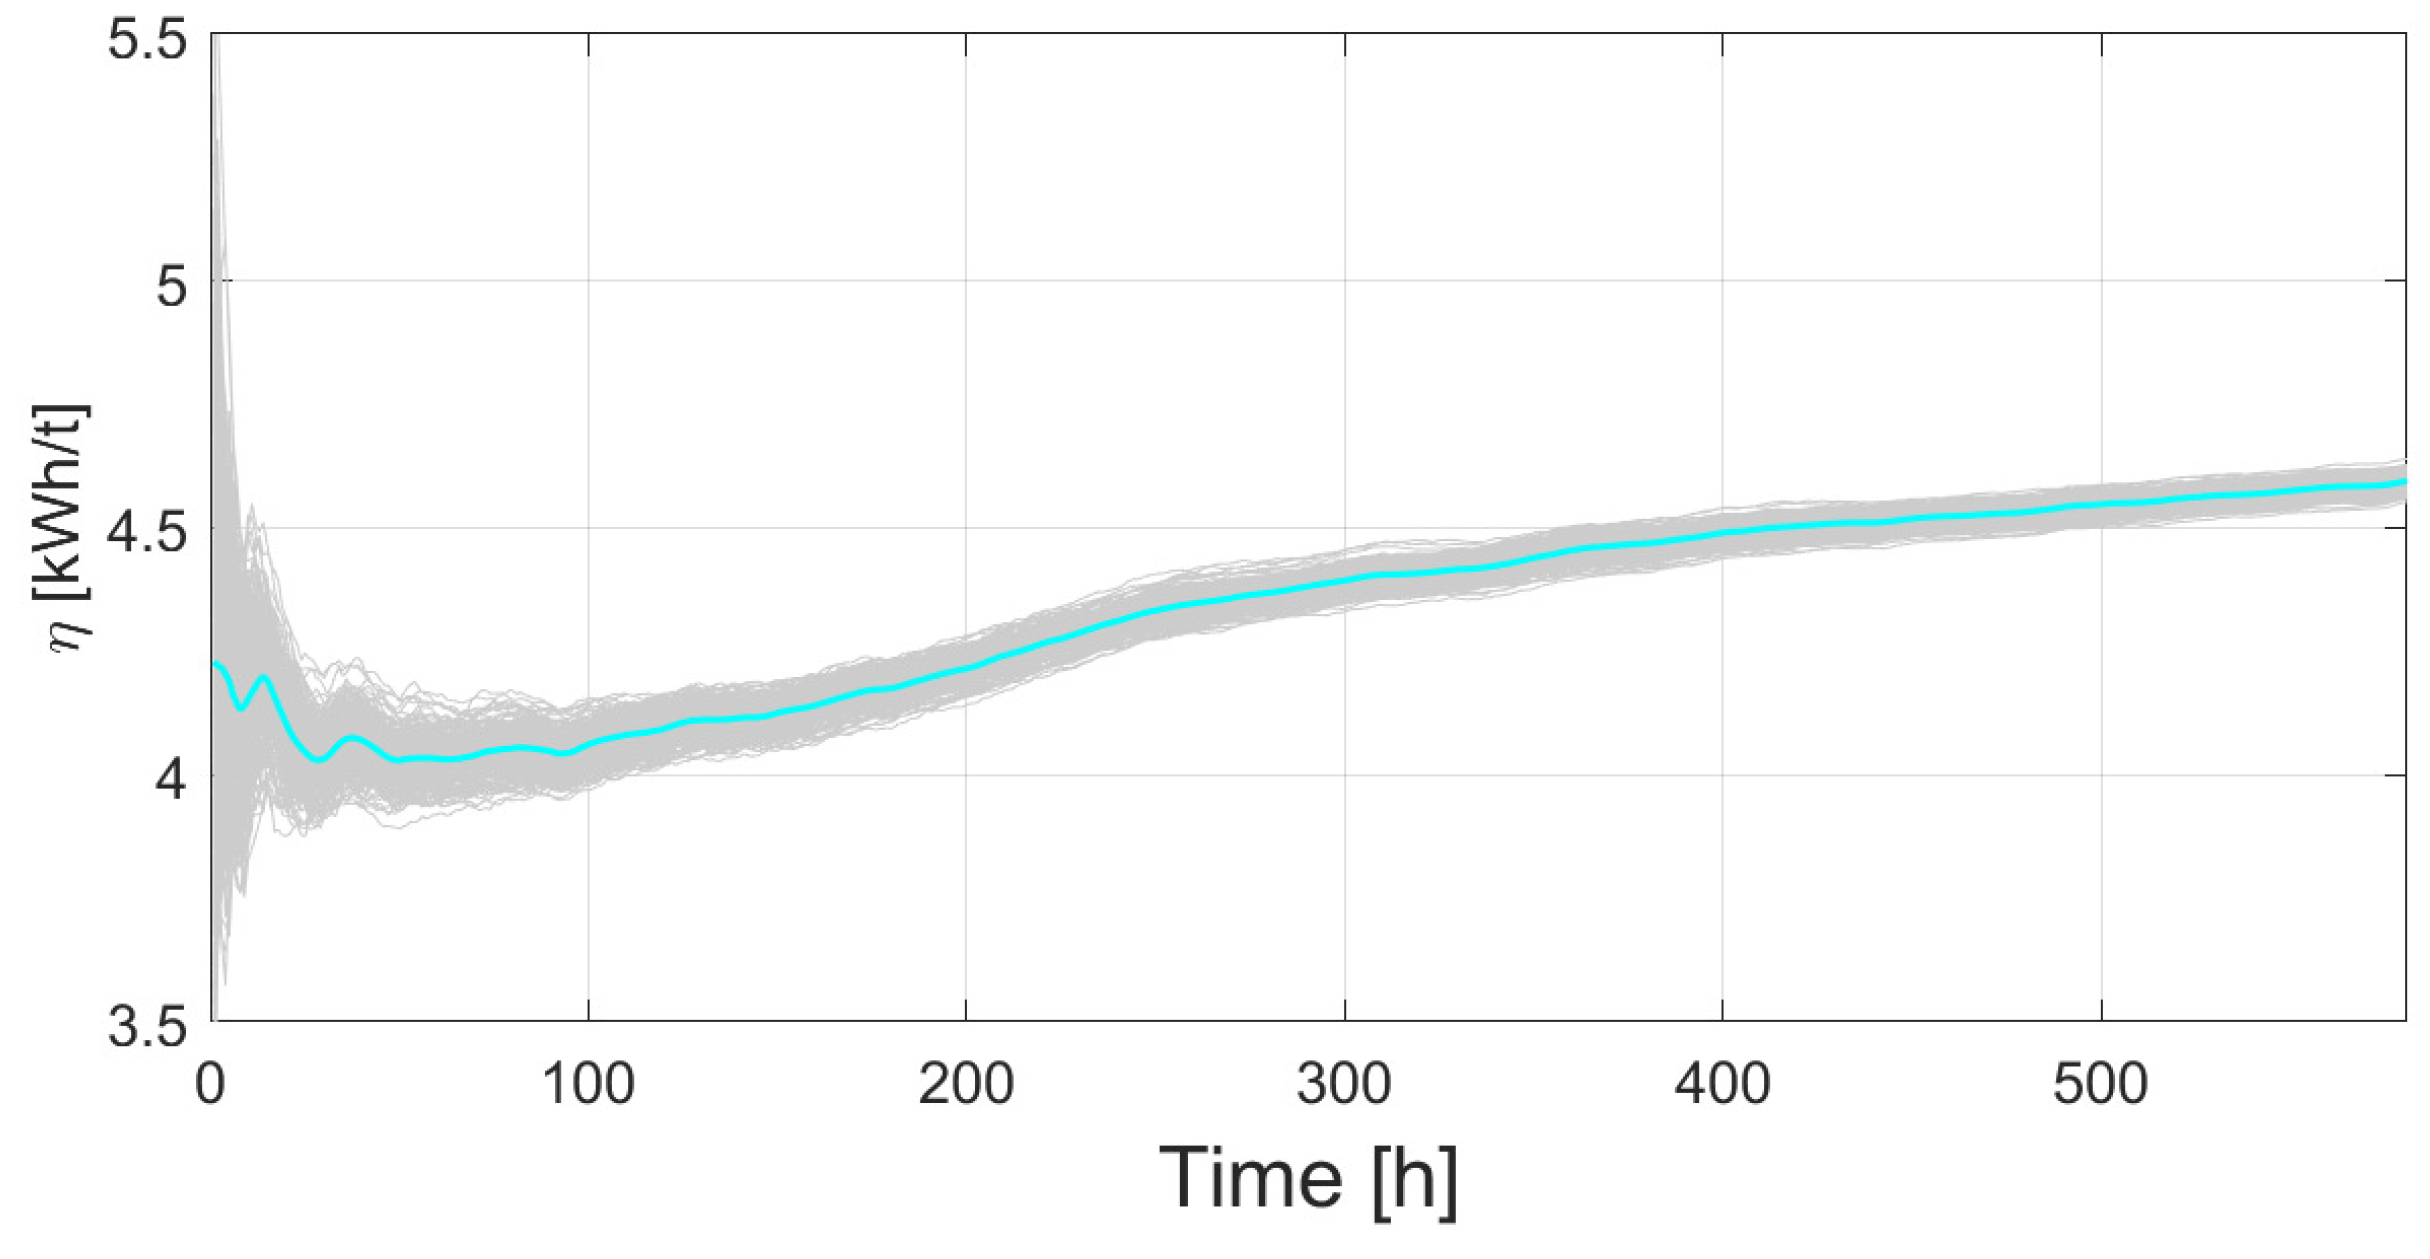
Figure 12.
Histogram for resultant RUL values for the synthetic data.
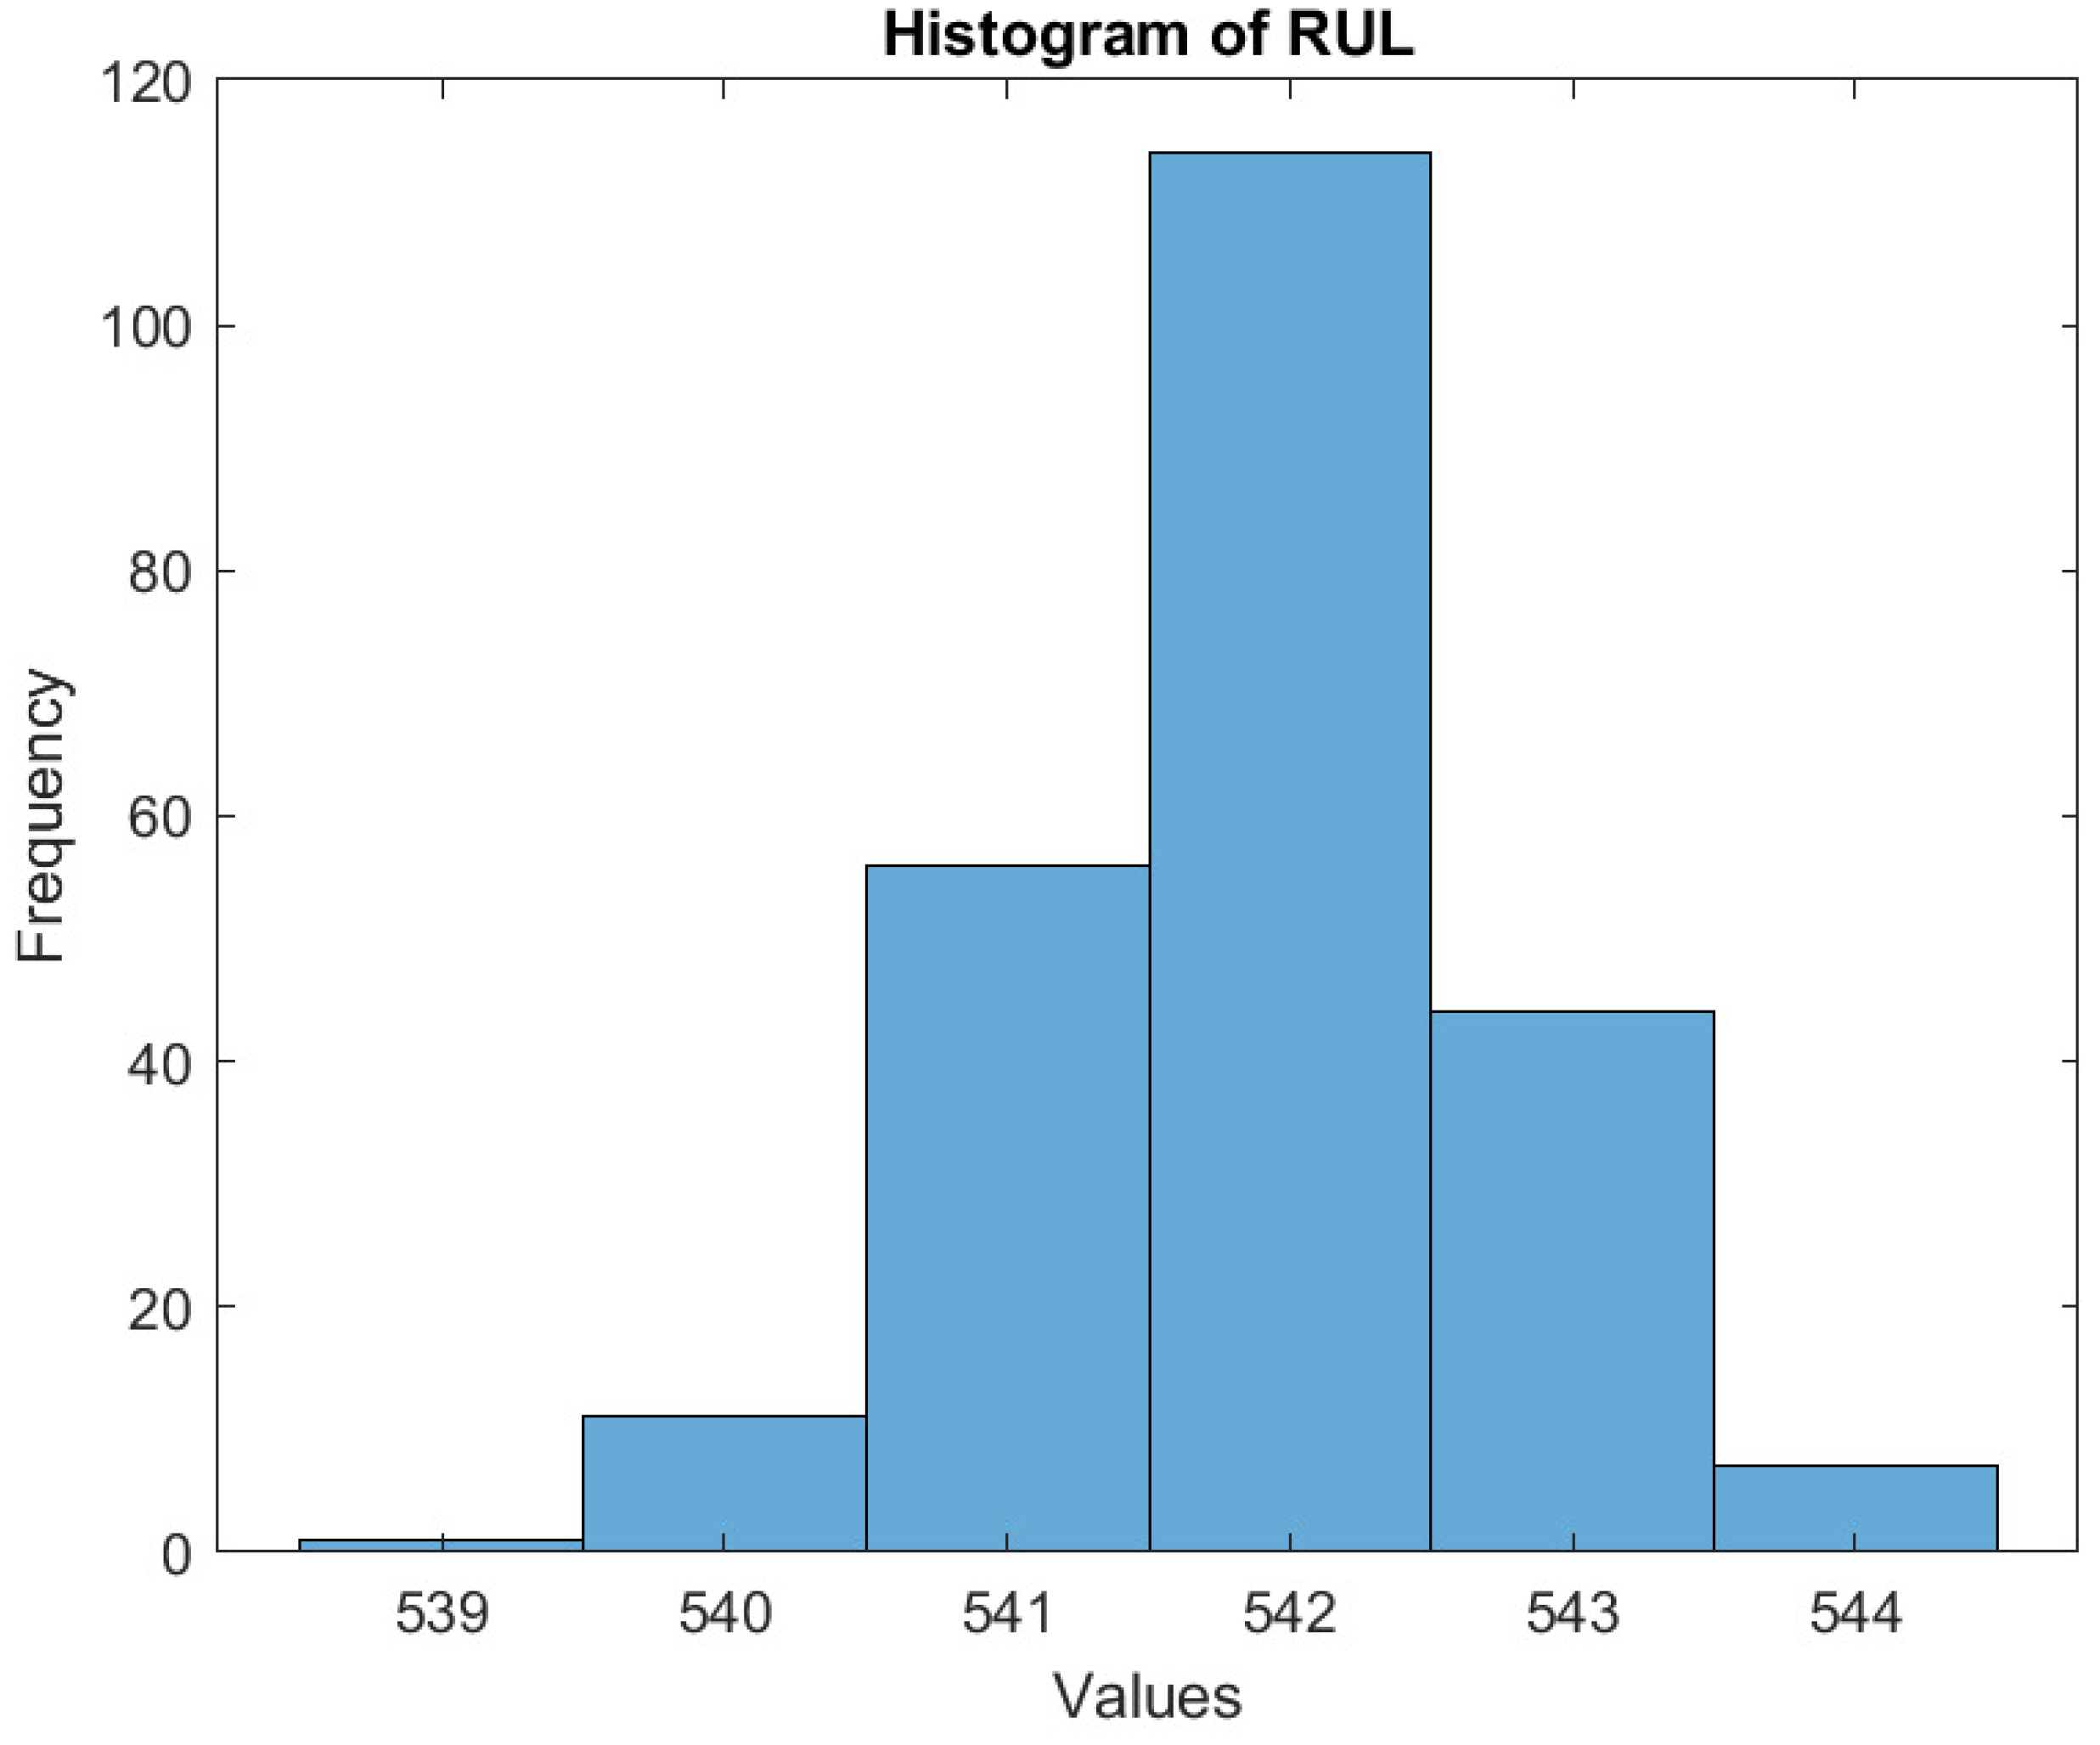
Figure 13.
Dynamic similarity comparison. Blue line corresponds to a real-data new trajectory of (LT2 period). From the first 50 h, the most similar trajectory (red dotted line) is chosen from the database.
Figure 13.
Dynamic similarity comparison. Blue line corresponds to a real-data new trajectory of (LT2 period). From the first 50 h, the most similar trajectory (red dotted line) is chosen from the database.
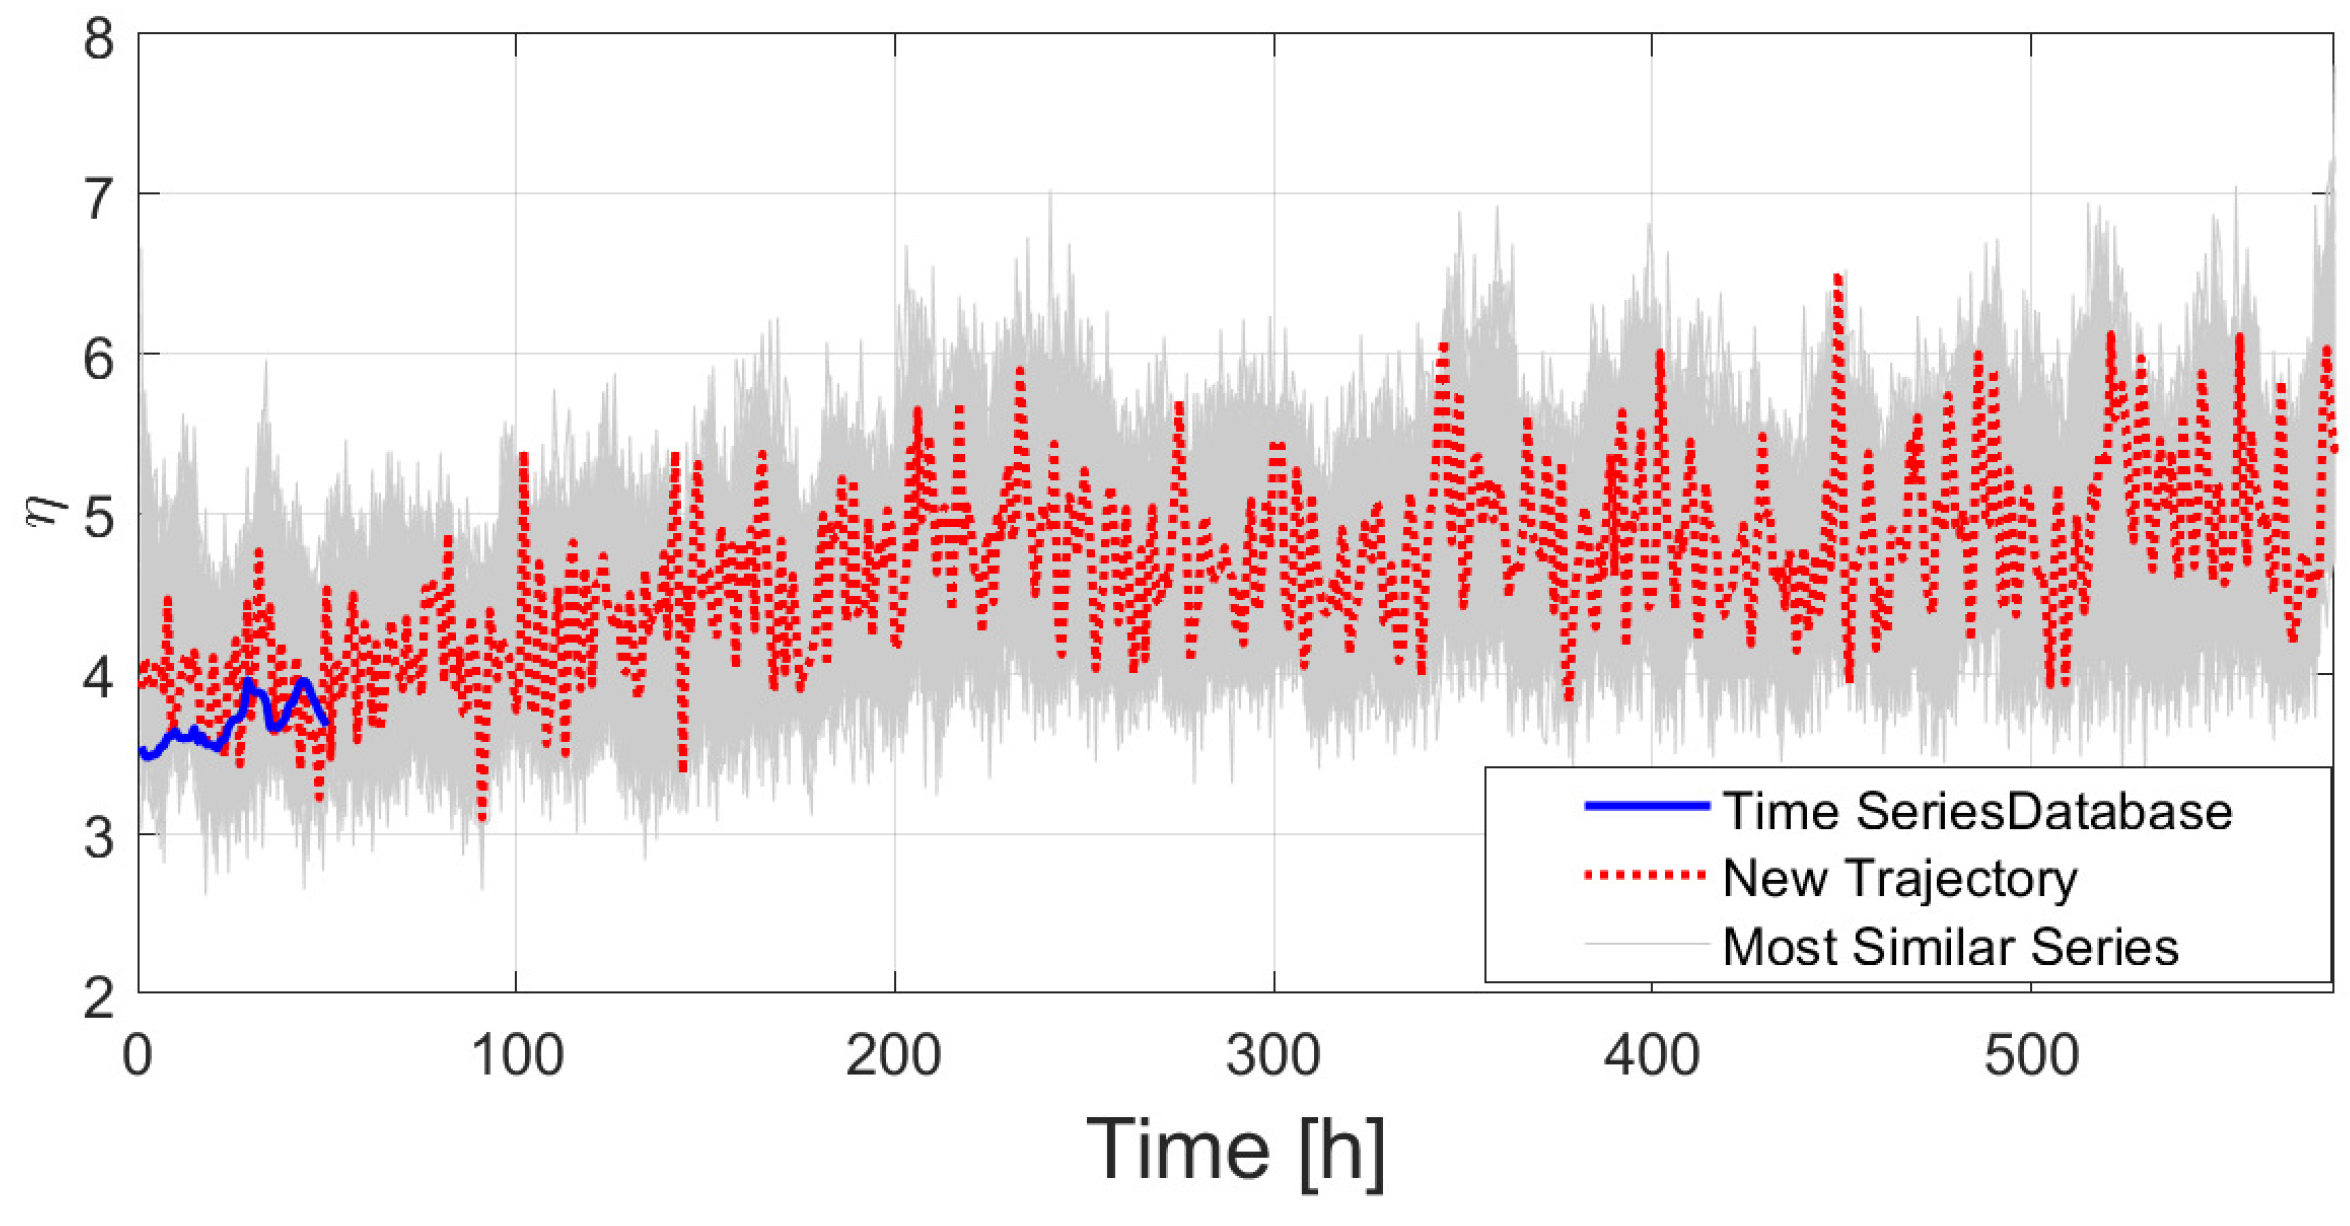
Figure 14.
Dynamic similarity comparison. Blue line corresponds to a real-data new trajectory of (LT2 period). From the full dataset (300 h), the most similar trajectory (red dotted line) is chosen from the database.
Figure 14.
Dynamic similarity comparison. Blue line corresponds to a real-data new trajectory of (LT2 period). From the full dataset (300 h), the most similar trajectory (red dotted line) is chosen from the database.
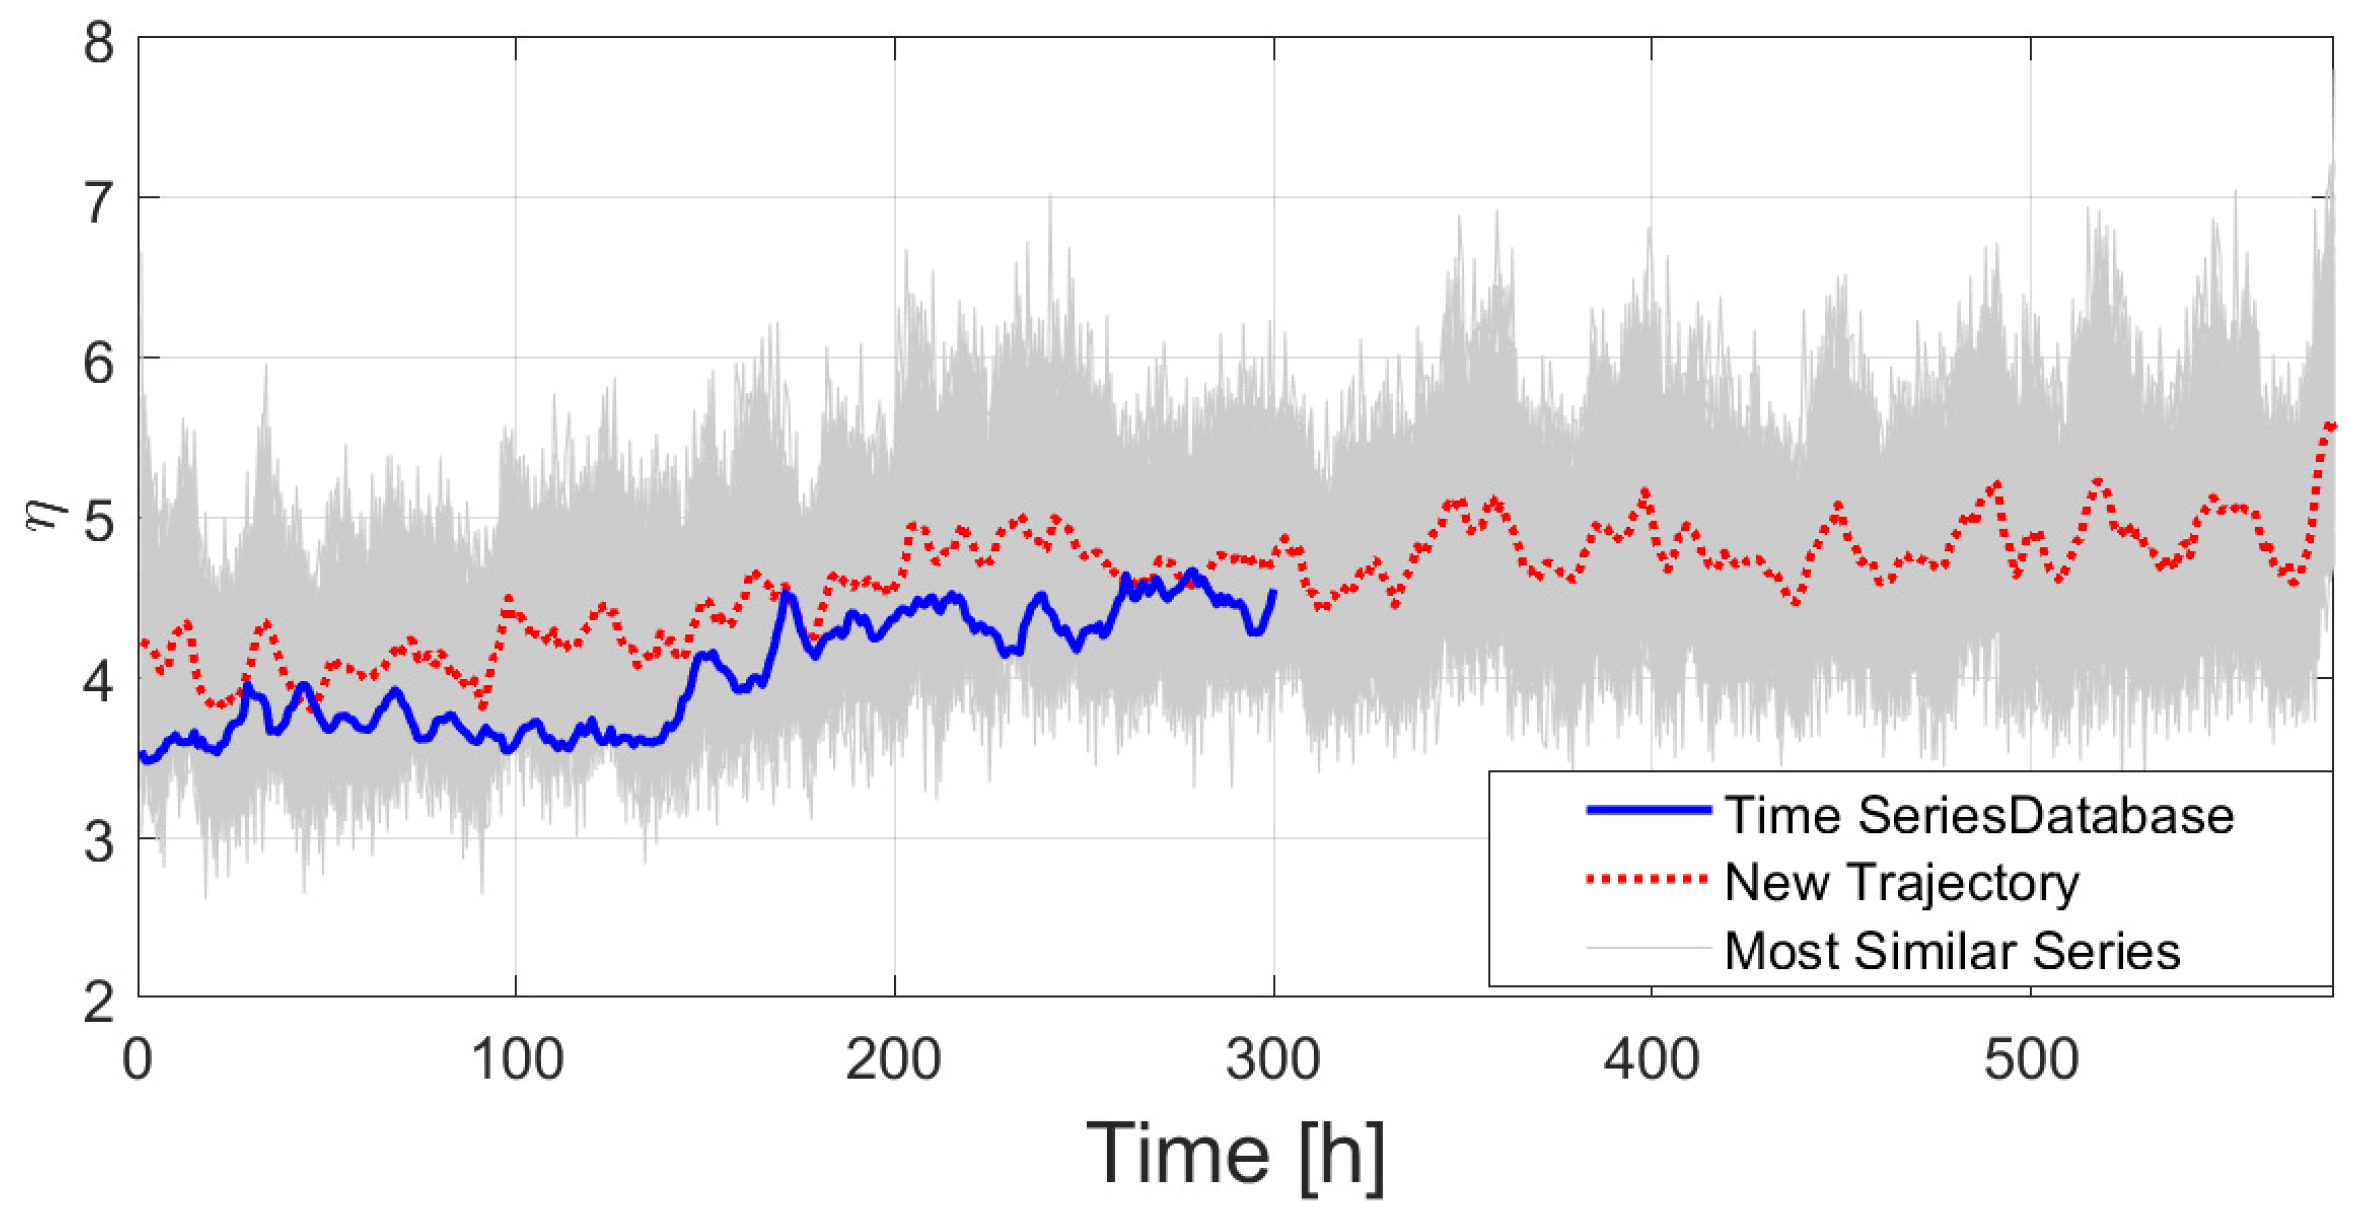
Figure 15.
RUL prognosis estimated in [h]. From 180 h RUL prognosis converges towards a 450h of lifetime.
Figure 15.
RUL prognosis estimated in [h]. From 180 h RUL prognosis converges towards a 450h of lifetime.
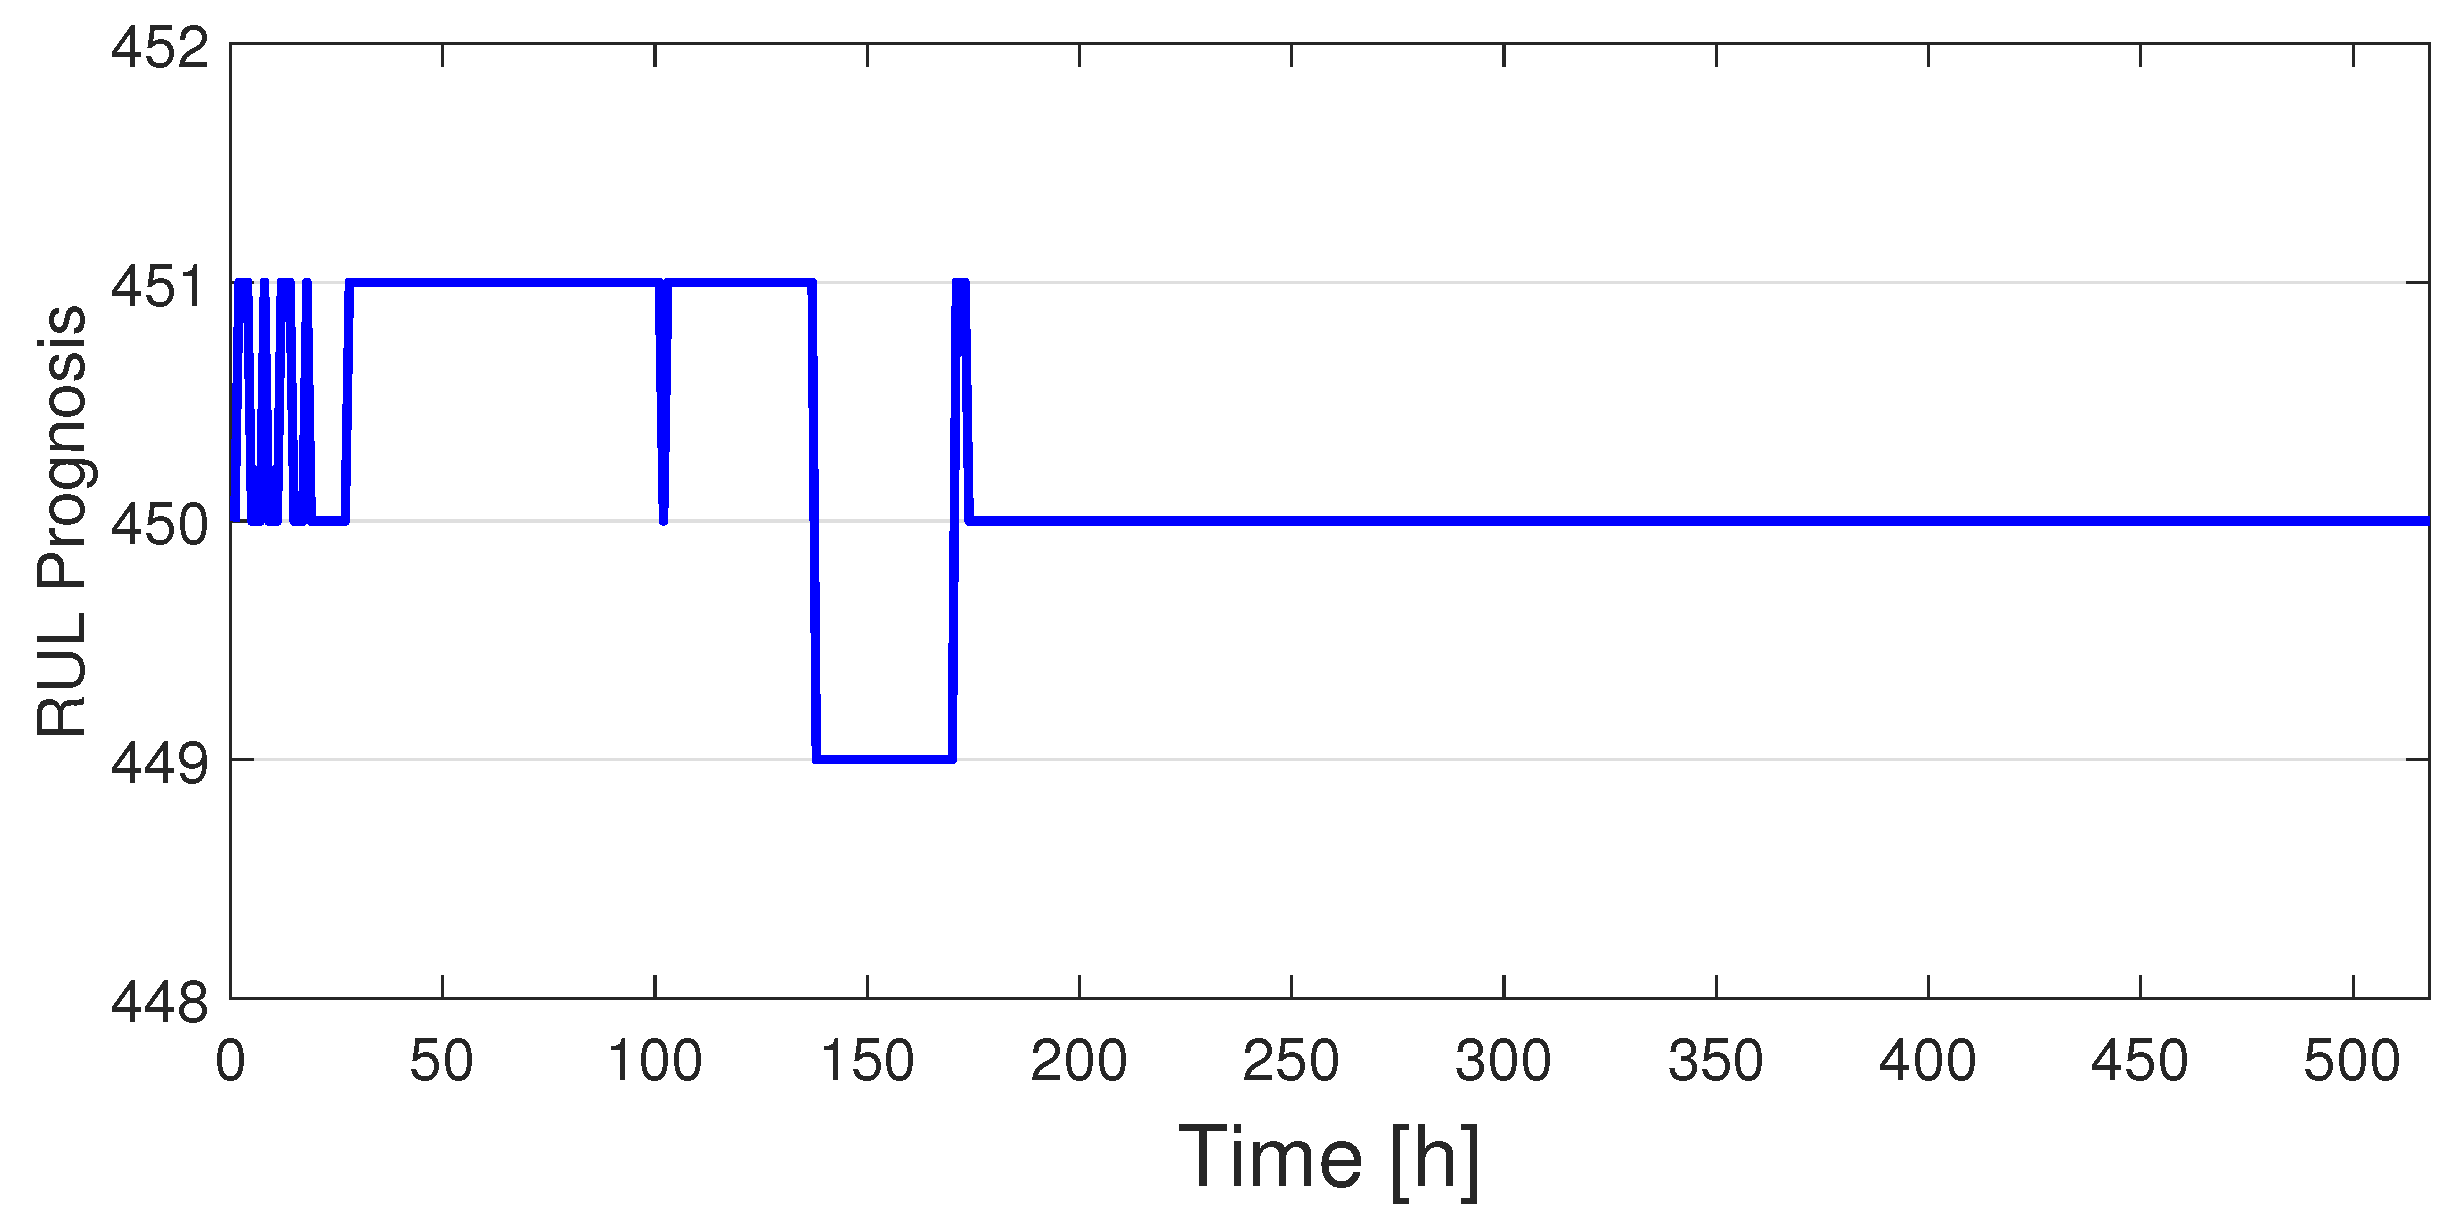
Figure 16.
Evolution of a trajectory. Smoothed slopes, defined threshold and High slope alerts.
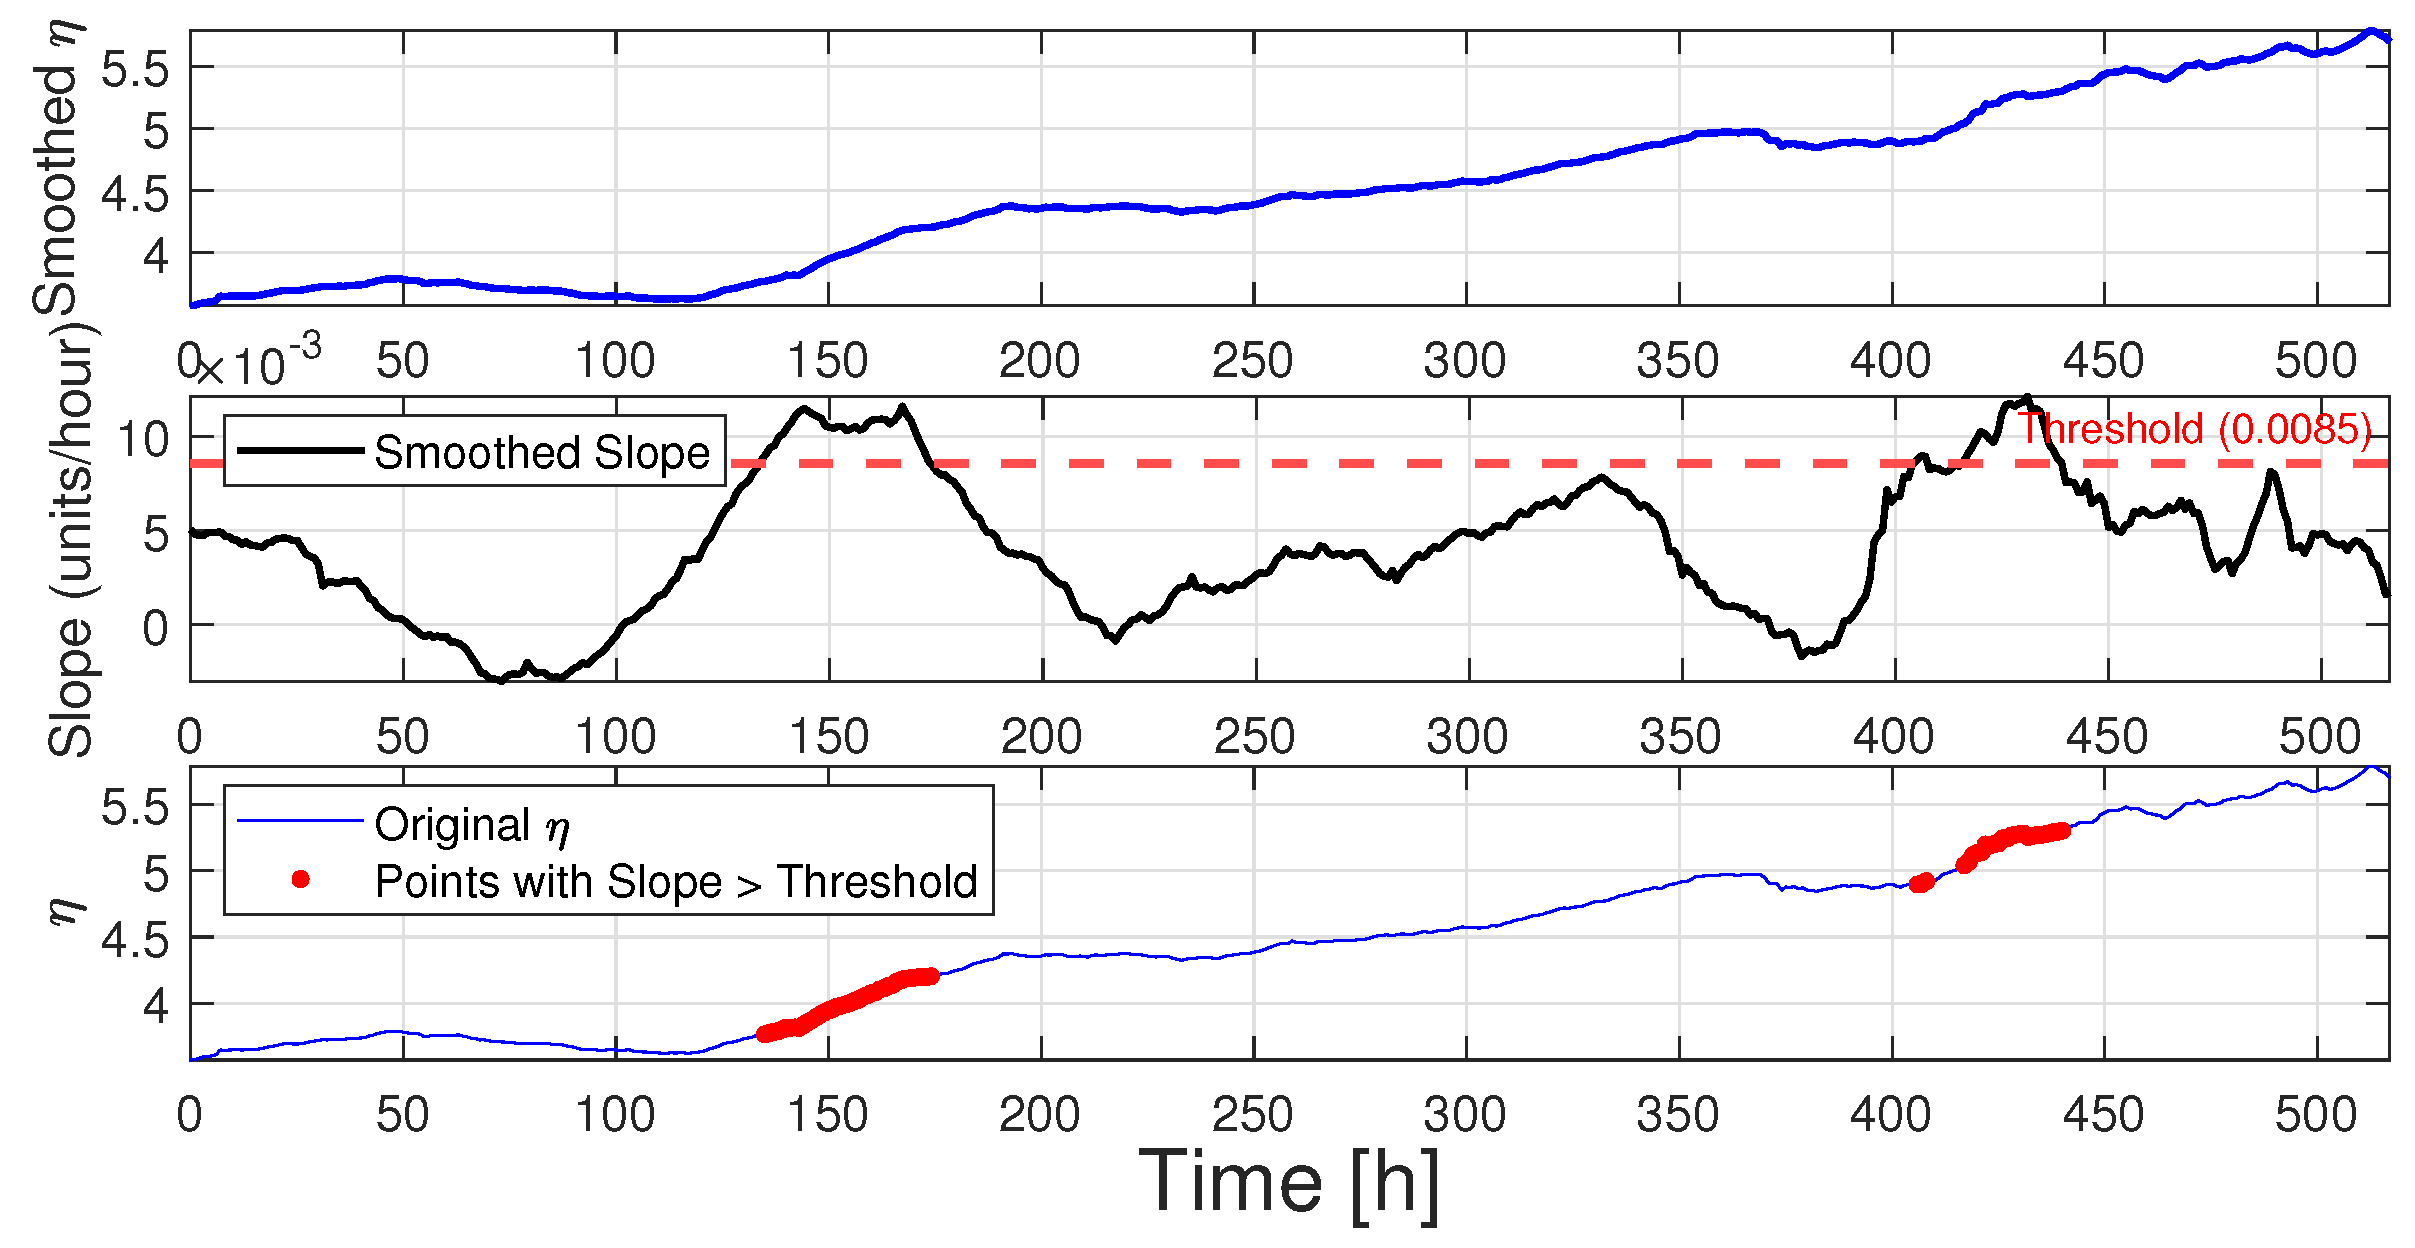
Figure 17.
Changepoints for which the slope have significant changes with respect to the RMSE. Here 10 change points are chosen.
Figure 17.
Changepoints for which the slope have significant changes with respect to the RMSE. Here 10 change points are chosen.
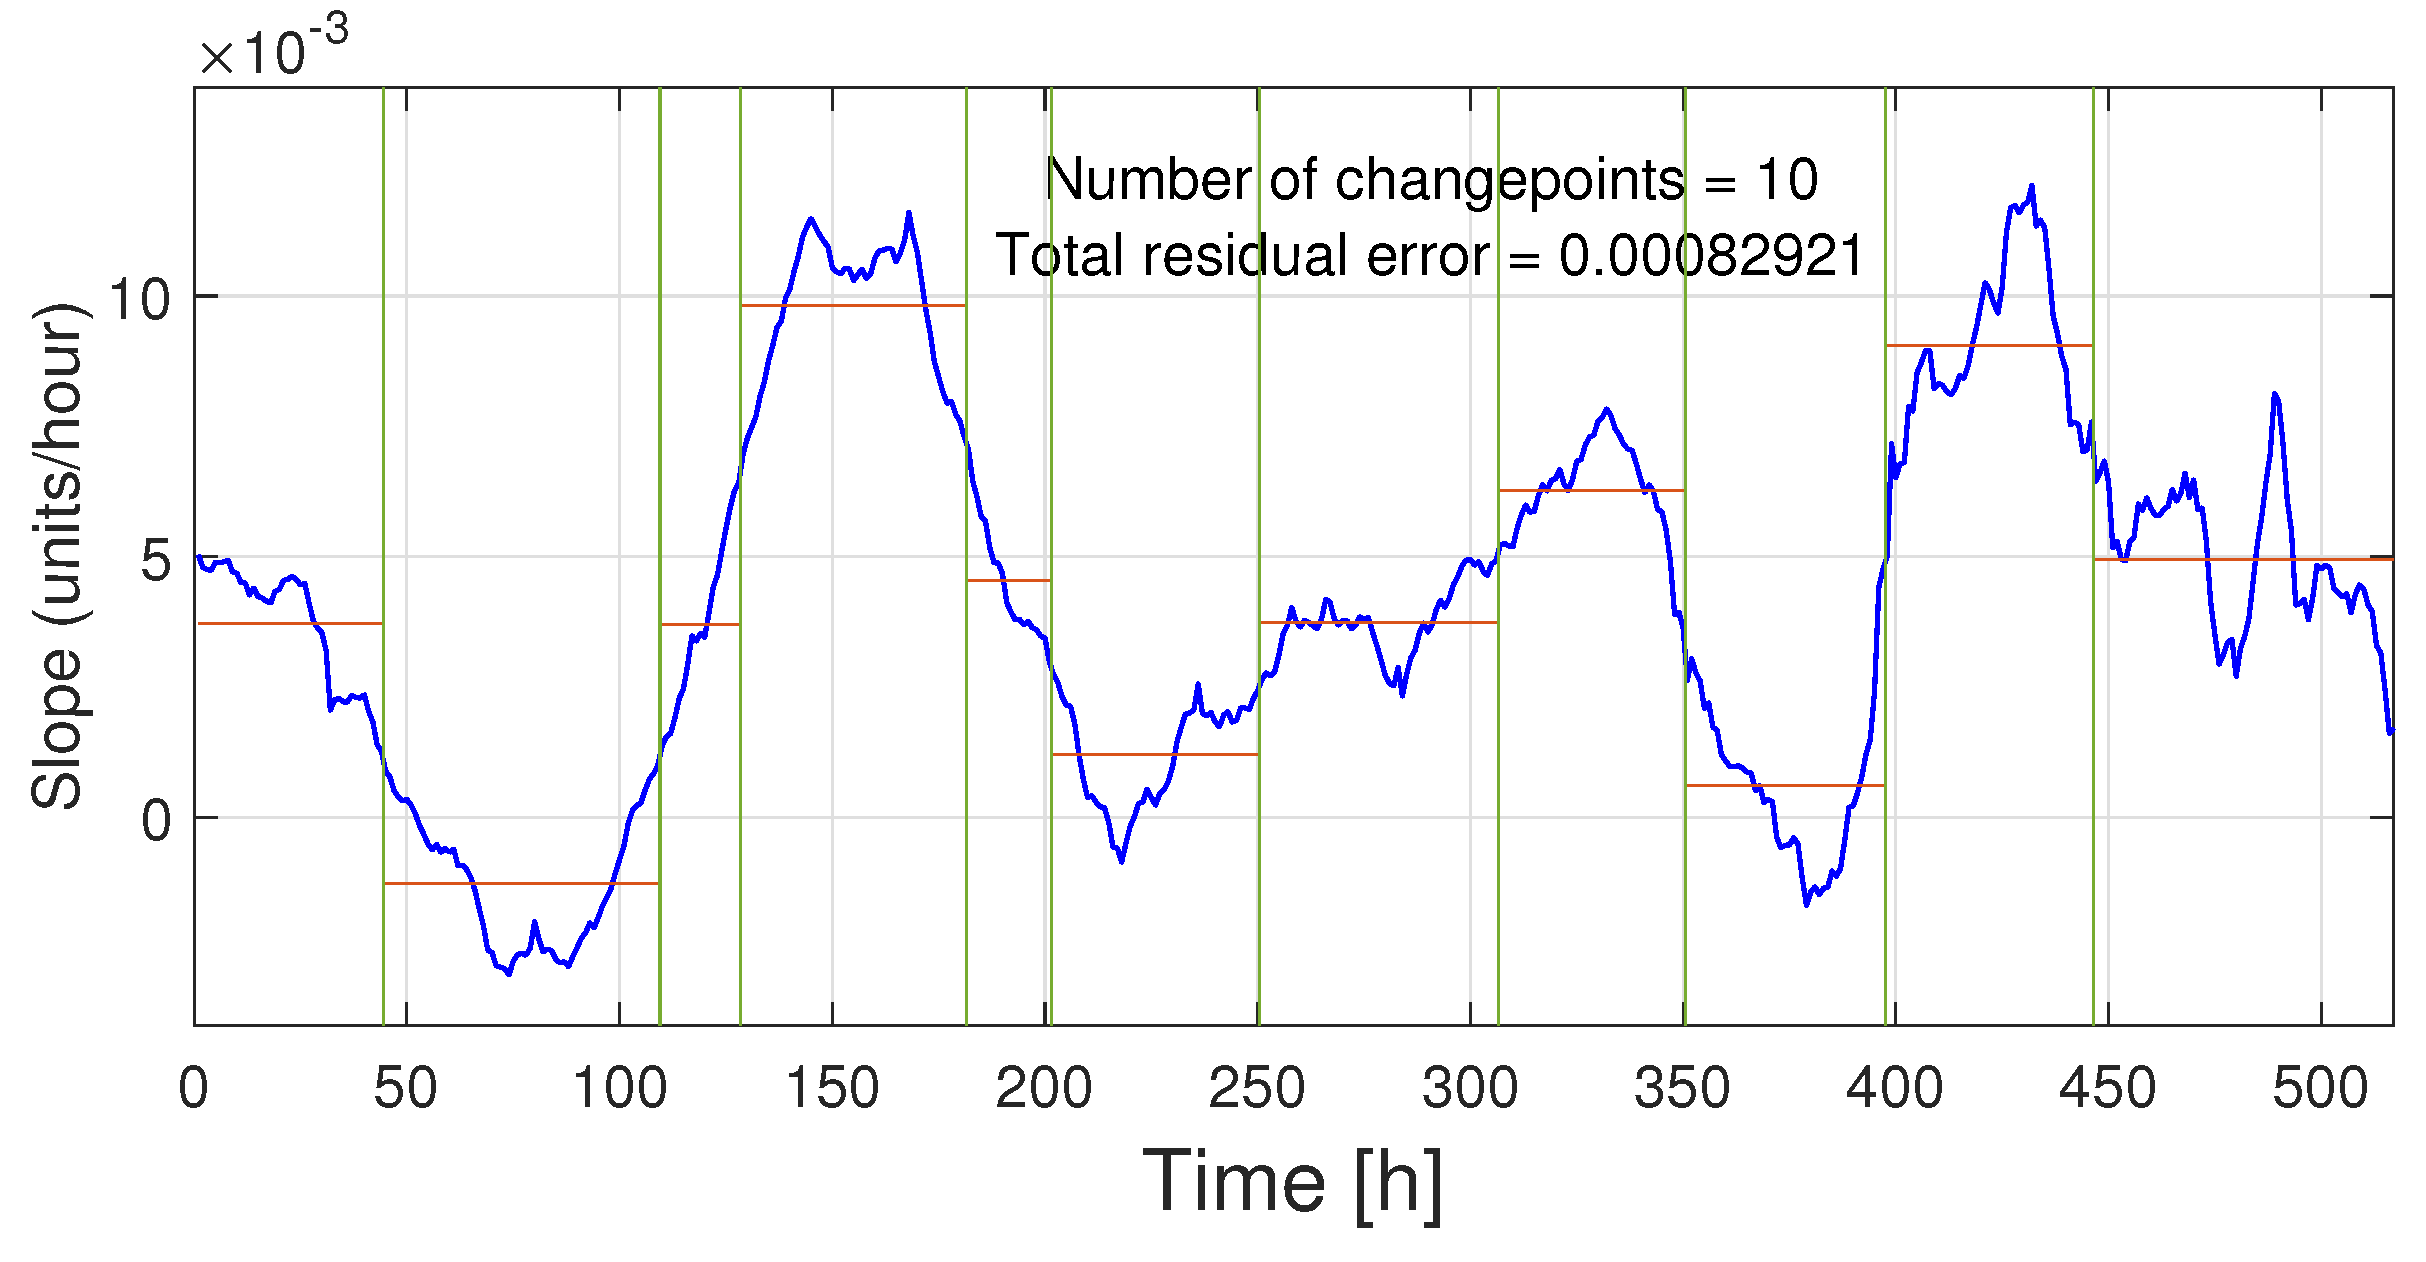
Figure 18.
Visualization of high slopes Windows analysis. Evolution of a trajectory (blue line) and zones of persistent threshold overshot.
Figure 18.
Visualization of high slopes Windows analysis. Evolution of a trajectory (blue line) and zones of persistent threshold overshot.
Disclaimer/Publisher’s Note: The statements, opinions and data contained in all publications are solely those of the individual author(s) and contributor(s) and not of MDPI and/or the editor(s). MDPI and/or the editor(s) disclaim responsibility for any injury to people or property resulting from any ideas, methods, instructions or products referred to in the content. |
© 2025 by the authors. Licensee MDPI, Basel, Switzerland. This article is an open access article distributed under the terms and conditions of the Creative Commons Attribution (CC BY) license (http://creativecommons.org/licenses/by/4.0/).
Copyright: This open access article is published under a Creative Commons CC BY 4.0 license, which permit the free download, distribution, and reuse, provided that the author and preprint are cited in any reuse.


