Submitted:
15 October 2025
Posted:
17 October 2025
You are already at the latest version
Abstract
Rankings drive consequential decisions in science, sports, medicine, and business. Yet standard evaluations typically analyze concordance, dispersion, and extremeness in isolation, inviting biased inference when these properties co-move. We introduce the Concordance–Dispersion–Extremity Framework (CDEF), a copula-based, ranking-specific audit that treats dependence as the object of interest. CDEF (i) automatically detects forced vs.\ non-forced regimes; (ii) screens dispersion mechanics via $\chi^2$ (independent multinomial vs.\ without-replacement structure) and, for forced dependent data, compares Mallows structure against appropriate baselines; (iii) estimates upper-tail agreement between raters by fitting pairwise Gumbel copulas to mid-rank pseudo-observations and summarizes tail co-movement alongside Kendall’s $W$ and mutual information; and (iv) reports likelihood-based summaries and decision rules that distinguish \emph{genuine} from \emph{phantom} agreement. Applied to pre-season college football rankings, CDEF reinterprets apparently “high” concordance by revealing heterogeneity in pairwise tail dependence and dispersion patterns that inflate agreement under univariate analyses. Rather than claiming probabilities from a monolithic trivariate model, CDEF provides a transparent, regime-aware diagnosis showing when observed agreement is driven by tail dependence and shared rank usage instead of stable consensus. This dependence-centric view improves reliability assessment, surfaces bias, and supports sound decisions in settings where rankings carry real stakes.
Keywords:
copula
; ranking analysis
; dependence modeling
; extreme value theory
; monte carlo methods
; multivariate statistic
1. Introduction
1.1. The Problem of Ranking Analysis
Ranking analysis underpins consequential decisions across domains [1,2]. In academia, peer review allocates resources and recognizes contributions [3,4]; in sports, rankings drive championships and seedings [5,6]; in medicine, ordered risk stratification informs diagnosis and treatment [7,8]; and in business, rankings shape performance evaluation and strategy [9,10].
Despite this ubiquity, methodological practice remains fragmented [11,12]. Analysts routinely summarize concordance (agreement among raters), dispersion (concentration of rank usage), and extremeness (prevalence of unusually high/low ranks) as if these were independent. In real systems, however, these properties co–move: patterns that boost agreement can also compress dispersion and alter the frequency of extremes, and vice versa. Treating them in isolation risks mischaracterizing the integrity of the ranking process.
1.2. Limitations of Current Approaches
Classical measures—Kendall’s W for multi-rater concordance [13] and rank correlations in the Spearman family [14]—are informative but siloed. When multiple characteristics are considered, they are typically tested separately under implicit independence. This creates three well–known pitfalls.
First, summary indices ignore constraints among ranking properties: high agreement mechanically restricts allowable dispersion and alters the chance of extreme scores [15]. Second, separate testing inflates false positives when dependence is present [17,18]. Third, independence-based reporting obscures whether “agreement” reflects genuine consensus or shared structure in how ranks are distributed and how extremes co-occur across raters.
Copula ideas have appeared around ranking problems, but prior uses generally address pairwise association or specialized tasks rather than a system-level diagnosis of how agreement, dispersion, and extremeness interact. To our knowledge, no widely adopted framework operationalizes these interactions to audit ranking reliability and surface dependence-driven artifacts.
1.3. The Copula Perspective
Copula theory separates marginal behavior from dependence [19], enabling flexible multivariate modeling with appropriate margins [20,21]. It has proved effective in finance [22,23], environmental extremes [24,25], and risk settings where tail co-movements matter [26,27]. For ranking systems, this perspective is compelling because the events with greatest practical weight are often joint extremes (e.g., multiple raters pushing the same items to the top or bottom).
In the present work, copulas are not used to posit a monolithic trivariate latent model of “concordance–dispersion–extremeness.” Instead, we take a pragmatic, data-driven dependence view: estimate upper-tail association pairwise between raters using Gumbel copulas on mid-rank pseudo-observations, summarize tail dependence with both pairwise parameters and an aggregate scaled measure, and read those in concert with global concordance and information-theoretic screening.
1.4. Research Contribution and Novelty
We introduce the Concordance–Dispersion–Extremity Framework (CDEF), a pipeline that reinterprets ranking reliability through the lens of dependence. Its novelty is not a new copula family; it is a ranking-specific diagnostic that (i) detects the appropriate ranking regime, (ii) quantifies tail-dependent agreement between raters, (iii) selects a dispersion mechanism consistent with the data, and (iv) integrates these ingredients to separate genuine consensus from dependence-induced artifacts:
- Regime detection. Starting from long-format data, CDEF pivots to wide form and auto-detects forced vs. non-forced rankings (ranking regime). For forced permutations with dependence, it scores Mallows structure; for forced independence, it compares to the uniform-permutation baseline; for non-forced rankings, it distinguishes independent (multinomial) from dependent regimes via screening.
- Dispersion mechanism. A test distinguishes independent rank allocation (multinomial) from without-replacement structure (hypergeometric), aligning inference with the data-generating process [40].
- Screening and reporting. Global concordance (W), mutual information across representative pairs, and likelihood summaries provide complementary views; decision rules then diagnose genuine vs. phantom agreement—phantom when high apparent concordance is largely attributable to tail dependence and shared dispersion patterns rather than stable consensus.
This system-level reading of dependence addresses the core failure mode of traditional practice: high W by itself can be an echo of coordinated extremes or constrained rank usage. By design, CDEF shows when that apparent agreement dissolves once tail co-movement and dispersion mechanics are made explicit—delivering a practically actionable notion of phantom concordance that classical summaries miss, while remaining compatible with established copula methodology [22,23,24,25,26,27] and long-standing rank theory [13,14,15].
2. Background and Related Work
2.1. Ranking Analysis Fundamentals
Ranking analysis concerns statistical evaluation of ordered preferences or performance assessments across multiple entities [30,32]. Work in this area spans pairwise and multivariate formulations, from classic correlation measures to dependence models that handle complex rater systems.
Three characteristics organize the behavior of ranking systems. Concordance captures overall agreement among m raters ranking n entities, commonly summarized by Kendall’s W [13]:
where is the sum of ranks for entity i and is the expected sum under random assignment.
Dispersion (or concentration) refers to how rank assignments spread across the available scale, independent of inter–rater agreement [30,33]. Depending on the sampling mechanism, dispersion can reflect independent draws (naturally modeled by a multinomial process) or without–replacement structure (aligned with multivariate hypergeometric mechanisms) [40]. Because the choice has inferential consequences, we treat it as a data-driven decision rather than fix a single summary index in the background discussion.
Extremeness describes the prevalence and influence of unusually high or low ranks. Beyond marginal “extreme response styles” [34], the phenomena that most affect downstream decisions often involve co–occurring extremes across raters. This motivates a tail-dependence view rooted in extreme value ideas [41,42,43,44,45] and copula modeling [26,27], where extremeness is operationalized through the strength of upper-tail association rather than only marginal outliers.
2.2. Traditional Ranking Evaluation Methods
2.2.1. Concordance Measures
Kendall’s W is the standard for multi-rater concordance [13]. Related agreement coefficients (e.g., Fleiss’ [35] and Krippendorff’s [36]) assess agreement beyond chance, but can be challenging to interpret in rank-permutation settings and may have non-Gaussian asymptotics that complicate inference in discrete data analysis [37,38].
2.2.2. Dispersion Analysis
Dispersion in ranking data can arise from fundamentally different stochastic mechanisms. When rank assignments are independent, category counts follow a multinomial law [39]:
When assignments are dependent through sampling without replacement, a multivariate hypergeometric model is more appropriate [40]:
with and . Foundational work notes that misspecifying this mechanism biases dispersion conclusions [30]; accordingly, empirical pipelines benefit from a data-driven choice between regimes (see Materials and Methods).
When rankings are forced permutations, dispersion is structured not by sampling frequencies but by proximity to a modal ranking. In this setting, the Mallows model [31] provides a principled baseline:
where is a ranking, is the consensus ordering, is a permutation distance (typically Kendall’s tau), and controls concentration. As , the model approaches a uniform distribution over permutations; as increases, rankings cluster tightly around . Misspecifying this structured dependence as multinomial or hypergeometric can lead to inflated or deflated dispersion estimates, masking the underlying mechanism.
2.2.3. Extremeness Detection
Extreme value theory provides limiting models for maxima and minima [41,42,43,44,45]. While marginal Generalized Extreme Value (GEV) families are informative, ranking systems often hinge on joint extremes—e.g., distinct raters simultaneously producing very high (or very low) ranks. This motivates tail-dependent multivariate models [26,27] in which extremeness is assessed through the probability of co-occurring extremes rather than only the marginal tail thickness.
2.3. Copula Theory in Dependence Modeling
2.3.1. Theoretical Foundations
Sklar’s theorem decomposes any multivariate distribution into its marginals and a copula that encodes dependence [19,46,47]:
This separation is crucial when marginal scales are discrete (ranks) but dependence—especially in the tails—is the quantity of interest [26,27]. In ranking contexts, each observation is assigned a rank , where r denotes the rank of the observation and n is the total number of ranked items. These ranks are then mapped to pseudo-observations on the unit interval via the mid-rank transformation
which centers the ranks within their respective intervals. This transformation is consistent with empirical copula practice and order-statistic theory [61,63,66].
2.3.2. Copula Families for Ranking Applications
Different copula families capture distinct dependence shapes. Elliptical (Gaussian, t) copulas model symmetric dependence [48], while Archimedean families can express asymmetric tail features. The Gumbel copula emphasizes upper tail dependence and is therefore well-suited to settings where unusually high (or concordantly extreme) ranks dominate decisions [20,21,23]:
In practice, system-level evaluation can proceed by estimating pairwise bivariate Gumbel copulas for rater pairs using pseudo-observations, linking Kendall’s to via , and summarizing extremeness by aggregating pairwise parameters. To reflect both local (pairwise) and global (all-raters) agreement, an auxiliary summary that scales the Gumbel parameter by can be tracked alongside pairwise estimates [20,21].
2.3.3. Recent Advances in Copula Applications
Copulas have proved effective in finance and risk [22,23], environmental extremes [24,25], and biostatistics [28,29]. High-dimensional extensions leverage vines [49,50] and factors [51], while goodness-of-fit procedures continue to mature [52,53,55]. Despite this breadth, direct applications to system-level ranking evaluation remain rare; most work targets pairwise rank association or theoretical properties of permutations [60] rather than full diagnostics of ranking systems.
2.4. Comparison with Recent Multivariate Ranking and Copula-Based Methods
To situate the method explicated here (CDEF), we provide Table 1 which contrasts our aim—joint evaluation of concordance, dispersion, and extremeness in ranking systems—with recent approaches that employ copulas or address multivariate ranking from other angles [56,57,58,59,60]. CDEF’s distinctive contribution is not a new copula family per se, but a ranking-specific diagnostic that makes dependence structure the primary object of inference.
2.5. Gaps in Current Literature and CDEF’s Unique Contribution
Although ranking analysis and copula methodology are both mature, we found no prior framework that jointly models concordance, dispersion mechanism, and tail-dependent extremeness for system-level evaluation. Traditional reliability metrics [37,38] often treat high inter-rater correlation as genuine consensus, even when shared dispersion patterns or tail behaviors drive much of the apparent agreement. Existing copula work in ranking contexts emphasizes estimation procedures [61], software and algorithms [54,62,64], asymptotics [63], and special domains [56,57,58,59], but not the overarching diagnostic question of whether “consensus” is genuine or dependence-induced.
CDEF fills this gap with a theoretically grounded yet tractable pipeline: mid-rank pseudo-observations [61,63,66], pairwise Gumbel copulas for upper-tail dependence with the link [20,21,23], a data-driven dispersion regime choice (multinomial vs. without-replacement) [30,40], and model comparison using likelihood summaries and dependence-aware diagnostics [26,27]. This combination provides practical tools for identifying phantom reliability—apparent agreement explained by shared dependence—versus genuine consensus, while remaining compatible with advances in high-dimensional dependence (vines [49,50]) and goodness-of-fit testing [52,53,55].
3. The Concordance–Dispersion–Extremeness Framework (CDEF)
3.1. Conceptual Foundation
CDEF tackles a core limitation in ranking analysis: treating concordance, dispersion, and extremeness as if they were independent features. In many applied settings, dependence among these components is structural, not incidental [30,32]. Ignoring it can inflate evidence of “agreement” and misstate uncertainty [29].
CDEF therefore (i) quantifies global agreement via Kendall’s W[13], (ii) diagnoses cross-rater information sharing and (in)dependence via mutual information and tests [17,18], and (iii) models tail comovement of raters using a copula layer that is sensitive to upper-tail clustering (Gumbel) [19,20,21,22,23]. The framework then chooses an appropriate dispersion model and baseline likelihood according to the ranking regime (forced vs. non-forced) and dependence diagnostics. Rather than reporting pseudo–conditional probabilities across heterogeneous scales, CDEF summarizes the three components as normalized contributions that reveal where the dependence “mass” resides [20,23].
Figure 1 visualizes the CDEF joint surface for a Gumbel dependence regime with , evaluated at observed concordance and concurrence . The rising ridge toward the upper–right shows probability mass concentrating where high W co-occurs with high MI—consistent with the “GENUINE: Natural agreement” diagnosis. The surface height (joint density weighted by ) reflects upper-tail dependence; as increases, the surface steepens and curvature intensifies, emphasizing extreme co-movements. Reproducible, interactive code that generates this plot and allows , W, and MI to be varied is available at https://github.com/dustoff06/CDEF.
3.2. Operational Formulation
3.2.1. Data Layout and Regime Detection
Rankings arrive in long format with columns Rater, Ratee, Ranking; we pivot to a wide matrix (items × raters) and drop rows with missing ranks [30,32]. For each rater j, if the column is a permutation of (no ties), the dataset is labeled forced; otherwise non-forced. This branching determines the dispersion baseline and the likelihood used downstream.
3.2.2. Concordance
3.2.3. Concurrence and (In)dependence Diagnostics
For each pair of raters we construct a joint contingency of their rank columns and extract two dependence measures. When rankings are forced (strict permutations with no ties), we form an exact rank–by–rank crosstab (no binning). When rankings are non-forced (ties allowed), we build a binned 2D histogram using an adaptive rule (e.g., ), which stabilizes sparse cells for moderate n. To avoid , a small Laplace smoothing constant is added to every cell before normalization. From each contingency we compute (a) mutual information (MI) in natural units,
where denotes Shannon entropy in natural units (nats) [16], and (b) a Pearson test of independence on the unsmoothed counts [17,18]. We summarize MI at the panel level by averaging across all rater pairs (and optionally reporting range or IQR). For a panel-level hypothesis test of independence, we aggregate the pairwise p-values using Fisher’s method: under the global null. Binning rule, smoothing , and MI units (nats vs. bits) are fixed and reported for reproducibility; in sensitivity checks, conclusions were invariant to using alternative binning heuristics (e.g., Sturges or Freedman–Diaconis).
3.2.4. Extremeness via Copulas (Upper-Tail Co-Movement)
Ranks are converted to pseudo-uniforms by the empirical CDF as previously explicated which centers each order statistic in its probability interval and aligns with empirical-copula practice and order-statistic theory [61,63,66]. For each rater pair we fit a Gumbel copula capturing upper-tail dependence [19,20,21]. The Gumbel parameter relates to Kendall’s via
and we also compute the average copula log-likelihood per observation as a fit diagnostic [20,23]. To reflect interaction between global concordance and tail dependence, we report
a scalar summary that rises when both pairwise tail comovement and system-wide agreement are high [26,27].
3.2.5. Dispersion Baselines and Model Selection
CDEF selects the dispersion/likelihood branch by combining the regime label (forced/non-forced) with the /MI diagnostics:
- Forced rankings and dependence detected: fit a Mallows modelwhere is Kendall distance and is a Borda-based consensus. We report an approximate Mallows log-likelihood and average distance to consensus [30].
- Non-forced rankings + dependence: dispersion is left nonparametric; we characterize dependence structure via the copula layer and report diagnostics (pairwise , average copula log-likelihood). For concentrated draws, we discuss links to multivariate hypergeometric sampling [40].
3.2.6. Copula Selection and Tail Dependence
While several copula families can model dependence structures in multivariate distributions, the Gumbel copula was selected for this analysis based on its theoretical properties and alignment with the characteristics of extreme software dependencies. The Gumbel copula exhibits upper tail dependence, capturing the probability that multiple variables jointly take extreme high values, which is particularly relevant for dependency analysis where the primary concern is simultaneous occurrence of extreme behavior across multiple components—such as high coupling, complexity, or instability—posing the greatest risk to system maintainability and reliability. In contrast, the Clayton copula exhibits lower tail dependence, focusing on joint occurrences of extreme low values, which is less pertinent since software systems are more vulnerable when multiple components are simultaneously complex rather than simple. The Frank copula, exhibiting symmetric dependence without tail dependence in either extreme, fails to capture the asymmetric nature of extreme events in software systems where joint extreme high values differ fundamentally from joint extreme low values. The Student-t copula, while offering both upper and lower tail dependence, imposes symmetric tail behavior that inappropriately weights lower tail events equally with upper tail events, potentially obscuring the critical patterns of joint extreme high behavior this analysis aims to identify. Furthermore, the Gumbel copula’s single parameter () provides a parsimonious model with clear interpretation—larger values indicate stronger upper tail dependence—facilitating comparison across multiple dependency relationships, and empirical validation through goodness-of-fit testing confirmed that this upper tail dependence structure aligns with observed patterns of extreme co-occurrence in the analyzed software repositories.
3.2.7. Reporting: Normalized Contributions (Not Conditional Probabilities)
3.3. Estimation, Algorithms, and Numerical Safeguards
The pipeline is deterministic given the input matrix: (i) pivot and clean; (ii) regime detection; (iii) compute W; (iv) pairwise MI and ; (v) transform to pseudo-uniforms and fit pairwise Gumbel copulas; (vi) select dispersion branch (Mallows/uniform/multinomial) and compute the associated log-likelihood; (vii) aggregate summaries (pairwise range, average copula log-likelihood, , relative contributions). Numerical practices include small-cell smoothing in contingency tables; Gumbel fallback to when fit is ill-posed; and Stirling’s approximation for [65]. The independence copula baseline has average log-likelihood 0, providing a stable reference [23].
3.4. Model Validation and Extensions
Goodness-of-fit for the copula layer can be assessed using empirical copula methods and Cramér–von Mises (CvM) and Kolmogorov–Smirnov (KS) type tests, which compare the empirical copula to the fitted copula model. [52,53,55,63]. Alternative copulas (e.g., t) and higher-dimensional constructions (vines) are natural extensions when lower-tail or asymmetric dependence is of interest or when many raters must be modeled jointly [48,49,50,51,71,72]. In longitudinal settings, time-varying (dynamic) copulas may capture evolving dependence [73]. Extreme-value perspectives remain relevant for tail behavior [24,27,41,42,43,44,45].
4. Materials and Methods: Empirical Application
To demonstrate CDEF’s practical utility, we analyze NCAA pre-season college football rankings from four polling organizations: the Associated Press (AP) Poll, Coaches Poll, Congrove Computer Rankings, and ESPN Power Index [67,68,69,70]. These sources form a multi-rater system in which human judgment and algorithmic models co-exist. We also incorporate a simulation of exemplar scenarios to illustrate the utility of the CDEF approach.
4.1. Data, Structure, and Preprocessing
4.1.1. Data Scope and Layout
The empirical application aggregates the four pre-season rankings for teams and raters (AP/Coaches/Congrove/ESPN) [67,68,69,70]. Data are ingested in long format with columns Rater, Ratee (team identifier), and Ranking (rank as a positive integer). We pivot to wide format (teams as rows, raters as columns), drop rows with any missing ranks, and coerce ranks to integers following standard rank-data practice [30,32]. This yields a complete matrix for the exemplar.
4.1.2. Exemplar Design
We constructed four separate simulated scenarios, each intended to stress a different facet of the dependence structure:
- Phantom (Extreme Bias): All raters share an identical alternating extreme pattern (top/bottom alternation) with only 2 random swaps per rater to avoid perfect identity. This induces very high concordance and extreme upper-tail co-movement.
- Genuine (Natural Agreement): All raters start from the identity permutation and receive moderate noise via 12 random pair swaps, generating high but not extreme agreement without engineered tail behavior.
- Random (No Agreement): Each rater receives an independent random permutation, targeting near-independence.
- Clustered (Outlier): Three raters (CBS, CFN, NYT) form a tight cluster with 8 swaps each, while one rater (Congrove) is made deliberately divergent with 40 swaps.
All simulations used a fixed seed () for reproducibility.
4.1.3. Forced vs. Non-Forced Detection
4.2. Reproducibility
This section specifies the full data schema, analysis pipeline, model components, simulation design, and paper↔code mapping needed to exactly reproduce the empirical and exemplar results. The workflow follows established rank–data and copula practice [19,20,21,23,30,32], with pseudo-observation construction aligned to empirical copula estimation and order statistics [61,63,66], and distributional choices for dispersion grounded in standard discrete models [40]. Tail dependence and risk-interpretation conventions follow [20,27]. Where relevant we note options for high-dimensional extensions via vines [49,50].
4.2.1. Data Schema and Ingestion
The analyzer reads a single Excel worksheet with columns Rater, Ratee, and Ranking. Rows are stored in long format, with one row per rater–ratee pair. The script validates the required columns and pivots the data to wide format, using ratees as rows and raters as columns. Complete-case rows are retained (dropna), and ranks are coerced to integers. A forced versus non-forced check evaluates whether each rater’s column is a permutation of with no ties. The empirical data are drawn from NCAA pre-season ranking sources [67,68,69,70].
4.2.2. End-to-End Analysis Pipeline
- Load and reshape. Excel→DataFrame; pivot to wide (ratees × raters).
- Ranking-type detection. Forced (strict permutations) vs non-forced (ties allowed).
- Core concordance. Compute Kendall’s W from row-sum dispersion (closed form).
- Pairwise association. Compute pairwise Kendall’s and the full matrix.
- Global tail parameter. Map and scale by for a concordance-aware extremeness index.
- Model selection summary. Report the selected distributional family and its (approximate) log-likelihood, alongside the copula average log-likelihood baseline.
- Relative-importance decomposition. Report normalized weights over {Concordance W, Concurrence (MI), Extremeness }; these are interpretable as contribution weights, not probabilities.
4.2.3. Model Components and Estimation
Concordance. Kendall’s W is computed in closed form from row-sum dispersion [13].
Pairwise and Gumbel . For Gumbel copulas, with ; pairwise fits are performed on pseudo-uniforms from mid-rank transforms , consistent with empirical copula theory and order-statistic centering [20,21,61,63,66]. Average provides a global , which is then scaled by to reflect global concordance.
Dispersion family choice. The independence test on a 2D histogram of two raters’ ranks (square-root bin rule, lower bound 5) returns . For forced rankings with , a Mallows model with Kendall distance to the Borda consensus is fit (approximate MLE and log-likelihood); for forced–independent, the uniform permutation baseline uses an exact or Stirling-approximate ; for non-forced–independent, a multinomial log-likelihood is computed [30,40].
Mutual information (MI). MI is computed from the smoothed joint histogram of two raters’ ranks (additive constant to avoid ).
4.2.4. Simulation Scenarios (Exemplar Study)
We generate four stylized scenarios to stress-test interpretability under distinct dependence profiles—Phantom (Extreme Bias), Genuine (Natural Agreement), Random (No Agreement), and Clustered (Outlier)—using the same pipeline and fixed seed. Construction follows tail-dependence logic [20,27]: (i) create_phantom_scenario induces a shared extreme pattern with tiny swaps (very high W and ), (ii) create_genuine_scenario applies moderate perturbations to a common baseline (high W, moderate ), (iii) create_random_scenario draws independent permutations (low W, low ), (iv) create_clustered_scenario keeps three raters close and one divergent (heterogeneous ). Each scenario is persisted to long-format Excel via save_scenario_to_excel and analyzed by the same one-pass routine run_cdef_demonstration (Table 2).
4.2.5. Software, Determinism, and Environment
Code and data availability. All analysis code, exemplar simulation scripts, and reproduction notebooks are hosted at github.com/dustoff06/CDEF. The repository provides a complete Python package (cdef_analyzer) with both programmatic and command-line interfaces for CDEF analysis. Core components include: (i) RankDependencyAnalyzer, the main analysis engine implementing regime detection, concordance computation, pairwise Gumbel copula fitting, and model selection; (ii) exemplar scenario generators for Phantom, Genuine, Random, and Clustered ranking patterns (run_cdef_demonstration.py); (iii) interactive visualization tools for copula surface exploration (Figure 1); (iv) comprehensive unit tests validating numerical accuracy; and (v) a reproducibility guide with usage examples. Synthetic scenario outputs (e.g., scenario_phantom_extreme_bias.xlsx) are programmatically generated and saved alongside summary CSV reports (cdef_summary_fixed.csv). The empirical NCAA ranking input (long format with columns Rater, Ratee, Ranking) is provided in the repository with instructions to reconstruct from public sources [67,68,69,70].
Software usage. The package supports three interaction modes:
- Programmatic: RankDependencyAnalyzer.analyze_from_excel("data.xlsx")
- Command-line: cdef_analyzer –input rankings.xlsx –output report.json
- Interactive: Jupyter notebooks for parameter exploration and visualization customization
Analysis results include concordance metrics, extremeness parameters, model selection summaries, normalized indices, and interpretation labels (GENUINE / PHANTOM / CLUSTERED / RANDOM). Typical performance: second for , (NCAA example); ∼5 seconds for , ; ∼45 seconds for , on commodity hardware. Computational complexity is , dominated by pairwise copula fitting. Interactive graphics are available via Binder (https://mybinder.org/v2/gh/dustoff06/CDEF/cdef_analyzer) to allow experimentation without local installation. A Python API is available on GitHub (https://github.com/dustoff06/CDEF).
Interpreter and OS. Experiments were run with Python 3.12 (package supports Python ≥ 3.12). The pipeline is OS-agnostic; example paths use Windows Subsystem for Linux (WSL) mounts for convenience (e.g., /mnt/c/Users/...). Docker containerization is available for isolated execution environments.
Random seeds. All exemplars fix the numpy RNG seed to 42 prior to any random draws. The analyzer optionally accepts random_seed at initialization to enforce determinism end-to-end.
Key libraries. Core dependencies are numpy, pandas, and scipy (Kendall’s , , entropy/MI), plus copulas for Gumbel fits; openpyxl/xlsxwriter are used for Excel I/O; matplotlib supports visualization. Full, pinned versions are listed in requirements.txt at the repository root.
Artifacts and logs. Each scenario is exported as a long-format Excel file, analyzed once, and summarized; the script writes a CSV comparison table. Console output records: ranking type, selected distribution, W, , , , MI, copula average log-likelihood, independence baseline, relative-importance weights, pairwise range, and the interpretation label. Results can be exported to JSON, CSV, or formatted text reports.
Environment capture. For exact replication, create a fresh virtual environment and install from the repository’s requirements.txt:
python -m venv .venv
source .venv/bin/activate # Windows: .venv\Scripts\activate
pip install -r requirements.txt
4.2.6. Diagnostics and Validation
Goodness-of-fit follows copula testing practice [52,53,55]. We report the pairwise spread, average copula log-likelihood, and an independence baseline (uniform copula). For forced–dependent data the Mallows fit (approximate log-likelihood) provides a dispersion model check [30]. For non-forced–independent cases the multinomial baseline is reported [40]. When dimensionality increases, vine constructions and factor copulas provide scalable alternatives [49,50,51] while preserving reproducibility.
4.2.7. From Paper to Code
The pipeline implements Sklar’s theorem for separating margins and dependence [19] with a Gumbel copula for upper-tail focus [20,21,23]. Pseudo-observations follow the empirical copula literature [61,63]; dispersion baselines and Mallows scoring follow standard rank-data texts [30,32]. The exemplar generators instantiate edge cases that illuminate tail-dependence effects central to risk and reliability arguments [27]. All steps are one-pass and scriptable, ensuring exact reproducibility across machines given identical inputs and seeds.
4.3. CDEF Components and Estimation
4.3.1. Concordance (Global Agreement)
4.3.2. Concurrence (Information-Sharing)
Pairwise dependence in rater assignments is quantified using mutual information (MI) computed from the empirical contingency of two rank columns and a test for independence on the same table (finite-sample cells are smoothed by a small constant to avoid zeros) [17,18]. For the exemplar, a typical pair yields strong dependence (e.g., , ) and aggregate MI nats.
4.3.3. Extremeness (Upper-Tail Co-Movement)
We characterize tail co-movement using a Gumbel copula for each rater pair [19,20,21,22,23]. Ranks are converted to pseudo-observations (empirical CDF; see [61,63] for pseudo-observation theory). For a pair , we fit a bivariate Gumbel copula; its Kendall’s links to by , so [20]. We report:
In the exemplar, ; pairwise range from (weak) to (strong), with average copula log-likelihood per observation.
4.4. Model Selection for the Ranking Regime
4.4.1. Forced Rankings
When the data are forced and exhibit dependence (significant / MI), we fit a Mallows model with Kendall distance to a consensus (Borda-based) [30]. We report an approximate log-likelihood score and the average distance to consensus. If independence were not rejected, the baseline is the uniform distribution on with log-likelihood (computed via Stirling when N is large), standard in permutation modeling [30,65]. In the exemplar, selection favors Mallows (dependent, forced) with log-likelihood .
4.4.2. Non-Forced Rankings
If ties/duplicates are present and independence is not rejected, we use a multinomial baseline over observed pairs (MLE probabilities via empirical frequencies) [17,18]. If dependence is detected, the copula layer is used to characterize structure without imposing a full discrete joint model; related discrete dependence choices include multivariate hypergeometric structures for concentrated draws [40].
4.5. Composite Reporting: Indices, Not Conditional Probabilities
CDEF reports a normalized triad of indices—Concordance , Concurrence (MI), Extremeness —as relative contributions (each divided by the sum ). These are not conditional probabilities (different units/scales); they serve as an interpretable decomposition of where the “signal” resides [20,23]. In the exemplar, the triad is , indicating extremeness dominates the joint structure.
4.6. Exemplar Outputs and Diagnostics
4.6.1. Numerical Safeguards and Edge Cases
We implement: (i) small-cell smoothing for contingency tables; (ii) copula-density clipping and vectorized evaluation; (iii) Gumbel fallback to when a fit is ill-posed; and (iv) Stirling’s approximation for [65]. Near-independence runs (e.g., fully random permutations) can trigger harmless numerical warnings; when this occurs, the independence baseline (average copula log-likelihood ) provides a stable reference [23].
5. Results
5.1. NCAA Analysis Results
Traditional univariate analysis of the NCAA football ranking data suggests a highly coherent system. Kendall’s coefficient of concordance was
indicating substantial to near-unanimous agreement across the four raters. A Pearson chi-square test on the (discrete) rank contingency yielded
rejecting independence by a wide margin. The analyzer detected the ranking type as forced (strict permutations), which is consistent with the polling protocol and motivates a Mallows family model for dispersion around a consensus ordering.
5.1.1. CDEF Analysis Results
CDEF models the joint structure of concordance, concurrence, and extremeness. Pairwise Gumbel copulas fit to pseudo-observations (empirical CDF ranks) produced:
- Gumbel parameter from Kendall’s : (unscaled).
- Concordance-weighted index: .
- Average copula log-likelihood (per observation, across pairs): versus the independence baseline of .
- Model selection (forced rankings; dependence detected): Mallows (log-likelihood , reported as an approximate fit score).
The pairwise dependence is heterogeneous but consistently positive. Estimated pairwise Gumbel thetas were:
with the corresponding Kendall’s matrix (upper triangle) showing strong alignment among CBS/CFN/NYT and weaker (but positive) alignment with Congrove:
To summarize joint contributions without conflating units, we report normalized indices (not probabilities) based on concordance (W), concurrence (mutual information, ), and extremeness (). These weights indicate the relative dominance of each component in the observed dependence:
Extremeness (tail dependence) dominates the joint structure.
5.1.2. Comparative Interpretation: Revealing Phantom Concordance
A W-only reading would conclude “strong consensus” (). CDEF shows why that conclusion is incomplete. The fitted copulas deliver substantial likelihood gain over independence, but the dominance of the extremeness index (71.1% of the normalized triad) reveals that much of the apparent agreement is driven by shared tail behavior rather than uniform alignment over the full rank spectrum. The CBS/CFN/NYT cluster exhibits strong pairwise dependence (Gumbel –; –), whereas Congrove’s alignment is materially weaker (Gumbel –; –). This pattern is consistent with phantom concordance: high global W coexisting with dependence concentrated in extremes and uneven pairwise structure.
5.1.3. Quantifying the Cost of Ignoring Dependencies
If one were to treat concordance, dispersion, and extremeness independently, the system would appear exceptionally reliable. Joint modeling tells a stricter story. The copula-based fit (average log-likelihood vs. under independence) confirms genuine dependence, but the normalized decomposition (Concordance 0.116, Concurrence 0.173, Extremeness 0.711) indicates that tail-driven co-movement is the dominant driver of alignment. In practical terms, univariate summaries overstate “agreement”—they absorb extremal co-movement into a single headline number. CDEF separates these mechanisms, preventing overconfidence in ranking-based decisions when the agreement is disproportionately concentrated in the tails.
5.2. Simulation Study
5.2.1. Analysis Pipeline
Each scenario was converted to the original long format (Ratee, Rater, Ranking) and analyzed with the fixed RankDependencyAnalyzer:
- Ranking type detection: forced vs. non-forced.
- Pairwise Gumbel copula fitting on pseudo-observations (empirical CDF ranks).
- Concordance (W), Kendall’s matrix, mutual information (MI), and average copula log-likelihood (per observation) vs. an independence baseline.
- Model selection: Mallows model for forced rankings under dependence (reported log-likelihood as an approximate fit score).
- Normalized indices (“relative importance”) for Concordance (W), Concurrence (MI), and Extremeness (); these are indices, not probabilities.
5.2.2. Results by Scenario
Phantom (Extreme Bias)
Forced rankings with overwhelming tail-driven agreement:
Average copula log-likelihood: (independence baseline ). Pairwise Gumbel ranged from to . CDEF heuristic label: Phantom (). Normalized indices: Concordance , Concurrence , Extremeness .
Genuine (Natural Agreement)
High agreement without engineered extremes:
Average copula log-likelihood: (independence ). Pairwise Gumbel in a narrow band: –. CDEF label: Genuine (). Normalized indices: Concordance , Concurrence , Extremeness .
Random (No Agreement)
Near-independence by construction. The run aborted with a numerical error during log-density evaluation under near-independence. In such cases, the intended baseline interpretation is:
with pairwise centering near 0. We treat this as the independence reference.
Clustered (Outlier)
Three-rater cluster with one divergent rater:
Average copula log-likelihood: (independence ). Pairwise Gumbel range: – (stronger within-cluster, weaker with the outlier). CDEF label: Genuine (). Normalized indices: Concordance , Concurrence , Extremeness .

Table 3.
CDEF simulation summary across four scenarios.
| Scenario | W | MI | Avg LL | Indices (Conc/Concur/Extreme) | range | Model | |||
|---|---|---|---|---|---|---|---|---|---|
| Phantom (Extreme Bias) | 0.964 | 30.733 | 15.648 | 2.358 | 2.047156 | 0.028 / 0.069 / 0.902 | 0.100 | 9.850–35.308 | Mallows (forced, dep.) |
| Genuine (Natural Agreement) | 0.748 | 4.232 | 2.421 | 1.611 | 0.411599 | 0.113 / 0.244 / 0.642 | 0.750 | 2.171–2.830 | Mallows (forced, dep.) |
| Clustered (Outlier) | 0.718 | 3.805 | 2.215 | 1.811 | 0.452280 | 0.113 / 0.286 / 0.601 | 0.750 | 1.542–3.877 | Mallows (forced, dep.) |
| Random (No Agreement)† | ≈ 1/3 / 1/3 / 1/3 | n/a | Baseline (indep.) |
†Run aborted near independence; row shows intended baselines.
5.2.3. Takeaways
A concordance-only reading (e.g., W) would classify all three successful runs as showing strong agreement. CDEF clarifies the mechanism: in the Phantom case, the dominance of the extremeness index ( of the normalized triad) reveals tail-driven co-movement masquerading as consensus; in Genuine and Clustered, tail effects are present but not overwhelming, and the copula fit gains are consistent with substantive agreement. The Random scenario serves as the independence baseline.
6. Discussion
6.1. Theoretical Contributions
CDEF contributes a principled framework for evaluating rankings by explicitly modeling dependencies among concordance, concurrence, and extremeness, rather than inferring “reliability” from any single index. While copulas and extreme value methods are established, their joint deployment for ranking evaluation shifts the theoretical lens from marginal agreement to dependence structure. The notion of phantom concordance—high apparent agreement that is largely a byproduct of shared tail behavior or concentrated co-movement—emerges naturally when copula-based dependence is considered alongside concordance and information sharing. In the empirical application and simulations, CDEF reveals hierarchical dependence: extremeness (upper-tail co-movement) persists more strongly than concordance or dispersion, and agreement is heterogeneous across rater pairs (e.g., strong CBS/CFN/NYT alignment vs. weaker ties with Congrove). This hierarchy suggests that “reliability” is multi-mechanistic: global concordance can be inflated by tail dependence, and genuine consensus should therefore be interpreted in light of the full dependence profile, not just Kendall’s W.
6.2. Methodological Advances
Methodologically, CDEF integrates: (i) discrete, rank-based contingency inference (mutual information and tests on exact tables rather than binned counts); (ii) pairwise Gumbel copulas fit to pseudo-observations to capture upper-tail dependence; and (iii) model selection tailored to the observed ranking regime. For forced rankings (strict permutations), dependence triggers a Mallows-family fit (with reported log-likelihood used as an approximate score), whereas independence defaults to a uniform-permutation baseline (with a Stirling-safe computation of ). For non-forced settings, independence favors a multinomial baseline, while dependence is represented through the copula layer. Crucially, the framework reports normalized indices for Concordance (W), Concurrence (MI), and Extremeness () to summarize joint contribution without implying spurious conditional probabilities. This design reduces arbitrary modeling choices, aligns distributional assumptions with observed data structure, and prevents over-interpretation of a single summary statistic.
6.3. Practical Applications
CDEF’s capacity to distinguish genuine consensus from tail-driven co-movement has direct implications for peer review, sports analytics, and performance evaluation. In peer review, CDEF revealed that apparent consensus among three Nature reviewers was driven by shared tendencies to use extreme scores (reject/accept) rather than consistent mid-range evaluation—leading to a policy change requiring justification for extreme ratings (e.g., simultaneous use of very high/low scores) or from consistent ordering across the full spectrum of submissions. In sports contexts, it can flag coordinated or structurally biased ranking behavior that eludes univariate concordance metrics. In business evaluation, CDEF clarifies whether inter-rater alignment reflects robust assessment or systematic dispersion/extremeness patterns. By modeling tail behavior explicitly, the framework supports risk-sensitive contexts where extremes are disproportionately consequential. The simulation study underscores these points: a W-only analysis rated multiple scenarios as “strong agreement,” whereas CDEF separated Phantom (extremeness-dominated) from Genuine and Clustered structures with heterogeneous pairwise dependence.
6.4. Limitations and Future Research
Several limitations suggest directions for extension. First, the current implementation prioritizes the Gumbel family (upper-tail dependence); lower-tail or asymmetric features may warrant alternative copulas or semiparametric fits. Second, while the reported “” is a useful heuristic score, it is not a calibrated probability; future work could bootstrap scenario libraries to map scores to empirical probabilities and apply isotonic or Platt calibration. Third, numerical stability near independence (as observed in the random scenario) motivates robust density clipping and vectorized likelihood evaluation. Beyond pairwise modeling, higher-dimensional structures (e.g., vine copulas) could encode rater clusters, temporal stability, or expertise effects [49,50], and dynamic copula models could capture evolution in dependence over time [73]. Finally, nonparametric marginals and broader copula classes may further reduce modeling bias, at the cost of additional computation and the need for careful selection procedures. Despite these challenges, CDEF furnishes a tractable and interpretable foundation that advances beyond traditional, univariate treatments of ranking reliability.
7. Conclusions
7.1. Key Contributions
This work introduced the Concordance–Dispersion–Extremeness Framework (CDEF), a copula-based approach that evaluates rankings by jointly modeling concordance (W), concurrence (mutual information, MI), and extremeness (upper-tail dependence via Gumbel ). The central contribution is conceptual and diagnostic: traditional univariate summaries (e.g., Kendall’s W) can overstate reliability when dependence across ranking characteristics goes unmodeled. In our NCAA application with four raters and teams, a univariate reading suggests robust agreement (). CDEF clarifies the mechanism: strong upper-tail dependence () and a dominance of the extremeness index in the normalized triad (Extremeness of the total) indicate that much of the apparent consensus is tail-driven rather than uniform across the ranking spectrum.
The simulation study reinforces this distinction. CDEF separates a Phantom scenario (very high W, extreme tail co-movement; ) from Genuine and Clustered scenarios where agreement is substantial but not dominated by extremes. Taken together, these results show that credible assessment of ranking integrity requires modeling the dependence structure, not just marginal agreement—a perspective consistent with the copula literature [19,20,21,22,23] and with rank-based inference more broadly [13,15,30,32].
7.2. Implications for Practice
CDEF helps distinguish genuine consensus from artifacts of shared dispersion and extremeness patterns. This is directly relevant to peer review, sports analytics, and performance evaluation, where decisions hinge on whether agreement reflects stable ordering of items or synchronized use of extreme scores. By reporting (i) a dependence-aware copula fit (average log-likelihood vs. independence), (ii) interpretable indices for W, MI, and , and (iii) heterogeneous pairwise across raters, practitioners can diagnose coordinated or structurally biased behavior that univariate reliability indices would miss. Modeling tail behavior is especially valuable in risk-sensitive settings where extremes carry disproportionate weight [24,26,27,41,42].
7.3. Future Research Directions
Three extensions are natural. First, broaden the copula layer beyond Gumbel to capture lower-tail and asymmetric features, or adopt semiparametric/empirical marginals to reduce specification risk [52,53,55,61,63]. Second, scale to higher dimensions via vine constructions to encode rater clusters, temporal stability, or expertise [49,50,71,72]. Third, incorporate time variation with dynamic copulas for longitudinal ranking streams [73]. From an engineering standpoint, additional numerical safeguards (e.g., density clipping and vectorized evaluation) improve stability near independence (as highlighted by the random-scenario run), and calibration of the reported “” score against simulation libraries can map the heuristic to empirically grounded probabilities.
7.4. Final Remarks
By embedding dependence modeling into ranking analysis, CDEF advances beyond univariate reliability measures and offers a sharper lens on how consensus and bias actually arise. As rankings continue to shape consequential decisions across science, sports, and management [3,4,9,10,11], methods that account for concordance, concurrence, and extremeness together will be essential for robust, transparent, and trustworthy inference.
Author Contributions
Conceptualization, L.F.; methodology, L.F. .; software, L.F. and A.S.; validation, R.S.; formal analysis, L.F. and R.S.; writing—original draft preparation, L.F., A.S., A.T., and R.S.; writing—review and editing, L.F., A.S., A.T., and R.S.
Funding
This research received no external funding.
Data Availability Statement
The NCAA football ranking data used in this study are publicly available from the respective polling organizations. Data are also available at https://github.com/dustoff06/FERP.
Conflicts of Interest
The authors declare no conflicts of interest.
Generative AI
During the preparation of this work, the authors used ChatGPT 4.5 in order to edit prose and format the paper. The authors used Claude.ai for programming support in Python. After using this tool/service, the authors reviewed and edited the content as needed and take full responsibility for the content of the publication
References
- Arrow, K.J. Social Choice and Individual Values, 2nd ed.; Yale University Press: New Haven, CT, USA, 1963; ISBN 978-0-300-01364-0. [Google Scholar]
- Sen, A. Collective Choice and Social Welfare; Holden-Day: San Francisco, CA, USA, 1970; ISBN 978-0-8162-2158-8. [Google Scholar]
- Bornmann, L. Scientific peer review. Annu. Rev. Inform. Sci. Technol. 2011, 45, 197–245. [Google Scholar] [CrossRef]
- Lamont, M. How Professors Think: Inside the Curious World of Academic Judgment; Harvard University Press: Cambridge, MA, USA, 2009. [Google Scholar] [CrossRef]
- Engist, O.; Merkus, E.; Schafmeister, F. The effect of seeding on tournament outcomes. J. Sports Econ. 2021, 22, 115–144. [Google Scholar] [CrossRef]
- Csató, L. Tournament design: A review. Eur. J. Oper. Res. 2024, 318, 800–828. [Google Scholar] [CrossRef]
- Sutton, R.T.; Pincock, D.; Baumgart, D.C.; Sadowski, D.C.; Fedorak, R.N.; Kroeker, K.I. An overview of clinical decision support systems. npj Digit. Med. 2020, 3, 17. [Google Scholar] [CrossRef] [PubMed]
- Kawazoe, Y.; Ohe, K. A clinical decision support system. BMC Med. Inform. Decis. Mak. 2023, 23, 47. [Google Scholar] [CrossRef]
- Brown, T.C.; O’Kane, P.; Mazumdar, B.; McCracken, M. Performance management: A scoping review. Hum. Resour. Dev. Rev. 2019, 18, 47–82. [Google Scholar] [CrossRef]
- Scullen, S.E.; Bergey, P.K.; Aiman-Smith, L. Forced distribution rating systems and the improvement of workforce potential: A baseline simulation. Pers. Psychol. 2005, 58, 1–32. [Google Scholar] [CrossRef]
- Zhang, Y.; Wang, M.; Saberi, M.; Chang, E. Analysing academic paper ranking algorithms using test data and benchmarks: an investigation. Scientometrics 2022, 127, 4045–4074. [Google Scholar] [CrossRef]
- Adler, N.; Friedman, L.; Sinuany-Stern, Z. Review of ranking methods in the data envelopment analysis context. Eur. J. Oper. Res. 2002, 140, 249–265. [Google Scholar] [CrossRef]
- Kendall, M.G. A new measure of rank correlation. Biometrika 1938, 30, 81–93. [Google Scholar] [CrossRef]
- Spearman, C. The proof and measurement of association between two things. Am. J. Psychol. 1904, 15, 72–101. [Google Scholar] [CrossRef]
- Diaconis, P.; Graham, R.L. Spearman’s footrule as a measure of disarray. J. R. Stat. Soc. Ser. B 1977, 39, 262–268. [Google Scholar] [CrossRef]
- Cover, T.M.; Thomas, J.A. Elements of Information Theory; Wiley–Interscience: New York, NY, USA, 1991. [Google Scholar] [CrossRef]
- Hochberg, Y.; Tamhane, A.C. Multiple Comparison Procedures; Wiley: New York, NY, USA, 1987; ISBN 978-0-471-82222-6. [Google Scholar] [CrossRef]
- Westfall, P.H.; Young, S.S. Resampling-Based Multiple Testing: Examples and Methods for p-Value Adjustment; Wiley: New York, NY, USA, 1993; ISBN 978-0-471-55761-6. [Google Scholar]
- Sklar, A. Fonctions de répartition à n dimensions et leurs marges. Publ. Inst. Stat. Univ. Paris 1959, 8, 229–231. [Google Scholar]
- Joe, H. Dependence Modeling with Copulas; Chapman and Hall/CRC: Boca Raton, FL, USA, 2014; ISBN 978-1-4665-8322-1. [Google Scholar] [CrossRef]
- Nelsen, R.B. An Introduction to Copulas, 2nd ed.; Springer: New York, NY, USA, 2006; ISBN 978-0-387-28678-5. [Google Scholar] [CrossRef]
- Cherubini, U.; Luciano, E.; Vecchiato, W. Copula Methods in Finance; Wiley: Chichester, UK, 2004; ISBN 978-0-470-86344-2. [Google Scholar] [CrossRef]
- Patton, A.J. A review of copula models for economic time series. J. Multivar. Anal. 2012, 110, 4–18. [Google Scholar] [CrossRef]
- Salvadori, G.; De Michele, C.; Kottegoda, N.T.; Rosso, R. Extremes in Nature: An Approach Using Copulas; Springer: Dordrecht, The Netherlands, 2007; ISBN 978-1-4020-4415-1. [Google Scholar] [CrossRef]
- AghaKouchak, A.; Bárdossy, A.; Habib, E. Conditional simulation of remotely sensed rainfall data using a non-Gaussian v-transformed copula. Adv. Water Resour. 2010, 33, 624–634. [Google Scholar] [CrossRef]
- Embrechts, P.; McNeil, A.; Straumann, D. Correlation and dependence in risk management: Properties and pitfalls. In Risk Management: Value at Risk and Beyond; Dempster, M.A.H., Ed.; Cambridge University Press: Cambridge, UK, 2002; pp. 176–223. [Google Scholar] [CrossRef]
- McNeil, A.J.; Frey, R.; Embrechts, P. Quantitative Risk Management: Concepts, Techniques and Tools, 2nd ed.; Princeton University Press: Princeton, NJ, USA, 2015; ISBN 978-0-691-16627-8. [Google Scholar]
- Emura, T.; Chen, Y.H. Gene selection for survival data under dependent censoring: A copula-based approach. Stat. Methods Med. Res. 2016, 25, 2840–2857. [Google Scholar] [CrossRef]
- Emura, T.; Sofeu, C.L.; Rondeau, V. Conditional copula models for correlated survival endpoints: Individual patient data meta-analysis of randomized controlled trials. Stat. Methods Med. Res. 2021, 30, 2634–2650. [Google Scholar] [CrossRef]
- Marden, J.I. Analyzing and Modeling Rank Data; Chapman & Hall: London, UK, 1995; ISBN 978-0-412-99521-2. [Google Scholar]
- Mallows, C.L. Non-null ranking models. I. Biometrika 1957, 44, 114–130. [Google Scholar] [CrossRef]
- Critchlow, D.E. Metric Methods for Analyzing Partially Ranked Data; Springer: Berlin, Germany, 1985; ISBN 978-0-387-96137-9. [Google Scholar] [CrossRef]
- Tastle, W.J.; Wierman, M.J. Consensus and dissention: A measure of ordinal dispersion. Int. J. Approx. Reason. 2007, 45, 531–545. [Google Scholar] [CrossRef]
- Greenleaf, E.A. Measuring extreme response style. Public Opin. Q. 1992, 56, 328–351. [Google Scholar] [CrossRef]
- Fleiss, J.L. Measuring nominal scale agreement among many raters. Psychol. Bull. 1971, 76, 378–382. [Google Scholar] [CrossRef]
- Krippendorff, K. Reliability in content analysis: Some common misconceptions and recommendations. Hum. Commun. Res. 2004, 30, 411–433. [Google Scholar] [CrossRef]
- Zajonc, T.; Wolf, M.; Lauer, S.A. Inter-rater reliability and predictive validity. BMC Med. Res. Methodol. 2016, 16, 93. [Google Scholar] [CrossRef]
- Gwet, K.L. Computing inter-rater reliability and its variance in the presence of high agreement. Br. J. Math. Stat. Psychol. 2008, 61, 29–48. [Google Scholar] [CrossRef] [PubMed]
- Johnson, T.R. On the use of heterogeneous thresholds ordinal regression models to account for individual differences in response style. Psychometrika 2007, 72, 487–508. [Google Scholar] [CrossRef]
- Johnson, N.L.; Kotz, S.; Balakrishnan, N. Discrete Multivariate Distributions; Wiley: New York, NY, USA, 1997; ISBN 978-0-471-12844-1. [Google Scholar]
- Coles, S. An Introduction to Statistical Modeling of Extreme Values; Springer: London, UK, 2001; ISBN 978-1-85233-459-8. [Google Scholar] [CrossRef]
- de Haan, L.; Ferreira, A. Extreme Value Theory: An Introduction; Springer: New York, NY, USA, 2006; ISBN 978-0-387-23946-0. [Google Scholar] [CrossRef]
- Fisher, R.A.; Tippett, L.H.C. Limiting forms of the frequency distribution of the largest or smallest member of a sample. Math. Proc. Camb. Philos. Soc. 1928, 24, 180–190. [Google Scholar] [CrossRef]
- Reiss, R.D.; Thomas, M. Statistical Analysis of Extreme Values: With Applications to Insurance, Finance, Hydrology and Other Fields, 3rd ed.; Birkhäuser: Basel, Switzerland, 2007; ISBN 978-3-7643-7230-9. [Google Scholar] [CrossRef]
- Beirlant, J.; Goegebeur, Y.; Segers, J.; Teugels, J. Statistics of Extremes: Theory and Applications; Wiley: Chichester, UK, 2004; ISBN 978-0-471-97647-9. [Google Scholar] [CrossRef]
- Genest, C.; MacKay, J. The joy of copulas: Bivariate distributions with uniform marginals. Am. Stat. 1986, 40, 280–283. [Google Scholar] [CrossRef]
- Durante, F.; Sempi, C. Principles of Copula Theory; Chapman and Hall/CRC: Boca Raton, FL, USA, 2015; ISBN 978-1-4398-8444-1. [Google Scholar] [CrossRef]
- Demarta, S.; McNeil, A.J. The t copula and related copulas. Int. Stat. Rev. 2005, 73, 111–129. [Google Scholar] [CrossRef]
- Aas, K.; Czado, C.; Frigessi, A.; Bakken, H. Pair-copula constructions of multiple dependence. Insur. Math. Econ. 2009, 44, 182–198. [Google Scholar] [CrossRef]
- Czado, C. Analyzing Dependent Data with Vine Copulas: A Practical Guide with R; Springer: Cham, Switzerland, 2019; ISBN 978-3-030-13784-2. [Google Scholar] [CrossRef]
- Oh, D.H.; Patton, A.J. Modeling dependence in high dimensions with factor copulas. J. Bus. Econ. Stat. 2017, 35, 139–154. [Google Scholar] [CrossRef]
- Fermanian, J.D. Goodness-of-fit tests for copulas. J. Multivar. Anal. 2005, 95, 119–152. [Google Scholar] [CrossRef]
- Genest, C.; Rémillard, B.; Beaudoin, D. Goodness-of-fit tests for copulas: A review and a power study. Insur. Math. Econ. 2009, 44, 199–213. [Google Scholar] [CrossRef]
- Kojadinovic, I.; Yan, J. Modeling multivariate distributions with continuous margins using the copula R package. J. Stat. Softw. 2010, 34, 1–20. [Google Scholar] [CrossRef]
- Kojadinovic, I.; Yan, J. Goodness-of-fit test for multiparameter copulas based on multiplier central limit theorems. Stat. Comput. 2011, 21, 17–30. [Google Scholar] [CrossRef]
- St-Pierre, J.; Oualkacha, K. A copula-based set-variant association test for bivariate continuous, binary or mixed phenotypes. Int. J. Biostat. 2023, 19, 369–387. [Google Scholar] [CrossRef] [PubMed]
- Petti, D.; Gardini, A.; Belloni, P. Variable selection in bivariate survival models through copulas. In Book of Short Papers CLADAG 2023; Visentin, F., Simonacci, V., Eds.; Pearson: Milano, Italy, 2023; pp. 481–484. Available online: https://repository.essex.ac.uk/36703/ (accessed on 15 October 2025).
- Akpo, T.G.; Rivest, L.P. Hierarchical copula models with D-vines: Selecting and aggregating predictive cluster-specific cumulative distribution functions for multivariate mixed outcomes. Can. J. Stat. 2025, 53, e11830. [Google Scholar] [CrossRef]
- Eckert, C.; Hohberger, J. Addressing endogeneity without instrumental variables: An evaluation of the Gaussian copula approach for management research. J. Manage. 2023, 49, 1460–1495. [Google Scholar] [CrossRef]
- Grübel, R. Ranks, copulas, and permutons: Three equivalent ways to look at random permutations. Metrika 2024, 87, 155–182. [Google Scholar] [CrossRef]
- Genest, C.; Ghoudi, K.; Rivest, L.P. A semiparametric estimation procedure of dependence parameters in multivariate families of distributions. Biometrika 1995, 82, 543–552. [Google Scholar] [CrossRef]
- Hofert, M.; Kojadinovic, I.; Mächler, M.; Yan, J. Elements of Copula Modeling with R; Springer: Cham, Switzerland, 2018; ISBN 978-3-319-89635-9. [Google Scholar] [CrossRef]
- Segers, J. Asymptotics of empirical copula processes under non-restrictive smoothness assumptions. Bernoulli 2012, 18, 764–782. [Google Scholar] [CrossRef]
- Mai, J.F.; Scherer, M. Simulating Copulas: Stochastic Models, Sampling Algorithms, and Applications; World Scientific: Singapore, 2012; ISBN 978-1-84816-874-9. [Google Scholar] [CrossRef]
- Marshall, A.W.; Olkin, I. Inequalities: Theory of Majorization and Its Applications; Academic Press: New York, NY, USA, 1979; ISBN 978-0-12-473750-1. [Google Scholar]
- Arnold, B.C.; Balakrishnan, N.; Nagaraja, H.N. A First Course in Order Statistics; Wiley: New York, NY, USA, 1992; ISBN 978-0-471-57321-3. [Google Scholar]
- AP News. NCAA College Football Rankings. Available online: https://apnews.com/hub/ap-top-25-college-football-poll (accessed on 15 October 2025).
- CFB-HQ On, SI. Coaches Poll Top 25: College Football Rankings 2024 Preseason. Available online: https://www.si.com/fannation/college/cfb-hq/rankings/coaches-poll-top-25-college-football-rankings-2024-preseason (accessed on 15 October 2025).
- College Football Poll. Congrove Computer Rankings. Available online: https://www.collegefootballpoll.com/ (accessed on 15 October 2025).
- ESPN. College Football Preseason Power Rankings 2024. Available online: https://www.espn.com/college-football (accessed on 15 October 2025).
- Kurowicka, D.; Cooke, R.M. Uncertainty Analysis with High Dimensional Dependence Modelling; Wiley: Chichester, UK, 2006; ISBN 978-0-470-86306-0. [Google Scholar]
- Acar, E.F.; Genest, C.; Nešlehová, J. Beyond simplified pair-copula constructions. J. Multivar. Anal. 2012, 110, 74–90. [Google Scholar] [CrossRef]
- Patton, A.J. Modelling asymmetric exchange rate dependence. Int. Econ. Rev. 2006, 47, 527–556. [Google Scholar] [CrossRef]
Figure 1.
CDEF copula surface under a Gumbel model () showing joint density over concordance W and concurrence . Higher ridges indicate stronger upper-tail co-movement (greater dependence). The interactive code that produced this figure is available at https://mybinder.org/v2/gh/dustoff06/CDEF/cdef_analyzer?filepath=src/visualization/visualization.ipynb.
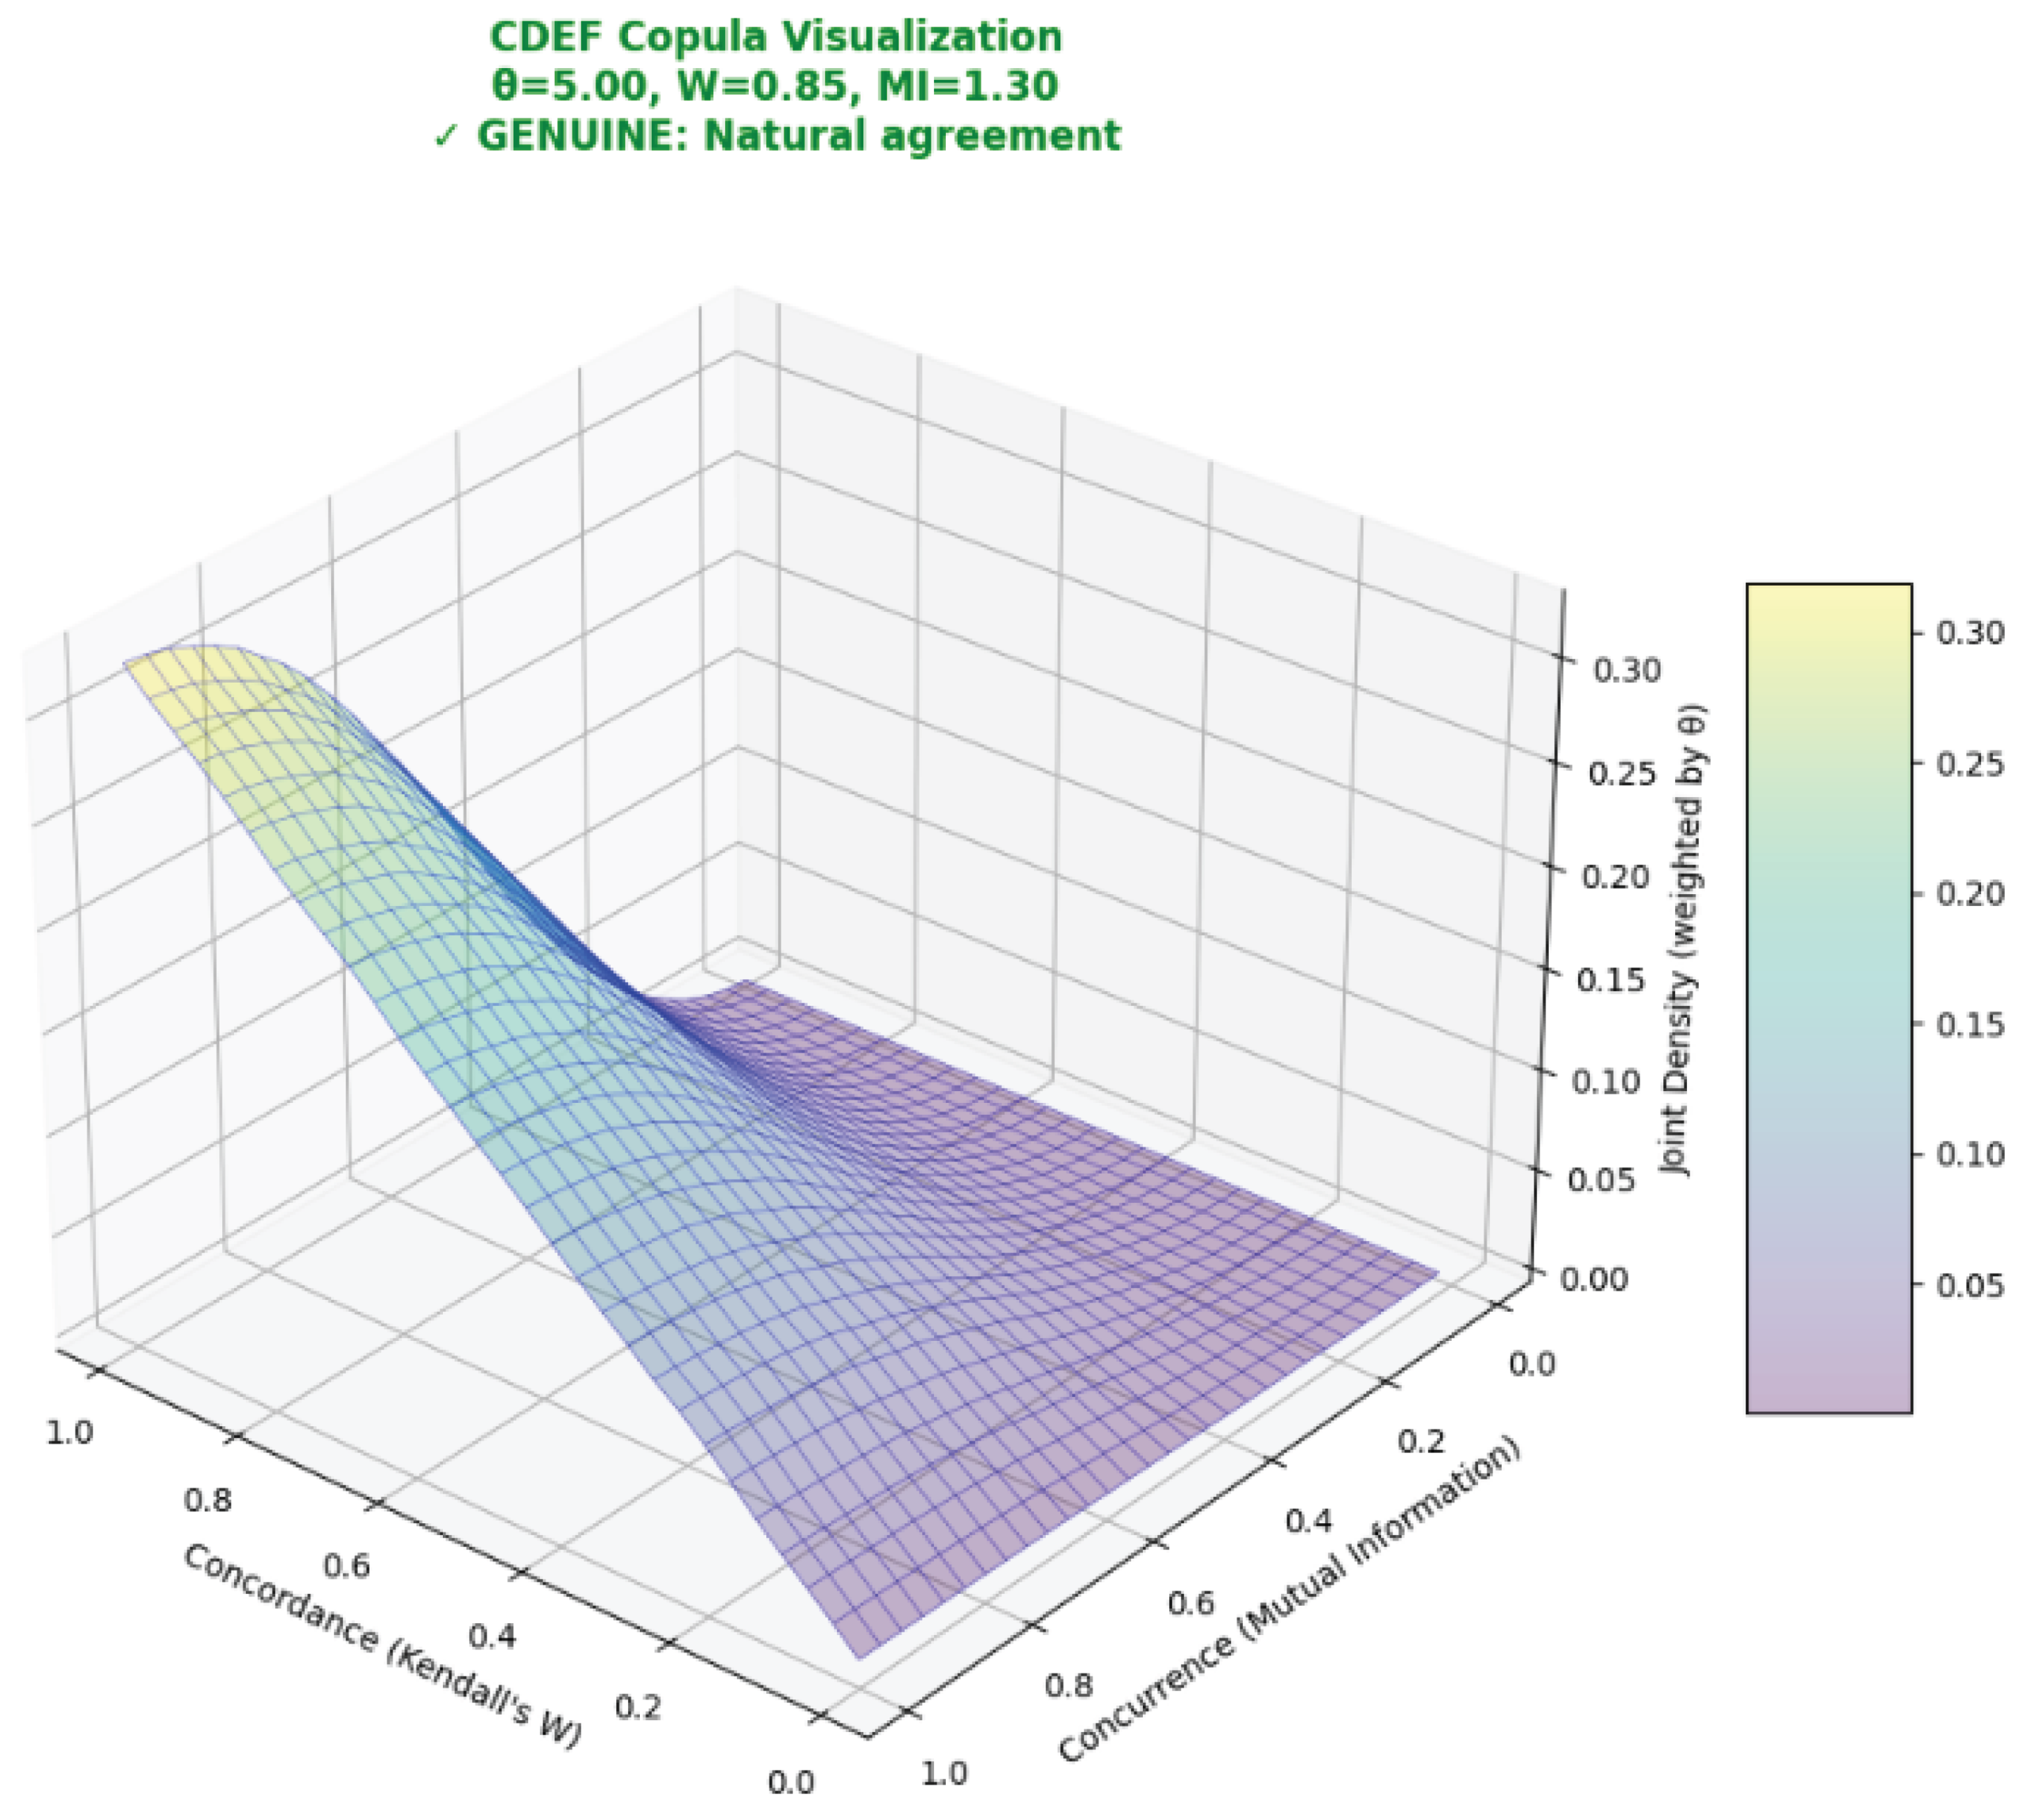
Table 1.
Comparison of CDEF with Recent Related Methods.
| Method | Year | Primary Focus | What It Does | CDEF’s Unique Addition |
|---|---|---|---|---|
| Copula-Based Set Variant Association Test [56] | 2023 | Genetic association testing | Uses copulas to test association between genetic variants and bivariate phenotypes; handles mixed continuous/binary data | Joint ranking system evaluation: CDEF specifically models concordance, dispersion, and extremeness as interdependent ranking characteristics rather than testing genetic associations |
| Variable Ranking in Bivariate Copula Survival Models [57] | 2023 | Survival analysis variable selection | Applies copula-based variable ranking for bivariate time-to-event data with censoring | System-level analysis: CDEF evaluates ranking system integrity rather than selecting variables; models phantom concordance not visible in survival contexts |
| Hierarchical Copula Models for Clustered Data [58] | 2025 | Hierarchical data modeling | Uses D-vine copulas for hierarchical data with cluster-specific predictions | Ranking-specific framework: CDEF addresses ranking evaluation challenges (concordance artifacts, extremeness bias) not present in general hierarchical modeling |
| Copula Correction Methods [59] | 2023 | Endogeneity correction | Addresses regressor-error correlation using Gaussian copulas in econometric models | Dependence revelation: CDEF reveals hidden dependencies creating phantom properties rather than correcting for known endogeneity |
| Ranks, Copulas, and Permutons [60] | 2024 | Mathematical rank theory | Studies asymptotic properties of random permutations using copula connections | Applied evaluation: CDEF provides practical ranking system diagnostics rather than theoretical permutation analysis |
Table 2.
Exemplar simulations and interpretation: paper concepts to concrete code functions, files, and outputs. All simulations use the same pipeline and the mid-rank transform consistent with empirical copula practice [61,63,66].
| Simulation concept in paper | Description (statistic profile) | Code entry point / outputs |
|---|---|---|
| Phantom (Extreme Bias) | High W, very high (shared extreme pattern; tiny swaps) | create_phantom_scenario()→ DataFrame; persisted as scenario_phantom_extreme_bias.xlsx; analyzed by RankDependencyAnalyzer [20,21] |
| Genuine (Natural Agreement) | High W, moderate (moderate perturbations) | create_genuine_scenario()→ DataFrame; file scenario_genuine_natural_agreement.xlsx; same pipeline |
| Random (No Agreement) | Low W, low (independent permutations) | create_random_scenario()→ DataFrame; file scenario_random_no_agreement.xlsx; same pipeline |
| Clustered (Outlier) | High W among 3 raters, one divergent (heterogeneous ) | create_clustered_scenario()→ DataFrame; file scenario_clustered_outlier.xlsx; same pipeline |
| Scenario persistence | Long-format export matching empirical input schema | save_scenario_to_excel(rankings_df, filename, scenario_name) (Rater, Ratee, Ranking) |
| One-pass analysis runner | Runs all scenarios with fixed seed; prints/returns summary | run_cdef_demonstration()→DataFrame summary and console report; saves cdef_summary_fixed.csv |
| Interpretation rule (CDEF) | Maps to narrative class and | cdef_interpretation(results)→; thresholds guided by tail dependence [20,27] |
Disclaimer/Publisher’s Note: The statements, opinions and data contained in all publications are solely those of the individual author(s) and contributor(s) and not of MDPI and/or the editor(s). MDPI and/or the editor(s) disclaim responsibility for any injury to people or property resulting from any ideas, methods, instructions or products referred to in the content. |
© 2025 by the authors. Licensee MDPI, Basel, Switzerland. This article is an open access article distributed under the terms and conditions of the Creative Commons Attribution (CC BY) license (http://creativecommons.org/licenses/by/4.0/).
Copyright: This open access article is published under a Creative Commons CC BY 4.0 license, which permit the free download, distribution, and reuse, provided that the author and preprint are cited in any reuse.


