
Submitted:
22 August 2025
Posted:
25 August 2025
You are already at the latest version
Abstract
Inflammation plays a key role in the pathogenesis of type 2 diabetes (T2D) and the associated cardiovascular complication. High-sensitivity C-reactive protein (hsCRP) is a widely used marker of systemic inflammation as well as a predictor of cardiovascular risk. There is increasing evidence that glucagon-like peptide-1 receptor agonists (GLP-1RAs), including semaglutide, may have effect on hsCRP levels, independent of their effects on glycemic control and body weight loss.
This purpose of our study is to explore the effect of semaglutide on hsCRP levels in patients with type 2 diabetes. Additionally, we aimed to determine whether the observed effect of semaglutide on hsCRP is fully mediated by changes in HbA1c and body weight, or whether there is a direct effect suggesting the presence of an independent anti-inflammatory mechanism.
The study included 66 outpatients with diagnosed type 2 diabetes undergoing therapy with metformin and/or a sulfonylurea. Semaglutide was added to the existing therapeutic regimen. All participants were followed up for 6 months period. Respectively, at the beginning and at the end of the study, the hsCRP values, some selected indicators of glycemic control as well as the anthropometric measurements were recorded. The mean hsCRP value at baseline was 4.90±1.21 mg/L, while after six-month therapy it dropped to 2.23±2.21 mg/L.
The results of the analysis have a good potential to contribute to better understanding of the pleiotropic effects of GLP-1 RAs and support the hypothesis of a direct anti-inflammatory role of semaglutide, which could have clinical significance in the context of cardiometabolic risk management in patients with type 2 diabetes.
Keywords:
GLP-1 receptor agonists
; hs-CRP
; cardiorenal protection
; cardiovascular risk
; inflammation
; type 2 diabetes
; incretin therapy
; metabolic control
1. Introduction
High-sensitivity C-reactive protein (hsCRP) is a form of C-reactive protein used to detect low-grade inflammation. Historically, CRP was discovered in the 1930s in the serum of patients with pneumococcal pneumonia; in these patients it reacted with C-polysaccharide from the cell wall of Streptococcus pneumoniae to form a precipitate - hence its name: “C-reactive protein.”[1] Sustained high levels of hsCRP over time, rather than instantaneous peaks, have been used as a prognostic biomarker for cardiovascular risk and development of atherosclerosis in otherwise apparently healthy individuals or individuals with or without risk factors.[2,3,4] The normal range for hsCRP is up to 1.0 mg/L. Higher levels are associated with a greater risk of cardiovascular disease (CVD). Levels above 2.0 mg/L are associated with poor prognosis, higher rates of complications and mortality [5,6].
Type 2 diabetes is one of the most common chronic metabolic diseases, which is characterized by development of insulin resistance and elevated blood sugar, relative insulin deficiency and often concomitant hyperglycemia. Patients with type 2 diabetes tend to develop micro- and macrovascular complications, mainly due to accelerated atherosclerosis, which is exacerbated by vascular inflammation and free radical damage caused by elevated blood glucose levels. [7,8] hsCRP has been shown to be a strong and independent marker of risk for cardiovascular and nephrological complications.[9]
In parallel with the progress in understanding the inflammatory component of type 2 diabetes, incretin-based drugs, including GLP-1 receptor agonists, have been widely introduced into therapeutic practice. These not only demonstrate a glucose-lowering effect but also the potential to modulate the inflammatory processes. [10,11] It has been suggested that this pleiotropic effect may contribute to lower residual cardiovascular risk in specific patient groups. The results of clinical studies support the observation that semaglutide has a potential anti-inflammatory effect, resulting in hsCRP decrease in patients with type 2 diabetes, which is partly due to the reduction in HbA1c and body weight loss. In addition, the hypothesis of a possible direct effect of semaglutide on hsCRP levels remain to be fully elucidated by further analyses. [12]
OBJECTIVE: To study the semaglutide effect on hsCRP levels, carbohydrate metabolism parameters and renal function in patients with type 2 diabetes. In addition, the aim is to determine whether the observed effect of semaglutide on hsCRP is fully mediated by changes in HbA1c and body weight, or whether there is a direct effect, suggesting the presence of an independent anti-inflammatory mechanism.
2. Material and Applied Methodology
Based on existing published studies on the GLP-1 Ras anti-inflammatory activity, we conducted an observational single-center study to evaluate the effect of semaglutide on high-sensitivity C-reactive protein levels in patients with type 2 diabetes mellitus. The study included 66 outpatients with proven type 2 diabetes, undergoing therapy with metformin and/or a sulfonylurea-class medication. In these patients, semaglutide was added to the existing therapeutic regimen at an initial dose of 0.25 mg per week with gradual titration to 1.0 mg per week in accordance with the available recommendations. All participants were followed for 6 months. hsCRP levels, some selected glycemic control parameters and the anthropometric measurements were recorded at baseline as well as at the end of the study period. After collection of all data, a cross-correlation analysis was performed between the different groups of markers in order to assess changes at baseline and after 6 months of GLP-1 RA treatment.
3. Tracking Design
At the beginning of the study, all patients underwent a detailed medical interview recording information on their age, type 2 diabetes duration, currently administered therapy, presence of concomitant diseases and diabetic complications. A review and analysis of the available medical documentation was performed.
The following clinical and laboratory parameters were recorded at the beginning and the end of the 6-month period:
- Glycated hemoglobin (HbA1c);
- Serum creatinine and estimated glomerular filtration rate (eGFR) through the CKD-EPI formula ;
- High-sensitivity C-reactive protein (hsCRP);
- Microalbuminuria (MALB);
- Anthropometric measurements: height, body weight, body mass index (BMI), waist circumference.
3.1. Data Collection Procedure
Empirical data were collected through standardized methods of applied medical sociology and clinical assessment, including:
- Structured individual survey;
- Semi-standardized clinical interview;
- Direct clinical observation.
The information was collected in real clinical practice conditions in outpatient medical care facilities, including:
- Medical Center "Doctors for Us" - Burgas
- Individual Practice of Specialized Medical Care "Dr. Nikolay Kostadinov" – city of Burgas
3.2. Patients Characteristics
The patients included in the study were randomly selected based on predefined inclusion and exclusion criteria.
Inclusion criteria:
- Age over 18 years;
- ∙ Confirmed diagnosis of type 2 diabetes mellitus for at least 6 months;
- ∙ Undergone prior treatment with metformin and/or a sulfonylurea;
- ∙ Signed informed consent for study participation.
Exclusion criteria:
- Type 1 diabetes mellitus;
- Gestational diabetes;
- Age under 18 years;
- Presence of cognitive deficits and/or mental illnesses limiting the validity of informed consent and/or access to objective information.
All participants signed informed-consent form prior to their inclusion in the study.
The therapeutic intervention included the addition of semaglutide to the treatment with sulfonylurea-class medication and/or metformin. Semaglutide was administered subcutaneously, once a week, in a gradually titrated dose of 0.25 mg for week 1-4, 0.5 mg for week 5-8 and then 1.0 mg weekly for the next four months of the study. Only patients who reached a weekly dose of 1.0 mg semaglutide remained in the study. All participants who, due to side effects of the drug, did not reach a weekly dose of 1 mg semaglutide, were excluded from the follow-up.
4. Results
4.1. Demographic and Anthropometric Profile of the Studied Population
The profile of the participants in the study was constructed based on demographic and social characteristics, including gender, age, educational level, professional status and work schedule, as well as basic anthropometric measurements characterizing physical development - height, body weight, waist circumference and body mass index.
Regarding the gender distribution, out of 66 participating patients, 39.4% (n=26) were male and 60.6% (n=40) were female. The age of the participants ranged from 33 to 75 years, with a mean value of 54.74 ± 10.22 years (Figure 1).
The distribution of participants by education level showcases that the majority (60.0%) had secondary education. 32.9% of the patients were holders of higher-education degree while 7.1% had primary education (Figure 2). This structure is representing the typical socio-educational profile of an outpatient population with type 2 diabetes in an urban environment.
As far as nature of employment is concerned, the participants have been divided into three main groups: 48.8% of the patients have a daytime job, 15.3% have a mixed work schedule (including night shifts), and 35.9% are not actively employed, with the majority of them being of retirement age. The distribution by professional employment has the following structure: 18.8% of the participants’ jobs involve physical labor, 16.5% have employment with no physical strain, 15.9% are employed in the field of public services, 5.3% hold managerial positions, 4.1% work in healthcare, and 3.5% responded they are engaged with intellectual work. The remaining 35.9% were not employed at the time of the survey.
4.2. Clinical and Anthropometric Profile
The analysis of the anthropometric measurements of the studied group showed a mean body weight of 110.76 ± 19.12 kg and a mean waist circumference of 114.71 ± 10.95 cm, which corresponds to a high degree of central obesity. The mean value of the body mass index (BMI) was 38.56 ± 5.46 kg/m² or obesity grade II according to the WHO criteria. (Figure 3).
The duration of type 2 diabetes mellitus in the participants ranged from 1 to 25 years, with a mean value of 6.83 ± 5.79 years. The distribution analysis revealed that in 25% of the patients the duration of the disease was up to 1 year, in 50% – up to 5 years, and in 25% – 10 years and more.
Above data reflects the heterogeneity of the group both in terms of metabolic risk as well as in terms of personal experience with diabetes and chronic complications.
4.3. Monitored Laboratory Parameters and Their Dynamics During the Course of Administered Treatment
The following laboratory parameters were monitored at the beginning and at the end of the 6-month observational period for each participant: high-sensitivity C-reactive protein (hsCRP), glycated hemoglobin (HbA1c), microalbuminuria (MALB), serum creatinine, as well as estimated glomerular filtration rate (eGFR), calculated using the CKD-EPI formula (Figure 4).
4.4. Inflammatory Marker hsCRP in Patients Treated with GLP -1 RA
C-reactive protein (CRP) belongs to the pentraxin family and exists in at least two conformationally distinct forms, the native pentameric form (pCRP) and the monomeric form (mCRP). [14,15] Studies have consistently demonstrated that pCRP can exhibit both pro- as well as anti-inflammatory properties depending on the context. In contrast, mCRP exhibits a strong pro-inflammatory effect on endothelial cells, endothelial precursor cells, leukocytes, and platelets, potentiating the inflammatory response. The dissociation of pCRP to the pro-inflammatory form mCRP is considered a mechanism directly linking CRP to inflammatory processes. Patients with elevated basal levels of C-reactive protein are at increased risk of developing cardiovascular disease, type 2 diabetes mellitus, and systemic hypertension. [16,17] During the 6-month treatment period with GLP-1 RA, a significant decrease in high-sensitivity C-reactive protein levels was observed probably due to improved health status of patients receiving the GLP-1 RA therapy. The mean hsCRP value at the beginning of the study was 4.90±1.21 mg/L and after 6 months of therapy it decreased 2.23±2.21 mg/L. The difference between the mean values was statistically significant (*p < 0.05), supported by t-statistic t=3.92 with a significance level Sig.=0.000, which is lower than α=0.05 (Figure 5).
4.5. Change in HbA1c Levels
A number of studies have highlighted the existing relationship between glycated hemoglobin (HbA1c) levels and high-sensitivity C-reactive protein, while simultaneously pointing out the importance of optimal glycemic control for reduction of systemic inflammation and limiting diabetes-associated complications [20,21,22].
In this analysis, the mean HbA1c at baseline was 8.18±1.98%, and after 6 months of treatment with GLP-1 RA (semaglutide), it decreased to 6.50±1.19%. The change of 1.68% is statistically significant (*p < 0.05), with the significance level (Sig.=0.000) being lower than the accepted threshold α=0.05. The calculated t-statistic was t=8.983 (Figure 6).
The results confirm the effectiveness of GLP-1 RAs in achieving significant improvement in glycemic control in patients with type 2 diabetes.
4.6. Dynamics of Changes in the Blood-Glucose Profile
Analysis of the blood-glucose profile (BGP) of patients receiving a GLP-1 receptor agonist shows that the differences between the mean values at the beginning of the study and after 6 months were statistically significant (* p < 0.05) for all seven BGP follow-up stages. This conclusion is supported by the results of the Independent Samples T - Test, which show that all t -values have significance levels Sig.<α=0.05. Based on these data, conclusion is that the administration of GLP-1 RA (semaglutide) has significantly lowered blood sugar levels at each stage of patients’ follow-up (Figure 7).
By monitoring glycemic control throughout the study, we found that improvement in glycemic parameters was directly related to reduction in hsCRP levels, which is the key factor for reducing the inflammatory response in patients. The data confirms that elevated hsCRP levels are associated with higher risk of developing type 2 diabetes, especially in individuals with metabolic syndrome. [23]
Therefore, hsCRP can be considered a valuable potential tool for early diagnosis and targeting individuals for adopting early preventive measures against cardiovascular events as well as to reduce morbidity and mortality among patients with type 2 diabetes. As a sensitive and accessible inflammatory marker, hsCRP has the potential to be used to detect prediabetes and to serve as a prognostic indicator for identifying cardiovascular complications, including in individuals without overt disease but with elevated blood glucose levels [24,25].
4.7. Descriptive and Comparative Analysis of the Therapeutic Effect of the Therapy with GLP-1 RA
The correlations between key clinical and laboratory parameters were analyzed: hsCRP, eGFR, serum creatinine, microalbuminuria, HbA1c, BMI. Table 1 presents summarized descriptive characteristics of the main parameters studied at baseline and after six months of treatment with GLP-1 RA. The application of the comparative/paired t-test (Paired Samples T-Test) showed that the differences between the mean values of most indicators were statistically significant at a confidence level of P=95% (α=0.05), except for microalbuminuria, where no significant change was found.
Six-month therapy with a GLP-1 receptor agonist (semaglutide) in patients with type 2 diabetes and comorbid obesity led to significant improvements in several metabolic and inflammatory markers. The reported statistically significant reduction in hsCRP confirms a pronounced anti-inflammatory effect, probably mediated by the body weight loss, improved glycemic control and possible direct immunomodulatory mechanisms of GLP-1 RAs. Regarding renal function, a significant increase in eGFR and a reduction in serum creatinine were witnessed, which supports a potential nephroprotective effect of the therapy. These effects are explained as a complex effect of the therapy on glucotoxicity, renal hemodynamics and systemic inflammation. Despite the lack of statistically significant change in microalbumin (MALB) levels, the results indicate the need for longer-term follow-up to assess the impact on early glomerular injury. Glycemic control also improved significantly, with HbA1c decreasing by an average of almost 2%, which is clinically significant and correlates with a reduced risk of vascular complications. In addition, a marked reduction in BMI with over 3 points was observed, which further contributes to the improvement in metabolic profile, inflammatory parameters and cardiovascular risk.
In summary, the study results demonstrate the multimodal therapeutic potential of GLP-1 RAs – with simultaneous effects on glycemia, body weight, inflammation and renal function, which positions them as a key component in the comprehensive approach to the treatment of type 2 diabetes, especially in patients at increased cardiovascular and nephropathic risk.
4.8. Correlation Analysis
To dig deeper into the relations between inflammatory, nephrological and metabolic biomarkers, Pearson correlation analysis was performed using the statistical software SPSS v.26. Two correlation matrices were constructed – for baseline values and after a 6-month therapeutic course with semaglutide.
The study applied cross-correlation analysis in a Bulgarian outpatient population with type 2 diabetes, and for the first time simultaneously examines the relations between high-sensitivity C-reactive protein (hsCRP), glycated hemoglobin (HbA1c), estimated glomerular filtration rate (eGFR), serum creatinine, microalbuminuria, and body mass index (BMI) in real outpatient practice with Bulgarian patients.
The identified statistically significant relationships allow for the formulation of hypotheses regarding possible direct anti-inflammatory and cardiorenoprotective effects of GLP-1 RAs. These results provide a basis for future pathophysiological models that can be of great aid to cardiovascular and nephrological risk management in patients with metabolic syndrome.
4.9. Correlation Analysis of the Data at the Beginning of GLP -1 RA Therapy
Three significant correlations with a confidence level of P ≥ 99% (p < 0.01) were found in the starting point of the GLP-1 RA therapy as summarized in Table 2. A weak negative correlation was observed between hsCRP and eGFR (r=-0.246), suggesting that higher levels of systemic inflammation are associated with decreased renal function. A moderate positive correlation was also found between hsCRP and serum creatinine (r=0.341), supporting the relationship between inflammatory status and markers of renal injury.
A weak but statistically significant negative correlation was found between hsCRP and eGFR (r=-0.246, p<0.01), linking systemic inflammation and early renal dysfunction. This is consistent with known pathophysiological mechanisms in which inflammation affects the endothelial function and renal perfusion. There was also a moderate positive correlation between hsCRP and serum creatinine (r=0.341, p<0.01), supporting the role of inflammation in renal injury. Higher hsCRP values correspond to elevated creatinine, which may imply both impaired renal function as well as inflammatory processes. In summary, correlation analysis at baseline showed a significant association between inflammation and renal function in patients with type 2 diabetes. Higher hs-CRP levels were associated with suppressed glomerular filtration rate and elevated serum creatinine, supporting inflammatory-mediated mechanism of renal injury.
4.10. Correlation Analysis of the Data at the End of GLP-1 RA Therapy
The correlation analysis after six months of GLP-1 RA therapy revealed two statistically significant relations with high confidence levels (Table 3).
The discovered modest positive correlation between eGFR and microalbuminuria (MALB) (r=0.247, p < 0.05) was expected. In addition to nephrological improvements, the summarized data are also consistent with the positive impact of GLP-1 RA on cardiovascular status, through reduction of systemic inflammation, improvement of metabolic control and beneficial effect on cardiac function. These results are further evidence of the multifactorial therapeutic potential of GLP-1 receptor agonists for patients with type 2 diabetes, contributing to both renal protection as well as for cardiovascular risk reduction.
4.11. The Established Correlations in GLP-1 RA Therapy Were Further Analyzed by Linear Correlation Analysis as Displayed in Table 4 and Table 5.
R– correlation coefficient, reflecting the strength and the direction of the linear relationship between the studied variables (values from –1 to +1).
R²(R Square) – coefficient of determination, indicating the proportion of the variation in the dependent variable that is explained by the independent variable.
Std. Error of the Estimate– standard error of the estimate; a measure of the accuracy of the predictions made by the regression model.
F– value of the F-test from a one-way ANOVA analysis, assessing the overall significance of the regression model.
Sig. (p-value)– level of statistical significance; values below 0.05 are considered statistically significant at α=0.05.

Table 4.
Relationships Between Clinical Parameters and the Start of GLP-1 RA treatment – Correlation Analysis.
Table 4.
Relationships Between Clinical Parameters and the Start of GLP-1 RA treatment – Correlation Analysis.
| Linear correlation dependence |
R |
R Square |
Std Error of the Estimate |
F |
Sig. (p-value) |
|
|
X: hsCRP Y: eGFR |
Y=92.236-0.803*X |
-0.246 |
16.632 |
3.994 |
0.050 |
|
|
X: hsCRP Y: Creatinine |
Y=67.185+0.724*X |
0.341 |
0.116 |
4.324 |
0.042 |
|
|
X: eGFR Y: MALB |
Y=156.536-0.886*X |
-0.768 |
0.589 |
10.854 |
91.823 |
0.000 |
Table 5.
Relationships Between Clinical Parameters and the End of Treatment with GLP-1 RA – Correlation Analysis.
Table 5.
Relationships Between Clinical Parameters and the End of Treatment with GLP-1 RA – Correlation Analysis.
| Linear correlation dependence |
R |
R Square |
Std Error of the Estimate |
F |
Sig. (p-value) |
|
|
X: Creatinine Y: eGFR |
Y=155.763-0.867*X |
0.759 |
0.557 |
10.588 |
92.614 |
0.000 |
|
X: MALB Y: eGFR |
Y=92.099+0.046*X |
0.247 |
0.061 |
15.769 |
4.411 |
0.039 |
4.12. Analysis of Correlation Dependencies in the Initial Stage of GLP-1 RA Therapy
At the initial stage of GLP-1 RA therapy, a linear correlation analysis was performed to prove the linkage between the inflammatory marker hsCRP, renal function indicators (eGFR and serum creatinine), and microalbuminuria (MALB). The results of the analysis highlighted three statistically significant relations. There was a weak but statistically significant negative correlation between hsCRP and eGFR (R=-0.246; p=0.050), suggesting that higher systemic inflammation is associated with suppressed glomerular filtration. Although the explanatory value (R²=0.050) is low, this relationship is clinically significant in view of the role of chronic inflammation as a risk factor for progression of renal damage (Figure 8).
A moderate positive correlation was also found between hsCRP and serum creatinine (R=0.341; p=0.042), giving further credit to the hypothesis of inflammatory component in the pathogenesis of impaired renal function. Although of low prognostic value (R²=0.116), the result underpins the potential role of inflammatory processes in early renal impairment in patients with type 2 diabetes (Figure 9):
The strongest negative correlation was between eGFR and microalbuminuria (R= -0.768; p<0.001), with the regression model explaining nearly 59% of the variation in MALB values (R²=0.589). This is highly consistent with the well-documented pathophysiological relationship between diminished glomerular filtration and growing urinary albumin loss, further reinforcing the reliability of the indicators for assessment of renal damage early during therapy.
4.13. Analysis of Correlation Dependencies in the Final Stage of GLP-1 RA Therapy
During follow-up of the patients after six months of GLP-1 RA therapy, two statistically significant linear relations between key kidney function parameters were identified. The results are presented in Table 5.
The second detected correlation is between microalbuminuria (MALB) and eGFR, with a reported coefficient R=+0.247 (p=0.039) and R²=0.061, indicating a weak to moderate positive linear relation. This result is not typical, since in most cases increased albuminuria is associated with a subsided glomerular filtration. One possible explanation is that in some patients GLP-1 RA therapy has led to a transient improvement in renal perfusion and hemodynamics, which temporarily increases the permeability of the glomerular barrier. Alternatively, the result may be attributed to individual differences in the response to therapy and is subject to further clarification through longer-term tracking as well as the addition of other nephroprotective biomarkers (Figure 11).
5. Discussion
The present prospective study on Bulgarian population selection group provides a pivotal contribution to the scientific literature by applying cross-correlation analysis between inflammatory and renal biomarkers in patients with type 2 diabetes, treated with GLP-1 receptor agonists (semaglutide). Conducted on a Bulgarian population, it is the first of its kind to explore the interaction between inflammation and early markers of kidney damage in a real clinical setting, tracking the dynamics of these relations before and after six months of therapy and supporting the possible role of GLP-1 RA not only as an antidiabetic therapy, but also as a strategic tool in cardiorenal risk management.
5.1. GLP-1 RA in the Context of the Cardiorenal Continuum
Type 2 diabetes mellitus is a disease that impacts multiple organs and systems, with renal and cardiovascular complications being the leading causes of morbidity and mortality. The concept of a close physiopathological link between renal damage and cardiovascular risk – the so-called cardiorenal continuum – in which chronic low-grade inflammation plays a central role is increasingly gaining traction in scientific circles. In this background, the results of the present study are particularly valuable.
The significant correlations between hsCRP and renal markers (eGFR and creatinine) established at baseline evidence the presence of an inflammatory component, even before the appearance of clinical renal failure. This is supported by an array of medical texts which refer to hsCRP as a predictor not only of cardiovascular risk, but also of the progression of diabetic nephropathy. [26,27] The moderate positive relationship between hsCRP and serum creatinine (R=0.341; p=0.042) in this study proves the early role of systemic inflammation in the impairment of glomerular function. The strongest relation - the negative correlation between eGFR and microalbuminuria (R= -0.768; p<0.001), confirms the classical pathophysiology of diabetic nephropathy, while offering readily available and inexpensive biomarkers for renal risk stratification in outpatient settings.
5.2. Renoprotection and Cardiovascular Risk – the Two Faces of the Therapy with GLP -1 RA
After 6 months of GLP-1 RA therapy, renal function was preserved and even slightly improved, in the absence of progression of microalbuminuria or elevation of the inflammatory marker hsCRP. This points to the potential role of GLP-1 RA in limiting renal inflammation and delaying diabetic nephropathy. The renoprotective effect is of particular importance in the light of cardiovascular risk management, as microalbuminuria and reduced eGFR have long been recognized as independent predictors of cardiovascular events. The improvement or stabilization of these parameters under the influence of GLP-1 RA can be interpreted as an indirect cardiovascular benefit, which is in line with the results from some large-scale studies (LEADER, REWIND, SUSTAIN 6). [28,29]
Therefore, renoprotection in patients with type 2 diabetes should not be considered in isolation, but as part of a comprehensive strategy to reduce cardiovascular events. Our study has provided local, validated data that confirm the applicability of this holistic approach in the Bulgarian population.
5.3. Author Contribution and Clinical Significance
The analysis offers not only theoretical but also practical guidelines for monitoring the effect of GLP-1 RA on cardiovascular risk and progression of chronic kidney disease, through accessible and routinely used parameters.
The study definitively underpins that early identification and control of inflammation, combined with targeted GLP-1 RA therapy, could become a powerful tool for secondary prevention in high-risk patients with type 2 diabetes.
6. Conclusions
The observed simultaneous optimization of glycemic control and reduction in hsCRP, combined with improvement in eGFR and reduction in MALB, suggests possible direct anti-inflammatory effect of GLP-1 RA. The decrease in hsCRP level – a validated cardiovascular risk marker – in the background of stabilized renal function points to a pronounced cardioprotective effect of the therapy. The data demonstrate that GLP-1 RA has impact on metabolic, inflammatory and nephrological parameters, which has the potential to optimize cardiovascular risk management in patients with type 2 diabetes in real-world clinical practice, with the aim of improving their long-term prognosis.
As the first Bulgarian study of its kind with cross-correlation analysis of GLP-1 RA therapy, this work makes a significant local contribution to the current knowledgebase on cardiorenal protection in type 2 diabetes. The obtained results support the integrated approach to monitoring and therapy, based on multimodal impact - glycemic, anti-inflammatory and organoprotective.
* Cross-correlation analysis is a statistical method used to measure the relationship between two (or more) variables, taking into account their course over time or under different conditions. Usually, this type of analysis is applied when the researcher wants to make sure whether a change in one variable is associated with a lagged or synchronous change in another, i.e. whether there is a temporal or functional parallel between them.
References
- Banait T, Wanjari A, Danade V, Banait S, Jain J. Role of High-Sensitivity C-reactive Protein (Hs-CRP) in Non-communicable Diseases: A Review. Cureus. 2022 Oct 12;14(10):e30225. [CrossRef] [PubMed] [PubMed Central]
- Clyne B, Olshaker JS. J Emerg The C-reactive protein. Med. 1999;17:1019–1025. [CrossRef]
- Ridker PM, Cushman M, Stampfer MJ, Tracy RP, Hennekens CH. N 2.Inflammation, aspirin, and the risk of cardiovascular disease in apparently healthy men. Engl J Med. 1997;336:973–979. [CrossRef]
- Ridker PM, Rifai N, Rose L, Buring JE, Cook NR. N Comparison of C-reactive protein and low-density lipoprotein cholesterol levels in the prediction of first cardiovascular events. Engl J Med. 2002;347:1557–1565. [CrossRef]
- Carrero JJ, Andersson Franko M, Obergfell A, Gabrielsen A, Jernberg T. J hsCRP level and the risk of death or recurrent cardiovascular events in patients with myocardial infarction: a healthcare-based study. Am Heart Assoc. 2019;8:0. [CrossRef]
- Lloyd-Jones DM, Liu K, Tian L, Greenland P. Narrative review: assessment of C-reactive protein in risk prediction for cardiovascular disease. Ann Intern Med. 2006;145:35–42. [CrossRef]
- Yang X, Tao S, Peng J, et al. High-sensitivity C-reactive protein and risk of type 2 diabetes: a nationwide cohort study and updated meta-analysis. Diabetes Metab Res Rev. 2021;37:0. [CrossRef]
- Ragy MM, Kamal NN.Linking senile dementia to type 2 diabetes: role of oxidative stress markers, C-reactive protein and tumor necrosis factor-α. Neurol Res. 2017;39:587–595. [CrossRef]
- Ridker PM, Buring JE, Shih J, Matias M, Hennekens CH.Prospective study of C-reactive protein and the risk of future cardiovascular events among apparently healthy women. Circulation. 1998;98:731–733. [CrossRef]
- Aroda VR, Ahmann A, Cariou B, Chow F, Davies MJ, Jódar E, et al. Comparative efcacy, safety, and cardiovascular outcomes with once-weekly subcutaneous semaglutide in the treatment of type 2 diabetes: insights from the SUSTAIN 1–7 trials. Diabetes Metab. 2019;45:409–18.
- Lingvay I, Catarig AM, Frias JP, Kumar H, Lausvig NL, le Roux CW, et al. Efcacy and safety of once-weekly semaglutide versus daily canaglifozin as add-on to metformin in patients with type 2 diabetes (SUSTAIN 8): a double-blind, phase 3b, randomised controlled trial. Lancet Diabetes Endocrinol. 2019;7:834–44.
- Liu L, Gao B, Wang J, Yang C, Wu S, Wu Y, et al. Reduction in serum highsensitivity C-reactive protein favors kidney outcomes in patients with impaired fasting glucose or diabetes. J Diabetes Res. 2020;2020:2720905.
- World Medical Association. World Medical Association Declaration of Helsinki: ethical principles for medical research involving human subjects. JAMA. 2013 Nov 27;310(20):2191-4. [CrossRef] [PubMed]
- Pearson TA, Mensah GA, Alexander RW, et al.Markers of inflammation and cardiovascular disease: application to clinical and public health practice: a statement for healthcare professionals from the Centers for Disease Control and Prevention and the American Heart Association. Circulation. 2003;107:499–511. [CrossRef]
- Salazar J, Martínez MS, Chávez-Castillo M, et al.C-reactive protein: an in-depth look into structure, function, and regulation. Int Sch Res Notices. 2014;2014:653045. [CrossRef]
- Luan YY, Yao YM. The clinical significance and potential role of C-reactive protein in chronic inflammatory and neurodegenerative diseases. Front Immunol. 2018;9:1302. [CrossRef]
- Kandelouei T, Abbasifard M, Imani D, et al.Effect of statins on serum level of hs-CRP and CRP in patients with cardiovascular diseases: a systematic review and meta-analysis of randomized controlled trials. Mediators Inflamm. 2022;2022:8732360. [CrossRef]
- Alharbi, SH. Anti-inflammatory role of glucagon-like peptide 1 receptor agonists and its clinical implications. Ther Adv Endocrinol Metab. 2024 Jan 27;15:20420188231222367. [CrossRef] [PubMed] [PubMed Central]
- Jara M, Norlin J, Kjær MS, Almholt K, Bendtsen KM, Bugianesi E, Cusi K, Galsgaard ED, Geybels M, Gluud LL, Harder LM, Loomba R, Mazzoni G, Newsome PN, Nitze LM, Palle MS, Ratziu V, Sejling AS, Wong VW, Anstee QM, Knudsen LB. Modulation of metabolic, inflammatory and fibrotic pathways by semaglutide in metabolic dysfunction-associated steatohepatitis. Nat Med. 2025 Jul 21. Epub ahead of print. [CrossRef] [PubMed]
- Davis TM, Coleman RL, Holman RR.Prognostic significance of silent myocardial infarction in newly diagnosed type 2 diabetes mellitus: United Kingdom Prospective Diabetes Study (UKPDS) 79. Circulation. 2013;127:980–987. [CrossRef]
- Ridker PM, Danielson E, Fonseca FA, et al. Rosuvastatin to prevent vascular events in men and women with elevated C-reactive protein. N Engl J Med. 2008;359:2195–2207. [CrossRef]
- Kim J, Pyo S, Yoon DW, et al. The co-existence of elevated high sensitivity C-reactive protein and homocysteine levels is associated with increased risk of metabolic syndrome: A 6-year follow-up study. PLoS One. 2018;13:0. [CrossRef]
- Mugabo Y, Li L, Renier G. The connection between C-reactive protein (CRP) and diabetic vasculopathy. Focus on preclinical findings. Curr Diabetes Rev. 2010 Jan;6(1):27-34. [CrossRef] [PubMed]
- Ghule A, Kamble TK, Talwar D, et al. Association of serum high sensitivity C-reactive protein with pre-diabetes in rural population: a two-year cross-sectional study. Cureus. 2021;13:0. [CrossRef]
- Rasheed A, Acharya S, Shukla S, Kumar S, Yarappa R, Gupte Y, Hulkoti V. High-sensitivity C-reactive protein in metabolic healthy obesity (MHO) https://www.jemds.com/data_pdf/sourya%20acharya-feb-17-.pdf J Evolution Med Dent Sci. 2020;9:443–447.
- Stanimirovic J, Radovanovic J, Banjac K, Obradovic M, Essack M, Zafirovic S, Gluvic Z, Gojobori T, Isenovic ER. Role of C-Reactive Protein in Diabetic Inflammation. Mediators Inflamm. 2022 May 17;2022:3706508. [CrossRef] [PubMed] [PubMed Central]
- Li J, Chen J, Lan HY, Tang Y. Role of C-Reactive Protein in Kidney Diseases. Kidney Dis (Basel). 2022 Dec 14;9(2):73-81. [CrossRef] [PubMed] [PubMed Central]
- Verma S, McGuire DK, Bain SC, Bhatt DL, Leiter LA, Mazer CD, Monk Fries T, Pratley RE, Rasmussen S, Vrazic H, Zinman B, Buse JB. Effects of glucagon-like peptide-1 receptor agonists liraglutide and semaglutide on cardiovascular and renal outcomes across body mass index categories in type 2 diabetes: Results of the LEADER and SUSTAIN 6 trials. Diabetes Obes Metab. 2020 Dec;22(12):2487-2492. [CrossRef] [PubMed] [PubMed Central]
- Webb J, Mount J, von Arx LB, Rachman J, Spanopoulos D, Wood R, Tritton T, Massey O, Idris I. Cardiovascular risk profiles: A cross-sectional study evaluating the generalizability of the glucagon-like peptide-1 receptor agonist cardiovascular outcome trials REWIND, LEADER and SUSTAIN-6 to the real-world type 2 diabetes population in the United Kingdom. Diabetes Obes Metab. 2022 Feb;24(2):289-295. Epub 2021 Nov 24. [CrossRef] [PubMed] [PubMed Central]
Figure 1.
Distribution of Patients by Gender.
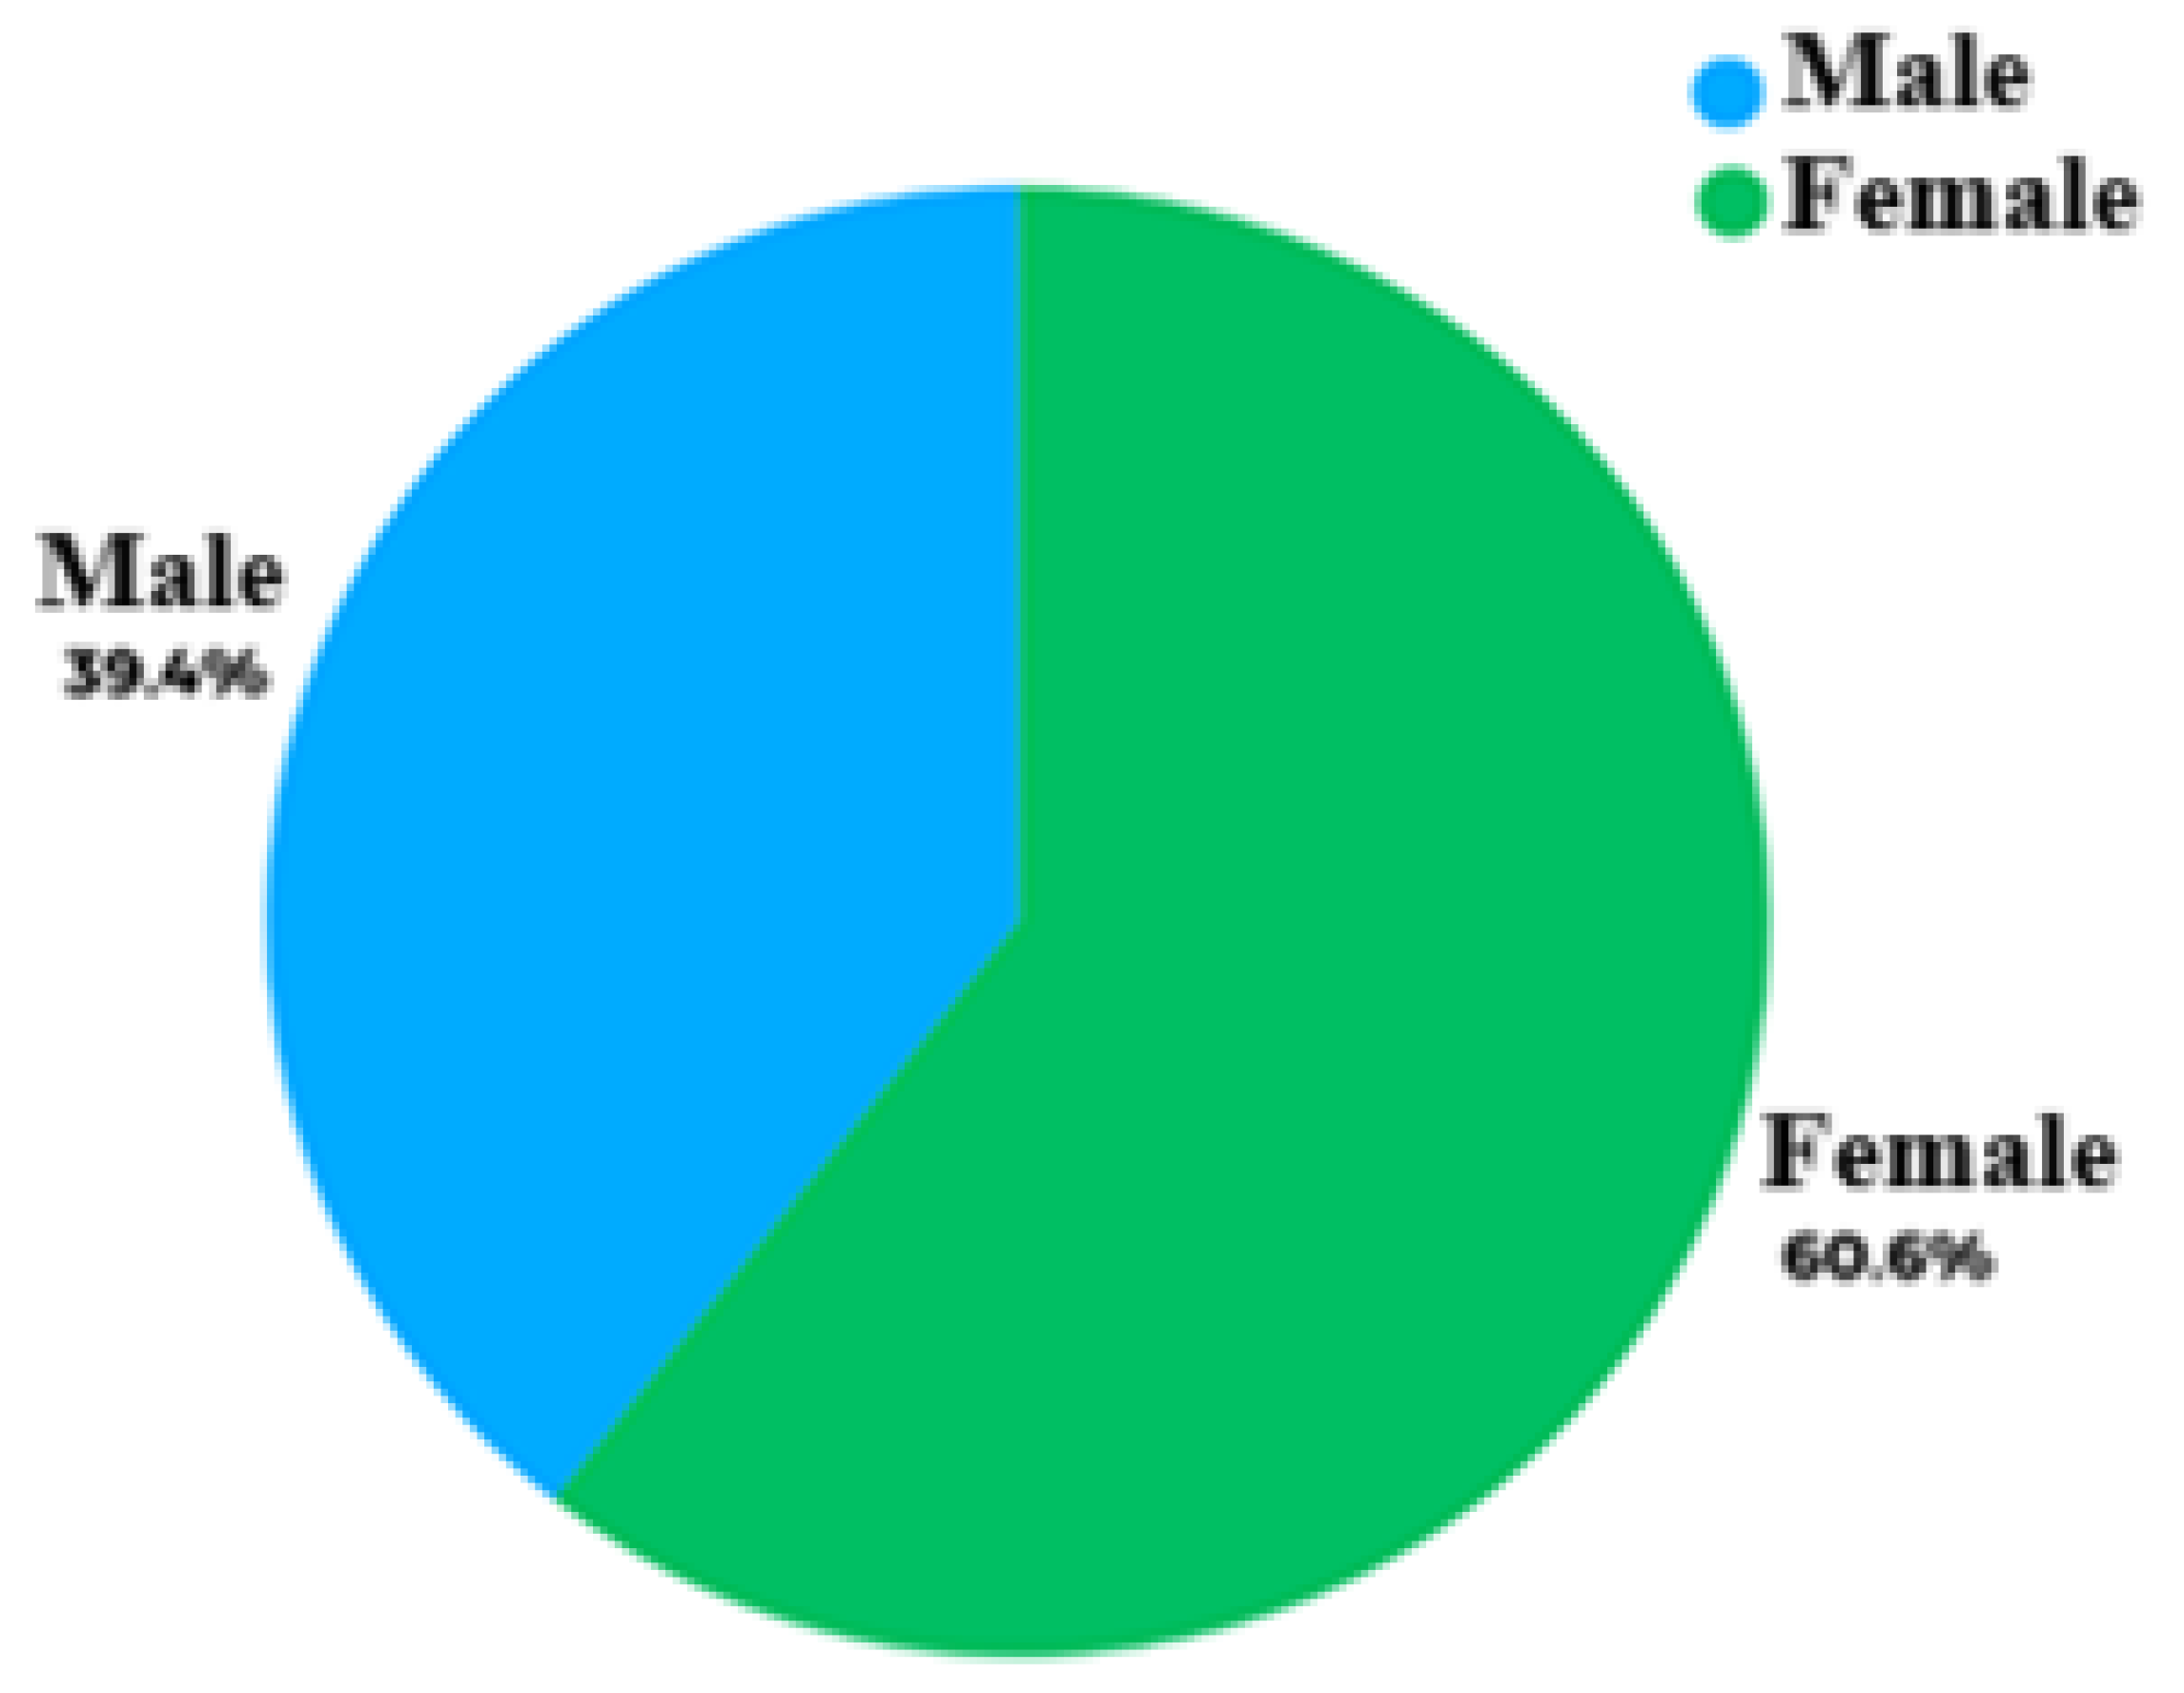
Figure 2.
Distribution of patients by education.
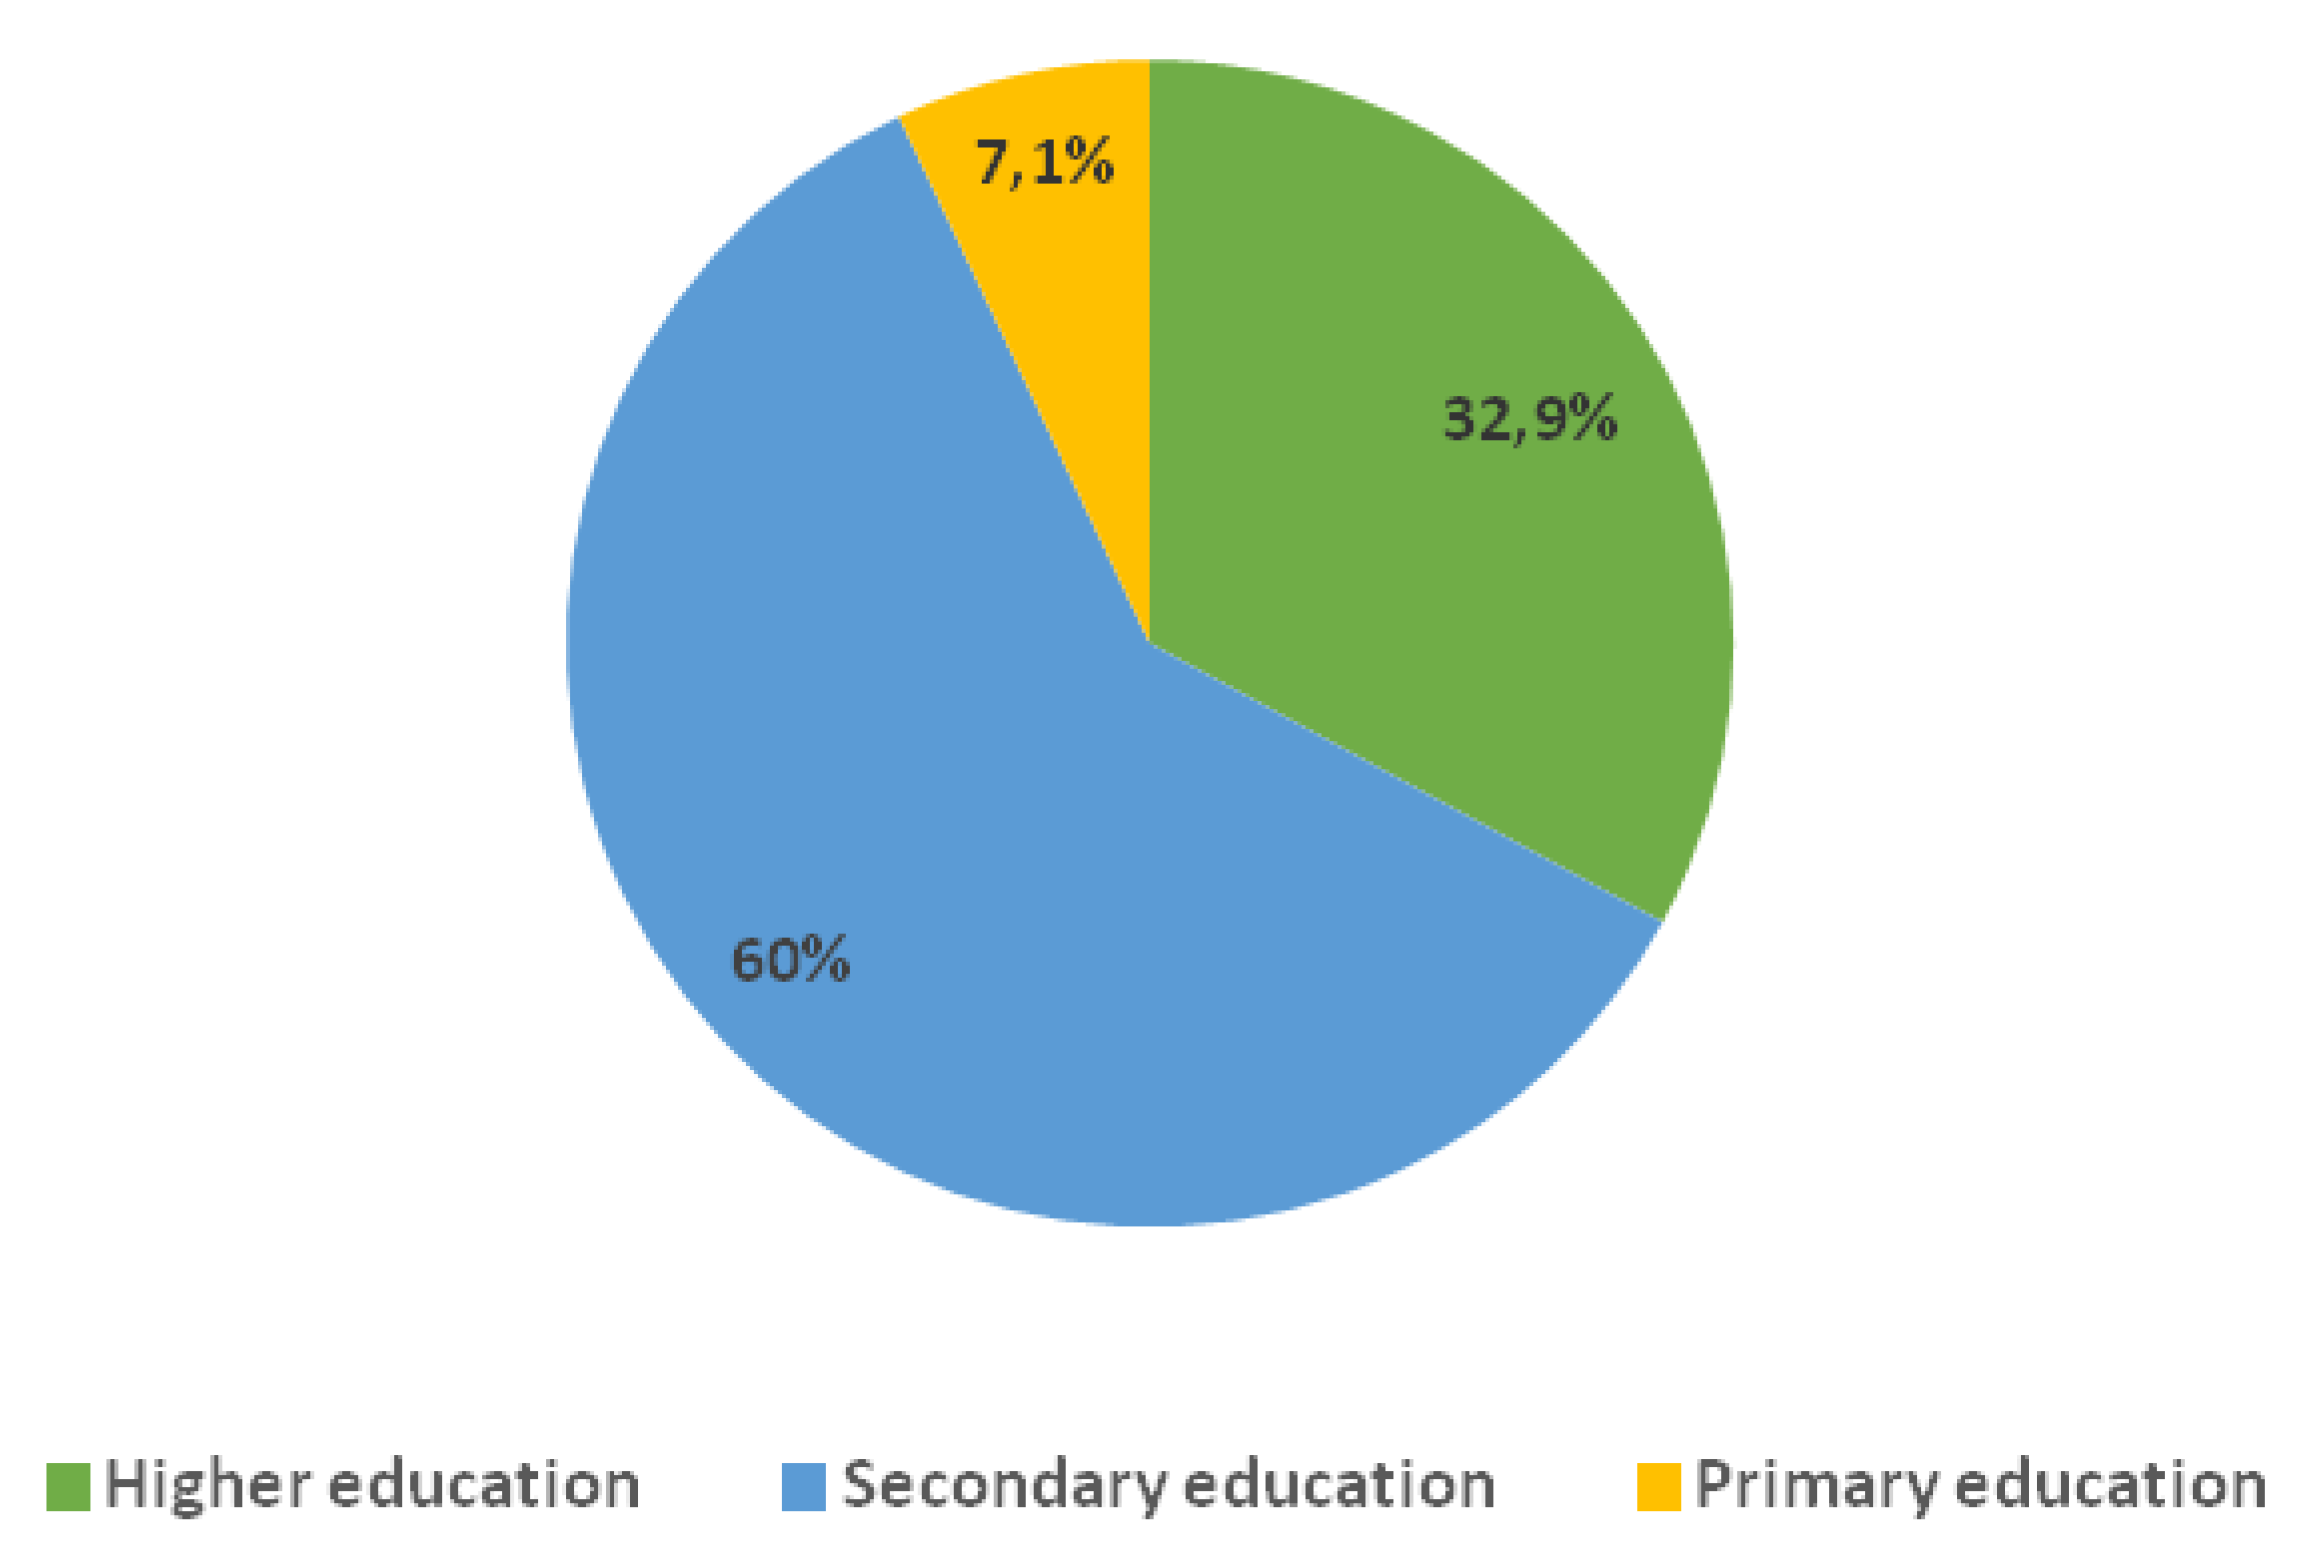
Figure 3.
Mean Values of Basic Anthropometric Measurements in the Study Group (Weight, Waist Circumference and BMI).
Figure 3.
Mean Values of Basic Anthropometric Measurements in the Study Group (Weight, Waist Circumference and BMI).
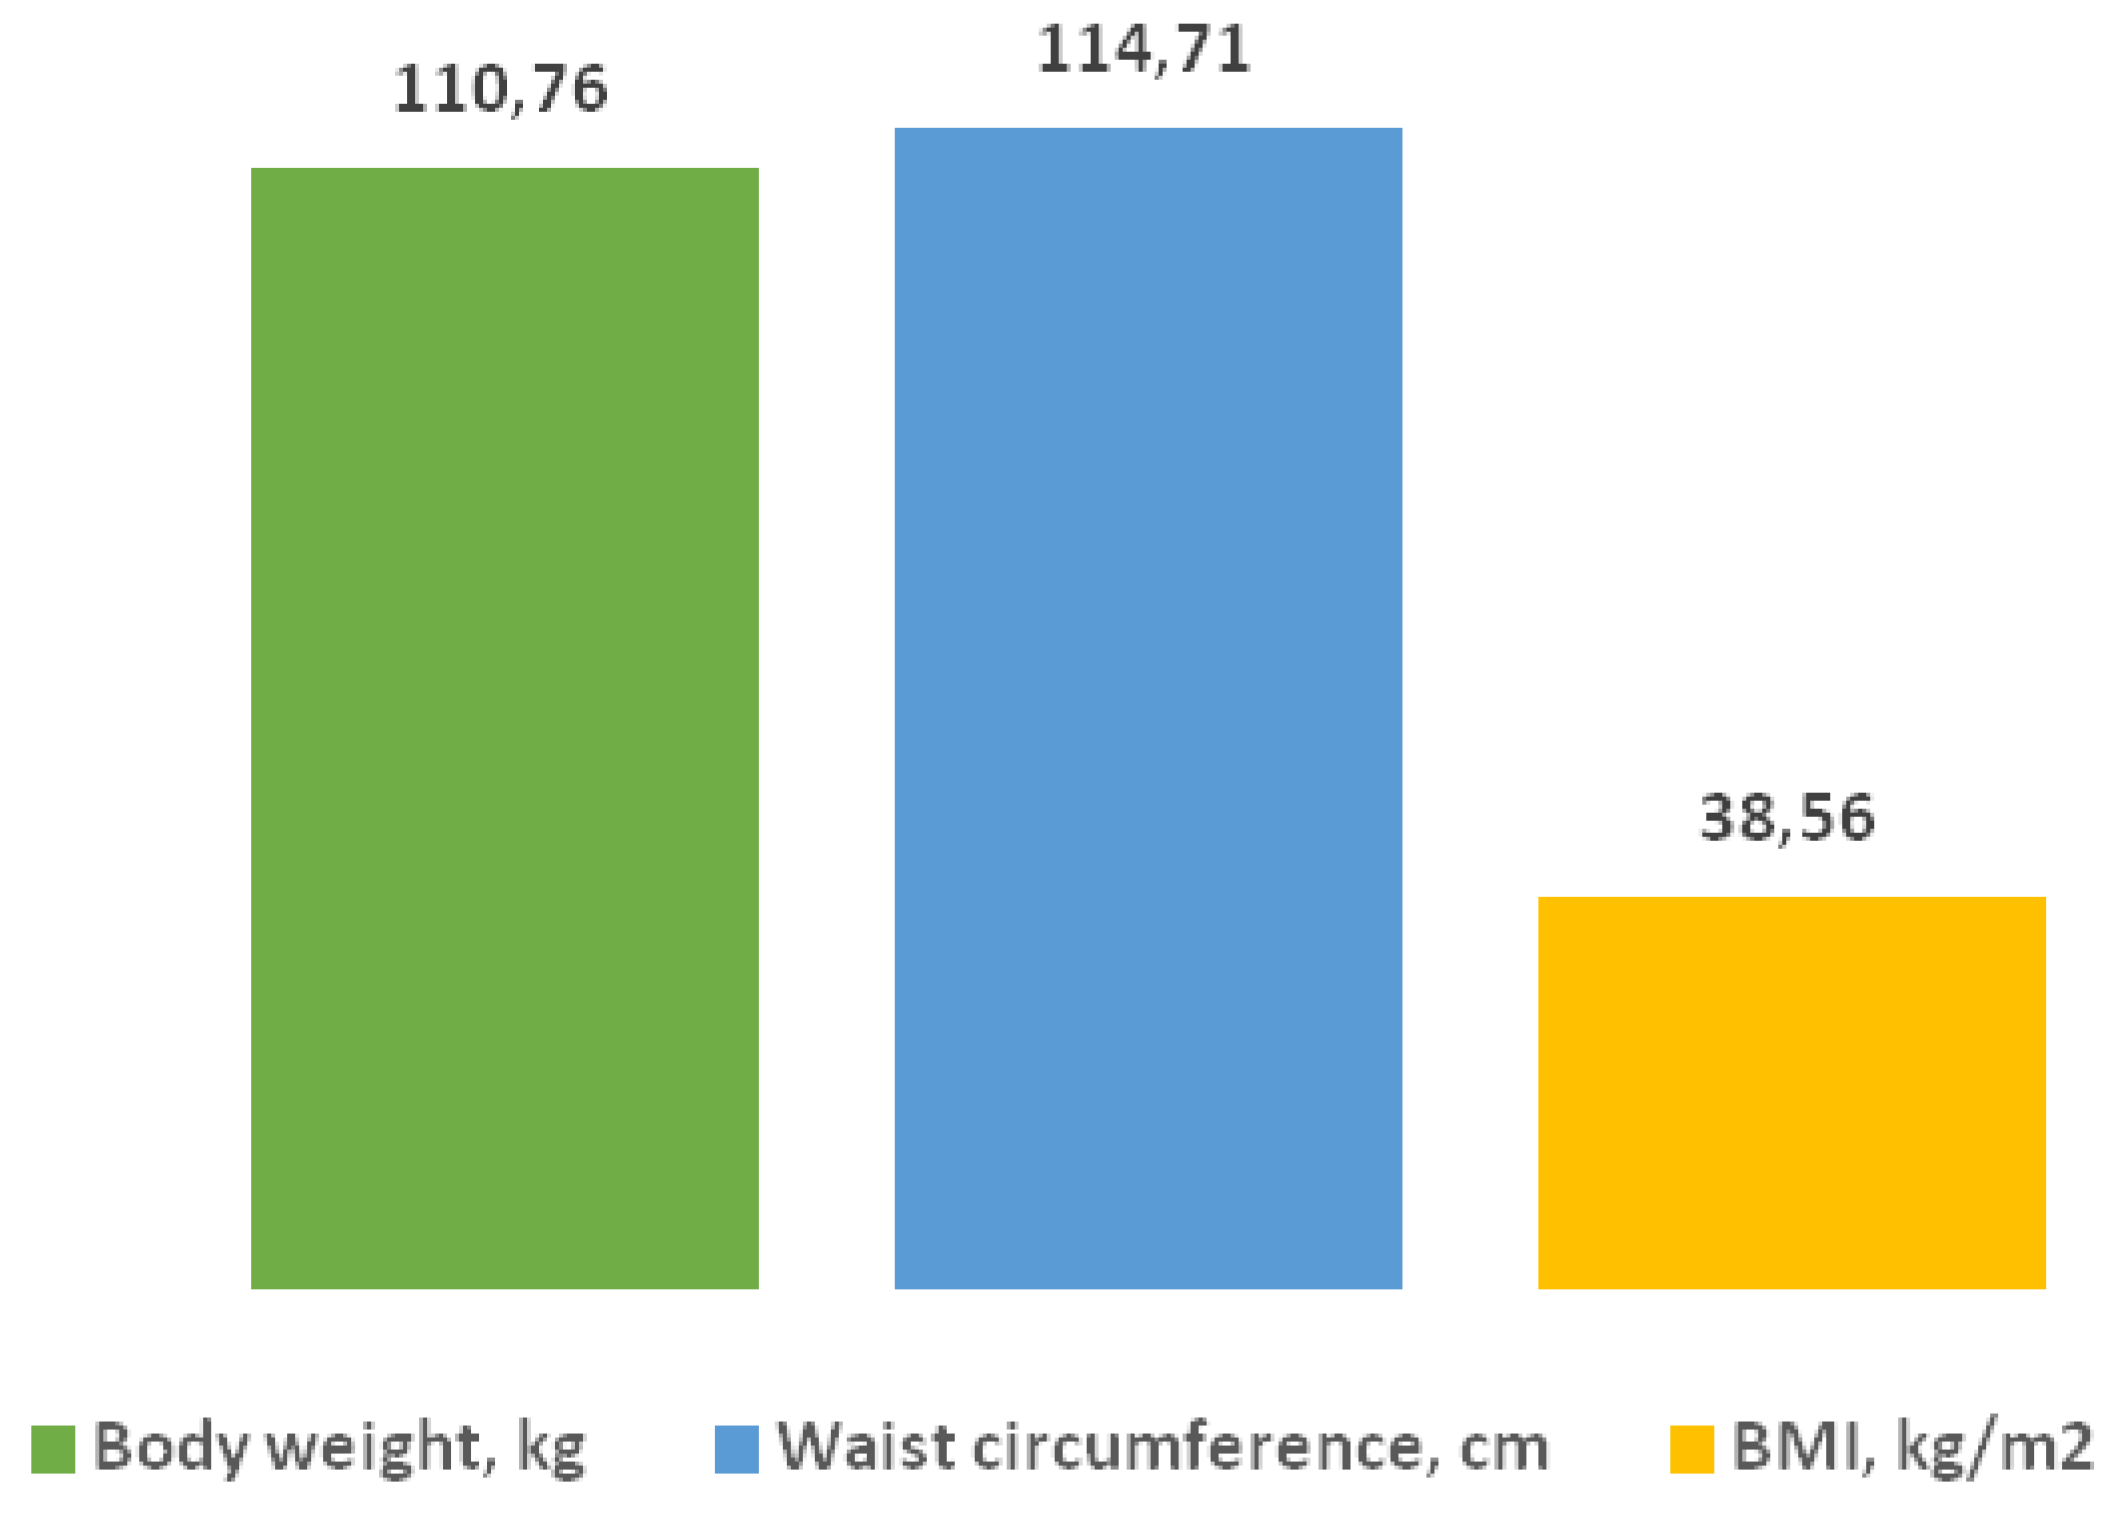
Figure 4.
Laboratory Parameters Changes in Patients with Type 2 Diabetes before and after 6 Months of Treatment with GLP-1 RA.
Figure 4.
Laboratory Parameters Changes in Patients with Type 2 Diabetes before and after 6 Months of Treatment with GLP-1 RA.
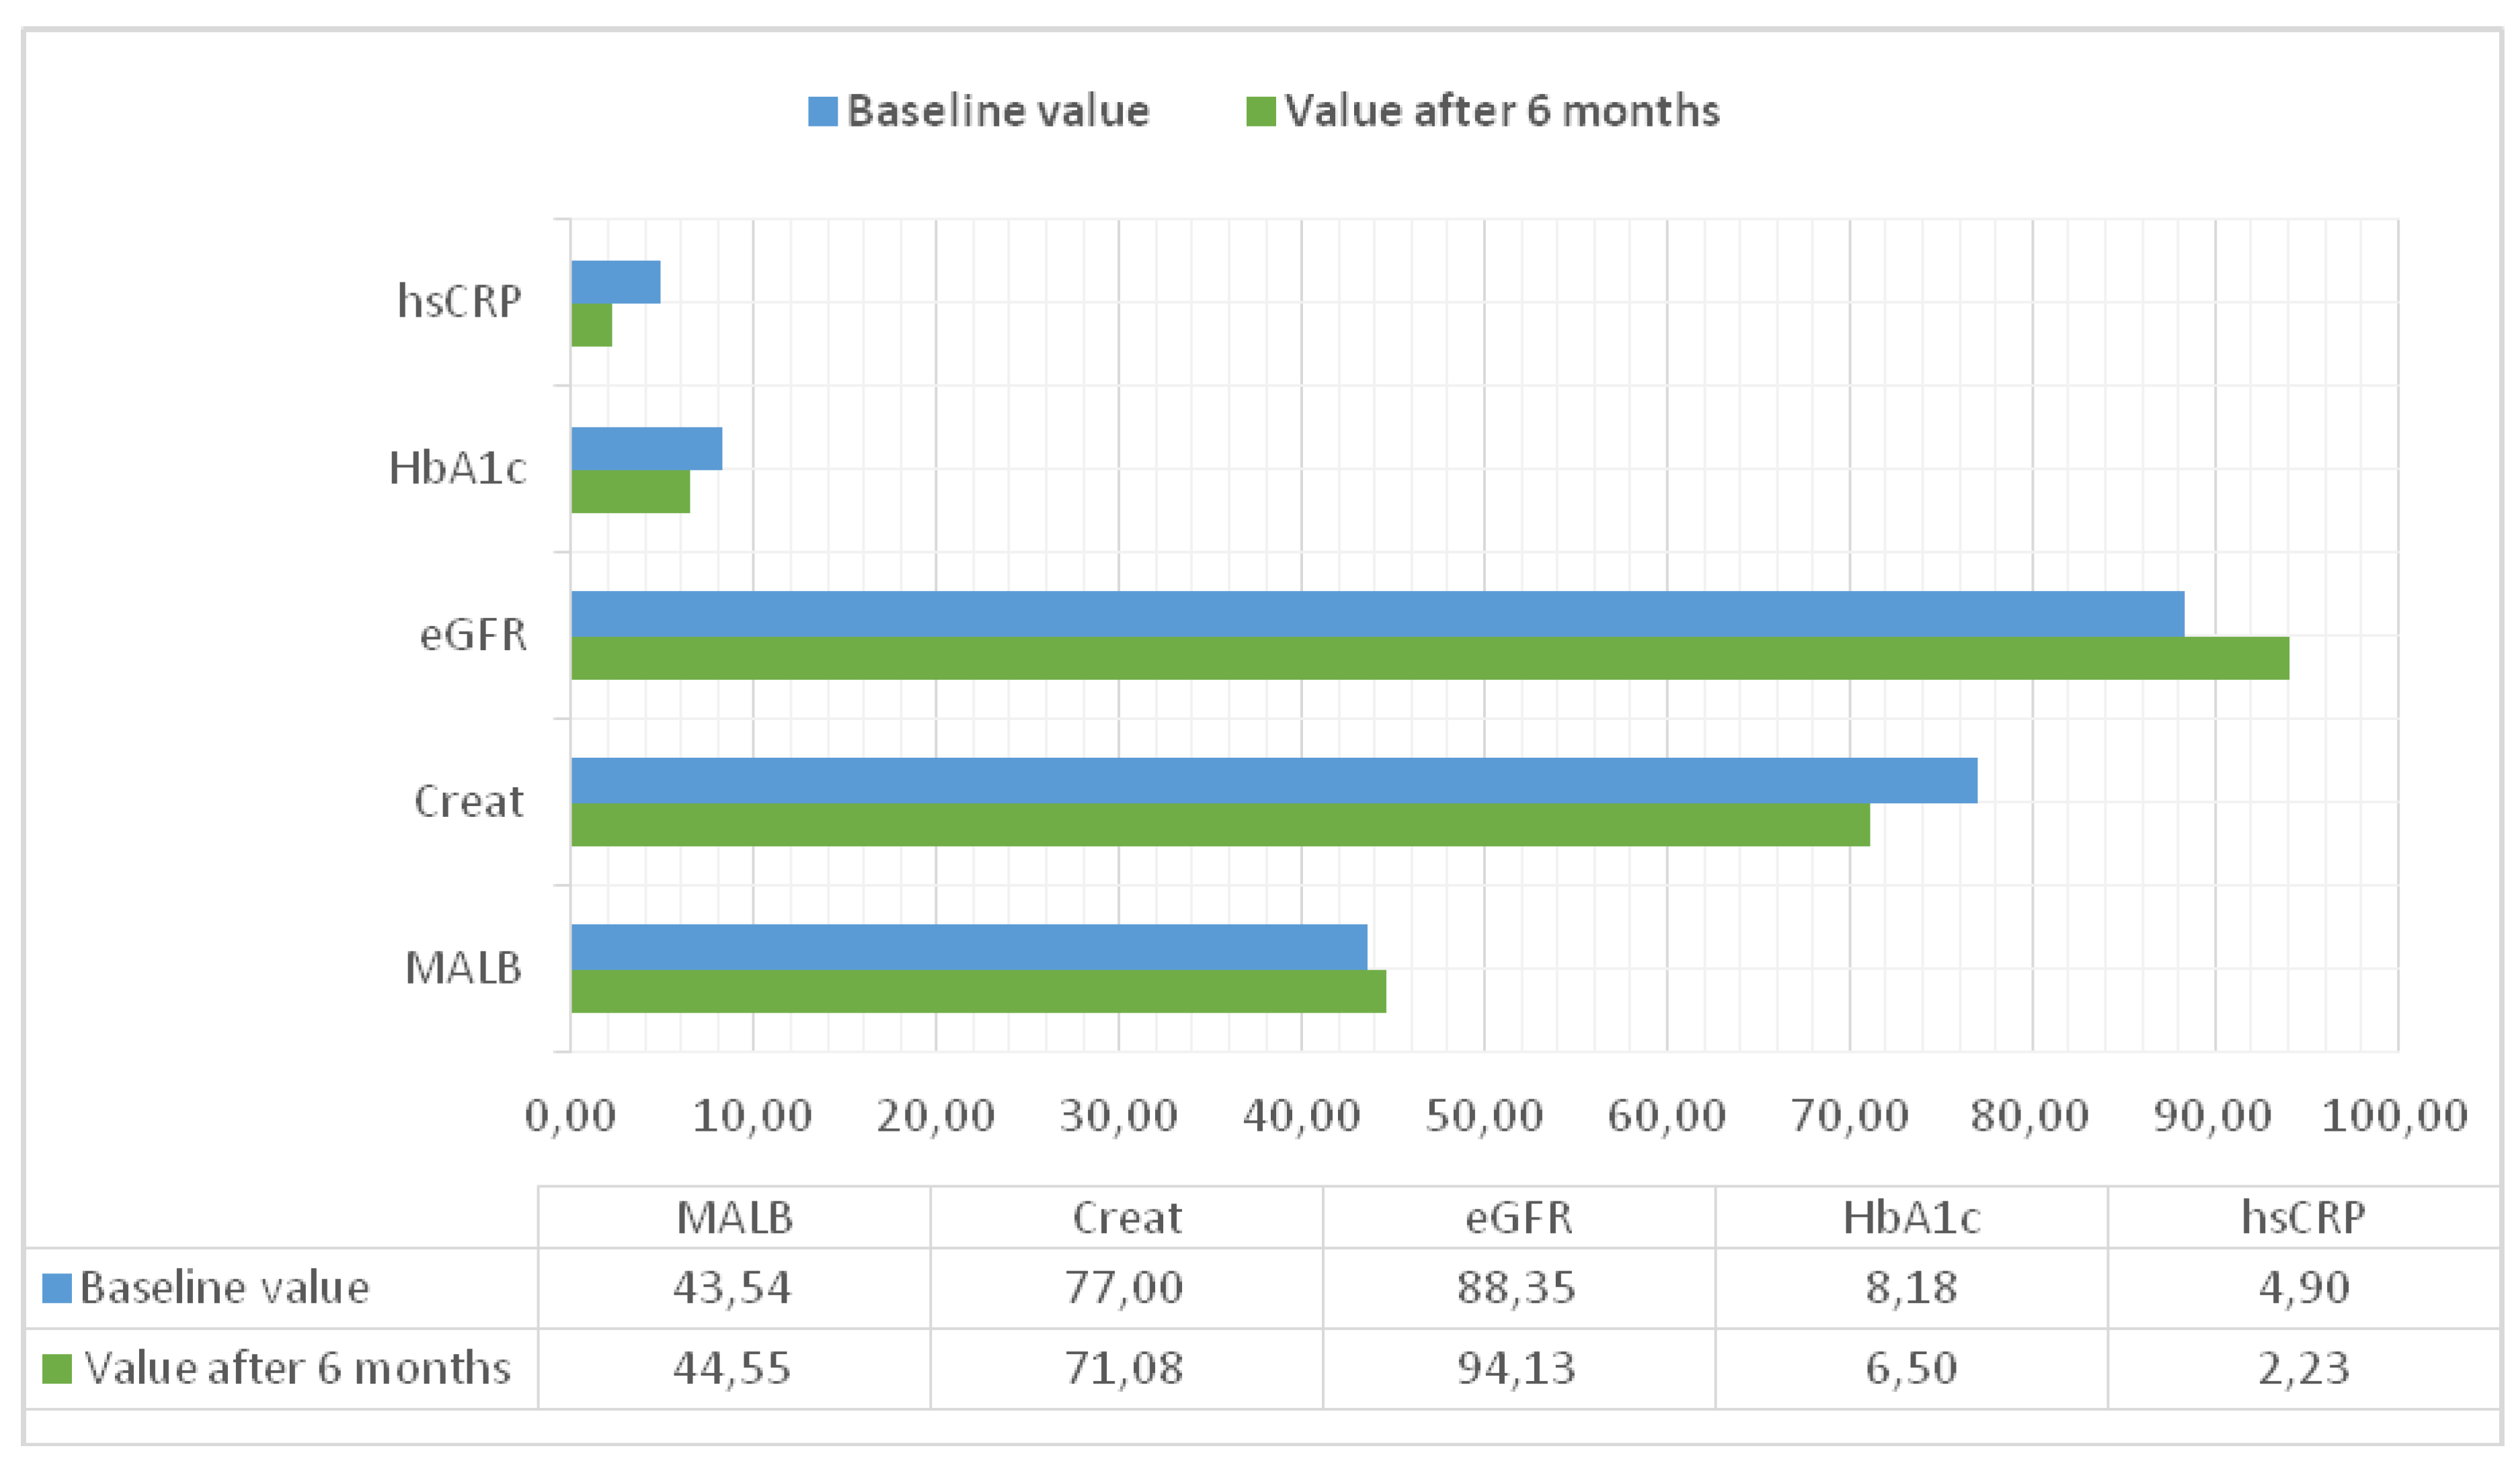
Figure 5.
Change in hsCRP in the course of GLP-1 RA (semaglutide) treatment.
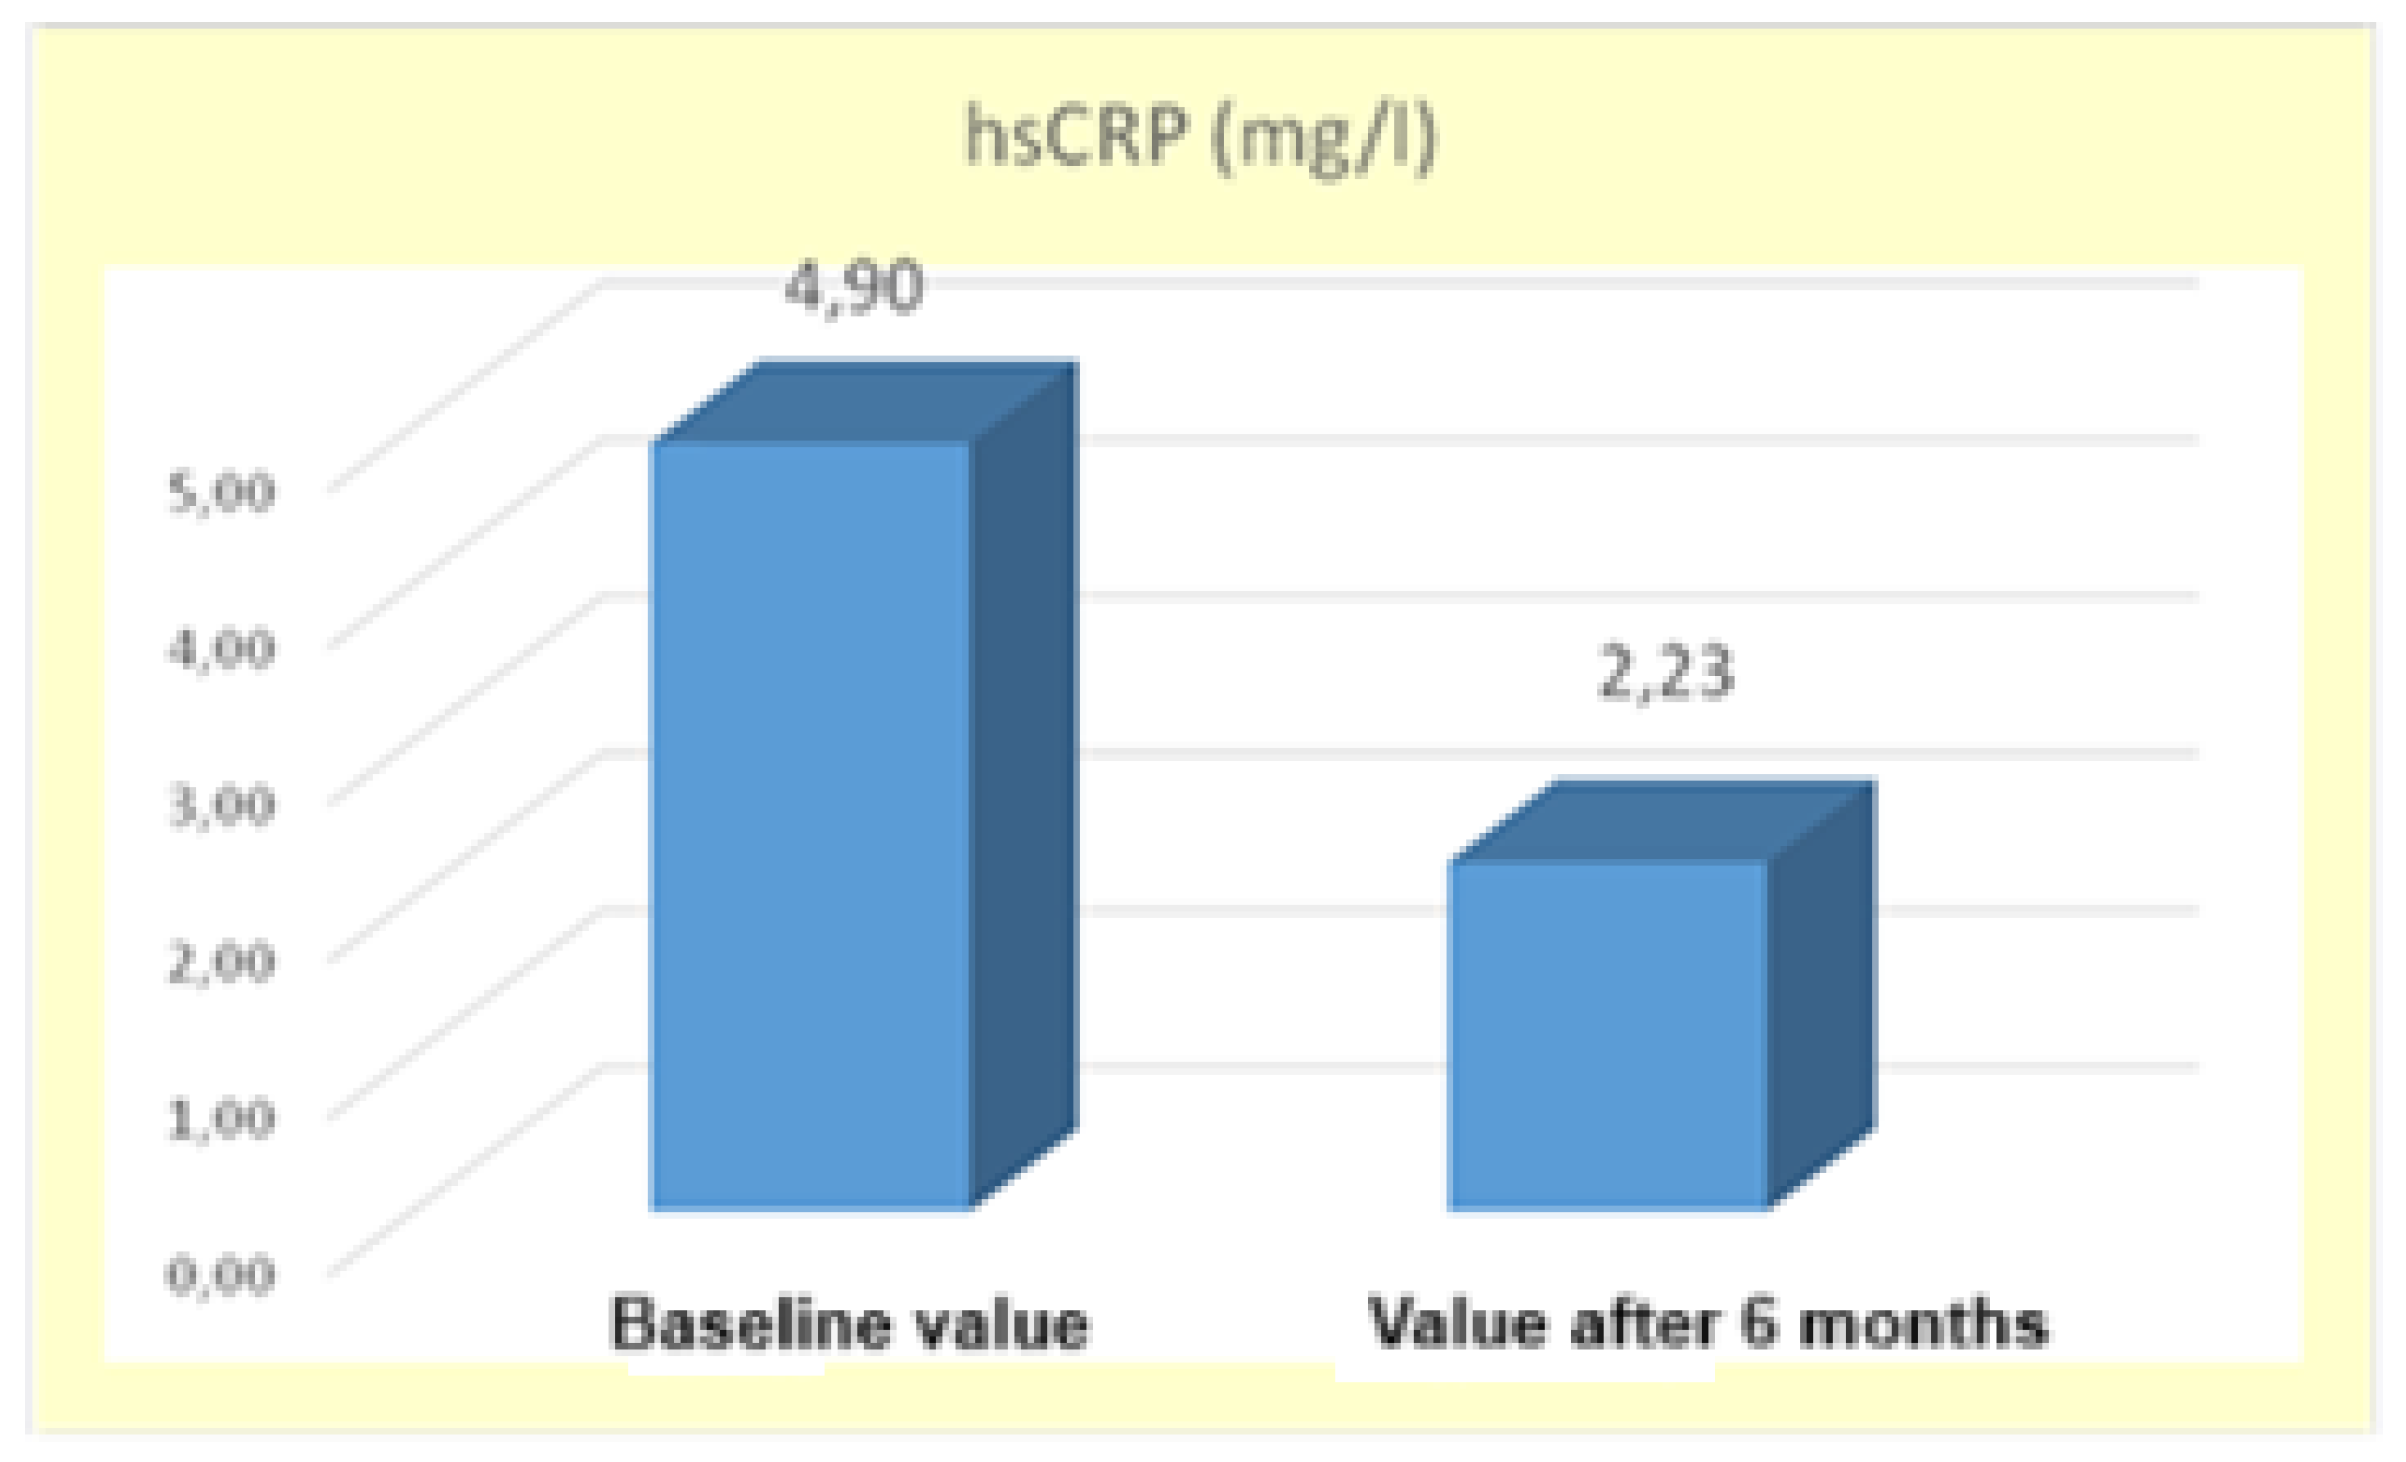
Figure 6.
Change in Glycated Hemoglobin following Administration of GLP-1 RA.
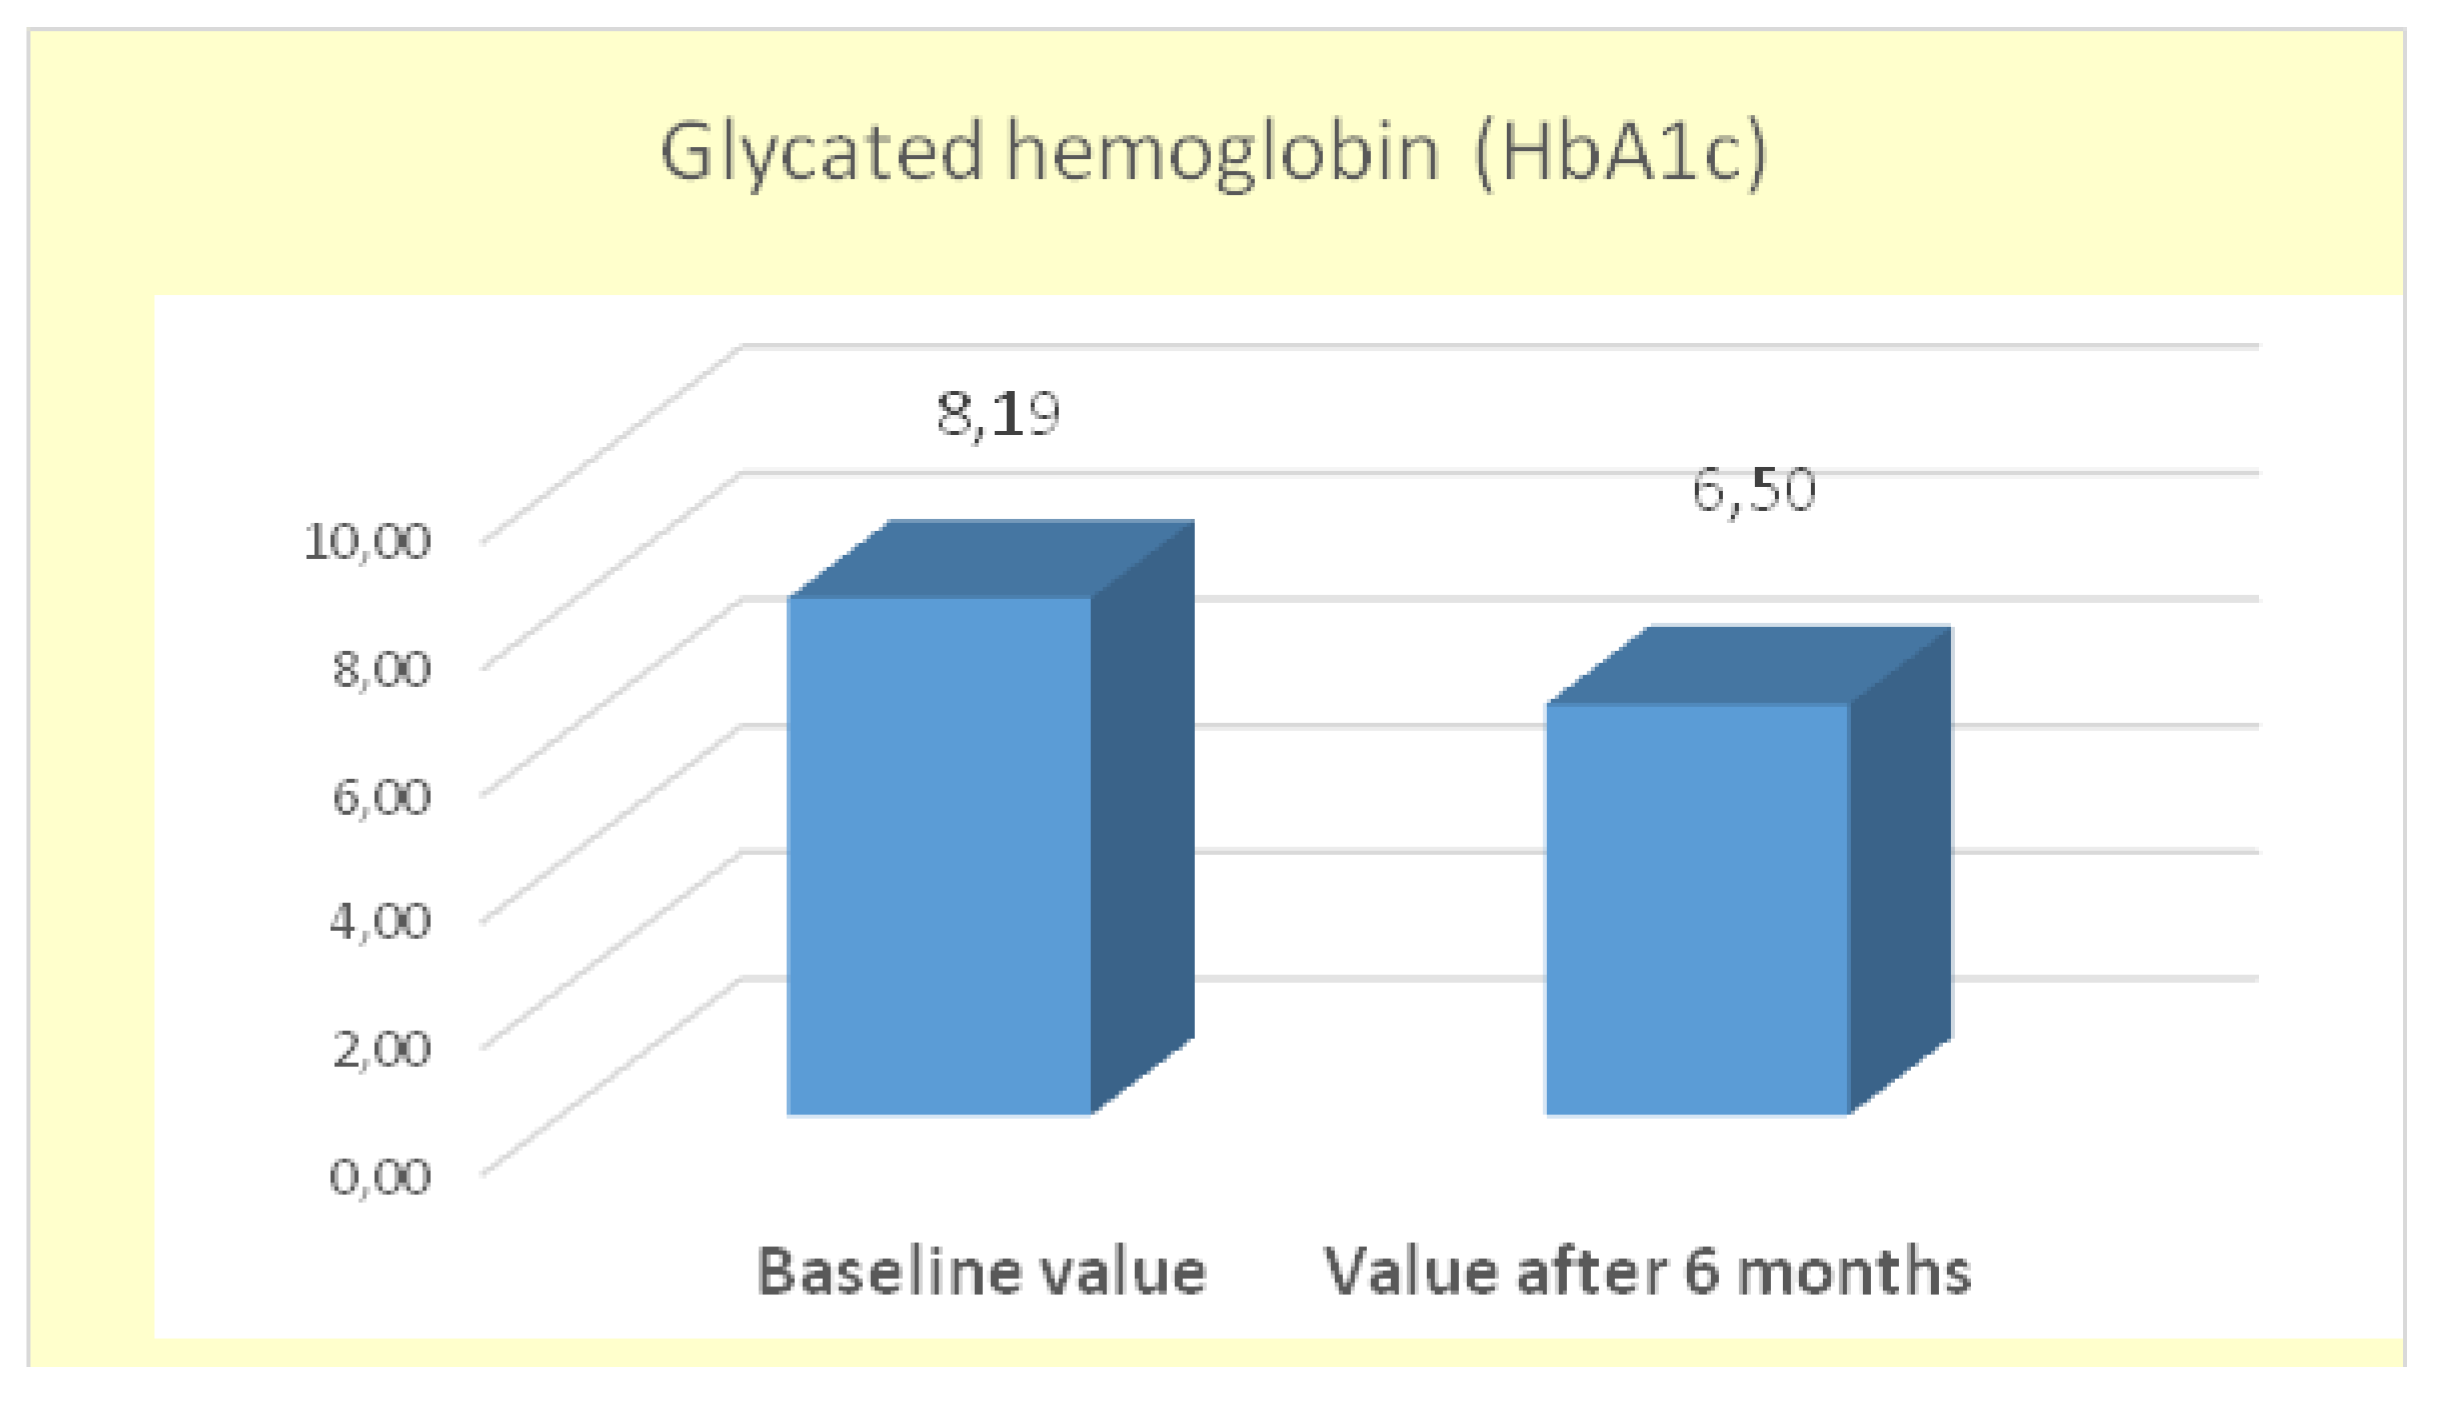
Figure 7.
Dynamics of Changes in the Blood-Glucose Profile Following Administration of GLP-1 RA.
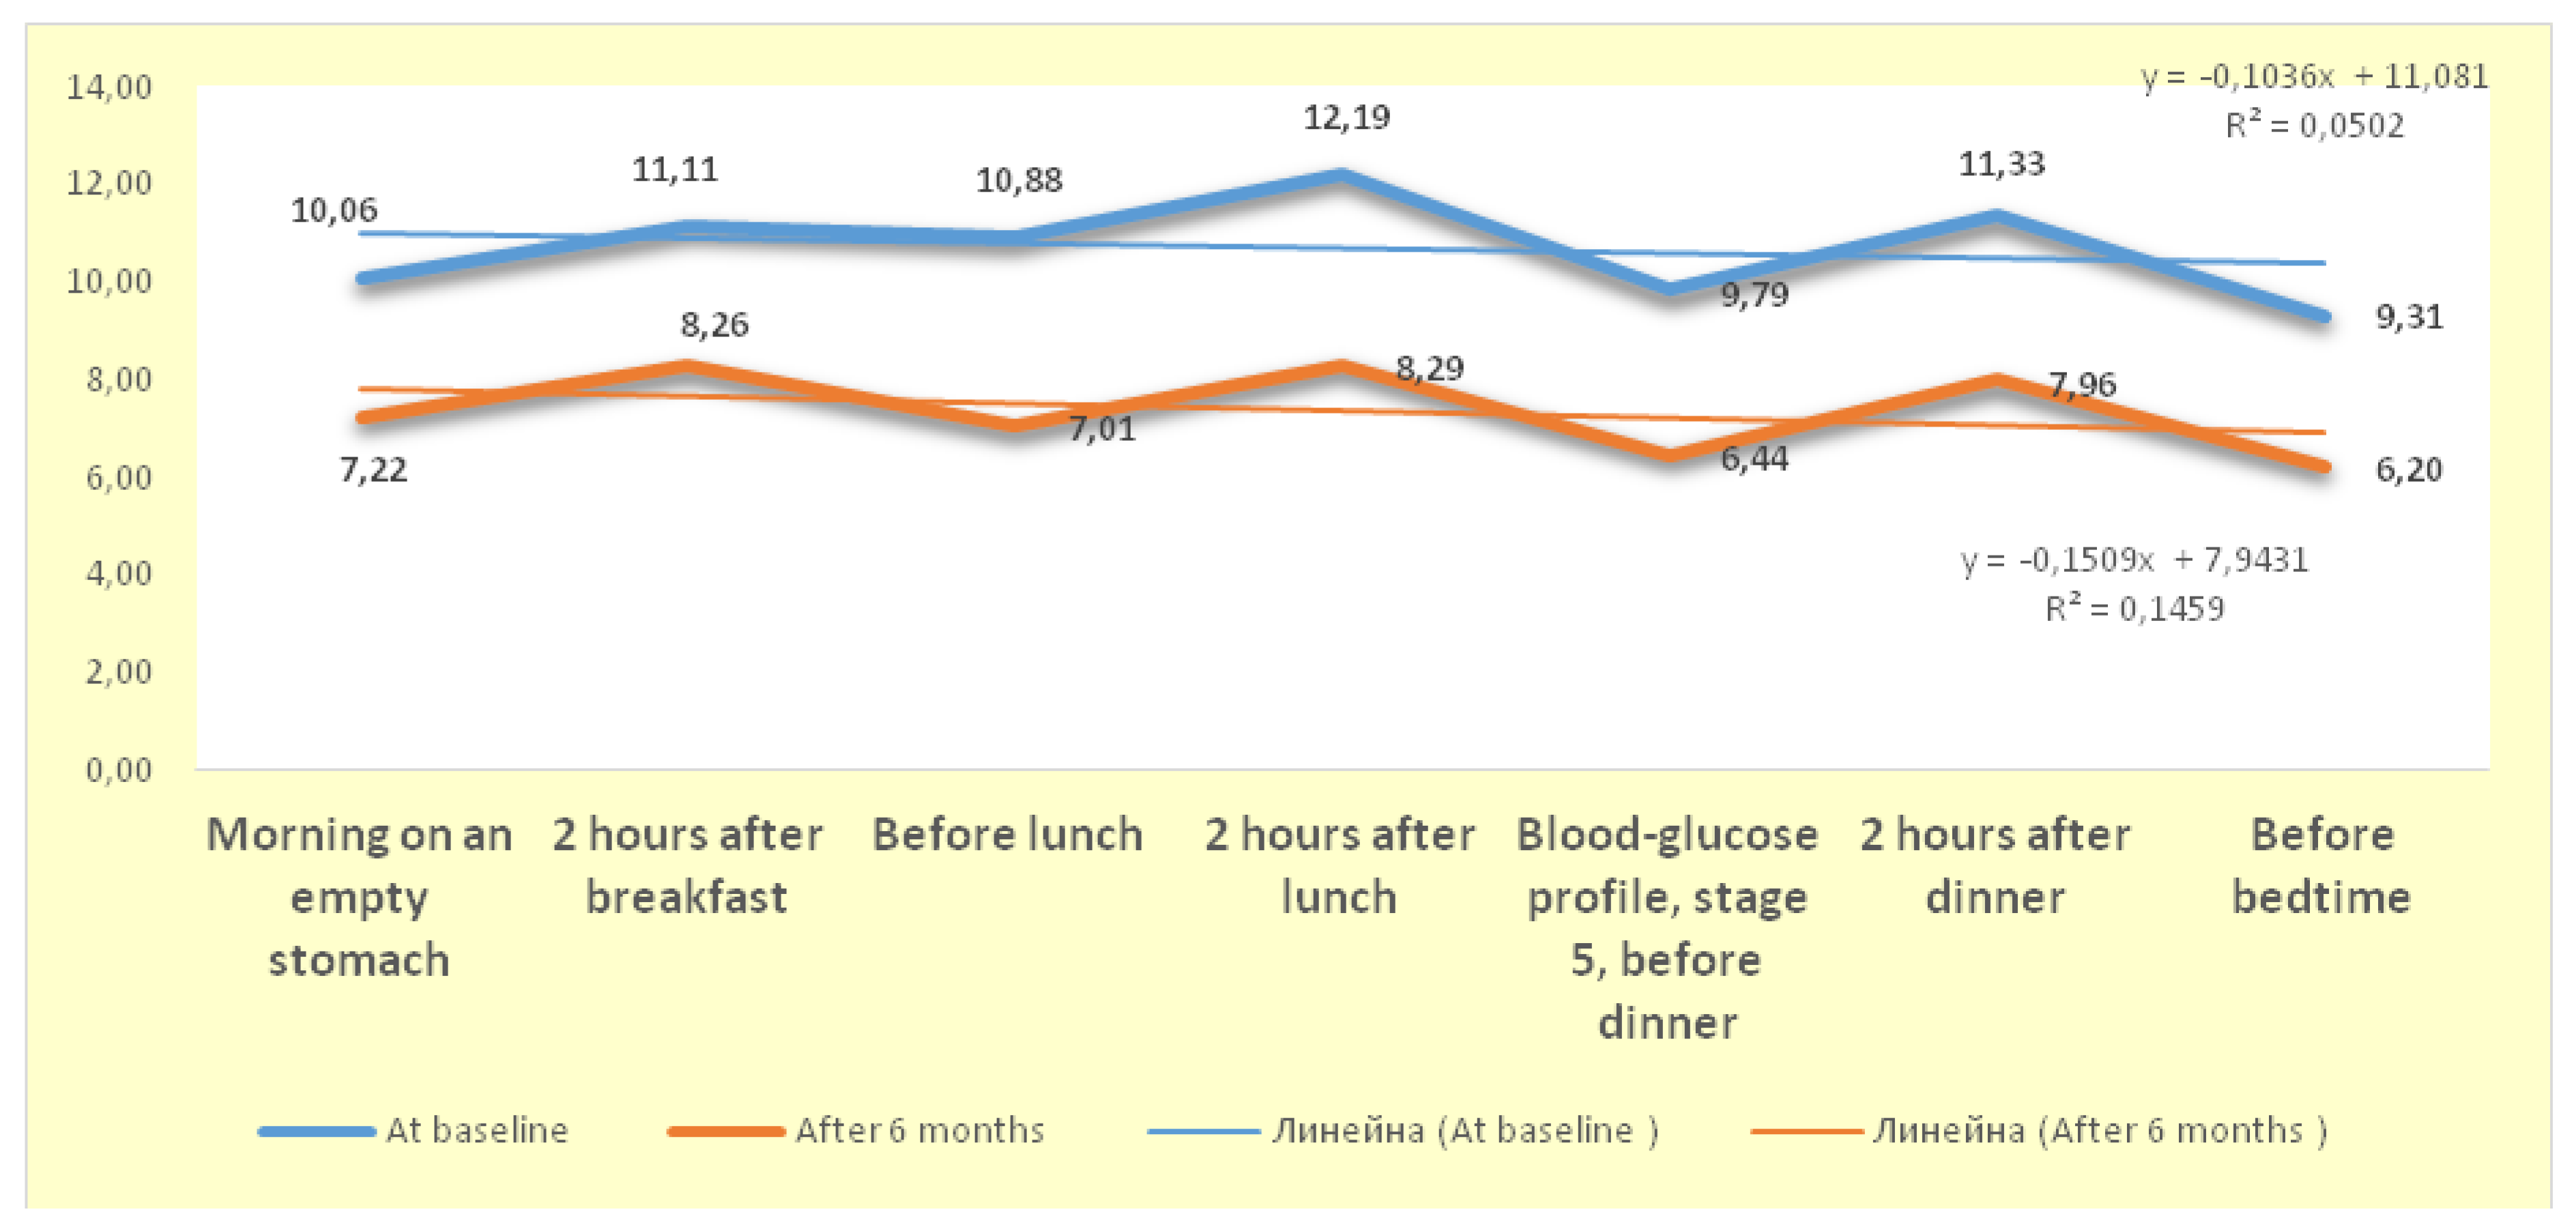
Figure 8.
Linear Correlation Between hsCRP and eGFR in the Initial Stage of Therapy with GLP-1 RA.
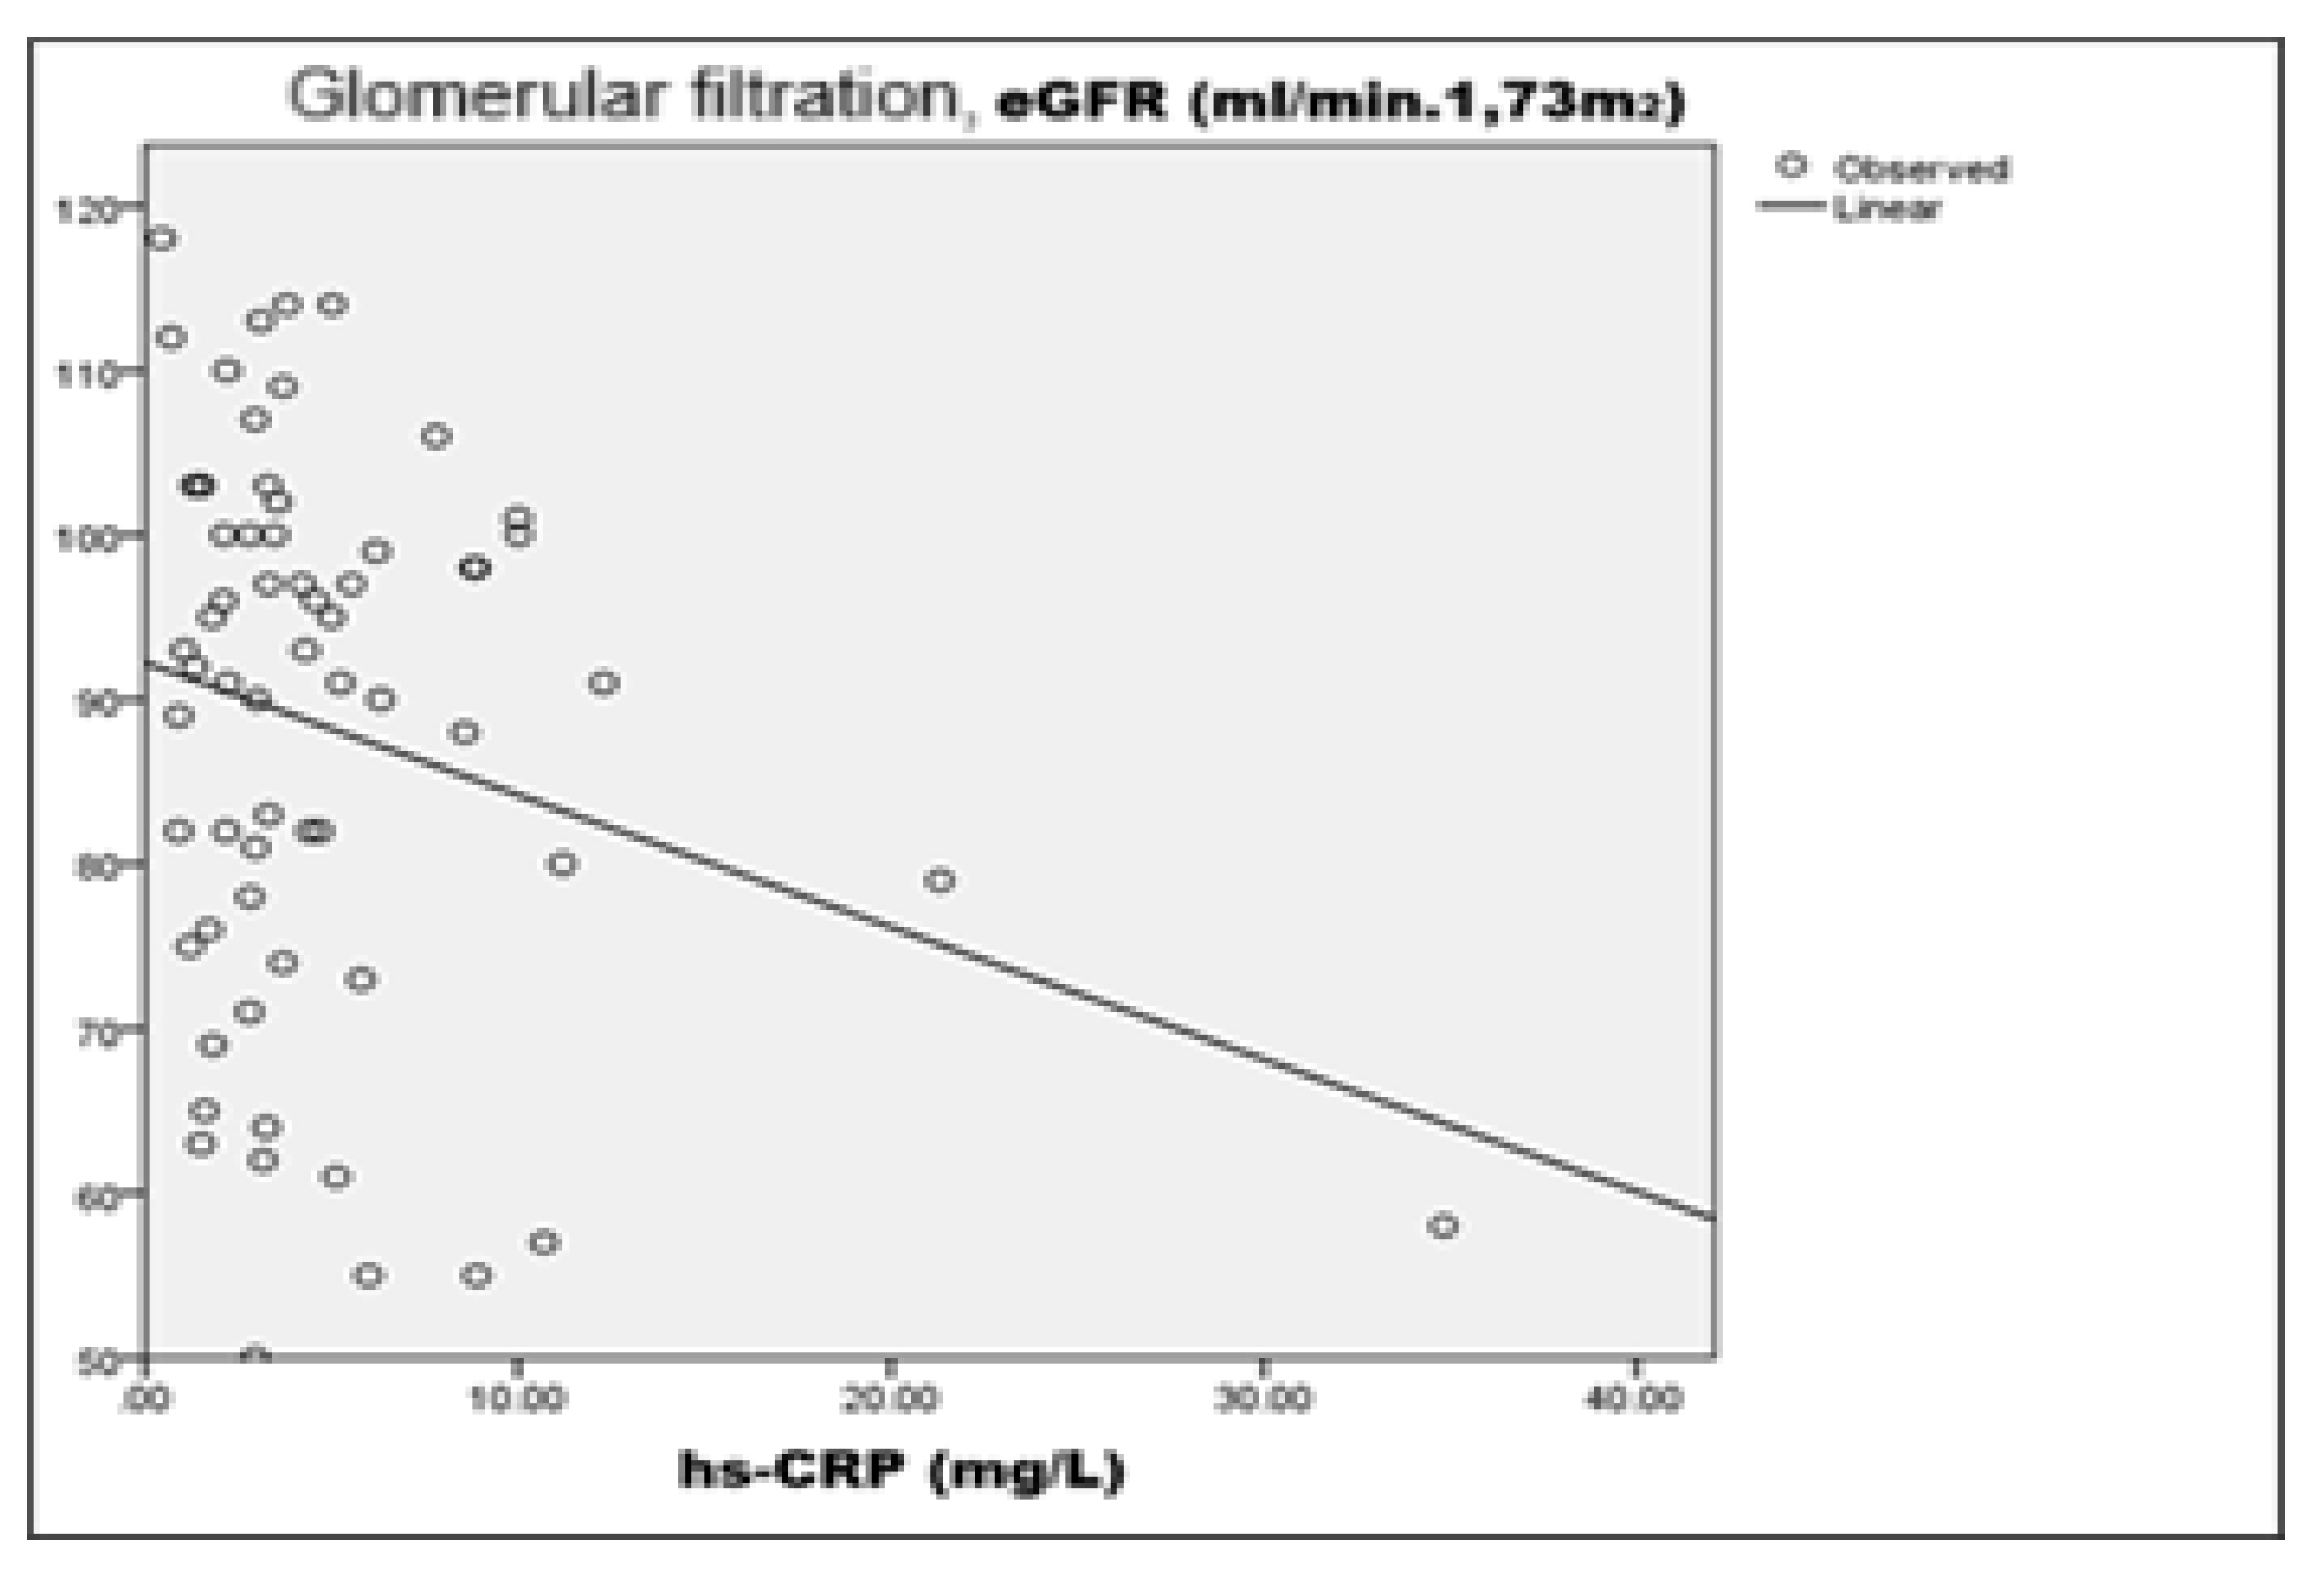
Figure 9.
Linear Correlation Between hsCRP and Creatinine in the Initial Stage of GLP-1 RA therapy.
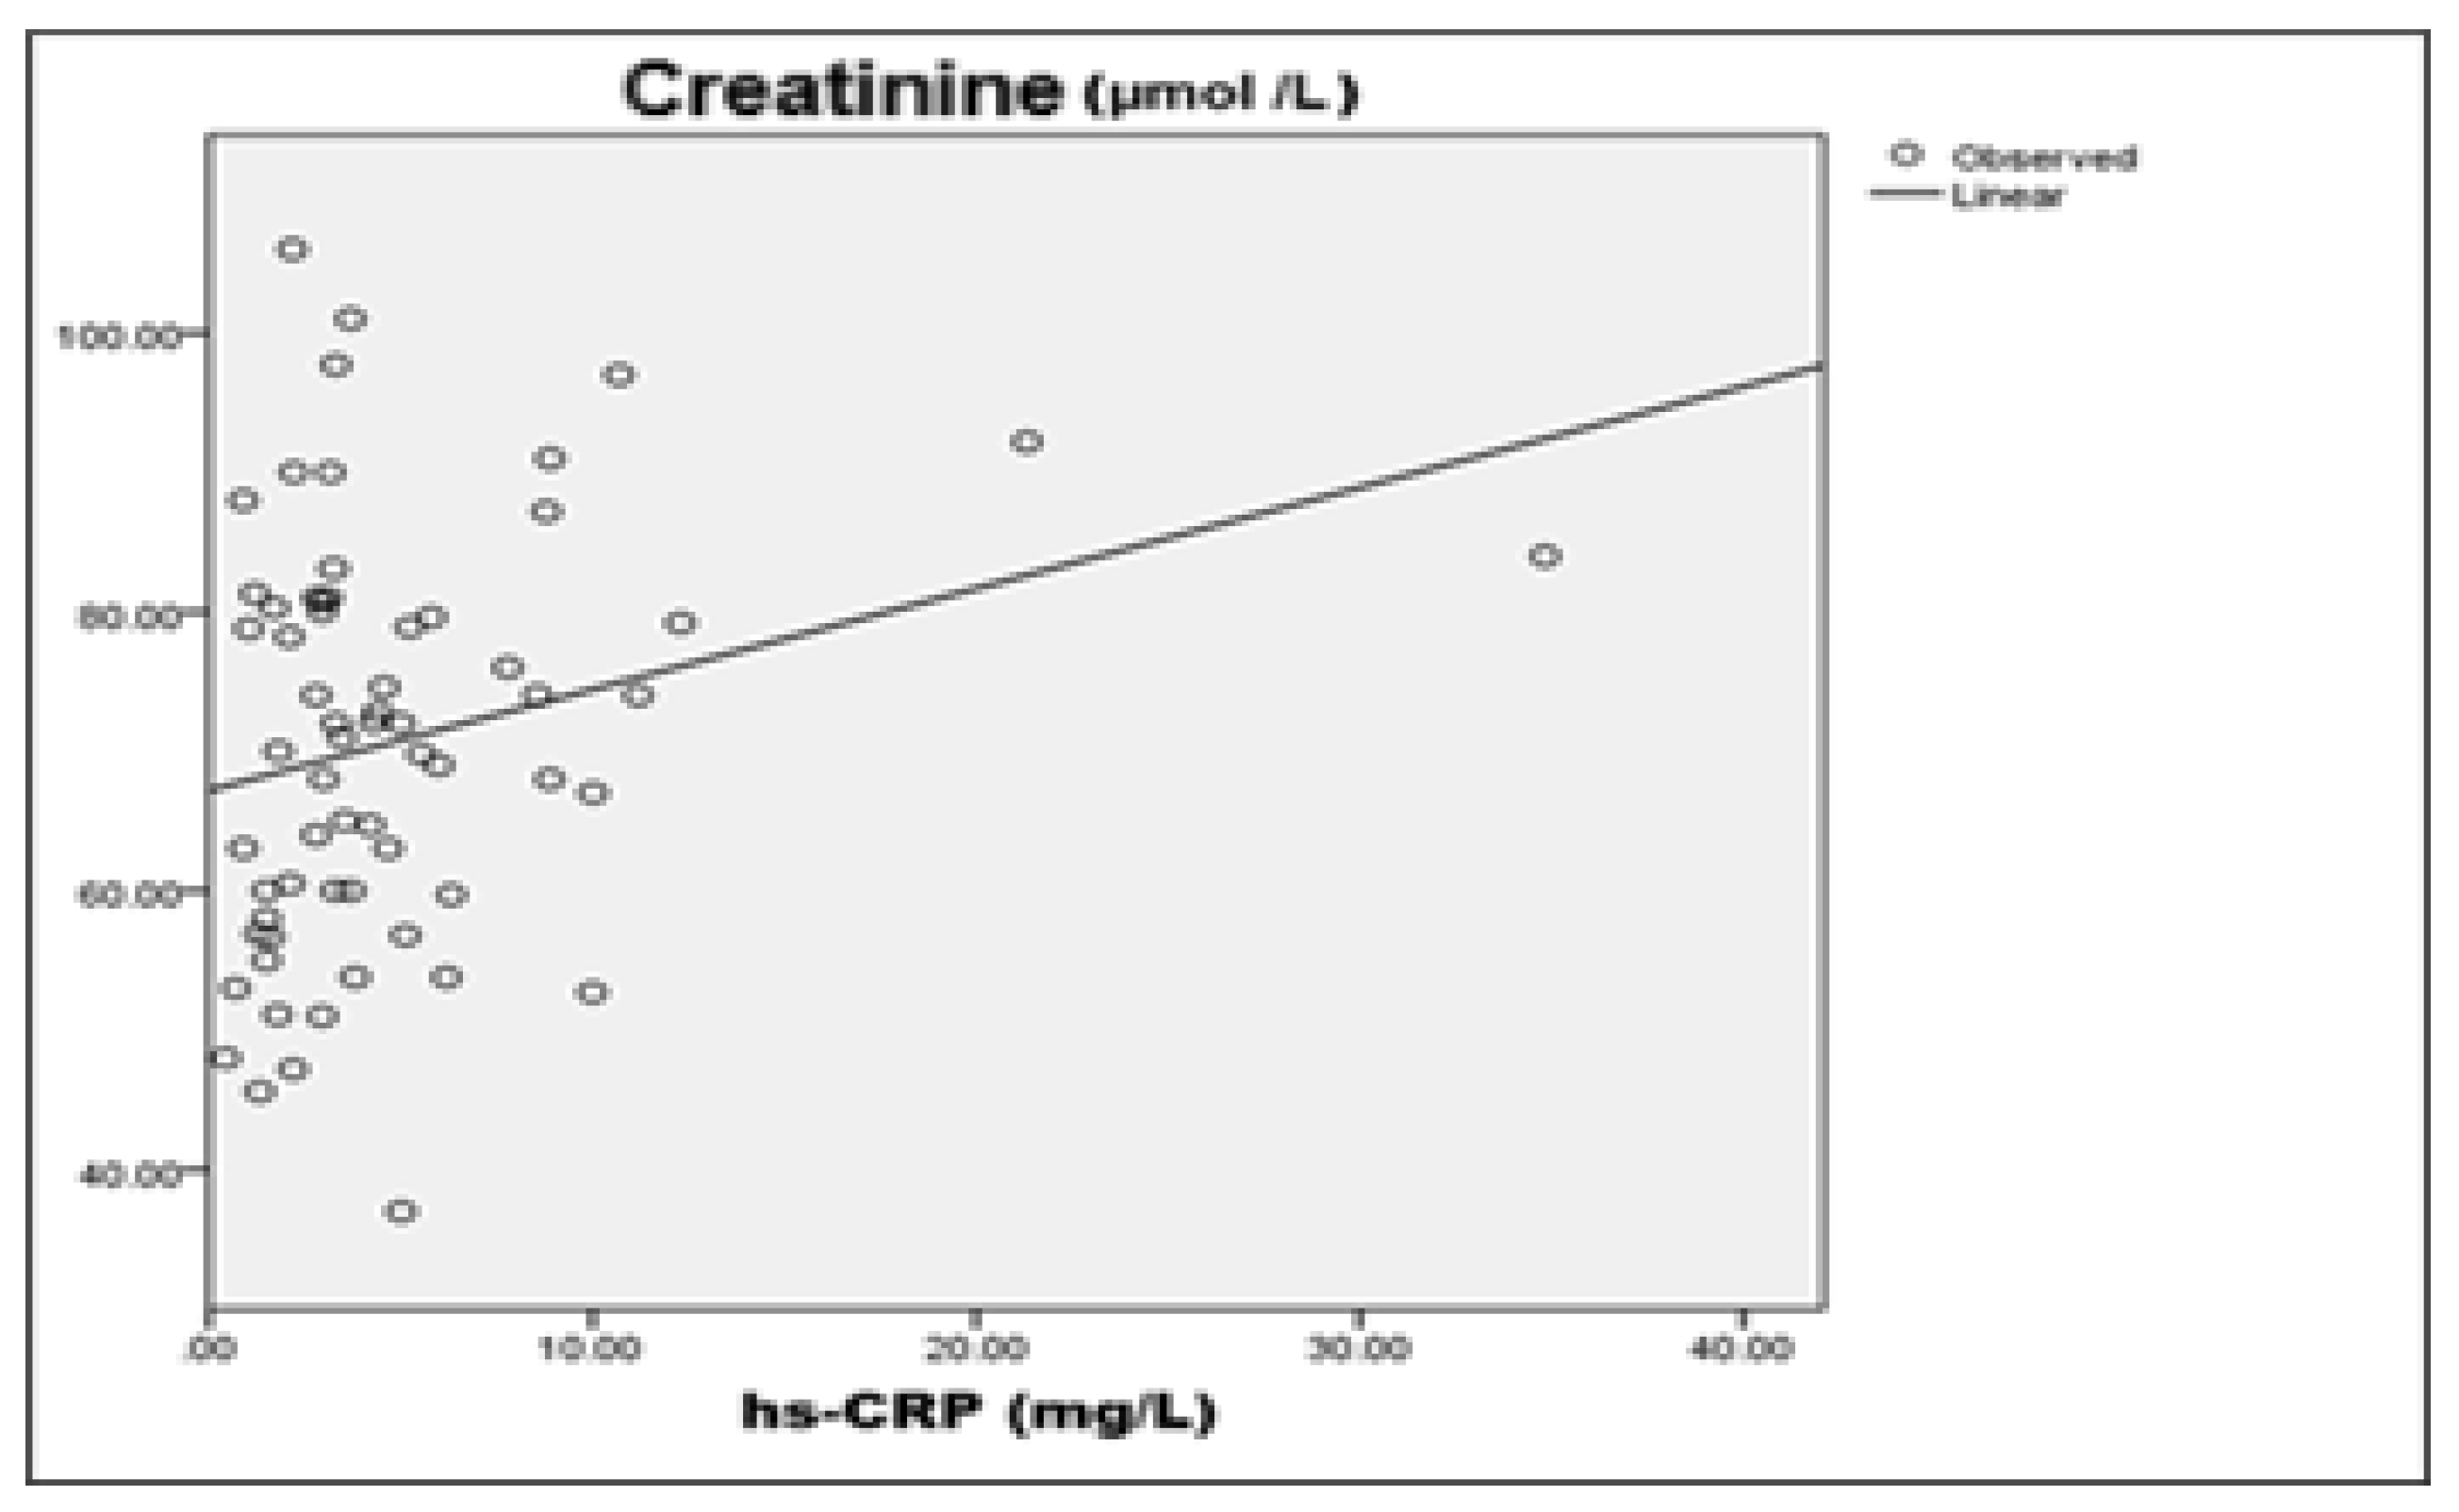
Figure 11.
Linear Correlation Between Creatinine and Glomerular Filtration Rate after 6 Months of Therapy with GLP-1 RA.
Figure 11.
Linear Correlation Between Creatinine and Glomerular Filtration Rate after 6 Months of Therapy with GLP-1 RA.
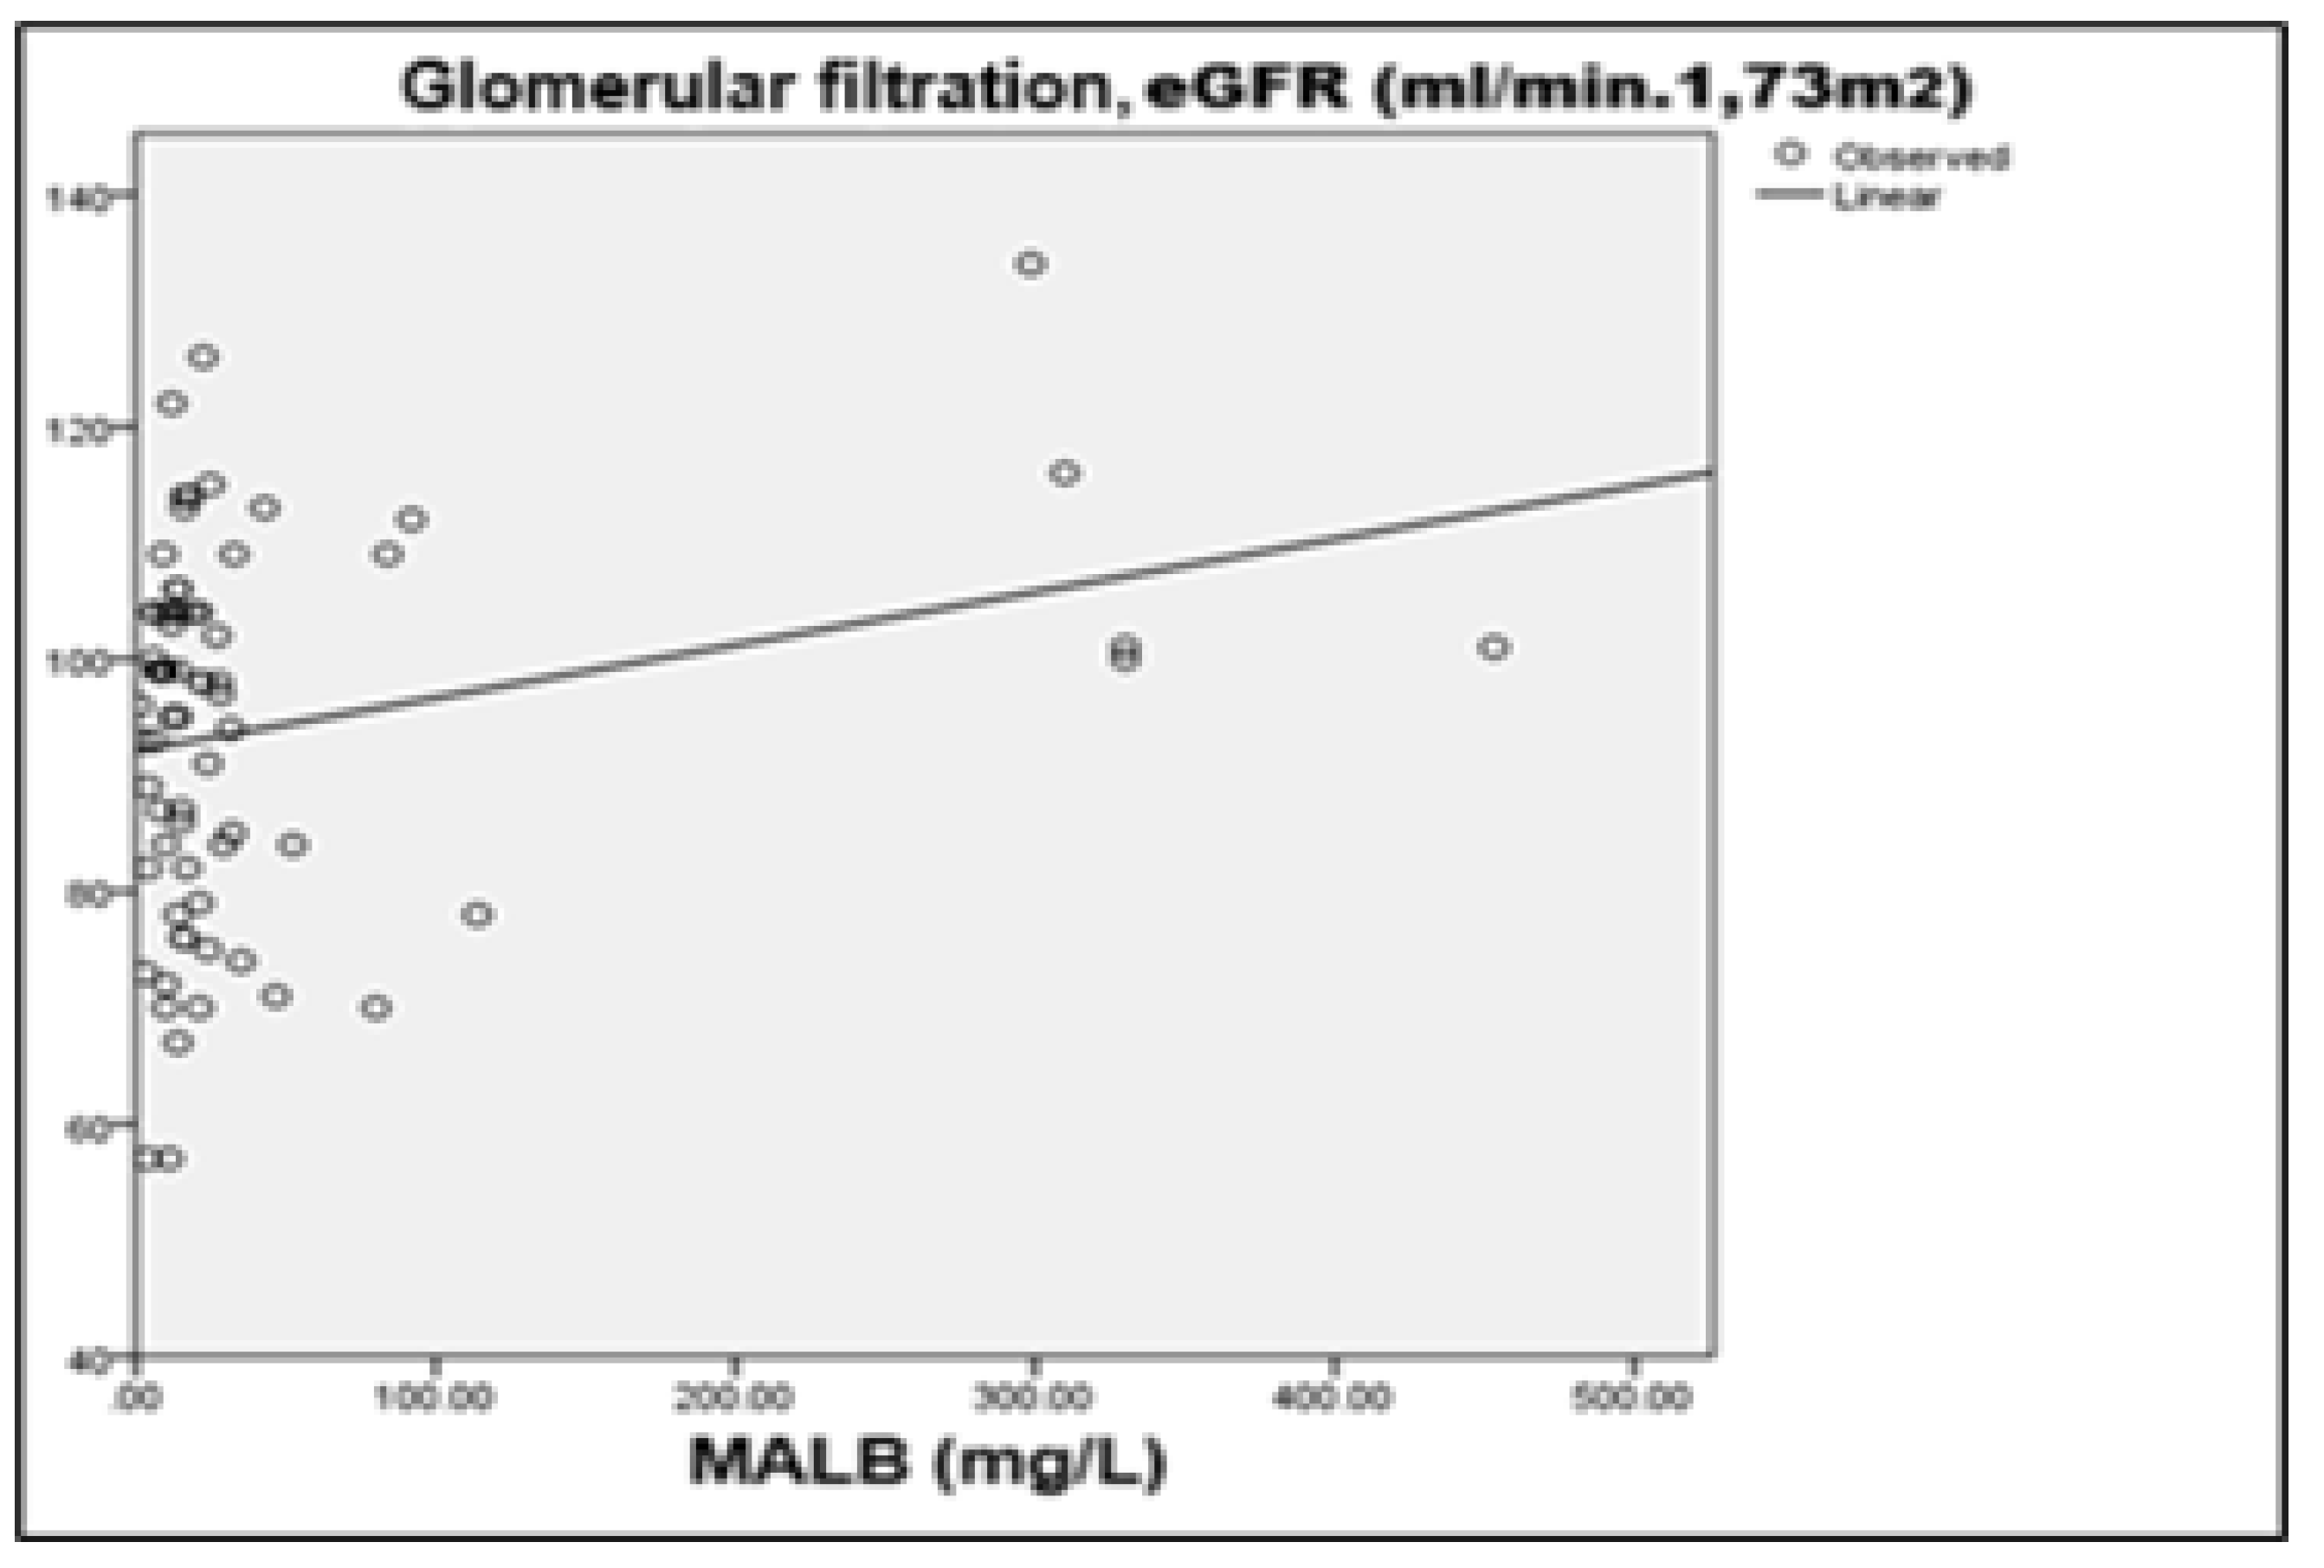
Table 1.
Descriptive Statistics of the Studied Parameters at Baseline and after 6 Months of GLP-1 RA therapy.
Table 1.
Descriptive Statistics of the Studied Parameters at Baseline and after 6 Months of GLP-1 RA therapy.
|
Beginning of therapy | |||||||||
| hsCRP (mg/L) | eGFR (ml/min.1.73m²) | Creatinine (µmol /L) | MALB (mg/L) | HbA1c (%) | BMI | ||||
| N | Valid | 64 | 66 | 66 | 66 | 66 | 66 | ||
| Missing | 2 | 0 | 0 | 0 | 0 | 0 | |||
| Mean value | 4.9025 | 88.57 | 77.0033 | 43.5409 | 8.1897 | 38.5662 | |||
| Std. Deviation | 5.2119 | 17.077 | 14.56903 | 73.62230 | .97865 | 5.46468 | |||
| Range | 34.39 | 68 | 56.00 | 399.00 | 4.00 | 27.97 | |||
| Minimum | .44 | 50 | 55.00 | 1.00 | 7.50 | 30.57 | |||
| Maximum | 34.83 | 118 | 111.00 | 400.00 | 11.50 | 58.54 | |||
|
Results after 6 months | |||||||||
| hsCRP (mg/L) | eGFR (ml/min.1.73m²) | Creatinine (µmol /L) | MALB (mg/L) | HbA1c (%) | BMI | ||||
| N | Valid | 70 | 70 | 70 | 70 | 70 | 70 | ||
| Missing | 0 | 0 | 0 | 0 | 0 | 0 | |||
| Mean | 2.2304 | 94.13 | 71.0876 | 44.5559 | 6.5036 | 35.5551 | |||
| Std. Deviation | 2.2172 | 16.154 | 14.14804 | 87.54986 | 1.19244 | 5.72462 | |||
| Range | 12.35 | 77 | 69.00 | 452.17 | 4.90 | 28.40 | |||
| Minimum | .45 | 57 | 37.00 | 1.00 | 4.90 | 26.97 | |||
| Maximum | 12.80 | 134 | 106.00 | 453.17 | 9.80 | 55.37 | |||
| a. Multiple modes exist. The smallest value is shown | |||||||||
Table 2.
Correlation Matrix Between Biomarkers and Clinical Parameters at the Baseline of GLP-1 RA therapy.
Table 2.
Correlation Matrix Between Biomarkers and Clinical Parameters at the Baseline of GLP-1 RA therapy.
|
Correlations | |||||||
| CRP (mg/L) | eGFR (ml/min.1,73m²) | Creatinine (µmol/L) | MALB (mg/L) | HbA1c (%) | BMI | ||
|
CRP (mg/L) |
Pearson Correlation | 1 | -.246* | .341** | .096 | .067 | -.014 |
| Sig. (2-tailed) | .050 | .006 | .449 | .600 | .914 | ||
| eGFR (ml/min.1,73m²) | Pearson Correlation | -.246 | 1 | -.768** | .125 | .173 | -.069 |
| Sig. (2-tailed) | .050 | .000 | .317 | .165 | .583 | ||
|
Creatinine (µmol/L) |
Pearson Correlation | .341** | -.768** | 1 | -.004 | .002 | .162 |
| Sig. (2-tailed) | .006 | .000 | .972 | .986 | .193 | ||
|
MALB (mg/L) |
Pearson Correlation | .096 | .125 | -.004 | 1 | .029 | -.129 |
| Sig. (2-tailed) | .449 | .317 | .972 | .819 | .303 | ||
|
HbA1c (%) |
Pearson Correlation | .067 | .173 | .002 | .029 | 1 | -.110 |
| Sig. (2-tailed) | .600 | .165 | .986 | .819 | .378 | ||
|
BMI |
Pearson Correlation | -.014 | -.069 | .162 | -.129 | -.110 | 1 |
| Sig. (2-tailed) | .914 | .583 | .193 | .303 | .378 | ||
| N | 64 | 66 | 66 | 66 | 66 | 66 | |
| **. Correlation is significant at the 0.01 level (2-tailed). | |||||||
Table 3.
Correlation Matrix of Variables after 6 Months of GLP-1 RA Administration.
|
Correlations | |||||||
| CRP (mg/L) | eGFR (ml/min.1,73m²) | HbA1c (%) | Creatinine (µmol /L) | MALB (mg/L) | Body weight (kg) | ||
| CRP (mg/L) | Pearson Correlation | 1 | -.137 | .233 | .082 | .211 | .135 |
| Sig. (2-tailed) | .259 | .052 | .499 | .080 | .264 | ||
| eGFR (ml/min.1,73m²) | Pearson Correlation | -.137 | 1 | .060 | -.759** | .247* | .153 |
| Sig. (2-tailed) | .259 | .619 | .000 | .039 | .206 | ||
| HbA1c (%) | Pearson Correlation | .233 | .060 | 1 | -.146 | .205 | .295* |
| Sig. (2-tailed) | .052 | .619 | .227 | .088 | .013 | ||
|
Creatinine (µmol /L) |
Pearson Correlation | .082 | -.759** | -.146 | 1 | -.174 | .120 |
| Sig. (2-tailed) | .499 | .000 | .227 | .150 | .324 | ||
| MALB (mg/L) | Pearson Correlation | .211 | .247* | .205 | -.174 | 1 | .195 |
| Sig. (2-tailed) | .080 | .039 | .088 | .150 | .105 | ||
| Body weight (kg) | Pearson Correlation | .135 | .153 | .295* | .120 | .195 | 1 |
| Sig. (2-tailed) | .264 | .206 | .013 | .324 | .105 | ||
| N | 70 | 70 | 70 | 70 | 70 | 70 | |
| **. Correlation is significant at the 0.01 level (2-tailed). | |||||||
| *. Correlation is significant at the 0.05 level (2-tailed). | |||||||
Disclaimer/Publisher’s Note: The statements, opinions and data contained in all publications are solely those of the individual author(s) and contributor(s) and not of MDPI and/or the editor(s). MDPI and/or the editor(s) disclaim responsibility for any injury to people or property resulting from any ideas, methods, instructions or products referred to in the content. |
© 2025 by the authors. Licensee MDPI, Basel, Switzerland. This article is an open access article distributed under the terms and conditions of the Creative Commons Attribution (CC BY) license (http://creativecommons.org/licenses/by/4.0/).
Copyright: This open access article is published under a Creative Commons CC BY 4.0 license, which permit the free download, distribution, and reuse, provided that the author and preprint are cited in any reuse.


