
Submitted:
22 August 2025
Posted:
25 August 2025
You are already at the latest version
Abstract
The primary objective of this study was to assess the safety and benefits of a nutritional supplement containing 100 mg of 5-aminolevulinic acid phosphate and 29 mg of sodium ferrous citrate (5-ALA phosphate/SFC) in patients with diabetes when administered in conjunction with standard-of-care hypoglycemic treatment. This post-marketing surveillance (PMS) study included 100 male and female diabetic patients from 14 healthcare centers in Bahrain, all of whom received 5-ALA phosphate/SFC in addition to their routine diabetes medications. Outcomes were compared with data from 96 historical control patients who received standard-of-care treatment alone. Data were collected at 16-week intervals: pre-study (t0–16 weeks), at treatment initiation (t0), at the end of treatment (t0+16 weeks), and at post-treatment follow-up (t0+32 weeks). Adverse events reported were either mild or unrelated to the supplement. Patients receiving 5-ALA phosphate/SFC were categorized into four response classes based on changes in HbA1c levels: super-responders, responders, steady-responders, and non-responders. Statistically significant reductions in HbA1c were observed in both the super-responder and responder classes at post-treatment follow-up (p < 0.05). No abnormalities were noted in blood laboratory analyses post-treatment. Among non-responders, insulin was administered when oral hypoglycemic agents proved ineffective due to severe insulin resistance. The findings suggest that 5-ALA phosphate/SFC is a safe and effective adjunct oral hypoglycemic supplement when used with standard-of-care treatments for diabetes. It was postulated that 5-ALA phosphate/SFC upregulates mitochondrial function. A follow-up study was also conducted to evaluate the supplement’s potential effect on mitochondrial activity, a factor often impaired in insulin-resistant individuals, particularly among super-responders. Further randomized, double-blind, placebo-controlled trials are warranted to confirm these findings.
Keywords:
5-aminolevulinic acid (5-ALA)
; Type 2 diabetes mellitus
; mitochondrial 43 dysfunction
; heme
; oral hypoglycemic agents’ algorithm
1. Introduction
1.1. The Impact and Response to Diabetes Mellitus
Diabetes mellitus represents one of the most significant global public health challenges. Since 1980, the prevalence of diabetes among adults has quadrupled, primarily due to the rising incidence of type 2 diabetes mellitus (T2DM), which is closely linked to increasing rates of overweight and obesity [1].
Countries in the Arab Gulf Cooperation Council (GCC), including Bahrain, have observed diabetes rates that exceed the global average. In Bahrain, over 16.3% of the adult population has been diagnosed with diabetes. More broadly, the Middle East and North Africa (MENA) region holds the highest regional prevalence at 16.2% and is projected to see an 86% increase in the number of people living with diabetes, reaching an estimated 136 million by 2045. The MENA region also records the highest percentage (24.5%) of diabetes-related deaths among people of working age [2].
Bahrain is among the nations most affected by the diabetes epidemic. In response, the Ministry of Health has taken extensive measures to reduce the burden of diabetes and its complications. These efforts include public awareness campaigns, healthcare provider training, enhanced treatment protocols, and the establishment of specialized diabetes clinics in all primary healthcare centers. These clinics are staffed by diabetes specialists and trained nurses and provide a comprehensive range of preventive and therapeutic services. These include medication management, routine screenings (e.g., retinal and foot exams), vaccinations, counseling, and personalized health education [3].
Current standard-of-care treatments for diabetes encompass a wide array of non-insulin and insulin-based glucose-lowering therapies, alongside recommended lifestyle interventions such as improved diet, regular physical activity, and smoking cessation. Preventing and managing diabetes-related complications is also a critical aspect of overall care. For example, angiotensin-converting enzyme (ACE) inhibitors are routinely used to prevent diabetic nephropathy. Metformin remains the first-line pharmacologic agent unless contraindicated. Other commonly used glucose-lowering medications include sulfonylureas and dipeptidyl peptidase-4 (DPP-4) inhibitors. These medications, combined with lifestyle changes — such as an improved diet and regular physical exercise — form the foundation of diabetes management [4,5,6,7].
1.2. 5-ALA and Its Potential Role
δ-Aminolevulinic acid (5-ALA) is the first compound in the porphyrin synthesis pathway, leading to heme synthesis in mammals [8]. Heme is a major component of hemoglobin and other hemoproteins, including myoglobin and cytochromes. Heme and cytochromes play an essential role in the electron transport chain (ETC) in mitochondria, and cytochrome P450 functions as a metabolic enzyme involved in the oxidation and detoxification of many xenobiotics and endogenous compounds. Given the nature of 5-ALA as a precursor of heme, it serves as an essential molecule in humans and other vertebrates and may be associated with various metabolic disorders [9,10].
1.3. Specific Hypothesis and Study Objectives
As heme is a critical component of the cytochrome system, it plays a vital role in the function of mitochondria. Dysfunction of mitochondria has been associated with insulin resistance and type 2 diabetes. Thus, enhancing the ETC in mitochondria enhances TCA cycle function and upregulates sugar and fat metabolism, increasing ATP production and reducing blood sugar. This work might shed light on the potential impact of 5-ALA phosphate/SFC on upregulating mitochondrial function, whose dysfunction is associated with insulin resistance, which could be used as an add-on supplement for diabetes patients. Mitochondrial dysfunction may be a central cause of insulin resistance and related complications [11].
A previous study demonstrated that mice heterozygous for the ALA synthase 1 (ALAS1) gene suffer from abnormal blood glucose levels and insulin resistance. The same study showed that 5-ALA deficiency resulted in heme deficiency, as there was decreased glucose uptake in myocytes in mice with absent ALAS1 and a block in heme synthesis. Such findings support the hypothesis that 5-ALA deficiency in vivo can impair glucose levels and insulin resistance [12].
A prospective, randomized, single-blind, placebo-controlled, dose-escalating clinical trial assessed the safety of 5-ALA phosphate with SFC at doses up to 200 mg 5-ALA phosphate/229.42 mg SFC per day in diabetes patients [13]. The study enrolled 53 patients living in Bahrain with uncontrolled T2DM, despite the use of one or more antidiabetic drugs. There was no significant difference in the incidence of adverse events reported, and the most frequent events reported were gastrointestinal, consistent with the known safety profile of 5-ALA phosphate in patients with diabetes. No significant changes in laboratory values and no difference in hypoglycemia between patients receiving 5-ALA phosphate/SFC and placebo were noted. Overall, the results support the use of 5-ALA phosphate with SFC up to 200 mg per day taken as 2 divided doses, which is safe in patients taking concomitant oral antidiabetic medications and may offer benefits in the diabetic population [14].
Currently, 5-ALA phosphate in combination with SFC is approved as a dietary supplement in Japan, Singapore, the Philippines, Dubai, Vietnam, Jordan, and was approved in Bahrain. 5-ALA hydrochloride is approved in many countries for photodynamic diagnosis during the intraoperative resection of gliomas using 5-ALA hydrochloride in conjunction with blue light to visualize the tumor by fluorescence of protoporphyrin IX. The usefulness of 5-ALA-induced tumor fluorescence for guiding tumor resection has been well known in the neurosurgery and urology fields [15,16]. 5-ALA hydrochloride [15,16], 5-ALA phosphate/SFC [13,14,17], and 5-ALA hydrochloride /SFC [18] have been shown to be safe in different types of applications.
This post-marketing survey study was conducted to examine the safety and efficacy of 5-ALA phosphate/SFC as an add-on to other hypoglycaemic drugs (standard of care) on T2DM patients in Bahrain. The main objectives of this study were to determine whether using 5-ALA phosphate/SFC is safe and effective as an add-on to other hypoglycemic agents for patients with diabetes and with potential mitochondrial dysfunction and insulin resistance. It was concluded that 5-ALA phosphate/SFC is a safe and effective oral hypoglycemic drug supplement along with the standard of care in diabetes patients, which could upregulate mitochondrial function. A follow-up study was conducted using saliva-based genetic screening and functional mitochondrial testing of both the super responders and non-responders. The study results will be published elsewhere.
2. Materials and Methods
2.1. Study Design
This study was a post-marketing survey conducted in Bahrain using 5-ALA phosphate/SFC on T2DM patients. It was approved by the National Health Regulatory Authority (NHRA) (No. CEO/2015-314/MAJ on 7 June 2015, and the Ministry of Health in Bahrain (No MA/SA/497/2015 on August 25, 2015). It was conducted in collaboration with the Bahrain Ministry of Health in 14 of the 27 health centres (Health Centers - Ministry of Health) to represent the Bahraini population: 1) Ibn Sina Health Centre, 2) Budaiya Health Centre, 3) Isa town Health Centre, 4) Sh Jabar Al Ahmed Ai Sabah Health Centre, 5) Yousef Abdulrahman Engineer Health Centre, 6) Harat Bu Maher Health Centre, 7) Al Hooora Health Centre, 8) Muharraq Health Centre, 9) Sheikh Jaber AlAhmad AlSabah Health Centre, 10) A’Ali Health Centre, 11) Ahmed Ali Kanoo Health Centre, 12) Hamad Kanoo Health Centre, and 13) Mohamed Jasim Kanoo Health Centre, 14) Kuwait Health Centre, as shown in Figure 1 [19].
The study was designed as an open-label, non-placebo-controlled investigation. A total of 100 patients were recruited through 14 primary care physicians across 14 health centers in Bahrain. The study duration was approximately 16 weeks. All enrolled patients received standard-of-care hypoglycemic agents in combination with 100 mg of 5-aminolevulinic acid phosphate (5-ALA phosphate) and 29 mg of sodium ferrous citrate (SFC), referred to as 5-ALA phosphate/SFC. For comparison, data were also collected from a historical control group of 96 patients who were treated with hypoglycemic agents alone but did not receive 5-ALA phosphate/SFC.
Data collection occurred at four time points: approximately 16 weeks before study initiation (pre-study, t0–16 weeks), at baseline (initial, t0), at the end of the treatment period (follow-up, t0+16 weeks), and 16 weeks after the conclusion of treatment (post-study, t0+32 weeks).
The study included both male and female participants residing in Bahrain who met the following recruitment criteria:
2.2. Inclusion Criteria
- Age between 20 and 75 years and considered to be in general good health (aside from having diabetes) as determined by the results of their medical history, physical examinations, and laboratory assessments.
- HbA1c levels between 6.5% and 10% (inclusive), which is uncontrolled, despite the use of one or more oral hypoglycemic agents
- Body Mass Index (BMI) ≤ 40 kg/m2 (Six patients exceeded the defined BMI limit of ≤ 40 kg/m2 )
- Sitting blood pressure (BP)≤160/100 mmHg
- Ophthalmological exam within normal limits as judged by the investigator. If abnormal findings are observed, they must be evaluated as not clinically significant
- Female subjects who are not pregnant or breastfeeding. If of childbearing potential, they should agree to use an acceptable form of birth control
2.3. Exclusion Criteria
- Liver dysfunction, defined as liver function test values ≥1.5 times the normal upper limit
- Renal dysfunction, defined as blood urea nitrogen and/or serum creatinine values ≥ 1.5 times the upper limit of normal and/or estimated Glomerular Filtration Rate (eGFR) < 30 ml/min/1.73 m2
- History of any life-threatening disease, cardiovascular disease, viral hepatitis, porphyria, or hemochromatosis
- Allergy to 5-ALA phosphate, SFC, or any other component of the study product
- Use of insulin for the management of serum glucose
- Hypoglycemic event within the previous 3 months, defined as serum glucose levels less than 70 mg/dl (3.89 mmol/l)
- History of sickle cell anemia
The patients were screened by their physician and asked to participate in the study if deemed appropriate regarding the suggested inclusion and exclusion criteria. Doctors obtained informed consent, and a questionnaire was filled out during the visit. The following was required to be filled out on the first visit (pre-study, t0-16 weeks).
Section 1: 1. Institution, 2. Clinician Name, 3. Date of Initial Assessment, 4. Patient Study ID
Section 2: 1. Patient Age, 2. Patient Sex, 3. Relevant diagnosis, 4. Relevant Diabetic Medical History, 5. Current Diabetes Treatment (Name of drug, dose, duration), 6. Prior Diabetes Treatment (Name of drug, dose, duration), 7. Baseline HbA1c, 8. Baseline Fasting Blood Glucose, 9. Baseline Height, 10. Baseline Weight, 11. Follow-up Weight
Furthermore, routine lab analyses were collected as recommended by the doctors’ primary care provider (PCP) at the initial time point (t0) and follow-up (t0+16 weeks)
2.4. Doses
In addition to the standard of care recommended by the physicians, the subjects were then started on 5-ALA phosphate/SFC with a recommended dosage of 100 mg a day (2 x 25 mg capsules twice a day).
2.5. The Standard of Care Used for Diabetes Patients
The oral hypoglycemic agent’s algorithm used for the standard of care followed the following therapies, depending on the patient’s condition:
- Monotherapy: metformin
- Dual Therapy: metformin + sulfonylurea
- Triple Therapy: metformin + sulfonylurea + DPP-4 Inhibitor
At time point t0+32 weeks (16 weeks post-treatment, +/- one week), the subjects were asked to return for assessment and evaluated by their physician on the following:
1. Date of Assessment, 2. Institution, 3. Clinician Name, 4. Patient Study ID, 5. Total number of bottles used 6. Estimated capsules taken per day, 7. HbA1c, 8. Fasting Blood Glucose, 9. Weigh, 10. Height, 11. Clinical Outcomes (Commenting on any changes), 12. Additional information (Including feedback from the subject or their family)
Furthermore, routine lab analyses were collected as recommended by the doctors. If a patient experienced an adverse event, it was discussed during their follow-up visit and recorded. The questionnaires were collected and analyzed; all data from the source files, including the adverse events, were recorded on an Excel sheet. The sheet was later checked for accuracy between the source and digital files. Data was collected at time point t0+32 weeks as well
2.6. Statistical Analysis
The data from the questionnaires was entered into Microsoft Excel. Additional statistical analysis was performed in Python 3.8.8 with the SciPy package 1.7.3. Independent t-tests were performed for all treatments (n=100) vs. control (n=96) at pre-study, initial, follow-up, and post-study timepoints. Paired t-tests were performed for each responder class: super responders (n=19), responders (n=22), steady responders (n=12), non-responders (n=47), controls (n=96), and all treatment classes (n=100), and study groups (treatment and control, n=196), at the following paired time points: pre study and initial, initial and follow up, follow up and post study, and pre study and post study. Patients with missed collection time points were excluded from the analysis. Statistical analysis [mean ± standard deviation,95% confidence interval upper and lower] was performed on the lab analysis data for all treatment and control subjects at initial and follow-up time points.
Demographic data was analyzed using descriptive statistics and frequency calculator functions in SPSS. The differences in HbA1c, fasting blood glucose, weight (kg), height (cm), and BMI between the time points were compared.
3. Results
Over the 4-month treatment period, all 100 enrolled patients completed the study regimen, receiving oral administration of 5-ALA phosphate/SFC in addition to standard-of-care therapy. Data were collected at four key time points:
- Pre-study: 16 weeks before treatment initiation (t0–16 weeks)
- Baseline: At the start of treatment (t0)
- Follow-up: 16 weeks after treatment initiation (t0+16 weeks)
- Post-study: 16 weeks after the end of treatment (t0+32 weeks)
For comparison, historical data from 96 patients—who received standard-of-care treatment only—were also collected at the same four time points, serving as a control group.
The standard-of-care hypoglycemic treatments administered were consistent with American Diabetes Association (ADA) guidelines and included:
- Monotherapy: Treated with one antidiabetic drug, mainly metformin
- Dual Therapy: Treated with two drugs, typically metformin and sulfonylurea
- Triple Therapy: Treated with three drugs, most commonly metformin, sulfonylurea, and a DPP-4 inhibitor
Patients who required insulin due to a lack of response to these oral agents were excluded from the study.
3.1. Demographics
Patients’ demographics and gender differences are presented in Table 1.
More males participated in this study (59%) than females (41%). The participants’ ages ranged from 31 to 77 years, with an overall average of 52.7 years, for both males and females. A wide range of males and females of all ages participated in this study. (Table 1)
3.2. Adverse Events and Safety
The study showed that administering the 5-ALA phosphate/SFC supplement at 100 mg/day was safe. Low rates of mild or unrelated adverse events were consistently observed and resolved. These adverse events were body aches, tremors, flatulence, nausea, abdominal pain, and diarrhea; however, no serious adverse events were reported (Table 2).
3.3. Efficacy: Patient Response to 5-ALA Phosphate /SFC
The response to 5-ALA phosphate/SFC among patients in the treatment group varied and was categorized into four distinct groups based on changes in HbA1c levels:
- Super Responders: These patients exhibited a marked and statistically significant reduction in HbA1c levels four weeks after initiating treatment. However, this effect diminished following the discontinuation of 5-ALA phosphate/SFC, with HbA1c levels rising significantly during the post-treatment phase.
- Responders: This group showed a moderate reduction in HbA1c levels four weeks after starting treatment. Like the super responders, their HbA1c levels increased after stopping treatment, indicating a temporary benefit during 5-ALA phosphate/SFC treatment.
- Steady Responders: Patients in this group experienced a sustained reduction in HbA1c after 16 weeks of treatment, which persisted even four weeks after discontinuation of 5-ALA phosphate/SFC, suggesting a more prolonged therapeutic effect.
- Non-Responders: These individuals showed no improvement or an increase in HbA1c levels throughout the study period, indicating no measurable response to the 5-ALA phosphate/SFC treatment.
Table 3 presents the classification of patients in the treatment group according to their HbA1c response to 5-ALA phosphate/SFC.
All patients in the treatment group received standard-of-care therapy continuously at three key time points, and continued to receive standard care thereafter. In comparison, the control group received only standard-of-care treatment over the same time intervals, without the addition of 5-ALA phosphate /SFC. The response to 5-ALA phosphate /SFC was evaluated primarily based on safety, changes in HbA1c levels, and standard laboratory parameters, and was compared with the control group.
Table 4 presents HbA1c across all time points: pre-study, initial, follow up and post-study, for each class within the treatment group—super responders, responders, steady responders, and non-responders—as well as for the control group. The table also includes a summary of statistics, including mean ± standard deviation and 95% confidence intervals (upper and lower bounds), for each group. Among non-responders, a high decrease in HbA1c was observed during the post-treatment (t0+32 weeks), as shown in Supplemental Table S1. This was likely due to treatment with insulin, which was used for patients who did not respond to all hypoglycemic agents and had a high level of HbA1c.
Table 5 shows mean of HbA1c changes and statistics for all treatment classes (super responders, responders, steady responders, and non-responders) and control subjects between the following time point pairs in the study: pre-study, to initial treatment, initial treatment to follow up, follow up to post study, and pre-study post study. The following summary statistics are provided for each group: change in mean ± standard deviation [95% confidence interval upper and lower bounds].
The mean HbA1c changes throughout the study are shown in Figure 2. The figure illustrates fluctuations in HbA1c across treatment response classes—super-responders, responders, steady responders, and non-responders—in the 5-ALA phosphate/SFC plus standard healthcare group, as well as in the control group receiving standard healthcare alone. Data are presented at four time points (pre-study, initial, follow-up, and post-study) using a mean values line chart (Figure 2A) and violin plots of individual data (Figure 2B), the latter showing symmetrical distributions within the treatment response classes.
The classes of the treatment group data, control group data, and overall treatment and control group data were compared between the four time points; pre-study (16 weeks before pre-study, t0-16 weeks), initial point (t0), follow-up (16 weeks after initial point, t0+16 weeks), and post-study (16 weeks after follow-up point, t0+32 weeks).
P-values from paired t-tests comparing HbA1c levels across treatment response groups and the control group at each study time point are presented in Supplemental Table S2. Measurements were taken at four key time points: 16 weeks before treatment initiation (pre-study), at the start of treatment (initial), 16 weeks after treatment began (follow-up), and 16 weeks after treatment ended (post-study). Paired t-tests were conducted for the following time intervals: Pre-study to initial, initial to follow-up, follow-up to post-study, and Pre-study to post-study
The groups comprise all participants in the study (n = 196), including both treatment group classes and control groups. This includes super responders (n=19), responders (n=22), steady responders (n=12), non-responders (n=47), and control group (n=96). The treatment group comprises all patients (n = 100) who received 5-ALA phosphate/SFC in combination with standard-of-care treatment, classified into the four response classes mentioned above. The control group (n=96) received standard-of-care treatment alone, without 5-ALA phosphate/SFC. Treatment data were compared with the control data
3.4. Efficacy: Age and Gender Variability in Response to 5-ALA Phosphate/SFC Treatment
Variations in treatment response to 5-ALA phosphate/SFC were observed across age and gender among study participants between the treatment initiation point (t0) and the follow-up point at 16 weeks (t0+16 weeks) (see Supplemental Tables S3 and S4).
The study included 59 male and 41 female participants. Among the male group, 35 individuals experienced a reduction in HbA1c levels, while 24 showed an increase. In contrast, 18 female participants exhibited decreased HbA1c levels, and 23 showed an increase. A higher proportion of males demonstrated HbA1c reductions compared to females.
After 16 weeks of treatment with 5-ALA phosphate/SFC alongside standard-of-care therapy, male participants generally responded more favorably than female participants. Among the 35 males who showed improvement, the average HbA1c reduction ranged from 0.61% to 2.2%. In contrast, the 24 males with increased HbA1c levels experienced rises between 0.54% and 1.55%.
Among the female participants, 18 individuals showed HbA1c decreases ranging from 0.63% to 0.89%, while 23 had increases between 0.55% and 1.60%.
3.5. HbA1c Changes in Patients Receiving Monotherapy, Dual Therapy, and Triple Therapy With and Without 5-ALA Phosphate/SFC
Patients receiving dual or triple hypoglycemic therapy in combination with 5-ALA phosphate/SFC showed greater reductions in HbA1c compared to those on monotherapy. Supplemental Table S5 summarizes the number of patients in both the treatment and control groups who demonstrated a decrease in HbA1c levels 16 weeks after treatment (follow-up).
In the treatment group, the greatest HbA1c reduction was observed among patients receiving dual therapy—primarily a combination of metformin and sulfonylurea—with approximately twice as many responders compared to the monotherapy group. This difference was statistically significant. Although triple therapy also showed favorable outcomes, the difference between dual and triple therapy was less marked.
- Monotherapy: Treated with one antidiabetic drug, mainly metformin
- Dual Therapy: Treated with two drugs, typically metformin and sulfonylurea
- Triple Therapy: Treated with three drugs, most commonly metformin, sulfonylurea, and a DPP-4 inhibitor
These results indicate that dual therapy combined with 5-ALA phosphate/SFC was more effective in lowering HbA1c than both monotherapy and triple therapy. A similar trend was seen in the control group; however, the number of patients experiencing HbA1c reductions was lower, particularly in the dual therapy. Table 6 presents the average HbA1c changes observed across monotherapy, dual therapy, and triple therapy groups, comparing those treated with 5-ALA phosphate/SFC to those in the control group.
3.6. Changes in Weight and BMI
After 16 weeks of treatment with 5-ALA phosphate/SFC alongside standard care, a slight reduction in both weight and BMI was observed (Supplemental Table S6). On average, treated patients experienced a decrease in BMI of -0.41 and a weight loss of -1.33 kg. In contrast, the control group showed a slight increase in BMI (+0.18) and weight (+0.49 kg) over the same period.
3.7. Laboratory Blood Analysis
Supplemental Table S7 presents the mean values and summary statistics for laboratory parameters in both the treatment and control groups at baseline (initial) and after 16 weeks (follow-up). Normal reference ranges are provided in Supplemental Table S8. The data include mean ± standard deviation and 95% confidence intervals for each time point.
Overall, no significant changes in blood parameters were observed following 16 weeks of treatment with 100 mg/day 5-ALA phosphate/SFC. Liver function markers such as ALP and ALT did not change significantly, indicating no impact on hepatic function. Similarly, renal markers stayed within normal limits throughout the study. Blood urea and creatinine levels were comparable between groups at both time points. In the treatment group, average creatinine values were 65.4 µmol/L at baseline and 64.6 µmol/L at follow-up. In the control group, they were 68.5 µmol/L and 67.8 µmol/L, respectively, well within normal reference ranges (Supplemental Table S8). These findings suggest that 5-ALA phosphate/SFC did not adversely affect kidney function.
4. Discussions
4.1. Safety and Effects of 5-ALA/SFC on Liver and Kidney Functions
This study demonstrated a low incidence of adverse events among patients treated with 5-ALA phosphate/SFC (Table 2), consistent with previous research [12,13,14]. Prior studies have reported minimal to no adverse effects associated with 5-ALA phosphate, highlighting its strong safety profile [14]. As an endogenous compound synthesized in the mitochondria, 5-ALA phosphate is generally well tolerated. Any side effects observed in the present study—such as diarrhea and back pain—were mild and not related to the treatment. This aligns with previous findings in diabetic populations [12,13,14].
Patients in this study received a range of concomitant oral hypoglycemic agents, with some taking up to three simultaneously. Importantly, no drug-drug interactions were reported between 5-ALA phosphate/SFC and standard antidiabetic medications. While hypoglycemia is a potential concern when combining nutritional supplements with glucose-lowering agents, no difference in hypoglycemic events was observed between the 5-ALA phosphate/SFC group and the control group. These findings are consistent with those from a Japanese study involving 45 patients, which confirmed that 5-ALA phosphate/SFC doses of 15 mg and 50 mg were well tolerated when combined with oral antidiabetic therapy [14]. In contrast to 5-ALA phosphate/SFC, many anti-hyperglycemic drugs are associated with higher rates of adverse events, including serious complications [20].
Supplemental Table S7 illustrates mean values and summary statistics of lab analysis for all treatment study subjects and control subjects at initial and follow-up time points. Raised ALP reflects biliary tree injury and cholestasis, whereas raised AST and ALT levels usually reflect hepatocyte injury. Raised bilirubin and low albumin can reflect impaired liver function (Supplemental Table S8). No significant changes in all liver parameters after 16 weeks of treatment with 100 mg/day 5-ALA phosphate/SFC were reported, and no significant changes were found in the control group. These results indicate that 5-ALA phosphate/SFC had no effect on liver function (Supplemental Tables S7 and S8).
Blood urea is formed in the liver and carried by the blood to the kidneys for excretion. Diseased or damaged kidneys cause an accumulation of blood urea nitrogen (BUN) in the blood as the glomerular filtration rate (GFR) drops. Generally, BUN levels of 7 to 20 mg/dL (2.5 to 7.1 mmol/L) are considered normal. The average blood urea in this study was within the normal range at the initial time point and follow-up for both treated and control groups (Supplemental Tables S7 and S8).
Serum Creatinine is a waste product from normal wear and tear on the body’s muscles. Creatinine levels in the blood can vary depending on age, gender, and body size. A creatinine level greater than 1.5 mg/dL may indicate kidney dysfunction. As kidney disease progresses, the level of creatinine in the blood rises. The overall averages of creatinine in this study were within the normal range at the initial time point and follow-up (Supplemental Tables S7 and S8). These results indicate no impact of 5-ALA phosphate/SFC with standard of care on kidney function in type 2 diabetes. Adverse effects reported for patients treated with 5-ALA phosphate/SFC are listed in Table 2. Only minor adverse events were reported, and no serious adverse events greater than Grade 2 were reported.
4.2. Efficacy: Overall Patient Response to 5-ALA Phosphate/SFC
Patient responses to 5-ALA/SFC as an add-on to standard care varied considerably across the study population. After 16 weeks of treatment, male participants demonstrated a stronger response to 5-ALA/SFC compared to female participants (Supplemental Tables S3 and S4).
As outlined in Figure 2 and Table 3, patients were categorized into four response groups based on changes in HbA1c: 1) super responders, 2) responders, 3) steady responders, and 4) non-responders. Supplemental Table S2 shows that, for all groups except super responders, there were no significant changes in HbA1c from the pre-study period to the treatment baseline (P > 0.05). In contrast, super responders exhibited a significant decrease in HbA1c during this same interval (P = 0.0486), suggesting early sensitivity to treatment.
For both super responders and responders, HbA1c levels significantly decreased from treatment initiation (t0) to the follow-up visit at 16 weeks (P = 1.54E-08 and P = 3.20E-06, respectively). However, a significant rebound in HbA1c was observed following cessation of 5-ALA phosphate/SFC treatment, from the follow-up to the post-study period (P = 6.01E-05 and P = 4.52E-05, respectively). These findings suggest that the glycemic benefits of 5-ALA phosphate/SFC were reversible upon treatment discontinuation. HbA1c levels at the post-study visit were not significantly different from pre-study levels (P > 0.05).
Steady responders also showed a significant HbA1c reduction from the initial dose to the follow-up (P = 0.00232), and a continued decrease from follow-up to post-study (P = 0.0213). A significant reduction was also observed from pre-study to post-study (P = 0.0154), indicating a sustained benefit even after treatment cessation.
Non-responders experienced a significant increase in HbA1c from treatment initiation to follow-up (P = 1.01E-09). These patients consistently showed the highest HbA1c levels among all groups, with greater variability (Figure 2). This group appeared unresponsive to both the standard of care and 5-ALA phosphate/SFC.
Notably, 11 non-responders were prescribed insulin during the post-study period. Of these:
- 7 patients responded to insulin with a reduction in HbA1c,
- 1 patient showed no change,
- 3 patients exhibited further increases in HbA1c, indicating limited or no response even with intensified therapy.
The variable response to 5-ALA phosphate/SFC may be linked to its mechanism of action. 5-ALA and iron are essential for mitochondrial heme biosynthesis, a key component of hemoglobin, myoglobin, and cytochromes. These are vital for mitochondrial energy production. Mitochondrial dysfunction is implicated in insulin resistance and type 2 diabetes [9,10], and elevated blood glucose levels are known to reduce endogenous 5-ALA synthesis [11]. It is hypothesized that super responders may have underlying mitochondrial dysfunction—possibly due to hyperglycemia or genetic predisposition—and that 5-ALA supplementation may have restored mitochondrial function. This mechanism is illustrated in Figure 3.
4.3. Efficacy: Overall Patient Response to 5-ALA Phosphate/SFC
Patients’ response to 5-ALA phosphate/SFC treatment as an add-on to the standard of care varied. After 16 weeks of treatment with 5-ALA phosphate/SFC in addition to the standard of care, males responded better than females to 5-ALA phosphate/SFC (Supplemental Tables S3 and S4). As previously described, patients were classified into four classes based on their response to 5-ALA phosphate/SFC treatment: 1) super responders, 2) responders, 3) steady responders, and 4) non-responders (detailed in Figure 2 and Table 3).
As shown in Supplemental Table S2, for all classes except super responders, HbA1c values did not change significantly between the pre-study phase and the start of 5-ALA phosphate dosing (P-value > 0.05). In contrast, super responders observed a significant change in HbA1c values (P-value = 0.0486) For super responders and responders, HbA1c values decreased significantly from the initial (start of dosing) to the follow up visit (end of dosing) (P-value= 1.54E-08 and 3.20E-06, respectively), then HbA1c values increased significantly from the follow-up visit (end of dosing) to the post study (P-value= 6.01E-05 and 4.52E-05, respectively), suggesting that HbA1c values increased once oral administration of 5-ALA/SFC was stopped. They responded in different magnitudes to 5-ALA phosphate/SFC treatment. Lastly, HbA1c values at the post-study were not significantly different from those of the pre-study (P-value>0.05), suggesting that HbA1c post-study values returned to pre-study levels and showing reversible effects of 5-ALA phosphate/SFC.
For steady responders, HbA1c values decreased significantly from the initial (start of dosing) to the follow-up visit (end of dosing) (P-value=0.00232), and then they continued to decrease significantly from the follow-up visit (end of dosing) to the post-study (P-value=0.0213); there was a significant decline between the pre-study and post-study visits (P-value=0.0154).
For non-responders, HbA1c values increased significantly from the initial (start of dosing) to the follow-up visit (end of dosing) (P-value=1.01E-09). HbA1c values were higher than all other classes and fluctuated in a higher range of HbA1c than the super responders, responders, and steady responders (Figure 2). These patients did not respond to either the standard health care treatment or 5-ALA phosphate/SFC
As shown in Table 3, 11 non-responders were treated with insulin during the post-study. Three of them did not respond even to the insulin treatment, and they showed an increase in HbA1c at the post-study. One showed no change, while 7 non-responders taking insulin at the post study responded to insulin treatment and showed a decrease in HbA1c at the post study.
Based on its mode of action, 5-ALA and iron are critical components in the mitochondrial biosynthesis of heme, a major component of hemoglobin and myoglobin. It is also an essential component of cytochromes, and therefore a crucial element of the energy-generating function of mitochondria. Mitochondrial dysfunction has been associated with insulin resistance and type 2 diabetes mellitus [9,10], and the research has also shown that increased blood glucose level leads to decreased 5-ALA production [11]. It is postulated that these super-responder patients might have mitochondrial dysfunction, either because of increased glucose or due to genetic defects. Administration of 5-ALA probably upregulated mitochondrial functions as demonstrated in Figure 3. and detailed in the next section
4.4. Proposed Mechanism of Action and Response Variability to 5-ALA/SFC
In type 2 diabetes mellitus (T2DM), elevated blood glucose levels suppress the activity of ALA synthase, the enzyme responsible for initiating heme biosynthesis in mitochondria. As a result, mitochondrial heme production declines, leading to diminished mitochondrial function and reduced glucose and lipid metabolism. Administration of exogenous 5-ALA enhances heme synthesis, which in turn activates mitochondrial function. This upregulation increases intracellular glucose utilization and lipid metabolism, promoting greater glucose uptake by cells and contributing to the reduction of blood glucose levels. These effects make 5-ALA a promising adjunctive therapy for patients with T2DM.
5-ALA may stimulate mitochondrial activity by enhancing processes such as the tricarboxylic acid (TCA) cycle, thereby supporting improved glucose metabolism. This mechanism likely contributed to the pronounced glycemic improvement observed in super responders. To a lesser degree, responders also appeared to benefit from enhanced mitochondrial activation. In steady responders, HbA1c levels declined significantly during the 16-week 5-ALA phosphate/SFC treatment and continued to decrease even after treatment cessation. These patients remained on standard care throughout the study and may have experienced residual or sustained metabolic effects from 5-ALA phosphate/SFC, or possibly made lifestyle changes that supported ongoing glycemic improvement.
Conversely, non-responders showed a significant increase in HbA1c despite treatment with 5-ALA phosphate/SFC and concurrent use of oral antidiabetic medications. Factors such as poor adherence to dietary or exercise regimens or limited pharmacological responsiveness may have contributed to the lack of glycemic control. As previously noted, many of these patients eventually required insulin therapy. To further explore our hypothesis that super responders may have underlying mitochondrial dysfunction contributing to their T2DM, a follow-up genomic analysis was conducted. Saliva samples from both super responders and non-responders were collected for genomic mapping to identify potential genetic differences related to mitochondrial function. The findings from this analysis will be reported in a forthcoming publication.
4.5. Effect of Hypoglycemic Agents on Reducing HbA1c
The American Diabetes Association (ADA) recommends metformin and lifestyle modifications for initial pharmacological therapy of T2DM. However, due to the progressive nature of the disease, most patients will require the use of a pharmacotherapy algorithm to reach therapeutic goals. The ADA recommends adding a sulfonylurea when monotherapy is insufficient to achieve or maintain target goals. The drug thiazolidinedione pioglitazone may be recommended when the risk of hypoglycemia is especially undesirable; the glucagon-like peptide-1 (GLP-1) analog exenatide may be recommended if weight loss is a primary goal of therapy. Based on the ADA guidelines, other drugs such as glinides, α-glucosidase inhibitors (AGIs), and DPP-4 inhibitors could also be used as additional triple or quadruple agents.
In this post-marketing survey study, single or multiple treatments with hypoglycemic agents were given to the patients as recommended by ADA and their physician, considering the patient’s situation as indicated above. 5-ALA phosphate/SFC was given along with other hypoglycemic agents in this study to allow for direct comparisons. Notably, a greater number of patients in the group taking metformin and sulfonylurea (dual therapy) with 5-ALA phosphate/SFC showed a marked decline in HbA1c from baseline after 16 weeks compared to the group solely taking metformin (monotherapy) or metformin + sulfonylurea+ DPP-4 Inhibitor (triple therapy) without 5-ALA phosphate/SFC (control group) (Supplemental Table S5).
Adding 5-ALA phosphate/SFC to all treatment regimens (mono, dual, or triple therapy) resulted in a marked decline in HbA1c compared to without 5-ALA phosphate/SFC, especially in super responders and responders. In addition, the decline of HbA1c in dual treatment was double the decline in monotherapy (0.97% vs 0.48%), which was significantly different (P<0.05). However, no significant difference between dual and triple treatments (0.97% vs 1.07%) was observed.
A possible contribution of 5-ALA phosphate/SFC in treating patients taking SU drugs can be explained by the recovery of insulin sensitivity by enhancing glucose metabolism through activation of mitochondrial functions, including TCA cycle activity. SU drugs are inducers of insulin secretion from pancreatic beta cells. Patients treated with SU drugs for an extended period and maintaining high levels of blood glucose and HbA1c are considered insulin resistant. Since 5-ALA phosphate/SFC promotes insulin sensitivity, a combination of SU drugs and 5-ALA phosphate/SFC is expected to be beneficial for patients taking SU drugs, as reported previously [13].
This study employed an open-label design, comparing 5-ALA phosphate/SFC plus standard care to historical control data from patients treated with standard hypoglycemic therapies alone. To confirm these findings, further randomized, double-blind, placebo-controlled studies are warranted.
5. Conclusions
Administration of the nutritional supplement 5-ALA phosphate (100 mg/day) combined with sodium ferrous citrate (SFC, 29 mg/day) for 16 weeks as an adjunct to standard care in patients with type 2 diabetes was found to be safe and well tolerated. All adverse events reported were mild and deemed unrelated to 5-ALA phosphate/SFC treatment. Laboratory analyses showed no adverse effects on liver or kidney function, with all measured parameters remaining within normal ranges. Importantly, 5-ALA phosphate/SFC led to a significant reduction in HbA1c levels in approximately 50% of participants, even when added to existing standard therapies. This effect is likely due to enhanced mitochondrial function via increased heme biosynthesis, particularly in individuals with suspected mitochondrial dysfunction contributing to their metabolic disorder. A follow-up study involving genomic screening of super-responders and non-responders is currently underway to further investigate potential genetic differences that may explain treatment variability. Mitochondrial function in these groups will also be examined in greater detail. While these findings are promising, randomized, double-blind, placebo-controlled trials are necessary to validate the efficacy and safety of 5-ALA phosphate/SFC as a therapeutic adjunct in type 2 diabetes management.
Supplementary Materials
The following supporting information can be downloaded at the website of this paper posted on Preprints.org.
Author Contributions
Conceptualization, T.T., M.N., and R.R.; methodology, R.R., M.N., T.T., and A.S.; Project Administration, A.A, F.A., S.A., H.H., N.A., Z.A., S.A., E.A., T. A., R.S., K.S., J.A., and J.N, R.R., and A.S., formal analysis, R.R.; investigation, A.A., F.A., S.A., H.H., N.A., Z.A., S.A., E. A., T.A., R. S., K.S., J.A., J.N., A.S., M.N., A.S., and R.R.; Data Curation, A. S. and R.R.; writing—original draft preparation, R.R.; writing—review and editing, R.R., M.N., A.A., F.A., S.A., H.H., N.A., Z.A., S.A., E.A., T.A., R.S., K.S., J.A., J.N., T.T, and A.S; supervision, A.A, F.A., S.A., H.H., N.A., Z.A., S.A., E.A., T.A., R.S., K.S., J.A., J.N, R.R. and A.S.; funding acquisition, R.R. All authors have read and agreed to the published version of the manuscript.
Funding
This research was supported in part by SBI Pharma Japan in providing the testing drug and study management, and conducted by the health centers of the Bahraini Ministry of Health.
Institutional Review Board Statement
The study was conducted following the Declaration of Helsinki and was approved by the National Health Regulatory Authority (NHRA) (No. CEO/2015-314/MAJ on 7 June 2015, and the Ministry of Health in Bahrain (No. MA/SA/497/2015 on 25/08/2015).
Informed Consent Statement
Informed consent was obtained from all subjects involved in the study.
Data Availability Statement
The data are contained within the article.
Acknowledgments
The authors thank Peter Rehani for assisting with statistical analysis and manuscript preparation.
Conflicts of Interest
All the clinical doctors who participated in the study and contributed to the preparation of the manuscript as coauthors have no COI. Riyadh Rehani, the corresponding author, is a senior scientific advisor of Photonamic, a subsidiary of SBI ALApharma. Motowo Nakajima and Tohru Tanaka are SBI Pharma and Kyan Pharma Co., Ltd. management board members, respectively.
Abbreviations
5-ALA, 5-aminolevulinic acid; SFC, sodium ferrous citrate; T2DM, type 2 diabetes mellitus; PMS, post-marketing survey; HbA1c, hemoglobin A1c; MENA, Middle East and North Africa; ETC, electron transport chain; DPP4, dipeptidyl peptidase-4; eGFR, estimated Glomerular Filtration Rate; AE, adverse event; GLP-1, glucagon-like peptide-1; AGI, α-glucosidase inhibitor; BMI, body mass index; ALT, alanine transaminase; AST, aspartate aminotransferase; BUN, blood urea nitrogen.
References
- World Health Organization. Global Report on Diabetes. World Health Organization, 2016. https://www.who.int/publications/i/item/9789241565257.
- Diabetes Atlas. 10th ed., International Diabetes Federation Diabetes Atlas 10th ed, 2021. https://diabetesatlas.org/idfawp/resource files/2021/07/IDF_Atlas_10th_Edition_2021.pdf.
- Bahrain Ministry of Health website, Our services, Diabetes. https://www.moh.gov.bh/Services/Diabetes?lang=en.
- NICE, National Institute for Health and Care Excellence. “Type 2 Diabetes in Adults: Management.” NICE Guidelines, 28 Dec. 2015, pp. 9. https://www.nice.org.uk/guidance/ng28/resources/2019-surveillance-of-diabetes-nice-guidelines-ng17-ng18-ng19-and-ng28-pdf-8862045321157.
- Hirst, J. A., A. J. Farmer, R. Ali, N. W. Roberts, and R. J. Stevens. “Quantifying the Effect of Metformin Treatment and Dose on Glycemic Control.” Diabetes Care, 2012, vol. 35, no. 2, pp. 446-454. https://pubmed.ncbi.nlm.nih.gov/22275444/. [CrossRef]
- Phung, O. J., J. M. Scholle, M. Talwar, and C. I. Coleman. “Effect of Noninsulin Antidiabetic Drugs Added to Metformin Therapy on Glycemic Control, Weight Gain, and Hypoglycemia in Type 2 Diabetes.” JAMA, 2010, vol. 303, no.14, pp. 1410-1418. https://pubmed.ncbi.nlm.nih.gov/20388897/. [CrossRef]
- The Look AHEAD Research Group. “Long Term Effects of a Lifestyle Intervention on Weight and Cardiovascular Risk Factors in Individuals with Type 2 Diabetes: Four Year Results of the Look AHEAD Trial.” Arch Med Res., 2010, vol. 170, no. 17, pp. 1566-1575. https://www.ncbi.nlm.nih.gov/pmc/articles/PMC3084497/. [CrossRef]
- Ishizuka M, Abe F, Sano Y, Takahashi K, Inoue K, Nakajima M, Kohda T, Komatsu N, Ogura S, Tanaka T. Novel development of 5-aminolevulinic acid (ALA) in cancer diagnoses and therapy. Int Immunopharmacol. 2011 Mar;11(3):358-65. PMID: 21144919. [CrossRef]
- Kim JA, Wei Y, Sowers JR. Role of mitochondrial dysfunction in insulin resistance. Circ Res. 2008 Feb 29;102(4):401-14. https://www.ahajournals.org/doi/10.1161/circresaha.107.165472. [CrossRef]
- KuryataO, Oleh Akimov O, Mykola Riabushko M, Kostenko H, Kostenko V, Mishchenko A, Nazarenko S, Solovyova N, Vitalii Kostenko V. Therapeutic potential of 5-aminolevulinic acid in metabolic disorders: Current insights and future directions. iScience 2024 Nov 26;27(12):111477. [CrossRef]
- Sato, T., T. Yasuzawa, A. Uesaka, et al. “Type 2 Diabetic Conditions in Otsuka Long-Evans Tokushima Fatty Rats Are Ameliorated by 5-Aminolevulinic Acid.” Nutr Res., vol. 34, no. 6, 2014, pp. 544-551. https://pubmed.ncbi.nlm.nih.gov/25026922/. [CrossRef]
- Saitoh, S., S. Okano, H. Nohara, H. Nakano, N. Shirasawa, A. Naito, M. Yamamoto, V. P. Kelly, K. Takahashi, T. Tanaka, M. Nakajima, and O. Nakajima. “5-Aminolevulinic Acid (ALA) Deficiency Causes Impaired Glucose Tolerance and Insulin Resistance Coincident with an Attenuation of Mitochondrial Function in Aged Mice.” PLoS One, 2018, vol. 13, no. 1, p. e0189593. https://www.ncbi.nlm.nih.gov/pmc/articles/PMC5783358/. [CrossRef]
- Al-Saber, F., W. Aldosari, M. Alselaiti, et al. “The Safety and Tolerability of 5-Aminolevulinic Acid Phosphate with Sodium Ferrous Citrate in Patients with Type 2 Diabetes Mellitus in Bahrain.” J Diabetes Res., 2016, pp. 1-10. https://pubmed.ncbi.nlm.nih.gov/27738640/. [CrossRef]
- Yamashita, N., A. Watanabe, H. Kondo, S. Kawata, T. Tanaka, and M. Nakajima. “Safety Test of a Supplement, 5-Aminolevulinic Acid Phosphate with Sodium Ferrous Citrate, in Diabetic Patients Treated with Oral Hypoglycemic Agents.” Food Funct Health Dis., 2014, vol. 4, no. 9, pp. 415-428. https://www.ffhdj.com/index.php/ffhd/article/view/151. [CrossRef]
- Stummer, W., A. Novotny, H. Stepp, C. Goetz, K. Bise, and H. J. Reulen. “Fluorescence-Guided Resection of Glioblastoma Multiforme Utilizing 5-ALA-Induced Porphyrins: A Prospective Study in 52 Consecutive Patients.” J Neurosurg., 2000, vol. 93, no. 6, pp. 1003-1013. https://pubmed.ncbi.nlm.nih.gov/11117842/. [CrossRef]
- Taoka R, Fukuhara H, Miyake M, Kobayashi K, Ikeda A, Kanao K, et al. Effect of extending the period from oral administration of 5-aminolevulinicacid hydrochloride to photodynamic diagnosis during transurethral resection for non-muscle invasive bladder cancer on diagnostic accuracy and safety: a single-arm multicenter phase III trial. Int J Clin Oncol. 2024;1–11. https://doi.org/10.1007/s10147-024-02654-5. [CrossRef]
- Rodriguez, B. L., J. D. Curb, J. Davis, T. Shintani, M. H. Perez, N. Apau-Ludlum, et al. “Use of the Dietary Supplement 5-Aminolevulinic Acid (5-ALA) and Its Relationship with Glucose Levels and Hemoglobin A1C among Individuals with Prediabetes.” Clin Transl Sci., 2012, vol. 5, no. 4, pp. 314-320. https://pubmed.ncbi.nlm.nih.gov/22883608/. [CrossRef]
- Kawamura K, Matsushima, H, Sakai, H, Iwashima, A, Nakamura S, Kojima T, Sasaki S, Shigenaga T, Natsume I, Sasaki T, Ohsaki Y, Iwanaga K, Nishi K, Mitsuishi Y, Taniguchi H, Sato K, Yamauchi M, Nakajima M, Takahashi K. A Randomized Phase 2 Study of 5-Aminolevulinic Acid Hydrochloride and Sodium Ferrous Citrate for the Prevention of Nephrotoxicity Induced by Cisplatin-Based Chemotherapy of Lung Cancer. Oncology 2022;100:620–632. [CrossRef]
- Alalawi, N. S., & Allani, N. (2024). Promoting Sustainability in Bahraini Primary Health Care Centers. In Nia, H. A., & Rahbarianyazd, R. (Eds.), Innovative Approaches to Cultural Heritage and Sustainable Urban Development: Integrating Tradition and Modernity, (pp. 1-17) Cinius Yayınları. [CrossRef]
- Rehani, P. R., H. Iftikhar, M. Nakajima, T. Tanaka, Z. Jabbar, and R. N. Rehani. “Safety and Mode of Action of Diabetes Medications in Comparison with 5-Aminolevulinic Acid (5-ALA).” J Diabetes Res., 2019, vol 2019, p. 4267357. https://www.hindawi.com/journals/jdr/2019/4267357/. [CrossRef]
Figure 1.
Map of Bahrain highlighting the locations of health centers involved in this study [19]. An asterisk (*) next to a health center’s name in the legend denotes centers that participated.
Figure 1.
Map of Bahrain highlighting the locations of health centers involved in this study [19]. An asterisk (*) next to a health center’s name in the legend denotes centers that participated.
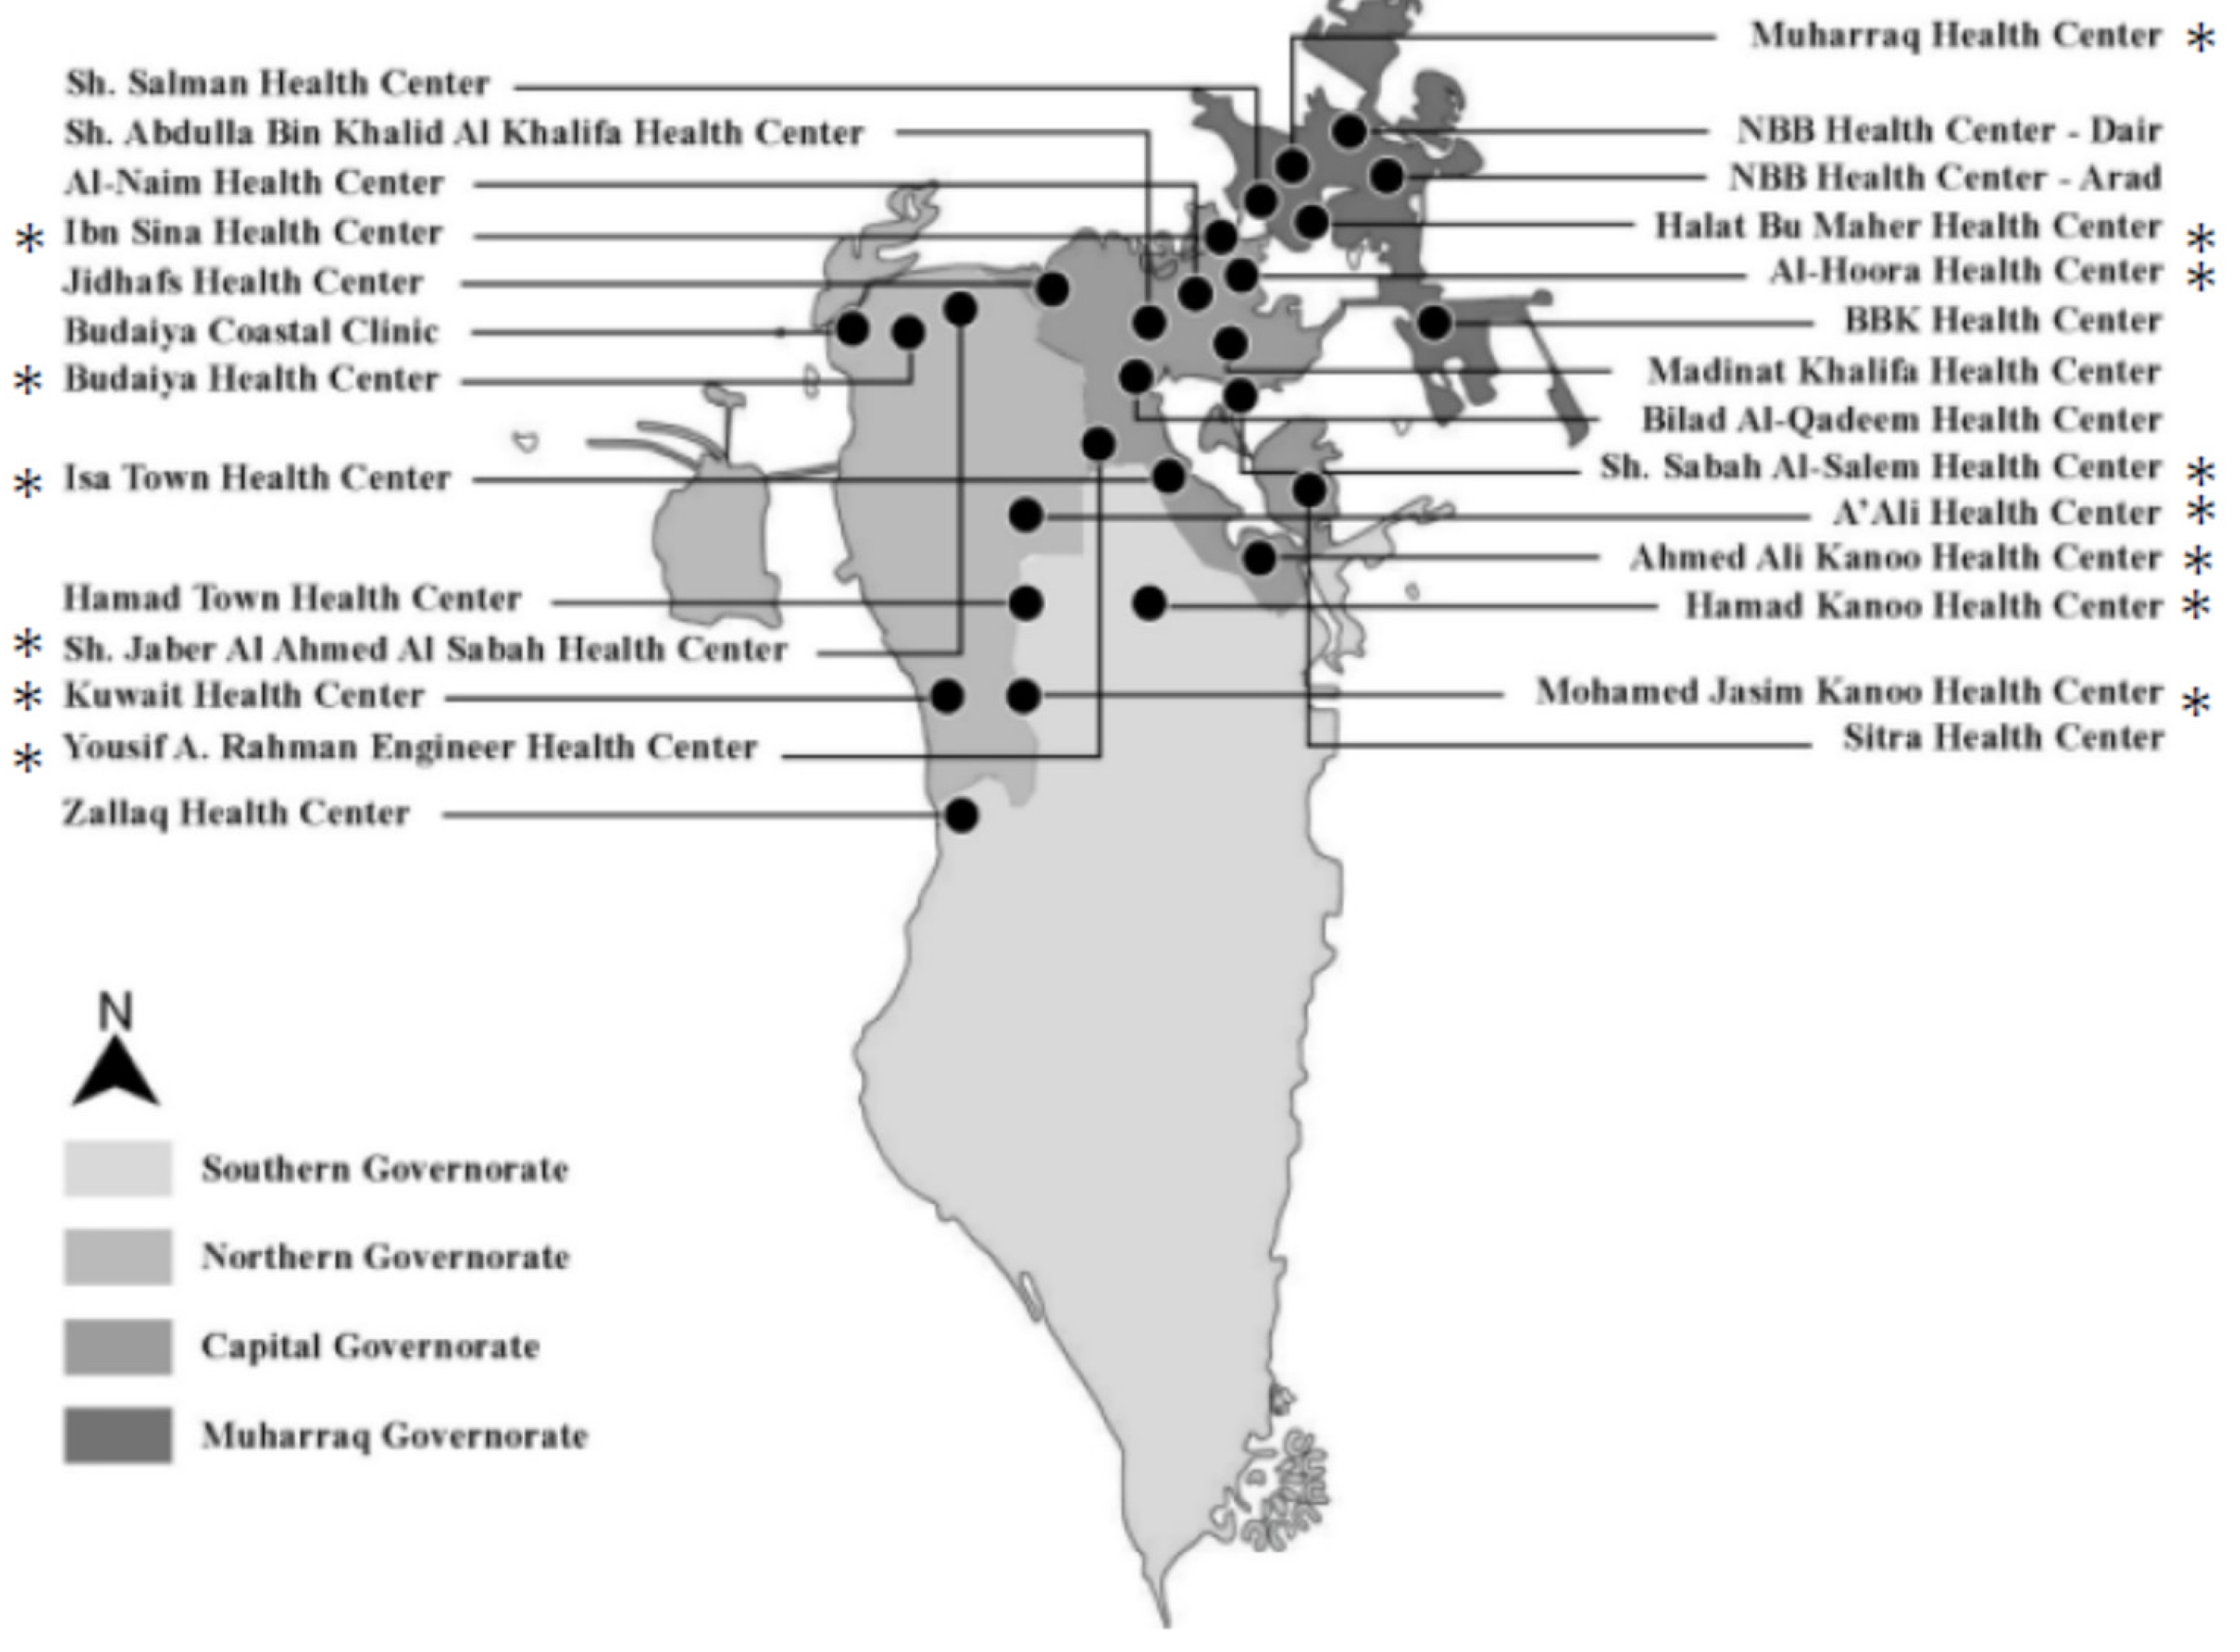
Figure 2.
*HbA1c fluctuations across treatment response classes—super-responders, responders, steady responders, and non-responders—in participants receiving 5-ALA phosphate/SFC with standard healthcare, compared to the control group receiving standard healthcare alone. Measurements were taken at four time points: pre-study, initial, follow-up, and post-study. Data are presented as a line chart (A) and violin plots by treatment response class (B). Statistical significance: *p < 0.05, **= p < 0.001.
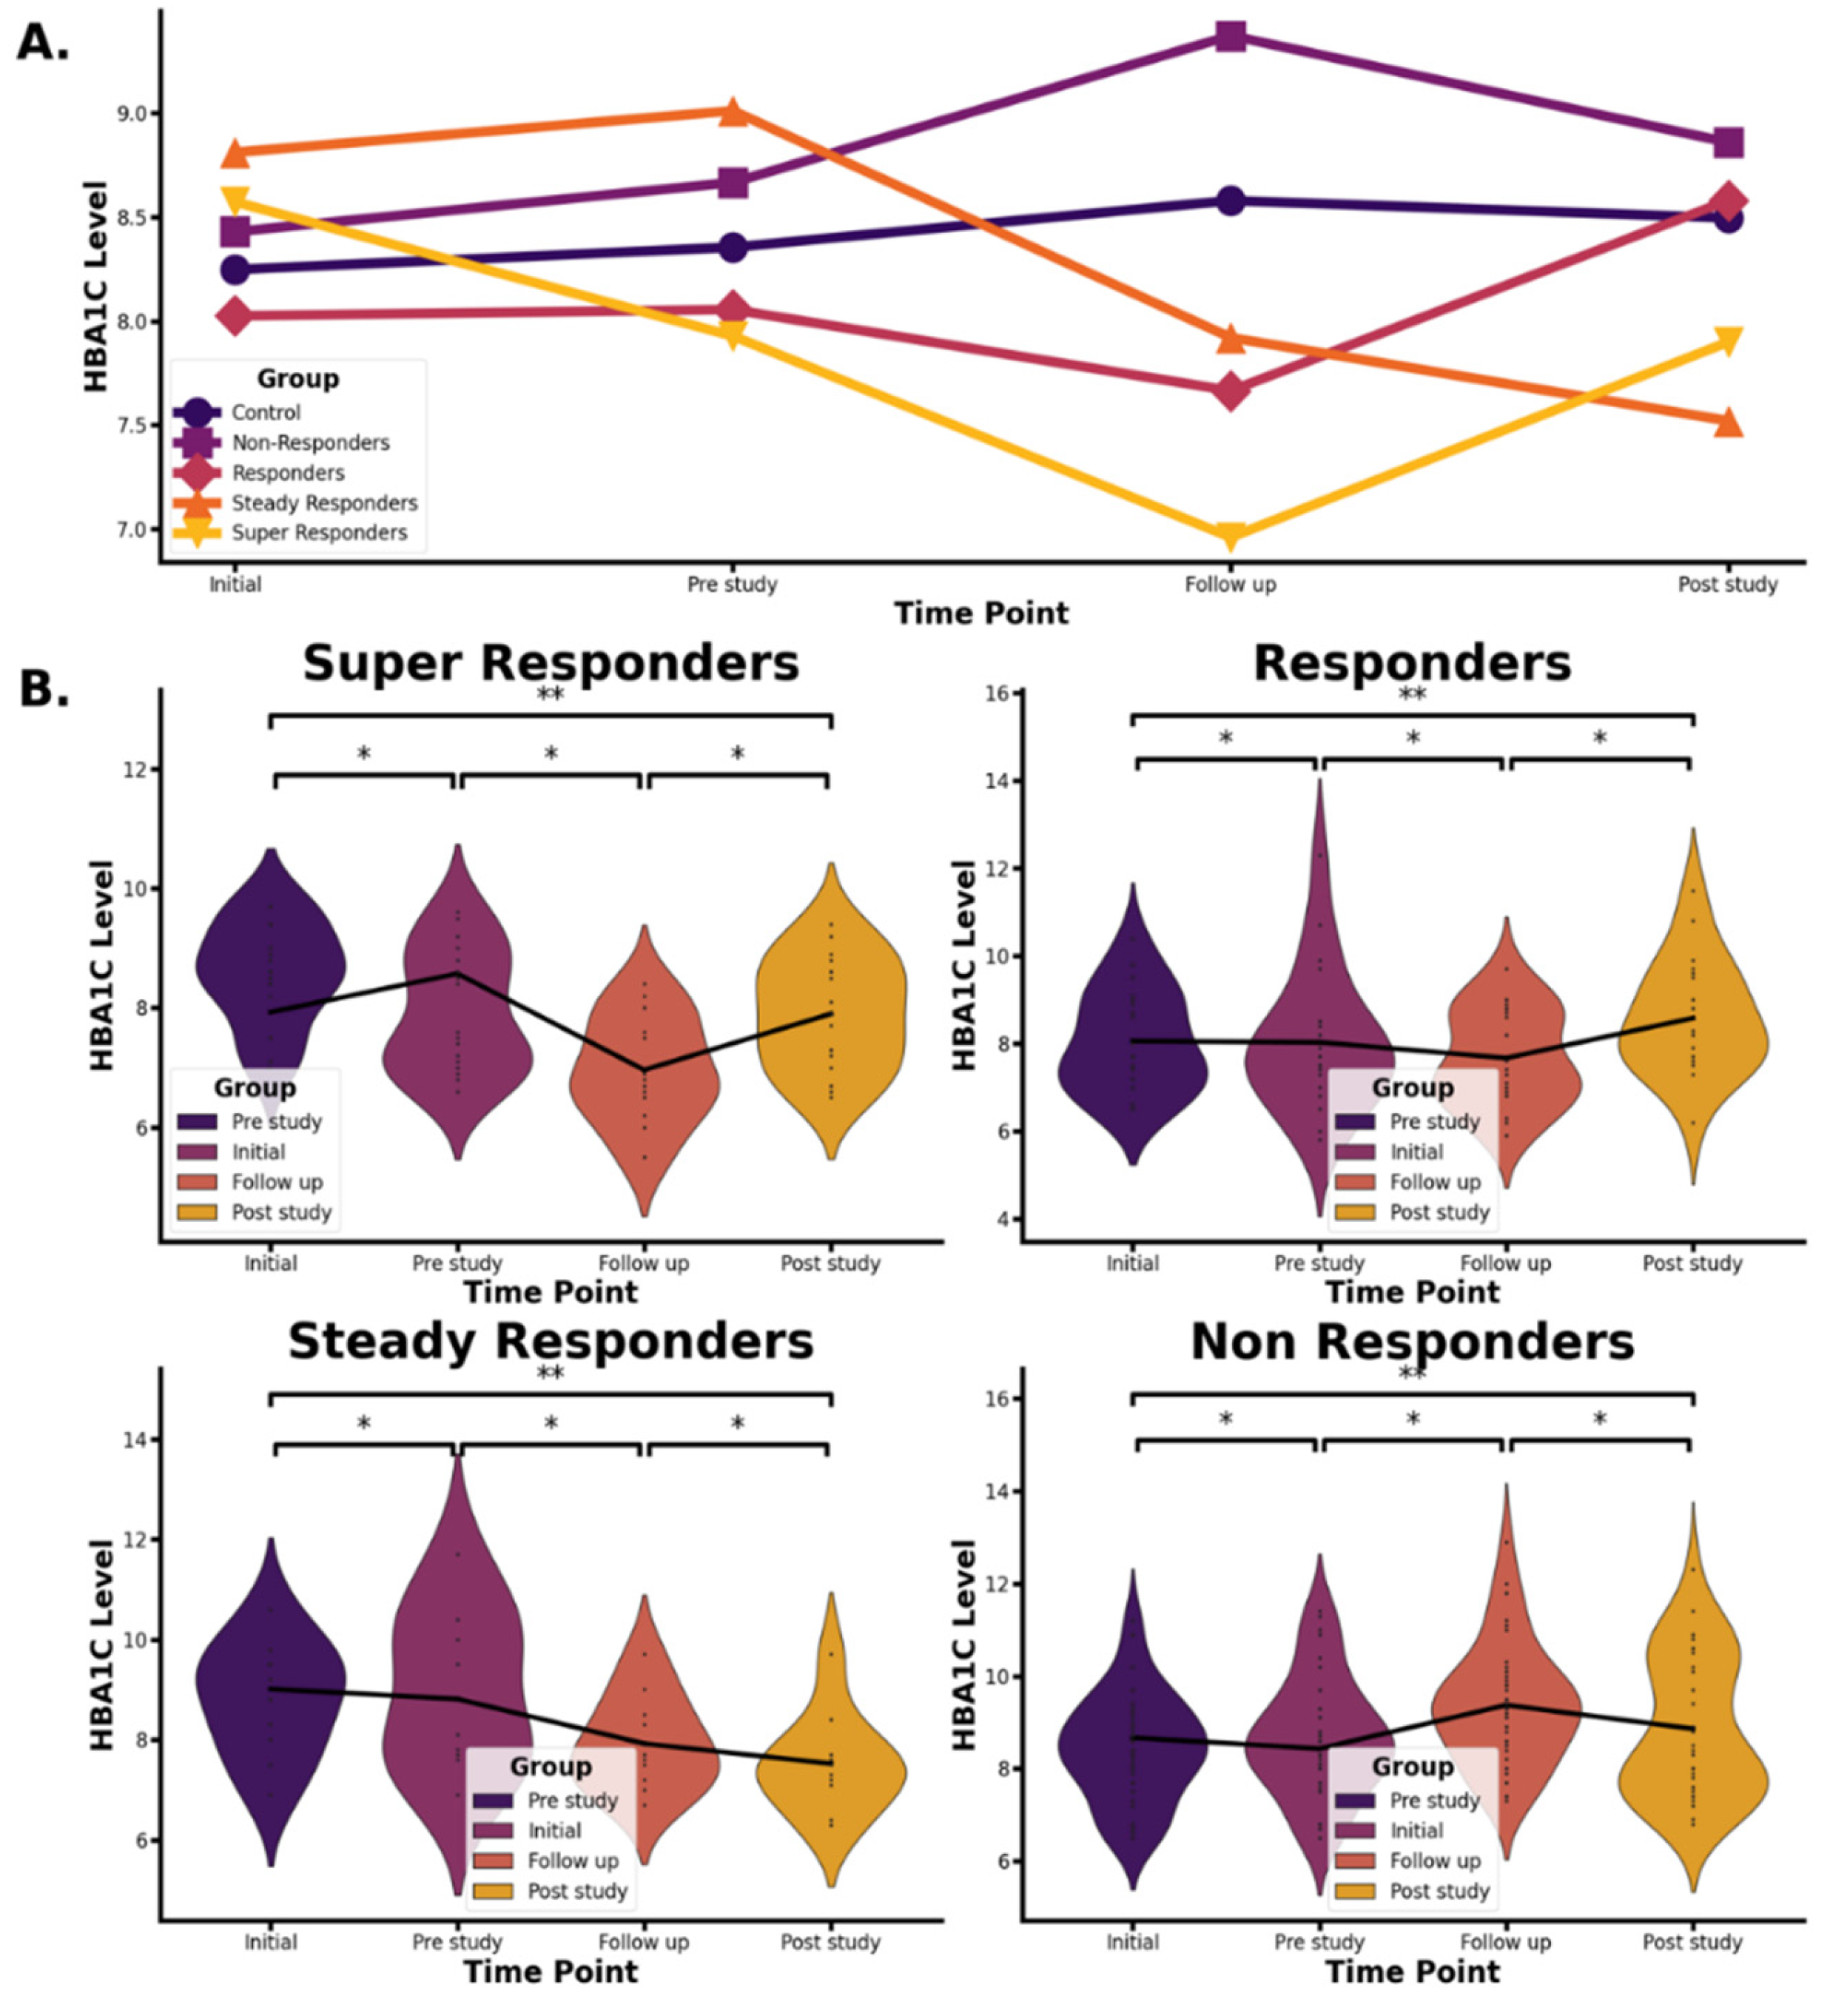
Figure 3.
Impact of Glucose on ALA Production and Heme Biosynthesis, and Proposed Mechanisms Underlying the Anti-Diabetic Actions of Exogenous 5-ALA Supplementation. .
Figure 3.
Impact of Glucose on ALA Production and Heme Biosynthesis, and Proposed Mechanisms Underlying the Anti-Diabetic Actions of Exogenous 5-ALA Supplementation. .
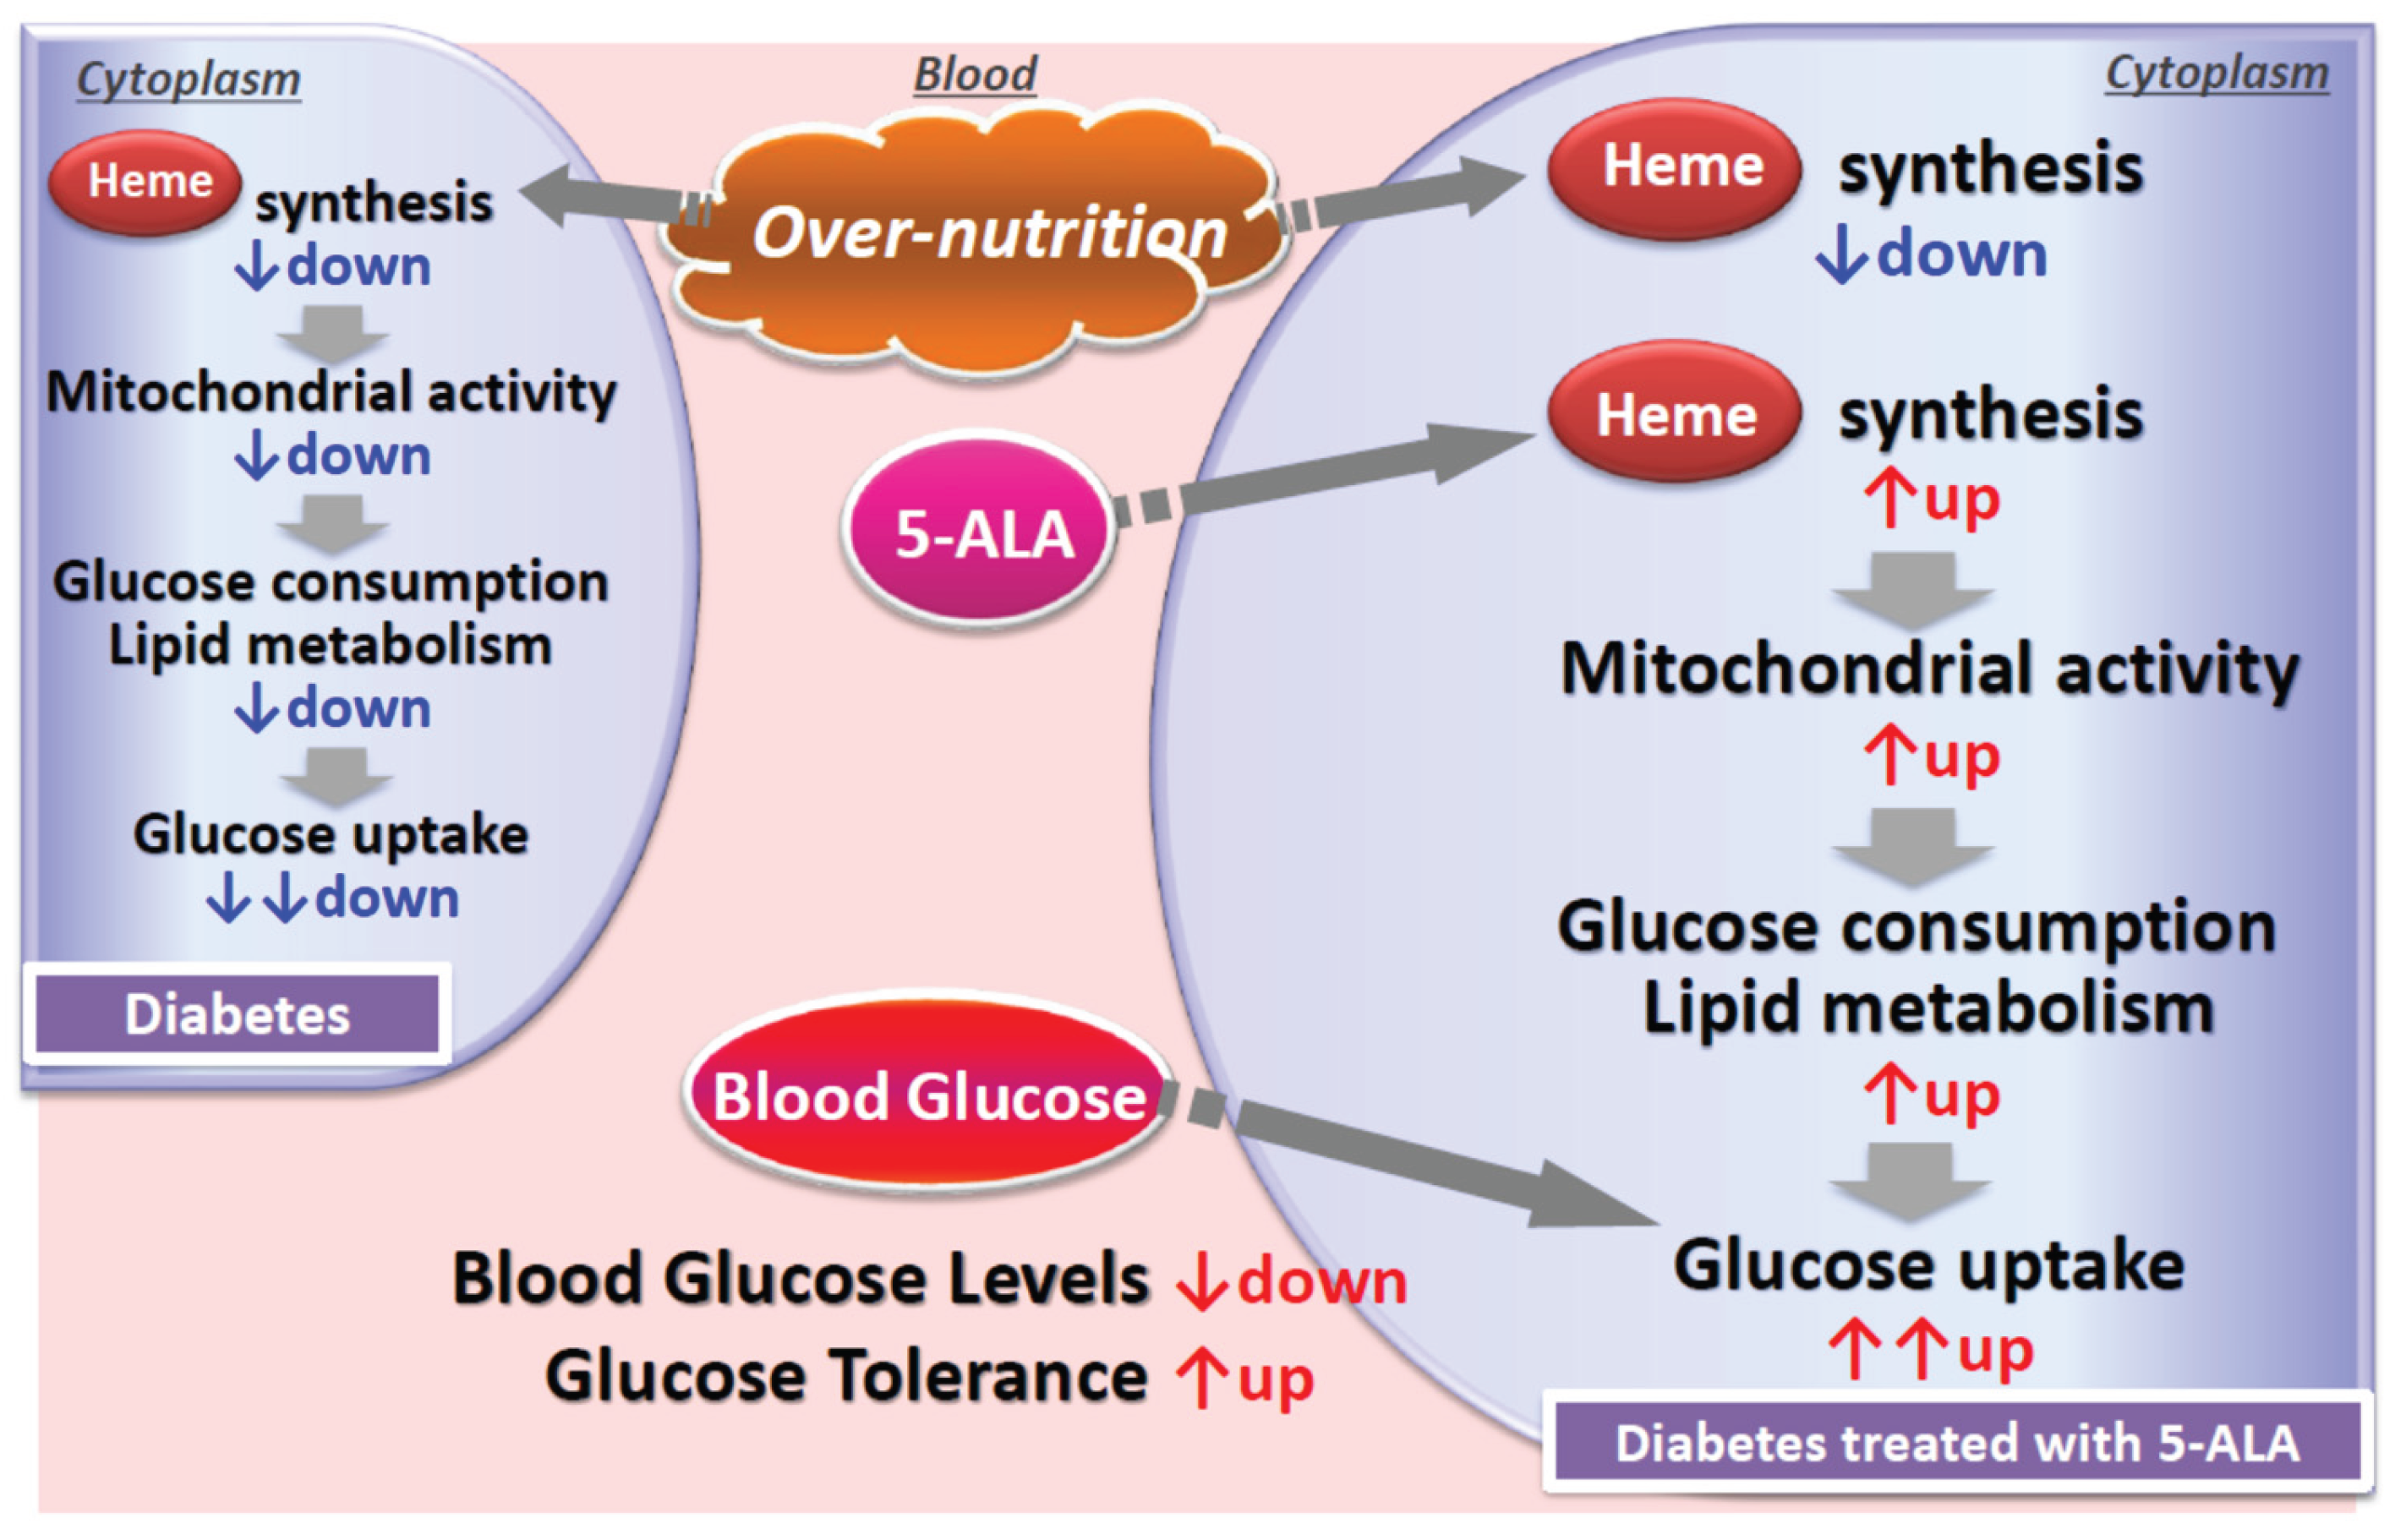

Table 1.
Demographics and gender differences of participating patients.
| Gender | n | Minimum Age/years |
Maximum Age/years |
Mean Age/years |
Std. Deviation |
| Male | 59 | 31 | 73 | 53.6 | 9.0202 |
| Female | 41 | 36 | 77* | 51.4 | 9.7051 |
| Overall | 100 | 31 | 77 | 52.7 | 9.3681 |
*One female patient exceeded the age range (20-75 yrs) and was 77 yrs old.
Table 2.
Adverse effects reported for patients treated with 5-ALA phosphate/SFC.
| Subject number | AE |
| 2 | Nausea |
| 15 | Flatulence |
| 16 | Tremor |
| 2 | Abdominal pain |
| 2 | Diarrhea |
| 19 | Body ache |
Table 3.
Classification of patients with diabetes based on their response to 5-ALA phosphate /SFC.
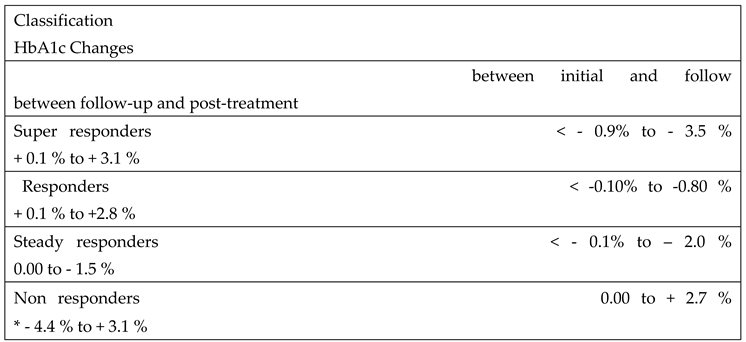 |
*1 patient of non-responders was treated with insulin during the post-study period.
Table 4.
Summary of HbA1c and statistical data (mean ± standard deviation, with 95% confidence intervals upper and lower bounds) for patients receiving 5-ALA phosphate/SFC alongside standard-of-care, classified by treatment response (super responders, responders, steady responders, and non-responders), and the control group, measured at key timepoints throughout the study.
| Group | Pre study (t0-16 weeks) |
Initial (t0) | Follow up (t0+16 weeks) |
Post study ( t0+32 weeks) |
| Super Responders | 7.93 ± 1.01 [7.46, 8.40] |
8.57 ± 0.86 [8.17, 8.97] |
6.96 ± 0.88 [6.55, 7.37] |
7.90 ± 0.92 [7.48, 8.32] |
| Responders | 8.05 ± 1.59 [7.36, 8.75] |
8.03 ± 1.16 [7.52, 8.53] |
7.67 ± 1.09 [7.19, 8.14] |
8.58 ± 1.29 [8.01, 9.15] |
| Steady Responders | 9.01 ± 1.59 [8.02, 10.00] |
8.81 ± 1.13 [8.11, 9.51] |
7.92 ± 0.94 [7.34, 8.50] |
7.52 ± 0.98 [6.91, 8.13] |
| Non-Responders | 8.67 ± 1.29 [8.26, 9.07] |
8.43 ± 1.16 [8.06, 8.80] |
9.37 ± 1.31 [8.95, 9.79] |
8.86 ± 1.52 [8.38, 9.34] |
| Control | 8.35 ± 1.15 [8.08, 8.63] |
8.25 ± 1.07 [7.99, 8.51] |
8.58 ± 1.11 [8.31, 8.85] |
8.50 ± 1.36 [8.17, 8.82] |
Table 5.
Summary of changes in HbA1c means and statistics [mean ± standard deviation, 95% confidence interval upper and lower] of HbA1c for all treatment classes and control subjects between the stated time point pairs in the study.
Table 5.
Summary of changes in HbA1c means and statistics [mean ± standard deviation, 95% confidence interval upper and lower] of HbA1c for all treatment classes and control subjects between the stated time point pairs in the study.
| Group | n | Pre study vs Initial |
Initial vs Follow up |
Follow up vs Post study |
Pre study vs Post study |
| Super Responders | 18 | 0.64 ± 1.29 [0.05, 1.24] |
-1.61 ± 0.68 [-1.93, -1.30] |
0.94 ± 0.75 [0.59, 1.29] |
-0.03 ± 1.28 [-0.62, 0.56] |
| Responders | 20 | -0.03 ± 1.52 [-0.70, 0.64] |
-0.36 ± 0.25 [-0.47, -0.25] |
0.92 ± 0.78 [0.57, 1.26] |
0.53 ± 1.61 [-0.18, 1.23] |
| Steady Responders | 10 | -0.20 ± 1.82 [-1.33, 0.93] |
-0.89 ± 0.67 [-1.31, -0.47] |
-0.40 ± 0.45 [-0.68, -0.12] |
-1.49 ± 1.58 [-2.47, -0.51] |
| Non-Responders | 38 | -0.24 ± 0.83 [-0.50, 0.03] |
0.94 ± 0.72 [0.71, 1.17] |
-0.51 ± 1.33 [-0.94, -0.09] |
0.19 ± 1.44 [-0.27, 0.65] |
| Control | 66 | -0.11 ± 1.13 [-0.38, 0.17] |
0.33 ± 0.79 [0.14, 0.52] |
-0.08 ± 1.09 [-0.35, 0.18] |
0.14 ± 1.36 [-0.19, 0.47] |
Table 6.
Average HbA1c changes in patients treated with mono, dual, or triple therapy with or without 5-ALA phosphate /SFC (control group).
Table 6.
Average HbA1c changes in patients treated with mono, dual, or triple therapy with or without 5-ALA phosphate /SFC (control group).
| Type of treatment | Mono | Dual | Triple | |||
| Time point | Initial | Follow up | Initial | Follow up | Initial | Follow up |
| With 5 ALA /SFC | 7.29 | 6.81 | 8.53 | 7.56 | 8.81 | 7.74 |
| control | 7.33 | 6.71 | 7.99 | 7.30 | 8.41 | 7.74 |
Disclaimer/Publisher’s Note: The statements, opinions and data contained in all publications are solely those of the individual author(s) and contributor(s) and not of MDPI and/or the editor(s). MDPI and/or the editor(s) disclaim responsibility for any injury to people or property resulting from any ideas, methods, instructions or products referred to in the content. |
© 2025 by the authors. Licensee MDPI, Basel, Switzerland. This article is an open access article distributed under the terms and conditions of the Creative Commons Attribution (CC BY) license (http://creativecommons.org/licenses/by/4.0/).
Copyright: This open access article is published under a Creative Commons CC BY 4.0 license, which permit the free download, distribution, and reuse, provided that the author and preprint are cited in any reuse.


