Submitted:
23 August 2025
Posted:
25 August 2025
You are already at the latest version
Abstract
This study investigates the influence of pectin and copper incorporation on the catalytic properties of Pd/ZnO catalysts in the liquid-phase hydrogenation of 2-hexyn-1-ol and photocatalytic hydrogen evolution. A series of monometallic Pd/ZnO catalysts with varying pectin contents (0–8.1 wt%) and bimetallic PdCu-Pec/ZnO catalysts with different Pd to Cu mass ratios (3:1, 1:1, 1:3) were synthesized via sequential adsorption of the polymer and metal ions onto ZnO. The catalysts were characterized using TGA, EDX, IR spectroscopy, XRD, TEM, UV–Vis DRS, and XPS. Characterization confirmed successful modification and changes in surface properties. Pectin modification improved the distribution of Pd nanoparticles (~4 nm) on the ZnO surface, resulting in enhanced catalytic performance of Pd-Pec/ZnO in both hydrogenation and hydrogen evolution reactions compared to unmodified Pd/ZnO. In contrast, copper addition led to a deterioration of catalytic properties in both processes, likely due to the inhibited reduction of Pd caused by Pd–Cu interactions. Among the catalysts studied, Pd-Pec/ZnO with low pectin content (1.8 wt%) exhibited the highest activity in both reactions. The hydrogenation of 2-hexyn-1-ol to cis-2-hexen-1-ol proceeded with high selectivity (96%) at a rate (WC≡C) of 3.3 × 10⁻⁶ mol/s. In the photocatalytic hydrogen evolution reaction, the rate reached 1.11 mmol/h gcat. These findings demonstrate the potential of biopolymer-modified ZnO composites for the design of multifunctional catalysts combining hydrogenation and photocatalytic activity.
Keywords:
Pd/ZnO catalyst
; 2-hexyn-1-ol hydrogenation
; photocatalytic hydrogen production
; pectin
; copper
; catalyst modification
; biopolymer-modified catalysts
1. Introduction
Catalytic hydrogenation is one of the most important chemical transformations that find its practical application in many industrial processes, including production of specialty chemicals from petroleum [1]. For example, various functional groups, such as −C≡C, −C=O, −NO2, −C≡N, −COOR, and −CONH2, can be selectively hydrogenated to their corresponding alkenes, alcohols, and amines that are key intermediates for the fine chemical, polymer, agrochemical, and pharmaceutical industries [1,2]. Among these transformations, the semi-hydrogenation of acetylenic alcohols (e.g., 2-butyne-1,4-diol, 3-hexyn-1-ol, 2-hexyn-1-ol, 2-methyl-3-butyn-2-ol) to the corresponding olefinic alcohols is of particular interest due to their broad application as intermediates in the synthesis of vitamins, perfumes, pharmaceuticals, and agrochemicals [3,4].
Palladium-based heterogeneous catalysts are among the most effective systems for acetylenic compounds hydrogenation, owing to their excellent ability to activate hydrogen and unsaturated bonds [2]. However, it is still highly challenging to control the selective hydrogenation chemistry of the catalysts [5]. Selectivity depends on the electronic and geometric structure of active sites that can be tunned using different approaches such as selection of a suitable support material, incorporation of other metals into Pd catalysts [2]. Сhen X. et al. [6] have reported that Pd species can be uniformly immobilized on zinc oxide by adjusting the pH value to 5.9-6.3 forming a strongly charged surface of the support, thereby anchoring oppositely [PdCl4]2- ions. The following high-temperature reduction (150-500 °C) of the resulting Pd/ZnO catalyst led to formation of intermetallic PdZn active sites exhibiting superior activity, unique selectivity, as well as outstanding stability in the continuous-flow semi-hydrogenation of alkynols to cis-enols.
In the review [7], the authors discussed the prospects of application of bimetallic PdCu nanoparticles as promising catalysts for a wide range of chemical and electrochemical reactions, including hydrogenation of organic compounds. Li J. et al. [8] have reported that the separation of continuous Pd atoms and modification of the Pd electronic state by Cu atoms suppressed β-hydride formation and alkene adsorption, contributing to high selectivity of the developed PdCu@α-Al2O3 catalyst in semi-hydrogenation of different substituted alkynes. Another study [9] revealed the influence of the pH value during Pd deposition on the catalytic performance of Pd–CuO/SiO₂ catalysts for the selective semi-hydrogenation of 2-methyl-3-butyn-2-ol (MBY). At a deposition pH of approximately 5, partial dissolution of CuO occurred, allowing Cu²⁺ ions to co-reduce with Pd²⁺ using NaBH₄. This process led to the formation of a sub-nanometer PdCu alloy. The resulting alloy modified the adsorption strength of MBY on the metal surface and altered the reaction kinetics of its semi-hydrogenation, resulting in high selectivity (up to 95%) toward the desired product, 2-methyl-3-buten-2-ol. Oberhauser W. et al. [10] demonstrated that PdCu-alloy nanoparticles, immobilized on stereocomplexed poly(lactic acid), selectively hydrogenated alkynols to alkenols (98 % at 96 % substrate conversion), whereas the corresponding Pd- and Cu-based catalysts showed high isomerization and over-hydrogenation activity.
Another highly effective strategy for tuning catalyst performance involves surface modification with polymeric or small organic ligands. Such modifiers can control nanoparticle size and morphology, alter the electronic structure of active sites, and influence substrate adsorption pathways [11,12,13]. In particular, biopolymers such as pectin, chitosan, and cellulose derivatives have gained significant attention due to their natural abundance, environmental friendliness, and functional group diversity. These macromolecules can act as stabilizers, structure-directing agents, or co-catalytic supports, enabling better control over reaction selectivity and stability [14]. In our prior work [15], ZnO-supported Pd and PdAg nanocatalysts modified with polysaccharides (2-hydroxyethyl cellulose, chitosan, and pectin) were tested in liquid-phase hydrogenation of 2-hexyn-1-ol under mild conditions (0.1 MPa, 40 °C). The obtained results showed that the selectivity to cis-hexen-1-ol can be improved by modification of a Pd/ZnO catalyst with silver and suitable polymer.
Zinc oxide has also been widely utilized for photocatalytic water splitting due to its excellent performance, low cost, non-toxicity, thermal stability, and chemical stability. However, its photocatalytic efficiency is often limited by poor visible light absorption and the rapid recombination of photogenerated electron–hole pairs. Coupling ZnO with metal or metal oxide nanoparticles can reduce the bandgap, enhance charge separation, suppress recombination, and thereby improve performance in photocatalytic H₂ production [16,17]. For instance, Park J.S. reported that decoration of ZnO nanowires with Pd nanoparticles significantly enhanced their photocatalytic activity [18]. Similarly, Manzoor M.F. et al. demonstrated that doping ZnO with copper improved H₂ evolution by reducing electron–hole recombination [19].
Therefore, this work is aimed to study the effect of modification of the Pd/ZnO with pectin and copper on behavior of the resulting composite catalysts in liquid-phase hydrogenation of 2-hexyn-1-ol and photocatalytic H2 evolution reaction. The effect of modification on the physicochemical properties of the catalysts was also investigated and discussed.
2. Results and Discussion
2.1. Characterization of the Catalysts
Mono- and bimetallic Pd/ZnO, Pd-Pec/ZnO, and PdCu-Pec/ZnO catalysts were prepared via an adsorption method. The amounts of the polymer and metal ions adsorbed on ZnO were assessed by determining their concentrations in the mother liquor after the sorption process. The pectin concentration was determined by measuring the viscosity of the mother liquor and referencing a previously established calibration curve, while the concentration of metal ions was determined using a photoelectric colorimetric (PEC) method.
Table 1 summarizes the results of pectin adsorption onto ZnO for the Pec/ZnO and Pd-Pec/ZnO composites. The data reveal distinct differences in the adsorption behavior between the two systems. In the Pec/ZnO system, the degree of pectin adsorption decreases from 100% to 59% as the amount of pectin introduced into the system increases from 18.5 to 92.5 mg. This trend indicates a saturation of available adsorption sites on the ZnO surface, leading to a plateau in the pectin content within the final composite, which reaches a maximum of approximately 5.0 wt%. In contrast, the Pd-Pec/ZnO system exhibited an adsorption degree of 96-100%. This enhanced adsorption performance is likely related to the formation of polymer–metal complexes between pectin molecules and Pd²⁺ ions. The interaction between palladium and functional groups of pectin (such as carboxyl and hydroxyl groups) may promote partial crosslinking of the polymer chains, increasing their affinity for the ZnO surface. Depending on the amount of pectin introduced, the calculated pectin content was found to be 1.8 wt%, 3.4 wt%, and 5.0 wt% for the Pec/ZnO composites, and 1.8 wt%, 3.5 wt%, and 8.1 wt% for the Pd-Pec/ZnO composites. For simplicity, the obtained Pec/ZnO and Pd-Pec/ZnO composites were designated as Pec1.8/ZnO, Pec3.4/ZnO, Pec5.0/ZnO, Pd-Pec1.8/ZnO, Pd-Pec3.5/ZnO, and Pd-Pec8.1/ZnO, where the number indicates the pectin content (in wt%) in the composite.

Table 1.
The results of the assessment of pectin content in Pec/ZnO and Pd-Pec/ZnO composites.
|
m(Pec) in the Initial Solution, mg |
m(Pec) in Solution after Sorption, mg | m(Pec) Adsorbed, mg | Adsorption Degree, % | Pec Content, % |
| Pec/ZnO | ||||
| 18.5 | 0.0 | 18.5 | 100 | 1.8 |
| 37.0 | 2.2 | 34.8 | 94 | 3.4 |
| 92.5 | 37.8 | 54.7 | 59 | 5.0 |
| Pd-Pec/ZnO | ||||
| 18.5 | 0.0 | 18.5 | 100 | 1.8 |
| 37.0 | 0.0 | 37.0 | 100 | 3.5 |
| 92.5 | 3.4 | 89.1 | 96 | 8.1 |
The presence and varying content of pectin in the composites was confirmed by thermogravimetric analysis (TGA) and infrared spectroscopy (IR). According to TGA data (Figure 1) the thermal degradation of Pd-Pec/ZnO composites occurred in two stages. Below 200 °C, there is an initial weight loss of 0.4-1.3%, which corresponds with the evaporation of physically adsorbed water. The main weight loss occurred in the range from 200 to 400 °C, corresponding to the decomposition of the polymer [20]. In the case of Pd-Pec8.1/ZnO, the weight loss in the 200–400 °C temperature range was higher (~4%) compared to Pd-Pec1.8/ZnO (~2%) and Pd-Pec3.5/ZnO (~3%), confirming the differing polymer content in the composites. Given that pure pectin loses approximately 50% of its mass in the 200–400 °C temperature range (Figure 1, inset), the calculated pectin content in Pd-Pec8.1/ZnO was estimated to be around 8%. This estimate is consistent with the viscosimetry data presented in Table 1, thereby confirming the quantitative deposition of pectin on the ZnO surface.
Figure 1.
TGA of Pd-Pec1.8/ZnO, Pd-Pec3.5/ZnO, Pd-Pec8.1/ZnO and pectin (inset).
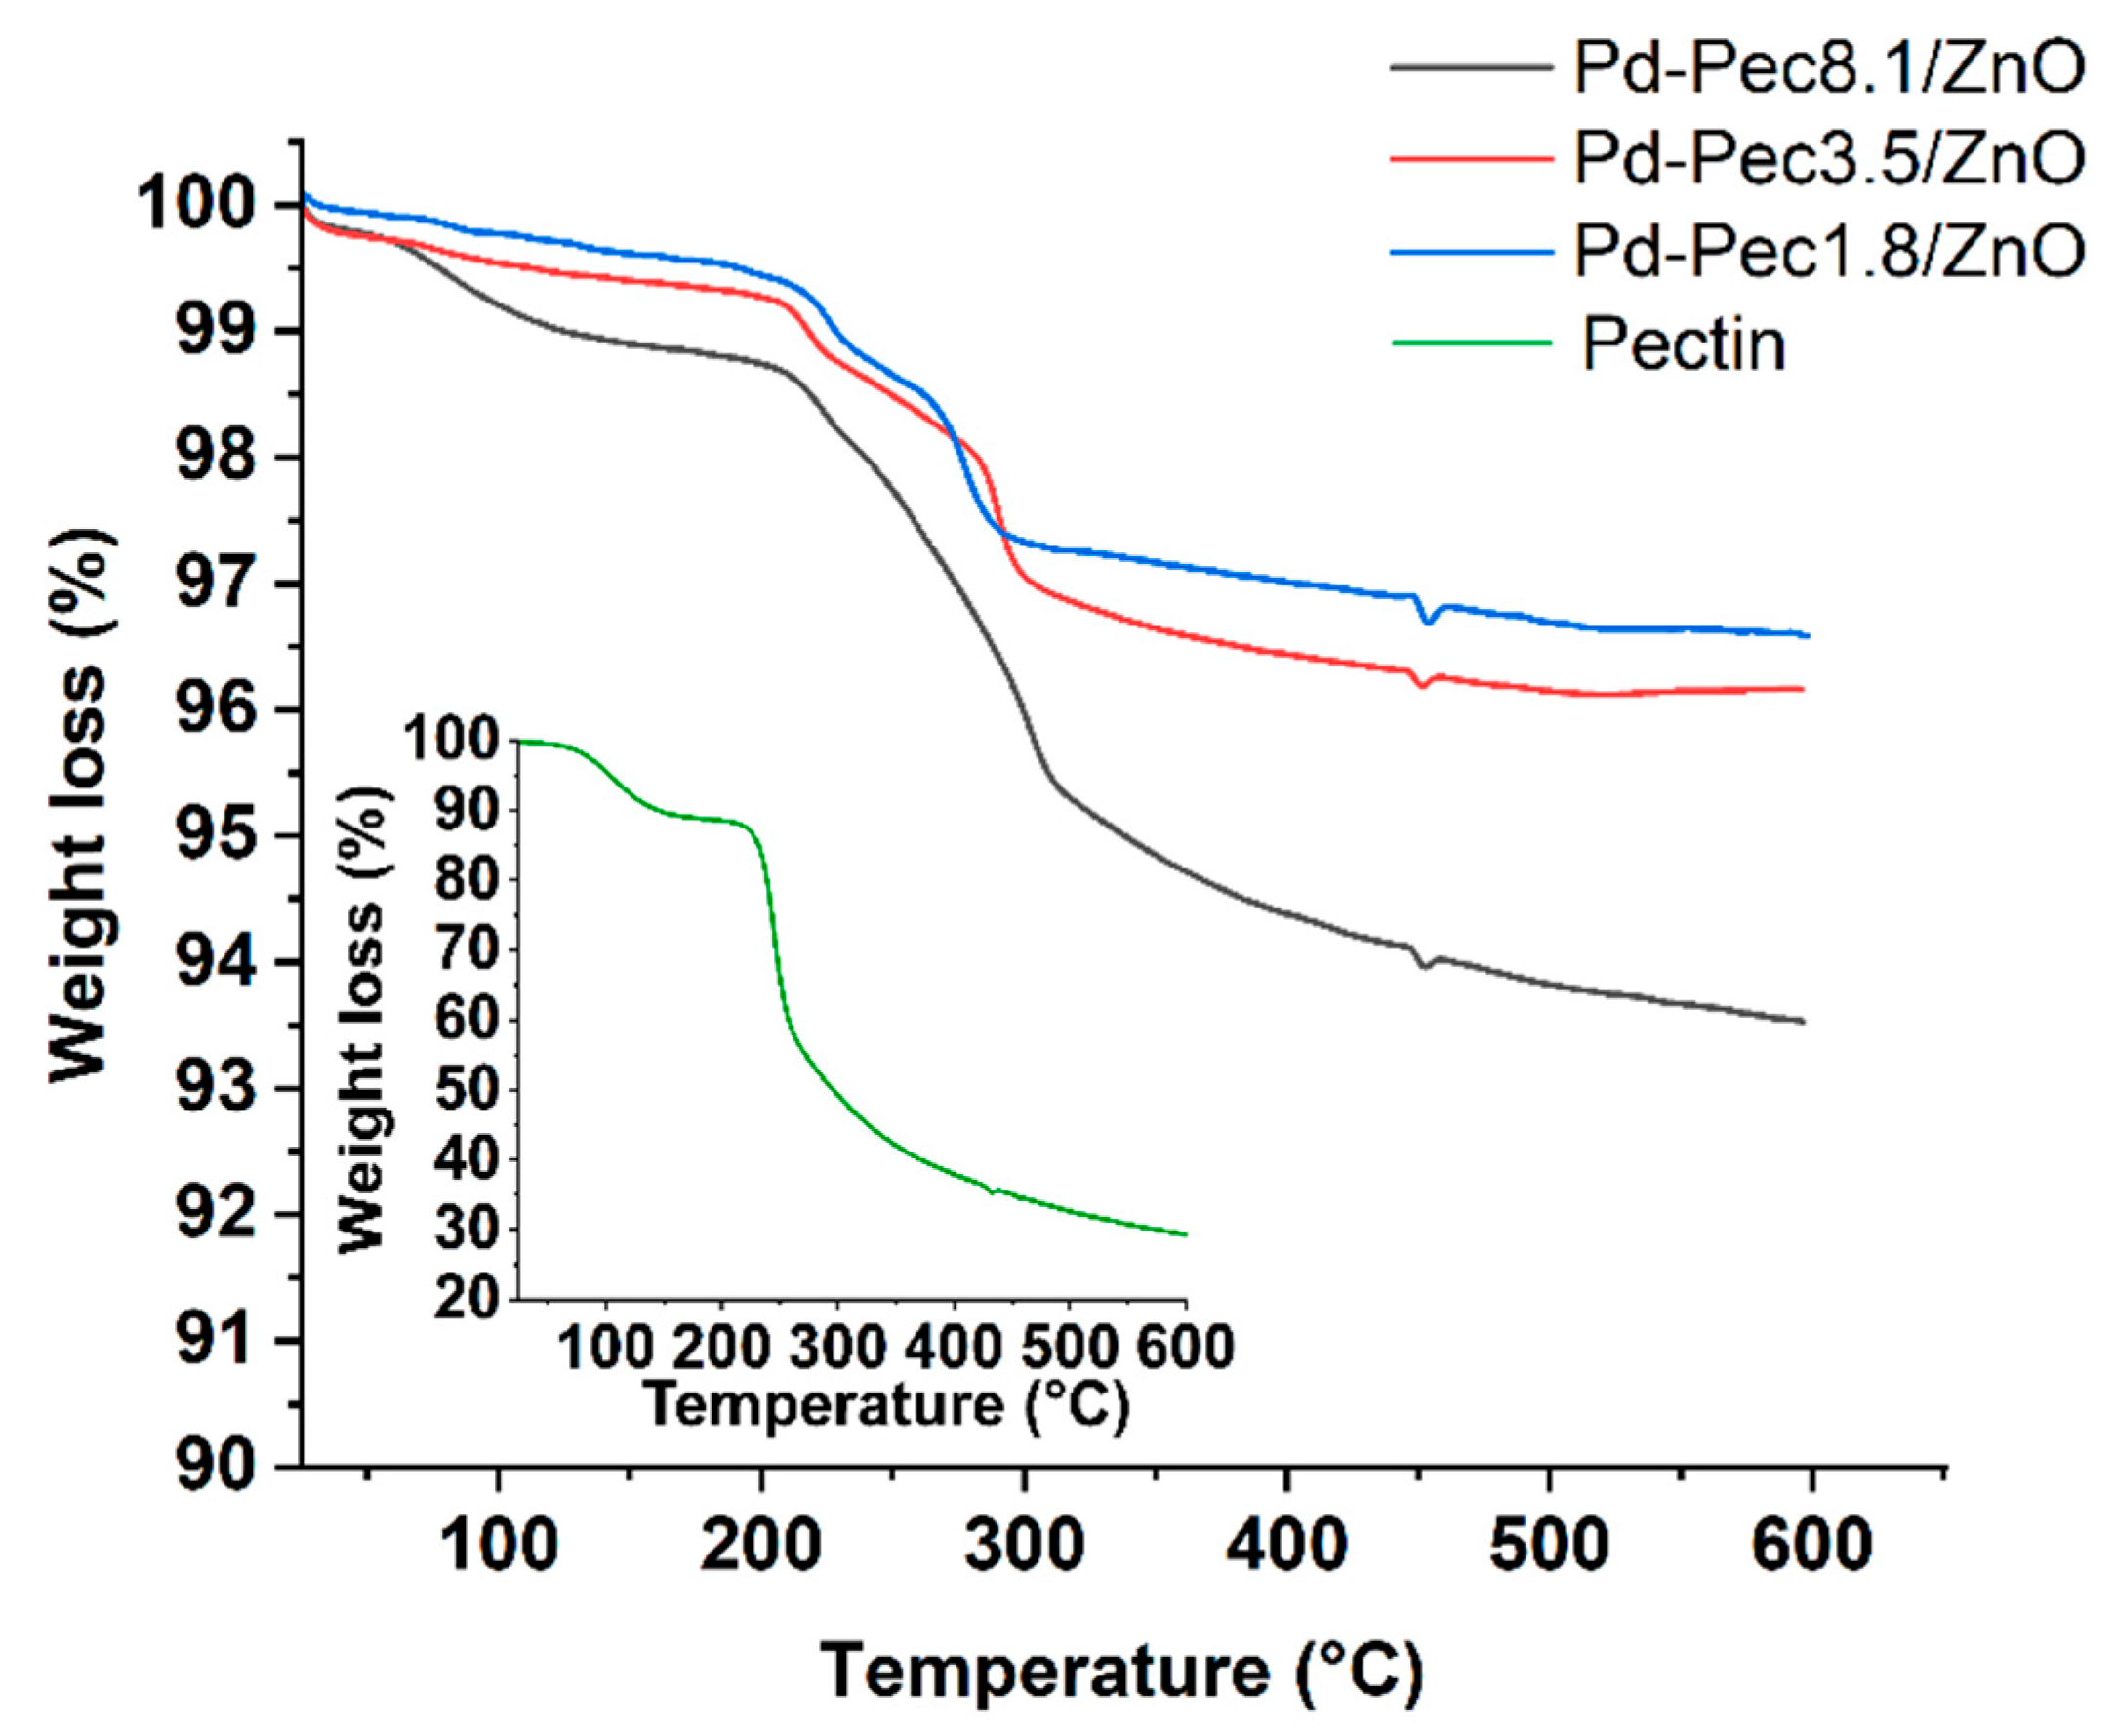
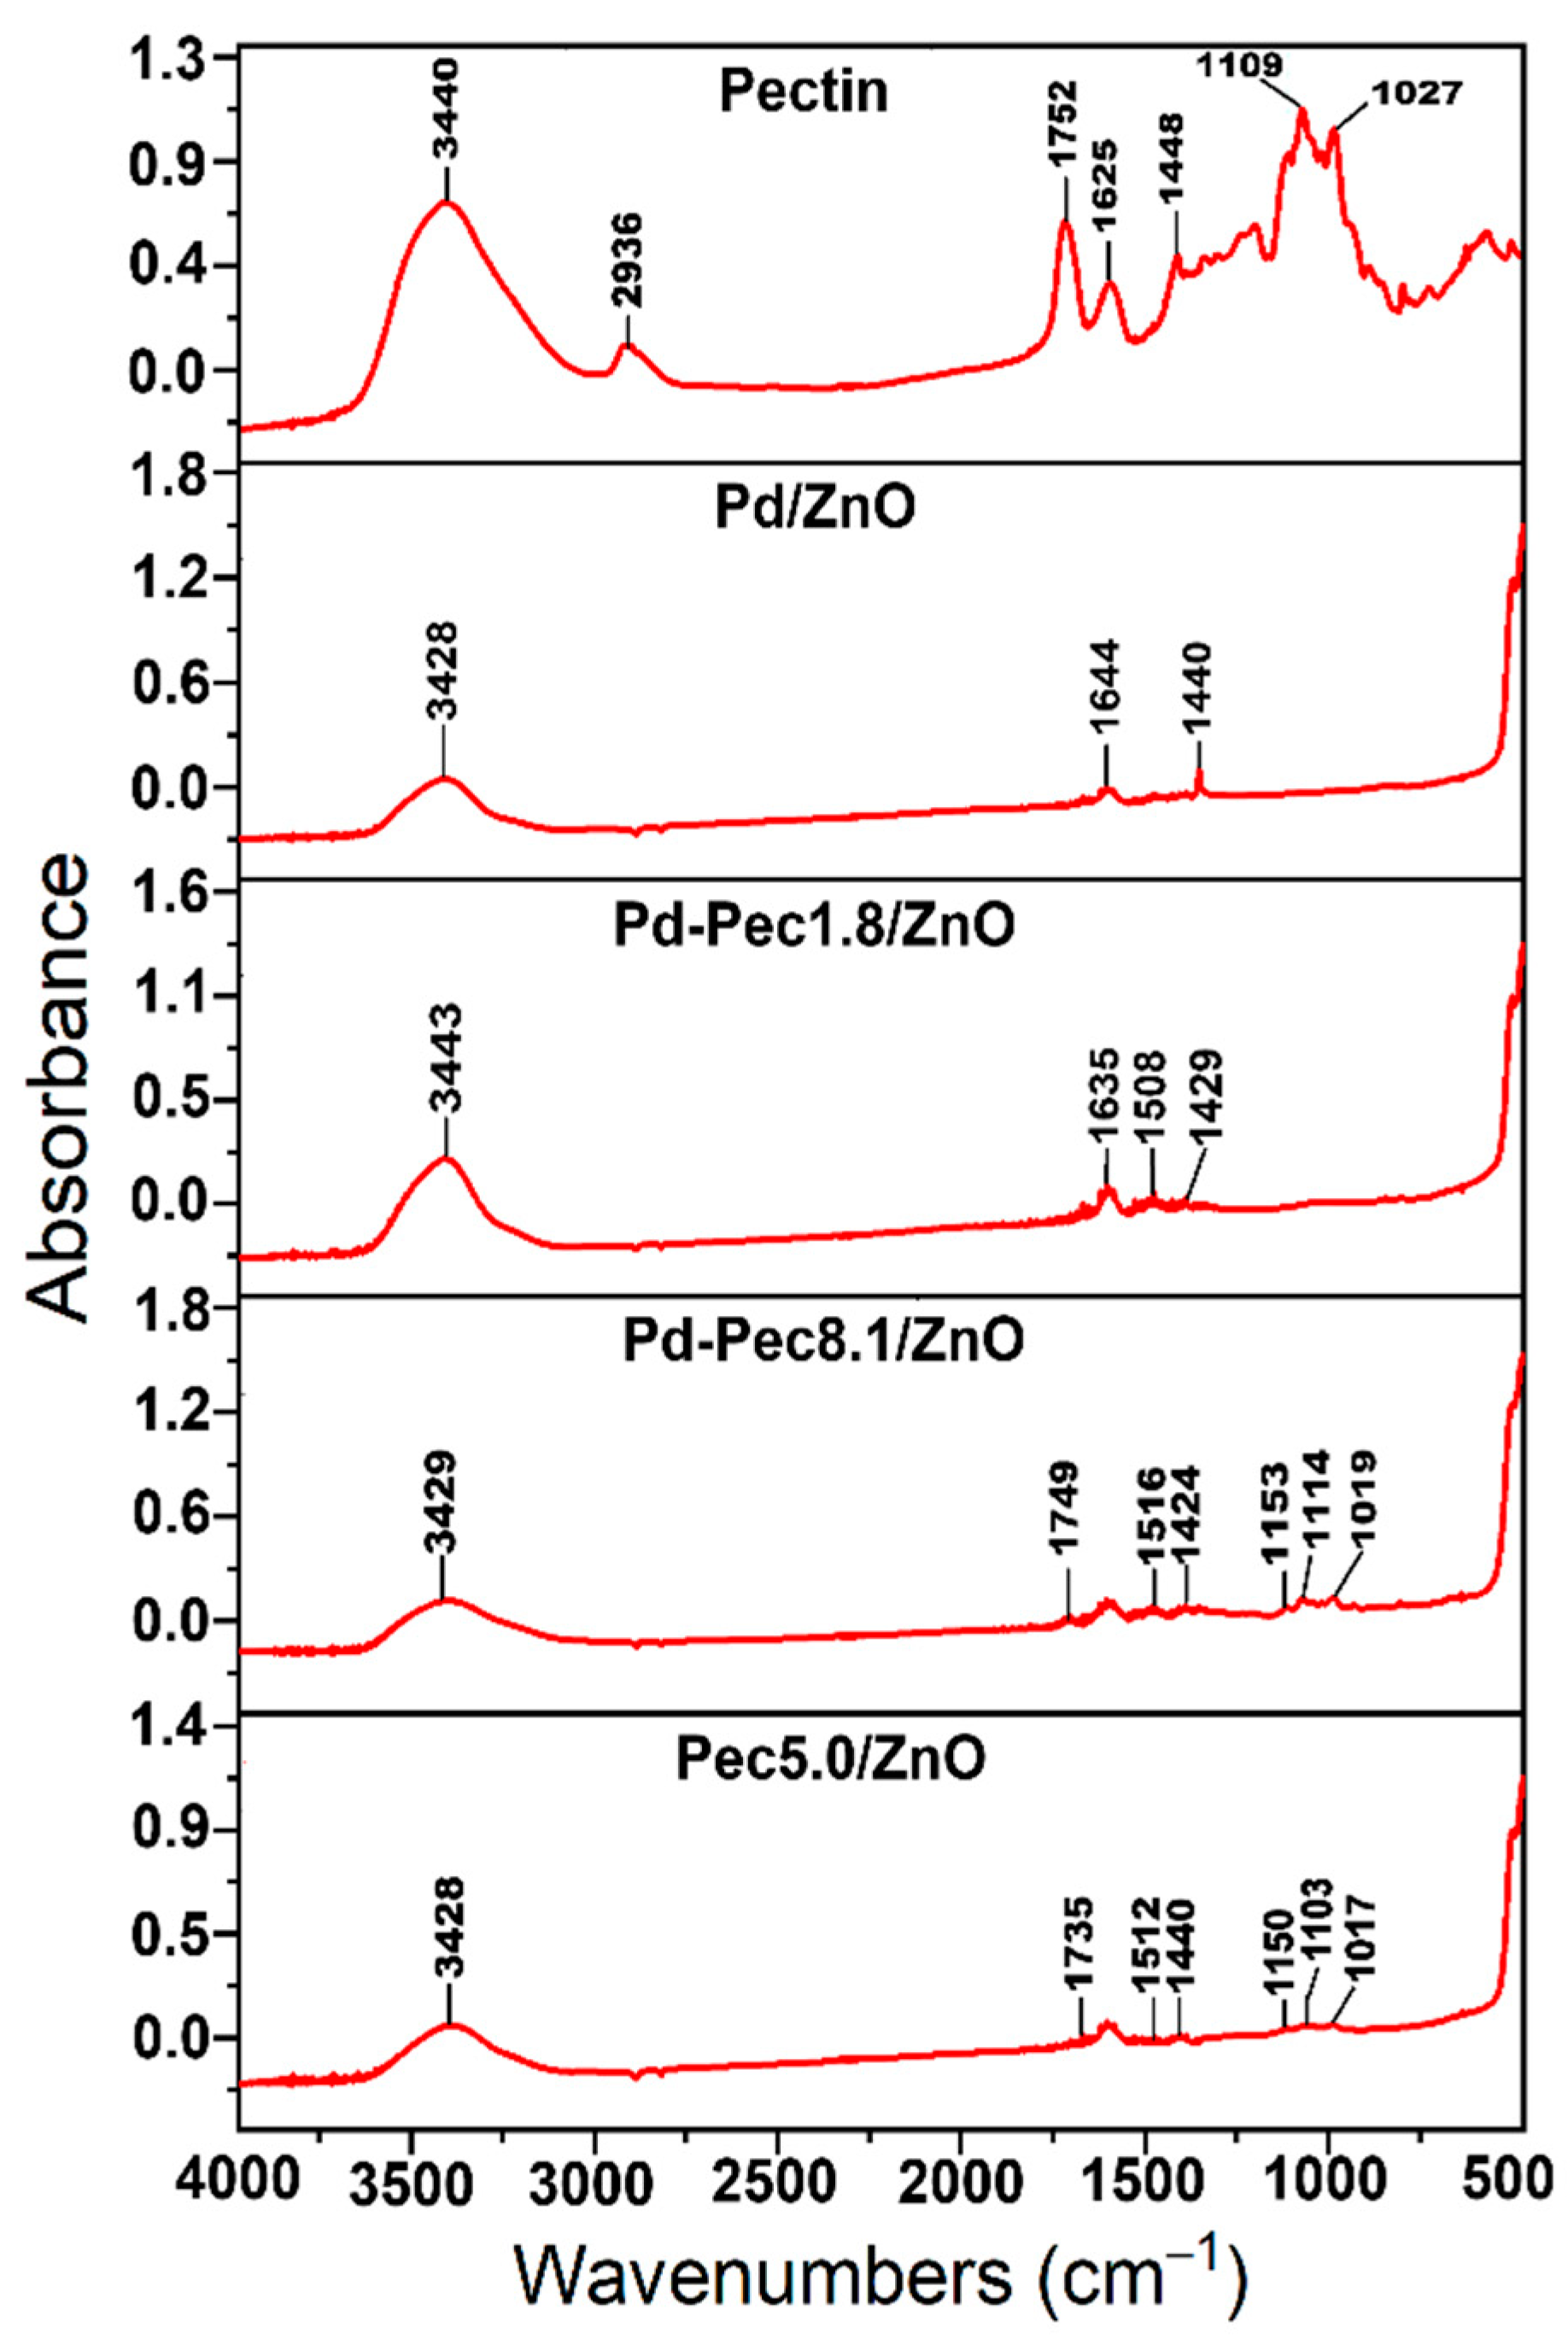
Figure 2 shows IR spectra of pectin, Pd/ZnO, Pd-Pec1.8/ZnO, Pd-Pec8.1/ZnO and Pec5.0/ZnO. The IR spectrum of pectin (Figure 2a) displays characteristic absorption bands corresponding to various functional groups of the polymer. Specifically, the bands at 3440 cm⁻¹, 1752 cm⁻¹, and 1625 cm⁻¹ are attributed to the stretching vibrations of –OH, C=O of ester, and C=O of carboxylic acid groups, respectively [21]. Notably, the absorbance is higher at 1752 cm−1 than at 1625 cm−1, confirming a high degree of esterification of the pectin (more than 50%). In addition, the region between 1200–1500 cm⁻¹ contains absorption bands associated with the stretching and bending vibrations of –C–OH, –C–H, and –O–H functional groups [22]. The broad absorption band in the range of 950–1200 cm⁻¹ corresponds to the “fingerprint” region of carbohydrates, which is crucial for identifying key structural units such as C–O, C–O–C, and C–C bonds in polysaccharides [23]. The IR spectrum of Pd/ZnO exhibits characteristic bands at 400–500 cm⁻¹, 1635 cm⁻¹, and 3443 cm⁻¹. The intensive band in the range of 400–500 cm⁻¹ corresponds to the Zn–O stretching vibrations, which are typical for ZnO-based materials [24]. The band at 1635 cm⁻¹ is assigned to the bending vibrations of adsorbed water molecules (H–O–H), while the broad absorption band at 3443 cm⁻¹ is attributed to the O–H stretching vibrations of surface hydroxyl groups or physically adsorbed water [25]. The IR spectra of Pec5.0/ZnO and Pd-Pec/ZnO composites (Figure 2c–f) display absorption bands characteristic of both pectin and Pd/ZnO, confirming the successful incorporation of the polymer into the composite structure. Notably, the intensity of pectin-related bands (especially evident in the fingerprint region around 950–1200 cm⁻¹) increases in the following order: Pd-Pec1.8/ZnO < Pec5.0/ZnO < Pd-Pec8.1/ZnO, reflecting the increasing pectin content in the composites. This trend is consistent with the results obtained from viscosimetry (Table 1) and TGA (Figure 1), further confirming the varying amounts of polymer deposited on the ZnO surface. Moreover, a comparison of IR spectra of pectin (Figure 2a), Pec5.0/ZnO (Figure 2f) and Pd-Pec8.1/ZnO (Figure 2d) composites indicated interaction of pectin with both ZnO and Pd ions. This is evidenced by the shift of the ester carbonyl (COOR) band from 1752 cm⁻¹ in pure pectin to 1735 cm⁻¹ in Pec5.0/ZnO and 1749 cm⁻¹ in Pd-Pec8.1/ZnO. Furthermore, new bands appearing at 1512 (Pec5.0/ZnO) and 1516 cm⁻¹ (Pd-Pec8.1/ZnO) in the composite samples can be attributed to the asymmetric stretching vibrations of carboxylate anions (COO⁻) [26], indicating coordination between deprotonated carboxyl groups and Zn²⁺ or Pd²⁺ ions. Minor shifts in the fingerprint region (950–1200 cm⁻¹) further support the structural modification of pectin upon interaction with the inorganic components.
Figure 2.
IR spectra of pectin, Pd/ZnO, Pd-Pec1.8/ZnO, Pd-Pec8.1/ZnO and Pec5.0/ZnO.
According to photoelectric colorimetric (PEC) analysis data, palladium ions were quantitatively adsorbed (~100%) on ZnO, which can be explained by the hydrolysis of Pd ions in the presence of ZnO. Pec/ZnO composites with a low pectin content (up to ~3.5 wt.%) also demonstrated high sorption capacity (96-99%) toward Pd²⁺ ions. In these cases, palladium ions likely interact with both ZnO and the pectin adsorbed on its surface. However, when the pectin content in the Pec/ZnO composite was increased to ~8 wt.%, the degree of Pd adsorption decreased to 86.6%. This could be attributed to the binding of Pd²⁺ ions with excess pectin that was not adsorbed onto the ZnO surface. This assumption was further supported by an additional experiment: the clarification of the mother liquor upon ethanol addition to the Pd²⁺–Pec–ZnO system suggested the complete removal of the free Pd–Pec complex via precipitation. During the preparation of bimetallic catalysts, palladium was introduced into the system after copper. In these cases, the amount of palladium introduced was lower, which likely facilitated it’s more complete sorption. As a result, the degree of Pd²⁺ adsorption reached 99–100%. Copper ions were also effectively adsorbed in the PdCu–Pec1.8/ZnO composites, with adsorption degrees ranging from 90% to 96% depending on the Pd:Cu ratio. Based on PEC analysis, the total metal (Pd and Cu) content in the catalysts was approximately 1 wt.%, which was consistent with the results obtained by energy-dispersive X-ray (EDX) elemental analysis (Table 2).
Table 2.
Results of assessing the degree of deposition of palladium and copper ions on ZnO and Pec/ZnO support materials.
Table 2.
Results of assessing the degree of deposition of palladium and copper ions on ZnO and Pec/ZnO support materials.
| Catalyst | Amount of Metal in Mother Liquor, mg | The Degree of Adsorption, % | Pd Content in a Catalyst, %wt. | |||||||
|---|---|---|---|---|---|---|---|---|---|---|
| before Sorption | after Sorption | PEC | EDX | |||||||
| Pd | Cu | Pd | Cu | Pd | Cu | Pd | Cu | Pd | Cu | |
| Pd/ZnO | 10.1 | - | 0.04 | - | 99.6 | - | 1.0 | - | 0.95 | - |
| Pd-Pec1.8/ZnO | 10.3 | - | 0.14 | - | 98.6 | - | 1.0 | - | 0.96 | - |
| Pd-Pec3.5/ZnO | 10.5 | - | 0.40 | - | 96.2 | - | 1.0 | - | 0.94 | - |
| Pd-Pec8.1/ZnO | 11.0 | - | 1.47 | - | 86.6 | - | 0.9 | - | 0.89 | - |
| PdCu(3:1)-Pec1.8/ZnO | 7.7 | 2.6 | 0.08 | 0.24 | 99.0 | 90.8 | 0.74 | 0.23 | 0.71 | 0.24 |
| PdCu(1:1)-Pec1.8/ZnO | 5.2 | 5.2 | 0 | 0.54 | 100 | 89.6 | 0.50 | 0.45 | 0.52 | 0.56 |
| Pd-Cu(1:3)-Pec1.8/ZnO | 2.6 | 7.7 | 0 | 0.32 | 100 | 95.8 | 0.25 | 0.72 | 0.17 | 0.81 |
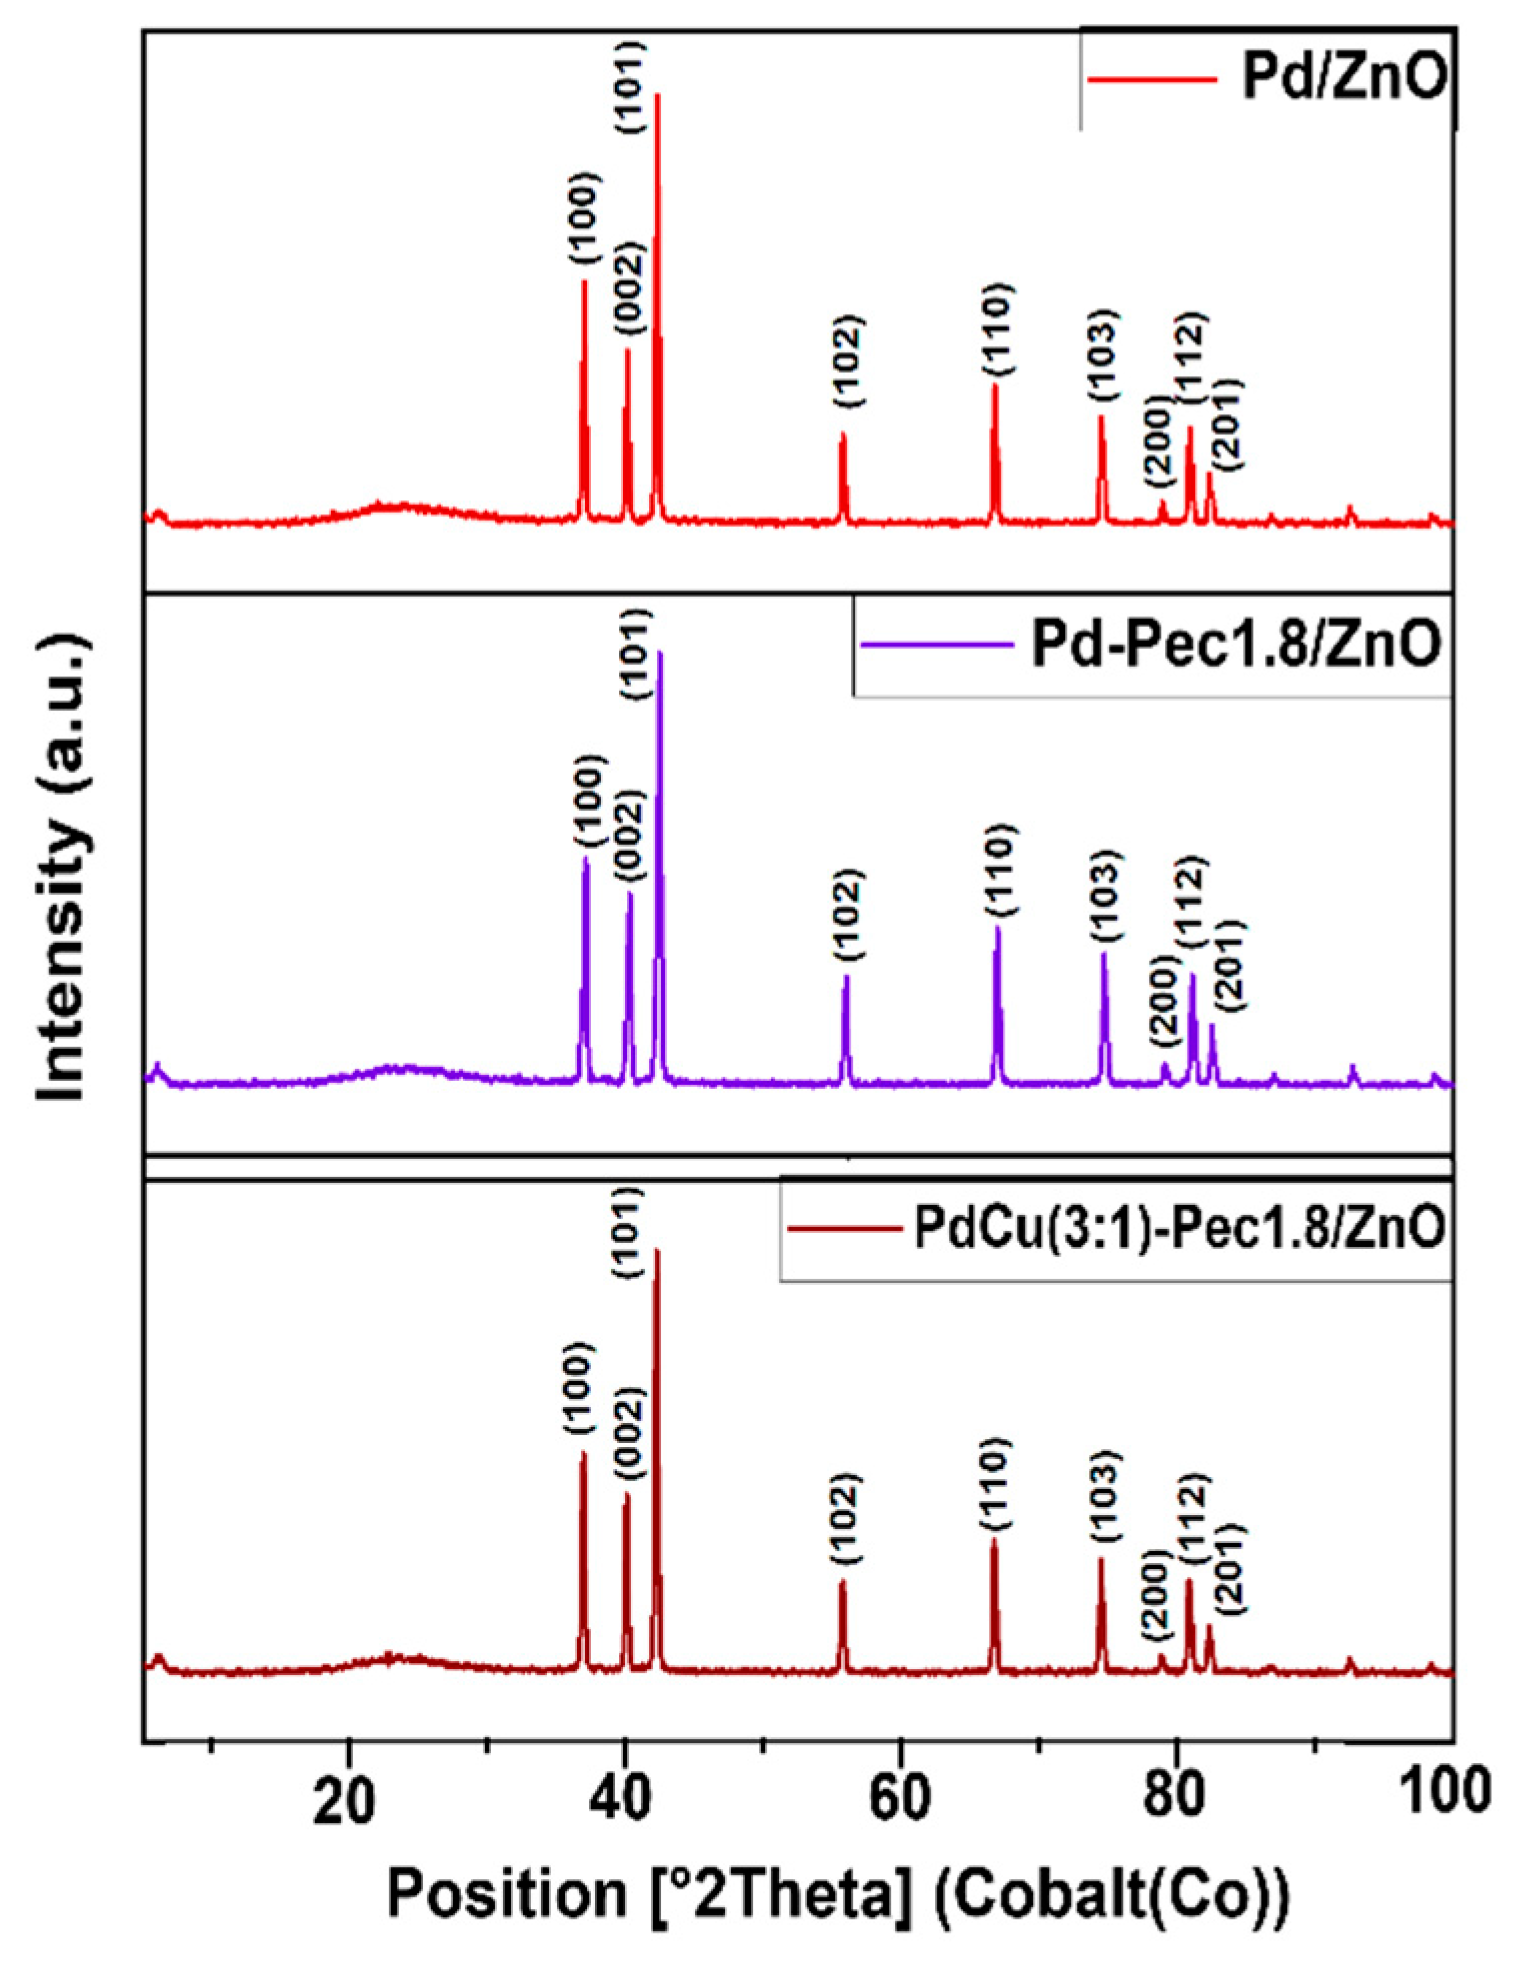
The results of X-ray powder diffraction analysis (XRD) of the Pd/ZnO, Pd-Pec1.8/ZnO, and PdCu(3:1)-Pec1.8/ZnO are shown in Figure 3. All XRD patterns showed characteristic peaks at 36.9°, 40.0°, 42.2°, 55.6°, 66.7°, 74.4°, 78.8°, 80.8°, and 82.3°, corresponding to the (100), (002), (101), (102), (110), (103), (200), (112), and (201) planes of ZnO hexagonal wurtzite structures (JCPDS card no. 79-2205) [27]. No diffraction peaks corresponding to palladium (Pd or PdO) or copper (Cu, Cu₂O, or CuO) species were observed in the XRD patterns of the catalysts. This absence can be attributed to the low metal content (Pd and Cu) in the samples, as well as the small size and high dispersion of the metal particles [15].
Figure 3.
XRD patterns of Pd/ZnO, Pd-Pec1.8/ZnO, and PdCu(3:1)-Pec1.8/ZnO.
To evaluate the size of metal particles and their distribution of a support surface Pd/ZnO, Pd-Pec1.8/ZnO, and PdCu(3:1)-Pec1.8/ZnO were studied using transmission electron microscopy (TEM) method (Figure 4). Before studies the catalysts were treated with hydrogen (1 atm) in a reactor at 40 °C for 30 min.
Figure 4.
TEM microphotographs (a, b, c), HAADF-STEM and EDX elemental mapping images (d, f) from Pd/ZnO (a), Pd-Pec1.8/ZnO (b, d), and PdCu(3:1)-Pec1.8/ZnO (c, f).
Figure 4.
TEM microphotographs (a, b, c), HAADF-STEM and EDX elemental mapping images (d, f) from Pd/ZnO (a), Pd-Pec1.8/ZnO (b, d), and PdCu(3:1)-Pec1.8/ZnO (c, f).
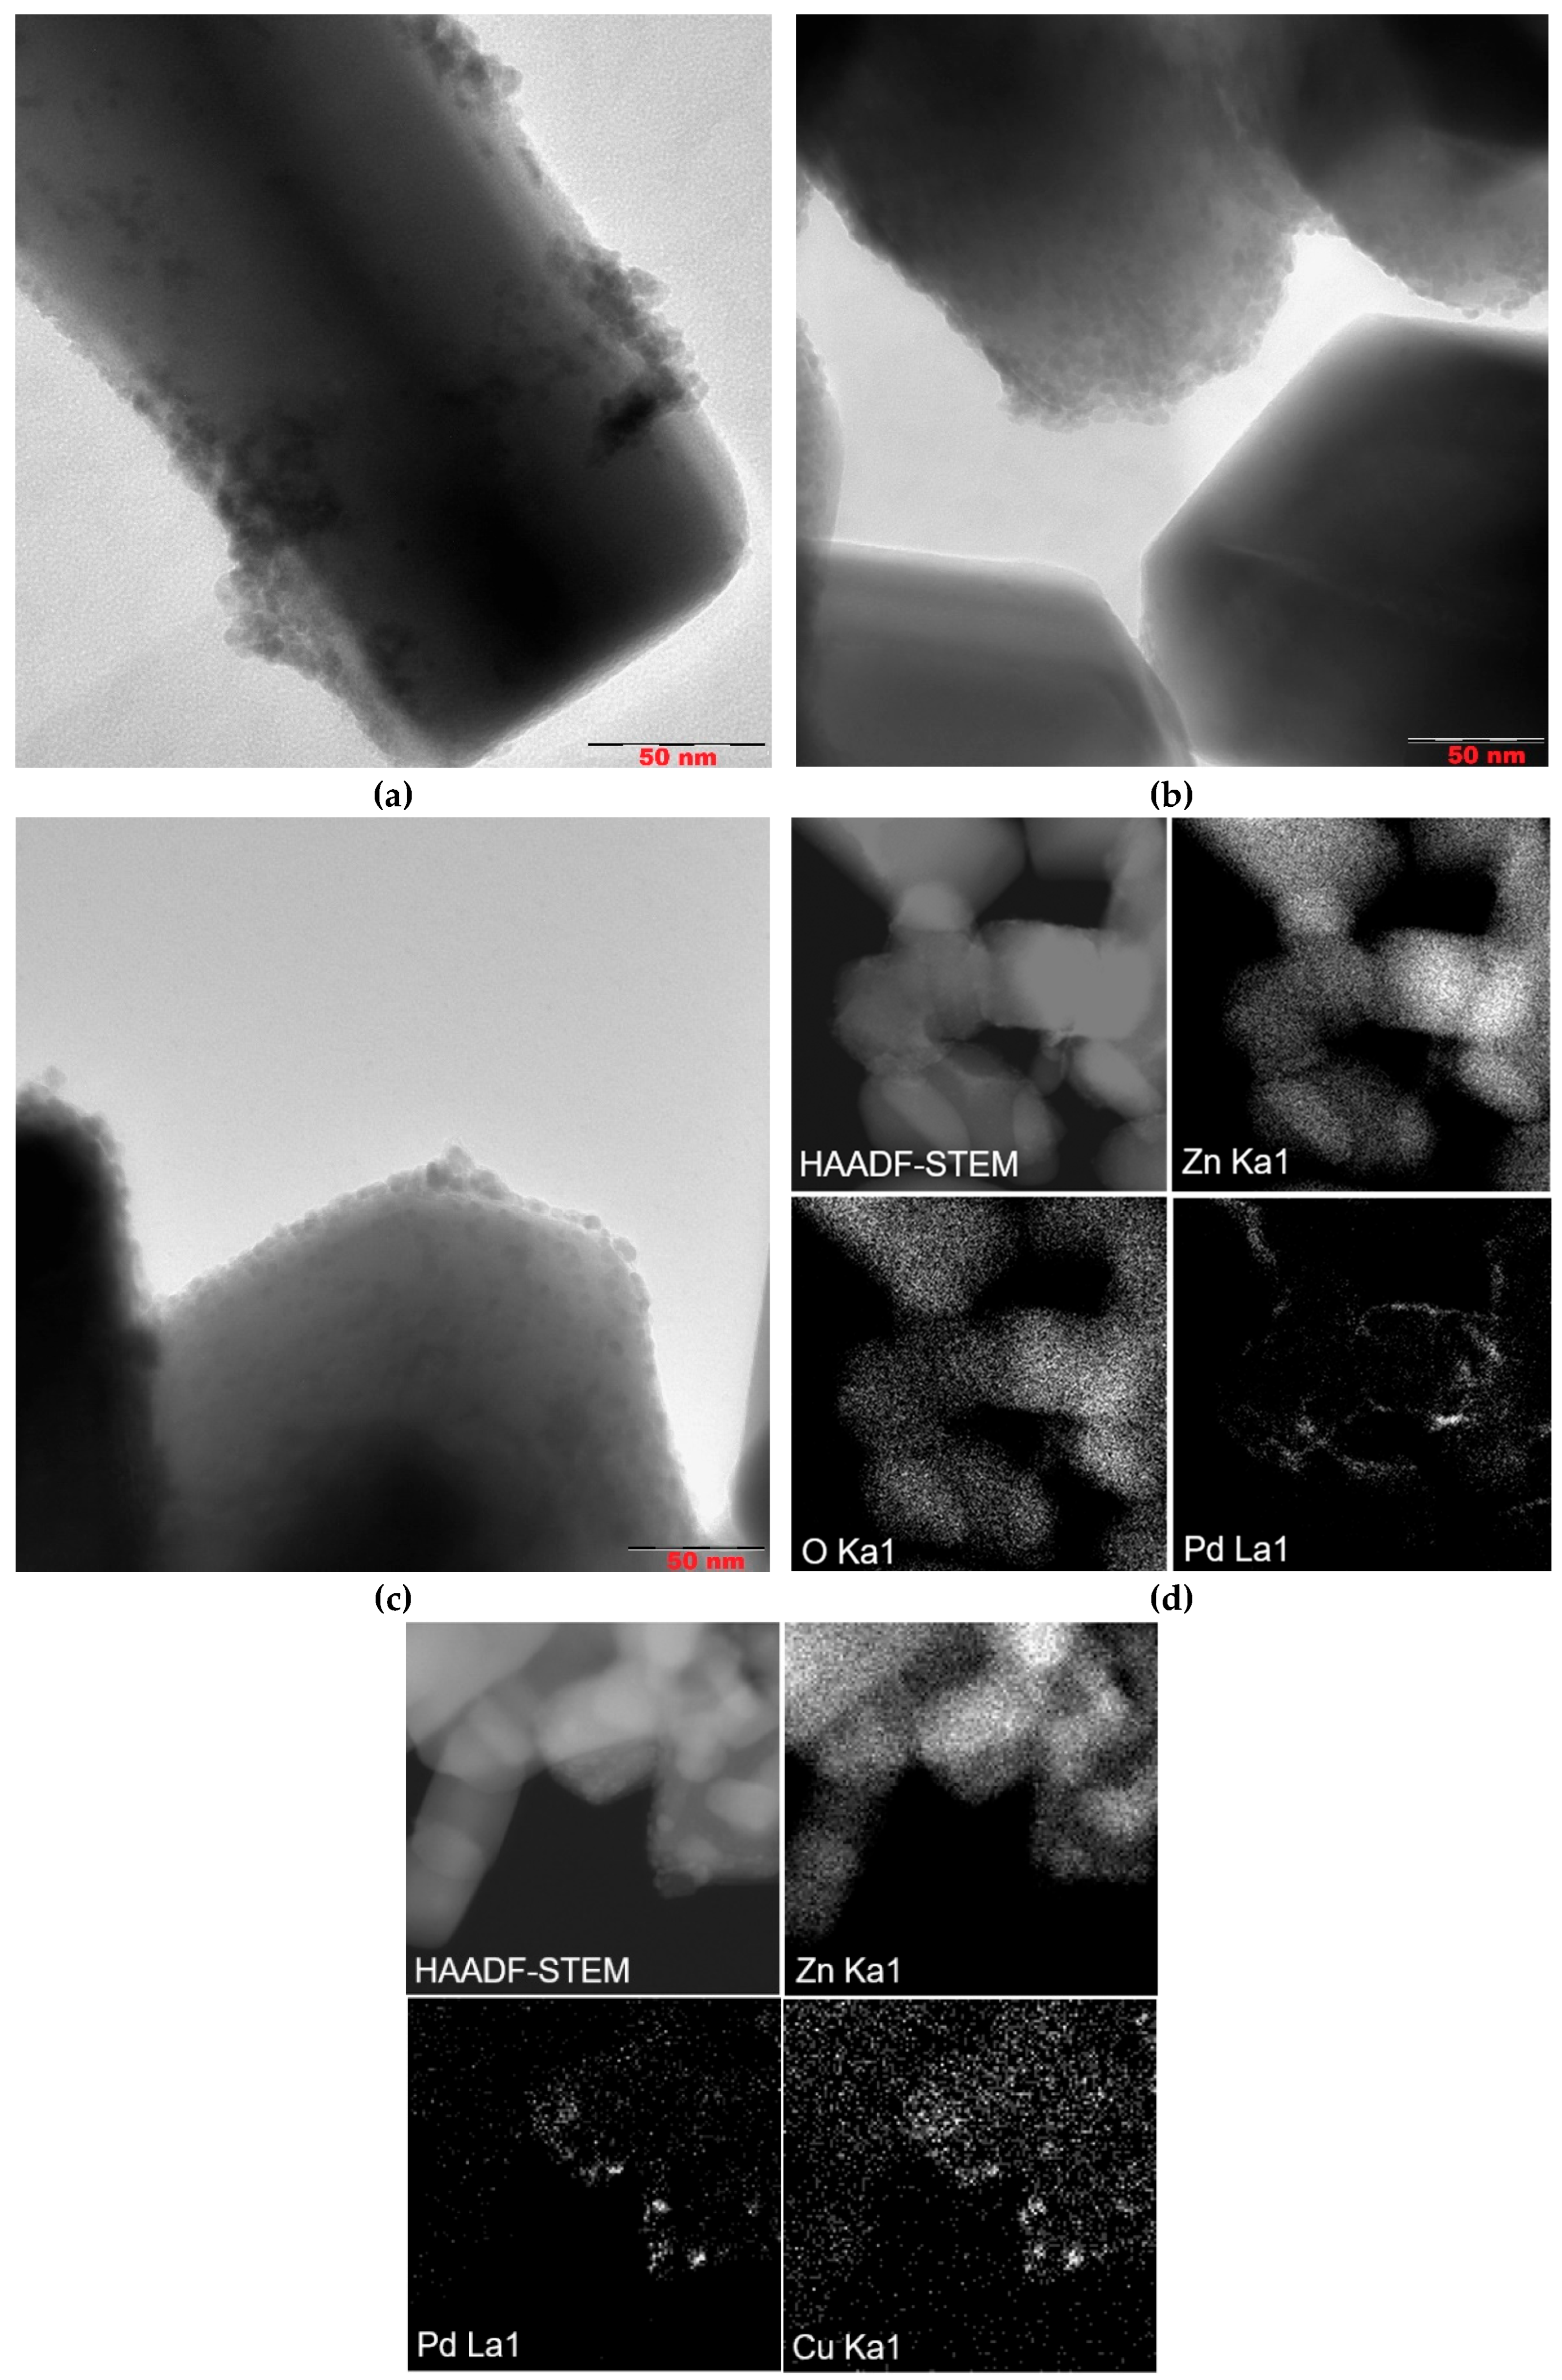
According to TEM studies, the Pd/ZnO catalyst is composed of palladium (Pd) nanoparticles with a primary size of approximately 4–5 nm. These nanoparticles tend to aggregate, forming larger nanoclusters ranging from 10 to 30 nm in size, which are distributed across various sites of the ZnO support. However, in certain regions, Pd nanoparticles remain well-dispersed without forming aggregates (Figure 4a). In contrast, both the Pd–Pec1.8/ZnO (Figure 4b) and bimetallic PdCu(3:1)–Pec1.8/ZnO (Figure 4c) catalysts exhibit a uniform distribution of nanoparticles on the ZnO support, with an average particle size of approximately 4 nm. The nanoparticles are predominantly spherical or slightly oval in shape and show no signs of significant aggregation. The use of pectin as a stabilizing agent during synthesis likely contributes to this homogeneous dispersion by preventing nanoparticle growth and aggregation. Elemental mapping analysis of the Pd–Pec1.8/ZnO catalyst (Figure 4d) further confirms the homogeneous distribution of palladium on the Pec1.8/ZnO support surface. The HAADF-STEM image, along with the corresponding EDX elemental maps for Zn (Zn Kα1), O (O Kα1), and Pd (Pd Lα1), shows that palladium is well-dispersed across the support without evidence of significant aggregation or phase separation. Similarly, the elemental maps of the PdCu(3:1)–Pec1.8/ZnO catalyst (Figure 4f) show uniform distribution and co-localization of Pd and Cu nanoparticles on the ZnO surface. The overlapping bright spots in the Pd and Cu maps suggest that both metals may be spatially coincident, which could indicate the formation of bimetallic nanoparticles or alloys.
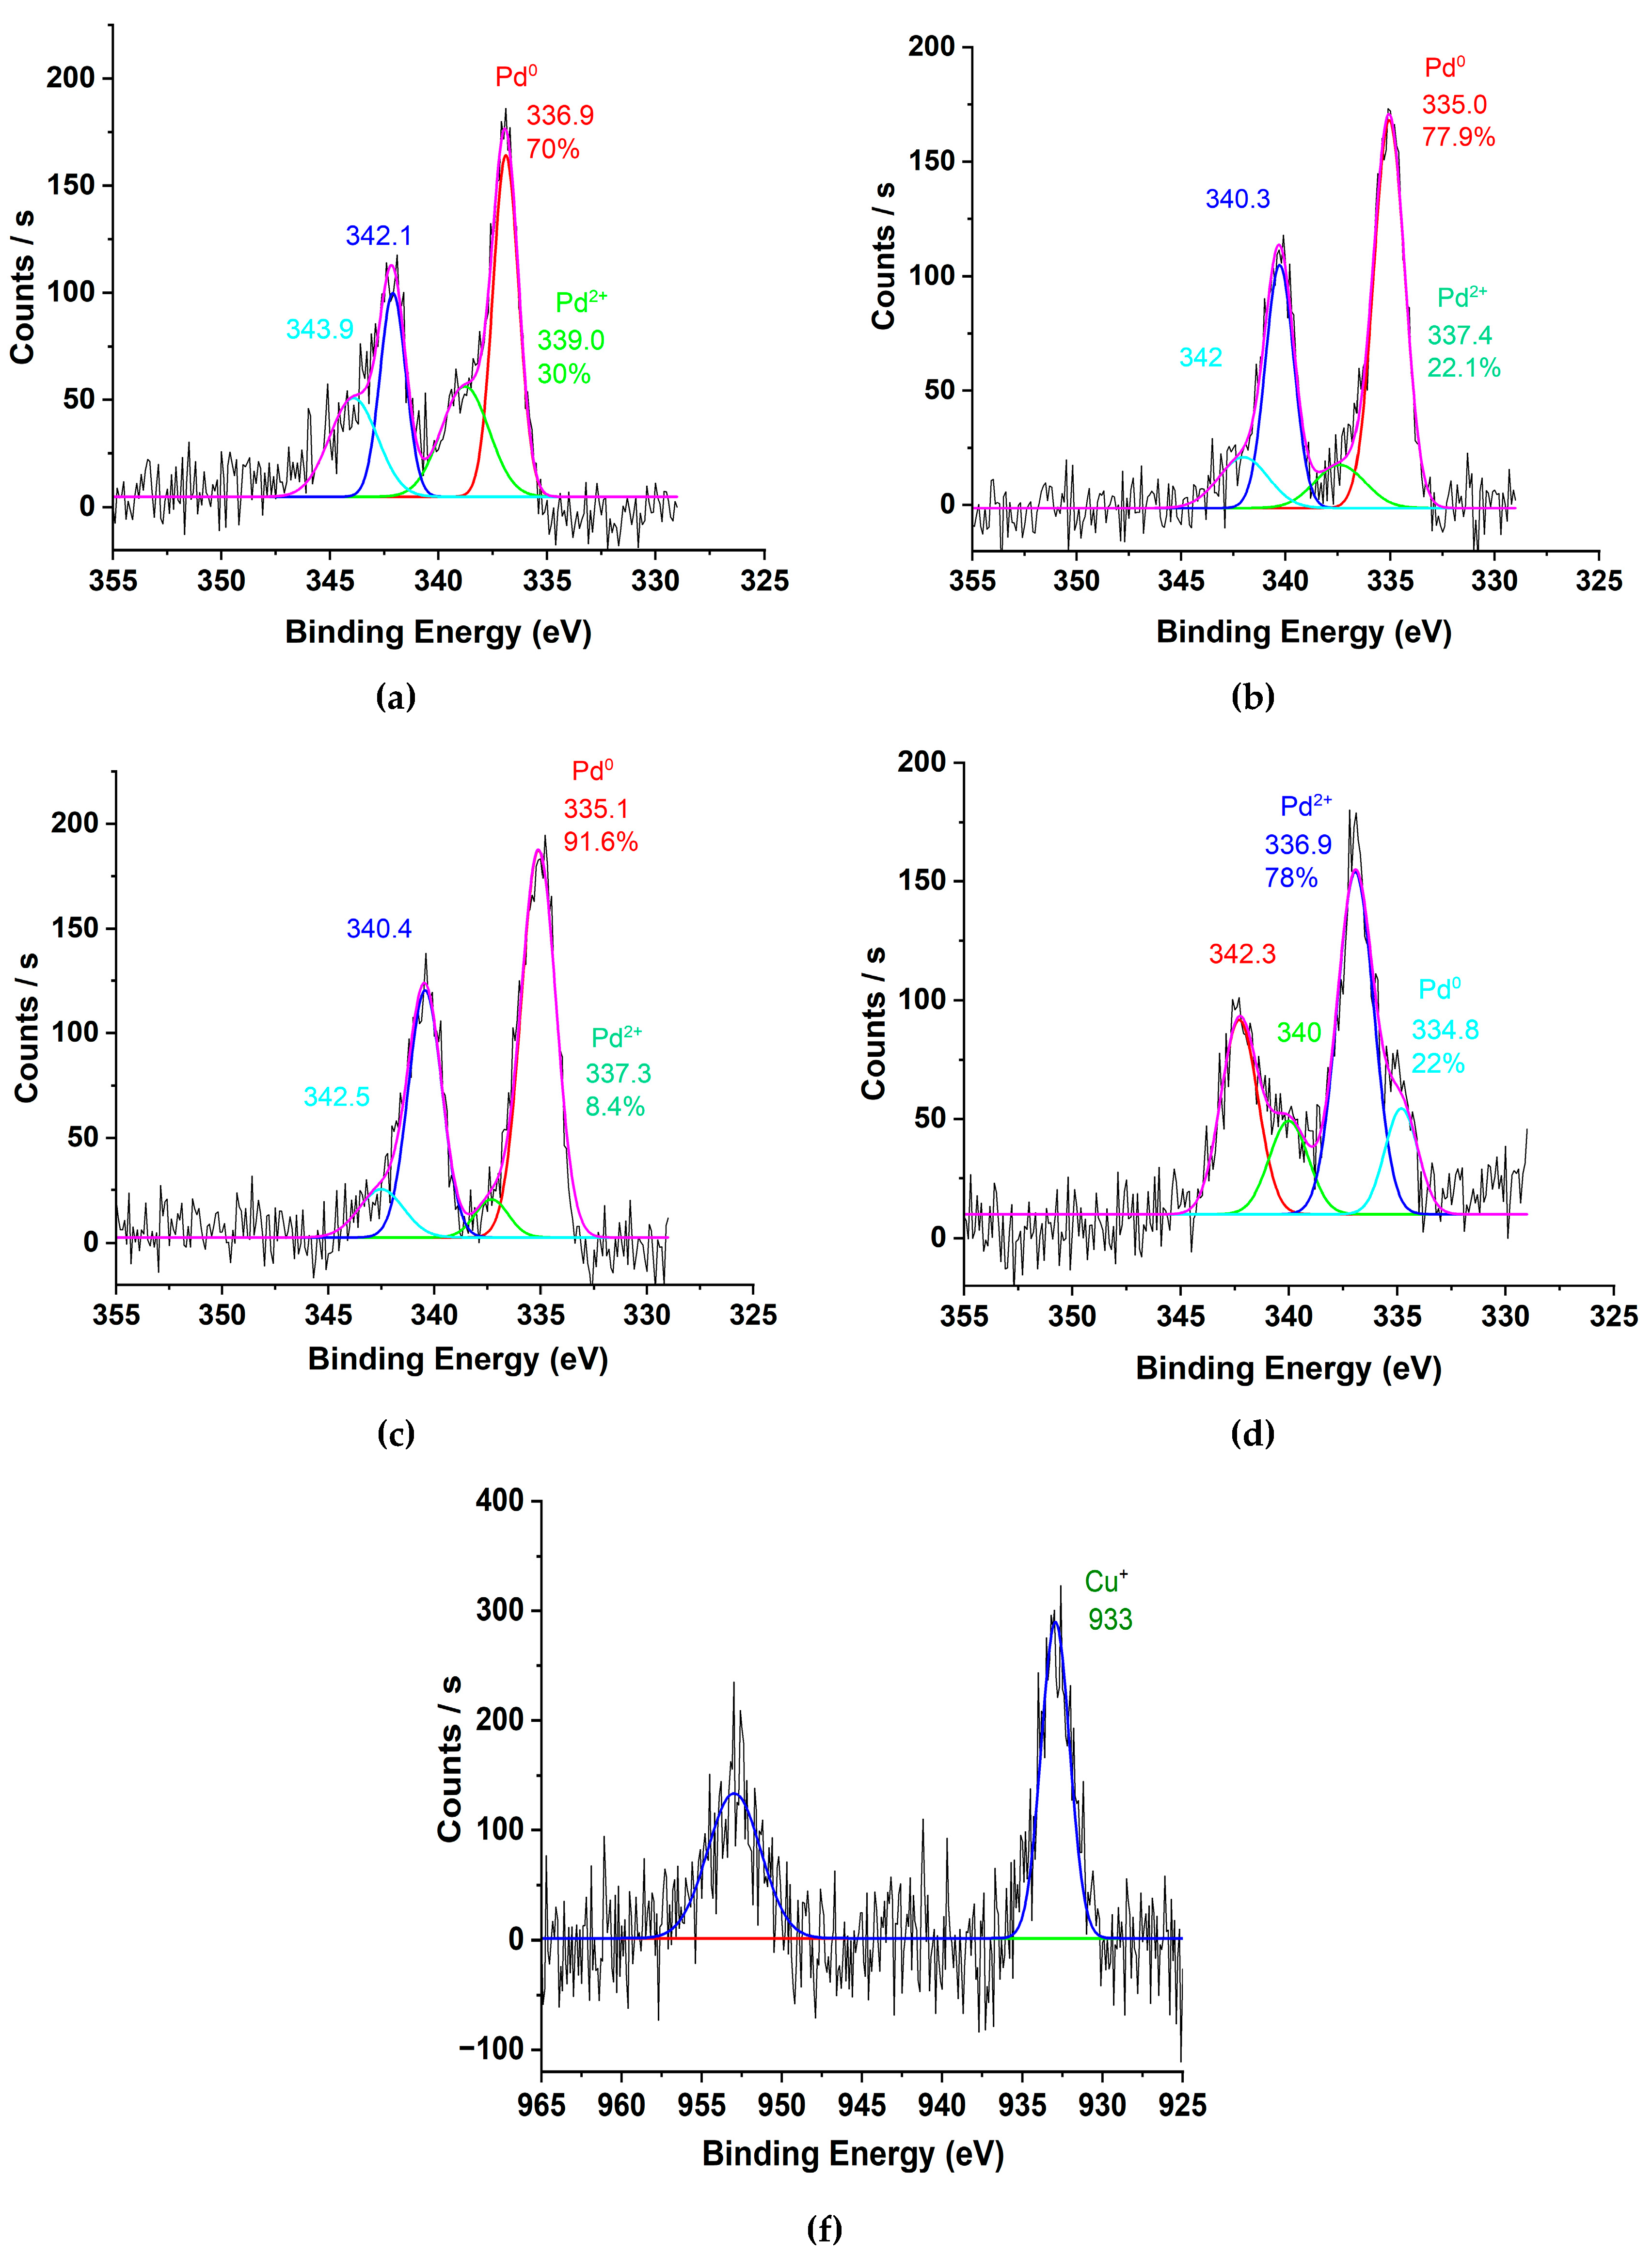
To assess the oxidation states of palladium and copper species during the hydrogenation process, X-ray photoelectron spectroscopy (XPS) was employed. The catalysts (Pd/ZnO, Pd-Pec1.8/ZnO, and PdCu(3:1)-Pec1.8/ZnO) were pretreated with molecular hydrogen at 40 °C in a reactor prior to XPS analysis. Additionally, untreated Pd-Pec1.8/ZnO was analyzed to determine the effect of hydrogen pretreatment on the Pd species. Figure 5 shows Pd 3d and Cu 2p regions of the XPS spectra of the catalysts. The deconvoluted Pd 3d signals (Figure 5a-d) clearly illustrate the different oxidation states of Pd existing on the surface of the catalysts. In the untreated Pd-Pec1.8/ZnO, Pd 3d 5/2 peaks with binding energies at 336.9 eV and 339.0 eV can be attributed to Pd in +2 and +4 oxidation states, respectively (Figure 5a) [28,29]. Treatment of the catalyst with molecular hydrogen at 40 °C led to significant changes in the Pd 3d spectral profile (Figure 5b). The peak at 339.0 eV (Pd⁴⁺) disappeared, and a new peak emerged at 335.0 eV, characteristic of metallic palladium (Pd⁰) [30,31]. In the reduced Pd-Pec1.8/ZnO sample, Pd⁰ (335.0 eV) became the dominant species, representing 78% of the surface Pd, while Pd²⁺ (337.4 eV) accounted for 22%. This confirms that hydrogen treatment effectively converts oxidized Pd species (Pd⁴⁺ and Pd²⁺) into metallic Pd⁰, thereby modulating the electronic state of palladium. Such modulation is expected to strongly influence catalytic behavior in hydrogenation reactions. Similarly, the reduced Pd/ZnO catalyst exhibited Pd 3d₅/₂ peaks at 335.1 eV and 337.3 eV, associated with Pd⁰ (92%) and Pd²⁺ (8%), respectively (Figure 5c). This suggests that the incorporation of pectin did not significantly affect the redox state of palladium after hydrogen treatment. In contrast, modification with copper led to notable changes in the Pd 3d spectral profile. The reduced PdCu(3:1)-Pec1.8/ZnO catalyst exhibited Pd 3d₅/₂ peaks at 334.8 eV and 336.9 eV, with Pd²⁺ becoming the predominant species (78%) and Pd⁰ contributing only 22% (Figure 5d). The shift in binding energies toward lower values, along with the altered Pd⁰/Pd²⁺ ratio compared to the monometallic Pd catalysts, is likely due to electronic interactions and charge transfer between Pd and Cu species [32].
The Cu 2p₃/₂ region of the XPS spectrum (Figure 5f) displays a main peak at ~933 eV with a full width at half maximum (FWHM) of 2.1 eV, which is characteristic of Cu⁺ in Cu₂O [33]. This suggests that Cu²⁺ species were effectively reduced to Cu⁺ during H₂ pretreatment, likely facilitated by hydrogen spillover or direct interaction with Pd⁰ species [34]. This observation supports the possible formation of Pd-Cu alloy compound.
Figure 5.
XPS spectra of Pd 3d for (a) untreated Pd-Pec1.8/ZnO, (b) reduced Pd-Pec1.8/ZnO, (c) reduced Pd/ZnO, and (d) reduced PdCu(3:1)-Pec1.8/ZnO; and Cu 2p for (f) reduced PdCu(3:1)-Pec1.8/ZnO.
Figure 5.
XPS spectra of Pd 3d for (a) untreated Pd-Pec1.8/ZnO, (b) reduced Pd-Pec1.8/ZnO, (c) reduced Pd/ZnO, and (d) reduced PdCu(3:1)-Pec1.8/ZnO; and Cu 2p for (f) reduced PdCu(3:1)-Pec1.8/ZnO.
2.2. Catalytic Properties of Pd and PdCu Catalysts in Hydrogenation Process
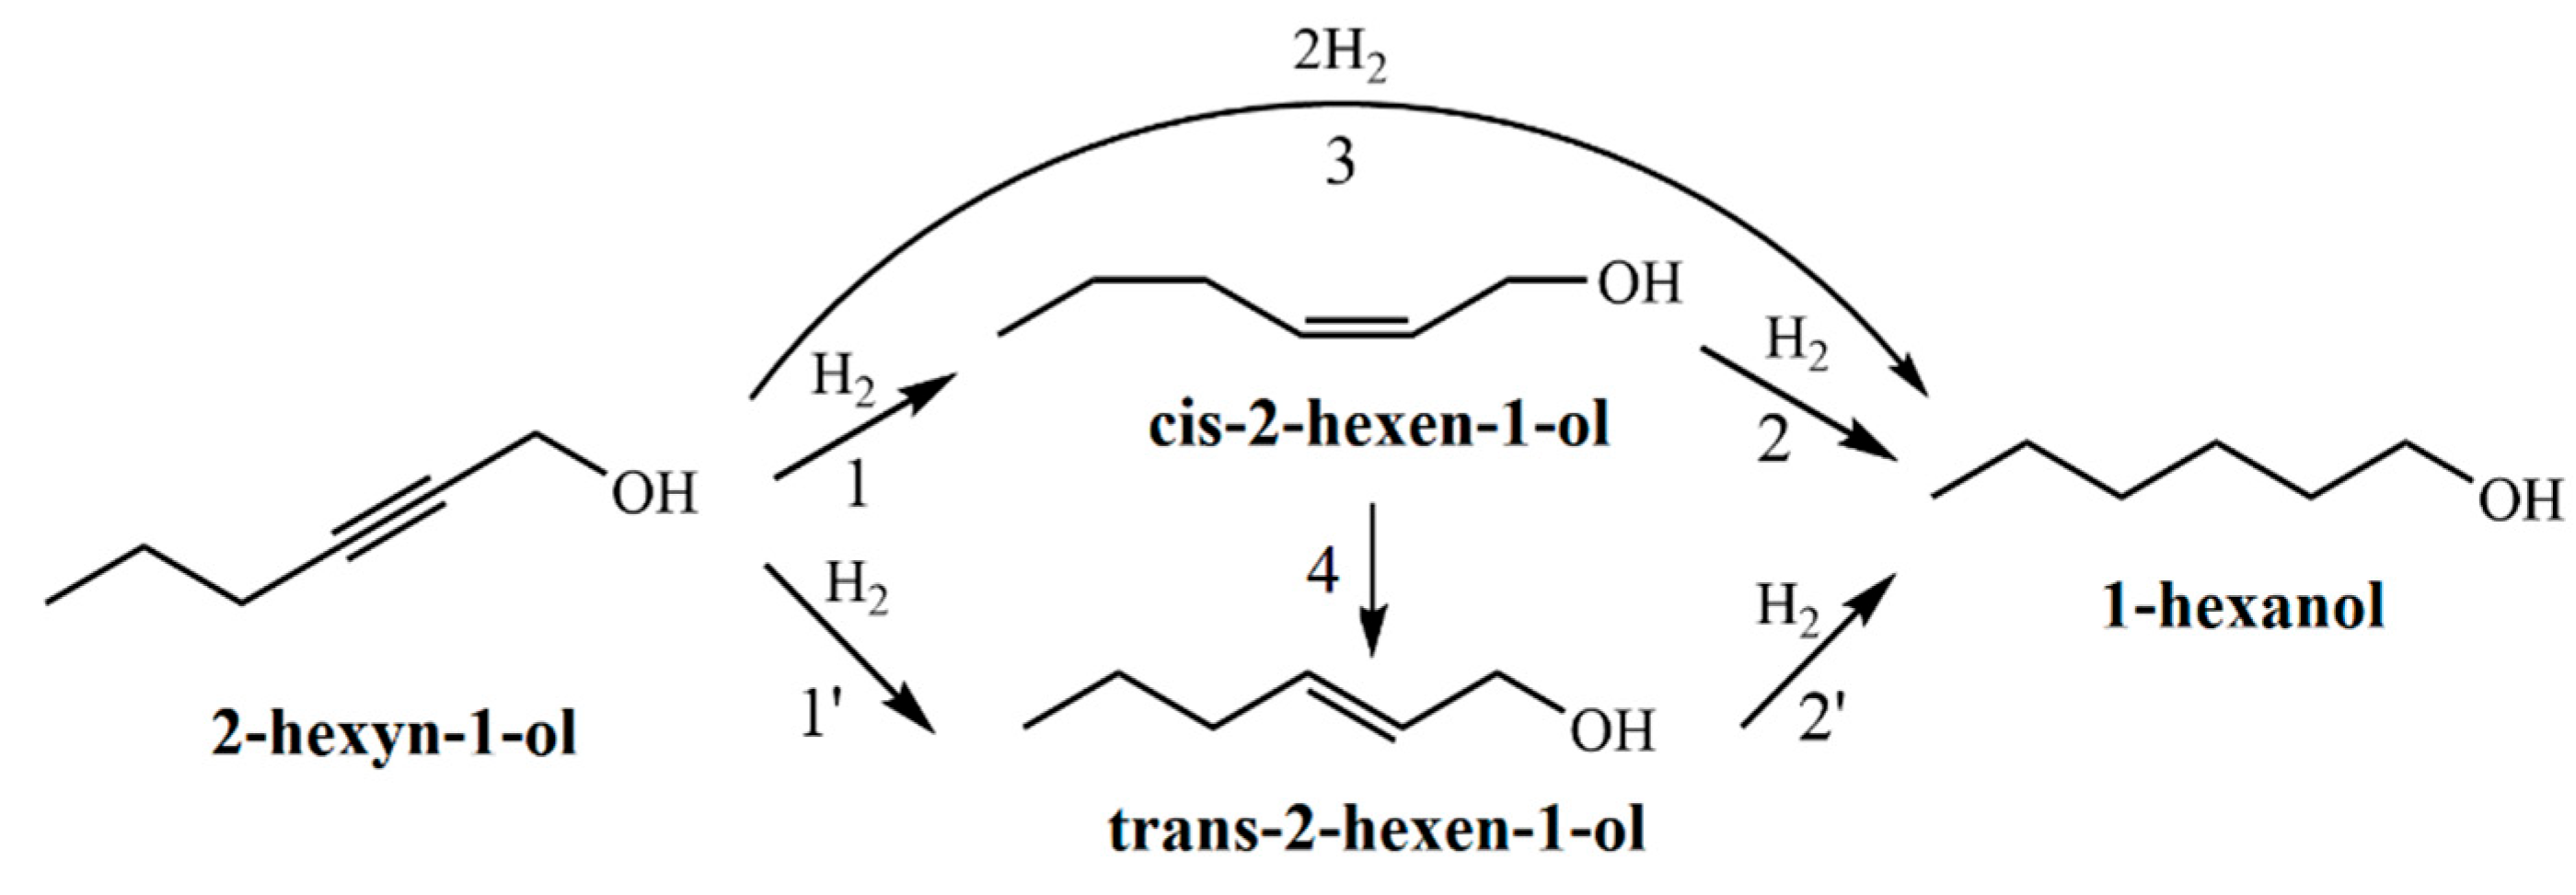
The hydrogenation of 2-hexyn-1-ol proceeds via a consecutive reaction pathway (Figure 6). In the first step, the triple C≡C bond of the acetylenic alcohol is selectively reduced to a double C=C bond, forming both cis- and trans- isomers of 2-hexen-1-ol (Figure 6, reactions 1 and 1′). These intermediates are further hydrogenated to 1-hexanol (Figure 6, reactions 2 and 2′). Additionally, direct hydrogenation of 2-hexyn-1-ol to 1-hexanol without accumulation of intermediates is also possible (Figure 6, reaction 3). It should also be noted that cis-2-hexen-1-ol may isomerize to its trans counterpart under the reaction conditions (Figure 6, reaction 4).
Figure 6.
Plausible reaction pathways for the hydrogenation of 2-hexyn-1-ol. 1 and 1′ – hydrogenation of the triple C≡C bond in 2-hexyn-1-ol to form cis-2-hexen-1-ol and trans-2-hexen-1-ol, respectively. 2 and 2′ – hydrogenation of the C=C bonds in cis-2-hexen-1-ol and trans-2-hexen-1-ol, respectively, yielding 1-hexanol. 3 – direct hydrogenation of the triple bond in 2-hexyn-1-ol to 1-hexanol. 4 – isomerization of cis-2-hexen-1-ol to trans-2-hexen-1-ol.
To investigate the catalytic performance in these transformations, two sets of catalysts were studied. In the first part, a series of monometallic Pd/ZnO catalysts with varying pectin content were examined to evaluate the effect of pectin modification on activity and selectivity. In the second part, the performance of the optimized monometallic catalyst was compared with bimetallic PdCu-Pec/ZnO catalysts, in which the Pd to Cu mass ratio was systematically varied to assess the influence of copper incorporation on the hydrogenation behavior.
The activity of the catalysts was evaluated by measuring the hydrogen uptake as a function of time. Based on the H₂ consumption data, the reaction rate was calculated. The selectivity of the process was determined by chromatographic analysis of reaction mixtures sampled at different time intervals.
Figure 7 shows the results of testing the monometallic Pd/ZnO catalysts in the hydrogenation of 2-hexyn-1-ol. Figure 7a presents the variation in H₂ uptake over time during the reaction. The Pd/ZnO and Pd-Pec/ZnO catalysts with lower pectin content demonstrated higher catalytic activity compared to Pd-Pec8.1/ZnO. The semi-hydrogenation point (50 mL of H₂ uptake) was reached after 8, 9, 10, and 20 minutes for Pd-Pec1.8/ZnO, Pd-Pec3.5/ZnO, Pd/ZnO, and Pd-Pec8.1/ZnO, respectively. These results suggest that modification with a small amount of pectin slightly improves the activity of the Pd/ZnO catalyst. However, a further increase in pectin content leads to a decrease in activity, most likely due to the steric hindrance caused by the excess polymer, which limits substrate access to the Pd active sites [35]. Figure 7b shows the hydrogenation rate (W), calculated from the H₂ uptake data. For all Pd-Pec/ZnO catalysts, the reaction rate increased during the first two minutes and remained nearly constant until the semi-hydrogenation point. Then, the rate increased again, reached a maximum, and subsequently dropped sharply. In contrast, the unmodified Pd/ZnO catalyst exhibited a slower and more gradual increase in reaction rate during the initial period up to the semi-hydrogenation point, without the sharp initial rise characteristic of the pectin-modified samples. This behavior can be attributed to a more uniform distribution of palladium particles on the support surface in the pectin-modified catalyst compared to the polymer-free system, as evidenced by the TEM data (Figure 4).
Figure 7.
Hydrogenation of 2-hexyn-1-ol on Pd/ZnO and Pd-Pec/ZnO catalysts: hydrogen uptake (a); change in
the rate of reaction (b); changes in the composition of the reaction mixture in presence of Pd-Pec/1.8ZnO (c); and
dependence of selectivity to cis-2-hexen-1-ol with the substrate conversion (d). Reaction conditions: 50 mg of
catalyst, 0.25 mL of 2-hexyn-1-ol, 25 mL of ethanol, at 40 °C and 0.1 MPa.
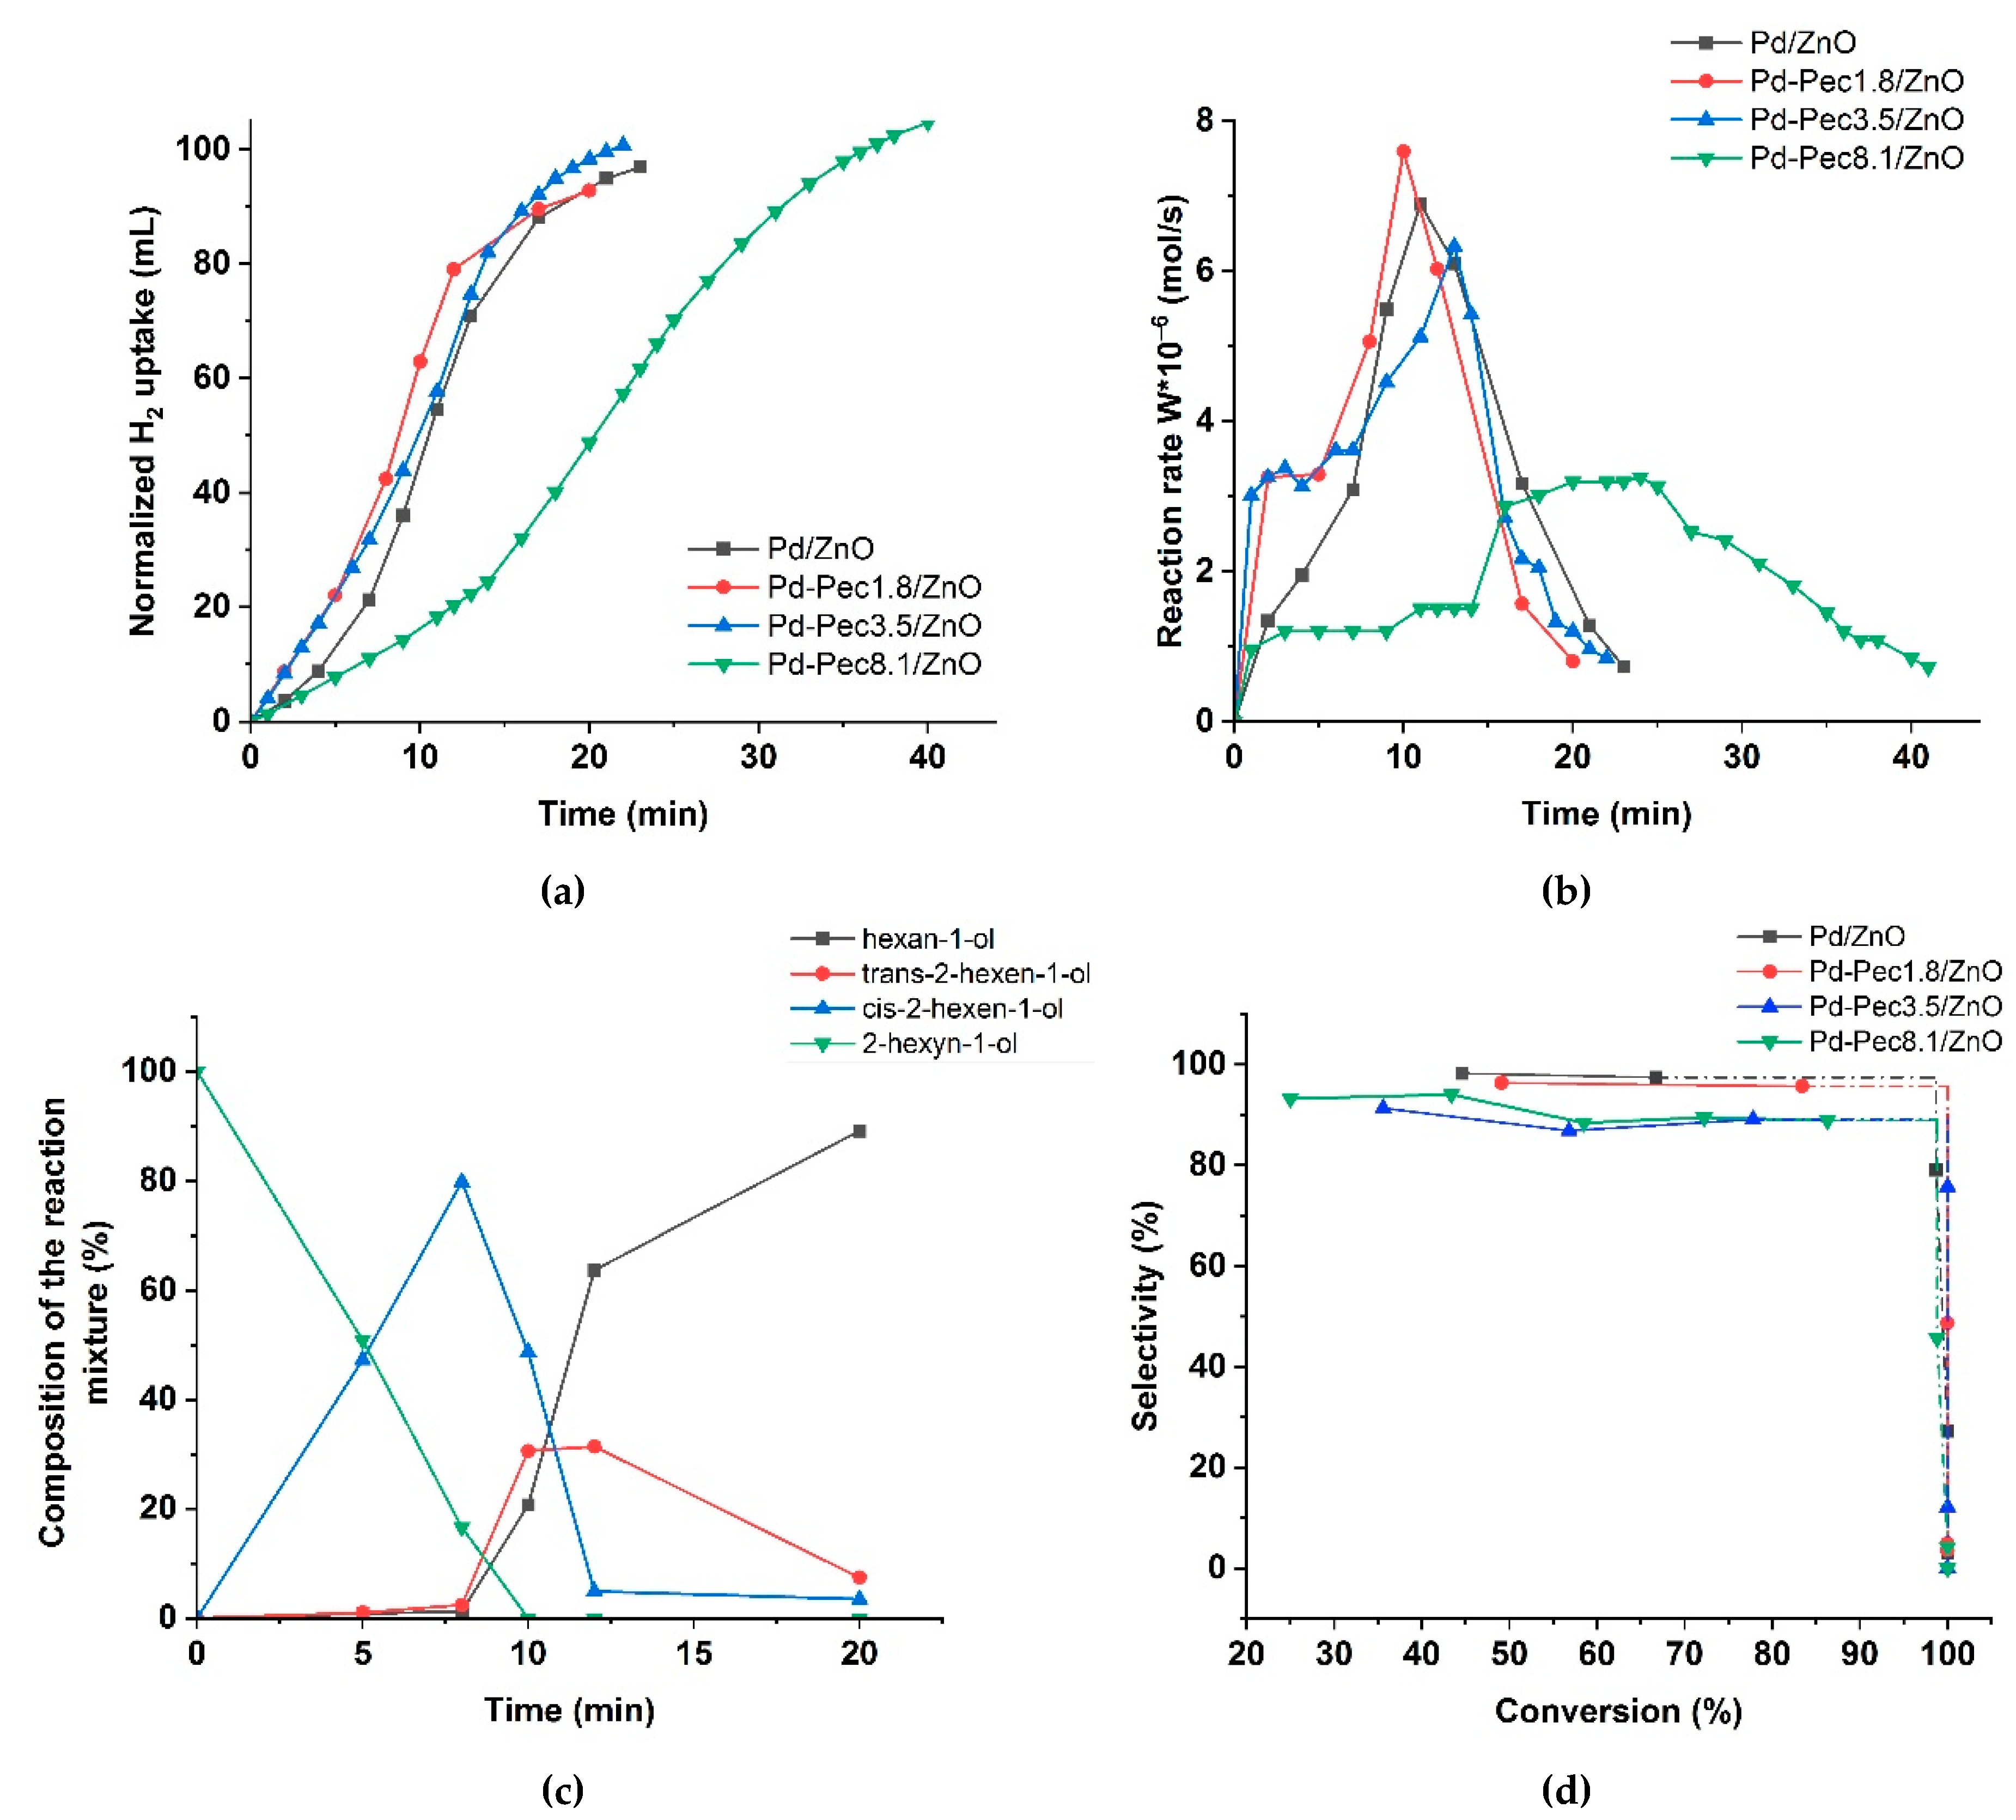
According to chromatographic analysis, cis-2-hexen-1-ol accumulated in the reaction medium over Pd-Pec1.8/ZnO during the initial period and was subsequently reduced to 1-hexanol (Figure 7c), which confirmed the occurrence of Paths 1 and 2 in Figure 6, respectively. The accumulation of cis-2-hexen-1-ol was accompanied by the formation of minor amounts of trans-2-hexen-1-ol and 1-hexanol, whose yields at the semi-hydrogenation point (8 min) were 2 % and 1 %, respectively, while the yield of cis-2-hexen-1-ol reached 80 %. The appearance of trans-2-hexen-1-ol and 1-hexanol before the semi-hydrogenation point confirmed the occurrence of Paths 1′ and 3 (Figure 6). After passing the semi-hydrogenation point, a portion of the accumulated cis-2-hexen-1-ol was also converted to trans-2-hexen-1-ol (Path 4), which was eventually reduced to 1-hexanol (Path 2′ in Figure 6). The composition of the reaction mixture changed similarly on the rest Pd/ZnO catalysts (Figure S1). The maximum cis-2-hexen-1-ol yields were determined to be 78 % at 11 min for Pd/ZnO, 76 % at 11 min for Pd-Pec3.5/ZnO, and 77 % at 20 min for Pd-Pec8.1/ZnO. These data confirmed that Pd-Pec/ZnO catalysts with lower pectin content (1.8 % and 3.5 wt) exhibited slightly higher activity than Pd/ZnO, whereas Pd-Pec8.1/ZnO demonstrated the lowest activity. The selectivity-versus-conversion curves (Figure 7d) showed that Pd/ZnO (97 %) and Pd-Pec1.8/ZnO (96 %) exhibited higher selectivity toward cis-2-hexen-1-ol compared to Pd-Pec3.5/ZnO (89 %) and Pd-Pec8.1/ZnO (89 %).
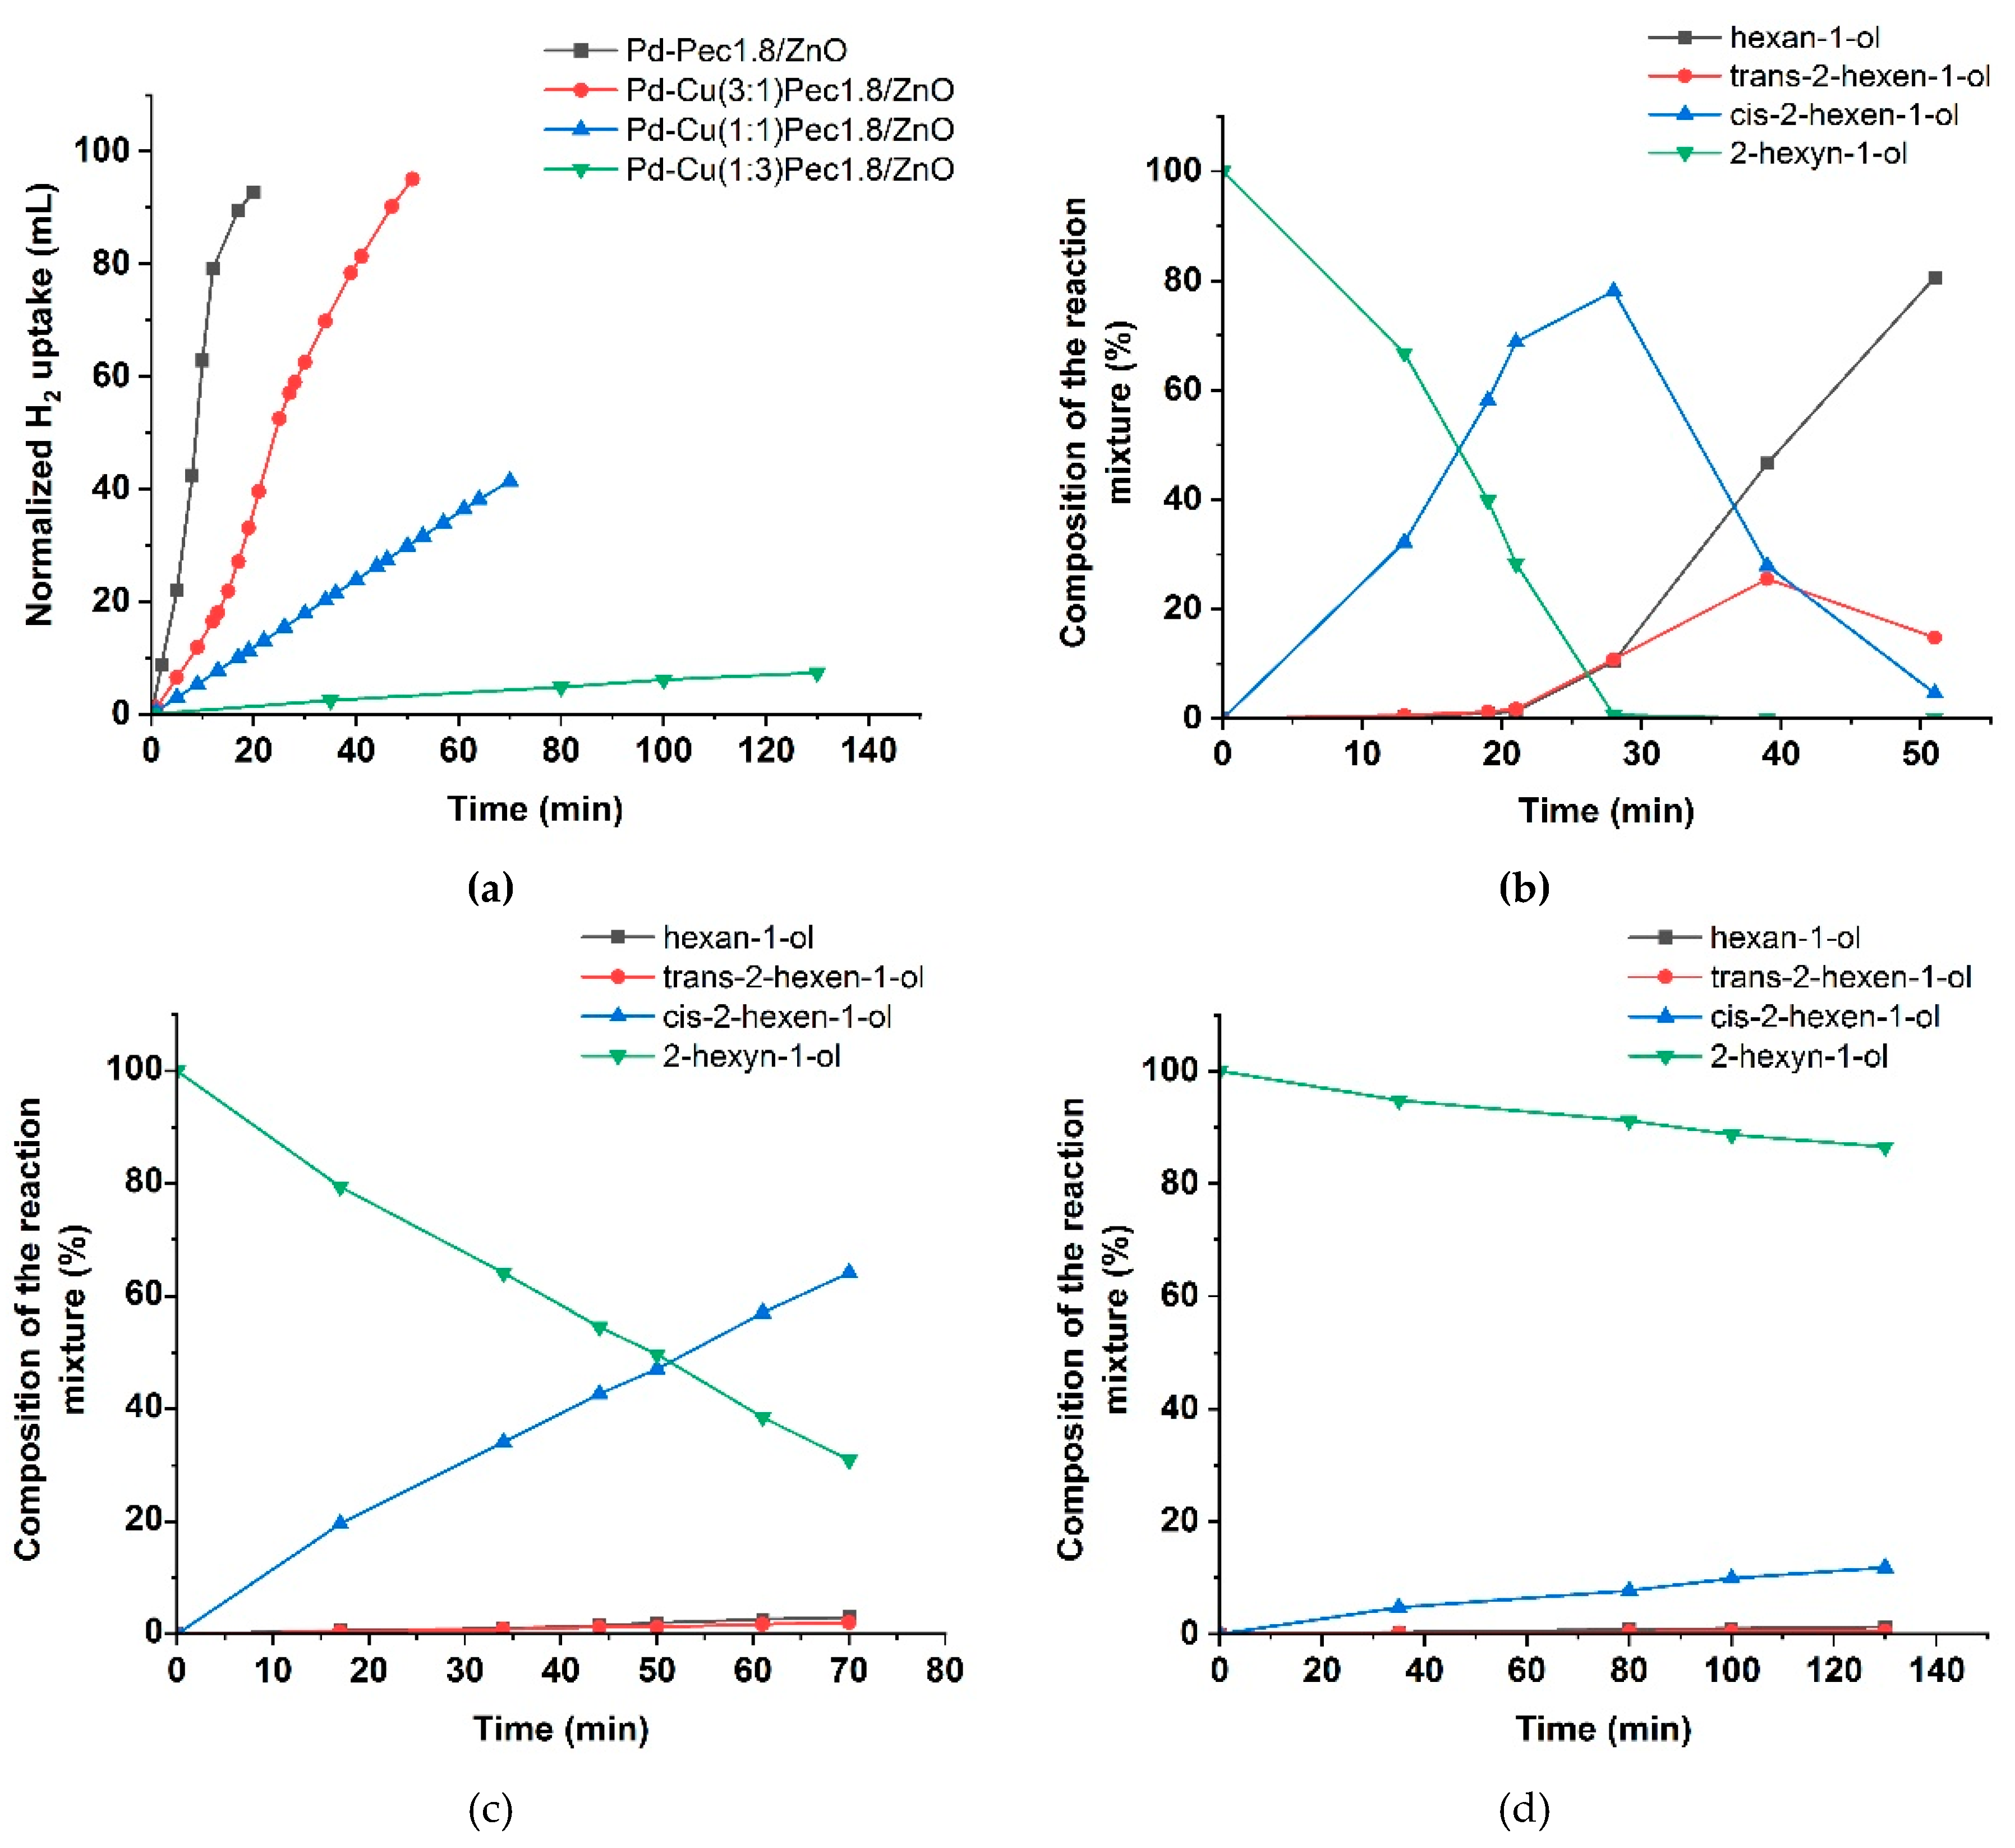
Figure 8 presented the results of testing the bimetallic PdCu-Pec1.8/ZnO catalysts. The modification with copper was shown to be significantly affected the activity of the optimized Pd-Pec1.8/ZnO catalyst. Compared to the monometallic Pd-Pec1.8/ZnO catalyst, which reached the semi-hydrogenation point in 8 minutes, the bimetallic PdCu(3:1)–Pec1.8/ZnO catalyst required a significantly longer time of 24 minutes under identical conditions. The other bimetallic catalysts exhibited negligible activity. Hydrogen uptake reached 41 mL for PdCu(1:1)-Pec1.8/ZnO (after 70 minutes) and 7 mL for PdCu(1:3)-Pec1.8/ZnO (after 130 minutes). This altered behavior can be explained by the effect of copper incorporation, which, according to the XPS data (Figure 5), suppressed the reduction of palladium to its metallic state, thereby reducing the proportion of Pd⁰ species relative to Pd²⁺. The composition of the reaction mixture over PdCu(3:1)-Pec1.8/ZnO changed similarly to that observed for the monometallic analogue, but at a slower rate. The maximum yield of cis-2-hexen-1-ol before reaching the semi-hydrogenation point (24 minutes) was 69% at 72% substrate conversion (data at 21 minutes), corresponding to 96% selectivity toward the target product (Figure 8b). The yield of cis-2-hexen-1-ol on PdCu(1:1)-Pec1.8/ZnO reached 64% at 69% substrate conversion (70 minutes) (Figure 8c), whereas for PdCu(1:3)-Pec1.8/ZnO, this value did not exceed 12% even after 130 minutes of reaction (Figure 8d).
Figure 8.
Hydrogenation of 2-hexyn-1-ol on PdCu-Pec1.8/ZnO catalysts: hydrogen uptake (a); changes in the
composition of the reaction mixture in presence of PdCu(3:1)-Pec1.8/ZnO (b), PdCu(1:1)-Pec1.8/ZnO (c) and
PdCu(1:3)-Pec1.8/ZnO (d). Reaction conditions: 50 mg of catalyst, 0.25 mL of 2-hexyn-1-ol, 25 mL of ethanol, at
40 °C and 0.1 MPa.
The hydrogenation rate and selectivity of the catalysts, calculated from hydrogen uptake and chromatographic analysis data, respectively, are summarized in Table 3.
Table 3.
A comparison of catalytic properties of Pd/ZnO, Pd-Pec/ZnO and PdCu-Pec1.8/ZnO catalysts in hydrogenation of 2-hexyn-1-ol.
Table 3.
A comparison of catalytic properties of Pd/ZnO, Pd-Pec/ZnO and PdCu-Pec1.8/ZnO catalysts in hydrogenation of 2-hexyn-1-ol.
| Catalyst | W × 10−6, mol/s | Selectivity to cis-2-hexen-1-ol, % | Conversion*, % | |
|---|---|---|---|---|
| C≡C | C=C | |||
| Pd/ZnO | 2.0 | 6.9 | 97 | 67 |
| Pd-Pec1.8/ZnO | 3.3 | 7.6 | 96 | 83 |
| Pd-Pec3.5/ZnO | 3.3 | 6.3 | 89 | 78 |
| Pd-Pec8.1/ZnO | 1.2 | 3.2 | 89 | 86 |
| PdCu(3:1)-Pec1.8/ZnO | 1.2 | 2.4 | 96 | 72 |
| PdCu(1:1)-Pec1.8/ZnO | 0.4 | - | 93 | 69 |
| Pd-Cu(1:3)-Pec1.8/ZnO | 0.1 | - | 87 | 13 |
| *— The value of the substrate conversion used for the calculation of selectivity of the catalysts. Reaction conditions: 50 mg of catalyst, 0.25 mL of 2-hexyn-1-ol, 25 mL of ethanol, at 40 °C and 0.1 MPa. | ||||
Modification with a minimal amount of pectin (1.8%) led to a slight improvement in the activity of the Pd/ZnO catalyst, while maintaining similarly high selectivity toward cis-2-hexen-1-ol. The increased activity can be attributed to the stabilizing effect of pectin, which promoted a more uniform distribution of palladium particles on the support surface. However, further increasing the pectin content to ~8% resulted in decreased activity and selectivity. This effect is likely due to steric hindrance restricting substrate access to the active sites caused by excess polymer. The addition of copper caused a significant decrease in catalyst activity, which is attributed to its influence on the state of the palladium active sites. At the same time, selectivity was not improved and even decreased for samples with higher copper content.
2.3. Perfomance of the Catalysts in Photocatalytic H2 Production
Before conducting photocatalytic H2 evolution experiments, the optical properties of Pd/ZnO, Pd-Pec1.8/ZnO and Pd-Cu(3:1)-Pec1.8/ZnO were evaluated using Ultraviolet–Visible diffuse reflectance spectroscopy (UV-vis DRS) method (Figure 9).
Figure 9.
UV-vis reflectance spectra (a) and Tauc plots (b) for Pd/ZnO, Pd-Pec1.8/ZnO and Pd-Cu(3:1)-Pec1.8/ZnO.
Figure 9.
UV-vis reflectance spectra (a) and Tauc plots (b) for Pd/ZnO, Pd-Pec1.8/ZnO and Pd-Cu(3:1)-Pec1.8/ZnO.
Figure 9a shows the UV–Vis diffuse reflectance spectra of the catalysts. Compared with the literature data for pristine ZnO, where the absorption edge is typically observed at ~380–400 nm [36], a noticeable red shift of the absorption edge to ~430–450 nm is observed for all palladium-containing samples. This shift may be attributed to the surface plasmon resonance (SPR) effect of metallic Pd nanoparticles, which extends the light absorption into the visible region [37]. The Pd/ZnO sample exhibits three distinct absorption bands (observed as reflectance minima) in the regions of approximately 400–500 nm, 500–600 nm, and 650–800 nm. These features likely originate from the superposition of interband transitions in ZnO, SPR of Pd, and possibly electronic transitions associated with palladium aggregates formed on the ZnO surface [37]. Interestingly, in the pectin-modified samples (Pd-Pec1.8/ZnO and PdCu(3:1)-Pec1.8/ZnO), the broad absorption band in the 650–800 nm region is absent. This disappearance is probably due to stabilization role of pectin, preventing aggregation of Pd nanoparticles on ZnO surface (Figure 4) and the formation of larger plasmon-active domains. Tauc plot analysis (Figure 9b) showed that the band gap values were 1.95, 1.99 and 2.06 eV for Pd/ZnO, PdCu(3:1)-Pec1.8/ZnO and Pd-Pec1.8/ZnO, respectively. All values are significantly lower than that of pristine ZnO (~3.37 eV) [37], confirming the strong modifying effect of metal nanoparticles and Pec component on the electronic structure of ZnO.
Despite having the widest band gap, Pd–Pec1.8/ZnO demonstrated the highest photocatalytic activity for hydrogen evolution under visible-light irradiation. Conversely, Pd/ZnO, with the narrowest band gap, was the least active, while the bimetallic Pd–Cu(3:1)–Pec1.8/ZnO sample showed intermediate performance. The total amount of hydrogen produced within 3 h was 74.7, 17.3, and 9.3 mL/gcat for Pd-Pec1.8/ZnO, PdCu(3:1)-Pec1.8/ZnO, and Pd/ZnO, respectively (Figure 10). Accordingly, the photocatalytic hydrogen evolution rate (PCHE) followed the order: Pd–Pec1.8/ZnO (1.11 mmol/h gcat) ≫ PdCu(3:1)–Pec1.8/ZnO (0.26 mmol/h gcat) > Pd/ZnO (0.14 mmol/h gcat).
Figure 10.
Photocatalytic H2 production efficiency of Pd/ZnO, Pd-Pec1.8/ZnO and Pd-Cu(3:1)-Pec1.8/ZnO. Reaction conditions: 70 mg of photocatalysts in 0.35 M Na2S and 0.25 M Na2SO3 aqueous solution, pH = 13, and light source—Xenon device (1000 W/m2).
Figure 10.
Photocatalytic H2 production efficiency of Pd/ZnO, Pd-Pec1.8/ZnO and Pd-Cu(3:1)-Pec1.8/ZnO. Reaction conditions: 70 mg of photocatalysts in 0.35 M Na2S and 0.25 M Na2SO3 aqueous solution, pH = 13, and light source—Xenon device (1000 W/m2).
Pd–Pec1.8/ZnO and PdCu(3:1)–Pec1.8/ZnO demonstrated higher photocatalytic performance compared to Pd/ZnO. According to TEM studies (Figure 4), in both pectin-modified samples metal nanoparticles (Pd and Cu) with an average size of ~4 nm were uniformly dispersed over the ZnO surface. In contrast, for Pd/ZnO, Pd nanoparticles (~4–5 nm) tended to form larger aggregates with sizes up to 10–30 nm. This clearly indicates that the catalysts’ performance is primarily governed by their morphological and structural characteristics, rather than by differences in band gap values.
However, between the two pectin-modified samples, Pd–Pec1.8/ZnO exhibited superior activity compared to PdCu(3:1)–Pec1.8/ZnO, despite having a similar nanoparticle size and dispersion. XPS analysis provides insight into this difference (Figure 5). After H₂ treatment, both catalysts contained Pd⁰ species, which are known to act as efficient electron traps [38]. In Pd–Pec1.8/ZnO, metallic Pd⁰ was the dominant species (~78%), while in PdCu(3:1)–Pec1.8/ZnO, the proportion of Pd⁰ was significantly lower (~22%). In the latter, Cu was detected as Cu⁺ (Cu₂O), indicating strong electronic interactions between Pd and Cu. These interactions result in a more “oxidized” Pd surface, which likely reduces the density of metallic electron traps and suppresses Pd⁰-mediated catalysis. This explains the lower photocatalytic activity of the bimetallic sample, despite the potential electron-mediating role of Cu⁺.
In summary, the superior activity of Pd–Pec1.8/ZnO can be attributed to: (i) enhanced light absorption in the visible region, likely resulting from the plasmonic effect of Pd nanoparticles; (ii) more uniform dispersion of Pd nanoparticles, leading to improved charge separation and efficient utilization of active sites; (iii) absence of Pd–Cu interactions, which in the bimetallic sample hinder the reduction of Pd²⁺ to catalytically active Pd⁰, thereby limiting the formation of effective electron traps.
3. Materials and Methods
3.1. Chemicals and Materials
Zinc oxide (ZnO, pure grade), pectin (Pec, from apple, 50-75% esterification, Sigma-Aldrich, St. Louis, MO, USA), palladium (II) nitrate dihydrate (Pd(NO3)2*2H2O, 40% Pd basis, Sigma-Aldrich, St. Louis, MO, USA), сopper (II) nitrate trihydrate (Cu(NO3)2*3H2O, 99.5%, Sigma-Aldrich, St. Louis, MO, USA), ethanol (96.3%, Talgar Alcohol LLP, Talgar, Kazakhstan) were used without additional purification. The purity of 2-hexyn-1-ol (97%, Sigma-Aldrich, St. Louis, MO, USA) was confirmed by gas chromatography.
3.2. Synthesis of Pd-Polysaccharide/ZnO Catalysts
Monometallic Pd-Pec/ZnO catalysts were prepared by sequential adsorption of the polymer and palladium ions on zinc oxide as follows. A 10 mL of 0.01-0.05 M pectin solution (0.0185-0.0925 g of Pec in 10 mL of water) was added dropwise to the aqueous suspension of zinc oxide (1 g in 15 mL of water) under continuous stirring for 2 h. Then, a 5 mL of ~0.02 M Pd(NO3)2 aqueous solution was added dropwise, and the resulting mixture and stirred for 3 h. Further, the resulting catalyst was kept in the mother liquor for 12–15 h, washed with distilled water and dried in air. The completeness of palladium immobilization was controlled by photoelectric colorimetry method on a SF-2000 UV/Vis spectrophotometer (OKB Spectr, Saint Petersburg, Russia) using calibration curves at a wavelength of λ = 271 nm. The amount of added palladium salt and pectin was calculated to obtain Pd-Pec/ZnO catalysts with Pd content of 1 wt.% and Pd to the polymer molar ratios of 1:1, 1:2 and 1:5. For comparison, similar unmodified Pd/ZnO catalyst was prepared using the same procedure except that the polymer was added.
3.3. Synthesis of PdCu-Pec/ZnO Catalysts
Bimetallic PdCu-Pec/ZnO catalysts were prepared using the same procedure as the monometallic palladium catalysts. Briefly, a 10 mL of 0.01 M pectin solution was added dropwise to the aqueous suspension of the ZnO (1 g in 15 mL of water). Afterward, metal ions were immobilized by successively adding 5 mL of Cu(NO3)2 and 5 mL of Pd(NO3)2 solutions to Pec/ZnO suspension. The concentrations of Pd(NO3)2 and Cu(NO3)2 solutions were varied within the range of 4.7·10-3 - 1.4·10-2 M and 7.9·10-3 - 2.4·10-2 M, respectively, to obtain 1% PdCu-Pec/ZnO catalysts with Pd:Cu molar ratios of 3:1, 1:1 and 1:3. The completeness of palladium and copper fixation was monitored by photoelectric colorimetry method. The copper salt solutions were analyzed in form of copper-ammonia complex at a wavelength of λ = 620 nm.
3.4. Characterization of the Composites and Catalysts
Powder X-ray diffraction (XRD) patterns were obtained with a DRON-4-0.7 X-ray diffractometer (Bourevestnik, Saint Petersburg, Russia) using cobalt-monochromatized Co Kα radiation (λ = 0.179 nm). Ultraviolet-visible diffuse reflectance spectra were recorded by a T92+ UV-Vis spectrophotometer (PG instruments, Wibtoft, UK). The spectra were measured against BaSO4 at a wavelength range of 240–950 nm. The obtained diffuse reflectance data were converted to absorbance spectra using the Kubelka–Munk function. Band gap energies (Eg) were evaluated by Tauc plots of [F(R∞) E]1/2 versus photon energy E, where R∞ = RSample/RBaSO4. Thermogravimetric analysis (TGA) of the catalyst was carried out in a nitrogen atmosphere (50 mL/min) at temperature range of 30-600 °C, using a STA 449F5 analyzer (Netzsch, Selb, Germany) at a heating rate of 20 °C per minute. The elemental analysis was carried out using a JSM-6610LV (Jeol, Tokyo, Japan) scanning electron microscope with an EDX detector. Fourier transform infrared (FTIR) spectra of catalysts samples were obtained using a Nicolet iS5 (Thermo Scientific, USA) in the 4000-500 cm-1 region. Pellets for infrared analysis were obtained by grinding a mixture of a 1 mg sample with 100 mg dry KBr, followed by pressing the mixture into a mold. X-ray photoelectron spectra (XPS) of catalysts were recorded on an ESCALAB 250Xi X-ray and Ultraviolet Photoelectron spectrometer (Thermo Fisher Scientific, Waltham, MA, USA) with AlKα radiation (photon energy 1486.6 eV). Spectra were recorded in the constant pass energy mode at 50 eV for a survey spectrum and 20 eV for an element core level spectrum, using an XPS spot size of 650 μm. The total energy resolution of the experiment was about 0.3 eV. Investigations were carried out at room temperature in an ultrahigh vacuum of the order of 1 × 10⁻⁹ mbar. An ion-electronic charge compensation system was used to neutralize the sample charge. Transmission electron microscopy (TEM) micrographs and elemental mapping images were obtained on a Zeiss Libra 200FE transmission electron microscope (Carl Zeiss, Oberkochen, Germany) with an accelerating voltage of 100 kV.
3.5. Hydrogenation of 2-hexyn-1-ol
The process was carried out in a thermostatically controlled long-necked glass flask reactor in an ethanol solution (25 mL) at 40 °C and atmospheric pressure of hydrogen, with intensive stirring (600–700 rounds per minute). A catalyst (50 mg) was pre-treated with hydrogen directly in the reactor at 40 °C for 30 min, and then, 2-hexyn-1-ol was introduced in the reaction medium to perform the reaction. The substrate amount (0.25 mL) was taken based on the uptake of 100 mL of hydrogen. The reaction rate was calculated as the hydrogen consumption per unit of time. The amount of hydrogen uptake was determined by measuring the H2 volume in a gas storage burette connected to the reactor. The reaction products were analyzed by gas chromatography on a Chromos GC-1000 chromatograph (Chromos, Russia) with a flame ionization detector using a BP21 (FFAP) capillary column with a polar phase (PEG-modified with nitroterephthalate) of 50 m in length and a 0.32 mm inside diameter. The selectivity of the catalyst was calculated as the ratio of the target product to the sum of all reaction products at a fixed conversion.
3.6. Photocatalytic H2 Evolution Experiments
Photocatalytic hydrogen production reactions took place in a homemade quartz reactor. An Asahi Spectra MAX-303 Xenon device was used as a light source during the photocatalytic hydrogen production measurements. The light source was adjusted to 1000 W/m2 via a light meter (HD 2302.0) in a manner that the source lighted an area of 3.5 × 3.5 cm of the base of the reactor in which the photocatalyst was fully located. Before the photocatalytic hydrogen production tests, the photocatalyst particles (70 mg) were suspended in aqueous solution of a 0.35 M Na2S and 0.25 M Na2SO3 mixture (pH = 13) of sacrificial reagent and allowed to settle down for 15 h. Just after the light irradiation, H2 generation took place and the qualitative and quantitative characterization of the produced H2 was performed by connecting the photocatalytic reactor directly to Agilent 6890 GC gas chromatograph (Agilent, Santa Clara, CA, USA).
4. Conclusion
This work is aimed at studying the effect of incorporation of pectin and copper into Pd/ZnO catalysts on their catalytic properties in liquid-phase hydrogenation of 2-hexyn-1-ol and photocatalytic hydrogen evolution. To this end, a series of monometallic Pd/ZnO catalysts with varying pectin content (0 wt%, 1.8 wt%, 3.5 wt%, and 8.1 wt%) as well as bimetallic PdCu-Pec1.8/ZnO catalysts with different Pd to Cu mass ratios (3:1, 1:1, 1:3) were successfully synthesized via sequential adsorption of the polymer and metal ions on ZnO, followed by comprehensive physicochemical characterization of the resulting catalysts. Modification of Pd/ZnO with a small amount of pectin (1.8 wt%) resulted in a slight increase in catalytic activity during hydrogenation, while maintaining high selectivity toward cis-2-hexen-1-ol (96–97%). This enhancement is attributed to a more uniform distribution of Pd nanoparticles facilitated by the polymer. However, further increases in pectin content led to a decline in both activity and selectivity, likely due to steric hindrance imposed by excess polymer, which limited substrate access to the active sites. In contrast, the introduction of copper into Pd-Pec1.8/ZnO catalysts resulted in a significant decrease in both activity and selectivity. This effect was more pronounced with increasing Cu content and is explained by suppression of Pd reduction ability due to Pd–Cu interactions, as confirmed by XPS analysis. The reduced proportion of metallic Pd likely compromised catalytic performance.
In photocatalytic hydrogen evolution, Pd-Pec1.8/ZnO outperformed both unmodified Pd/ZnO and bimetallic PdCu(3:1)-Pec1.8/ZnO, indicating a strong promoting effect of pectin modification. The observed trend in photocatalytic activity (Pd-Pec1.8/ZnO >> PdCu(3:1)-Pec1.8/ZnO > Pd/ZnO), suggesting that pectin modification can influence the electronic structure and the number of the active site of the catalyst. The results confirm that while pectin can positively affect Pd dispersion and catalytic performance, co-introduction of copper may have a detrimental effect due to unfavorable electronic interactions between Pd and Cu species.
Overall, the study confirms that ZnO is an excellent support for palladium catalysts in hydrogenation reactions. While Pd/ZnO itself is already an effective catalyst, its performance can be further enhanced by modification with pectin, which improves the dispersion of Pd nanoparticles and increases catalytic efficiency in both liquid-phase hydrogenation and photocatalytic hydrogen evolution. The Pd-Pec1.8/ZnO catalyst demonstrates true bifunctional activity and holds promise for effective application in these two distinct processes. This work highlights the potential of polymer-modified Pd/ZnO systems and underscores the importance of precise control over catalyst composition to optimize performance.
Supplementary Materials
The following supporting information can be downloaded at the website of this paper posted on Preprints.org, Figure S1: Changes in the composition of the reaction mixture during hydrogenation of 2-hexyn-1-ol on Pd/ZnO (a), Pd Pec3.5/ZnO (b), and Pd Pec8.1/ZnO (c).
Author Contributions
Conceptualization, A.K.Z.; methodology, A.K.Z., E.T.T., A.K. and Z.K.M.; validation, A.I.J., A.M.K., and Z.K.M..; formal analysis, A.M.K., A.T.Z. and Z.K.M.; investigation, A.I.J., A.M.K., A.T.Z., and Z.K.M; resources, A.K.Z., and A.K.; data curation, A.M.K., and Z.K.M.; writing—original draft preparation, A.M.K., E.T.T., A.T.Z., Z.K.M. and A.S.A.; writing—review and editing, A.K.Z., E.T.T. and A.K.; visualization, Z.K.M., and A.M.K.; supervision, A.K.Z., ; project administration, A.K.Z., A.T.Z., E.T.T.; funding acquisition, A.K.Z. All authors have read and agreed to the published version of the manuscript. .
Funding
This research was funded by the Science Committee of the Ministry of Science and Higher Education of the Republic of Kazakhstan (Grant No. AP19678287).
Data Availability Statement
The data that support the findings of this study are available from the corresponding author upon reasonable request.
Acknowledgments
The XRD: IRS, and EDX studies were carried out on the equipment of the Laboratory of Physical Research Methods of D.V. Sokolskiy Institute of Fuel, Catalysis, and Electrochemistry. UV–vis diffuse reflectance measurements and photocatalytic H2 evolution experiments were performed on the equipment of Marmara University. The XPS studies were performed on the equipment of the Resource Center “Physical Methods of Surface Investigation” of the Research Park of St. Peters- burg University. TEM studies were performed on the equipment of the Interdisciplinary Resource Center for Nanotechnology of the Research Park of St. Petersburg University. TGA was carried out on the equipment of the Department of General and Inorganic Chemistry of Al-Farabi Kazakh National University.
Conflicts of Interest
The authors declare no conflicts of interest.
References
- Zhang, L.; Zhou, M.; Wang, A.; Zhang, T. Selective Hydrogenation over Supported Metal Catalysts: From Nanoparticles to Single Atoms. Chem. Rev. 2020, 120, 683–733. [Google Scholar] [CrossRef]
- Zhao, X.; Chang, Y.; Chen, W.-J.; Wu, Q.; Pan, X.; Chen, K.; Weng, B. Recent Progress in Pd-Based Nanocatalysts for Selective Hydrogenation. ACS Omega 2022, 7, 17–31. [Google Scholar] [CrossRef]
- Xiao, C.; Chuang, S.; Changhai, L. Highly selective catalysts for the hydrogenation of alkynols: A review. Chinese Journal of Catalysis 2021, 42, 2105–2121. [Google Scholar] [CrossRef]
- Brito, V.D.; Achimón, F.; Dambolena, J.S.; Pizzolitto, R.P.; Zygadlo, J.A. Trans-2-hexen-1-ol as a tool for the control of Fusarium verticillioides in stored maize grains. Journal of Stored Products 2019, 82, 123–130. [Google Scholar] [CrossRef]
- Zhang, J.; Hu, W.; Qian, B.; Li, H.; Sudduth, B.; Engelhard, M.; Zhang, L.; Hu, J.; Sun, J.; Zhang, C.; He, H.; Wang, Y. Tuning hydrogenation chemistry of Pd-based heterogeneous catalysts by introducing homogeneous-like ligands. Nature Communications 2023, 14, 3944. [Google Scholar] [CrossRef] [PubMed]
- Chen, X.; Shi, C.; Wang, X.-B.; Li, W.-Y.; Liang, C. Intermetallic PdZn nanoparticles catalyze the continuous-flow hydrogenation of alkynols to cis-enols. Commun. Chem. 2021, 4, 175. [Google Scholar] [CrossRef] [PubMed]
- Gholinejad, M.; Khosravi, F.; Afrasi, M.; Sansano, J.M.; Nájera, C. Applications of bimetallic PdCu catalysts. Catal. Sci. Technol. 2021, 11, 2652–2702. [Google Scholar] [CrossRef]
- Li, J.; Suo, W.; Huang, Y.; Chen, M.; Ma, H.; Liu, C.; Zhang, H.; Liang, K.; Dong, Z. Mesoporous α-Al2O3-supported PdCu bimetallic nanoparticle catalyst for the selective semi-hydrogenation of alkynes. Journal of Colloid and Interface Science 2023, 652, 1053–1062. [Google Scholar] [CrossRef]
- Xu, J.; Guo, X.; Guan, Y.; Wu, P. Influence of Pd deposition pH value on the performance of Pd-CuO/SiO2 catalyst for semi-hydrogenation of 2-methyl-3-butyn-2-ol (MBY). Chinese Chemical Letters 2022, 33, 349–353. [Google Scholar] [CrossRef]
- Oberhauser, W.; Frediani, M.; Dehcheshmeh, I.M.; Evangelisti, C.; Poggini, L.; Capozzoli, L.; Moghadam, P.N. Selective Alkyne Semi-Hydrogenation by PdCu Nanoparticles Immobilized on Stereocomplexed Poly(lactic acid). Chem.Cat.Chem. 2022, 14, 1–9. [Google Scholar] [CrossRef]
- Lu, L.; Zou, S.; Fang, B. The Critical Impacts of Ligands on Heterogeneous Nanocatalysis: A Review. ACS Catalysis 2021, 11(10), 6020–6058. [Google Scholar] [CrossRef]
- Razzaque, S.; Hussain, S.Z.; Hussain, I.; Tan, B. Design and Utility of Metal/Metal Oxide Nanoparticles Mediated by Thioether End-Functionalized Polymeric Ligands. Polymers 2016, 8, 156. [Google Scholar] [CrossRef]
- Jin, L.; Liu, B.; Duay, S. S.; He, J. Engineering Surface Ligands of Noble Metal Nanocatalysts in Tuning the Product Selectivity. Catalysts 2017, 7, 44. [Google Scholar] [CrossRef]
- Akhmetova, S.; Zharmagambetova, A.; Talgatov, E.; Auyezkhanova, A.; Malgazhdarova, M.; Zhurinov, M.; Abilmagzhanov, A.; Jumekeyeva, A.; Kenzheyeva, A. How the Chemical Properties of Polysaccharides Make It Possible to Design Various Types of Organic–Inorganic Composites for Catalytic Applications. Molecules 2024, 29, 3214. [Google Scholar] [CrossRef] [PubMed]
- Zharmagambetova, A.K.; Talgatov, E.T.; Auyezkhanova, A.S.; Bukharbayeva, F.U.; Jumekeyeva, A.I. Polysaccharide-Stabilized PdAg Nanocatalysts for Hydrogenation of 2-Hexyn-1-ol. Catalysts 2023, 13, 1403. [Google Scholar] [CrossRef]
- Dagareh, M.I.; Hafeez, H.Y.; Mohammed, J.; Kafadi, A.D.G.; Suleiman, A.B.; Ndikilar, C.E. Current trends and future perspectives on ZnO-based materials for robust and stable solar fuel (H2) generation. Chemical Physics Impact 2024, 9, 100774. [Google Scholar] [CrossRef]
- Bakranova, D.; Nagel, D. ZnO for Photoelectrochemical Hydrogen Generation. Clean Technol. 2023, 5, 1248–1268. [Google Scholar] [CrossRef]
- Park, J.S.; Kim, B.J.; Seo, B.G.; Han, G.D.; Park, K.-H.; Koo, J.; Park, H.-D.; Shim, J.H. Hetero-structured palladium-coated zinc oxide photocatalysts for sustainable water treatment. Journal of Water Process Engineering 2022, 45, 102488. [Google Scholar] [CrossRef]
- Manzoor, M.F.; Ahmed, E.; Ahmad, M.; Ahmad, I.; Rana, A.M.; Ali, A.; Ghouri, M.I.; Manzoor, M.S.; Aziz, M.T. Enhanced photocatalytic activity of hydrogen evolution through Cu incorporated ZnO nano composites. Materials Science in Semiconductor Processing 2020, 120, 105278. [Google Scholar] [CrossRef]
- Zharmagambetova, A.K.; Talgatov, E.T.; Auyezkhanova, A.S.; Tumabayev, N.Z.; Bukharbayeva, F.U. Effect of polyvinylpyrrolidone on the catalytic properties of Pd/γ-Fe2O3 in phenylacetylene hydrogenation. Reaction Kinetics, Mechanisms and Catalysis 2020, 131, 153–166. [Google Scholar] [CrossRef]
- Sumathra, M.; Govindaraj, D.; Jeyaraj, M.; Arfaj, A.A.; Munusamy, M.A.; Kumar, S.S.; Rajan, M. Sustainable pectin fascinating hydroxyapatite nanocomposite scaffolds to enhance tissue regeneration. Sustainable Chemistry and Pharmacy 2017, 5, 46–53. [Google Scholar] [CrossRef]
- Thompson, J.M. Infrared Spectroscopy, 1st еd.; Jenny Stanford: New York, USA, 2018. [Google Scholar] [CrossRef]
- Urias-Orona, V.; Rascón-Chu, A.; Lizardi-Mendoza, J.; Carvajal-Millán, E.; Gardea, A.A.; Ramírez-Wong, B. A Novel Pectin Material: Extraction, Characterization and Gelling Properties. Int. J. Mol. Sci. 2010, 11, 3686–3695. [Google Scholar] [CrossRef] [PubMed]
- Shi, L.; Gunasekaran, S. Preparation of Pectin–ZnO Nanocomposite. Nanoscale Res. Lett. 2008, 3, 491–495. [Google Scholar] [CrossRef] [PubMed]
- Danková, Z.; Mockovčiaková, A.; Dolinská, S. Influence of ultrasound irradiation on cadmium cations adsorption by montmorillonite. Desalination and Water Treatment 2014, 52, 5462–5469. [Google Scholar] [CrossRef]
- Wagner, M.; Pigliapochi, R.; Tullio, V.D.; Catalano, J.; Zumbulyadis, N.; Centeno, S.A.; Wang, X.; Chen, K.; Hung, I.; Gan, Z.; Dworzak, M.R.; Yap, G.P.A.; Dybowski, C. Multi-technique structural analysis of zinc carboxylates (soaps). Dalton Trans. 2023, 52, 6152–6165. [Google Scholar] [CrossRef]
- Devi, P.G.; Velu, A.S. Synthesis, structural and optical properties of pure ZnO and Co doped ZnO nanoparticles prepared by the co-precipitation method. J. Theor. Appl. Phys. 2023, 10, 233–240. [Google Scholar] [CrossRef]
- Collins, G.; O’Dwyer, C.; Holmes, J.D. Colloidal Palladium Nanoparticles versus Commercial Palladium Catalysts for Suzuki Cross Coupling reactions – The Influence of Surface Functionalization. NSTI: Advanced Materials - TechConnect Briefs 2015, 2, 79–82. [Google Scholar]
- Sarac, B.; Karazehir, T.; Yüce, E.; Mühlbacher, M.; Sarac, A.S.; Eckert, J. Porosity and thickness effect of Pd–Cu–Si metallic glasses on electrocatalytic hydrogen production and storage. Materials & Design 2021, 210, 110099. [Google Scholar] [CrossRef]
- Sasaki, H.; Sakamoto, K.; Mori, M.; Sakamoto, T. Synthesis of Ce1−xPdxO2−δ Solid Solution in Molten Nitrate. Catalysts 2020, 10, 640. [Google Scholar] [CrossRef]
- Talgatov, E.T.; Naizabayev, A.A.; Bukharbayeva, F.U.; Kenzheyeva, A.M.; Yersaiyn, R.; Auyezkhanova, A.S.; Akhmetova, S.N.; Zhizhin, E.V.; Brodskiy, A.R. Pd Catalysts Supported on Mixed Iron and Titanium Oxides in Phenylacetylene Hydrogenation: Effect of TiO2 Content in Magnetic Support Material. Nanomaterials 2024, 14, 1392. [Google Scholar] [CrossRef]
- Du, Z.-Y.; Wang, K.; Xie, Y.-M.; Zhao, Y.; Qian, Zh.-X.; Li, S.-B.; Zheng, Q.-N.; Tian, J.-H.; Rudnev, A. V.; Zhang, Y.-J.; Zhang, H.; Li, J.-F. In situ Raman reveals the critical role of Pd in electrocatalytic CO2 reduction to CH4 on Cu-based catalysts Free. J. Chem. Phys. 2024, 161, 021101. [Google Scholar] [CrossRef]
- Ghodselahi, T.; Vesaghi, M.A.; Shafiekhani, A.; Baghizadeh, A.; Lameii, M. XPS study of the Cu@Cu2O core-shell nanoparticles. Applied Surface Science 2008, 255, 2730–2734. [Google Scholar] [CrossRef]
- Mierczyński, P.; Mierczyńska-Vasilev, A.; Maniukiewicz, W.; Vasilev, K.; Szynkowska-Jóźwik, M. Novel Cu and Pd-Cu Catalysts Supported on Multi-Walled Carbon Nanotubes for Steam Reforming and Decomposition of Methanol. Catalysts 2023, 13, 533. [Google Scholar] [CrossRef]
- Raksha, C.H.; Yogeesh, M.P.; Shetty, N.S. Recent advances in the synthesis of polymer supported catalysts: a review. Discover Applied Sciences 2025, 7, 565. [Google Scholar] [CrossRef]
- Lu, Y.; Lin, Wang, D.; Wang, L.; Xie, T.; Jiang, T.A high performance cobalt-doped ZnO visible light photocatalyst and its photogenerated charge transfer properties. Nano Research 2011, 4, 1144–1152. [CrossRef]
- Mbrouk, O.A.; Fawzy, M.; Elshafey, H.M.; Saif, M.; Hafez, H.; Mottaleb, M.S.A.A. Green synthesized plasmonic Pd–ZnO nanomaterials for visible light-induced photobiogas production from industrial wastewater. Appl Organomet Chem. 2022, 36, 6807. [Google Scholar] [CrossRef]
- Li, B.; Wang, R.; Shao, X.; Shao, L.; Zhang, B. Synergistically enhanced photocatalysis from plasmonics and a co-catalyst in Au@ZnO–Pd ternary core–shell nanostructures. Inorg. Chem. Front. 2017, 4, 2088–2096. [Google Scholar] [CrossRef]
Disclaimer/Publisher’s Note: The statements, opinions and data contained in all publications are solely those of the individual author(s) and contributor(s) and not of MDPI and/or the editor(s). MDPI and/or the editor(s) disclaim responsibility for any injury to people or property resulting from any ideas, methods, instructions or products referred to in the content. |
© 2025 by the authors. Licensee MDPI, Basel, Switzerland. This article is an open access article distributed under the terms and conditions of the Creative Commons Attribution (CC BY) license (https://creativecommons.org/licenses/by/4.0/).
Copyright: This open access article is published under a Creative Commons CC BY 4.0 license, which permit the free download, distribution, and reuse, provided that the author and preprint are cited in any reuse.


