
Submitted:
21 August 2025
Posted:
26 August 2025
You are already at the latest version
Abstract
Heparan sulfate proteoglycans are known to serve as initial attachment site for several viruses and bacteria. Recent studies suggest that SARS-CoV-2 coronavirus similarly exploits these glycosaminoglycans, facilitating conformational changes in the spike protein, that promotes the interaction between the receptor binding domain (S1-RBD) and the cellular angiotensin-converting enzyme 2 receptor (ACE2), thereby triggering the virus internalization process. Until now, the molecular details that drive this process, particularly, the co-receptor role of the heparan sulfate (HS), remain not completely understood. Our research seeks to characterize the interaction between an HS hexasaccharide (hexa) and the N343 glycosylated S1-RBD of the Omicron and wild-type (WT) variants of SARS-CoV-2. The conformational properties of hexa in unbound and bound state with these S1-RBDs are investigated using multiple independent MD simulations; the proton binding epitope of hexa, as well as the details of the interaction between this glycan and S1-RBD of the Omicron variant, are characterized by comparing experimental and theoretical saturation transfer difference NMR signals. This investigation reinforces previous evidence about the low specificity and multi-modal nature of the interaction between HS oligosaccharides and these S1-RBDs, and underlines the role of the glycosyl moiety at N343 in potentially affecting this interaction in both selected variants.
Keywords:
1. Introduction
2. Materials and Methods
2.1. Molecular Dynamics Simulations
2.1.1. System Preparation and MD Simulation Protocol
2.1.2. Filtering and Analysis of the MD Trajectories: Bound State Condition of S1-RBD and Hexa
2.1.3. Model Validation by Reduced Matrix (RedMat)
2.1.4. Cluster Analysis
2.2. NMR Spectroscopy: Sample Preparation and Experiment
3. Results and Discussion
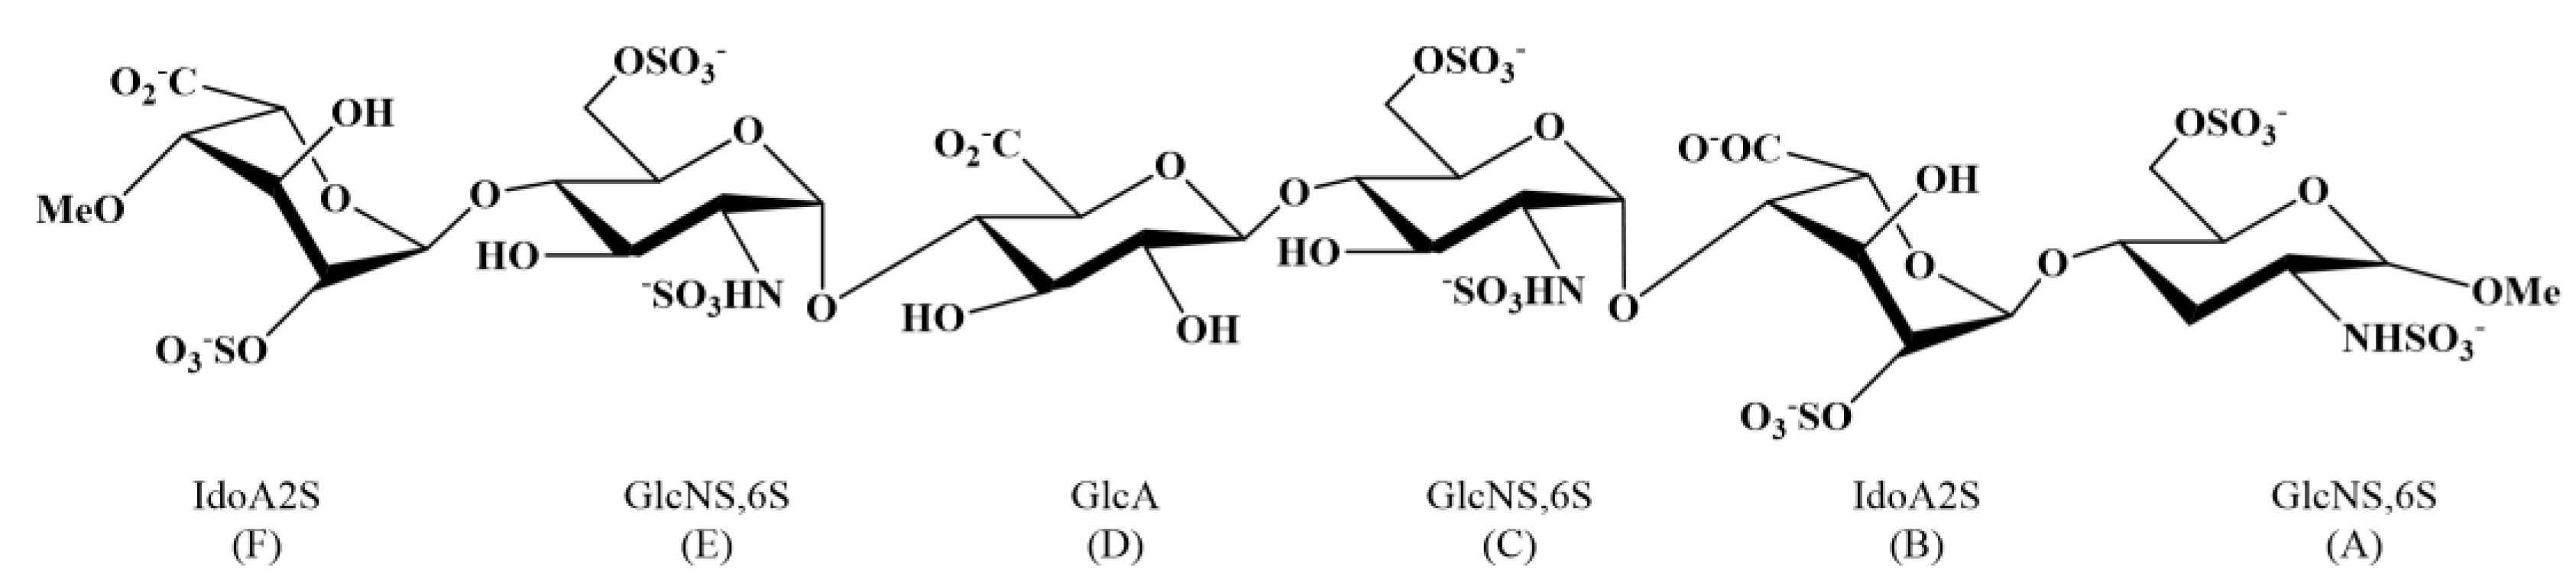
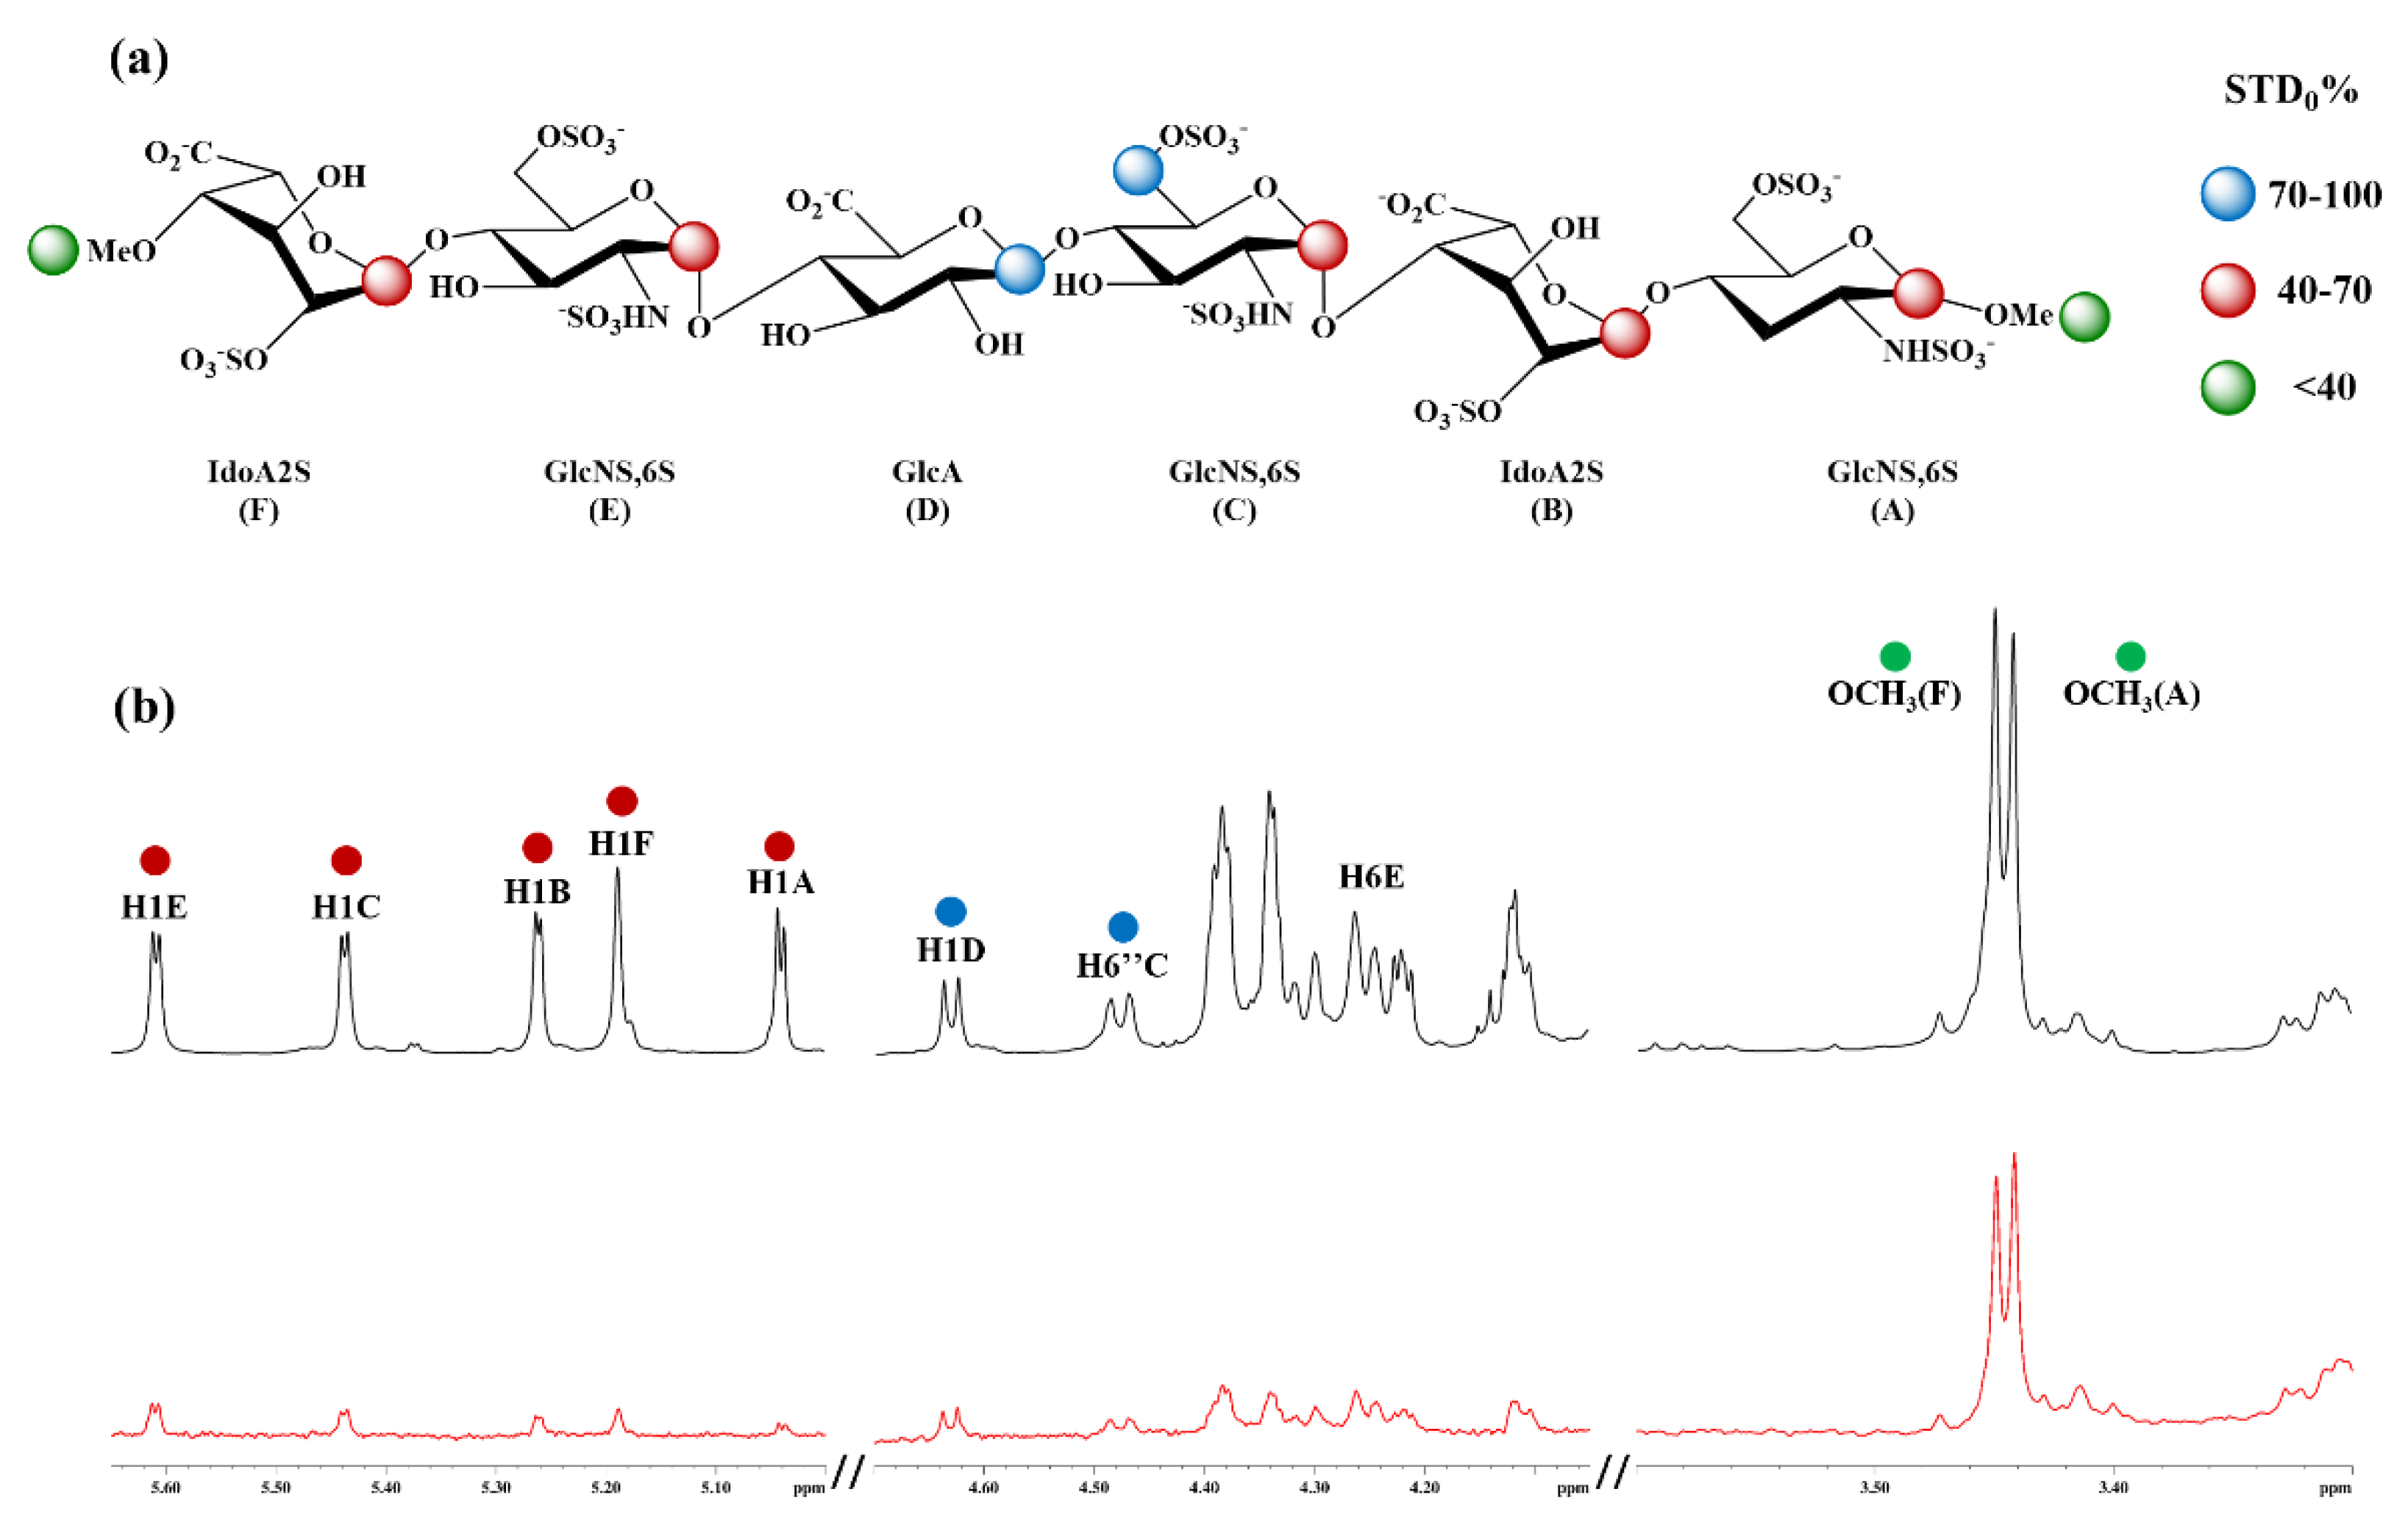
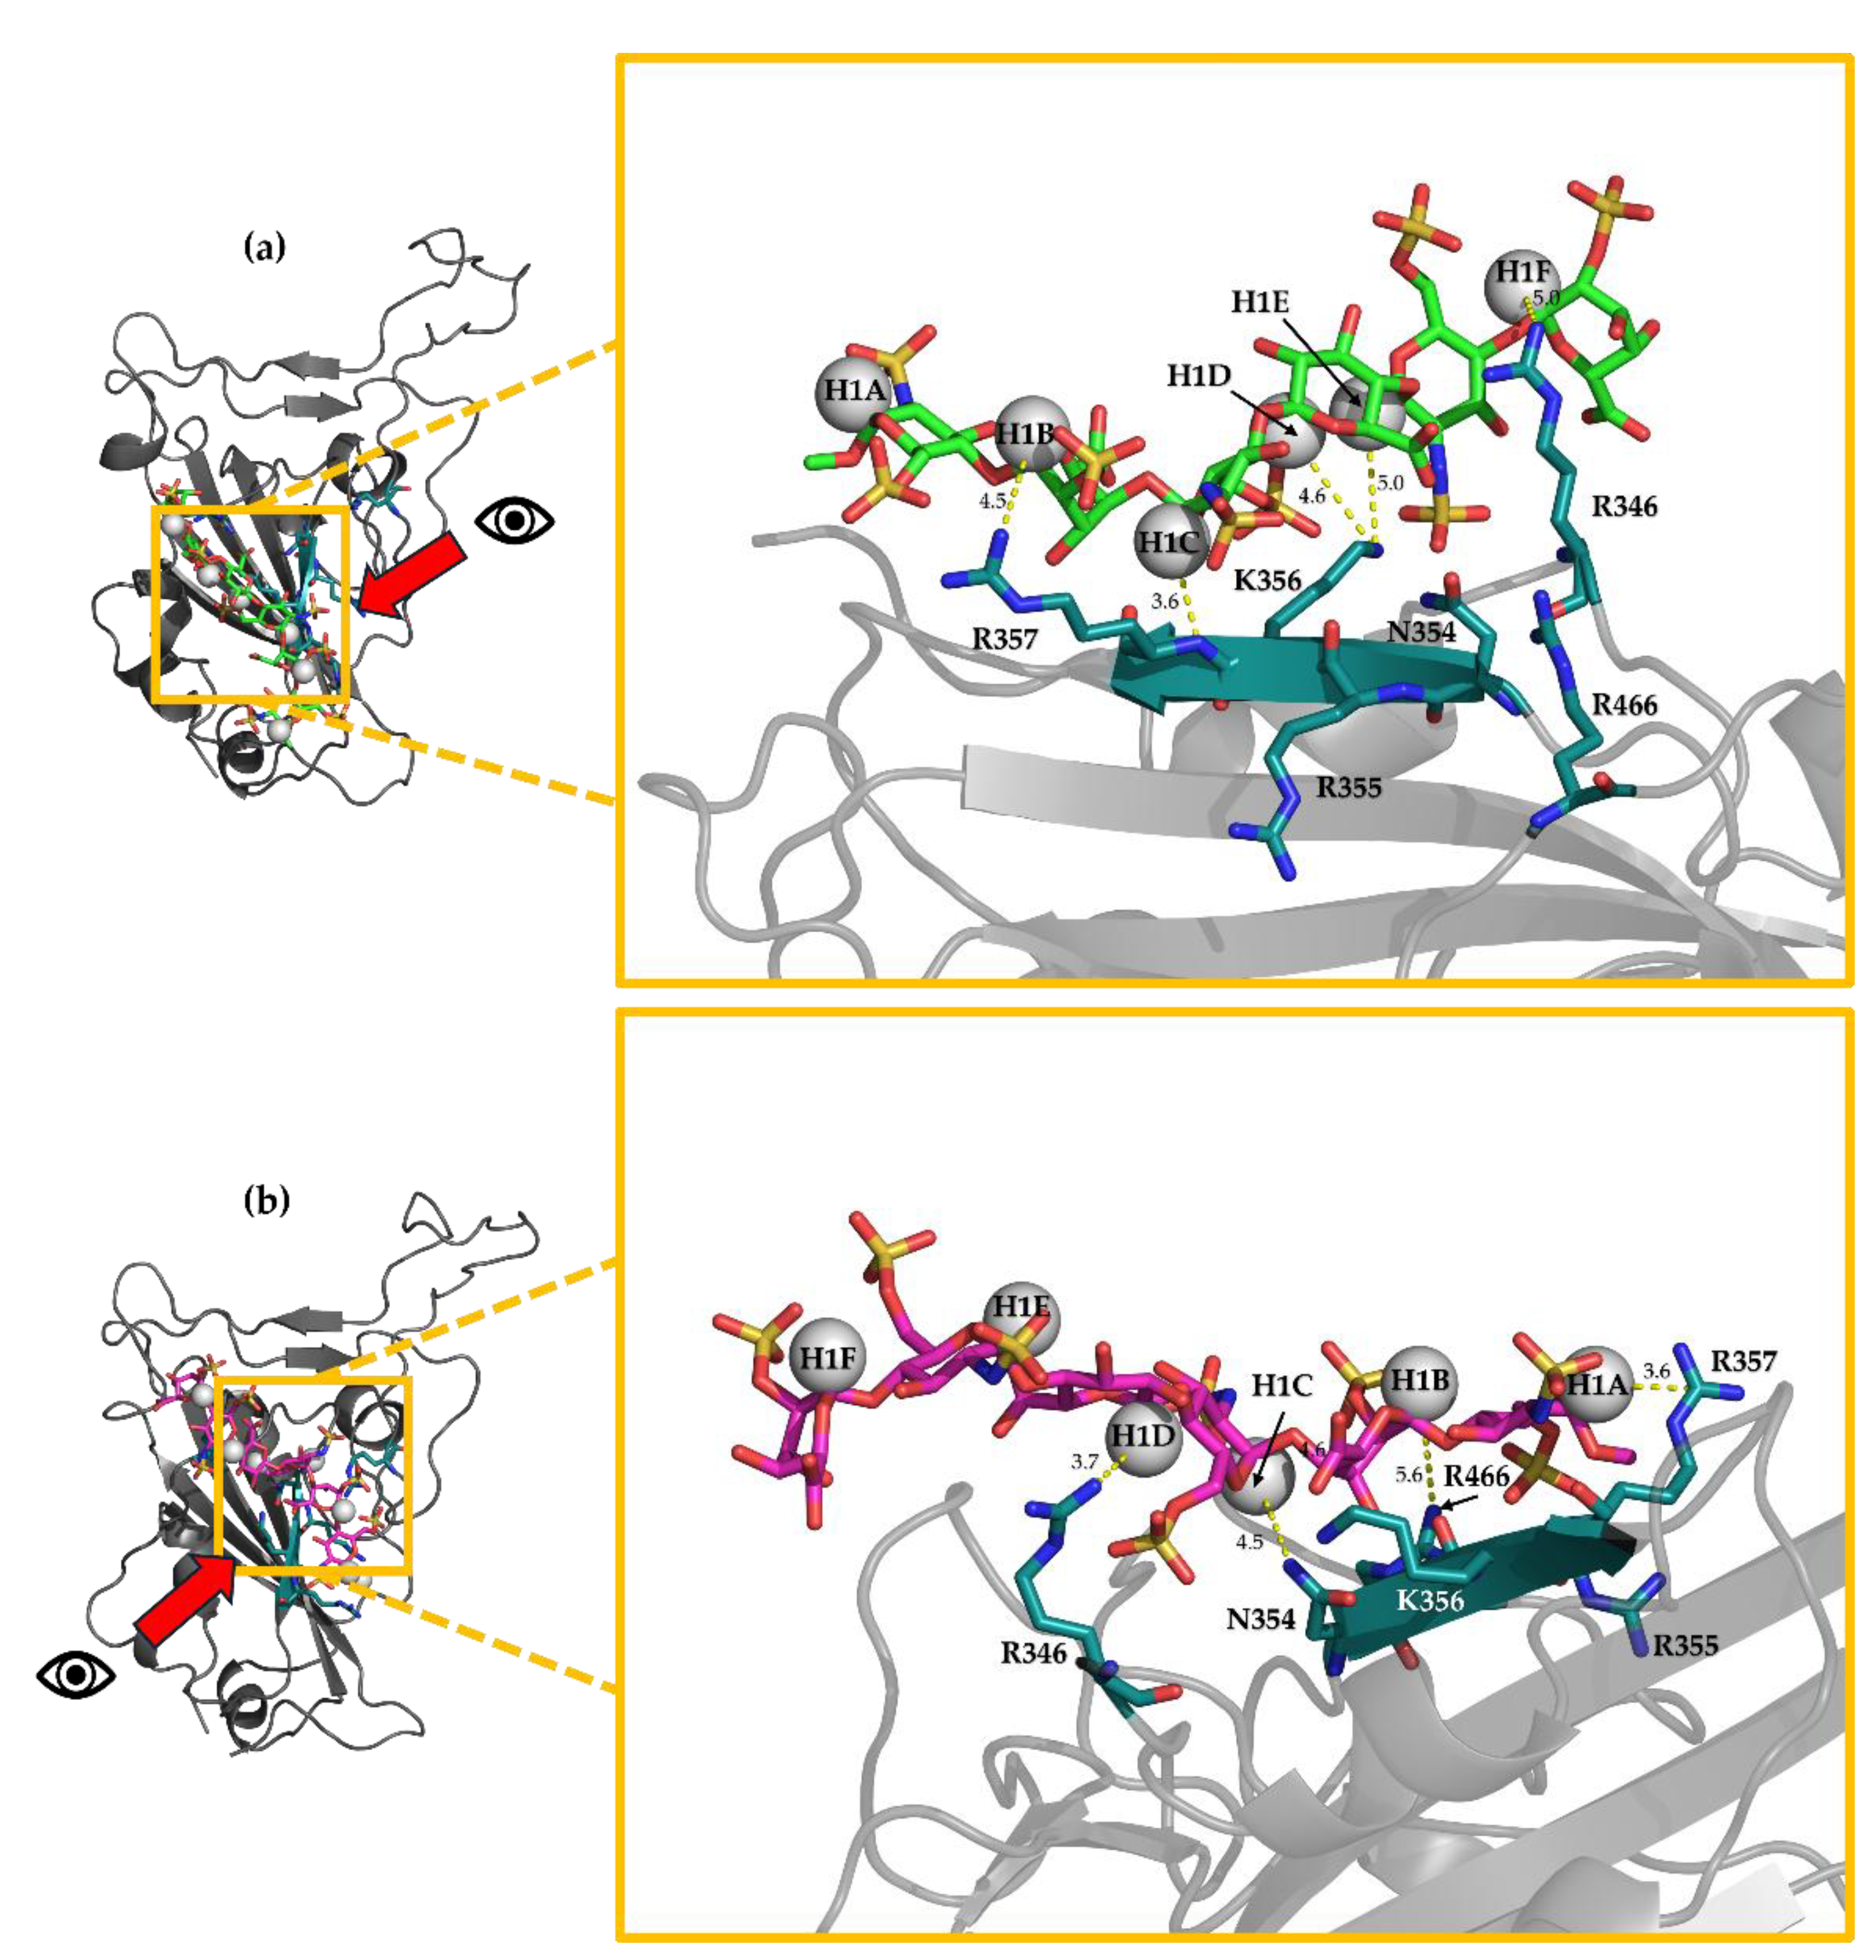
3.11. H-STD NMR Interaction Experiment Between Hexa and Omi S1-RBD
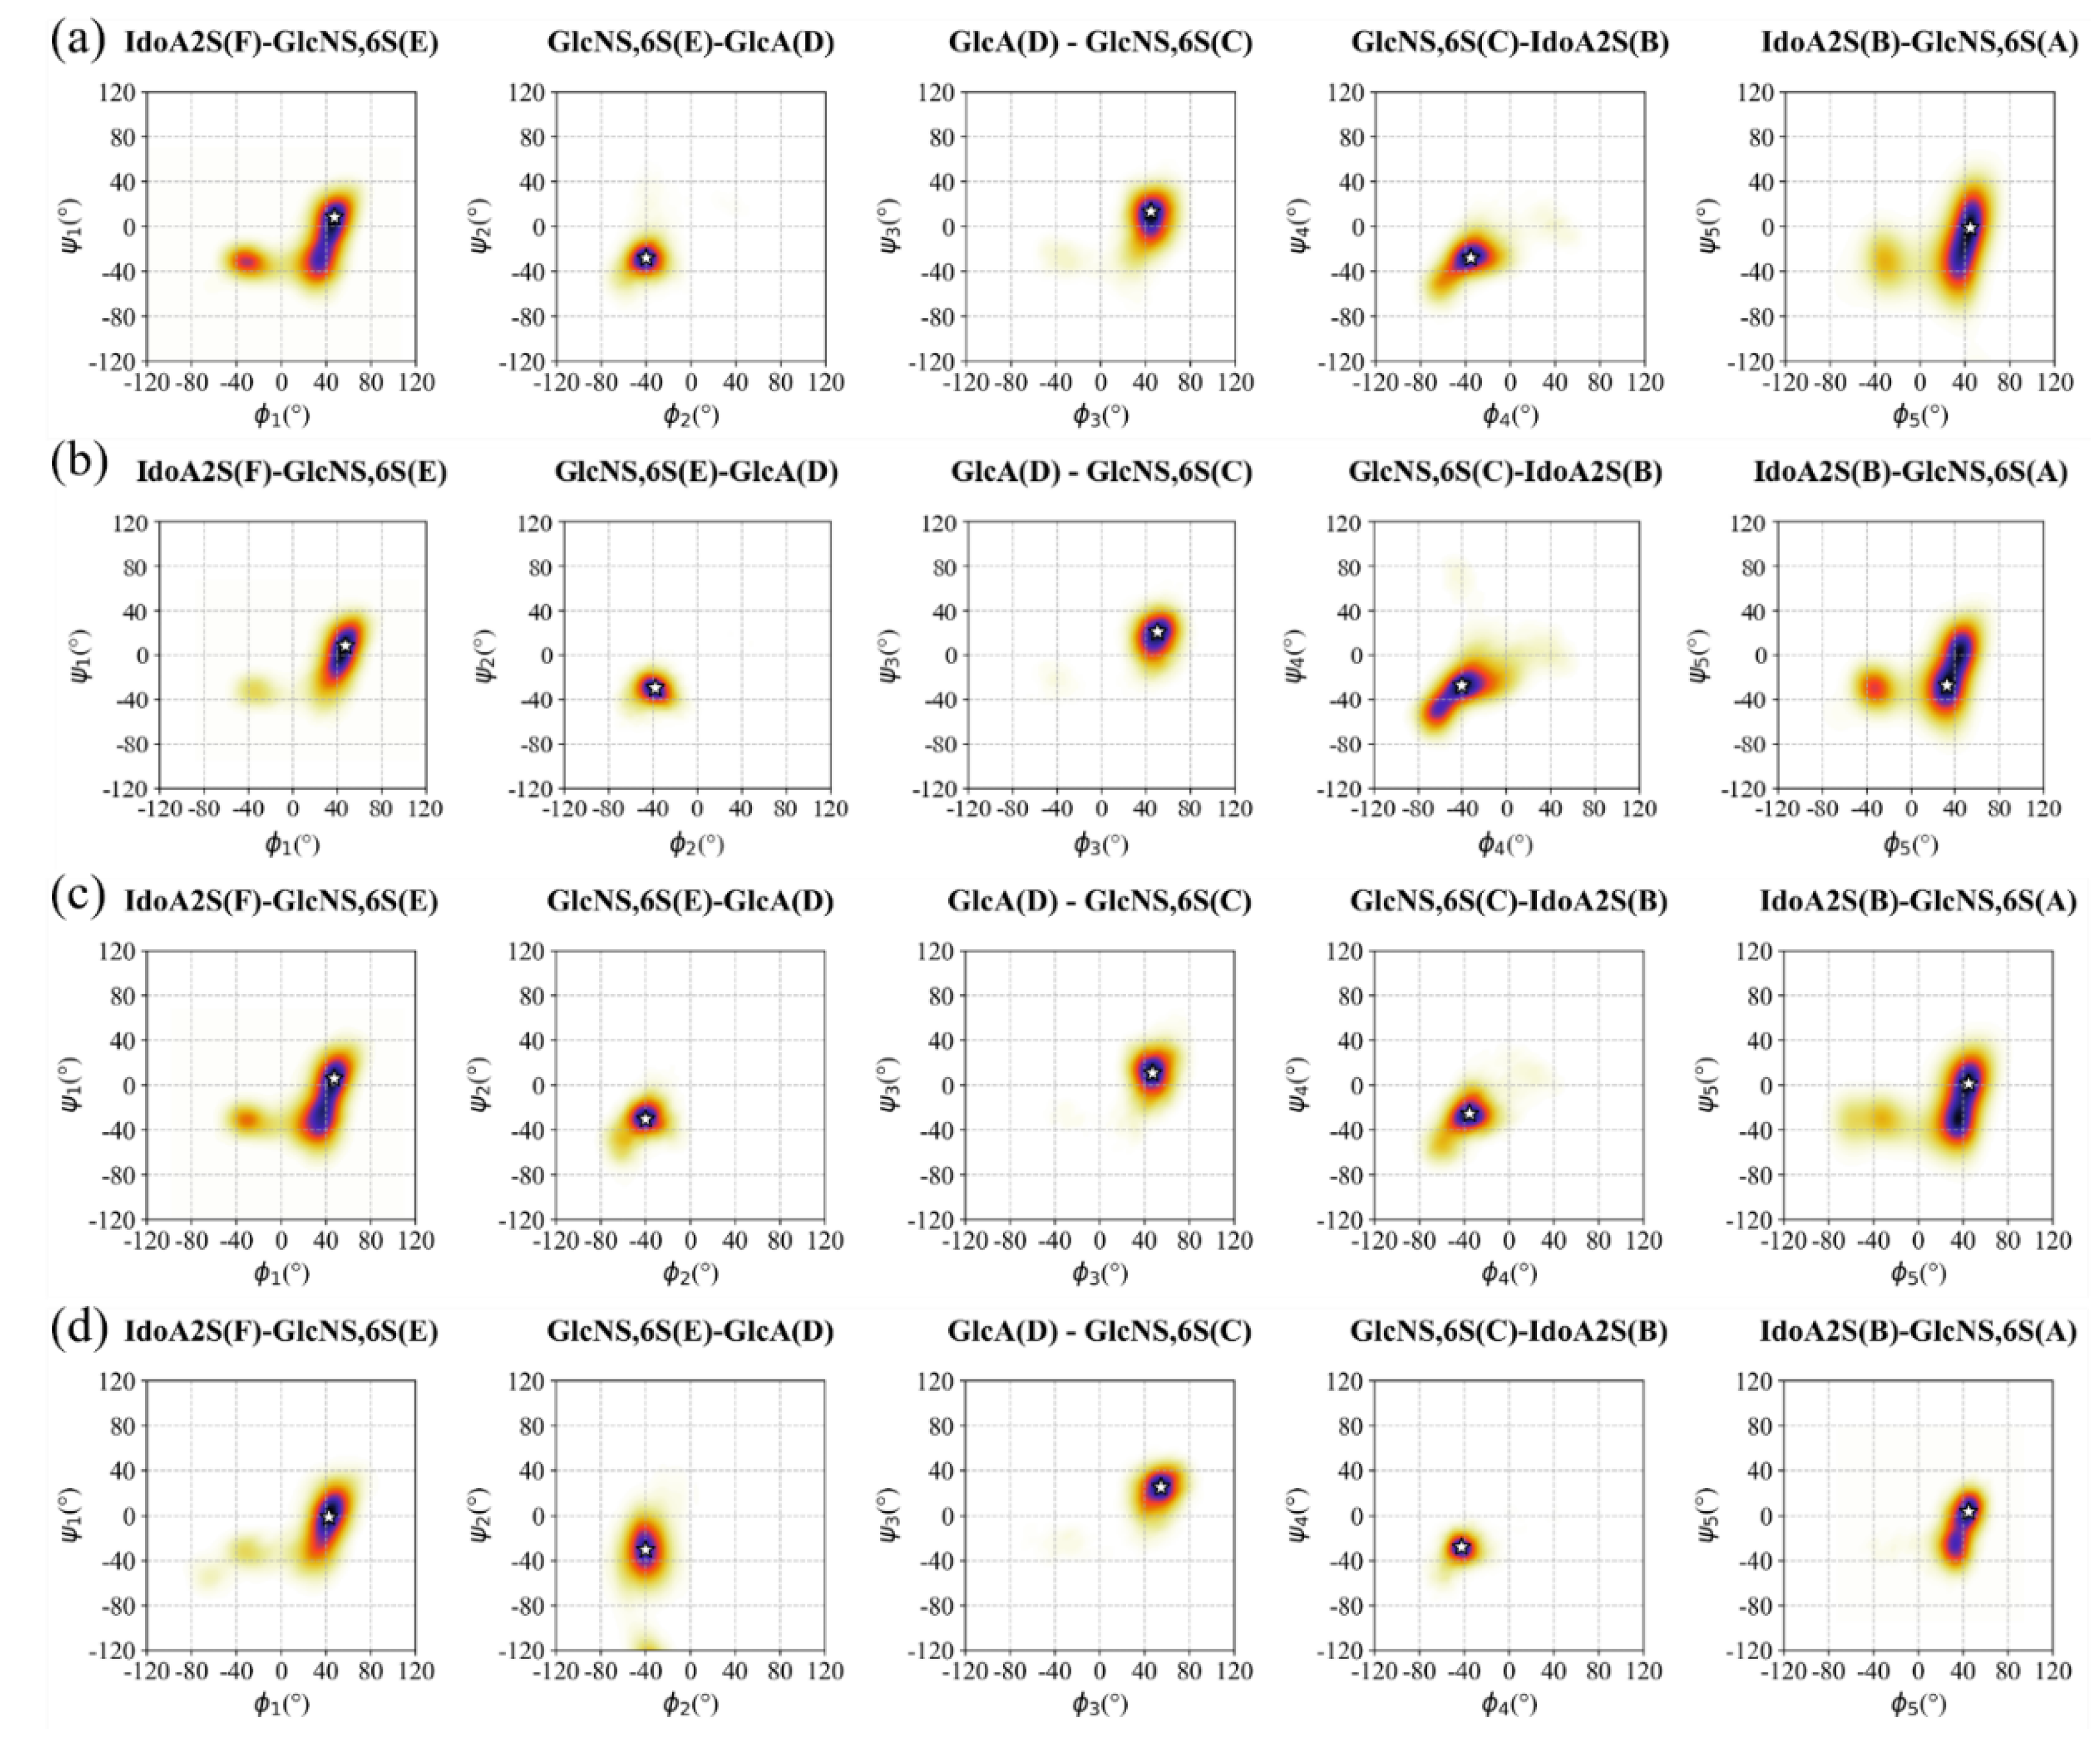
3.2. Conformation of Hexa in Bound State with Omicron and WT S1-RBD
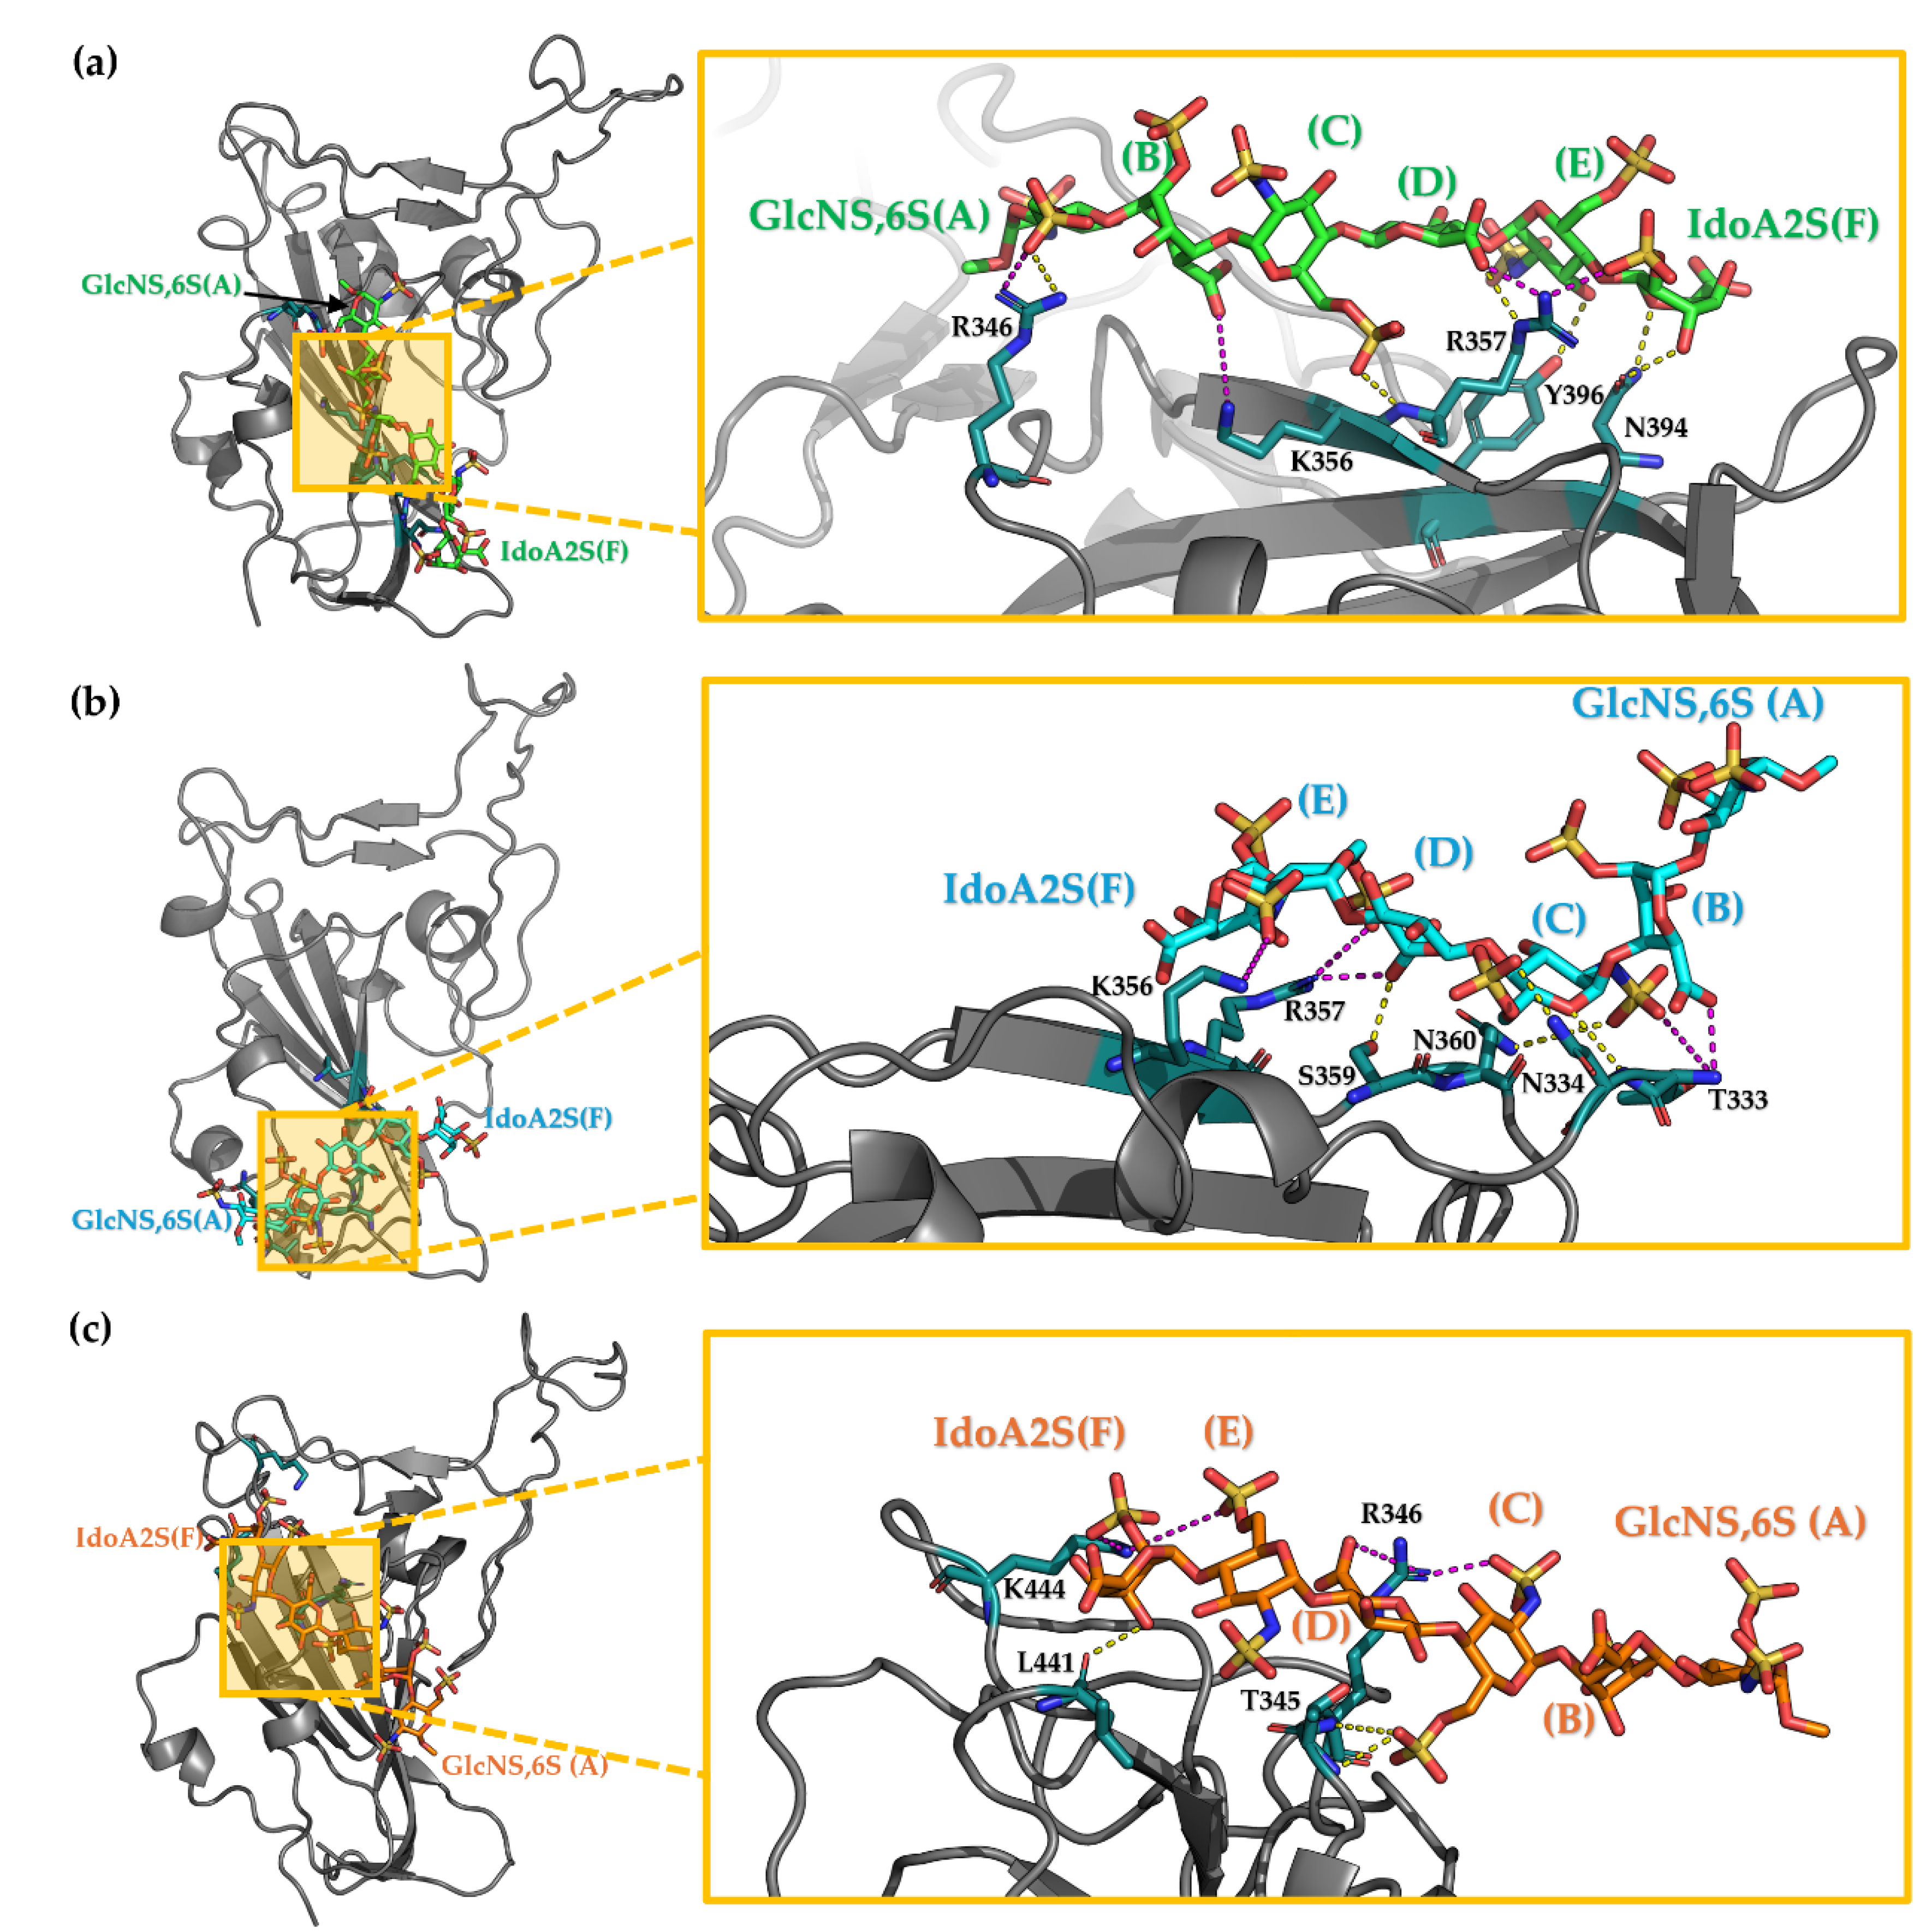
3.3. Characterisation of the Interaction Between Hexa and S1-RBD of Omicron and WT Variants
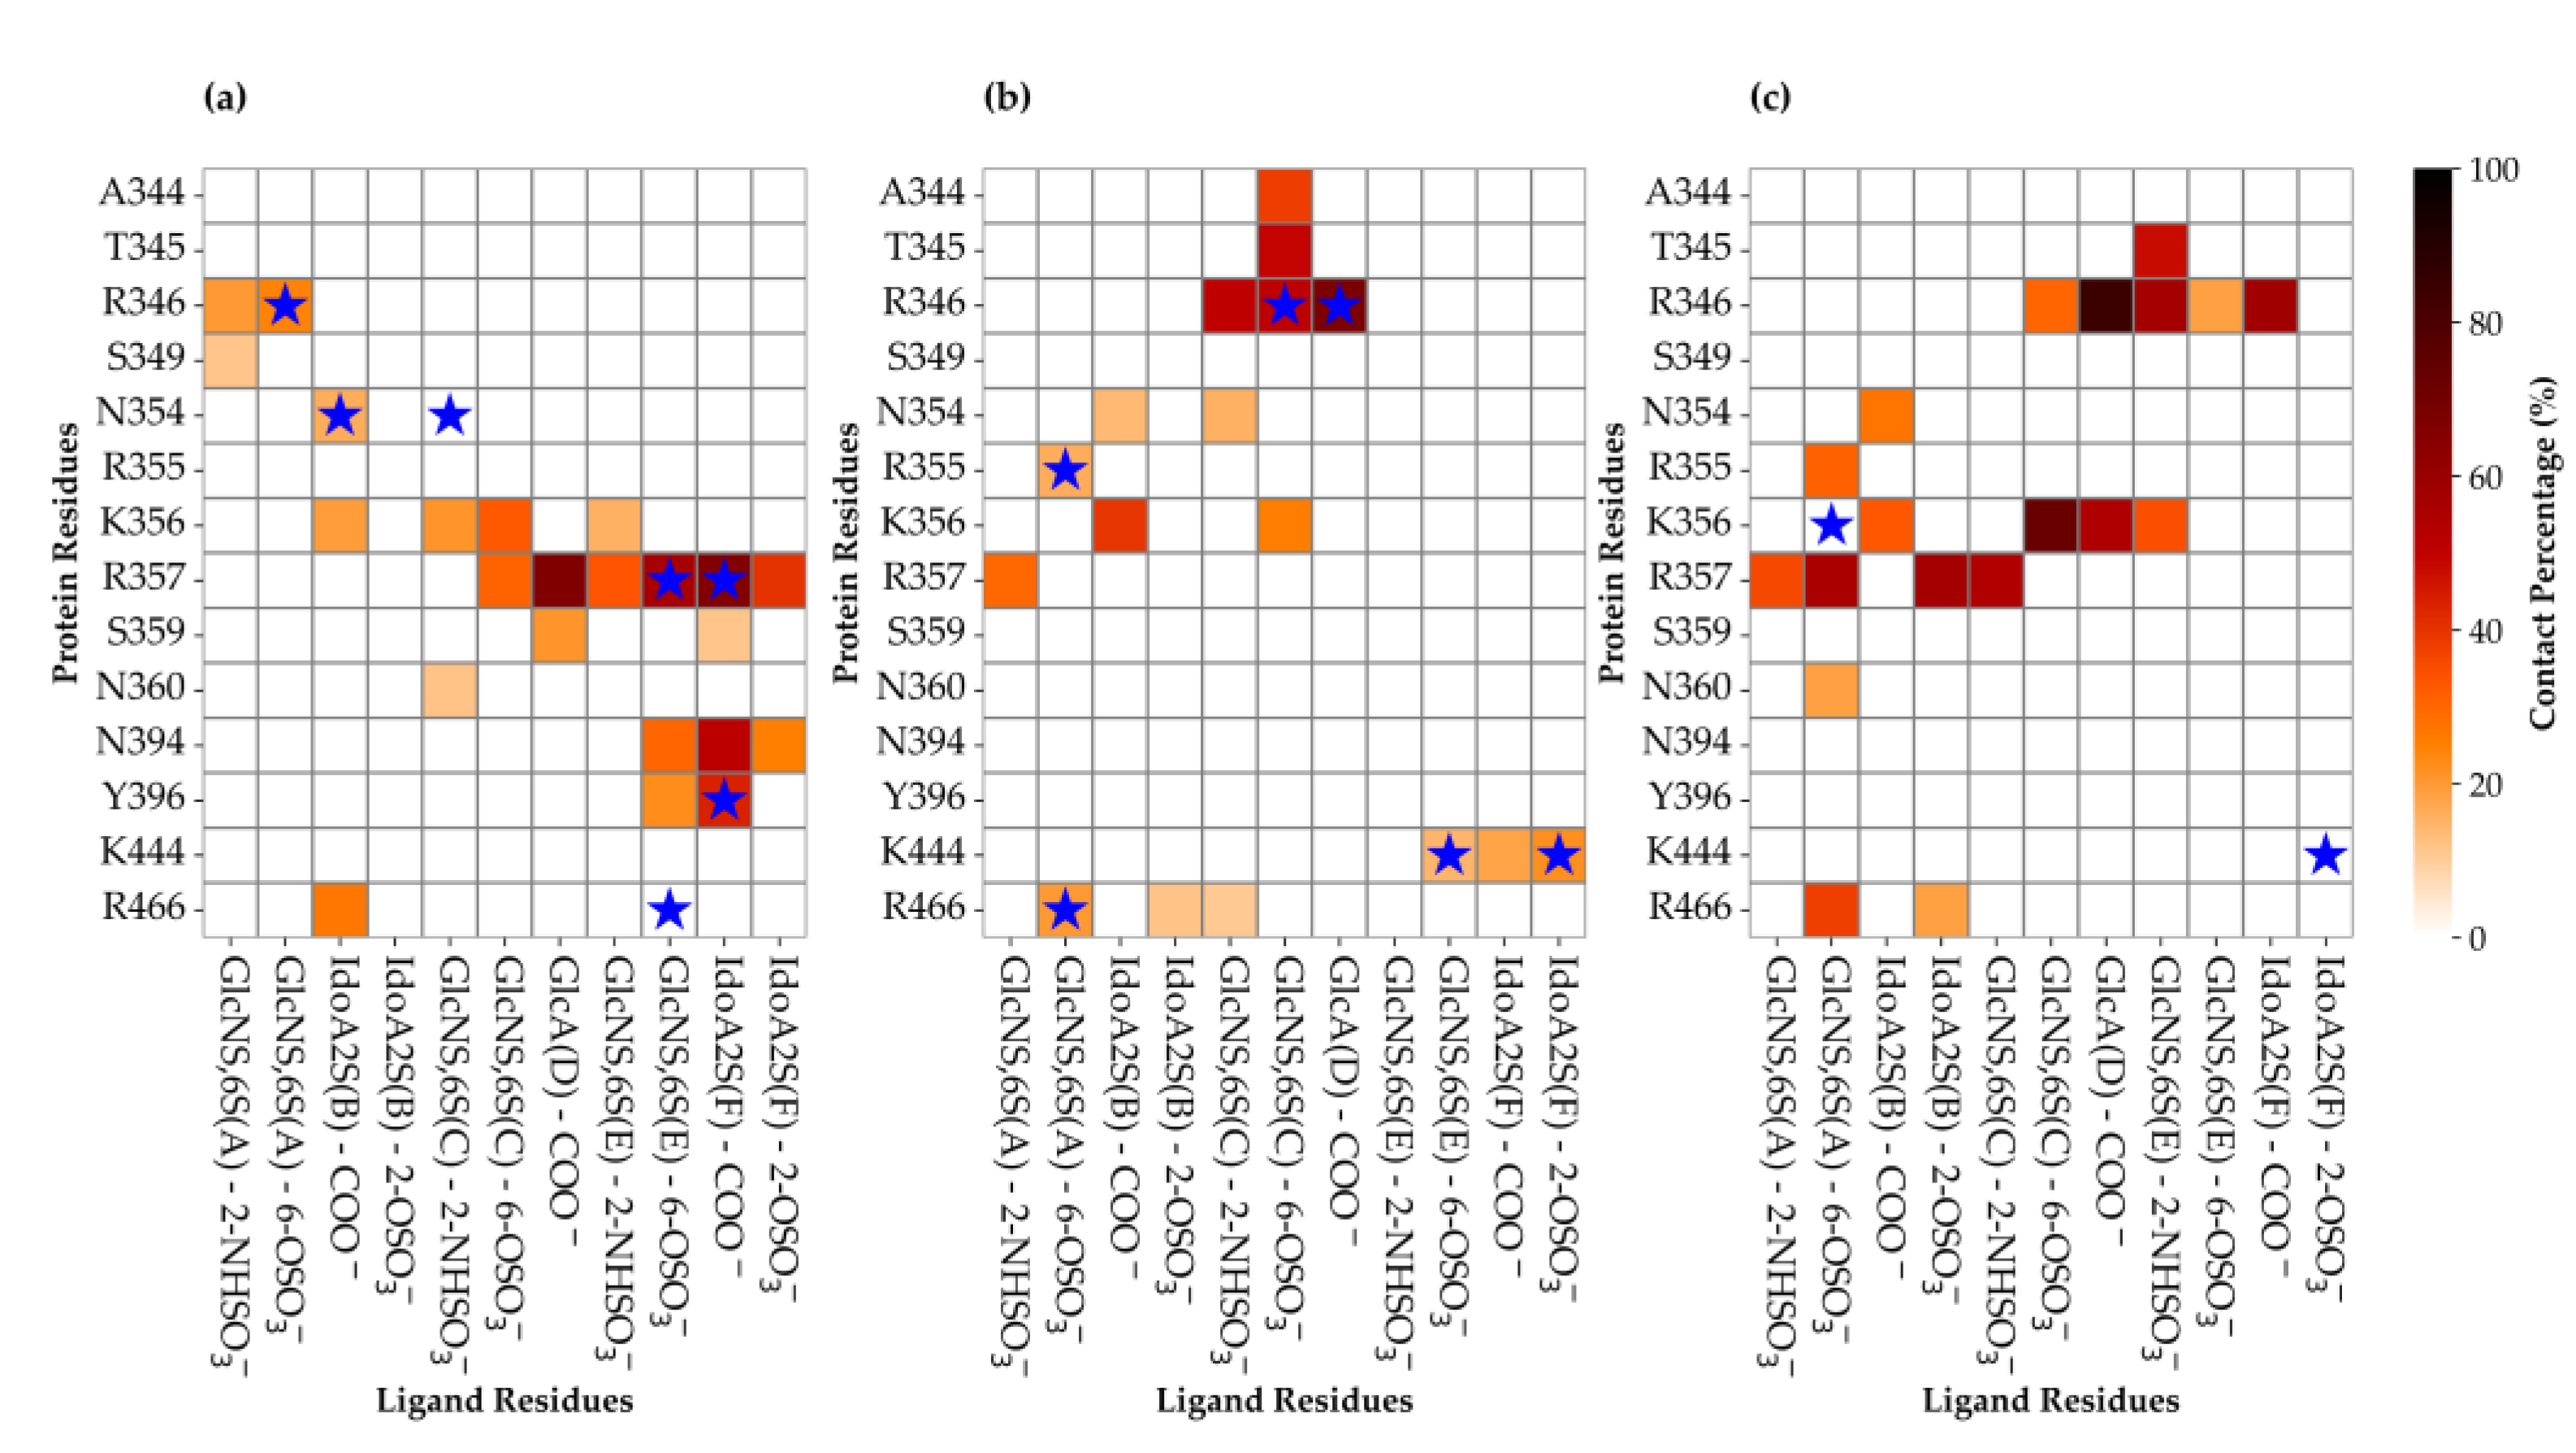
3.3.1. Analysis of the MD Simulation Meta-Trajectories
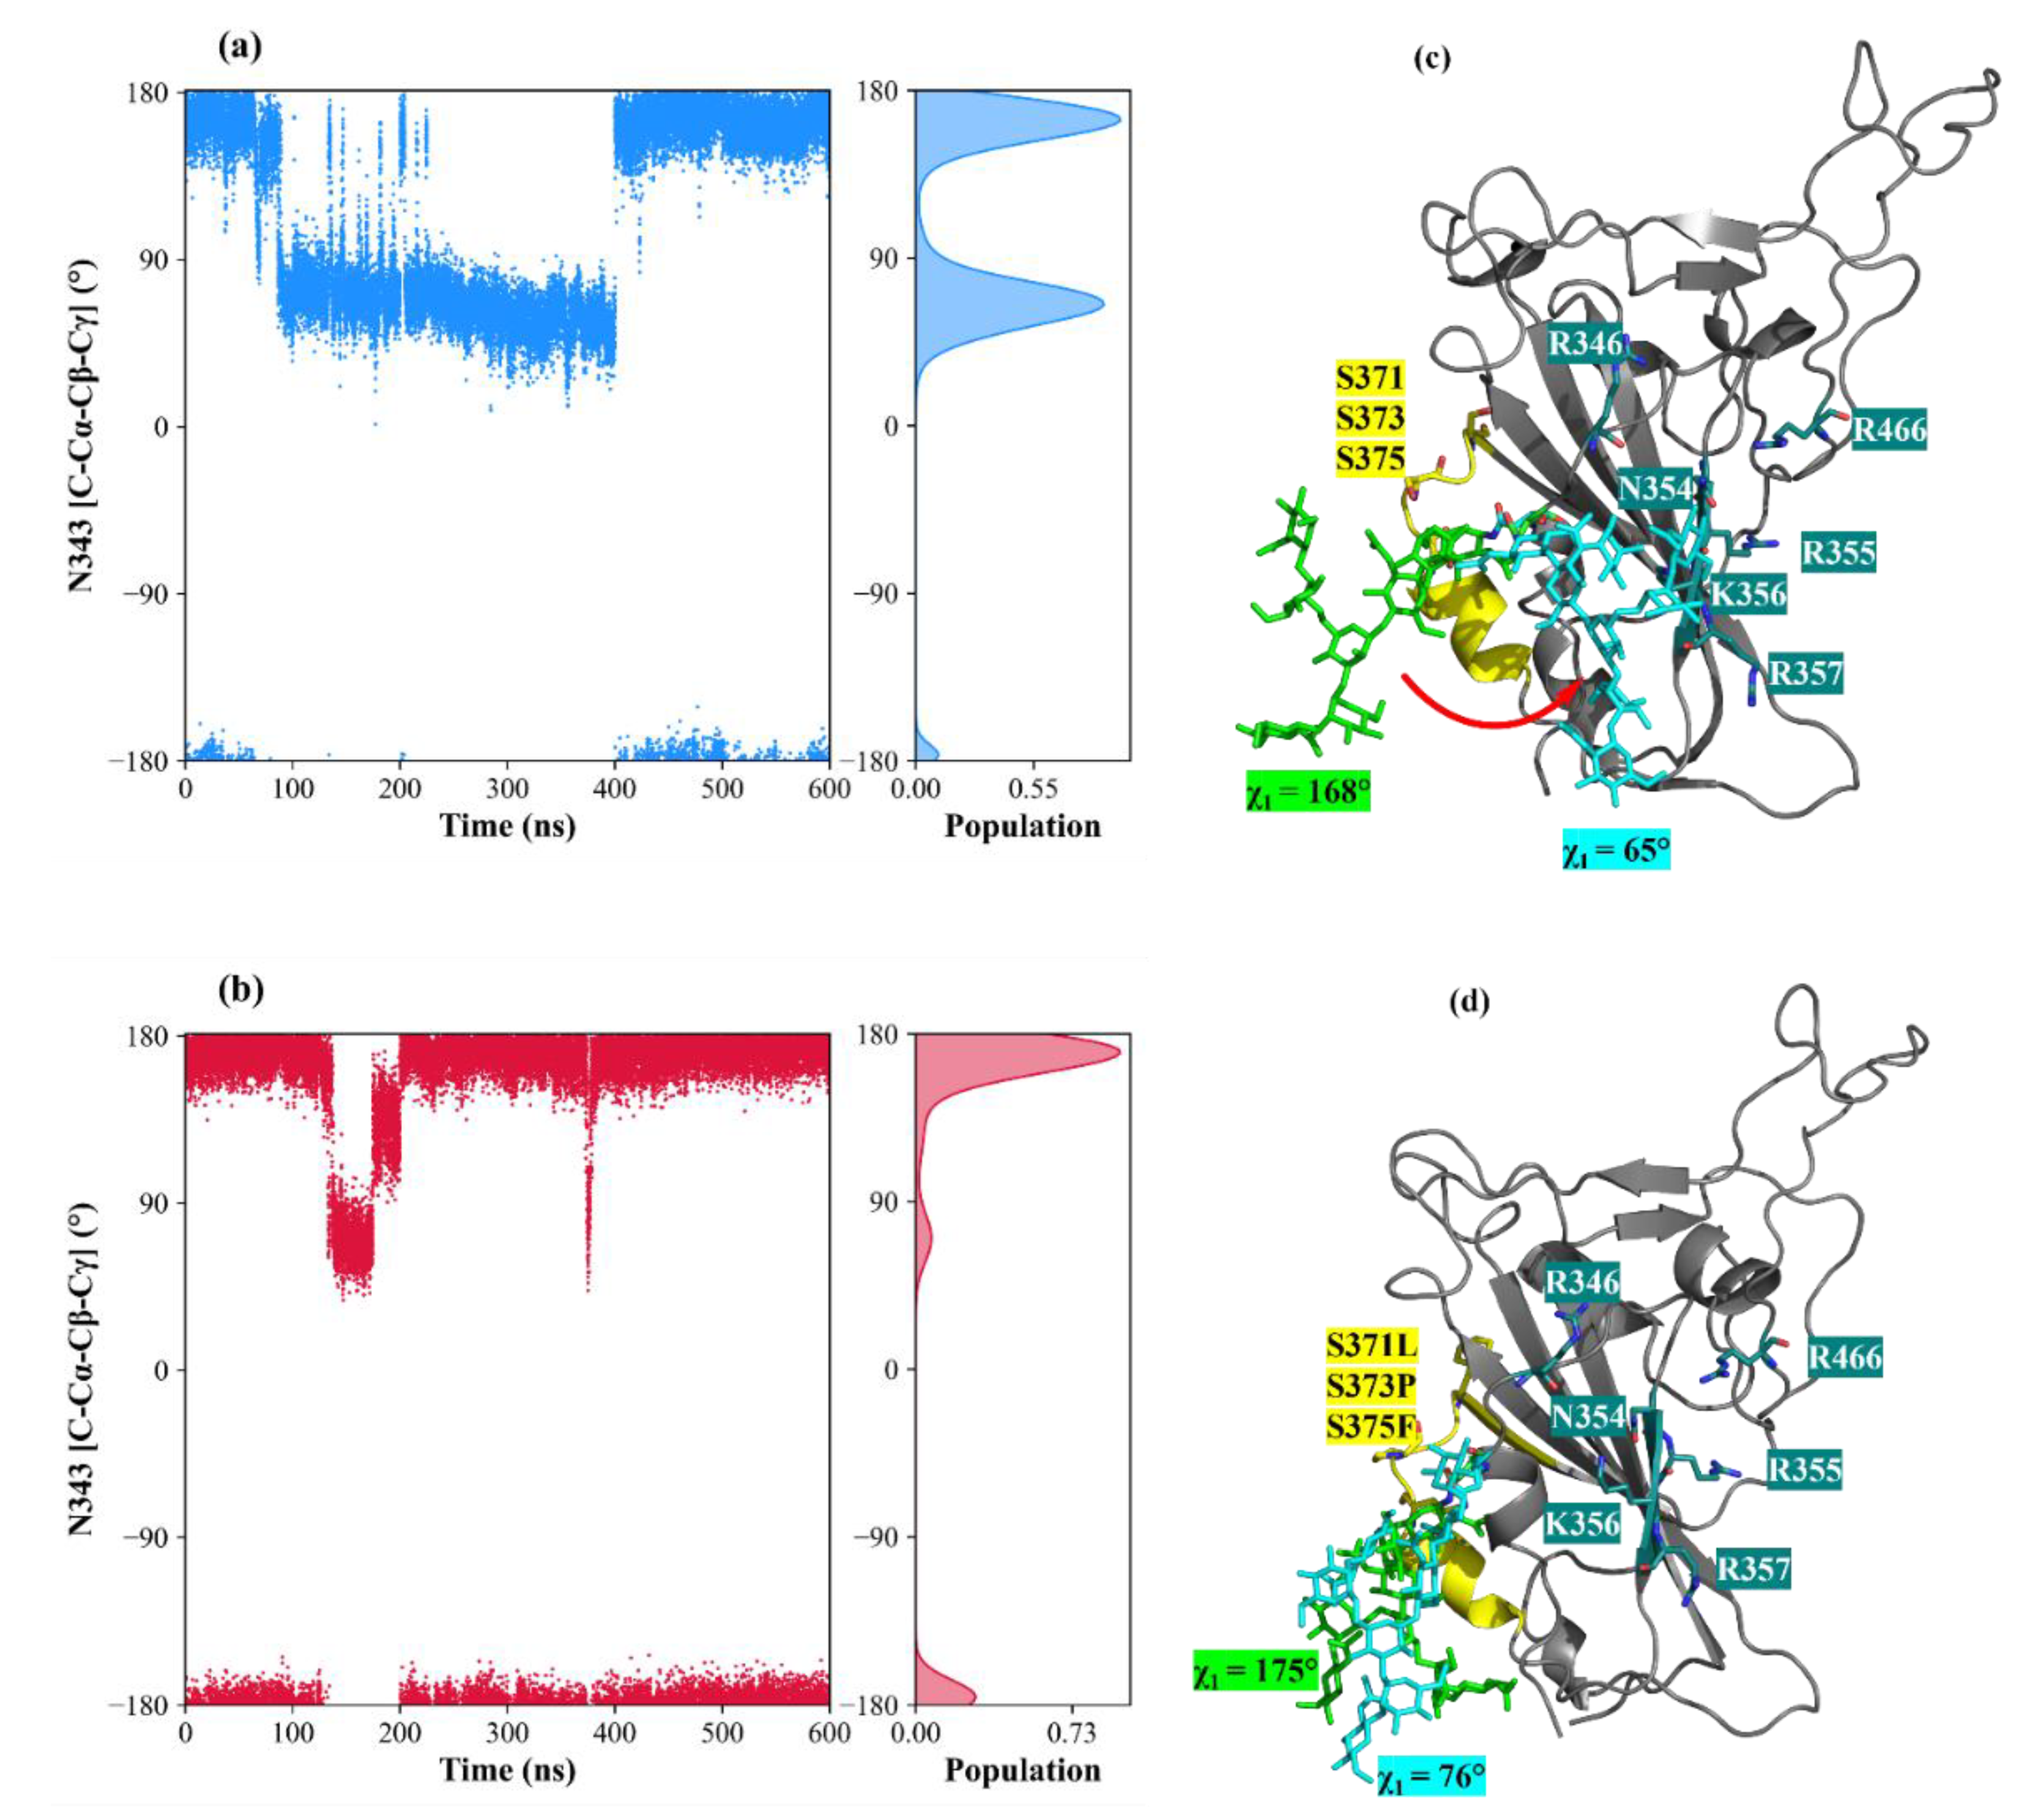
3.4. The Mutation G339D in Omi-S1-RBD Reduce the Shielding Effect That the N343 Glycosyl Moiety Exerts on Site I
3.5. Selection of the Complexes Omi-S1-RBD-Hexa Using the Experimental STD0
4. Conclusions
Supplementary Materials
Author Contributions
Funding
Data Availability Statement
Acknowledgments
Conflicts of Interest
Abbreviations
| ACE2 | Angiotensin Converting Enzyme 2 |
| GlcA | Glucuronic Acid |
| GlcNS,6S | Glucosimina, N-, 6-O- disulfated |
| HS | Heparan Sulfate |
| IdoA2S | Iduronic acid 2-O-sulfated |
| MD | Molucular dynamics |
| RBD | Receptor Binding Domain |
| RMSD | Root Mean Square Deviation |
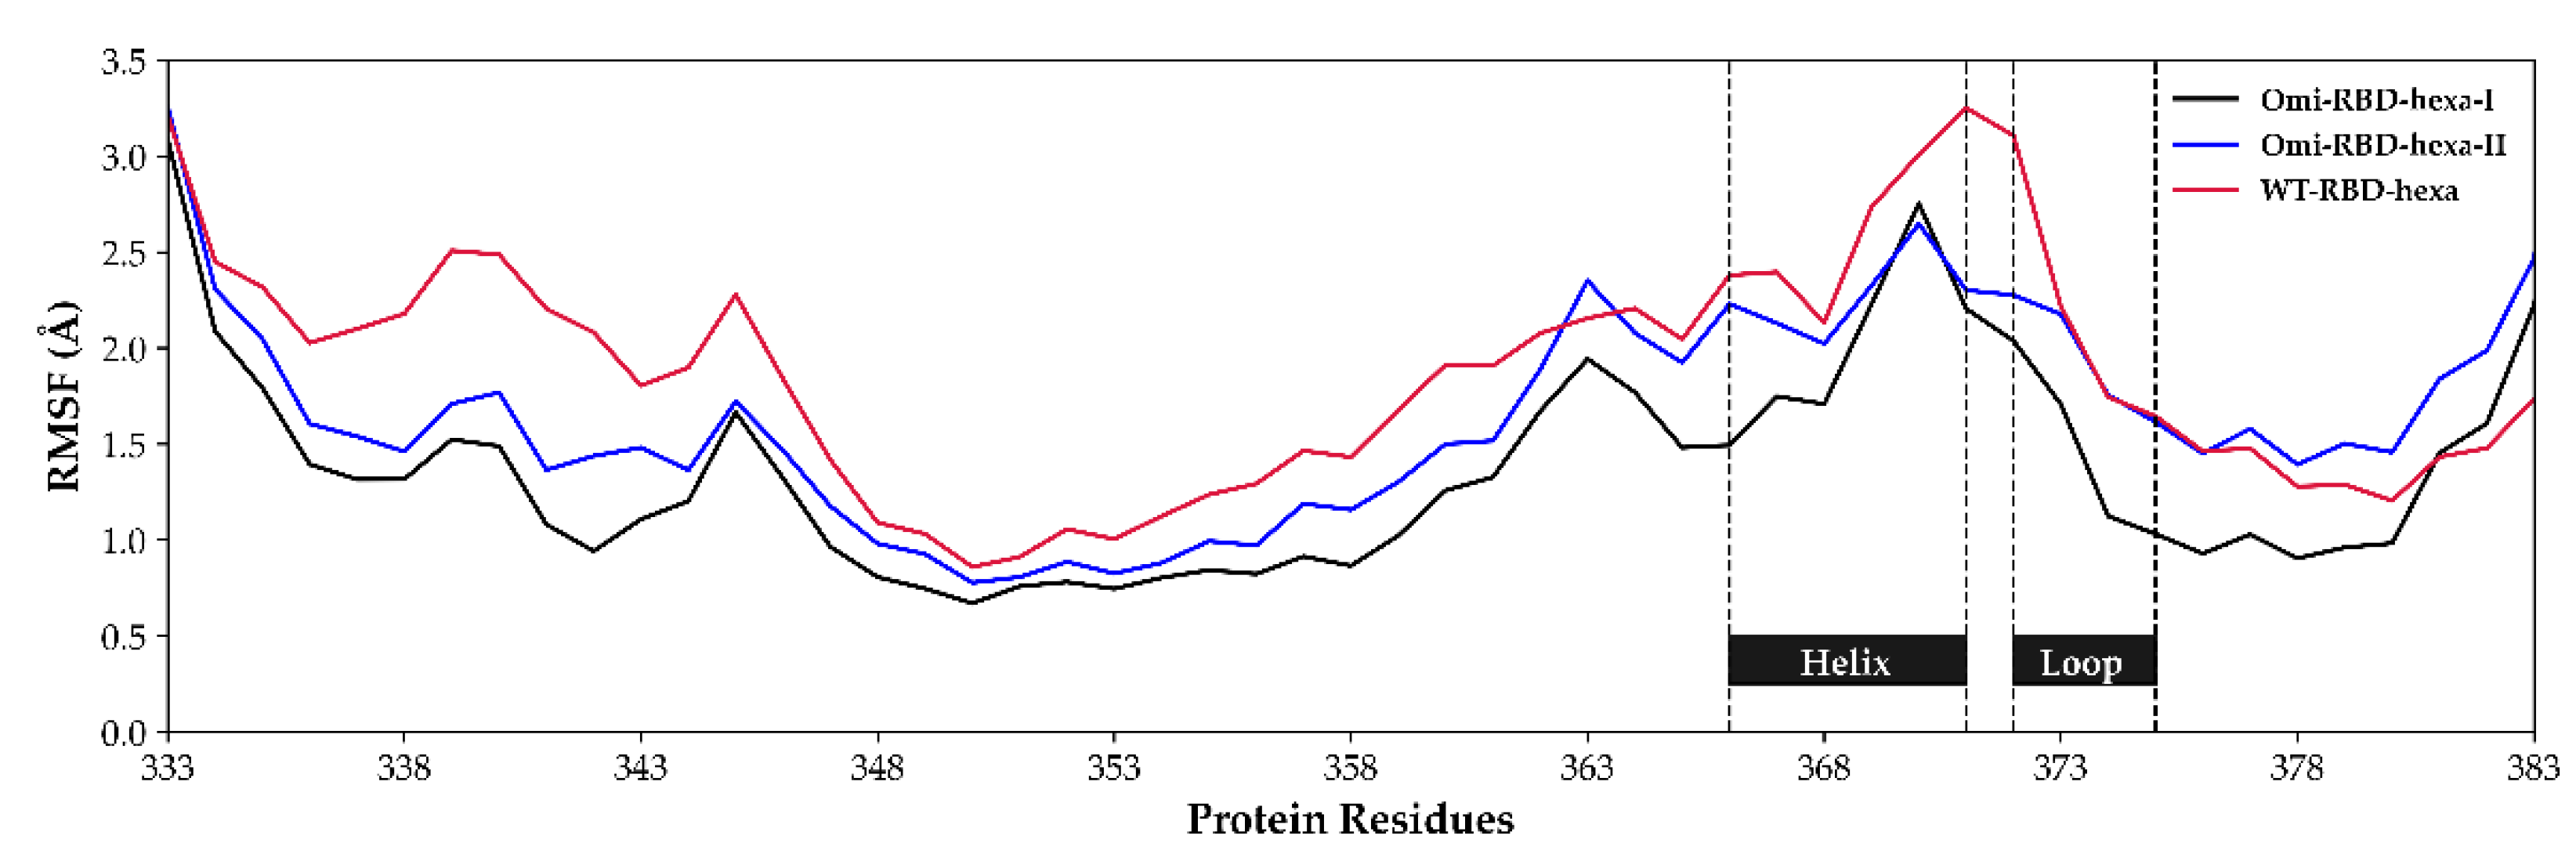
| RMSF | Root Mean Square Fluctation |
| SARS | Severe Acute Respiratory Syndrome |
| STD-NMR | Saturation Transfer Difference Nuclear Magnetic Resonance |
References
- J. Kreuger and L. Kjellén, “Heparan Sulfate Biosynthesis: Regulation and Variability,” Journal of Histochemistry and Cytochemistry, vol. 60, no. 12, p. 2012. [CrossRef]
- J. T. Gallagher, M. J. T. Gallagher, M. Lyon, and W. P. Steward, “Structure and function of heparan sulphate proteoglycans,” Biochemical Journal, vol. 236, no. 2, pp. 313–325, Jun. 1986. [Google Scholar] [CrossRef]
- U. Lindahl and M. Höök, “Glycosaminoglycans and their binding to biological macromolecules.,” Annu Rev Biochem, vol. 47, no. Volume 47, 1978, pp. 385–417, Jul. 1978. [CrossRef]
- B. Casu and U. Lindahl, “Structure and biological interactions of heparin and heparan sulfate,” Adv Carbohydr Chem Biochem, vol. 57, pp. 159–206, Jan. 2001. [CrossRef]
- H. Lortat-Jacob, A. H. Lortat-Jacob, A. Grosdidier, and A. Imberty, “Structural diversity of heparan sulfate binding domains in chemokines,” Proc Natl Acad Sci U S A, vol. 99, no. 3, pp. 1229–1234, Feb. 2002. [Google Scholar] [CrossRef]
- W. H. Burgess and T. Maciag, “THE HEPARIN-BINDING (FIBROBLAST) GROWTH FACTOR FAMILY OF PROTEINS,” Annu Rev Biochem, vol. 58, no. Volume 58, 1989, pp. 575–602, Jul. 1989. [CrossRef]
- R. S. Aquino, K. R. S. Aquino, K. Hayashida, A. Hayashida, and P. W. Park, “Role of HSPGs in Systemic Bacterial Infections,” Methods Mol Biol, vol. 2303, p. 2022. [Google Scholar] [CrossRef]
- V. Cagno, E. D. V. Cagno, E. D. Tseligka, S. T. Jones, and C. Tapparel, “Heparan Sulfate Proteoglycans and Viral Attachment: True Receptors or Adaptation Bias?,” Viruses, vol. 11, no. 7, p. 596, Jul. 2019. [Google Scholar] [CrossRef]
- D. Shukla et al., “A novel role for 3-O-sulfated heparan sulfate in herpes simplex virus 1 entry,” Cell, vol. 99, no. 1, pp. 13–22, Oct. 1999. [CrossRef]
- C. Artpradit, L. N. C. Artpradit, L. N. Robinson, B. K. Gavrilov, T. T. Rurak, M. Ruchirawat, and R. Sasisekharan, “Recognition of heparan sulfate by clinical strains of dengue virus serotype 1 using recombinant subviral particles,” Virus Res, vol. 176, no. 1–2, pp. 69–77, Sep. 2013. [Google Scholar] [CrossRef]
- M. Donalisio et al., “Inhibition of human respiratory syncytial virus infectivity by a dendrimeric heparan sulfate-binding peptide,” Antimicrob Agents Chemother, vol. 56, no. 10, pp. 5278–5288, Oct. 2012. [CrossRef]
- V. Cagno et al., “Highly sulfated K5 Escherichia coli polysaccharide derivatives inhibit respiratory syncytial virus infectivity in cell lines and human tracheal-bronchial histocultures,” Antimicrob Agents Chemother, vol. 58, no. 8, pp. 4782– 4794, 2014. [CrossRef]
- S. M. Johnson et al., “Respiratory Syncytial Virus Uses CX3CR1 as a Receptor on Primary Human Airway Epithelial Cultures,” PLoS Pathog, vol. 11, no. 12, p. e100 5318, 2015. [CrossRef]
- T. M. Clausen et al., “SARS-CoV-2 Infection Depends on Cellular Heparan Sulfate and ACE2,” Cell, vol. 183, no. 4, pp. 1043-1057.e15, Nov. 2020. [CrossRef]
- J. Yue et al., “Heparan Sulfate Facilitates Spike Protein-Mediated SARS-CoV-2 Host Cell Invasion and Contributes to Increased Infection of SARS-CoV-2 G614 Mutant and in Lung Cancer,” Front Mol Biosci, vol. 8, Jun. 2021. [CrossRef]
- F. L. Kearns et al., “Spike-heparan sulfate interactions in SARS-CoV-2 infection,” Curr Opin Struct Biol, vol. 76, p. 102439, Oct. 2022. [CrossRef]
- M. Parafioriti et al., “Evidence for multiple binding modes in the initial contact between SARS-CoV-2 spike S1 protein and cell surface glycans**,” Chemistry – A European Journal, Jan. 2022. [CrossRef]
- C. Nie, A. K. C. Nie, A. K. Sahoo, R. R. Netz, A. Herrmann, M. Ballauff, and R. Haag, “Charge Matters: Mutations in Omicron Variant Favor Binding to Cells,” ChemBioChem, vol. 23, no. 6, Mar. 2022. [Google Scholar] [CrossRef]
- A. L. Gelbach et al., “Interactions between heparin and SARS-CoV-2 spike glycoprotein RBD from omicron and other variants,” Front Mol Biosci, vol. 9, p. 912887, Aug. 2022. [CrossRef]
- M. He, X. M. He, X. Zhou, and X. Wang, “Glycosylation: mechanisms, biological functions and clinical implications,” Signal Transduction and Targeted Therapy 2024 9:1, vol. 9, no. 1, pp. 1–33, Aug. 2024. [Google Scholar] [CrossRef]
- L. Casalino et al., “Beyond shielding: The roles of glycans in the SARS-CoV-2 spike protein,” ACS Cent Sci, vol. 6, no. 10, pp. 1722–1734, Oct. 2020. [CrossRef]
- Y. Watanabe et al., “Vulnerabilities in coronavirus glycan shields despite extensive glycosylation,” Nature Communications 2020 11:1, vol. 11, no. 1, pp. 20 May; 10. [CrossRef]
- C. M. Ives et al., “Role of N343 glycosylation on the SARS-CoV-2 S RBD structure and co-receptor binding across variants of concern,” Elife, vol. 13, Jun. 2024. [CrossRef]
- R. Nepravishta et al., “Fast Quantitative Validation of 3D Models of Low-Affinity Protein-Ligand Complexes by STD NMR Spectroscopy,” J Med Chem, vol. 67, no. 12, pp. 10025–10034, Jun. 2024. [CrossRef]
- J. Froese et al., “Evolution of SARS-CoV-2 spike trimers towards optimized heparan sulfate cross-linking and inter-chain mobility,” Scientific Reports 2024 14:1, vol. 14, no. 1, pp. 1–16, Dec. 2024. [CrossRef]
- D. A. Case et al., “Amber18 (University of San Francisco),” 2017.
- J. A. Maier, C. J. A. Maier, C. Martinez, K. Kasavajhala, L. Wickstrom, K. E. Hauser, and C. Simmerling, “ff14SB: Improving the Accuracy of Protein Side Chain and Backbone Parameters from ff99SB,” J Chem Theory Comput, vol. 11, no. 8, pp. 3696–3713, Jul. 2015. [Google Scholar] [CrossRef]
- K. N. Kirschner et al., “GLYCAM06: A generalizable biomolecular force field. Carbohydrates,” J Comput Chem, vol. 29, no. 4, pp. 622–655, Mar. 2008. [CrossRef]
- P. Mark and L. Nilsson, “Structure and Dynamics of the TIP3P, SPC, and SPC/E Water Models at 298 K,” Journal of Physical Chemistry A, vol. 105, no. 43, pp. 9954–9960, Nov. 2001. [CrossRef]
- R. J. Loncharich, B. R. R. J. Loncharich, B. R. Brooks, and R. W. Pastor, “Langevin dynamics of peptides: The frictional dependence of isomerization rates of N-acetylalanyl-N′-methylamide,” Biopolymers, vol. 32, no. 5, pp. 1992. [Google Scholar] [CrossRef]
- J. P. Ryckaert, G. J. P. Ryckaert, G. Ciccotti, and H. J. C. Berendsen, “Numerical integration of the cartesian equations of motion of a system with constraints: molecular dynamics of n-alkanes,” J Comput Phys, vol. 23, no. 3, pp. 327–341, Mar. 1977. [Google Scholar] [CrossRef]
- G. Bussi, D. G. Bussi, D. Donadio, and M. Parrinello, “Canonical sampling through velocity rescaling,” Journal of Chemical Physics, vol. 126, no. 2007; 1. [Google Scholar] [CrossRef]
- D. R. Roe and T. E. Cheatham, “PTRAJ and CPPTRAJ: Software for processing and analysis of molecular dynamics trajectory data,” J Chem Theory Comput, vol. 9, no. 7, pp. 3084–3095, Jul. 2013. [CrossRef]
- M. Mayer and T. L. James, “NMR-Based Characterization of Phenothiazines as a RNA Binding Scaffoldt,” J Am Chem Soc, vol. 126, no. 13, pp. 4453–4460, Apr. 2004. [CrossRef]
- J. Lan et al., “Structure of the SARS-CoV-2 spike receptor-binding domain bound to the ACE2 receptor,” Nature 2020 581:7807, vol. 581, no. 7807, pp. 215–220, Mar. 2020. [CrossRef]
- P. Han et al., “Receptor binding and complex structures of human ACE2 to spike RBD from omicron and delta SARS-CoV-2,” Cell, vol. 185, no. 4, pp. 630-640.e10, Feb. 2022. [CrossRef]
- C. J. Mycroft-West et al., “Heparin Inhibits Cellular Invasion by SARS-CoV-2: Structural Dependence of the Interaction of the Spike S1 Receptor-Binding Domain with Heparin,” Thromb Haemost, vol. 120, no. 12, pp. 1700–1715, Dec. 2020. [CrossRef]
- G. Paiardi, M. G. Paiardi, M. Ferraz, M. Rusnati, and R. C. Wade, “The accomplices: Heparan sulfates and N-glycans foster SARS-CoV-2 spike:ACE2 receptor binding and virus priming,” Proc Natl Acad Sci U S A, vol. 121, no. 43, p. e2404892121, Oct. 2024. [Google Scholar] [CrossRef]
- M. Sanda, L. M. Sanda, L. Morrison, and R. Goldman, “N-and O-Glycosylation of the SARS-CoV-2 Spike Protein,” Anal Chem, vol. 93, no. 4, pp. 2003–2009, Feb. 2021. [Google Scholar] [CrossRef]
- ”CHARMM-GUI.” Accessed: Jul. 10, 2025. [Online]. Available: https://charmm-gui.org/?
- H. Woo et al., “Developing a fully glycosylated full-length SARS-COV-2 spike protein model in a viral membrane,” Journal of Physical Chemistry B, vol. 124, no. 33, pp. 7128–7137, Aug. 2020. [CrossRef]
- B. Zheng et al., “S373P Mutation Stabilizes the Receptor-Binding Domain of the Spike Protein in Omicron and Promotes Binding,” JACS Au, vol. 3, no. 7, pp. 1902–1910, Jul. 2023. [CrossRef]
Disclaimer/Publisher’s Note: The statements, opinions and data contained in all publications are solely those of the individual author(s) and contributor(s) and not of MDPI and/or the editor(s). MDPI and/or the editor(s) disclaim responsibility for any injury to people or property resulting from any ideas, methods, instructions or products referred to in the content. |
© 2025 by the authors. Licensee MDPI, Basel, Switzerland. This article is an open access article distributed under the terms and conditions of the Creative Commons Attribution (CC BY) license (http://creativecommons.org/licenses/by/4.0/).


