1. Introduction
This project aims at an accurate and efficient detection of COVID-19 (C19) carried out for the design and development of advanced deep learning (DL) and transfer learning (TL) techniques. These techniques use large datasets of medical images, such as CT scans and chest X-rays, to identify anomalies and patterns associated with the virus. By training neural networks to recognize these specific features, the system can assist in rapid screening and diagnosis. The goal is to provide a reliable, non-invasive, and cost-effective diagnostic tool that can serve as an alternative or supplement to the traditional Reverse Transcription Polymerase Chain Reaction (RT-PCR) test, which, although widely used, often requires more time and specialized laboratory equipment, has a reported sensitivity (Sn) of approximately 59%, and can be prone to false negatives [
1]. The implementation of AI-driven diagnostic methods could significantly enhance early detection, especially in resource-constrained settings or during mass outbreaks.
Since the outbreak of C19 in December 2019, the pandemic has had a devastating global impact, resulting in more than 7.1 million reported deaths and over 776 million confirmed cases to date [
2]. Building on a foundational grasp of machine learning (ML) principles, algorithms, and their healthcare applications, this work incorporated an extensive review of literature on C19 and related respiratory illnesses such as viral pneumonia (VP), focusing on their clinical and radiological distinctions. Understanding disease characteristics and progression patterns was vital for addressing diagnostic complexities. Subsequently, DL approaches were explored for their potential in analyzing medical images to detect C19 and similar conditions. This integrated study provided a coherent framework for using advanced computational models to enhance diagnostic accuracy and support informed clinical decision-making.
This study presents advanced neural network methods for rapid and accurate C19 detection from chest radiographs, supporting clinicians and aiding medical training. It addresses diagnostic challenges across age groups, especially differentiating scans of young and elderly patients. C19, caused by SARS-CoV-2, is a highly contagious respiratory disease marked by lung inflammation and symptoms like breathing difficulty, fever, and dry cough [
3]. Since its outbreak, it has infected 16–28 million people globally, with older adults at higher risk due to weaker immunity and comorbidities, while children often show mild or no symptoms, complicating diagnosis [
2]. This approach aims to improve early detection, essential for effective disease control.
C19 symptoms vary widely, with fever reported in about 81% of patients, cough in 58%, and dyspnea and sputum production in roughly 25% of cases. Patients also commonly experience headaches, breathing difficulties, and fatigue, which may worsen as the infection advances. Accurate diagnosis depends on laboratory and imaging tests: RT-PCR is the gold standard for detecting viral genetic material, while radiological tools like CT scans and chest X-rays identify lung abnormalities such as ground glass opacities. Serological tests help detect prior exposure and support epidemiological studies.[
3]. Treatment options vary according to disease severity, including corticosteroids to reduce inflammation, anticoagulants to prevent blood clots, supplemental oxygen, and mechanical ventilation for severe respiratory failure. Additionally, rehabilitation therapies assist recovery from severe illness and long C19 symptoms, aiming to restore lung function and improve quality of life [
4].
While C19 and pneumonia share respiratory symptoms, they differ in cause, lung involvement, and radiographic features. C19, caused by SARS-CoV-2, usually affects both lungs simultaneously, especially the lower lobes, whereas pneumonia, caused by bacteria, viruses, or fungi, often presents as a localized infection in one lung with a more diffuse or patchy pattern. On chest X-rays, C19 consolidations appear denser and irregular, primarily in lower zones, while pneumonia consolidations are less dense and better defined. Pleural effusion is generally minimal or absent in C19 but more common and pronounced in bacterial pneumonia, signaling greater inflammation or complications. These differences are vital for accurate diagnosis and treatment planning [
5].
C19 can cause multiple complications, especially in moderate to severe cases or those with pre-existing conditions. Common issues include pneumonia, characterized by lung inflammation and fluid buildup often affecting both lungs, lung opacity (LO) visible on imaging, and in severe cases, Acute Respiratory Distress Syndrome (ARDS), which necessitates intensive care. Bronchitis and long-term pulmonary fibrosis may also develop, impairing lung function and breathing. Early diagnosis and management are crucial to reduce such complications. Treatment faces challenges due to limited antiviral efficacy and the continuous emergence of SARS-CoV-2 variants that can evade immune responses, complicating vaccination and therapy efforts. Vaccine hesitancy and misinformation further hinder control measures. Diagnostic hurdles include the lengthy RT-PCR testing process, limited ability to detect new variants, and radiological similarities between C19 and other respiratory illnesses like pneumonia and bronchitis, making differential diagnosis difficult.
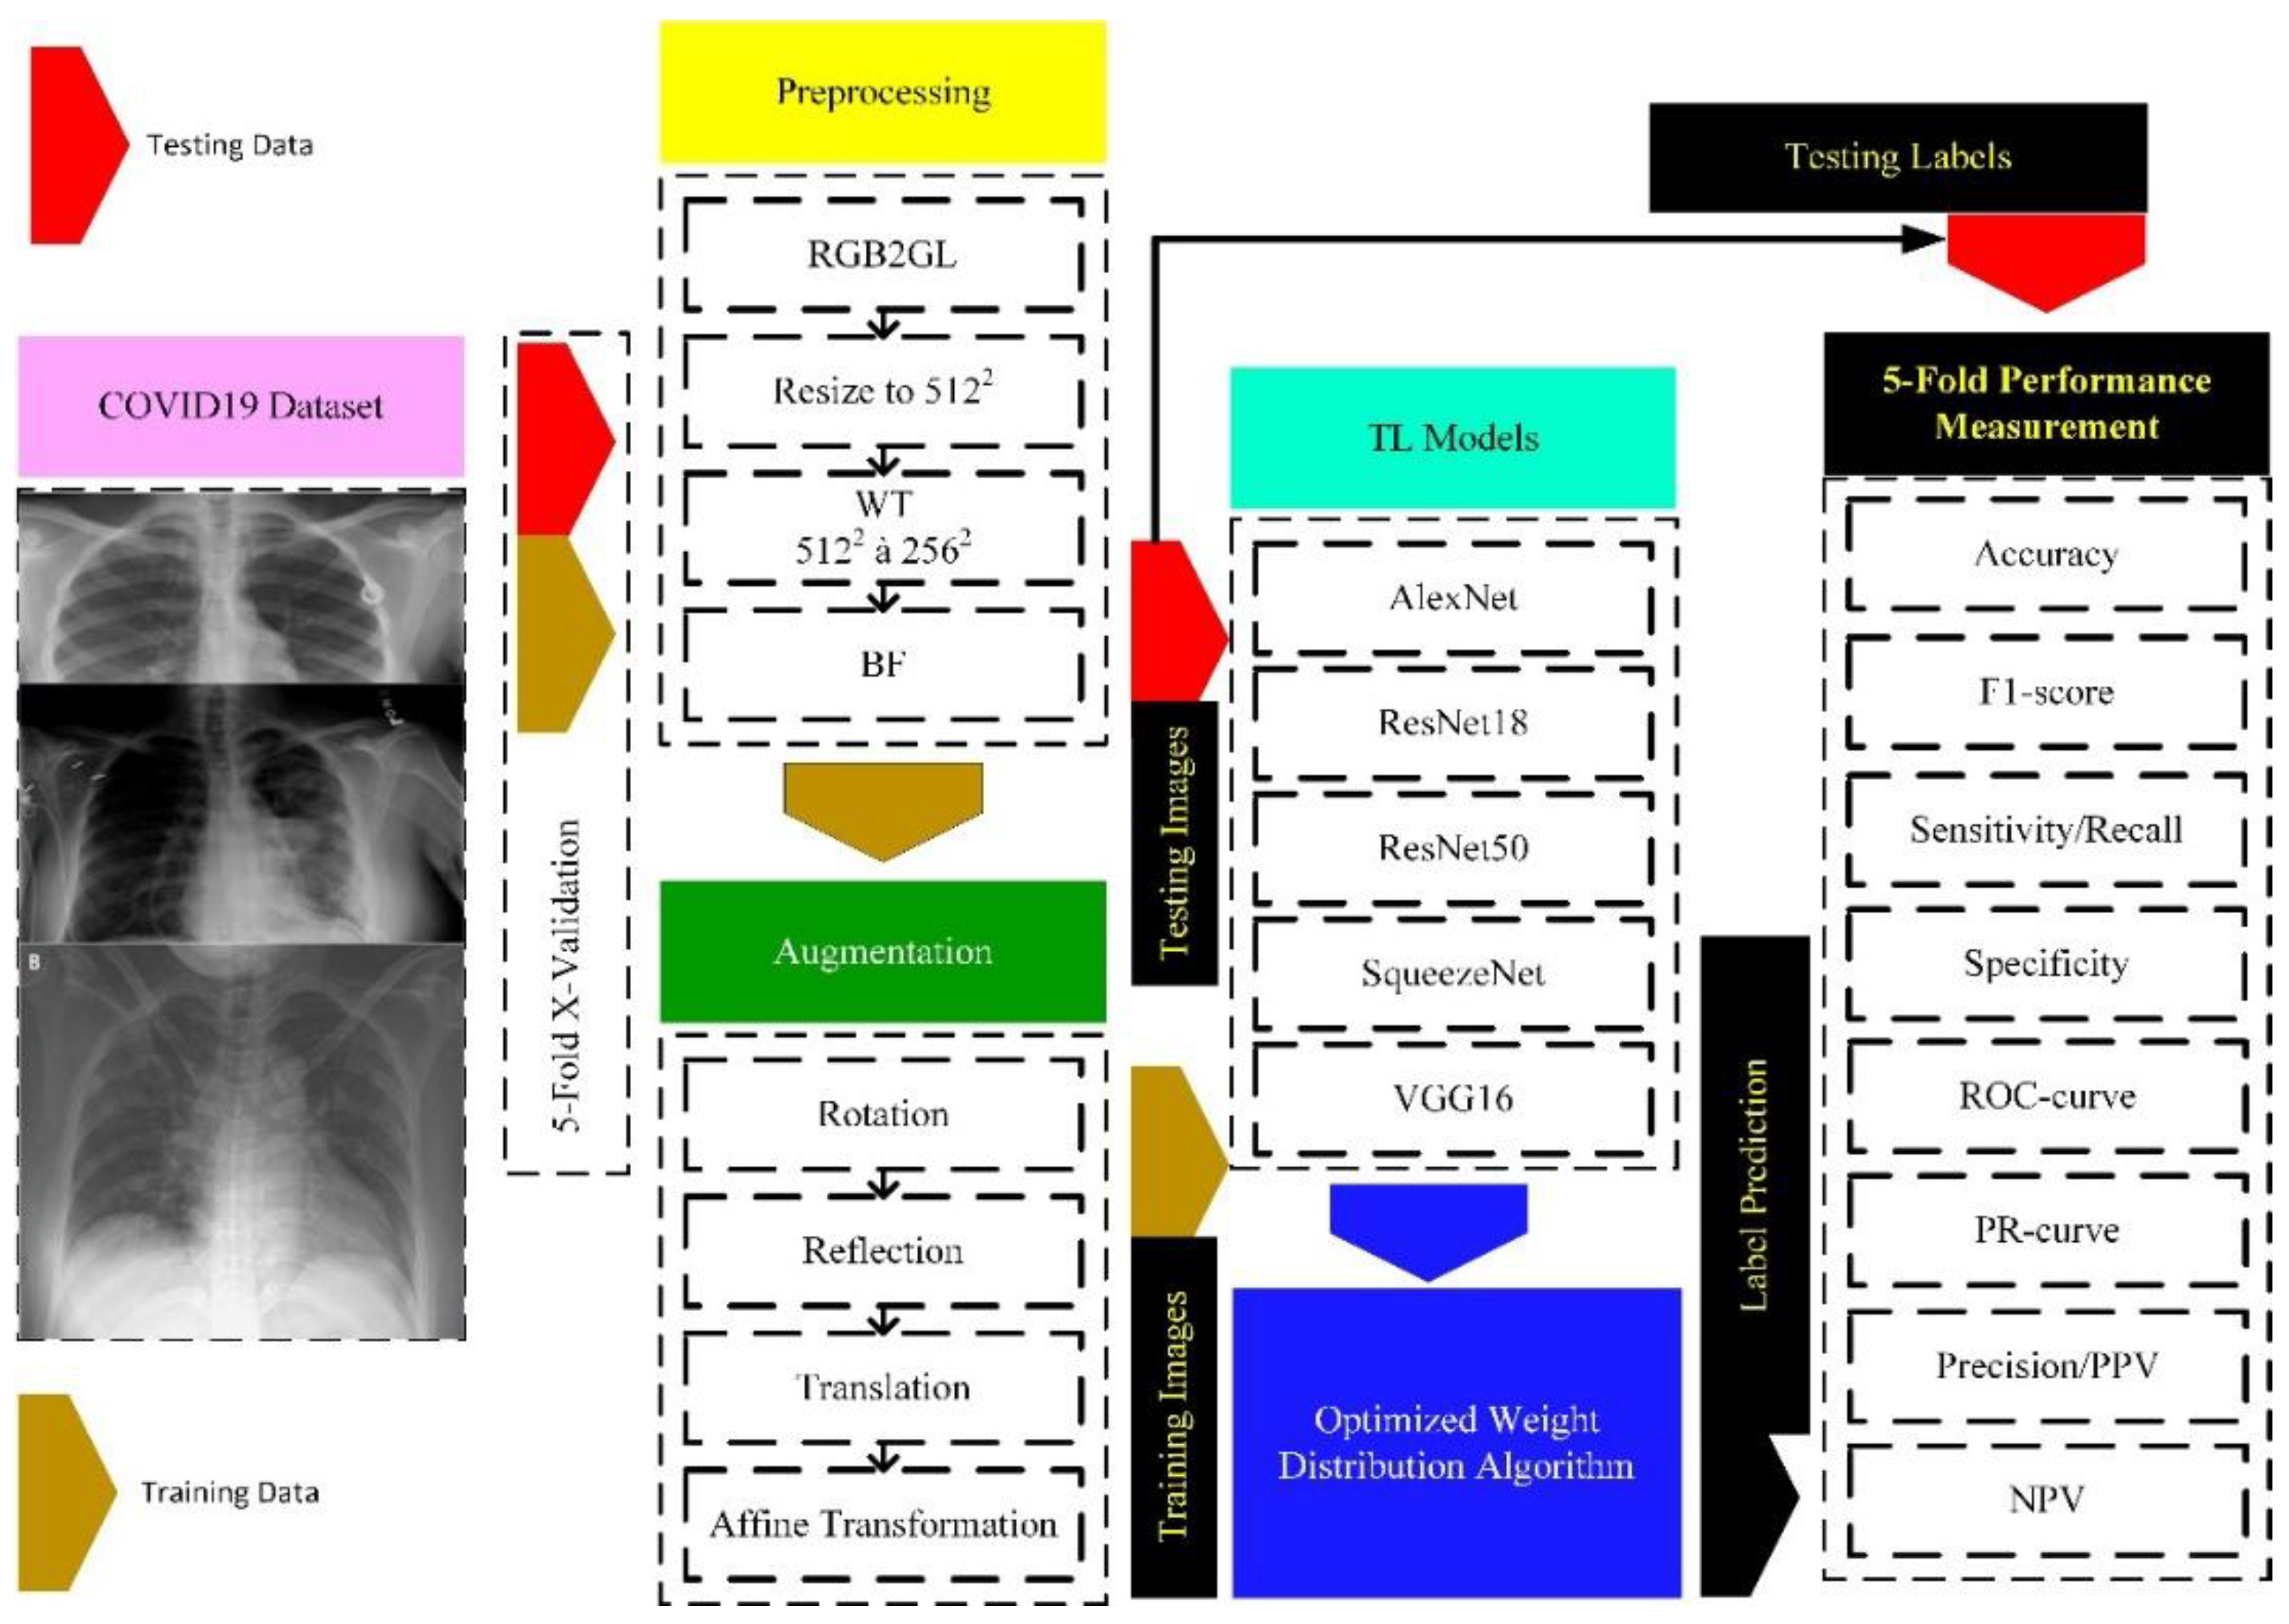
In this study, we employed large deep learning architectures with pretrained weights in TL mode. Based on prior research, we selected five algorithms as potential backbones. The results of each architecture are post-processed using an ensemble weight-optimized distribution algorithm, which mitigates model bias and provides more reliable results for C19 patients, making it clinically preferable to a single DL strategy. Outlined below are the principal contributions of this article.
The article proposes the design and implementation of DL-based TL methods tailored for the robust detection of C19 from chest radiographs and CT scans using a weight-optimized distribution algorithm. The metrics, from each of the large DL architectures, are normalized by dividing each metric by the sum of the corresponding metrics from all models. This normalization ensures that each metric’s influence is proportional to the individual performance of each of the five models.
It uses an extensive dataset with variations to make it more challenging. The good classification ability of Class A could negatively impact the performance of Classes B and C due to feature dominance. We have used the first three classes (C19, LO, N) to make the task challenging. The last class achieves outstanding results, specifically, due to its discriminative characteristics, which can otherwise lead to negatively biased performance.
It explicitly tackles the variation in imaging features across five different DL algorithms, improving differentiation between C19 manifestations in young versus elderly patients.
The study addresses limitations of the traditional RT-PCR test, such as lower Sn (~59%), longer turnaround times, and the need for specialized laboratories, by offering a non-invasive, cost-effective AI-based diagnostic tool suitable for resource-limited settings.
Support for Clinical Decision-making and Medical Education: Beyond assisting radiologists with a reliable second opinion in image interpretation, the proposed framework presents a valuable educational tool for medical graduates.
This article is organized into four sections.
Section 1 provides an introduction, outlining the background and significance of the study on C19. The materials and methods used in this work are detailed in
Section 2, whereas the
Section 3 presents the results and a comprehensive discussion, evaluating the performance of the proposed model in comparison to existing methods. Finally,
Section 4 concludes the article by summarizing the key findings and discussing the potential implications of the research.
1.1. Related Work
C19, caused by the SARS-CoV-2 virus, is a rapidly spreading infectious disease that has led to a global health crisis and significant mortality worldwide [
6]. Early symptoms commonly include fever, respiratory distress, pneumonia, and reduced white blood cell count. The RT-PCR technique is the primary diagnostic method, as it detects viral RNA; however, a negative result does not fully rule out infection. Consequently, medical imaging modalities such as chest X-rays are often employed as supplementary diagnostic tools [
7]. The integration of AI into healthcare has expanded considerably with the increasing availability of large-scale datasets. Using extensive collections of chest X-ray and CT images, AI can facilitate disease detection, predict patient outcomes, and recommend optimal treatment strategies, thereby enhancing diagnostic accuracy and efficiency [
8]. In this context, researchers have extensively explored deep neural networks and ensemble learning techniques for their potential in detecting C19 from chest radiographs.
Jouibari et al. [
9] utilized a private dataset from a local hospital containing both emergency and routine cases. They applied TL with 11 well-known neural networks, with ResNet50 achieving an accuracy of 95.00%. To improve classification between cases, ensemble-learning methods such as majority voting and error-correcting output codes were employed. Similarly, Srinivas et al. [
10] worked with a dataset of 243 chest X-rays, including 191 COVID-positive and 122 Normal (N) cases. Their hybrid V3-VGG architecture comprised four blocks: the first used VGG16, the second and third employed InceptionV3, and the fourth incorporated average pooling, dropout, a fully connected layer, and Softmax. This model reached 98.00% accuracy.
Kolhar et al. [
8] evaluated the effectiveness of DL models VGG16 and ResNet50 in detecting tuberculosis, C19, and healthy lungs from chest X-rays. ResNet50 demonstrated precision and recall rates close to 99.00%, while VGG16 performed well in tuberculosis detection. Kumar et al. [
11] used CNNs to automatically extract features, removing the need for manual feature selection. Their CXNet-based model classified images as N, C19, or pneumonia with an accuracy of 98.00%.
Fernandaz-Miranda et al. [
12] trained the VGG16 CNN model on three datasets from different institutions. Although hyperparameters remained consistent, the model’s performance dropped by up to 8.00% when images from a different manufacturer were included. Variations in device response and image processing led to performance reductions of 18.90% and 9.80% in separate instances. Brunese et al. [
13] proposed a three-phase approach: detecting pneumonia presence, classifying C19 and pneumonia using VGG16, and localizing affected regions with GRAD-CAM. Using a dataset of 6,523 images, they achieved 93.00% accuracy.
Nayak et al. [
14] conducted a comprehensive comparison of DL models such as AlexNet, VGG16, and ResNet-34, finding ResNet-34 to be the most effective with 98.33% accuracy, making it a strong candidate for early C19 detection. Correspondingly, Zhang et al. [
15] applied DL to 1,531 chest X-rays, achieving 96.00% accuracy for C19 cases and 70% for non-COVID cases. They also used Grad-CAM for lung region localization. Arias-Londono et al. [
16] investigated the impact of data preprocessing on model performance, demonstrating that appropriate preprocessing of 79,500 X-ray images enhanced both accuracy and explainability.
Similarly, Vaid et al. [
17] employed TL with CNNs on publicly available chest radiographs, reaching 96.30% accuracy. Their confusion matrix showed 32 true positives for C19, confirming the model’s clinical reliability. Kassania et al. [
18] compared feature extraction frameworks and identified that DenseNet121 combined with a Bagging Tree classifier yielded the highest accuracy of 99.00% for C19 detection.
Hussain et al. [
19] developed CoroDet, achieving 99.10% accuracy in detecting C19, N, and pneumonia cases. In three-class case (C19, N, pneumonia), the model reached 94.30% accuracy, while in four-class classification (C19, N, VP, bacterial pneumonia (BP)) it achieved 92.10%. Similarly, Ismael et al. [
20] employed ResNet50 for C19 classification, attaining 94.70% accuracy with fine-tuned models.
Xu et al. [
21] proposed a DL approach for differentiating C19 from influenza-A VP and healthy cases using pulmonary CT images. Their method first localized infection regions with a 3D DL model, then classified C19, IAVP, and non-infectious cases using a location-attention classification model. The Noisy-or Bayesian function was finally applied to determine the infection type for each CT case.
Ali Abbasian et al. [
22] optimized CNNs via TL, using ten architectures, AlexNet, VGG16, VGG-19, SqueezeNet, GoogleNet, MobileNet-V2, ResNet18, ResNet50, ResNet-101, and Xception, to distinguish C19 infections from non-C19 cases. Likewise, Li et al. [
23] designed the C19 detection neural network (COVNet) to classify C19, community-acquired pneumonia (CAP), and non-pneumonia cases. Lung regions were extracted using the U-Net [
24] segmentation method, and preprocessed images were passed to COVNet for predictions. Grad-CAM was applied to visualize key decision-making regions, improving model interpretability.
Hu et al. [
25] utilized a ShuffleNet V2-based CNN for C19 detection from chest CT images. The model extracted features from 1,042 CT scans, comprising 397 healthy, 521 C19, 76 bacterial pneumonia, and 48 SARS cases, and achieved 91.21% accuracy on an independent test set. Similarly, Wang et al. [
26] introduced COVID-Net, a deep CNN for C19 detection from chest X-ray (CXR) images, trained on the COVIDx dataset. The model initially classified non-infectious, non-C19, and C19 viral infection images, with GSInquire used to localize regions of interest. Generative synthesis was then applied to optimize both micro- and macro-architecture designs for COVID-Net.
Charmaine et al. [
27] compared multiple CNN models for classifying CT scans into C19, influenza VP, or non-infectious categories. The pipeline involved preprocessing CT images to identify lung regions, applying a 3D CNN for segmentation, classifying the infection type, and generating an analysis report for each sample using the Noisy-or Bayesian function.
Rohit et al. [
28] proposed a weighted consensus model to minimize false positives and false negatives in C19 detection. Within this framework, ML algorithms including Linear Regression, k-Nearest Neighbor, Random Forest, Support Vector Machine, and Decision Tree were applied. Each model predicted different classes, and normalized accuracy was computed for each class. Similarly, Sinra et al. [
29] employed an ensemble ML approach to classify chest X-ray images into N, C19, and LO categories. They used the random forest classifier with 5-fold CV, and applied thresholding for image segmentation.
Ahmad et al. [
30] designed a custom convolutional neural network (CNN) consisting of eight weighted layers, incorporating dropout and batch normalization (BN), and trained using stochastic gradient descent for 30 epochs. The model classified chest X-ray samples into C19, N, and pneumonia categories, achieving a precision score of 98.19%. Chen et al. [
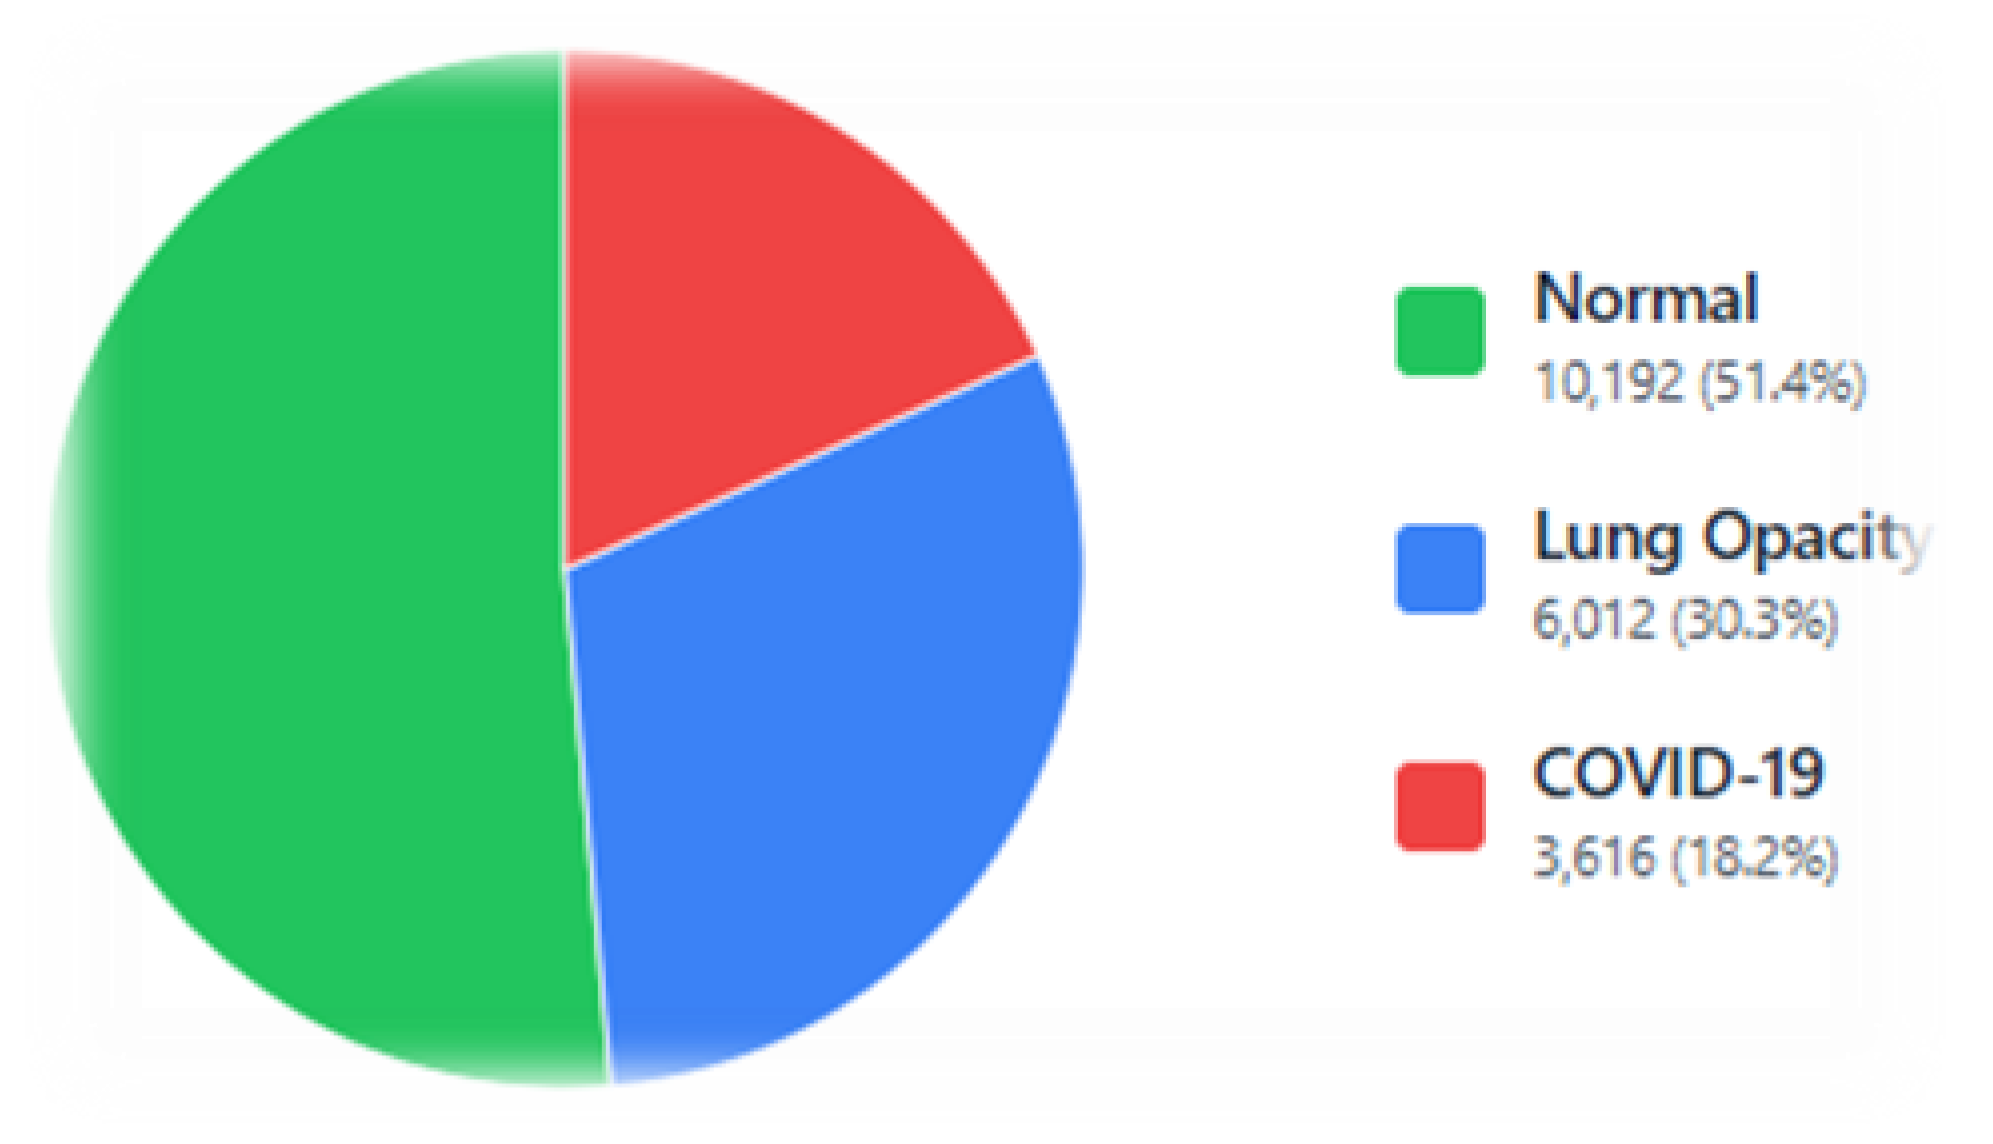
31] applied TL to classify X-ray images into C19, VP, LO, and N cases. They evaluated Efficient Neural Networks, multi-scale Vision Transformers, Efficient Vision Transformers, and standard Vision Transformers on 3616 C19, 6012 LO, 10192 N, and 1345 VP samples. The Vision Transformer achieved the highest accuracy, 98.58% (binary classification), 99.57% (three-class), and 95.79% (four-class).
Alamin et al. [
32] explored fine-tuning across various architectures using approximately 2,000 X-ray images. Xception, InceptionResNetV2, ResNet50, ResNet50V2, EfficientNetB0, and EfficientNetB4 achieved accuracies of 99.55%, 97.32%, 99.11%, 99.55%, 99.11%, and 100%, respectively, with EfficientNetB4 yielding the highest accuracy and an F1-score of 99.14%. Kirti et al. [
33] fine-tuned four deep TL models, ResNet50, DenseNet, VGG16, and VGG19, using an augmented dataset. VGG-19 delivered the best performance across both datasets.
Sunil et al. [
34] introduced CovidMediscanX, a framework combining custom CNN models with pre-trained and hybrid TL architectures for C19 detection from chest X-rays. The custom CNN achieved 94.32% accuracy, though its lower recall in labeling N cases indicated the need for further refinement. Yadlapali et al. [
35] combined fuzzy logic with DL to differentiate C19 pneumonia from interstitial pneumonia, employing a ResNet18 four-class classifier for C19, VP, N, and bacterial pneumonia. This approach achieved 97.00% accuracy, 96.00% precision, and 98.00% recall, outperforming other methods. Similarly, Dokumaci et al. [
36] classified X-ray images into C19, LO, and VP using a four-way classifier. Among evaluated CNN models, ConvNext achieved the highest performance, with 98.10% accuracy and 97.80% precision, demonstrating strong potential for early C19 diagnosis.
Our literature review was key to shaping this research. It helped us see what worked well in past studies and where the gaps were. This guided our choice of preprocessing methods, like bilateral filtering and discrete wavelet transform, to improve image quality. We also identified strong DL models, such as VGG16 and ResNet50, for our classification tasks.
3. Results and Discussion
The experiments were conducted on a Lenovo ThinkPad running Microsoft Windows 11 Pro (Build 26100) having an Intel® Core™ i7 processor (~2.59 GHz), 64 GB RAM, on an x64-based architecture, and a GPU is an NVIDIA Quadro P3200 with Max-Q Design (6 GB dedicated VRAM, 1792 CUDA cores).
In this study, we implemented evaluation of five widely used TL models, namely ResNet50, VGG16, AlexNet, SqueezeNet, and ResNet18, for the classification of C19 from chest radiographs [
62]. A 5-fold CV procedure was applied for training and validating purpose, ensuring stable results. The hyper-parameters such as batch size, learning rate, number of epochs, and optimizer selection were kept the same for all models run to ensure a fair comparison. The training process was monitored to prevent over-fitting and reach optimal performance levels on both training and validation sets.
3.1. AlexNet
In this section, a comprehensive evaluation of the classification capability of a pre-trained AlexNet model is conducted for identifying C19, LO, and N cases on chest X-rays.
Table 5 illustrates the results, showing the sensitivity analysis of the model’s performance across different epochs. There was improvement in performance scores with increase in epochs across all metrics. Sn increased from 90.39% to 95.23% , and Sp rose from 79.76% to 90.94% with epochs rising in the range [
1,
50]. The Pr trend demonstrated a steady improvement, increasing from 81.05% to 92.02% rising epochs in the range [
1,
50], with the NPV progressed from 90.54% to 92.02%. The ROC(AUC) values increased from 0.94 at to 0.95 by increasing epochs. A similar trend was observed in the PR(AUC) values, improving from 0.89 to 0.93, indicating a better performance. The F1-score rose significantly from 79.42% to 91.44%, highlighting the model’s improved performance. The overall
A of the model showed growth from 81.93% to 91.53% by increasing epochs from 1 to 50.
In
Figure 9, ROC curves are illustrated for the ResNet18 model. The ROC curve offers insight into detection trend versus false alarm rates. The ROC(AUC) value reflects the model’s overall classification skill, ranging from 1.0 (perfect) to 0.5 (none).
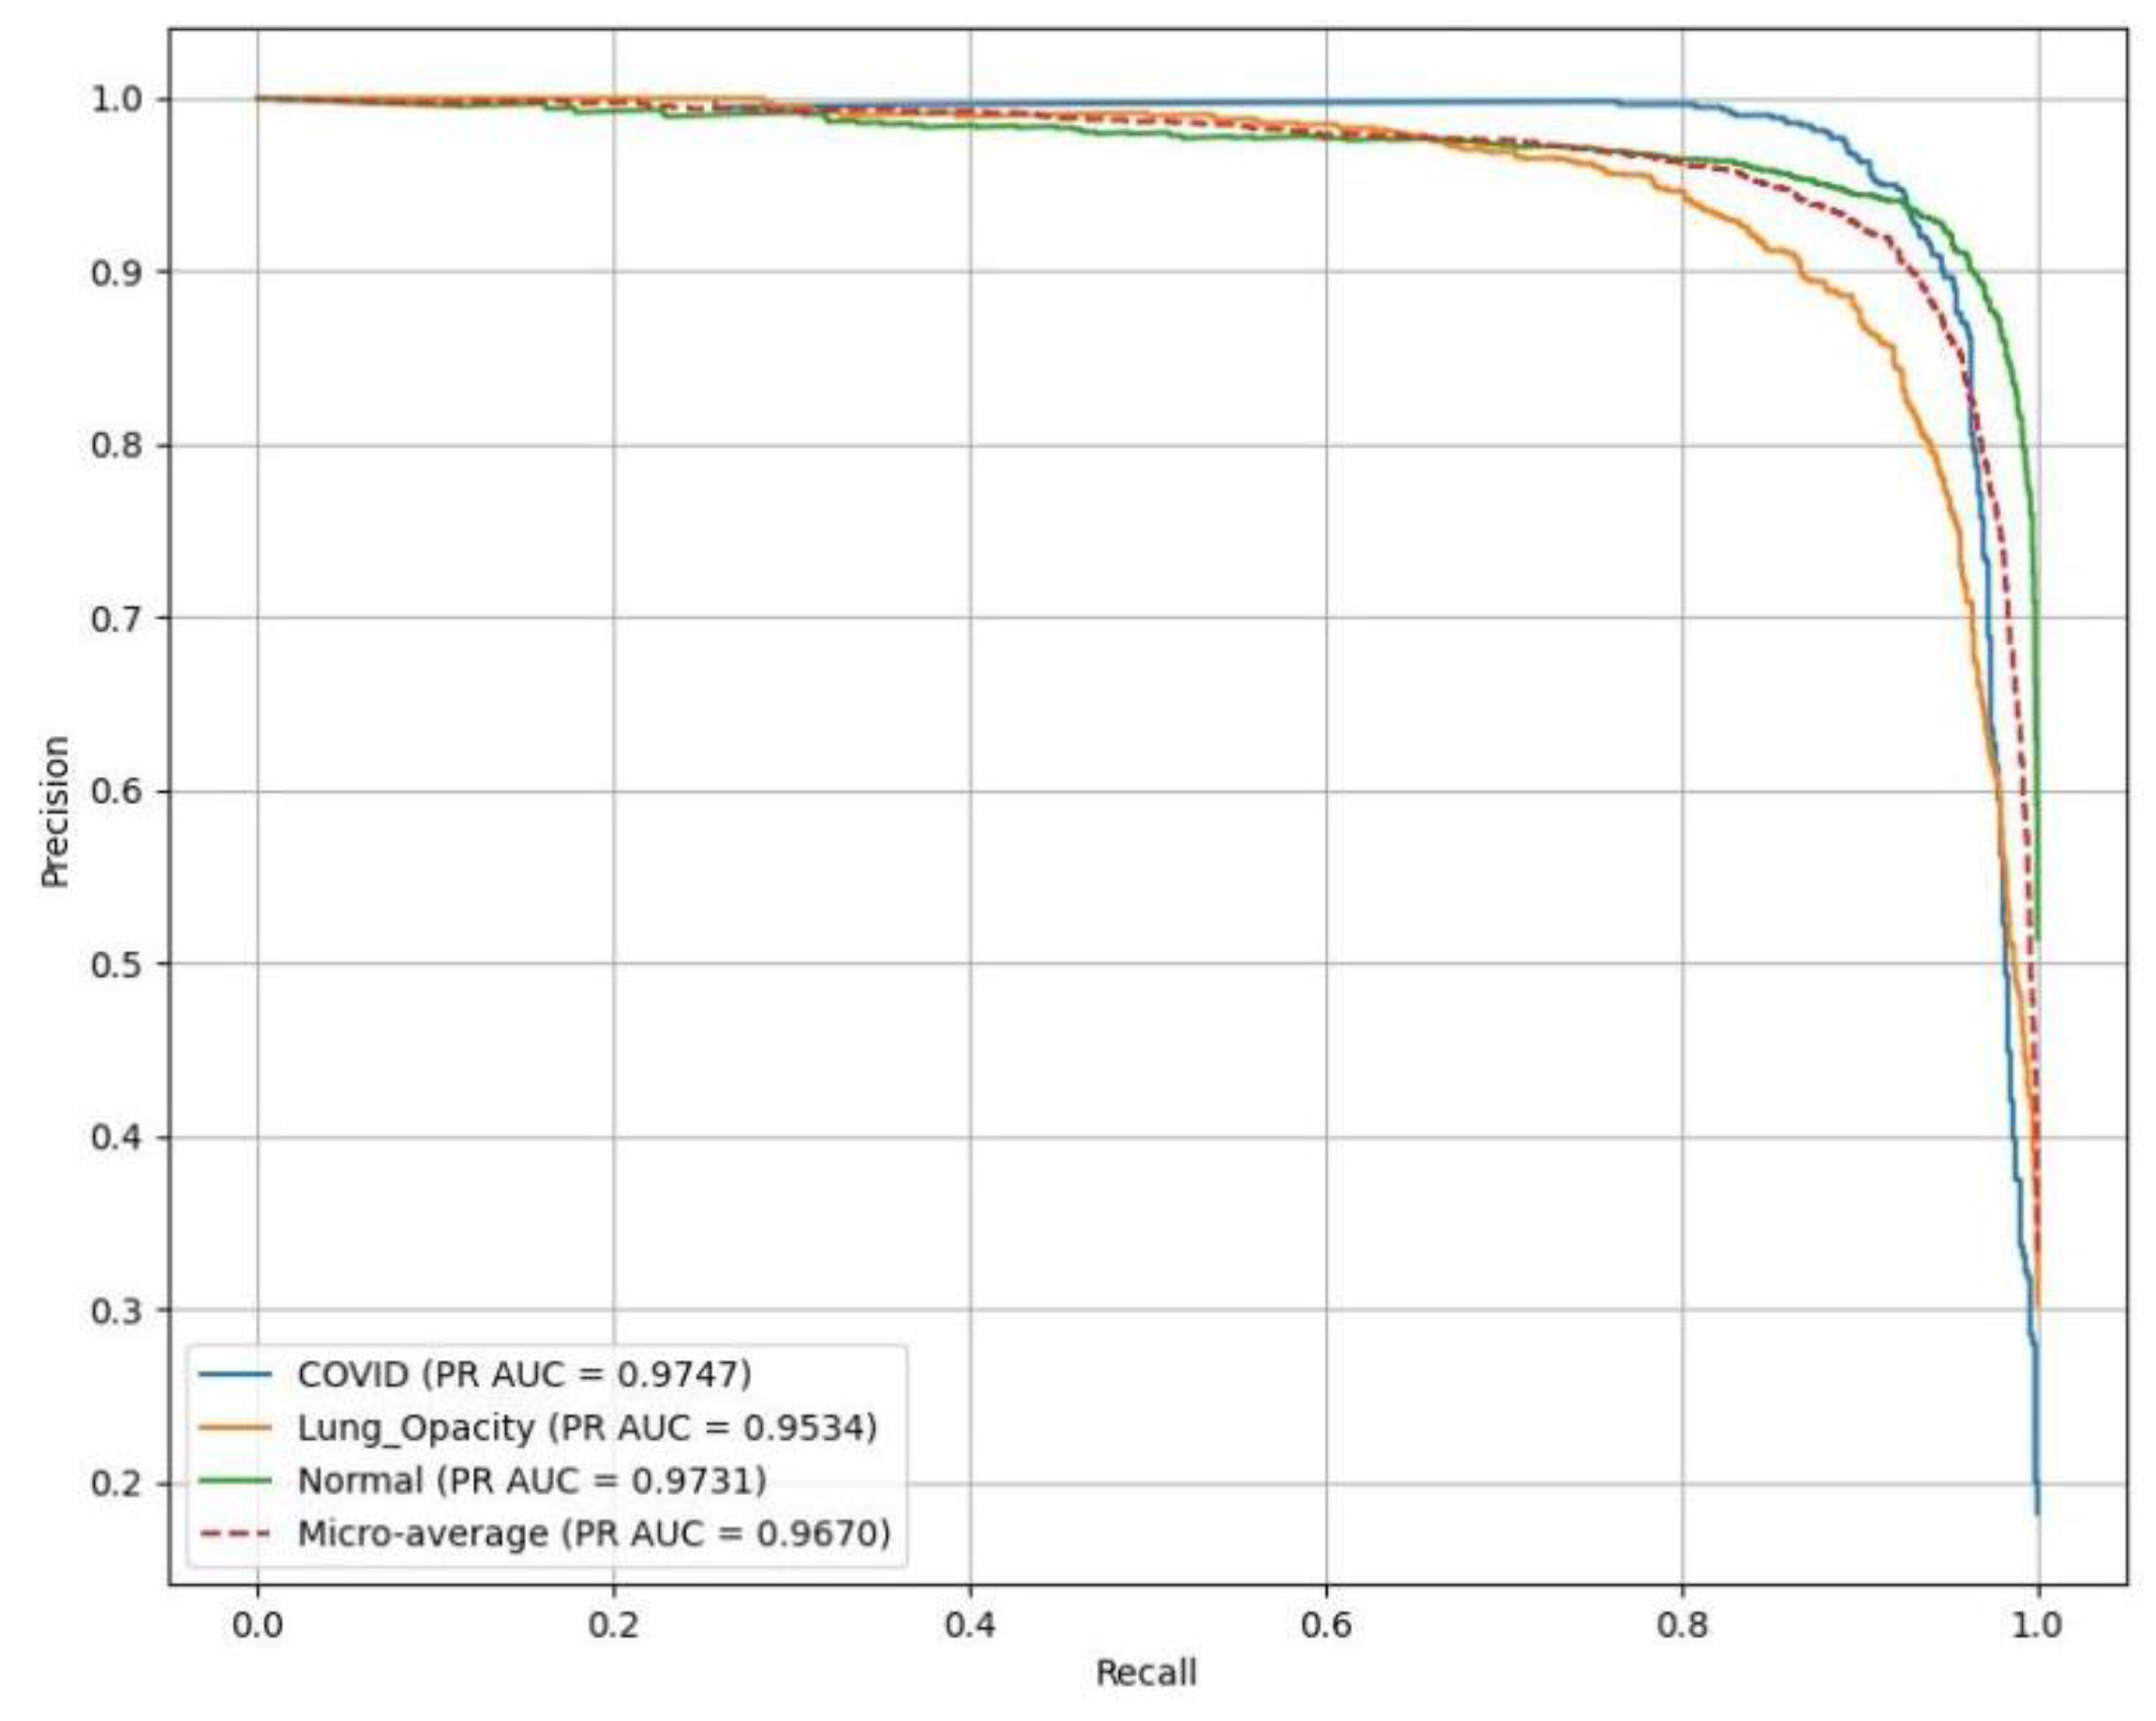
AlexNet resulted in excellent performance across all classes as illustrated in
Figure 10, with PR(AUC) values as follows: C19 (blue curve) achieves 0.97, LO (orange curve) reaches 0.95, reflecting high reliability in LO detection, and N (green curve) attains 0.97.
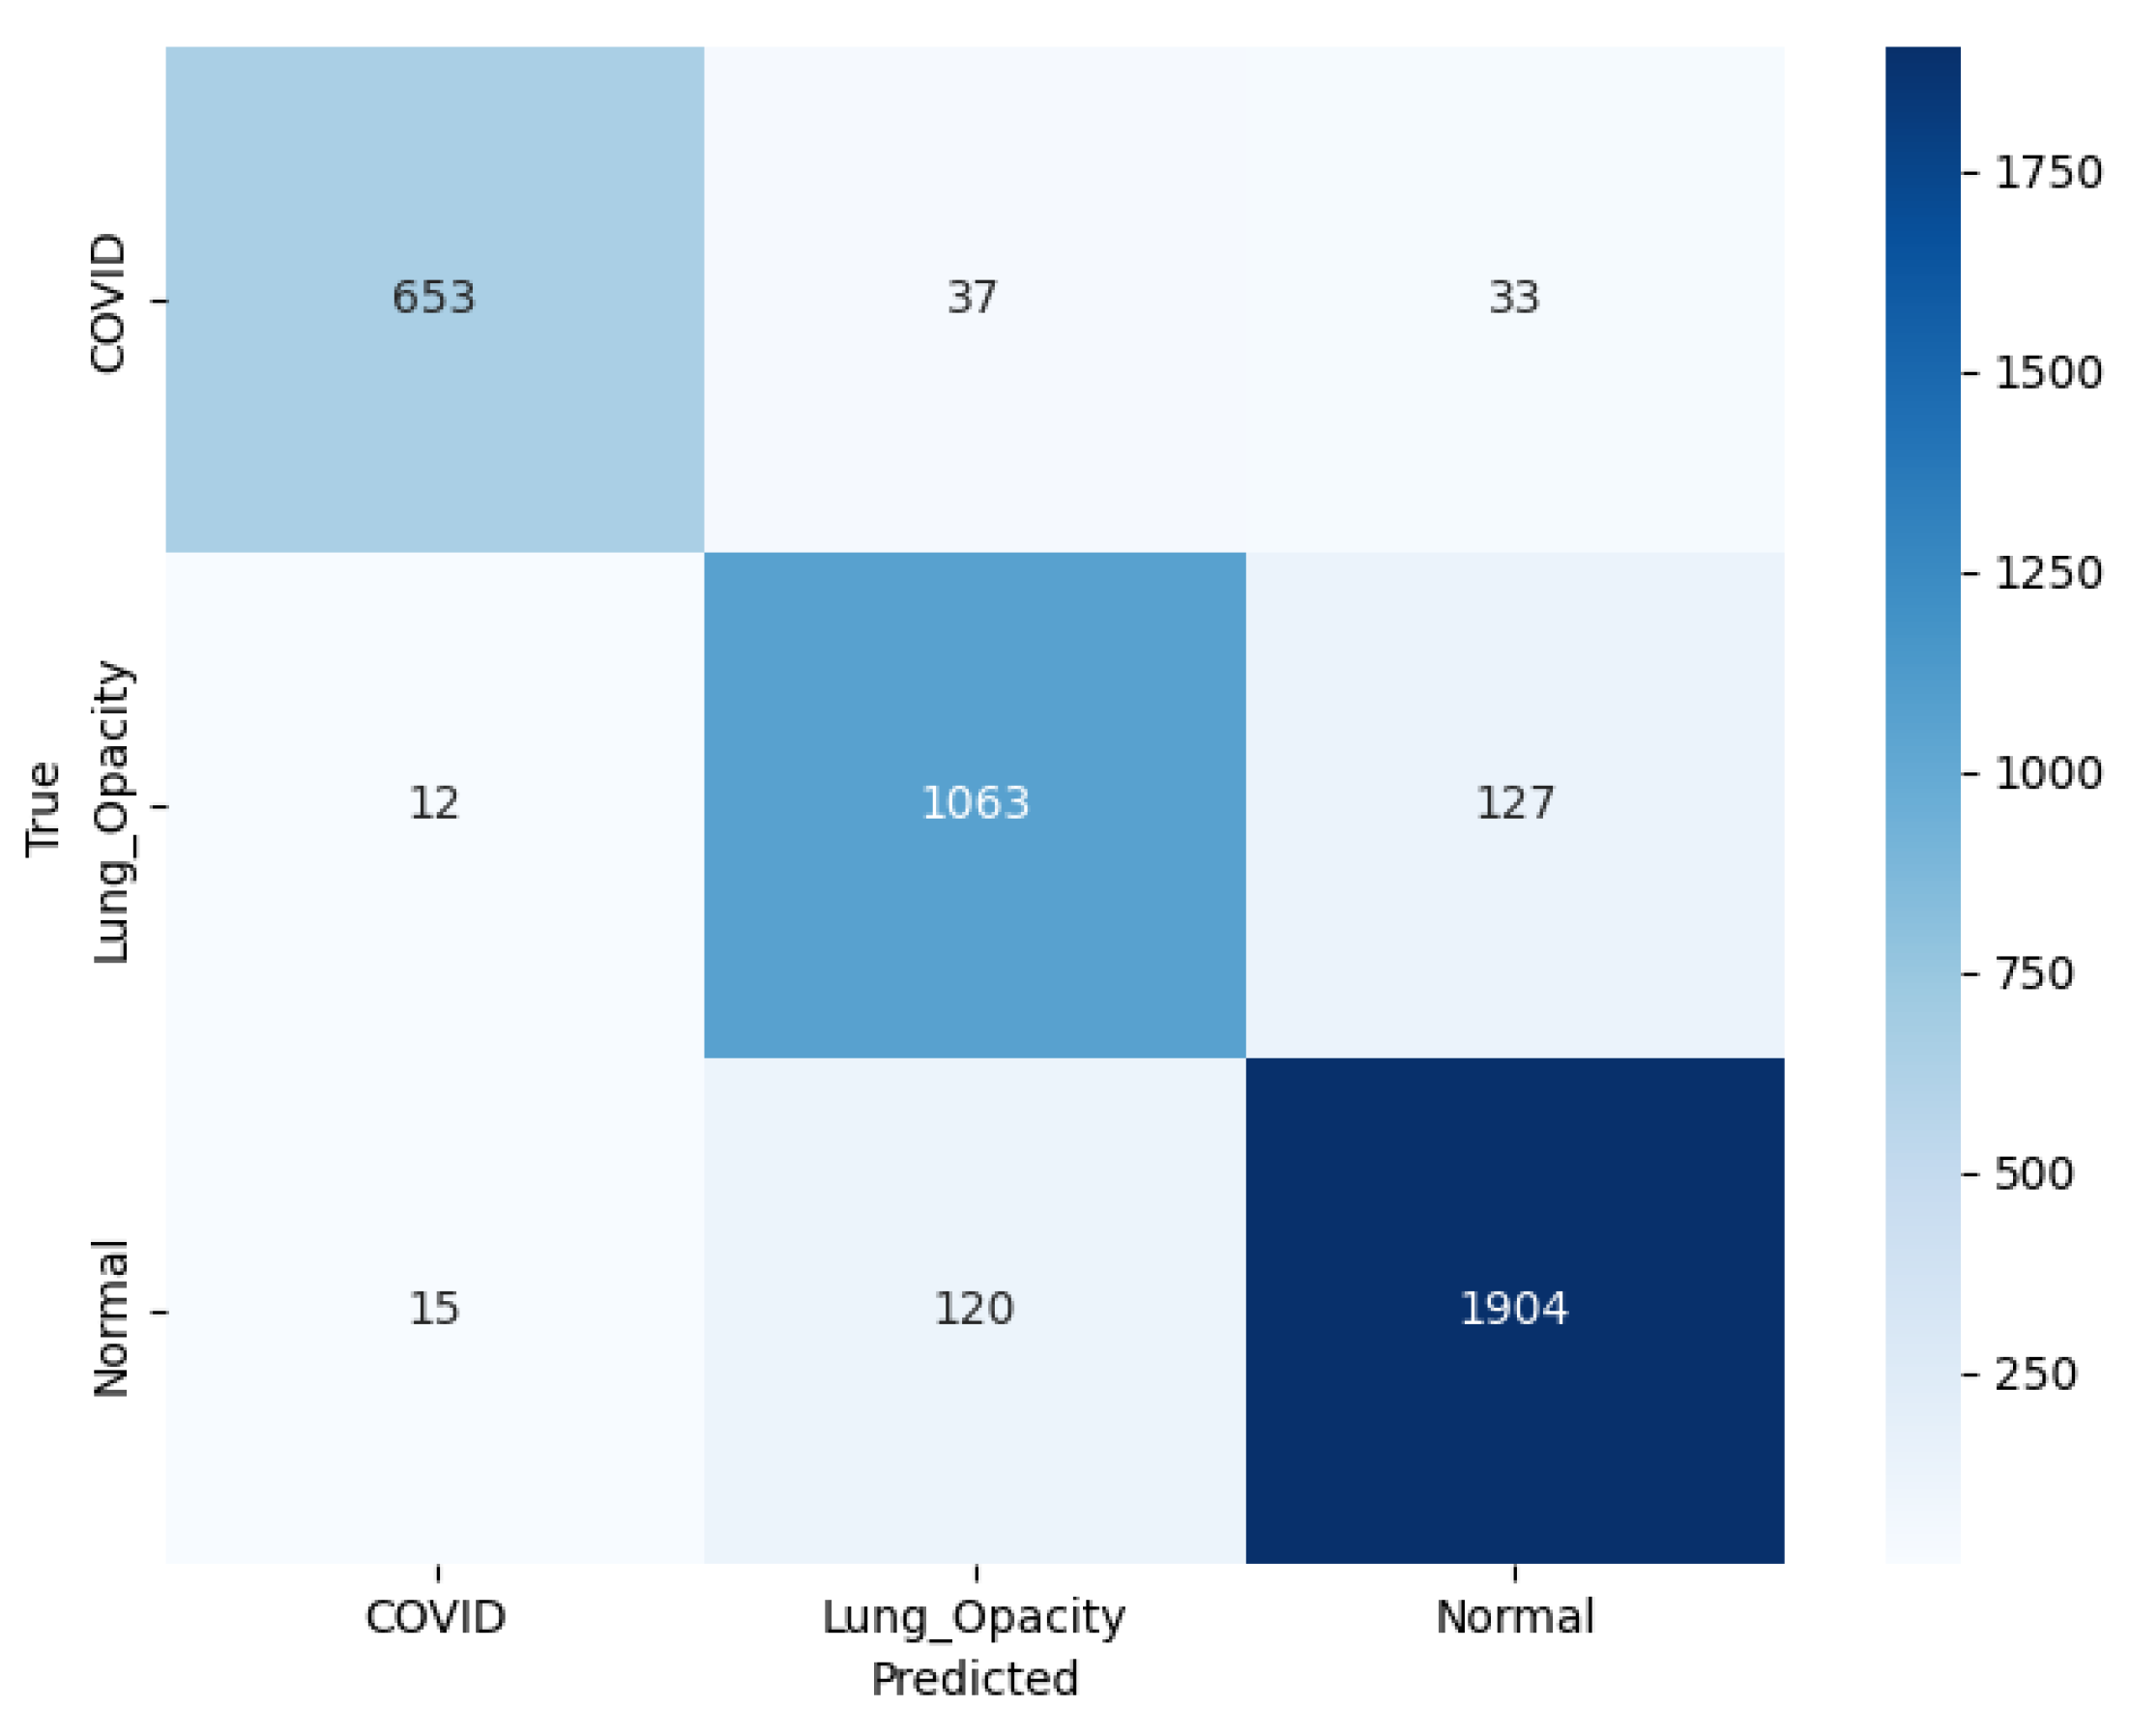
The confusion matrix for this experimentation with pre-trained AlexNet model is illustrated in
Figure 11. The model accurately predicted 653 C19 cases, with some misclassifications: 37 instances were identified as LO, and 33 as N. For the LO class, the model correctly identified 1063 cases, though 12 were misclassified as C19, and 127 as N. For the N class, the model achieved a high accuracy, correctly identifying 1904 cases, with only 15 misclassifications as C19 but 120 as LO. The color scale is a visual depiction of the occurrence of each category, with darker shades pointing higher values. Overall, the model demonstrates appropriate performance, particularly in distinguishing N from C19, but there is some feature similarity existing between LO and the remaining classes leading to lagging results.
3.2. ResNet18
The details related to the classification performance of a pre-trained ResNet18 model are discussed in this section under identical conditions defined in
Section 3. The classification performance of the ResNet18 model is illustrated in
Table 6. It is clear that as the number of epochs increases, the model’s performance improves. For example, at epoch 1, the
A is 85.76±1.58%, while at epoch 40, it reaches 92.74±0.50%. Specific metrics show consistent improvements, with Sp rising from 92.50±0.29% to 95.67±0.15% and Sp rising from 85.12±1.24% to 92.40±0.30% with epochs increasing in the range [
1,
40]. The model’s AUC for both ROC and PR curves follows a similar trend. This indicates that as the model trains over more epochs, it becomes more reliable in distinguishing between the various classes. Beyond epoch 40, overfitting is expected to impact generalization due to training on image noise, which hinders learning and affects testing results.
ResNet18 results are presented in
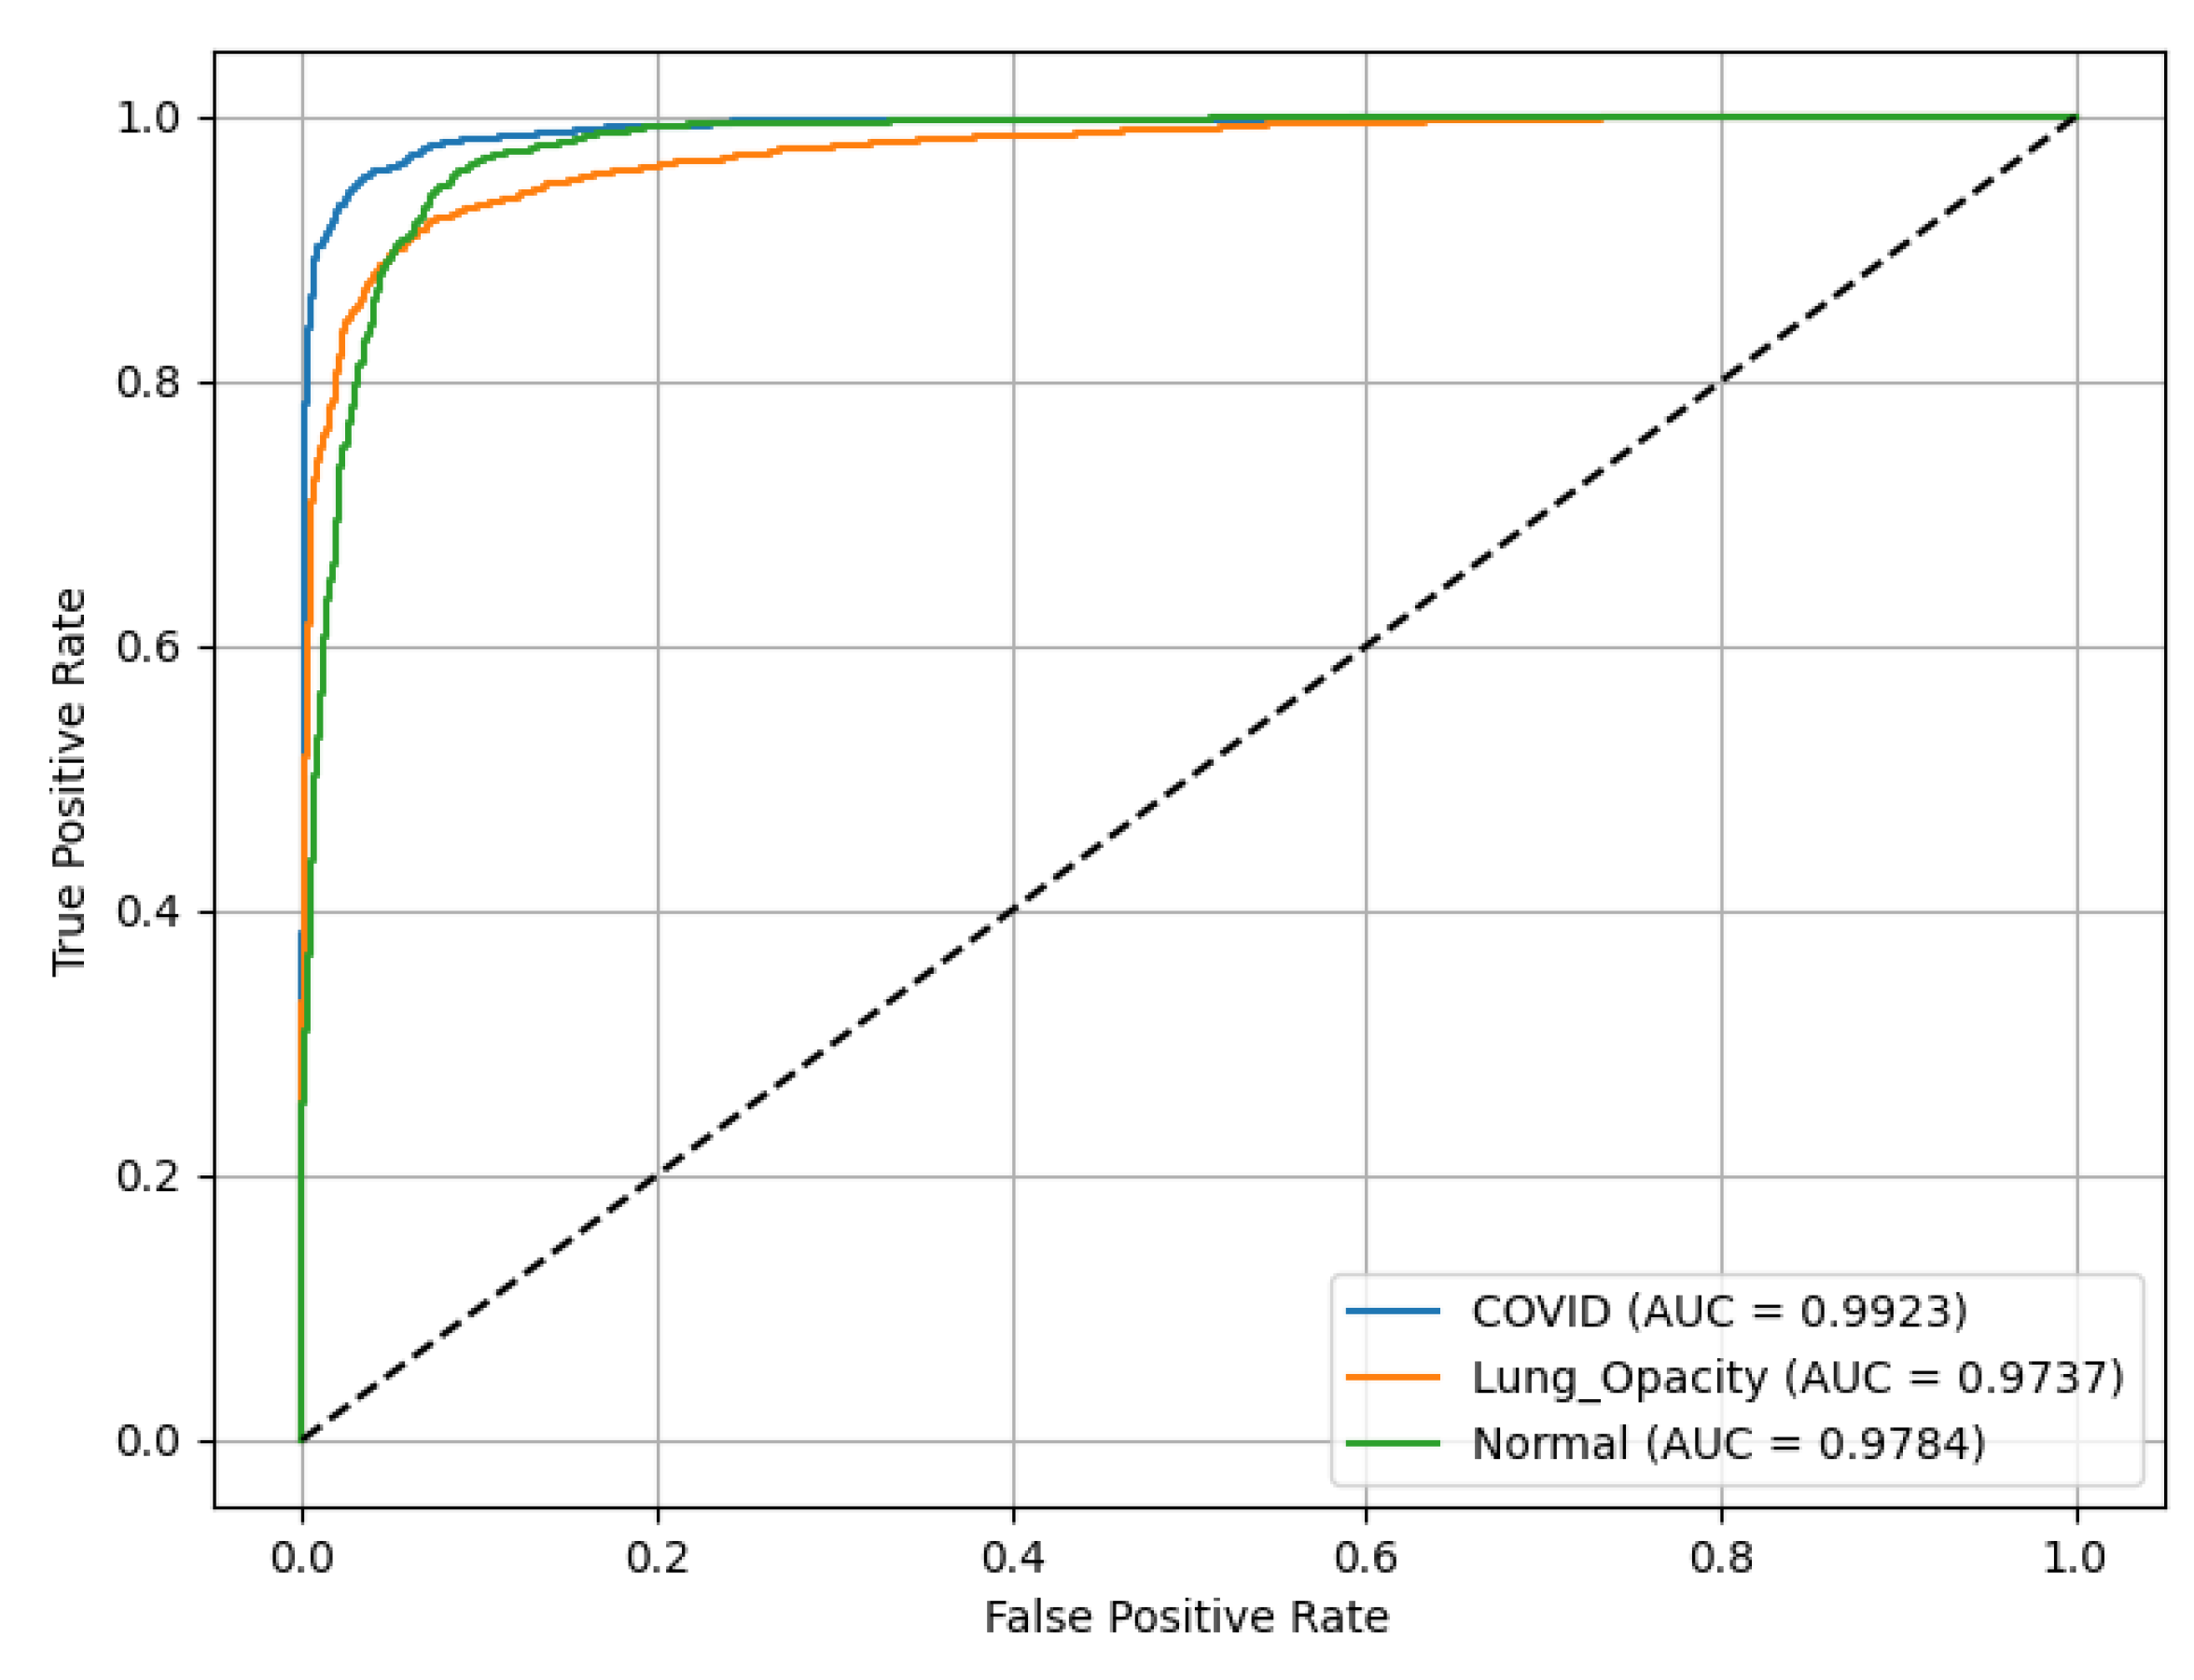
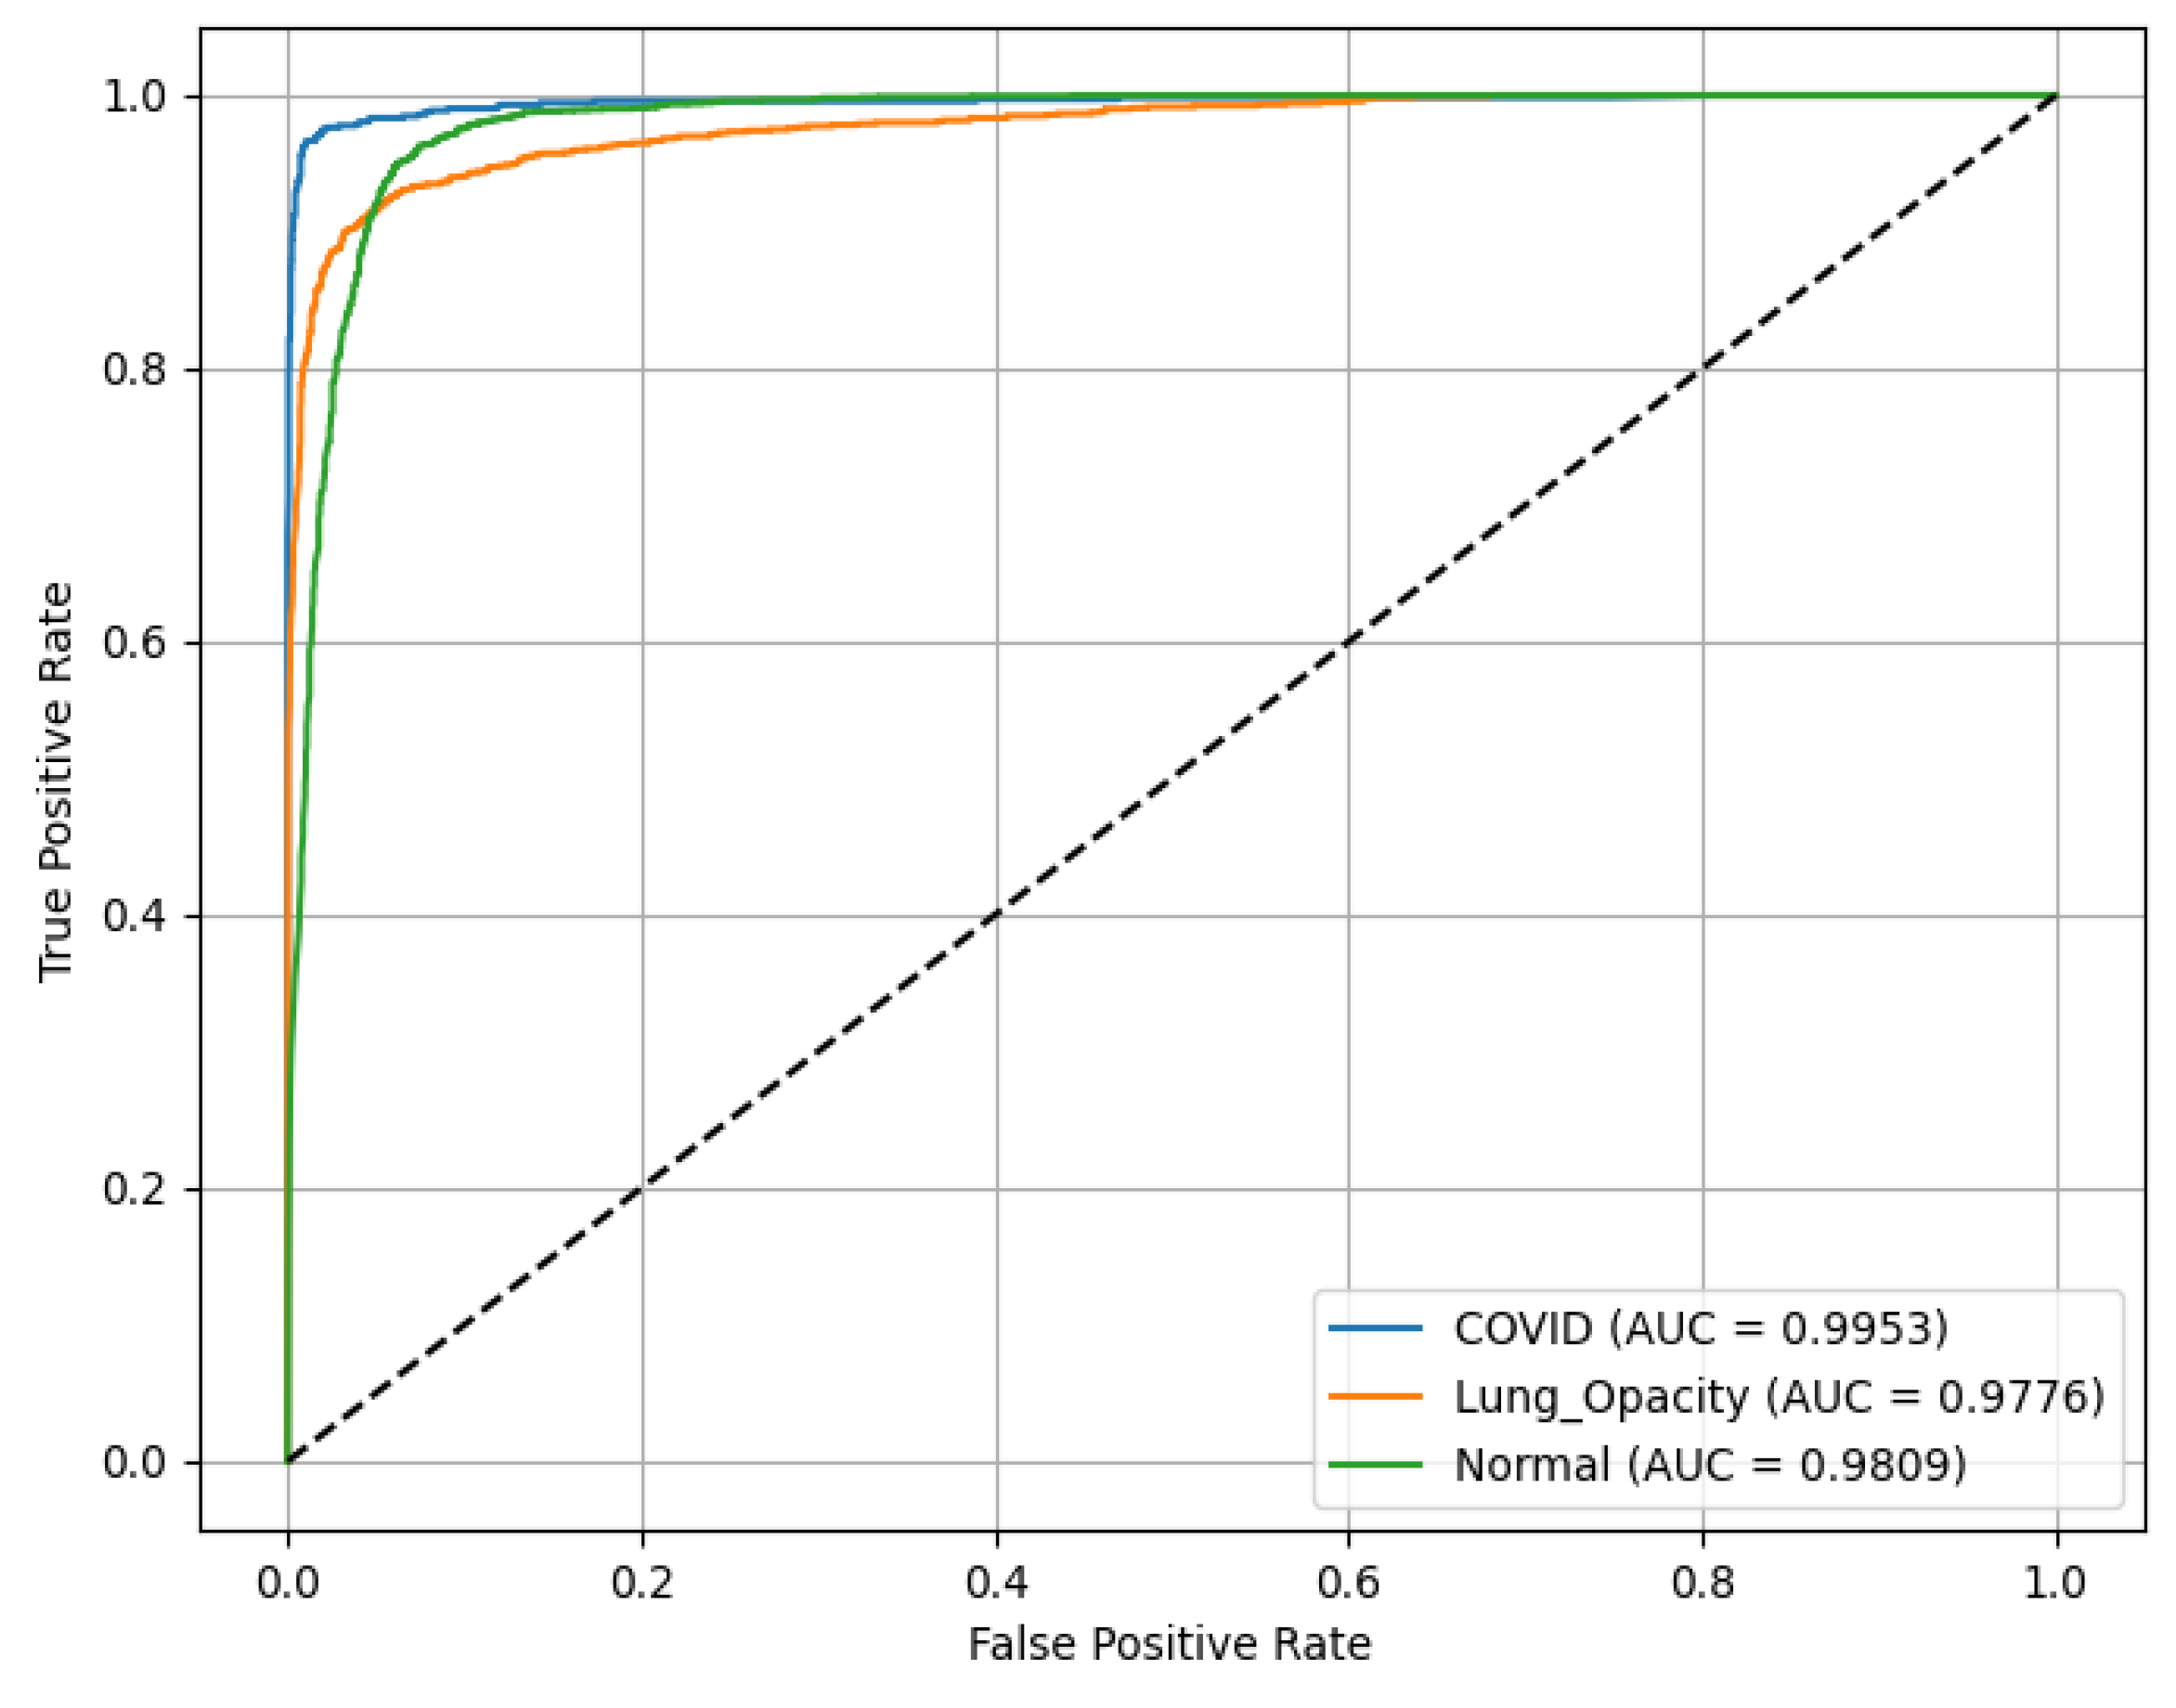
Figure 12, demonstrating discriminative ability across all classes. The ROC(AUC) values are as follows: C19 (blue curve) achieves an ROC(AUC) of 0.99, indicating excellent performance in identifying C19 cases. LO (orange curve) has an AUC of 0.97, reflecting high accuracy in detecting LO; and N (green curve) records an AUC of 0.98, showing robust classification of N cases. The diagonal line (dashed) represents a random classifier (AUC = 0.5) for reference, highlighting the model’s superior performance well above chance level across all categories.
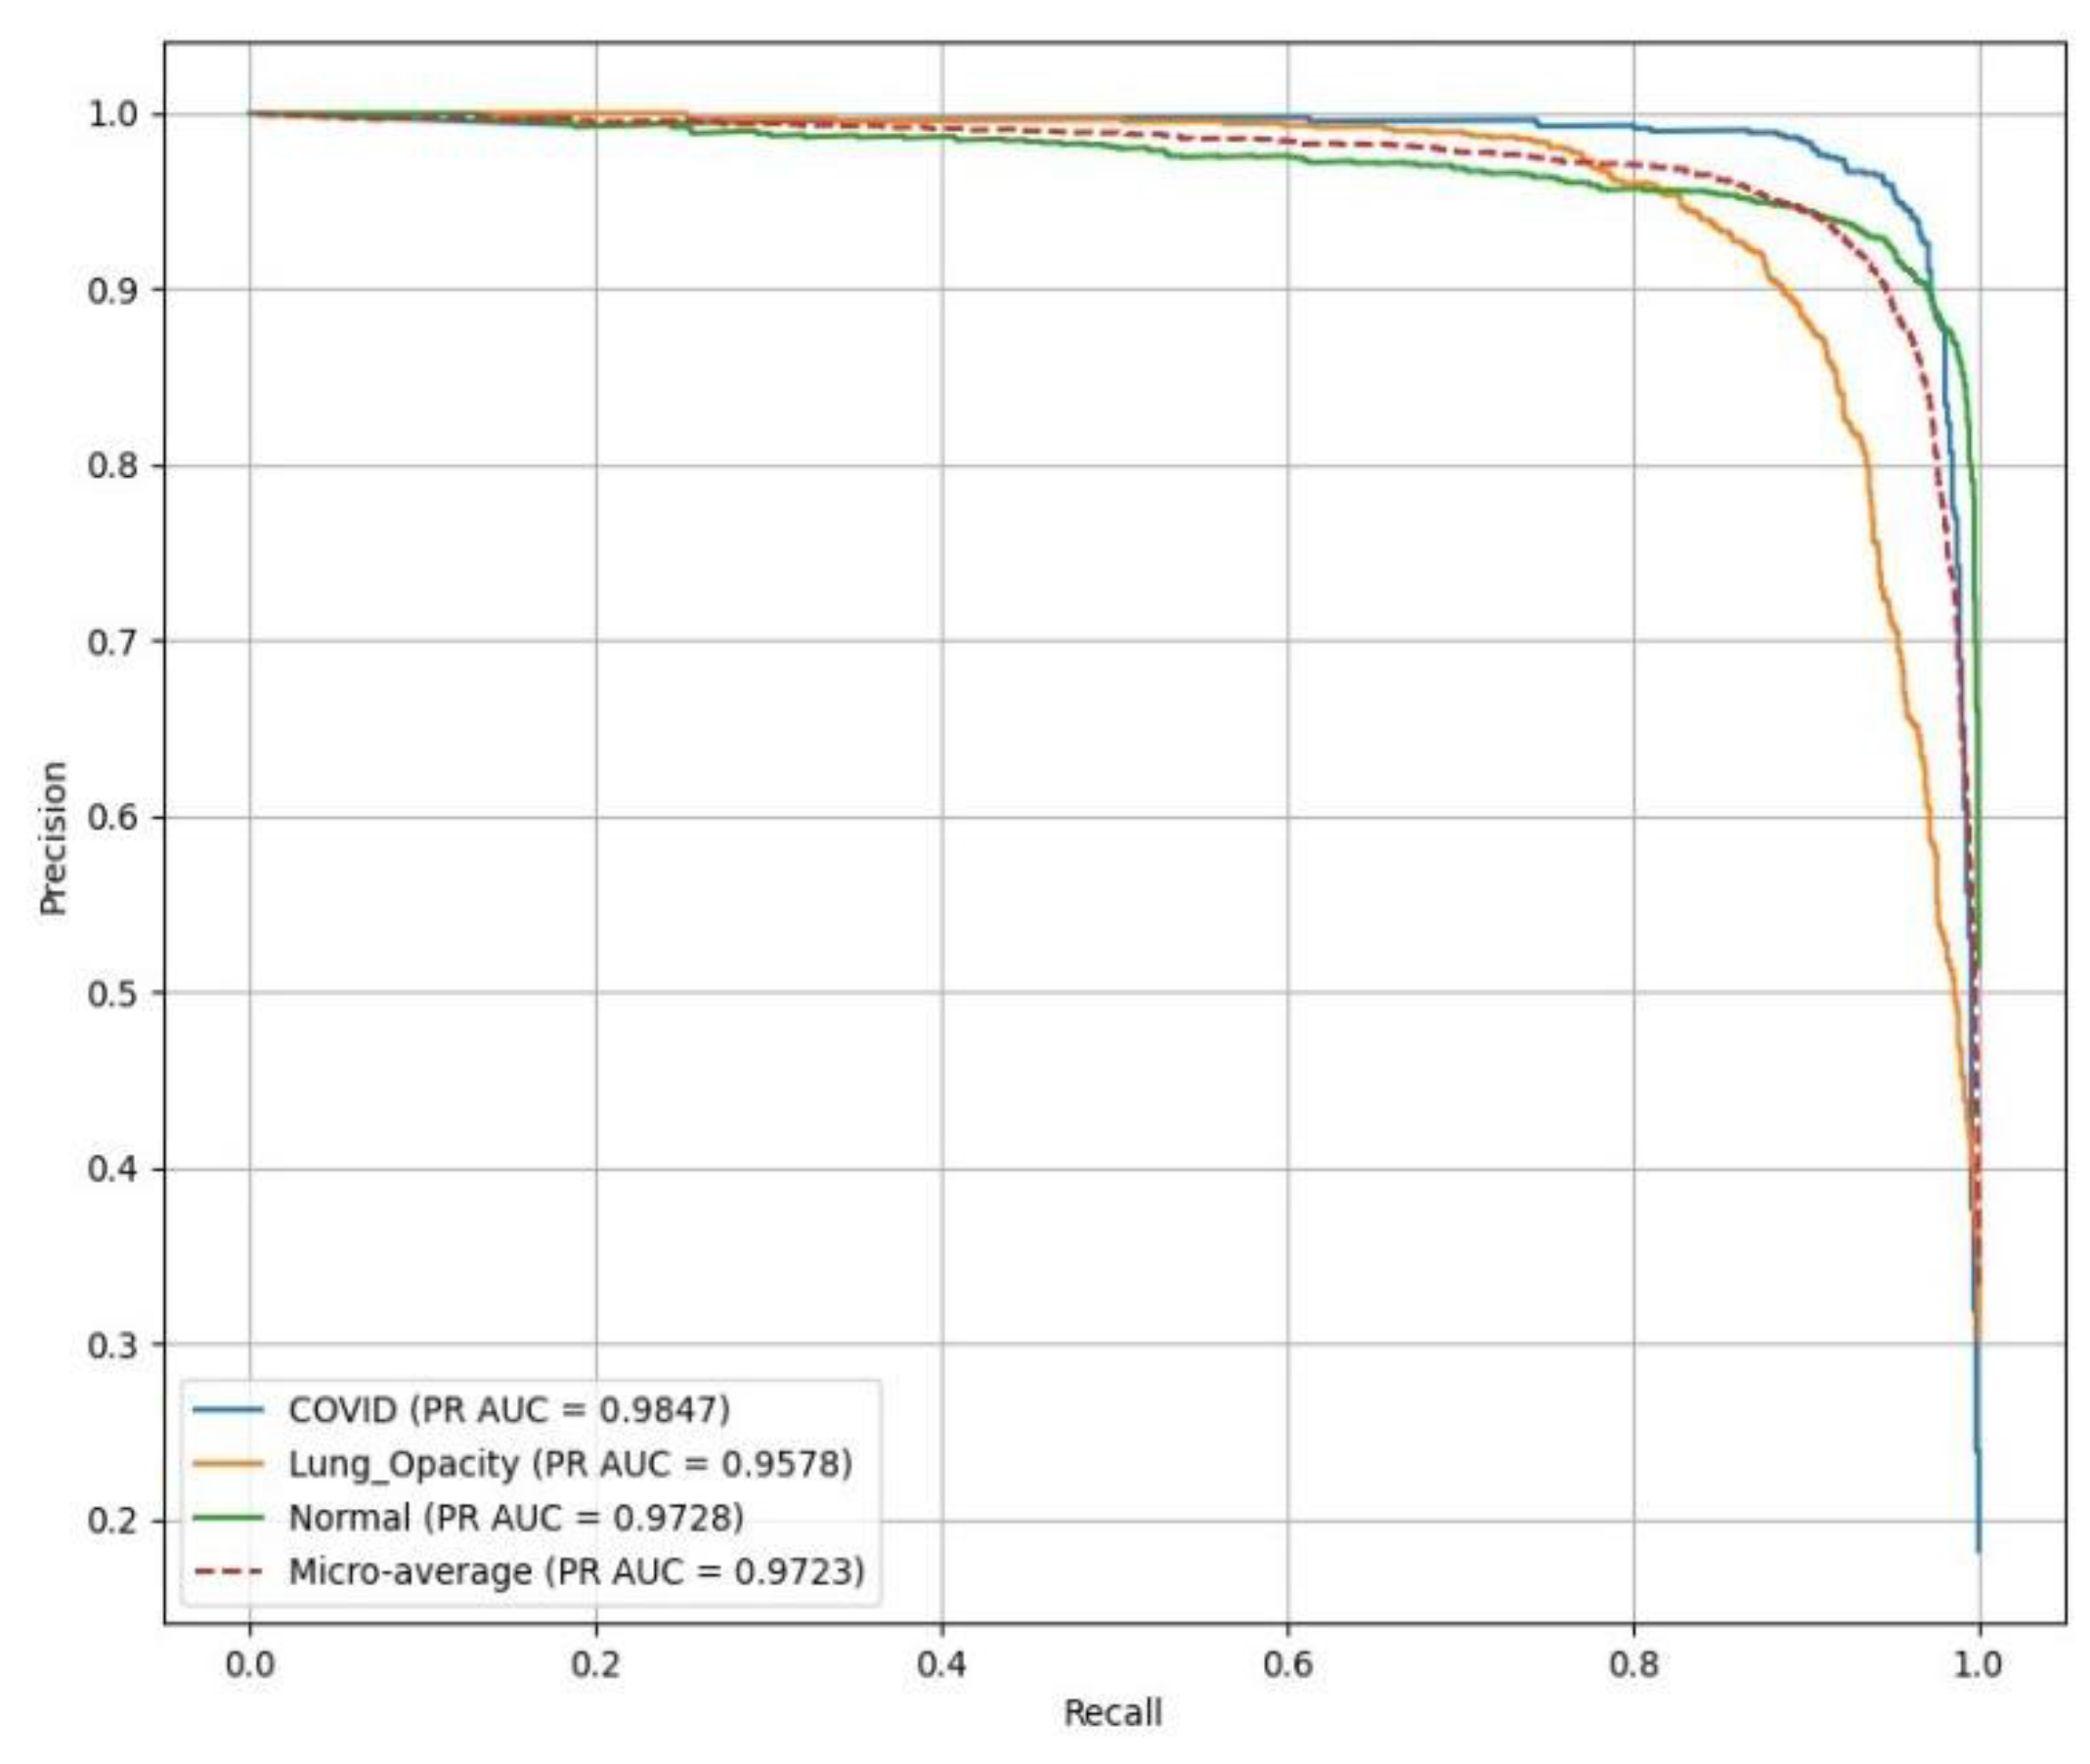
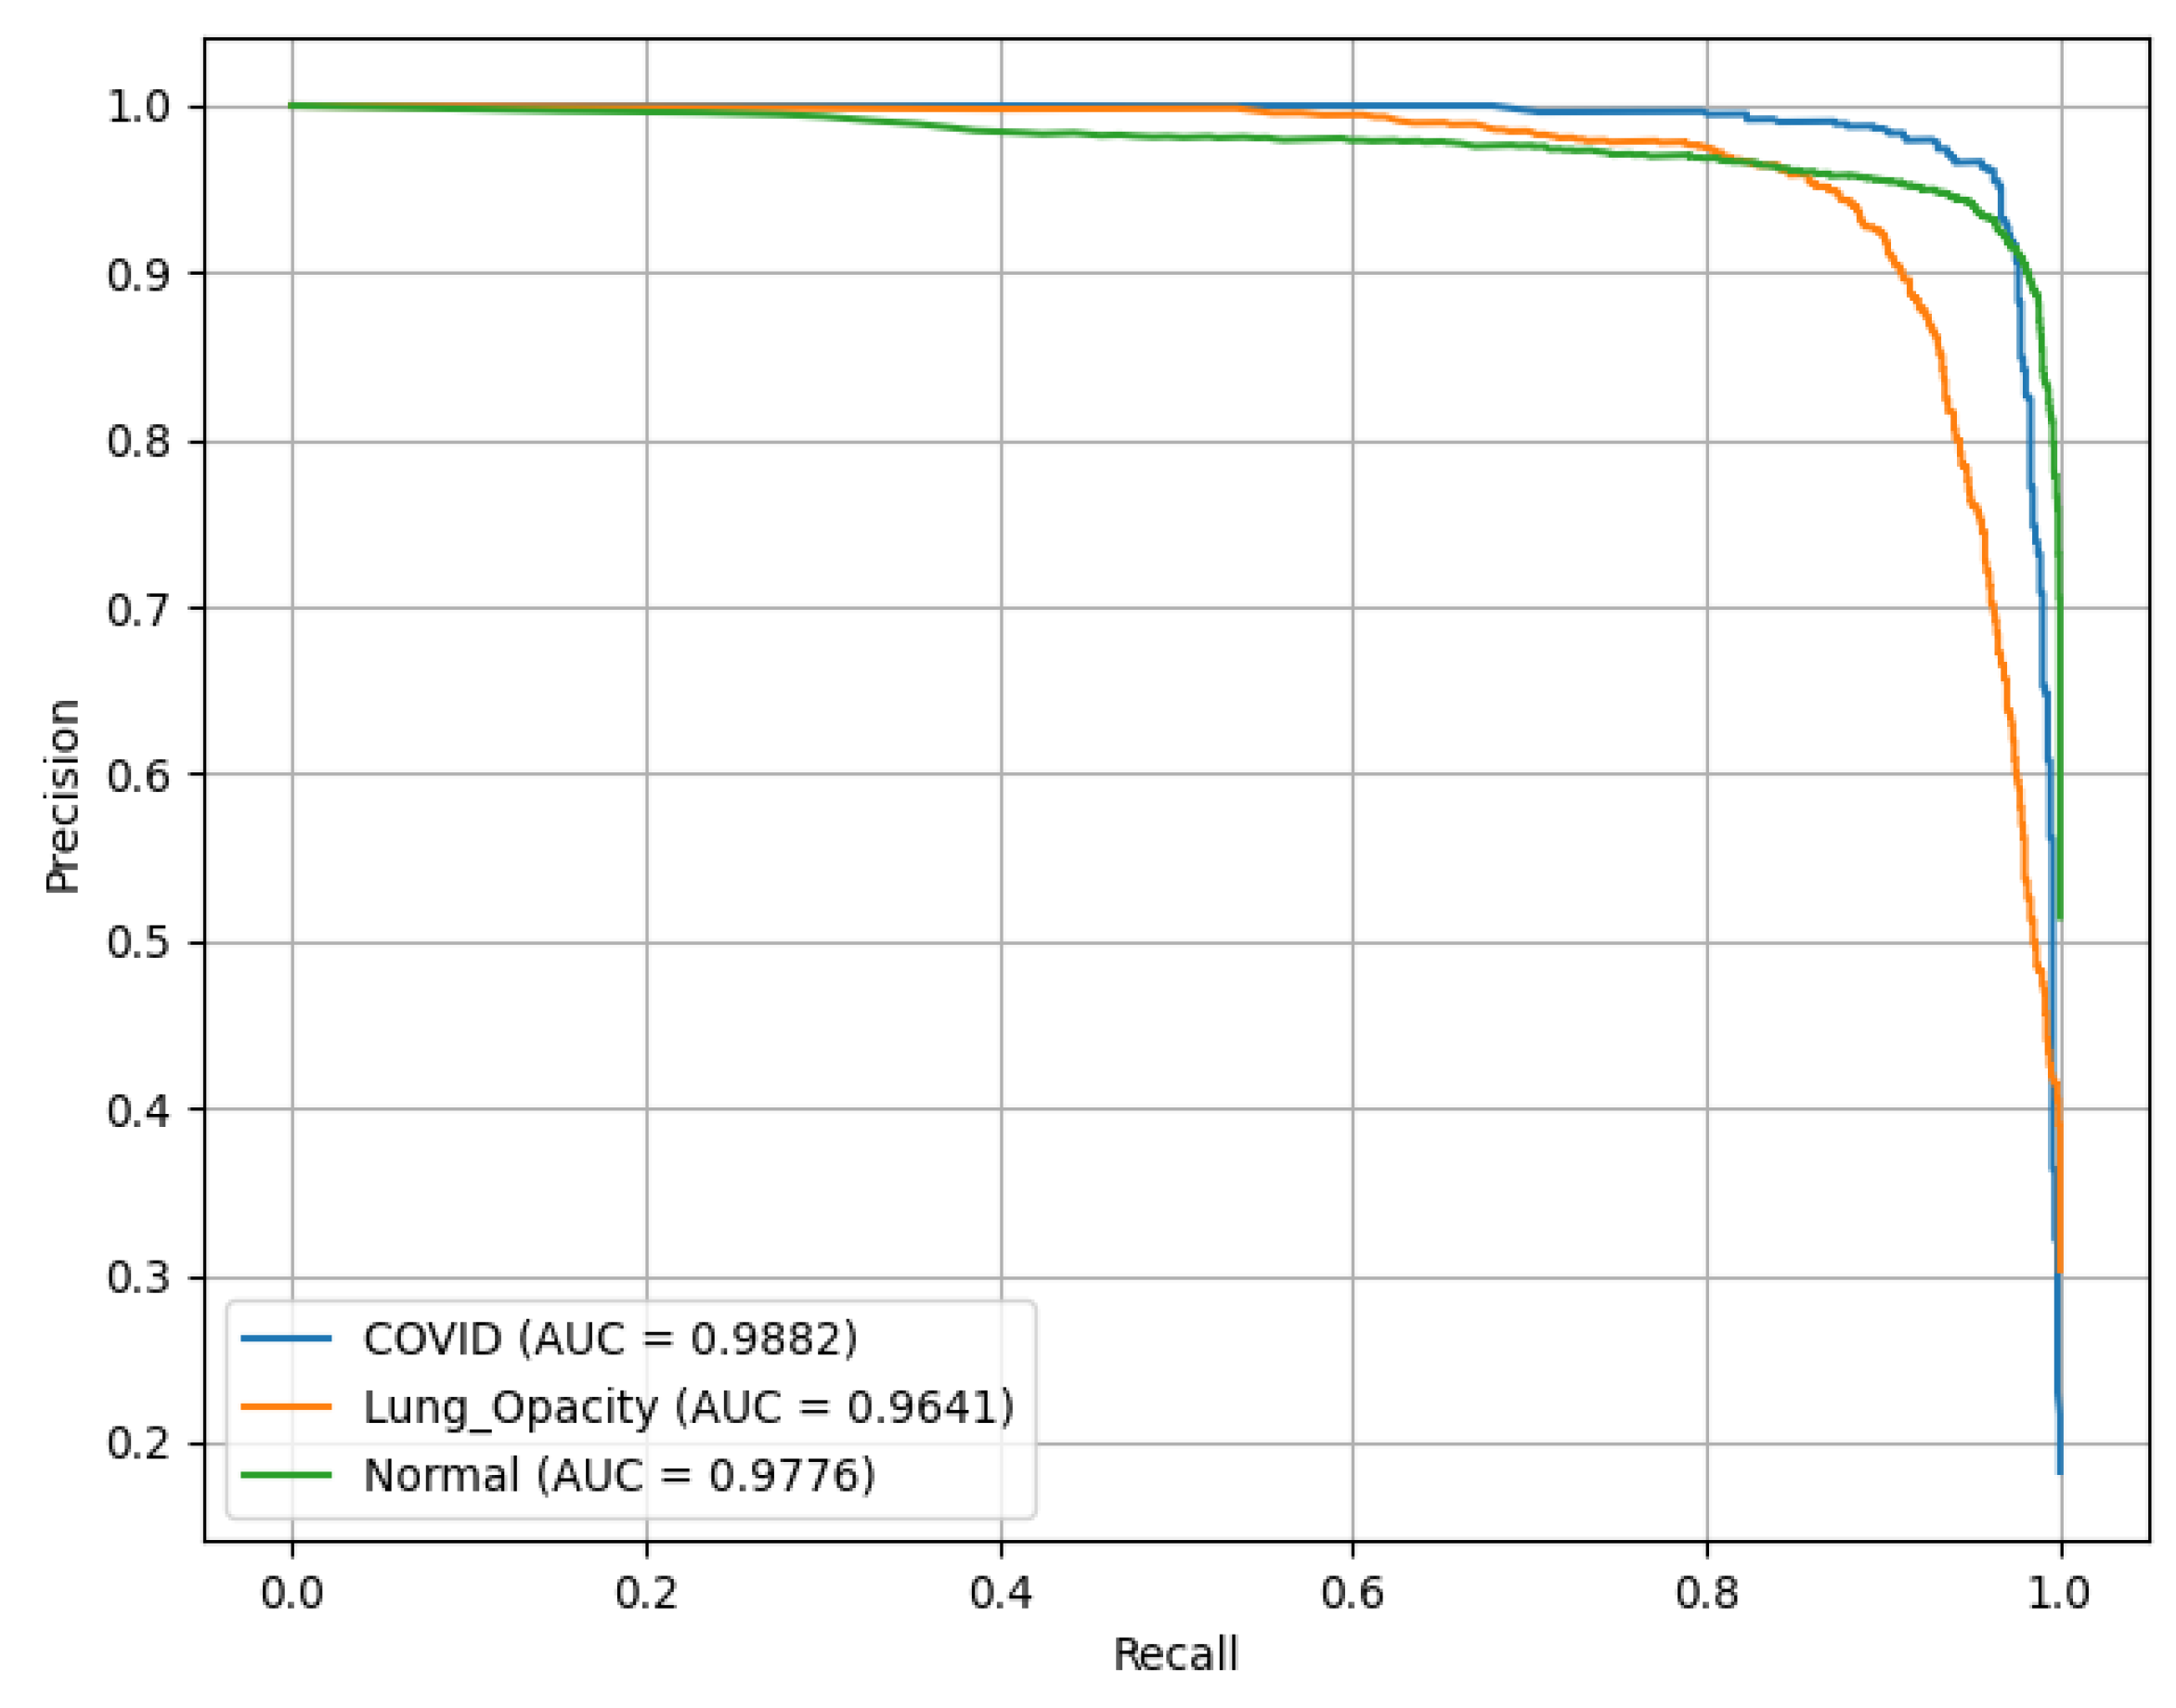
PR(AUC) is illustrated in
Figure 13, showing the performance of a ResNet18 model. C19 achieves a PR(AUC) of 0.98, LO has an AUC of 0.96, reflecting high reliability in identifying LO, and N (green curve) records an AUC of 0.97.
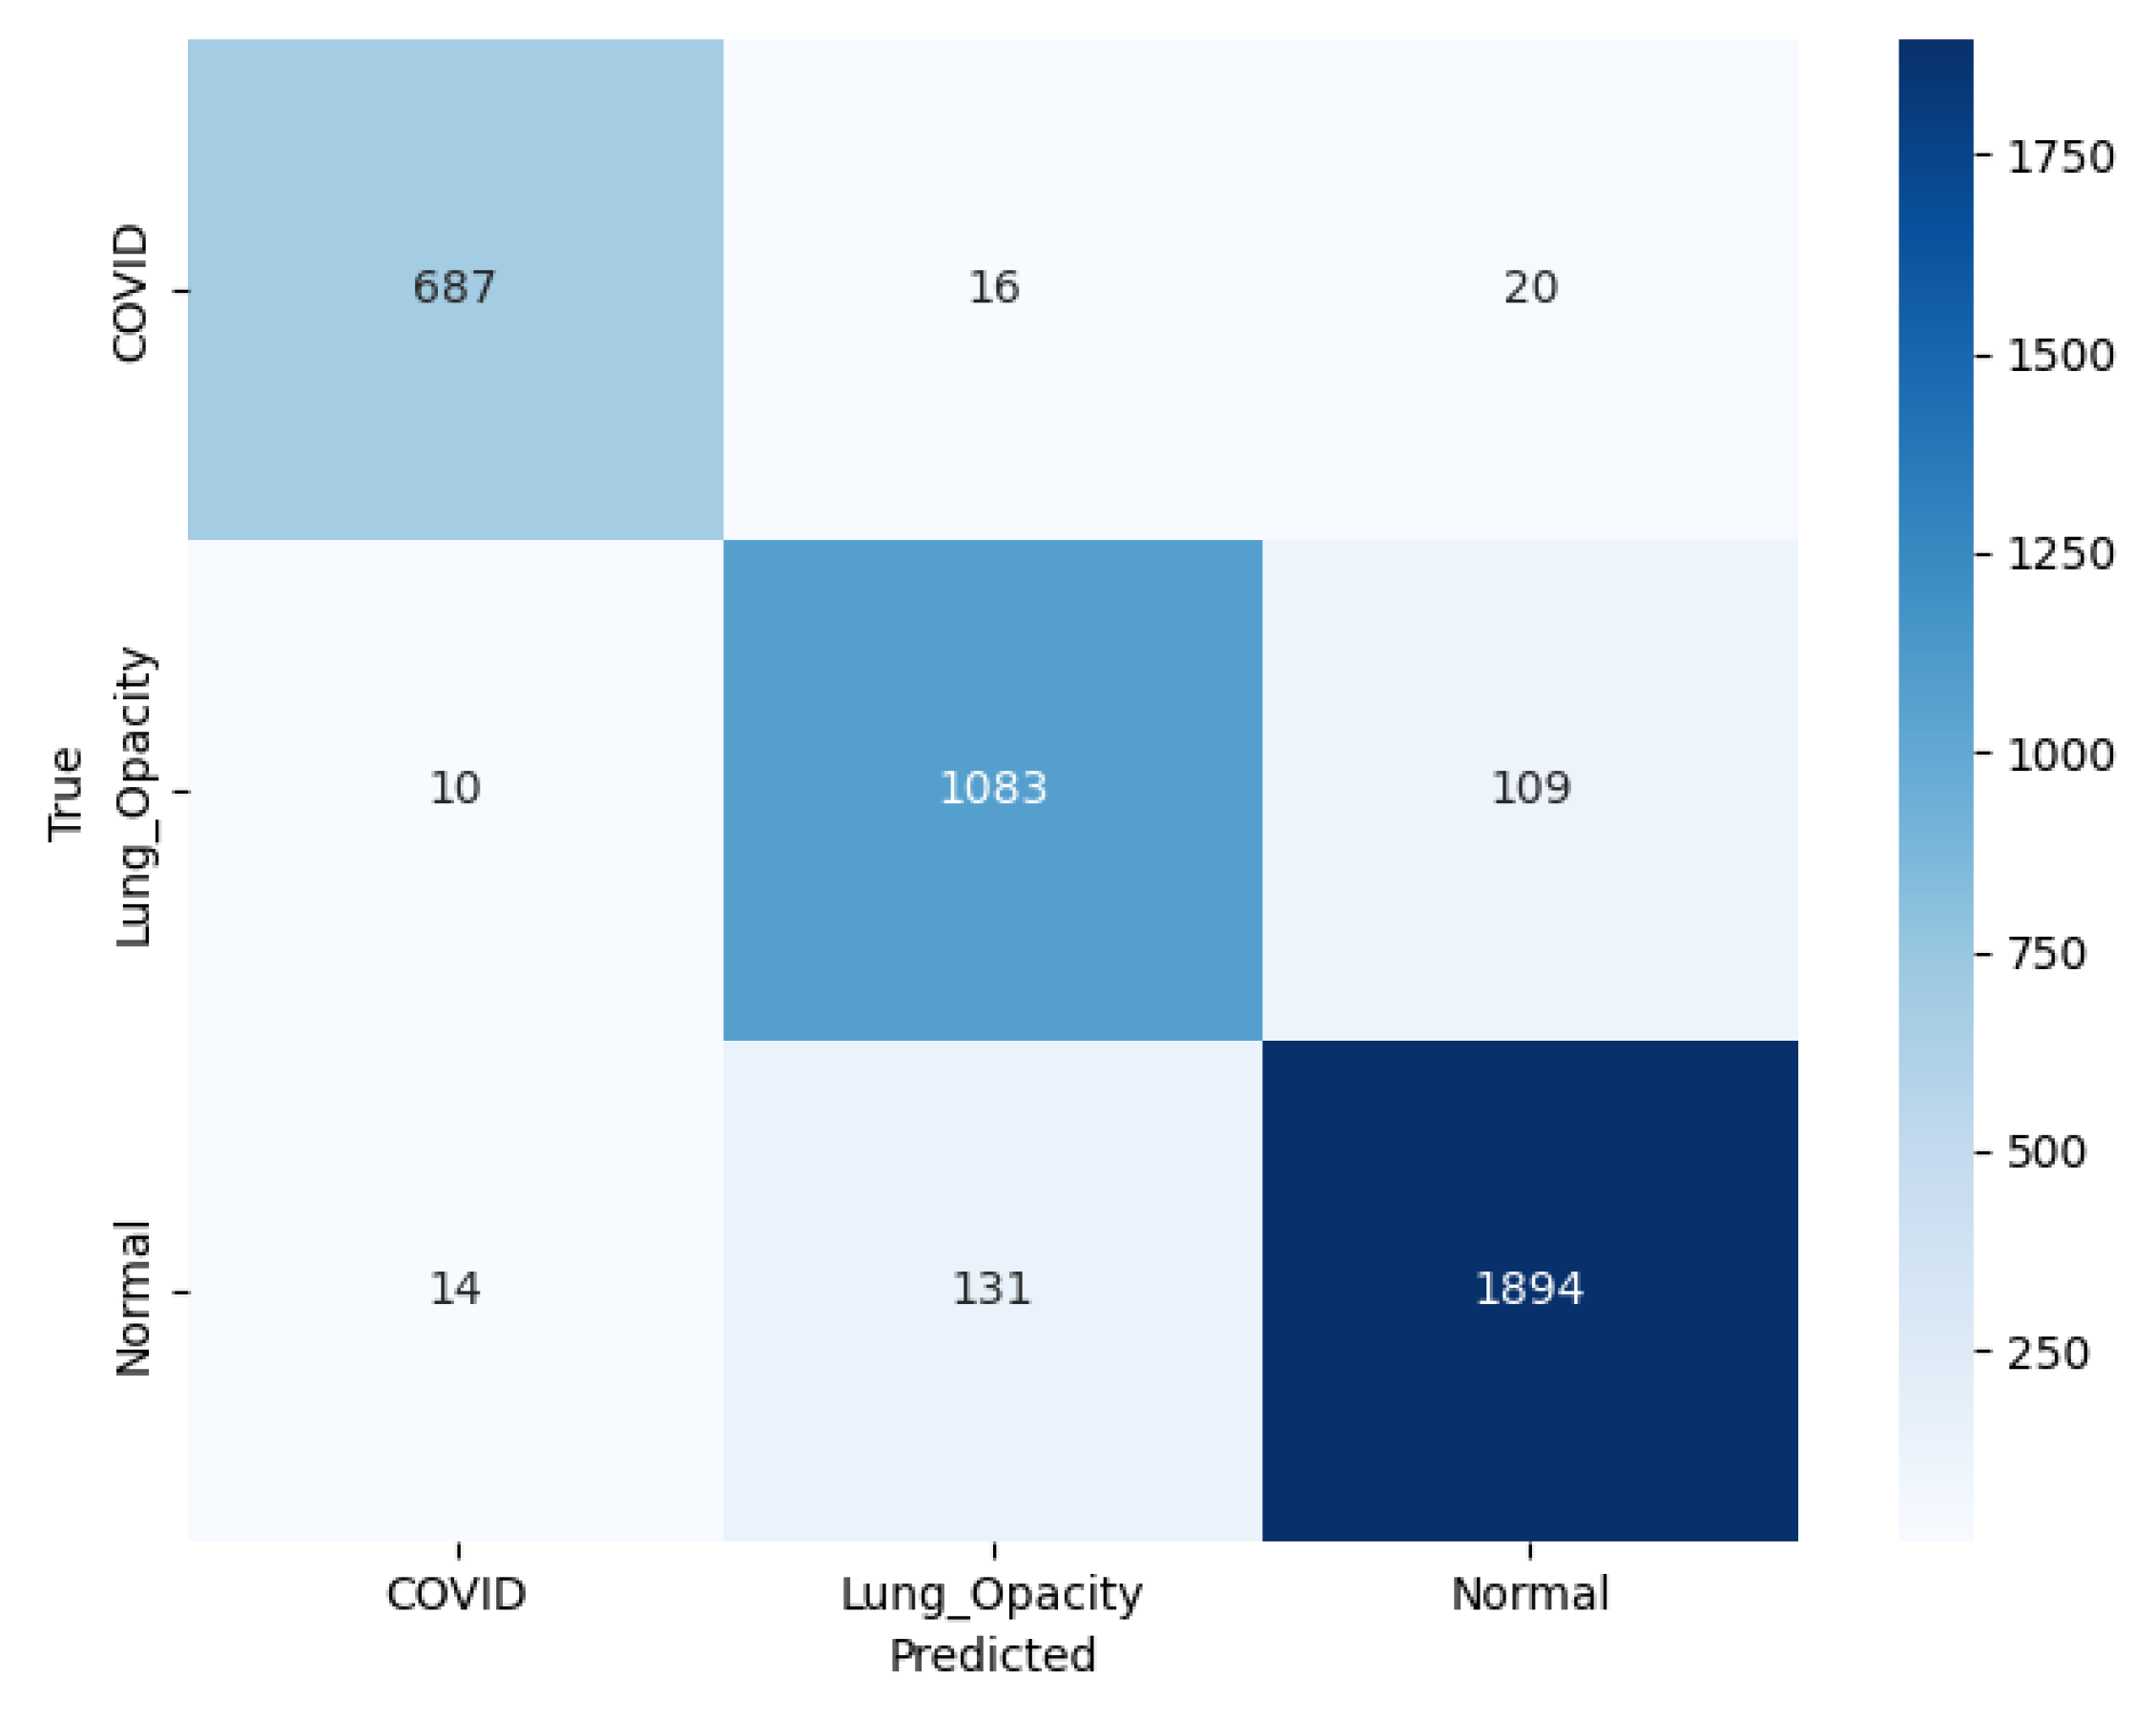
The model correctly classified 687 C19 cases, with 16 misclassified as LO and 20 as N, as illustrated in the confusion matrix shown in
Figure 14. For LO, 1083 cases were identified correctly, with 10 misclassified as C19 and 109 as N. For N cases, 1894 was correctly classified, with 14 misclassified as C19 and 131 as LO. The color intensity, ranging from light to dark blue, represents the number of instances, with the scale on the right indicating counting from 0 to 1750.
3.3. ResNet50
The classification performance of the pre-trained ResNet50 model for identifying C19, LO, and N is illustrated in
Table 7. As the number of epochs increased, there was a consistent improvement in the model’s performance across various metrics. The Sp risen from 92.43% at epoch 1 to 96.24% at epoch 30, indicating a substantial improvement in the model’s ability to identify positive cases correctly until the overfitting threshold is reached. Similarly, Sp (Rc/Sn) rose from 85.55% at epoch 1 to 93.24% at epoch 30, beyond which a slight decline in the performance scores is observed. Other metrics followed the same trend. The ROC(AUC) remained high throughout, reaching 0.98 at epoch 50. Similarly, the PR(AUC) remained strong, improving from 0.94 at epoch 1 to 0.97 at epoch 50, indicating its capability to handle imbalanced classes. The F1-score steadily enhanced from 84.30% at epoch 1 to 93.44% at epoch 30. Finally, A showed a rise from 85.17% at epoch 1 to 93.41% at epoch 30, reflecting the overall enhancement in model performance.
This ROC curve illustrates the performance of the ResNet50 model in classifying three chest X-ray classes as illustrated in
Figure 15: C19, LO, and N, based on test data from Fold 2. The tight clustering of these ROC curves near the top-left corner of the plot highlights ResNet50’s high capability in minimizing false positives while maximizing true positives across all three classes.
Figure 16 shows that C19 achieves the highest PR(AUC) of 0.99 at varying classification thresholds. The N class follows with a strong PR(AUC) of 0.98, while LO records a slightly lower AUC of 0.96, suggesting somewhat greater difficulty in distinguishing it from other conditions.
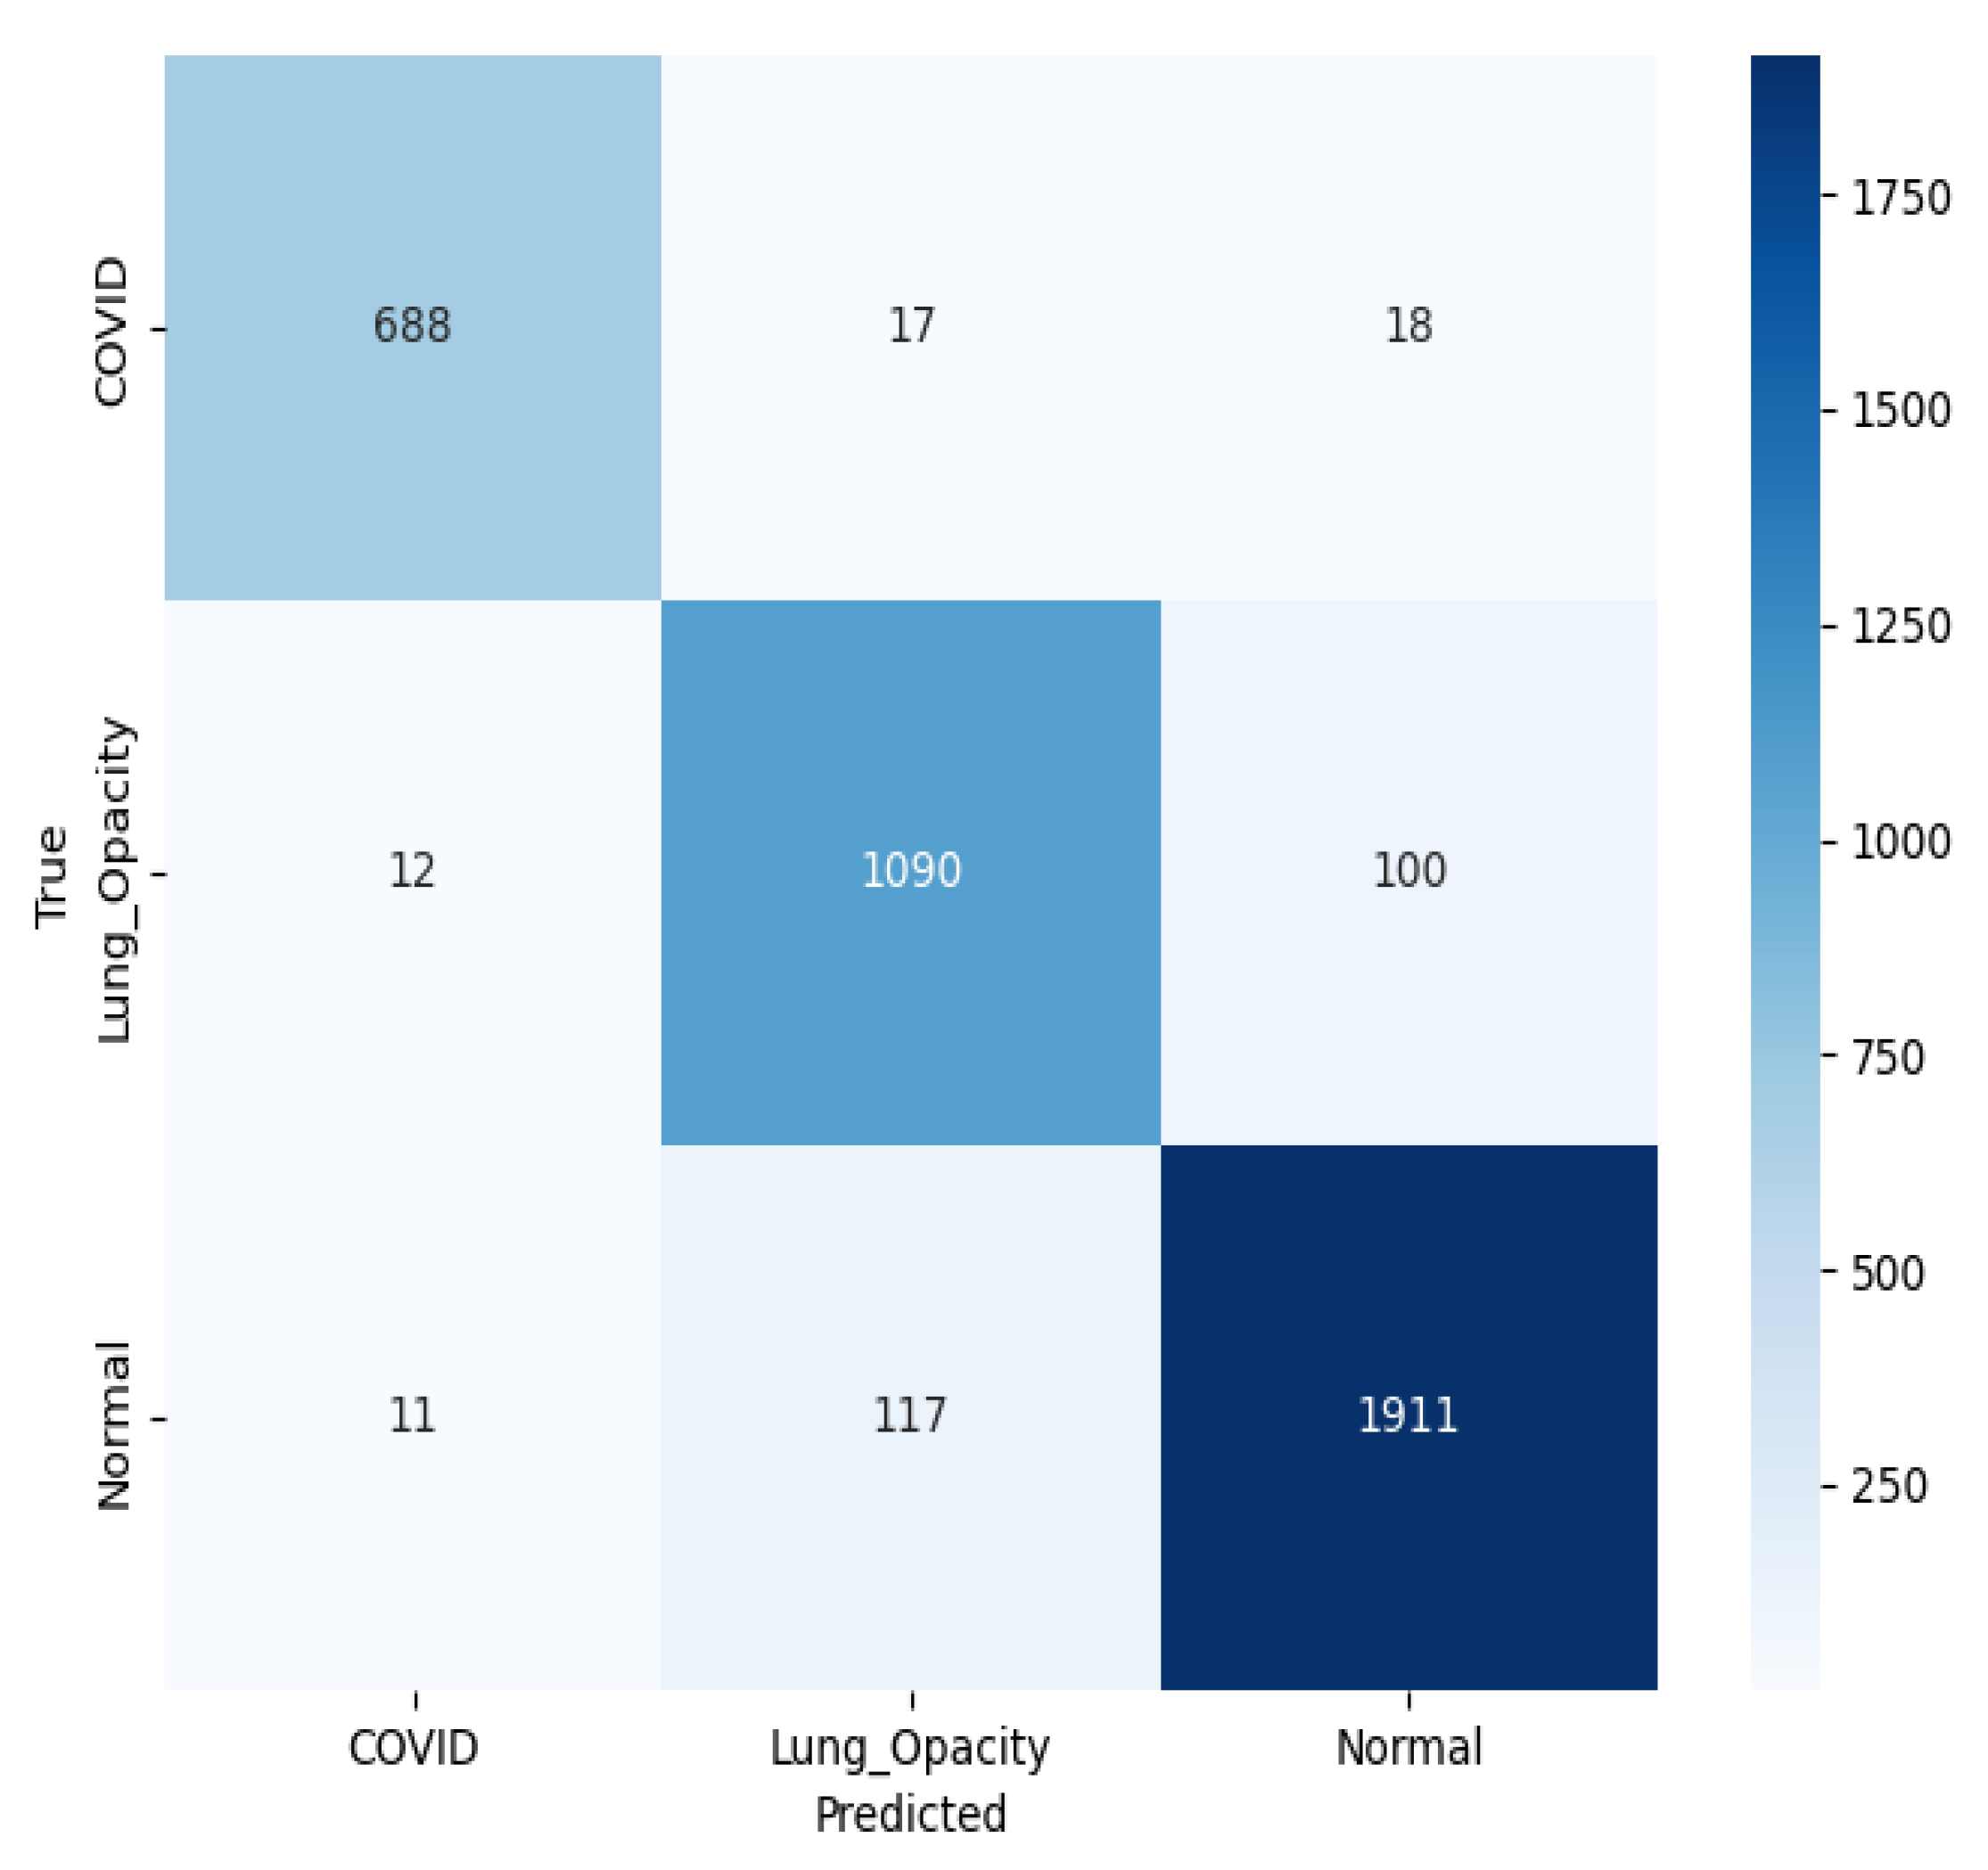
Figure 17 presents a multiclass confusion matrix for the classification of chest X-ray images into three classes using a pre-trained ResNet50 model. For C19, 688 predictions were correct, while 17 were LO and 18 N. For LO, 1090 were accurate, with 12 predicted as C19 and 100 as N. For N, the model correctly classified 1911, misclassifying 117 as LO and 11 as C19. The relatively low number of misclassifications indicates that the model is performing well, although some overlap remains, particularly between LO and N cases.
3.4. SqueezeNet
The classification performance results of the pre-trained SqueezeNet are illustrated in
Table 8. For this experimentation, the results have been shown for epochs 20, 25, 30, 40, and 50. The performance metrics indicate that the SqueezeNet model achieved its best results at epoch 25. Specifically, the Sp reached 96.52%, the highest value observed across all epochs, demonstrating the model’s excellent ability to identify true positives correctly. The Sn secured 93.95%, and the Pr was 94.65%, reflecting reliable predictions for positive cases. The NPV at epoch 25 was 96.71%, further highlighting the model’s ability to predict true negatives accurately. In terms of area under the curve (AUC), the model achieved an ROC(AUC) of 98.94% and a PR(AUC) of 98.36%, both indicating excellent performance. The F1-score was also high at 94.01%, balancing both precision and recall effectively. The A was 94.01%, again showing that the model’s overall performance was powerful at epoch 25.
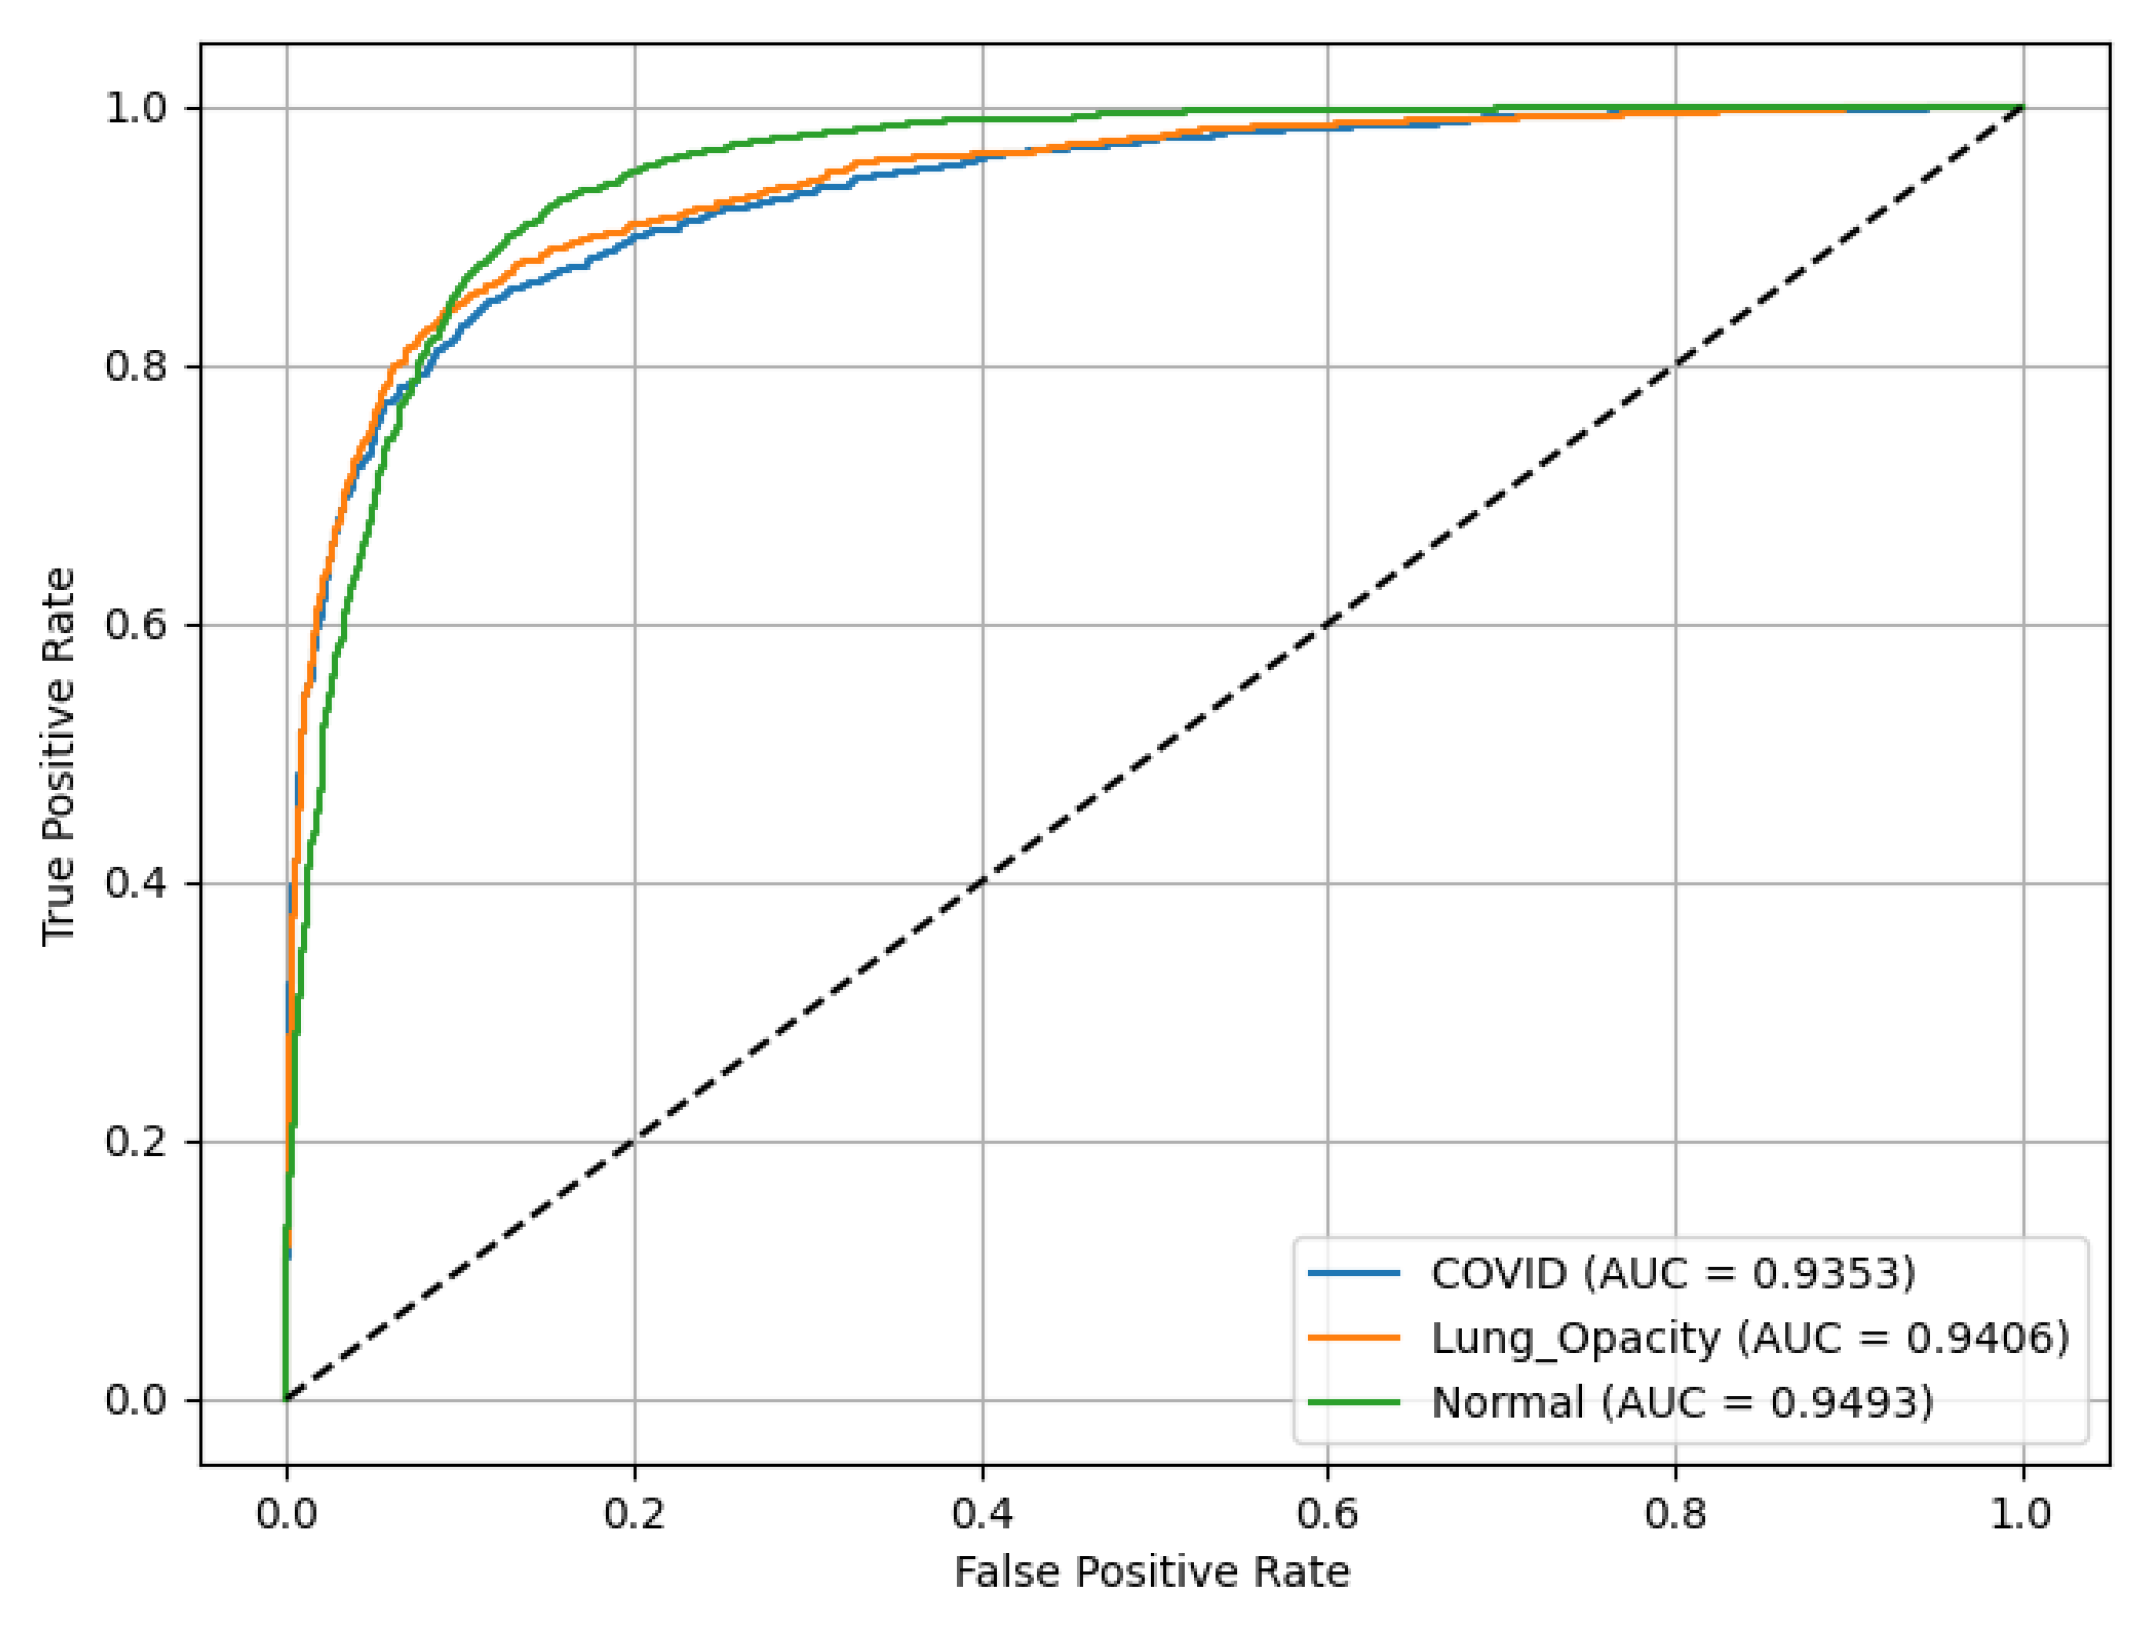
Figure 18 represents ROC(AUC) curves asses the performance of a SqueezeNet model. LO has ROC(AUC) of 0.94, C19 achieves ROC(AUC) of 0.94, reflecting high reliability in identifying LO, and N (green curve) records ROC(AUC) of 0.9493.
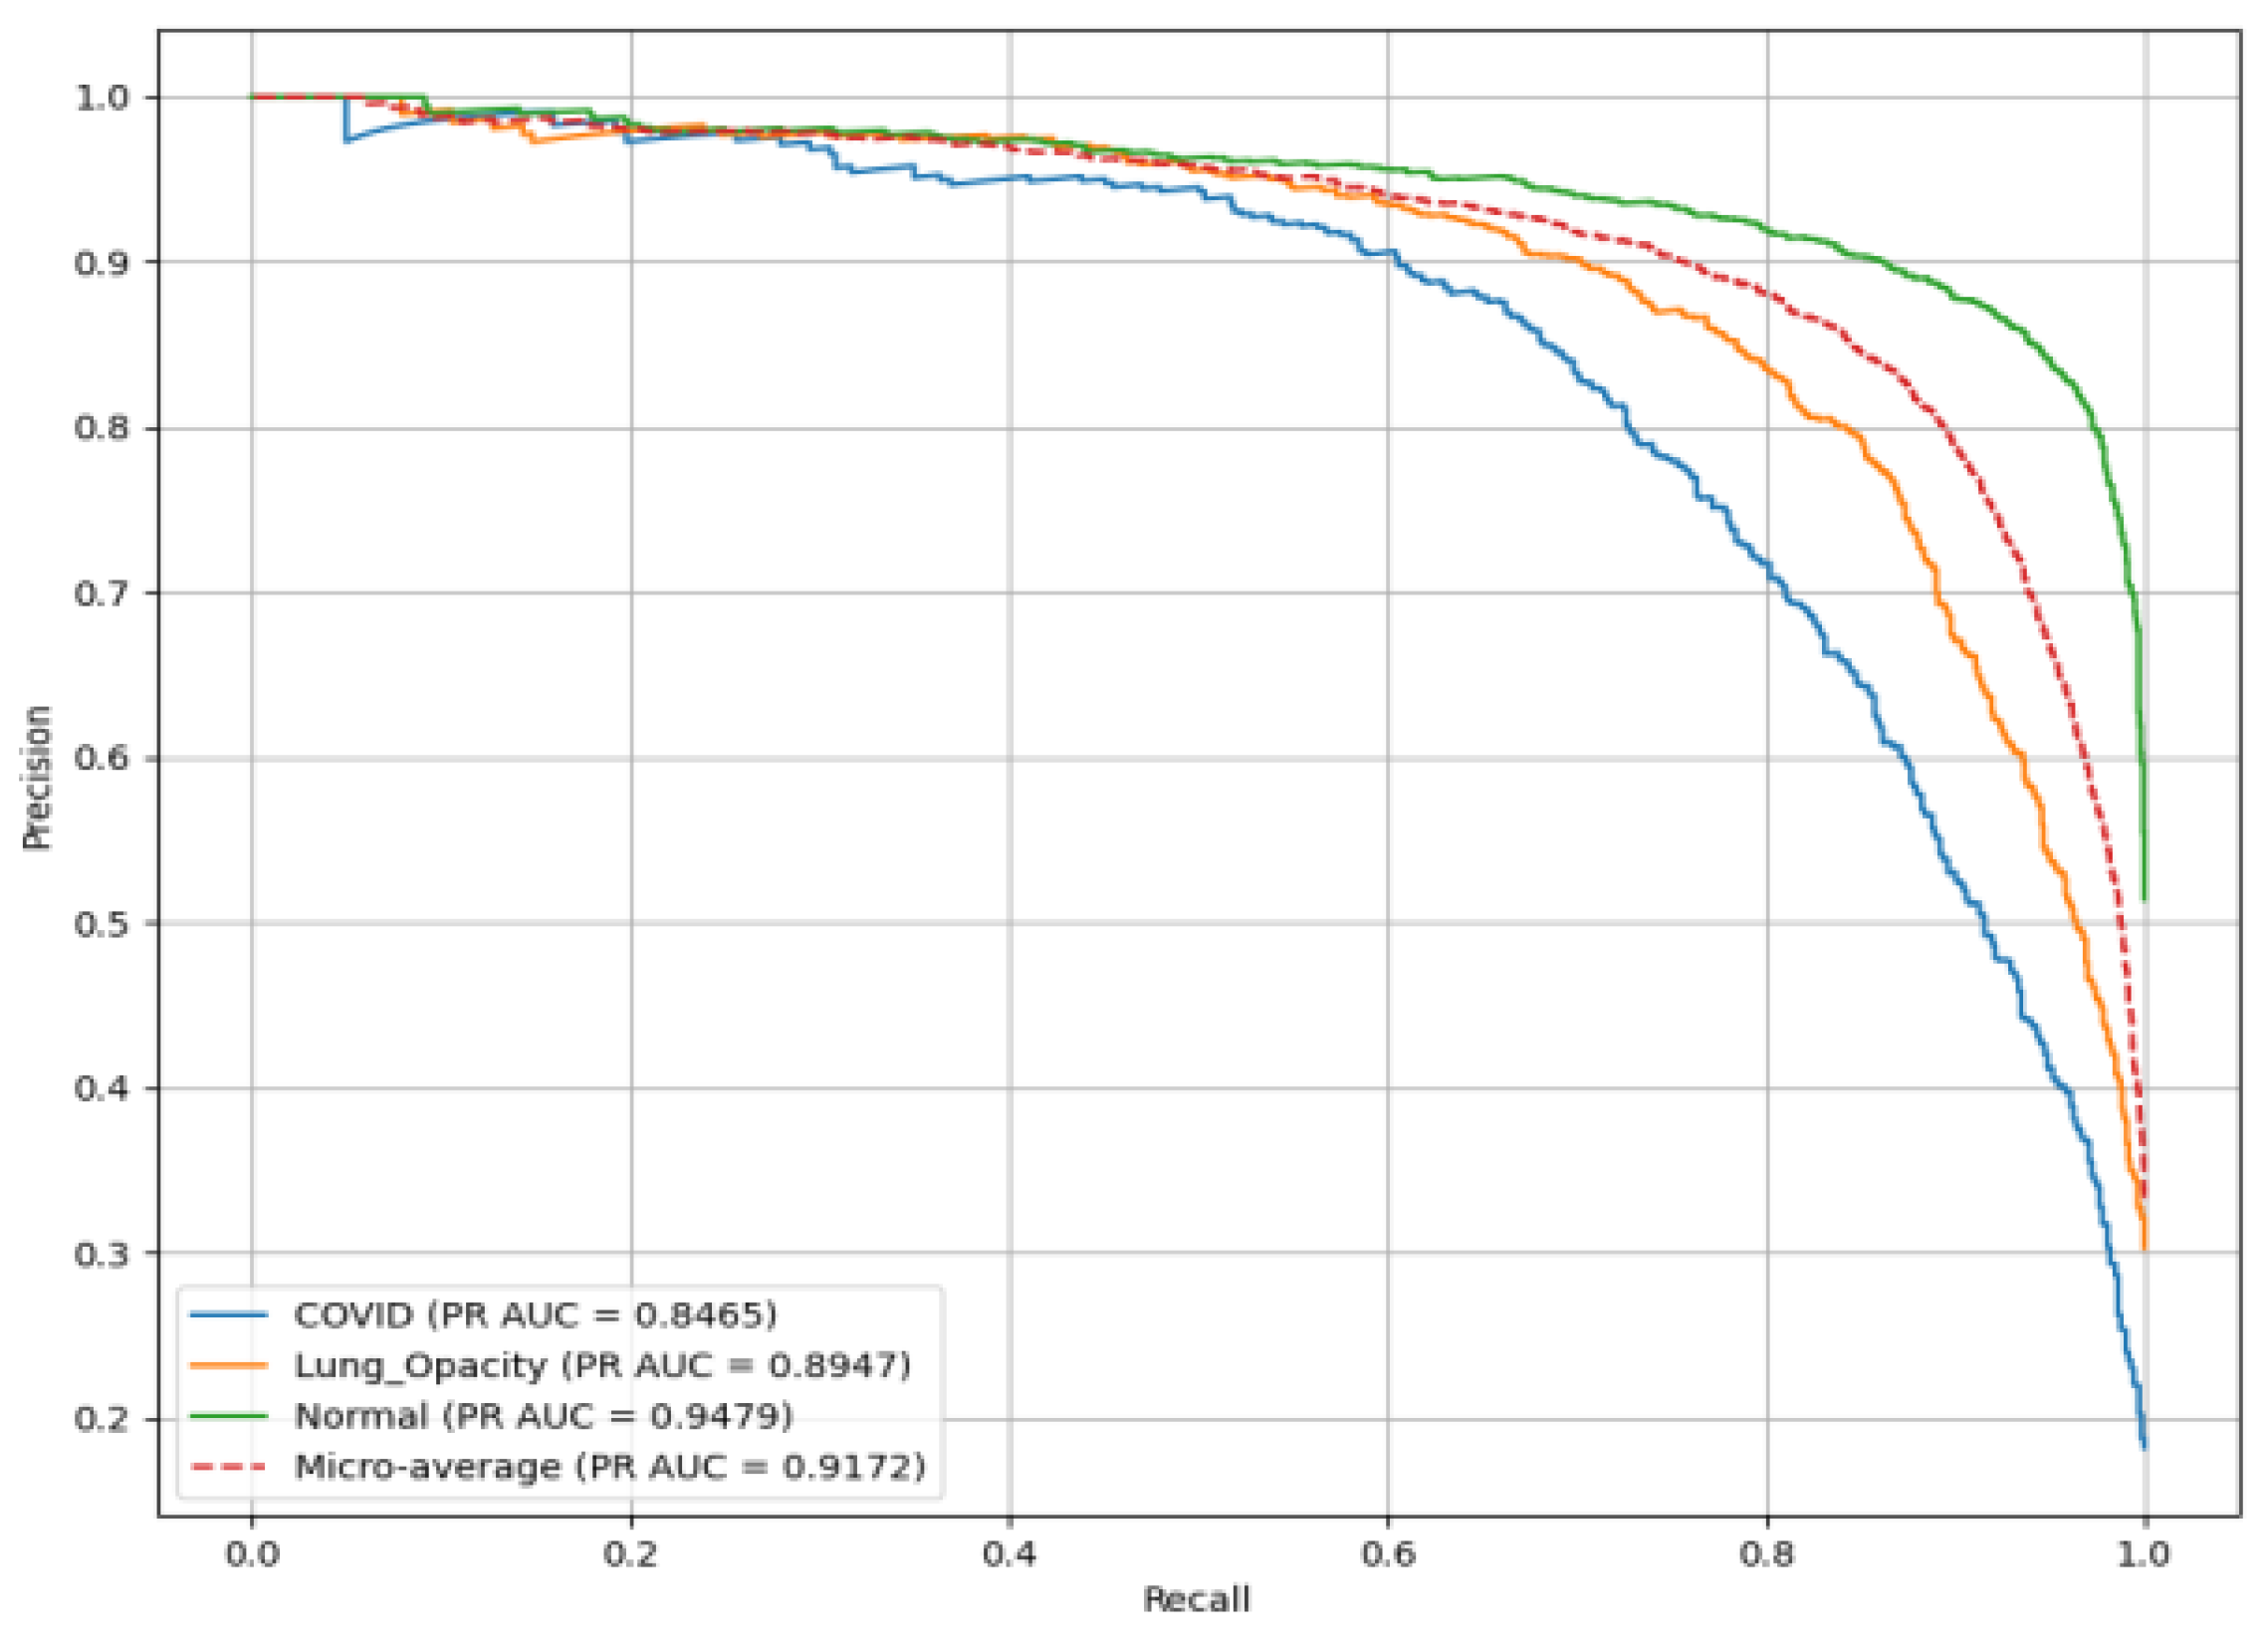
Figure 19 presents the PR(AUC) for the SqueezeNet model used to classify chest X-ray images into three classes. C19 (blue curve) achieves PR(AUC) of 0.85. LO (orange curve) has PR(AUC) of 0.89, reflecting high reliability in identifying LO; and N (green curve) records PR(AUC) of 0.92.
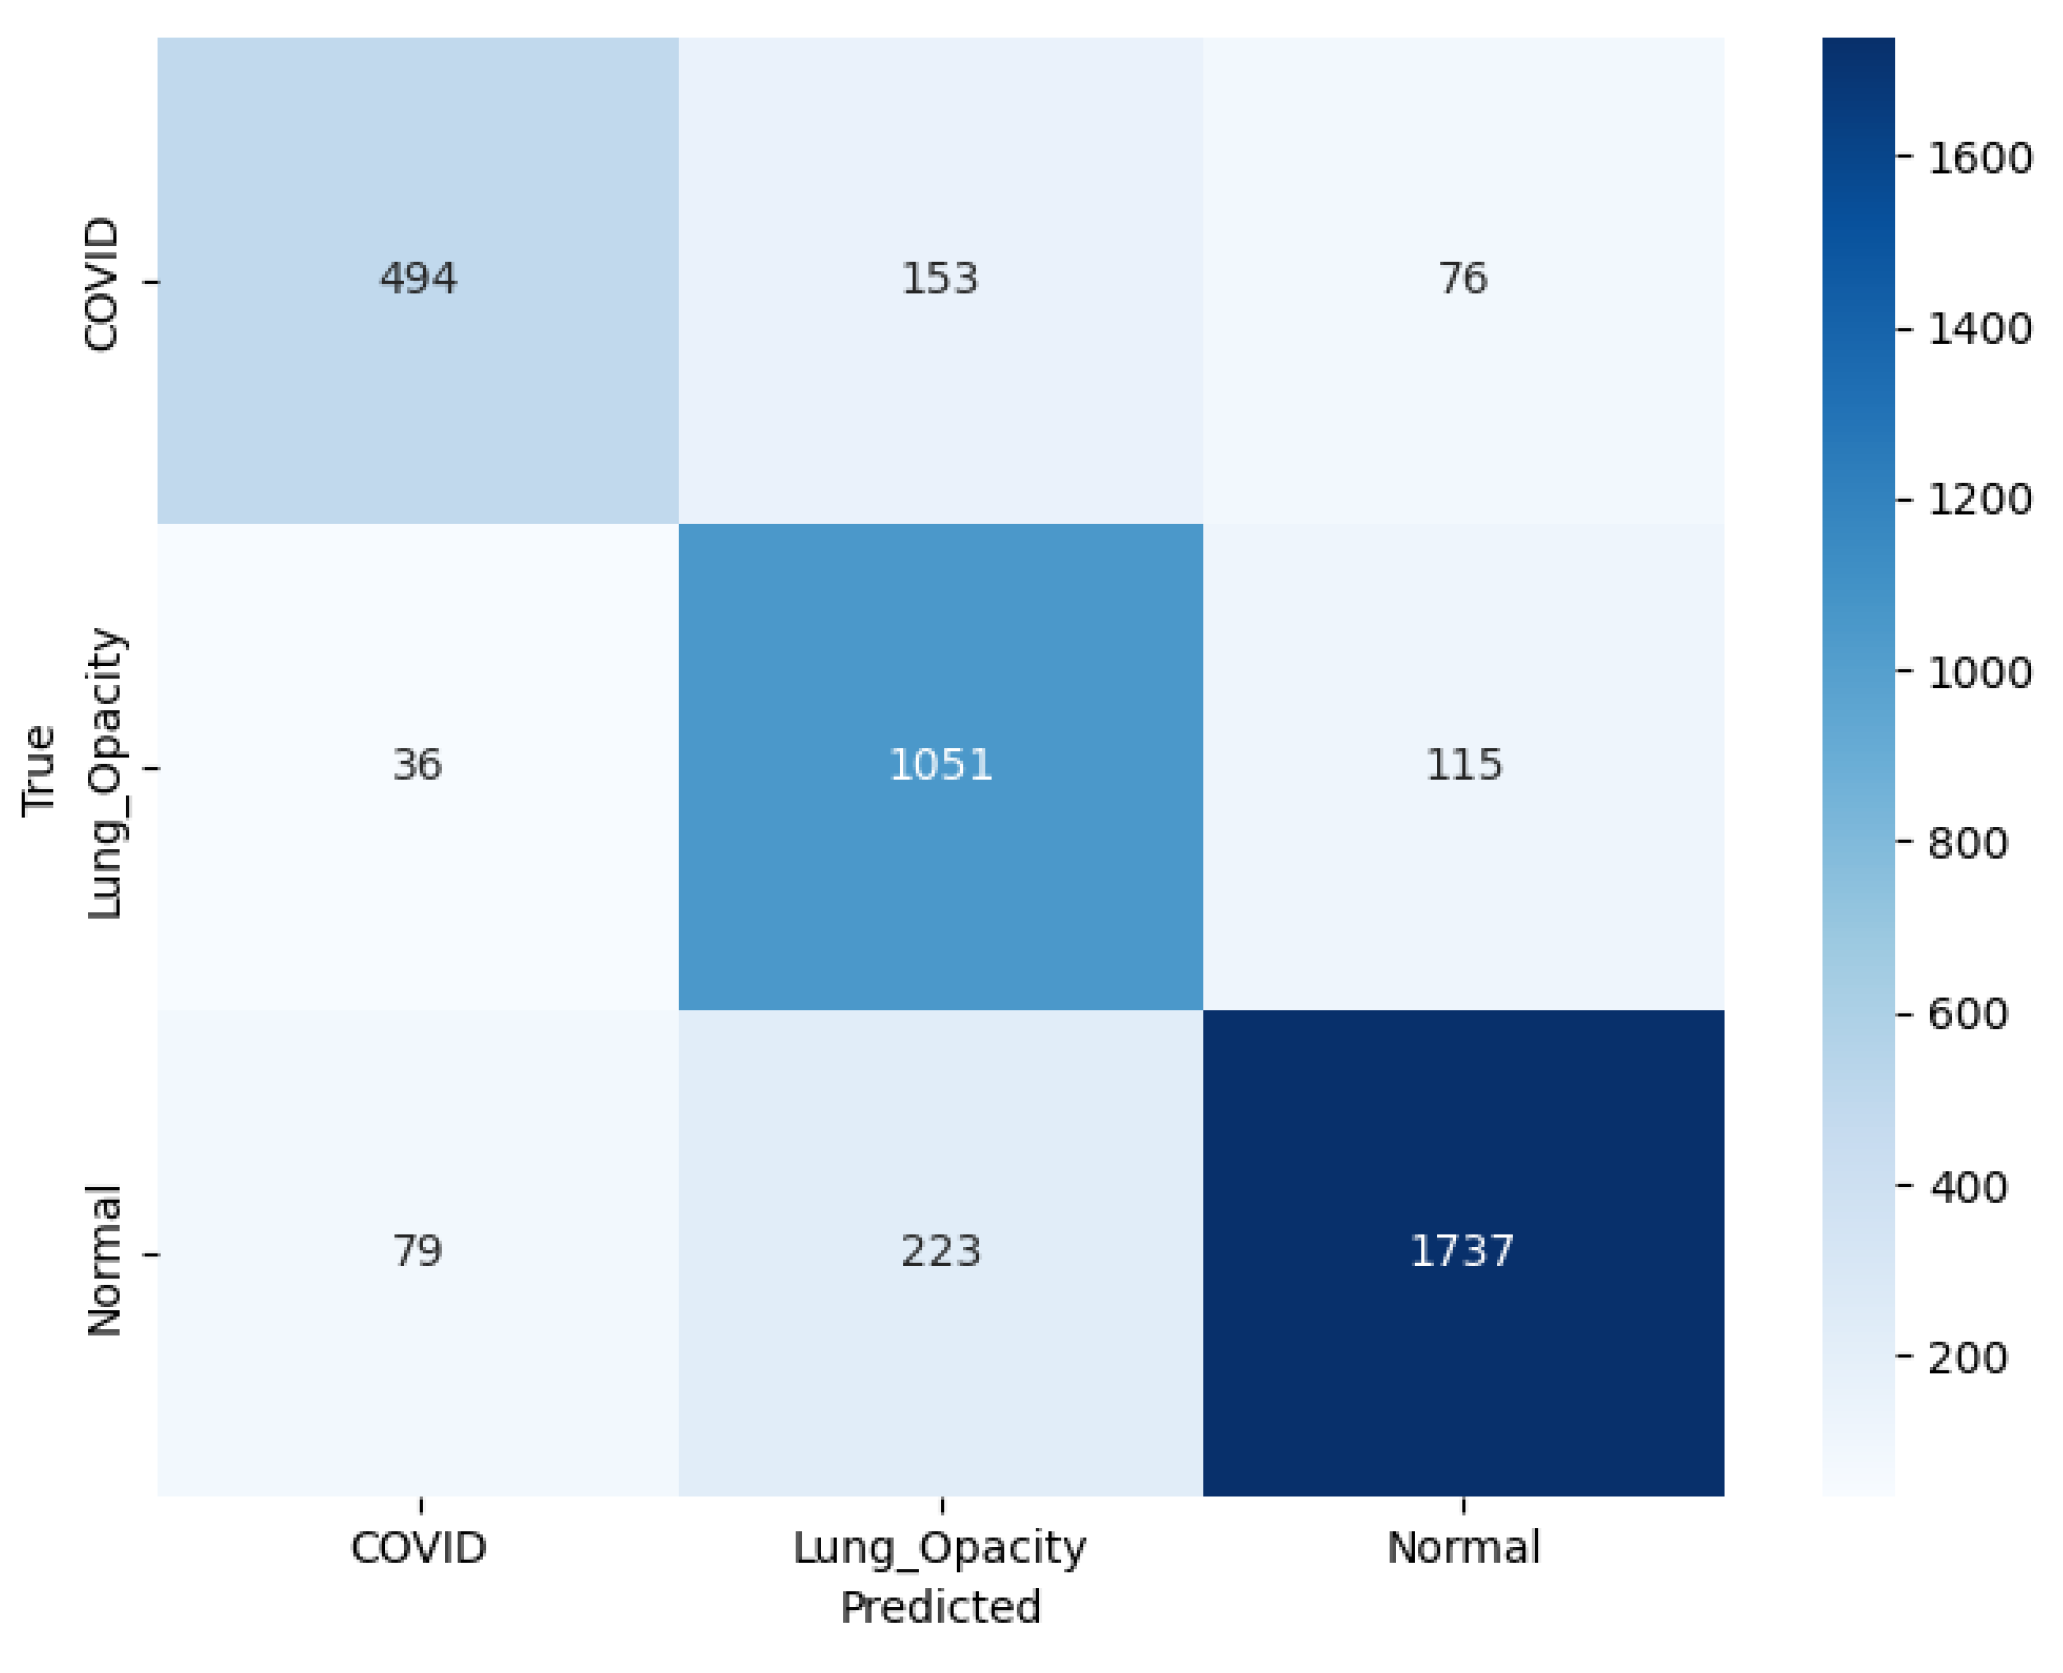
In
Figure 20 illustrating the confusion matrix for SqueezeNet model, C19 class, out of the total actual cases, 494 were correctly classified, while 153 were misclassified as LO and 76 as N. It indicates considerable confusion particularly with LO cases. In the LO class, the model performs more robustly, with 1051 correct predictions, while 36 were incorrectly labeled as C19 and 115 as N, showing relatively balanced misclassification. In the N class, the model performs more robustly, with 1737 correct predictions, while 79 were incorrectly labeled as C19 and 223 as LO.
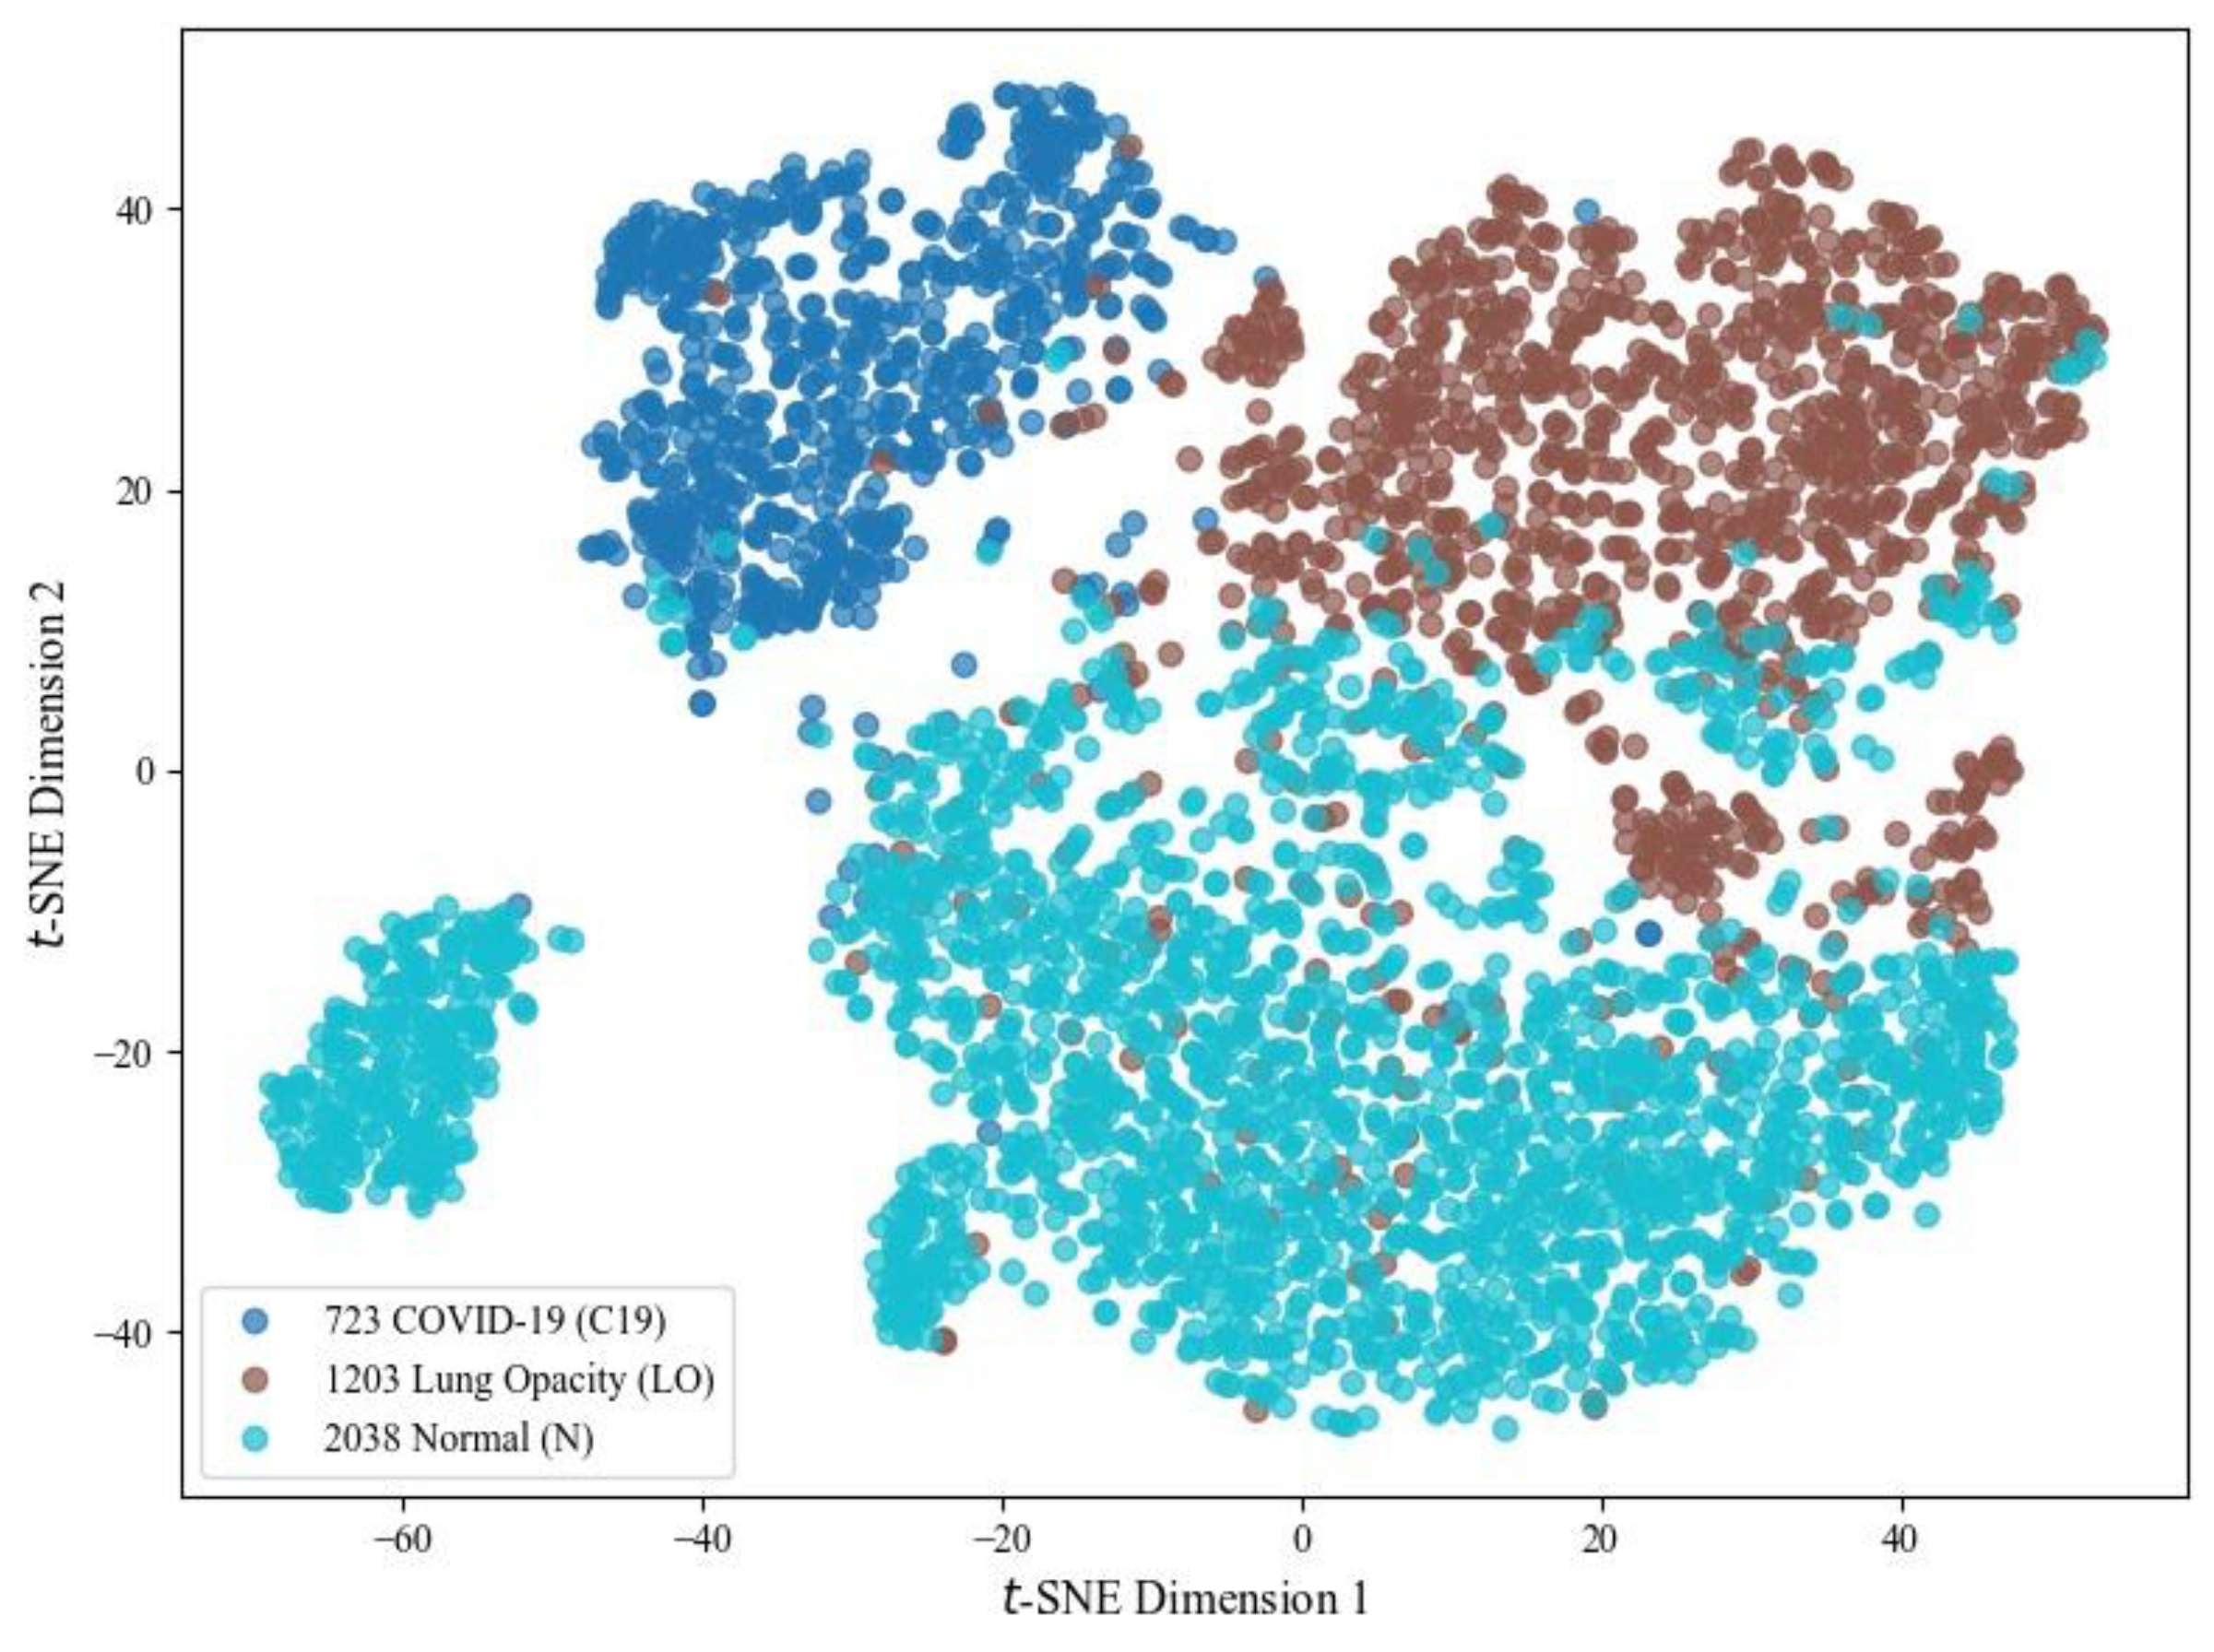
For visual analysis, three chest X-ray classes using high-dimensional features extracted from the SqueezeNet model are illustrated in
Figure 21. For this, t-SNE, a non-linear dimensionality reduction method, projects feature vectors into a 2D space, thereby improving the representation by minimizing crowding and revealing class clusters. As shown, the model learns discriminative features where C19 samples tend to form a relatively compact cluster. At the same time, some overlap is observed between LO and N categories due to inherent similarities in chest radiographs. The C19 cluster remains discriminative, highlighting that the results for this class are more impressive than those of other options.
3.5. VGG16
A detailed experimentation of the classification performance of the pre-trained VGG16 model (under identical conditions) is illustrated in
Table 9. At epoch 1, the Sp was 90.43%, with the Sn at 79.04%, and Pr at 81.36%. The NPV was 91.47%, and the ROC(AUC) was 0.93, indicating the model’s initial classification capabilities. As the number of epochs increased, the model showed steady improvements across all metrics. By epoch 25, the Sp reached 93.05%, the Specificity improved to 83.50%, and the F1-score reached 85.92%. At epoch 50, the Sn peaked at 94.83%, while the Specificity was the highest at 89.11%. The ROC(AUC) reached 0.98 at epoch 50, indicating excellent performance in distinguishing between the three classes. The model’s
A improved from 83.12% at epoch 1 to 90.26% at epoch 50, reflecting overall enhancement in classification. PR(AUC) reached 0.96 at epoch 50. The F1-score steadily improved, particularly at higher epochs, culminating at 90.26% in epoch 50, showing a balanced performance between precision and recall.
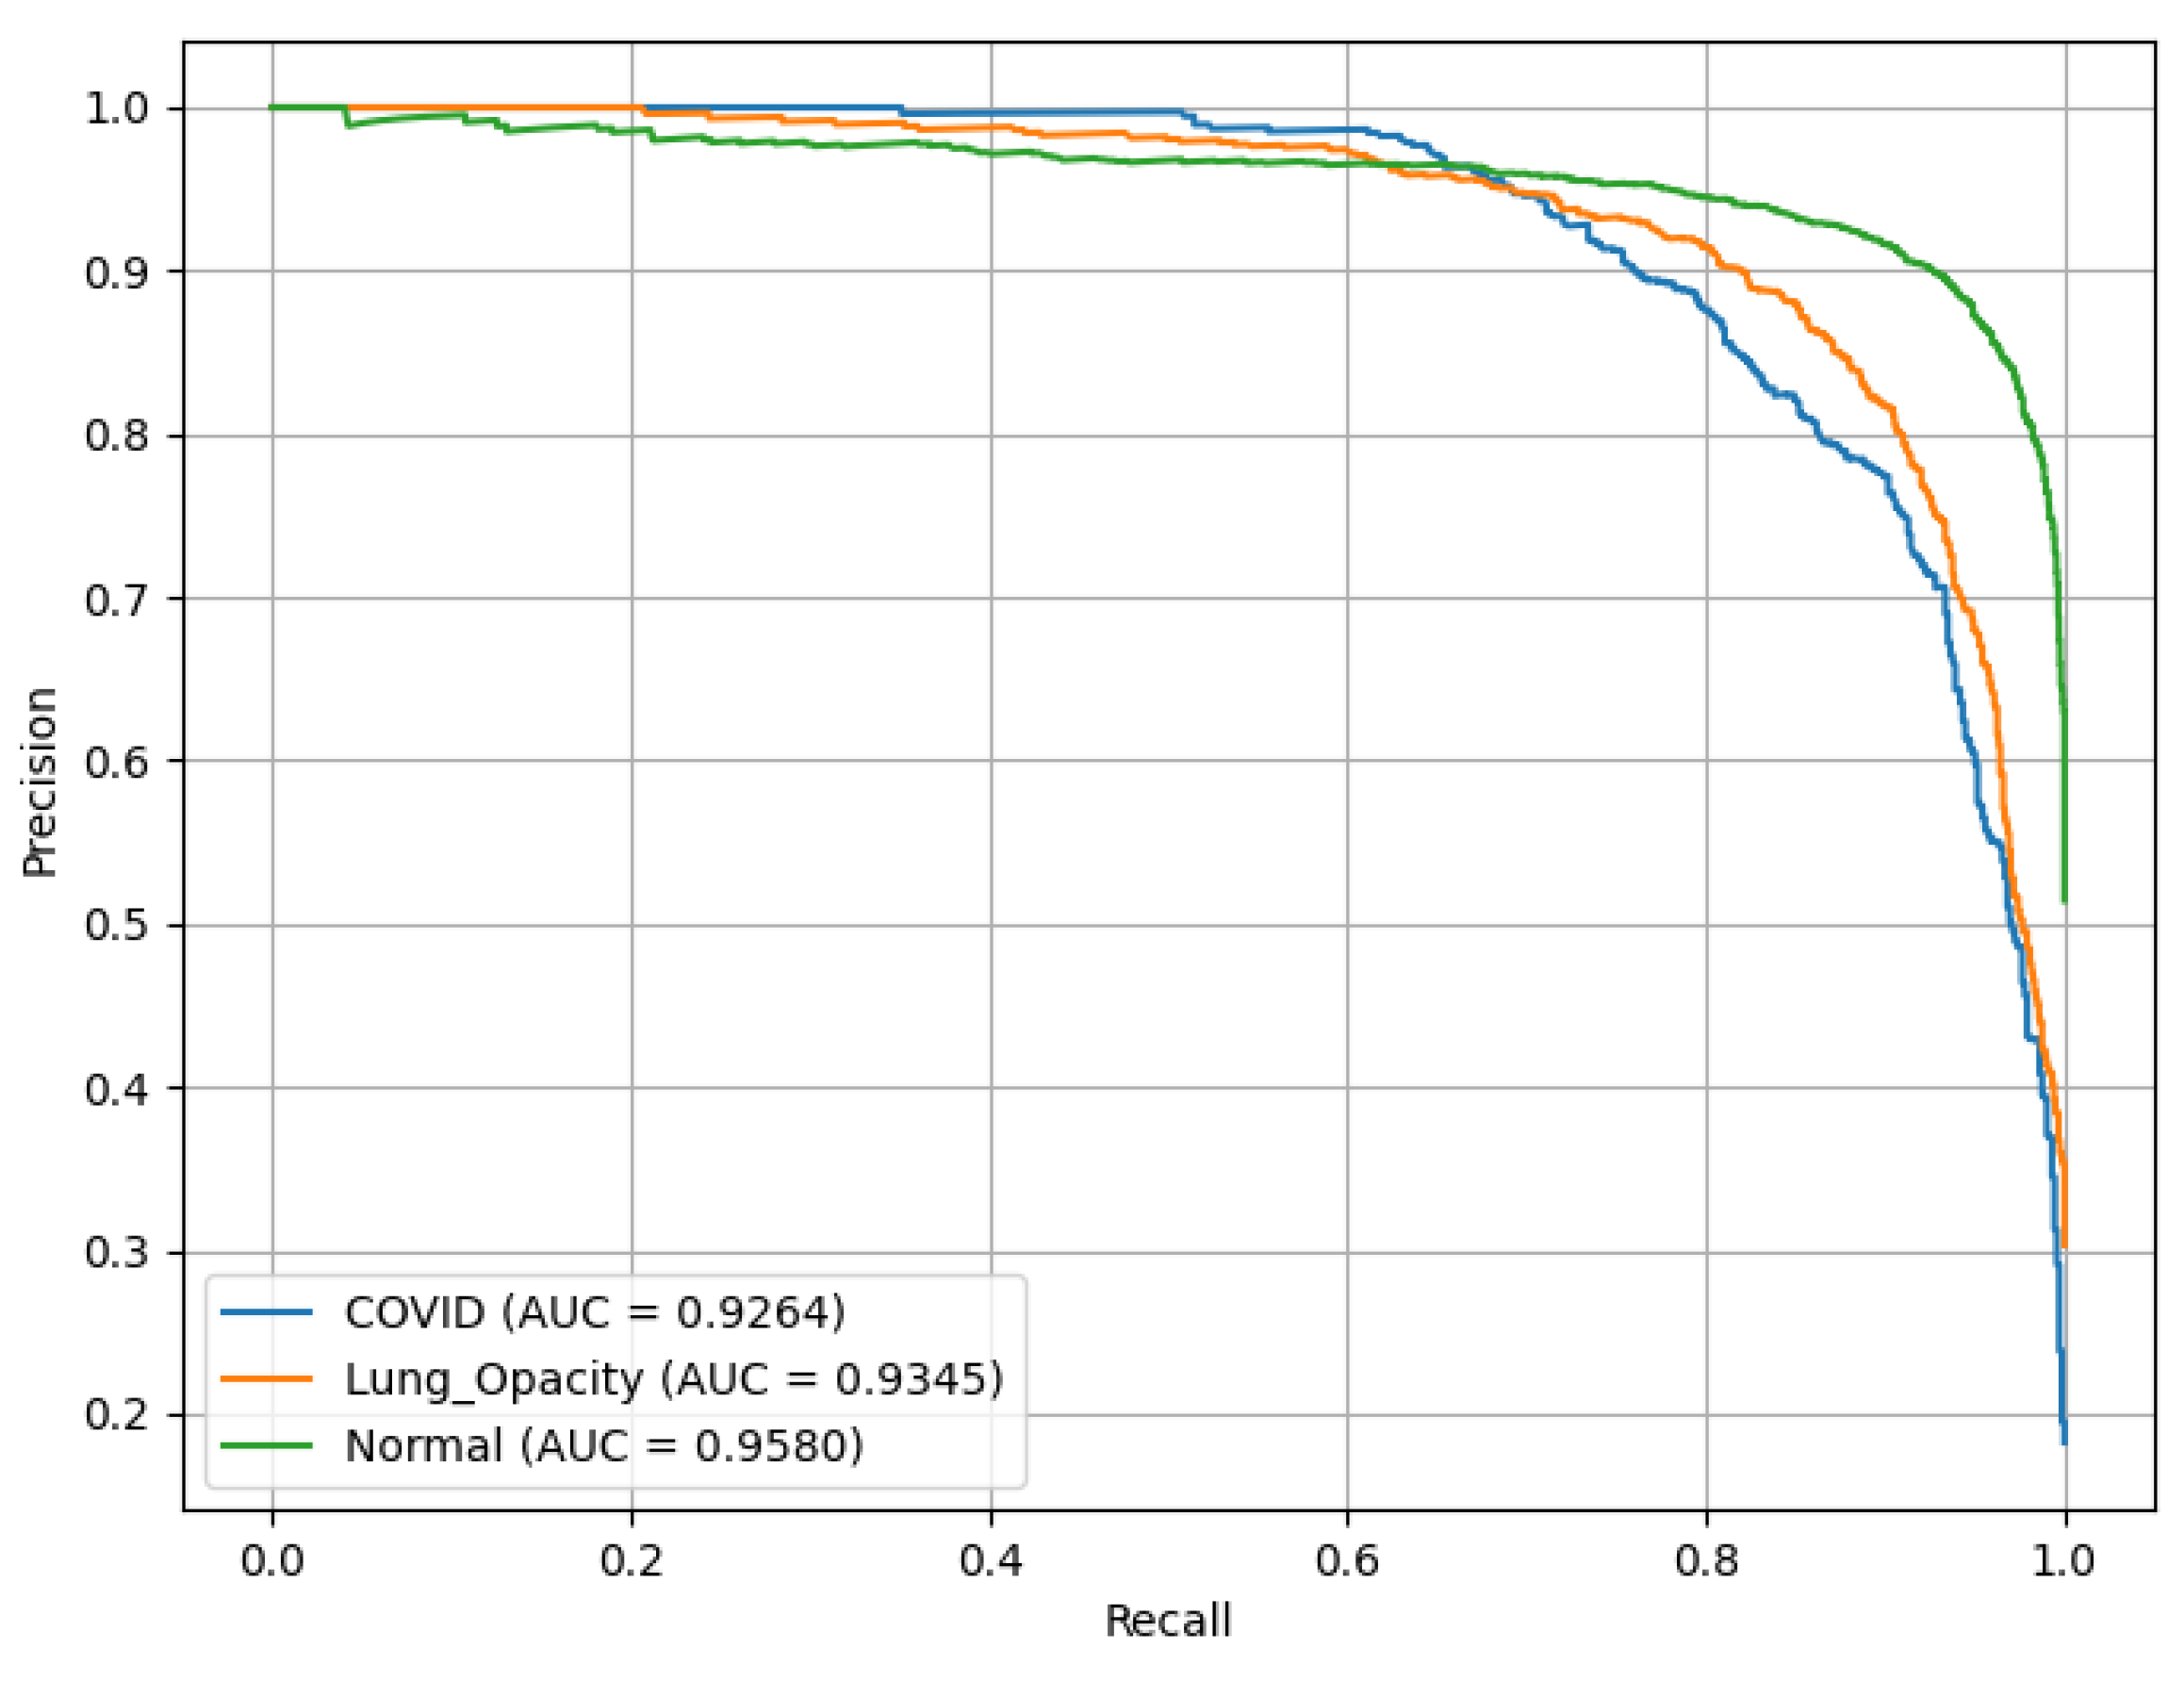
Figure 22 represents PR(AUC) curves that illustrates the performance of the VGG16 model. C19 and LO each achieved an AUC of 0.93, while N (green curve) achieved 0.96.
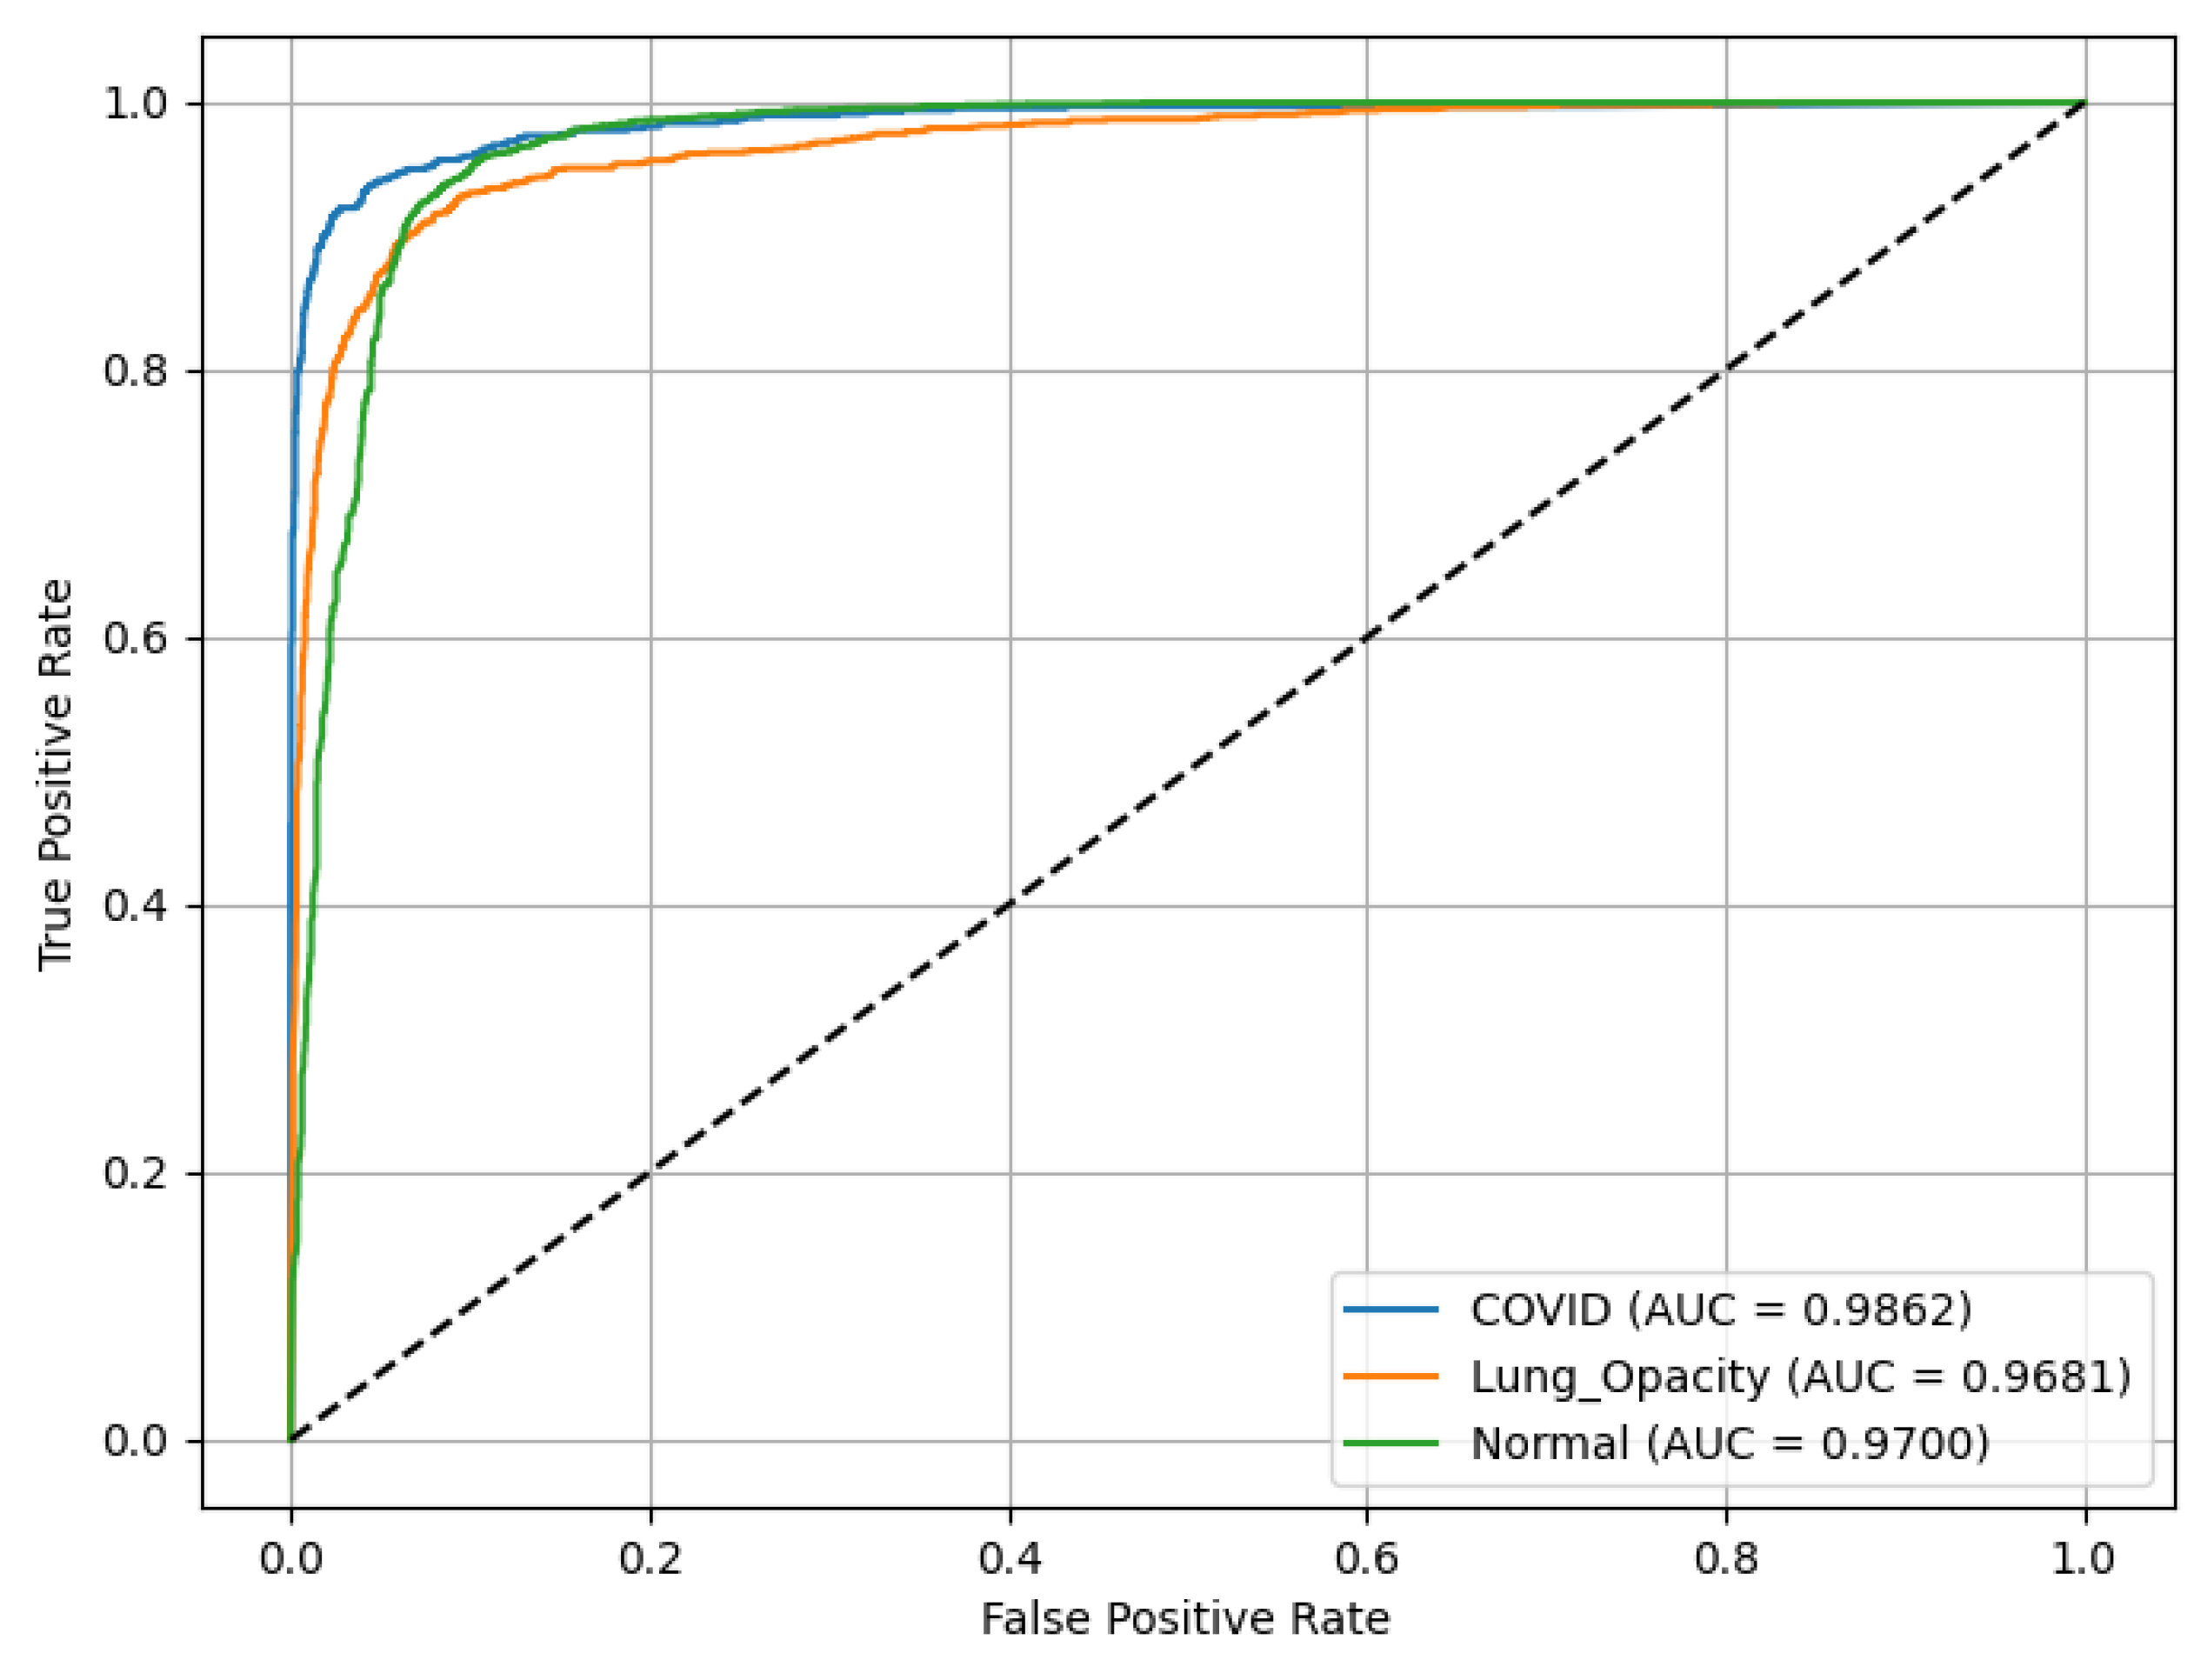
Figure 23 shows that VGG16 achieved an ROC(AUC) of 0.99 for the C19 class, 0.97 for the LO class, and 0.97 for the N class, indicating excellent classification performance. The curves’ positions near the top-left corner of the plot reflect the model’s high Sn and low false positive rate, particularly for the C19 class.
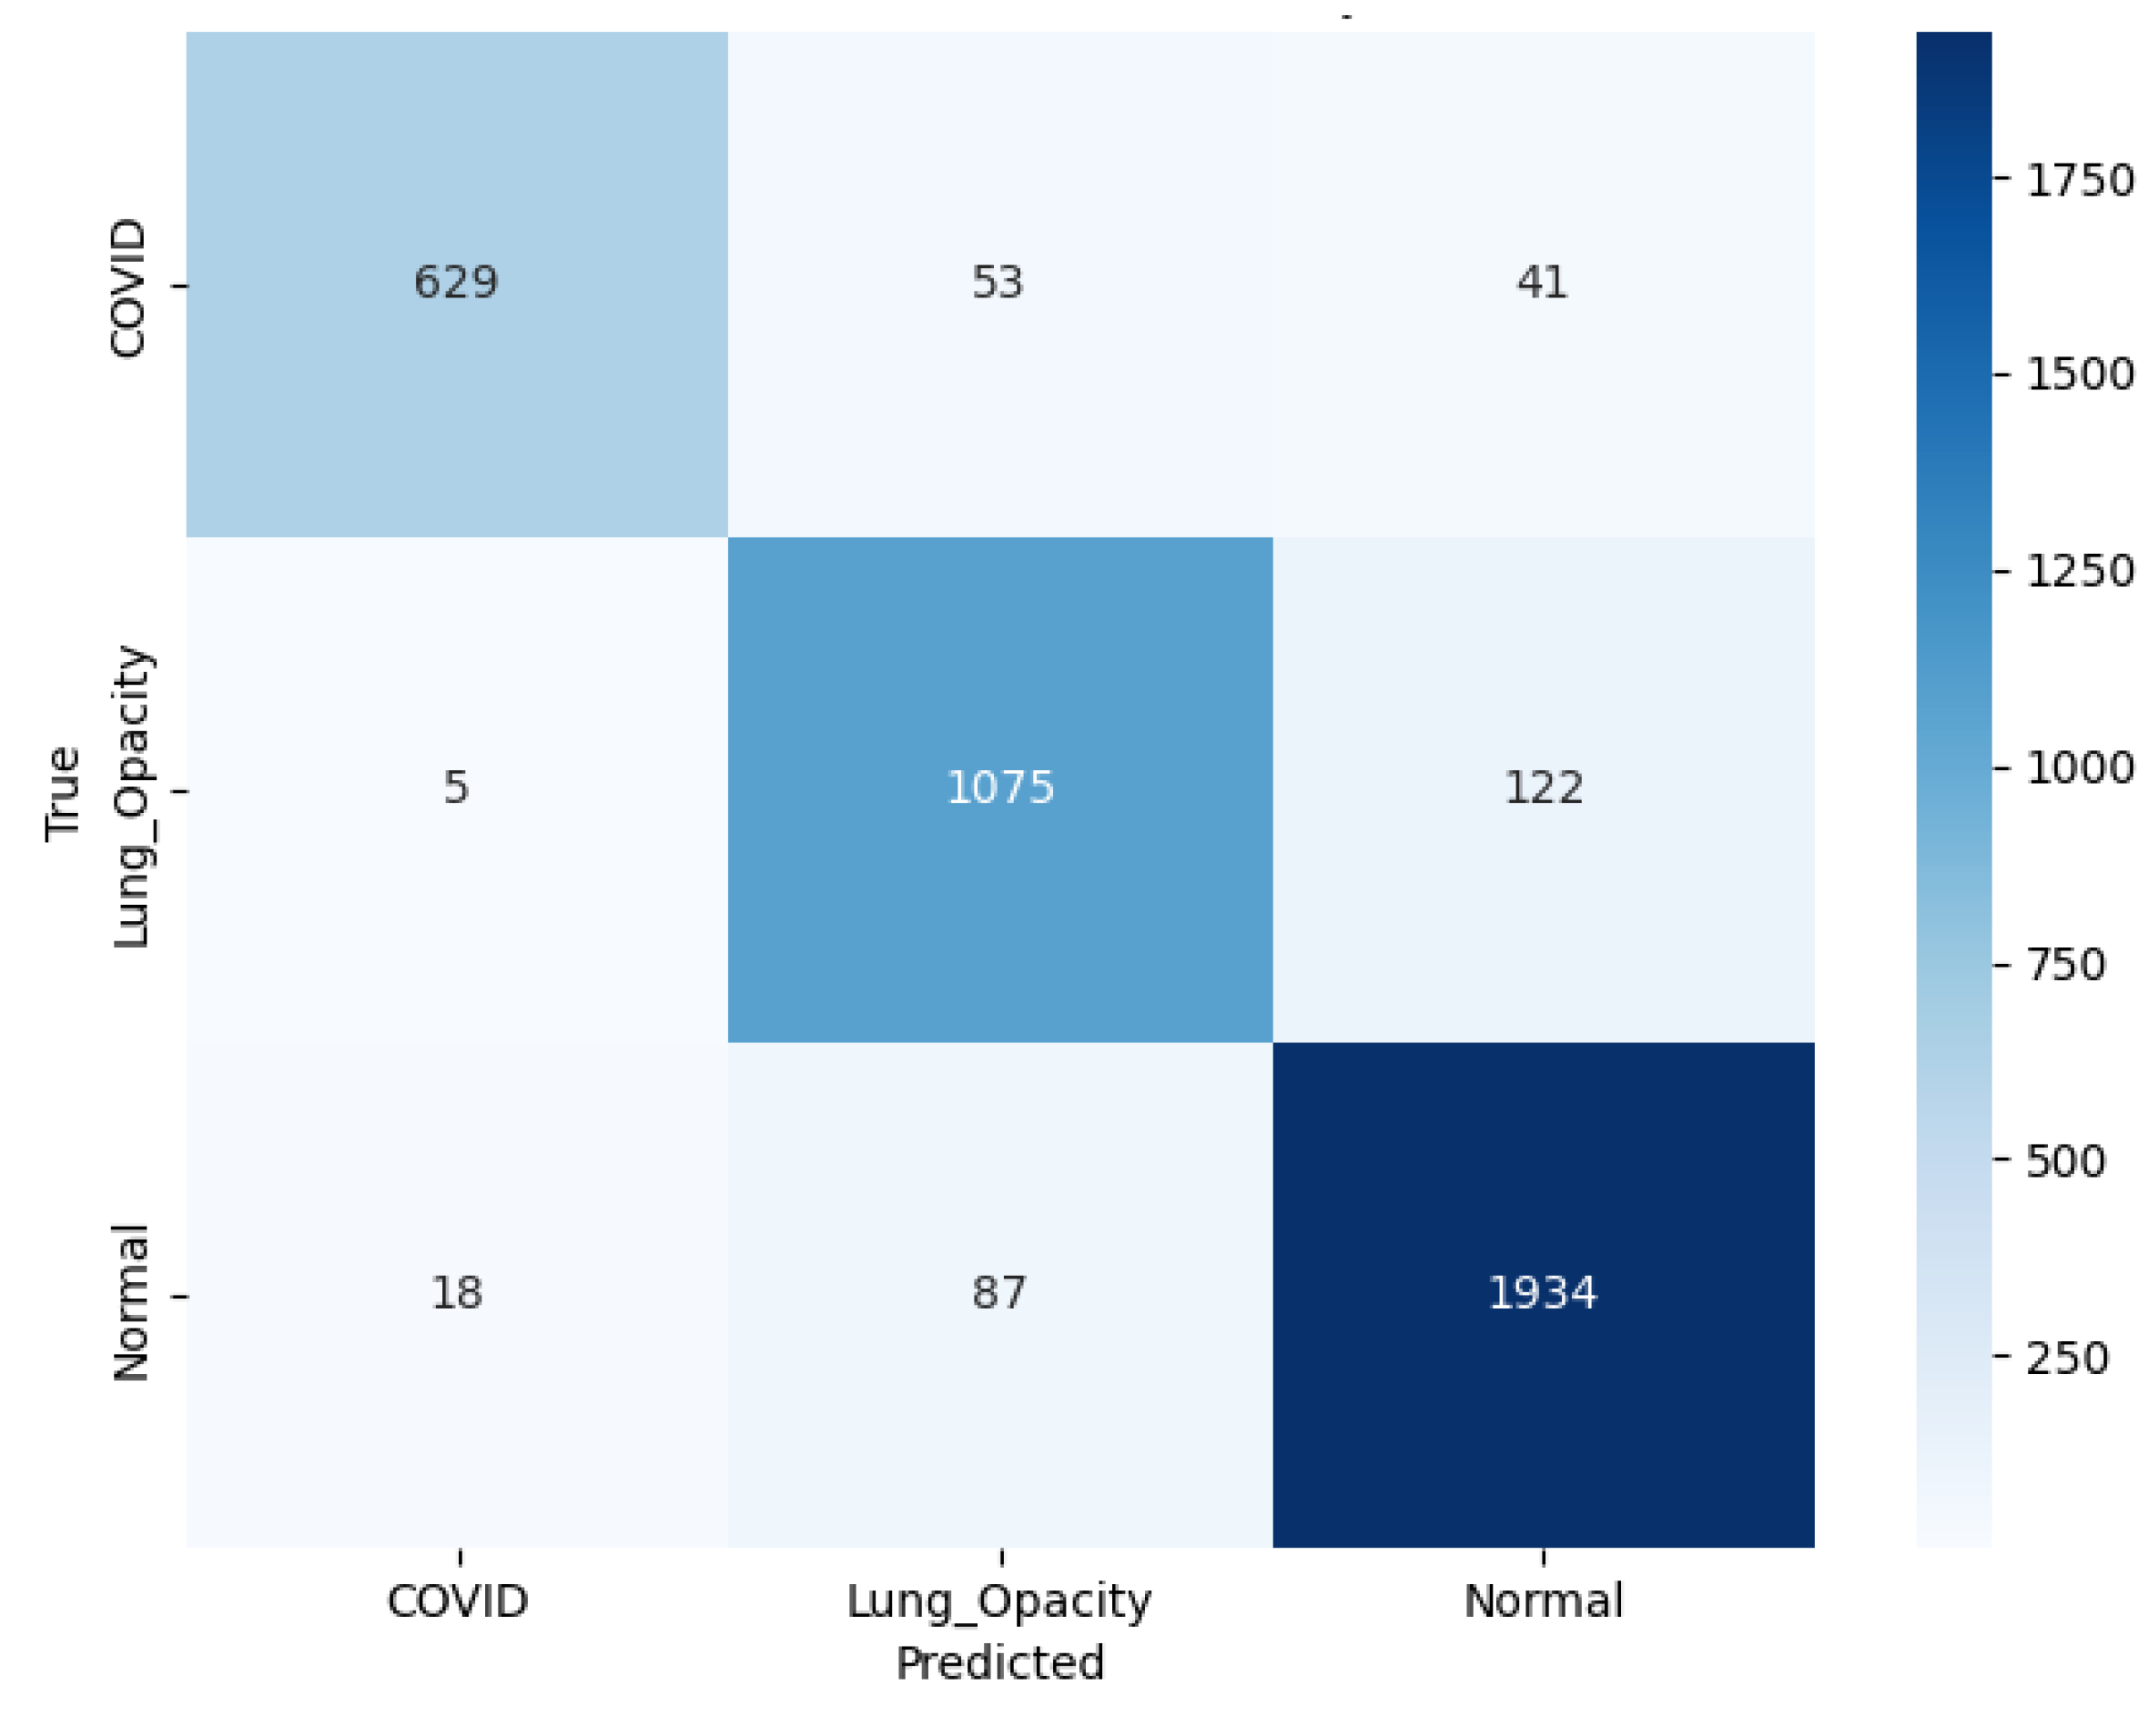
Figure 24 shows that VGG16 correctly predicted 629 C19, 1,075 LO, and 1,934 N cases. Errors included 53 C19 mislabeled as LO and 41 as N. Among LO samples, 5 were misclassified as C19 and 122 as N. Among N samples, 18 were predicted as C19 and 87 as LO.
3.6. Ensemble Contribution Aggregation Results
The integration of five DL algorithms, ResNet50, ResNet18, AlexNet, SqueezeNet, and VGG16, provides valuable insights into their ensemble performance across various diagnostic metrics.
Table 10 illustrates a comparison of the performance of five pretrained DL models. The comparison is based on various performance metrics as illustrated in
Section 2.6.
In terms of A, SqueezeNet outperforms all other models with the highest accuracy of 94.01%, closely followed by ResNet50 at 93.41%. ResNet18 achieves a slightly lower accuracy of 92.74%, while AlexNet scores 91.60%. This indicates that SqueezeNet leads in terms of overall performance in this category. For recall (Rc/Sn), SqueezeNet again takes the lead with a recall score of 93.95%, showing its ability to identify true positives. ResNet50 and ResNet18 also perform strongly with recall values of 93.24% and 92.42%, respectively. Regarding Pr, SqueezeNet stands out with a precision score of 94.65%, followed by ResNet50 at 93.66%. The other models, AlexNet, ResNet18, and VGG16, show slightly lower Pr, indicating SqueezeNet’s superior ability to identify true positive results with fewer false positives.
For ROC(AUC) and PR(AUC), SqueezeNet remains the top performer, achieving an AUC score of 0.98 in both ROC and PR curves. ResNet50 and ResNet18 also perform well, each scoring 0.98 in ROC(AUC) and 0.97 in PR(AUC), reflecting their ability differentiating positive/ negative cases. In terms of the F1-score SqueezeNet again leads with a performance score of 94.01%, followed by ResNet50 with 93.44%. VGG16 achieves the lowest F1-score at 90.26%, indicating it may struggle with balancing Pr (91.77%) and recall (89.11%) in comparison to other models. The accuracy shows that SqueezeNet is the most effective model across the various metrics, with ResNet50 follows closely in second place, showing competing overall performance.
For the weighted-ensemble performance,
Table 11 shows the contribution of the weighted metrics for the five CNN backbone models and the resulting weighted totals. Weights are consistent across models (around 18-20% each), with slight increases for SqueezeNet and ResNet50 in all columns, suggesting complementary contributions rather than reliance on a single backbone. The optimized ensemble achieves strong overall performance: 92.57% accuracy, 92.36% F1-score, 93.00% Precision, and 91.95% Recall. Discrimination is excellent, with an ROC(AUC) of 0.98 and PR(AUC) of 0.97, which is impressive for a three-class imbalanced dataset. Summing up, combining the five models with an optimized weight distribution results in a balanced classifier that provides robustly optimized outcomes by finely balancing the contribution from each classifier.
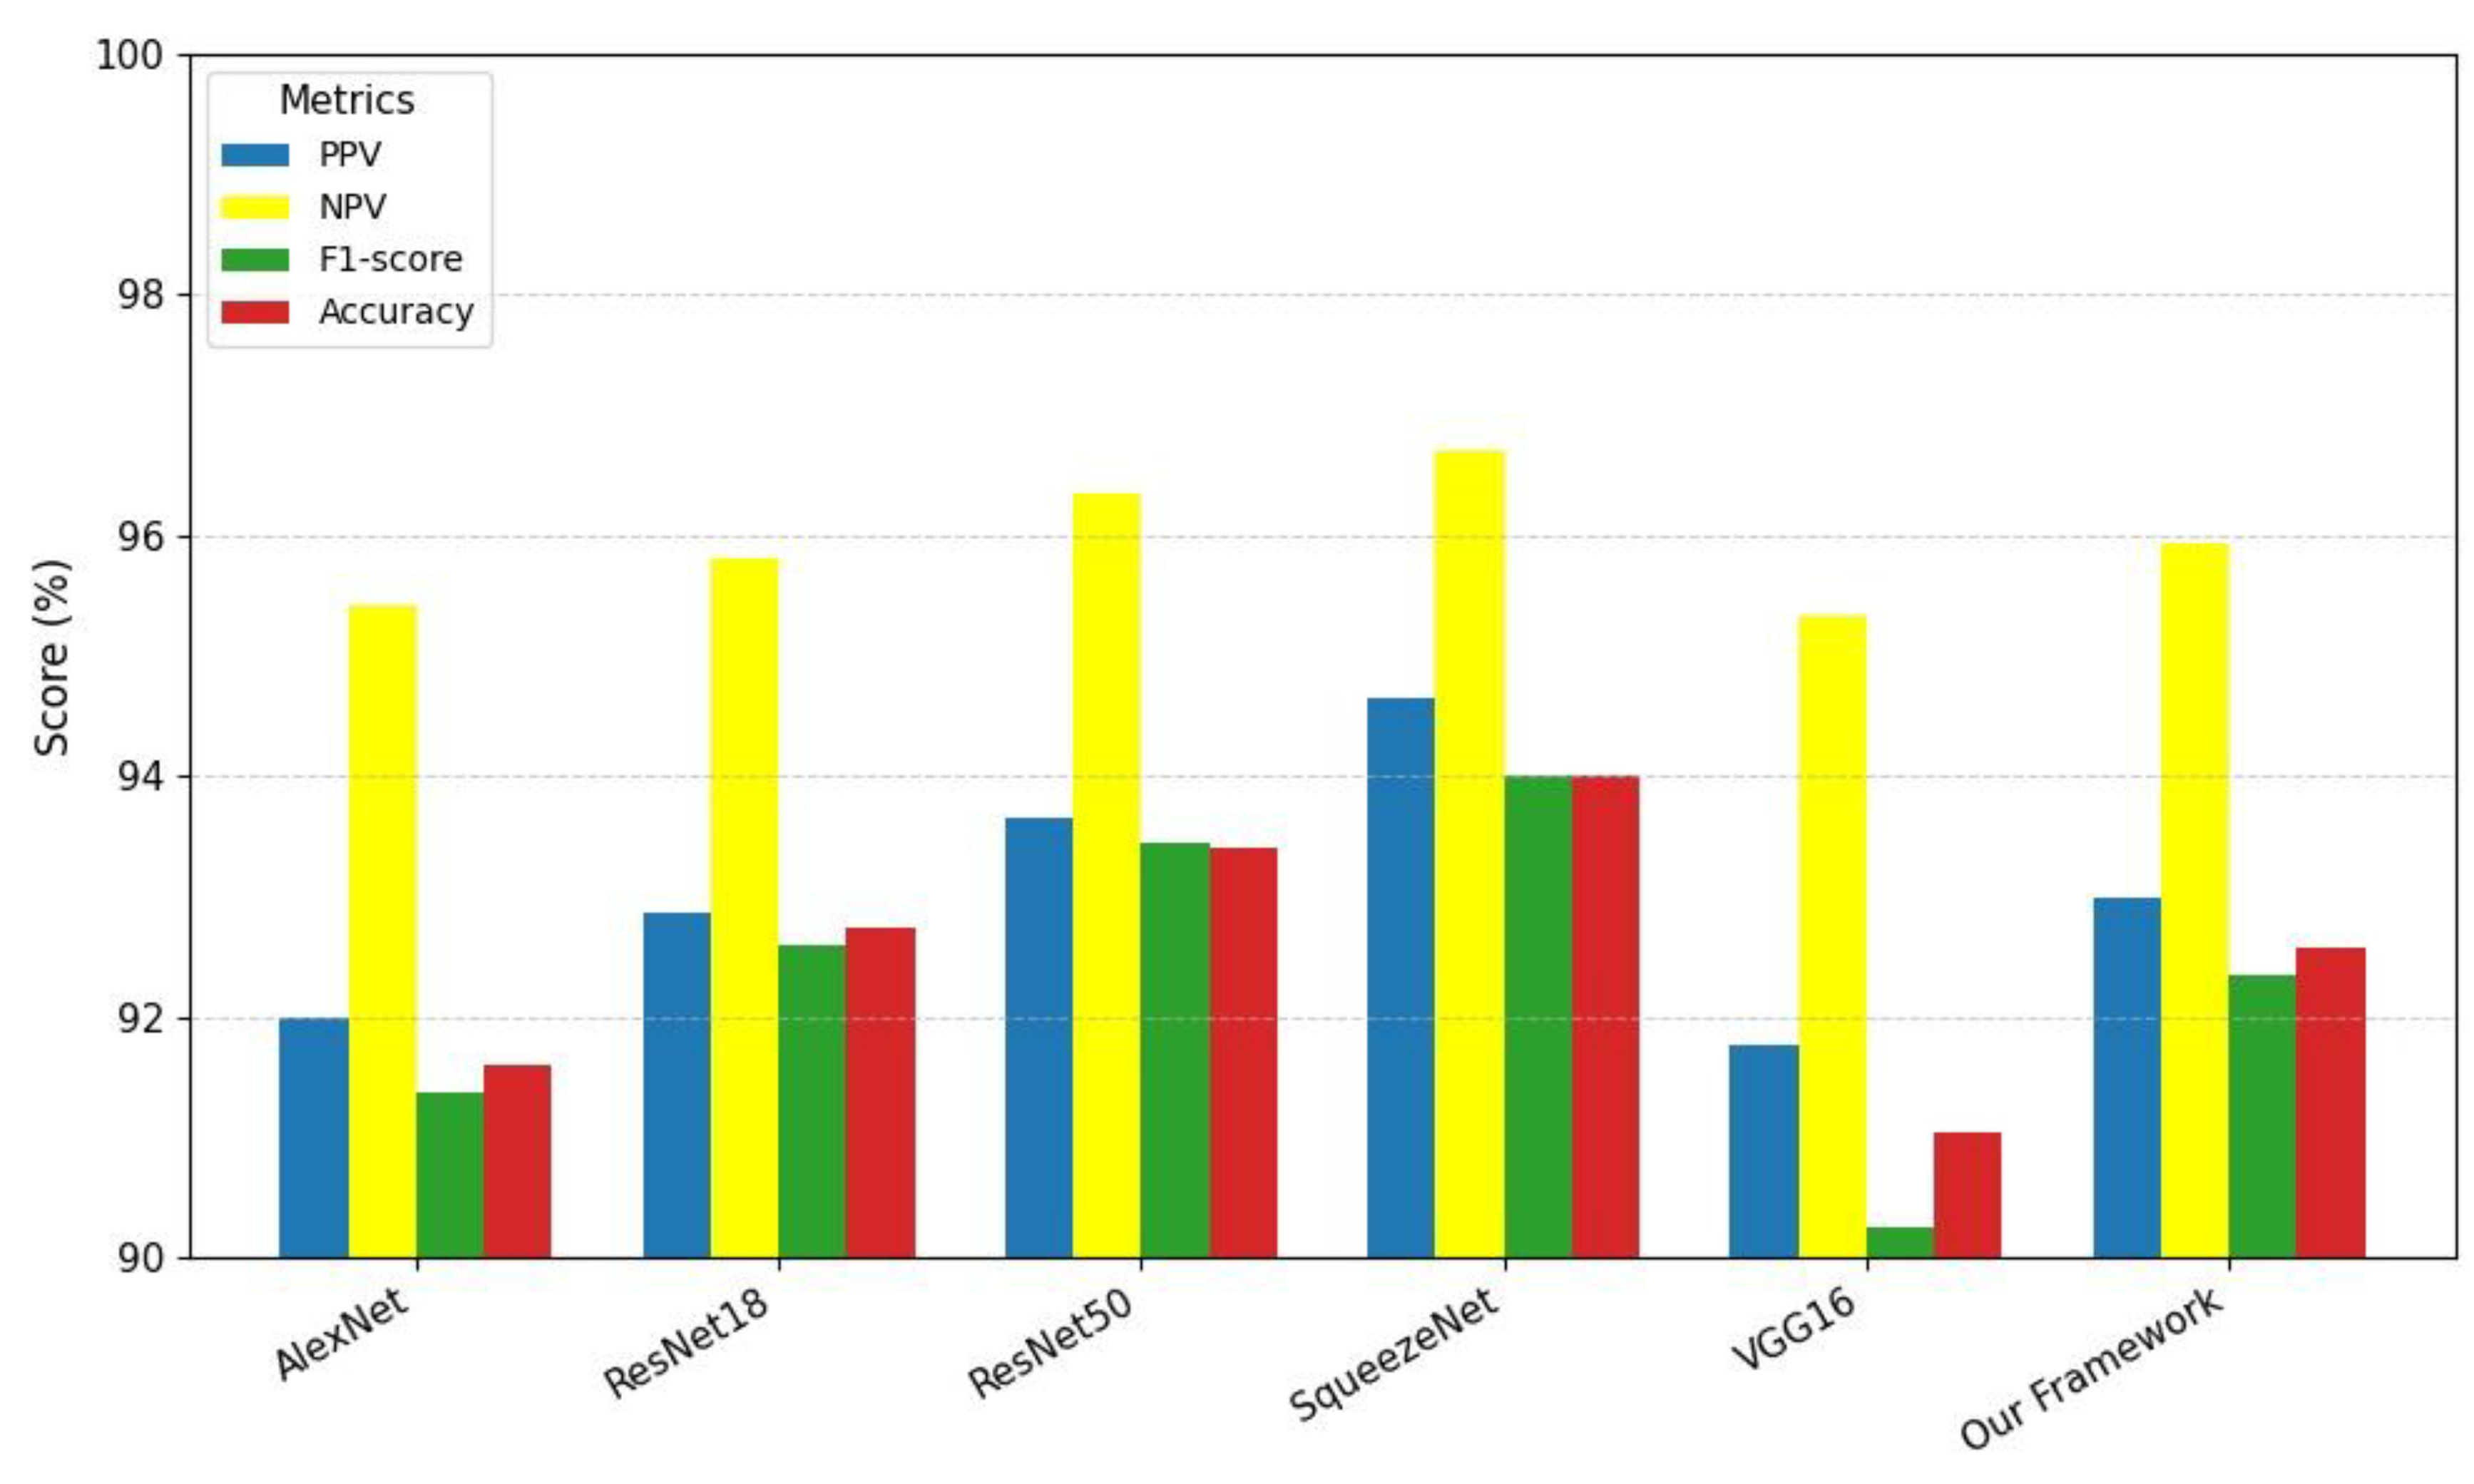
A visual comparison of various model evaluation scores, including PPV, NPV, F1-score, and
A, for different studies is illustrated in
Figure 25. These models are represented as bars on the x-axis: AlexNet, ResNet18, ResNet50, SqueezeNet, VGG16, and our proposed framework. The evaluation metrics are color-coded: PPV is shown in yellow, NPV in blue, F1-score in red, and
A in green. From the graph, it is clear that the proposed framework achieves competitive performance across all metrics. Notably, the proposed framework demonstrates a high accuracy score, comparable to the best-performing models. However, its F1-score, which balances precision and recall, stands out as the highest among all models.
3.7. Comparison of the Proposed Study with Other Techniques
A comparison of different cohorts for C19-based classification is presented in
Table 12. For a fair deduction of the standpoint of the proposed methodology, all the study selections are based on the same dataset or some of its derivatives. Each cohort, of course, is utilizing a different methodology and data split to achieve classification across various classes, including C19, LO, N, and VP. We have used the first three classes to make the task challenging. The last class achieves outstanding results, specifically, due to its discriminative characteristics, which can otherwise lead to negatively biased performance in other classes due to feature dominance.
Samir et al. [
63] employed TL with architectures like AlexNet, GoogLeNet, and ResNet-18, combined with a custom CNN. The data is split in an 80/20 ratio, and it classifies four classes, achieving an accuracy of 94.10%. However, this model faces limitations such as bias due to the highly discriminative features of VP. In another study, Wang et al. [
64] used MobileNetV3 along with a Dense Block and 5-fold CV. This model classifies three classes, C19, N, and VP, reaching an overall accuracy of 98.71%. Like the previous model, it is limited by VP class-bias from the dataset and cross-testing using just one dataset. Singh et al. [
65] used a U-Net architecture for lung segmentation and combined it with a Convolution-Capsule (Conv-Cap) Network. The data is divided into 70% for training, 15% for validation, and 15% for testing. It classifies the same three classes as given, illustrated in [
64], but the accuracy drops to 88%. This model also suffers from bias, particularly towards the highly discriminative features of VP (
A = 93%).
Khan et al. [
66] combined features from TL models with a hybrid whale-elephant herding selection scheme and an extreme learning machine (ELM). The dataset is split into two partitions, namely training and testing, each of 50%, with a 10-fold CV applied on each. This model classifies four classes, achieving a remarkable accuracy of 99.1%. While its performance is impressive, it is still limited by the fact that the second partition for testing will be used for deriving the results. The training partition carrying 50% of the dataset would not be involved in deriving the results. Furthermore, the use of only one dataset for cross-testing introduces bias due to VP features.
Our proposed framework involves an ensemble of transfer learning with 5-fold cross-validation, classifying three classes, C19, N, and LO, and achieving 92.57% accuracy. The results are robust against model learning bias effects by applying an optimized weight distribution algorithm. Overall, the proposed framework shows competitive performance, though it does not surpass the highest accuracy achieved by [
66]. The analysis highlights the common challenge of bias towards VP features and the limitations related to using a single dataset for cross-testing, which affects the generalization ability of the models.
3.8. Main Findings
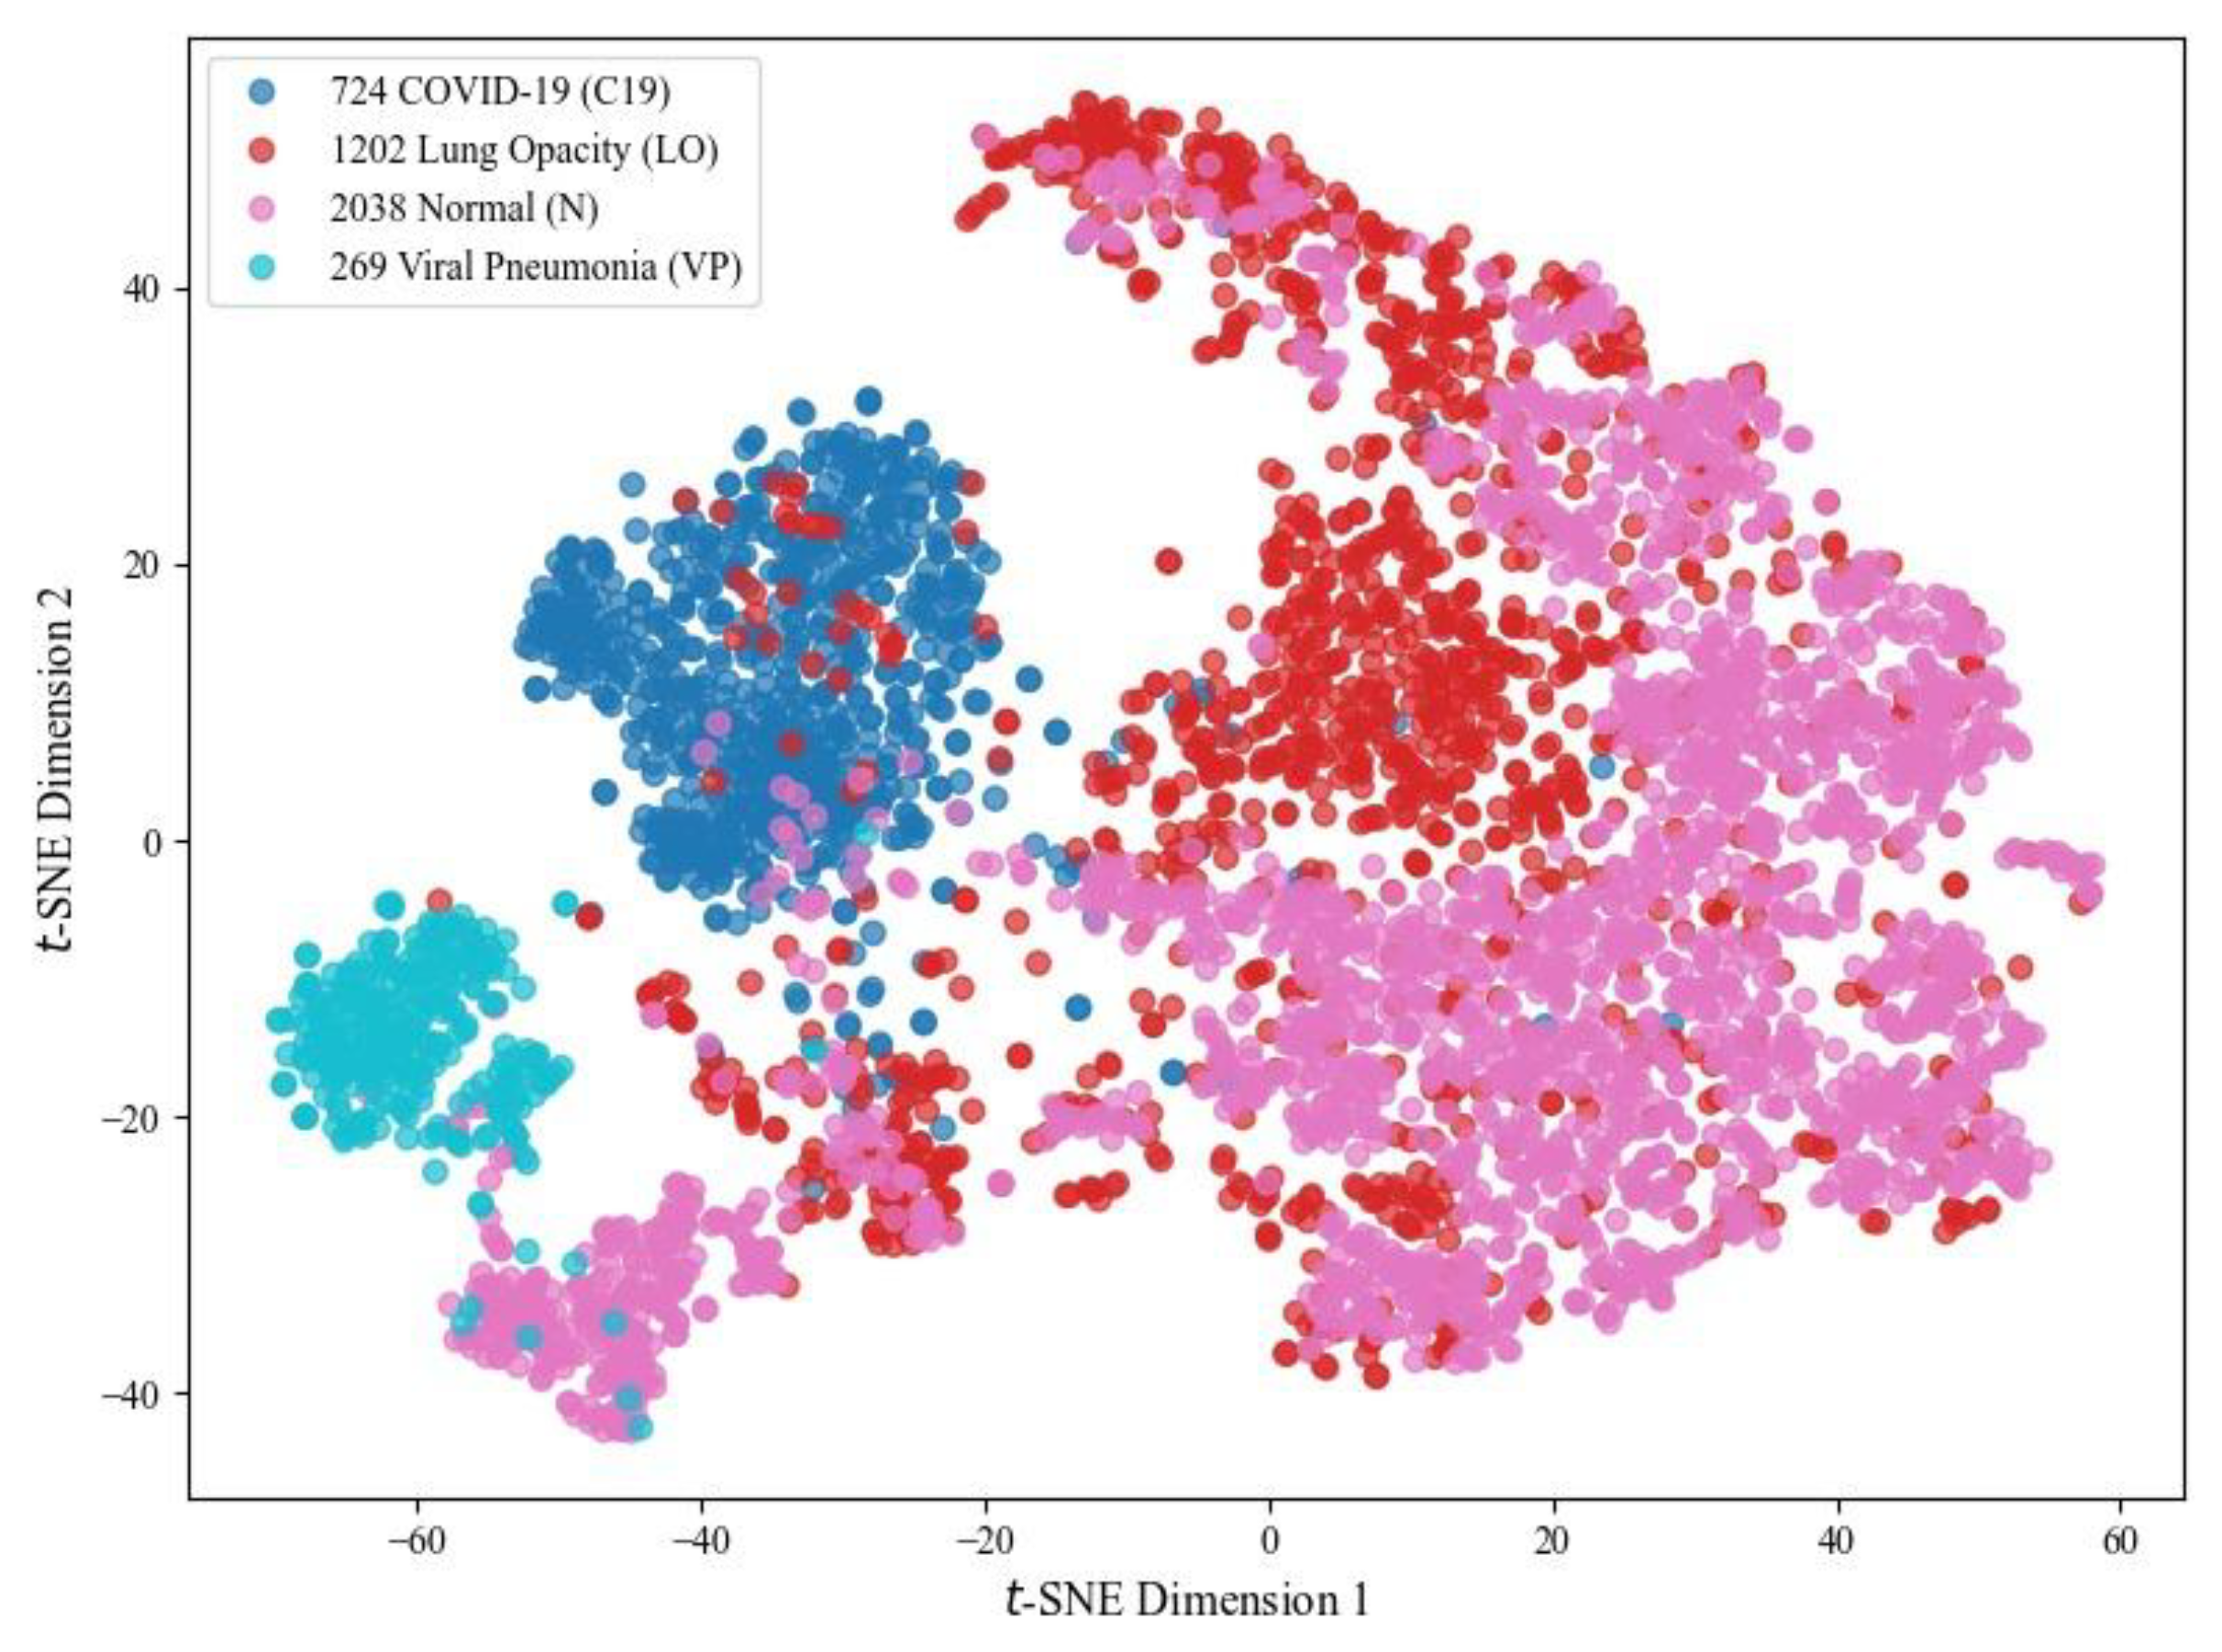
The article proposes a DL-based TL method for COVID-19 detection from chest radiographs and CT scans using a weight-optimized distribution algorithm, ensuring that each model’s metric influence is proportional to its performance. It uses an extensive, varied dataset to make the task more challenging, where the strong classification ability of Class VP may negatively affect the performance of Classes C19, LO and N. The discriminative nature of the VP class feature, as illustrated in
Figure 26, is clearly observed in the 4-class t-SNE plot using the SqueezeNet pretrained model with 25 epochs.
The study addresses imaging feature variations across five DL models, improving differentiation between C19 manifestations in young and elderly patients. It also offers a non-invasive, cost-effective AI-based diagnostic tool, overcoming the limitations of traditional RT-PCR tests, such as lower sensitivity and longer turnaround times. The proposed framework supports radiologists with reliable second opinions and serves as an educational tool for medical graduates.
3.9. Limitations and Future Recommendations
While this study demonstrates promising results with DL architectures, and those focusing on C19 classification using chest radiographs have made significant progress. However, there are still limitations and areas that need improvement with respect to our study. The following are some key limitations and future recommendations.
One key limitation of this study is the absence of grid computing infrastructure, which could have enhanced the scalability and efficiency of training DL models on large datasets [
67]. Without this capability, the training process relied on conventional hardware, potentially limiting the exploration of larger networks or ensemble methods that could improve classification performance. Additionally, the dataset used in this study was neither multi-institutional nor multi-parametric, which may affect the generalizability of the findings. A single-source dataset carries the risk of bias, as it may not fully represent diverse demographic variations, imaging protocols, or disease manifestations seen across different hospitals and populations [
68].Incorporating multi-institutional data with clinical, laboratory, or genomic parameters could have further strengthened the model’s robustness and cross-clinical performance. These limitations highlight opportunities for future work to integrate distributed computing and diverse datasets for more reliable and scalable AI-driven C19 diagnosis.
To improve and expand this work in future, one promising direction is the adoption of explainable artificial intelligence (XAI), which can provide transparent insights into model predictions, highlighting key radiographic features that contribute to C19 diagnosis [
69]. Another transformative trend involves the convergence of Nano-diamond-based bio-sensing with DL for multimodal disease assessment. Nano-diamonds offer ultra-sensitive, label-free detection of viral biomarkers, enabling early diagnosis when integrated with AI-driven radiographic analysis [
70]. Moreover, Radiogenomic approaches can link imaging phenotypes with genomic data, enabling precision medicine in C19 management [
71]. By training DL models on multi-modal datasets that incorporate chest X-rays, genetic risk factors, and proteomic biomarkers, AI systems could predict disease severity. Additionally, large deep learning models (ResNet50, ResNet18, VGG16, AlexNet, SqueezeNet), which contain a large number of learnable parameters, these could potentially be reduced by utilizing lightweight architectures [
72].
Figure 1.
Methodological Framework for C19 detection using DL Models.
Figure 1.
Methodological Framework for C19 detection using DL Models.
Figure 2.
C19 dataset: instance distribution by class.
Figure 2.
C19 dataset: instance distribution by class.
Figure 3.
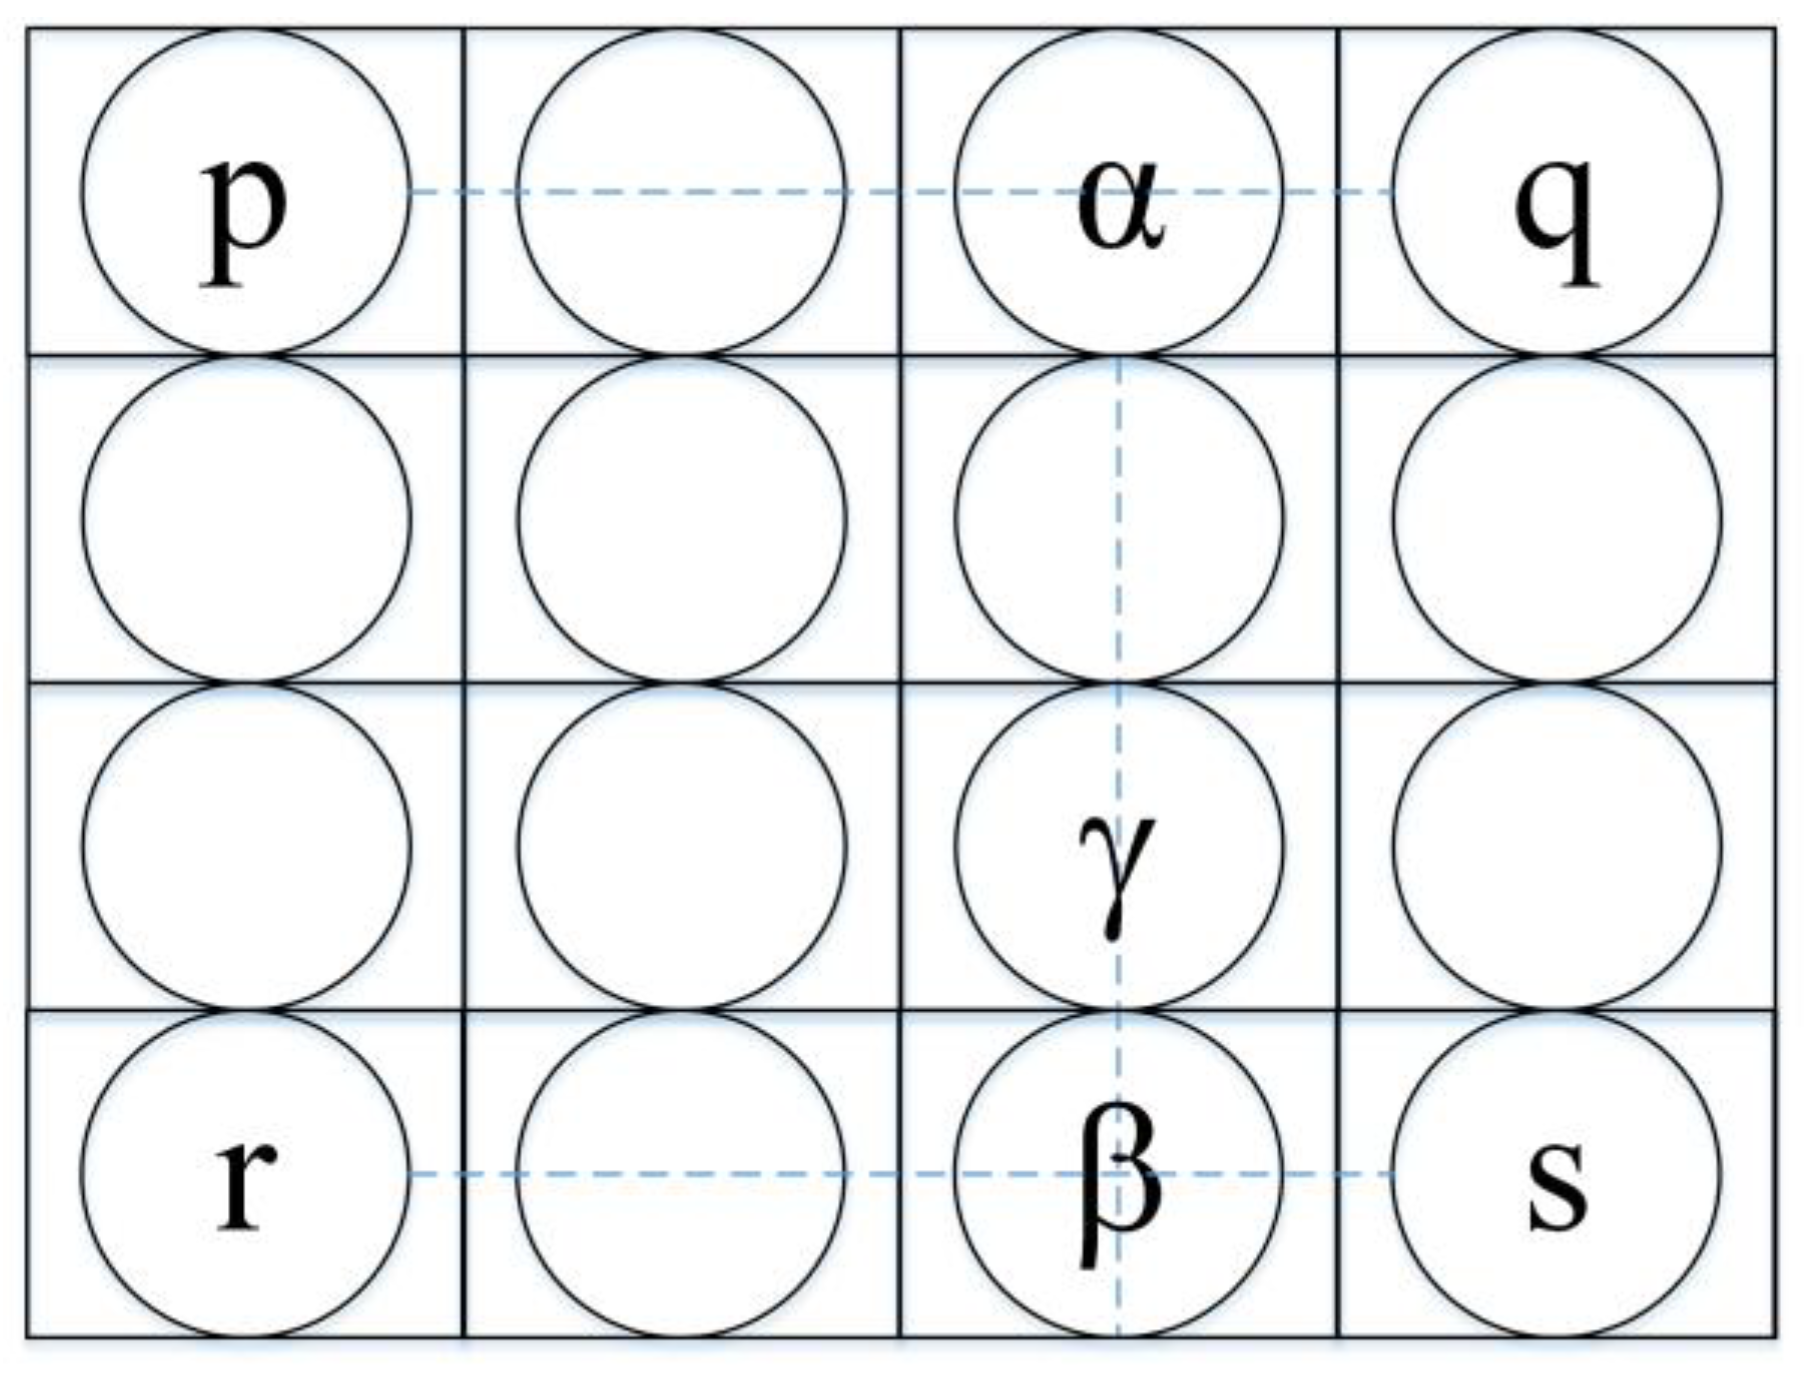
Resizing the chest X-ray images using bilinear interpolation where the intensity value at a new pixel location is estimated based on the weighted average based on the four nearest surrounding pixels.
Figure 3.
Resizing the chest X-ray images using bilinear interpolation where the intensity value at a new pixel location is estimated based on the weighted average based on the four nearest surrounding pixels.
Figure 4.
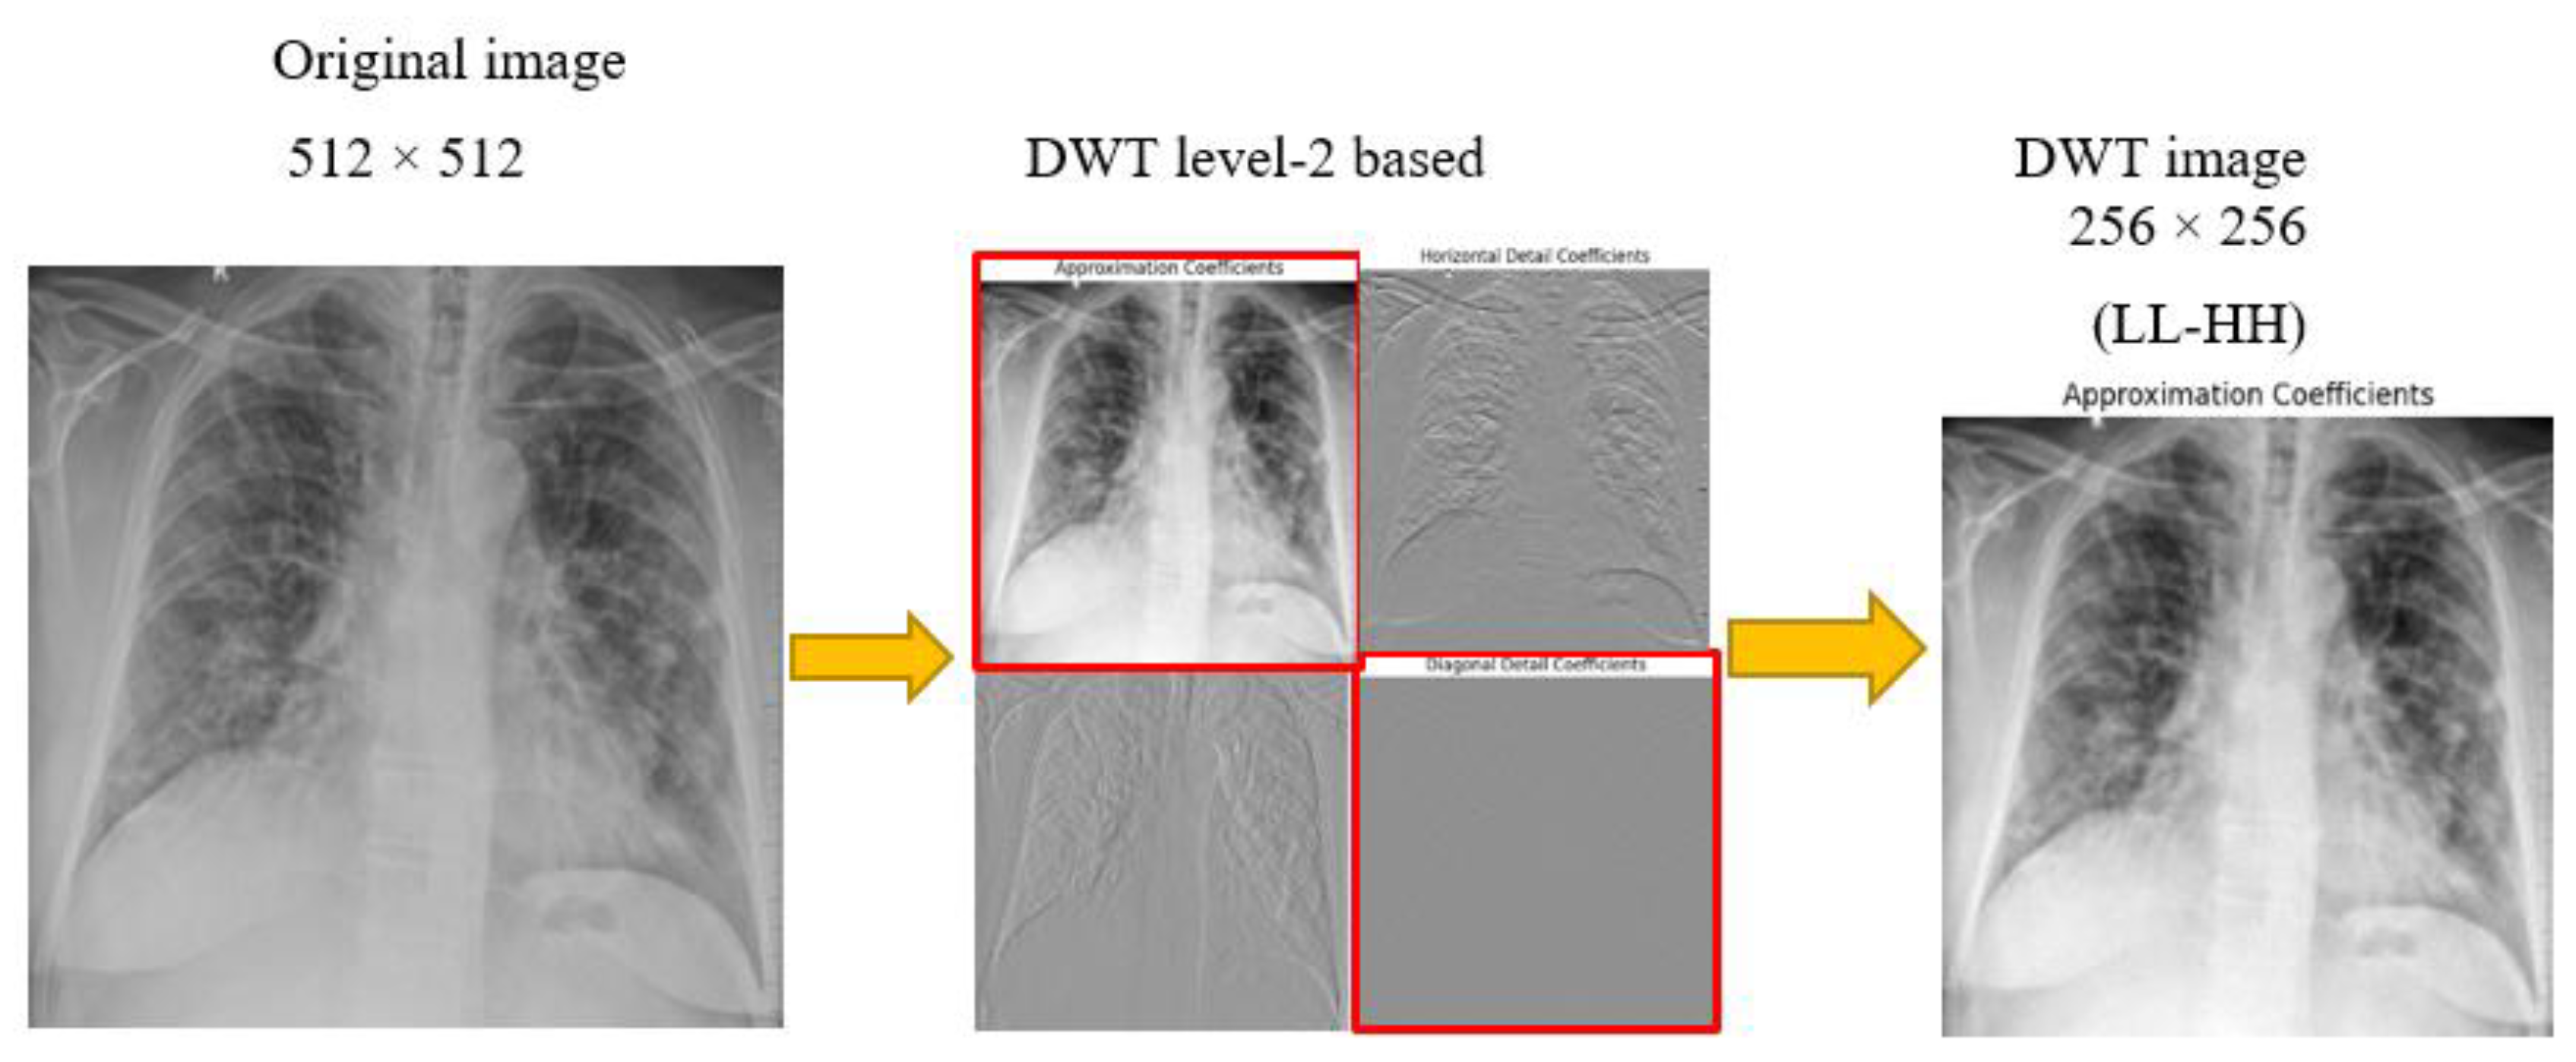
DWT decomposition of X-ray radiographs to obtain high contrast images.
Figure 4.
DWT decomposition of X-ray radiographs to obtain high contrast images.
Figure 5.
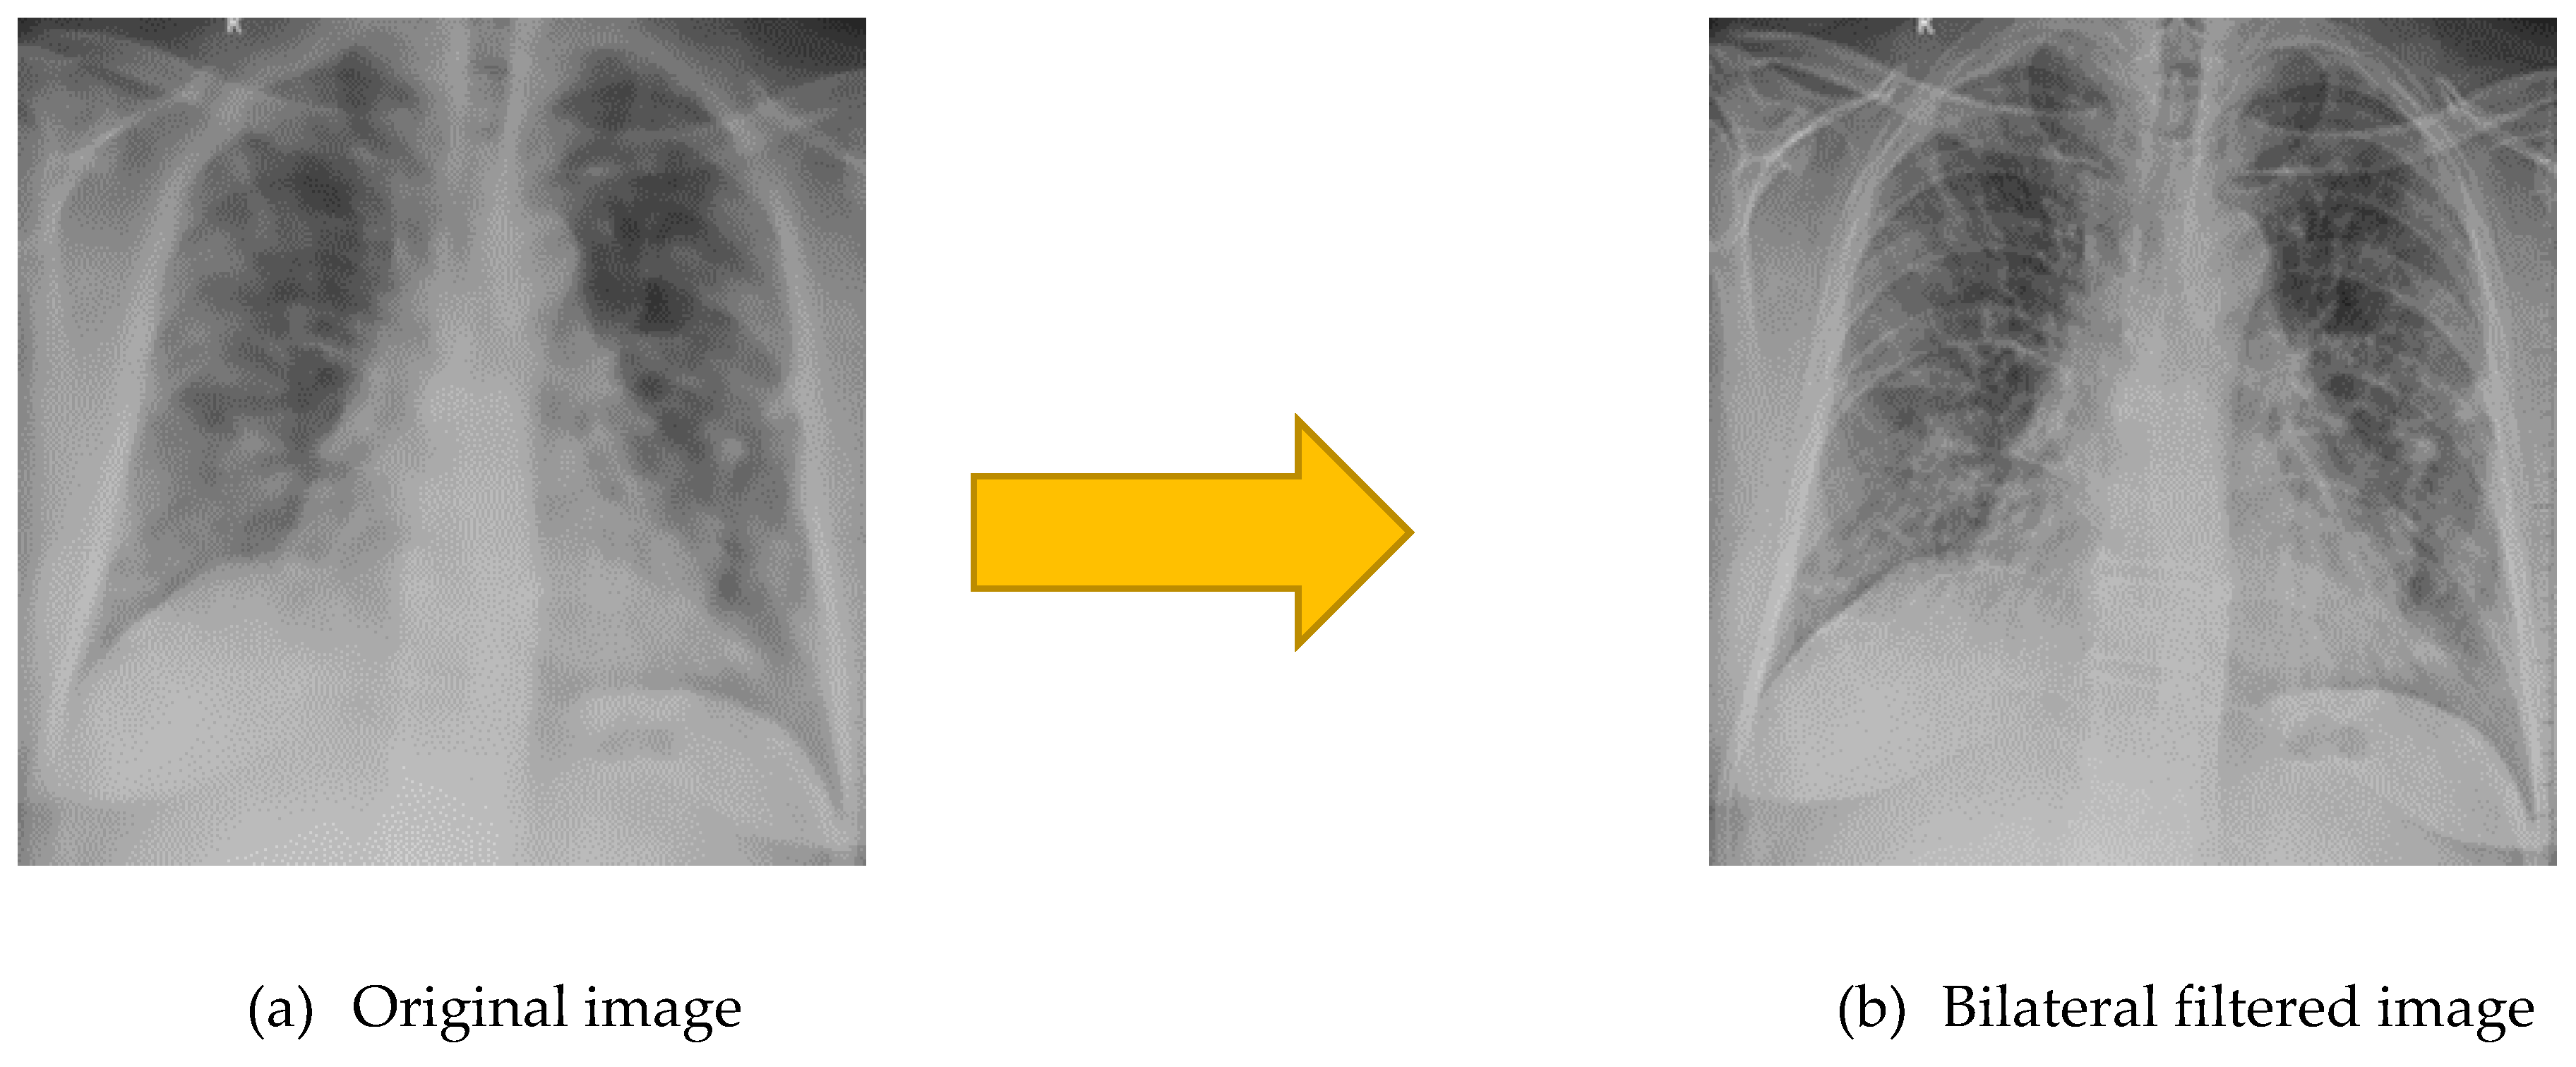
Bilateral filtered image (a) is very smooth with preserved edges, reduced texture than (a) original image.
Figure 5.
Bilateral filtered image (a) is very smooth with preserved edges, reduced texture than (a) original image.
Figure 6.
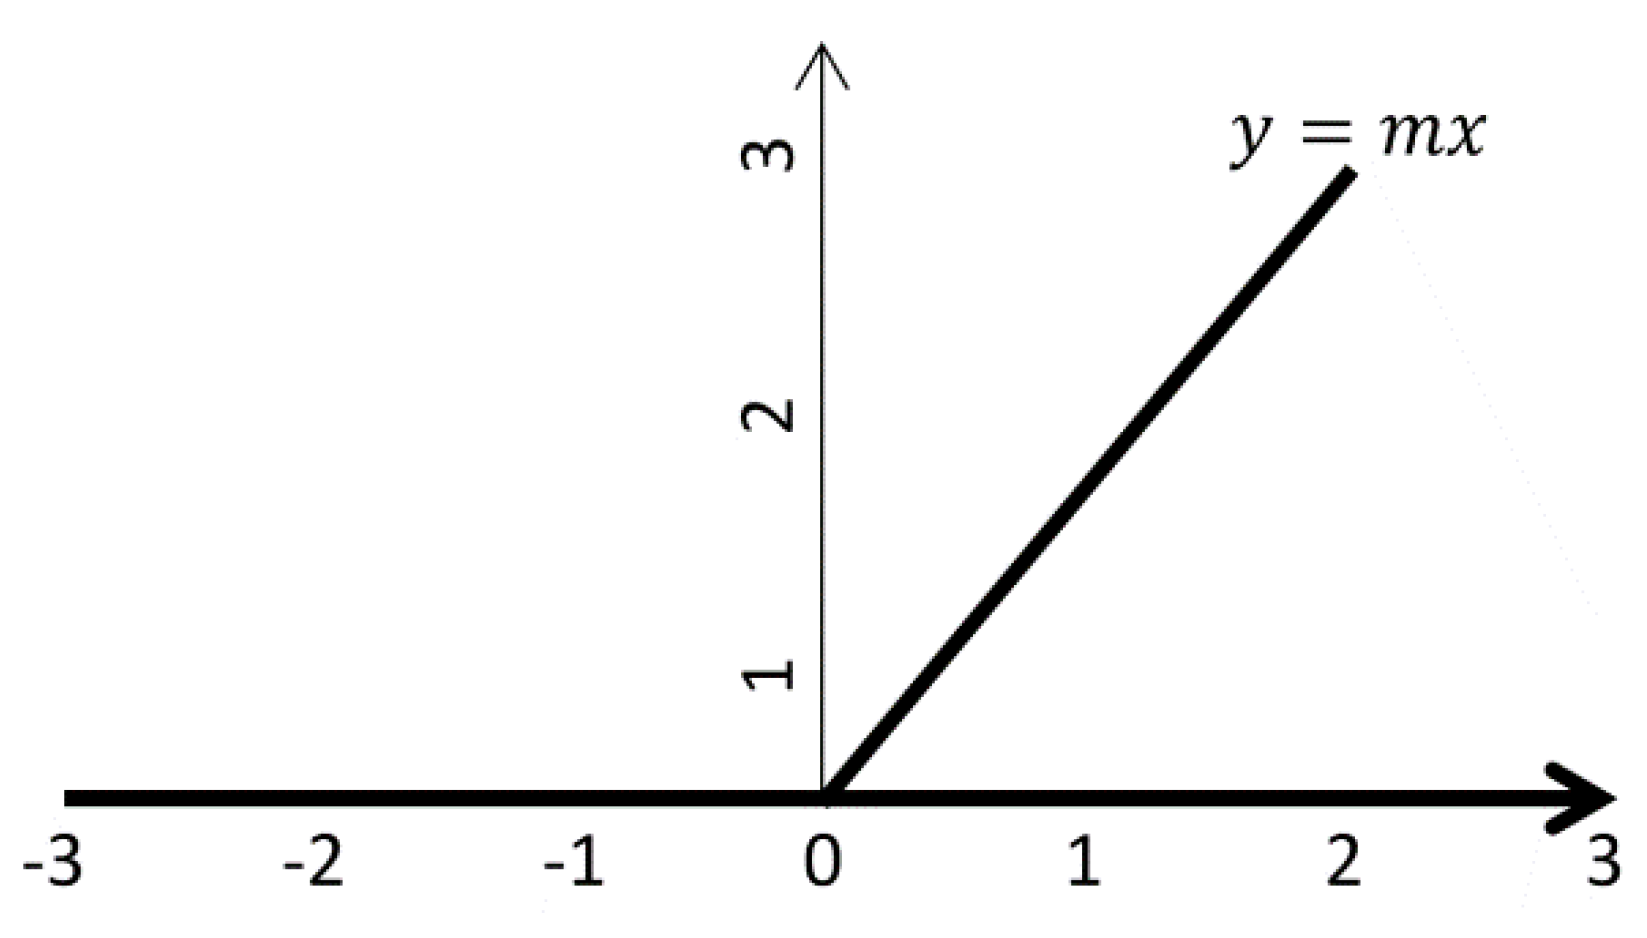
ReLU for input values x < 0, the function outputs 0 (a flat horizontal line along the x-axis), effectively suppressing negative values.
Figure 6.
ReLU for input values x < 0, the function outputs 0 (a flat horizontal line along the x-axis), effectively suppressing negative values.
Figure 7.
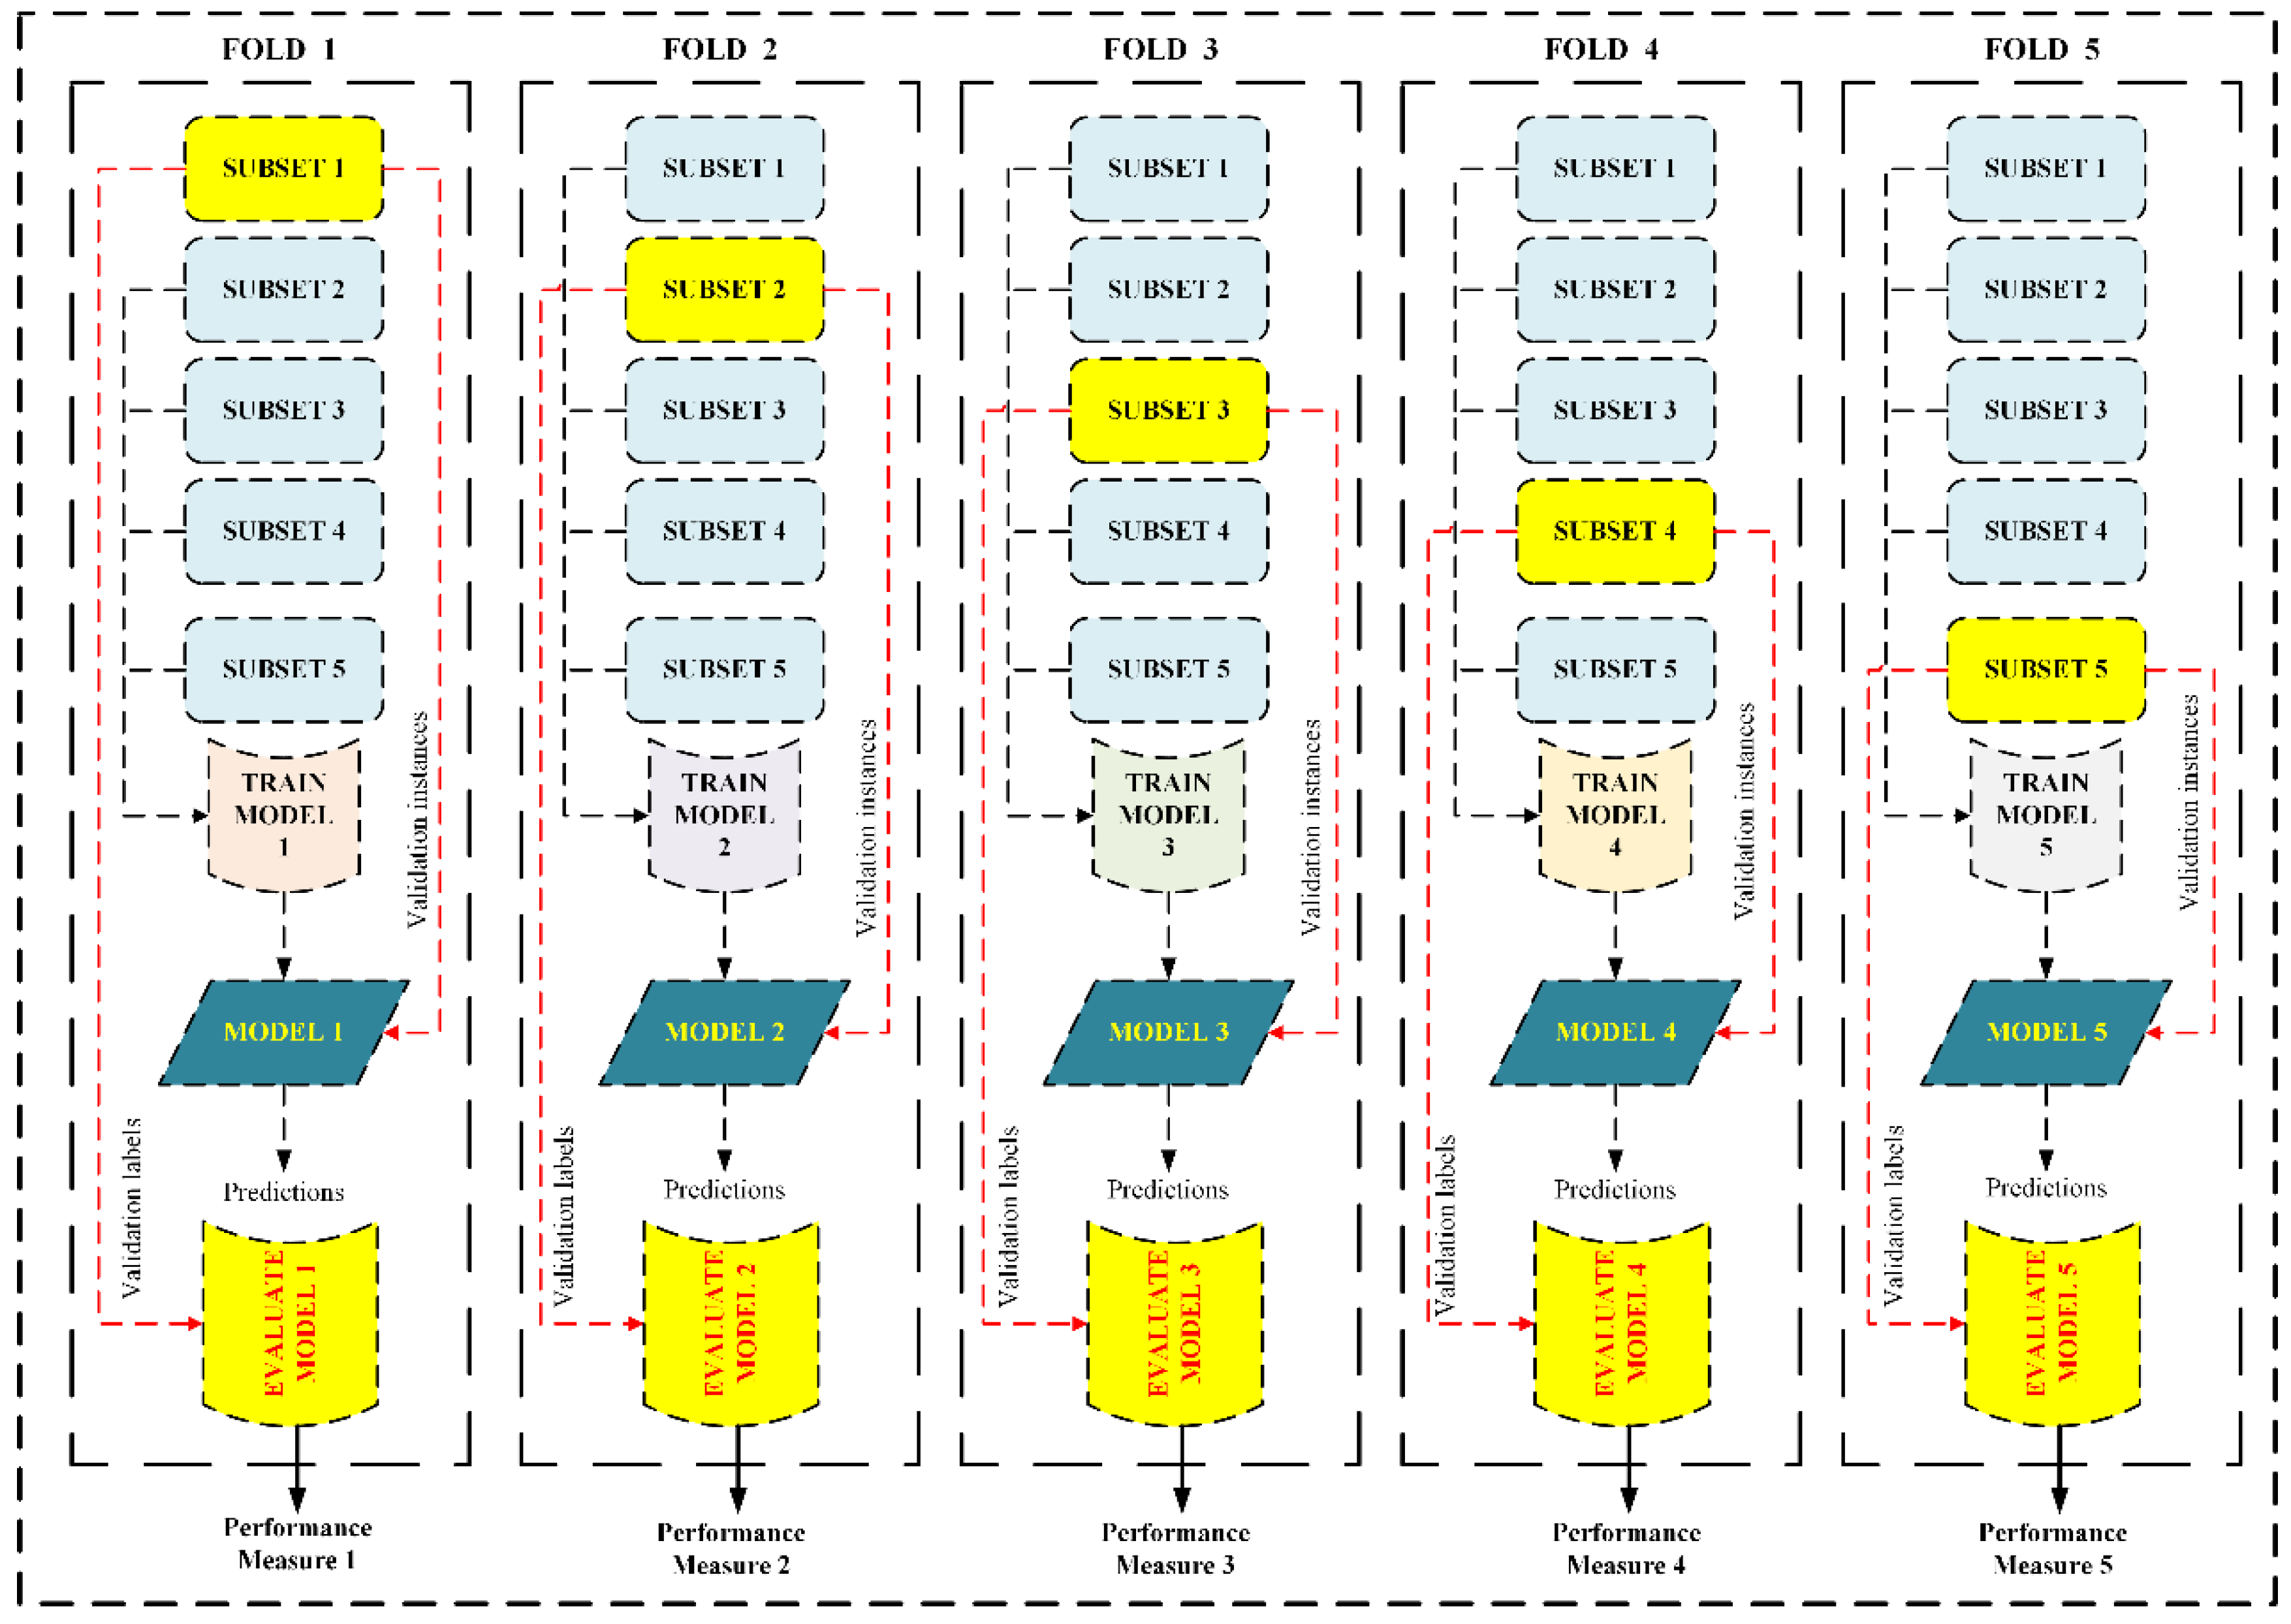
5-fold CV which initially splits dataset into five equal parts. Then the process of training and testing is carried out 5 times. In each iteration, a different fold is crossed as testing, while the remaining four are assumed the training set.
Figure 7.
5-fold CV which initially splits dataset into five equal parts. Then the process of training and testing is carried out 5 times. In each iteration, a different fold is crossed as testing, while the remaining four are assumed the training set.
Figure 8.
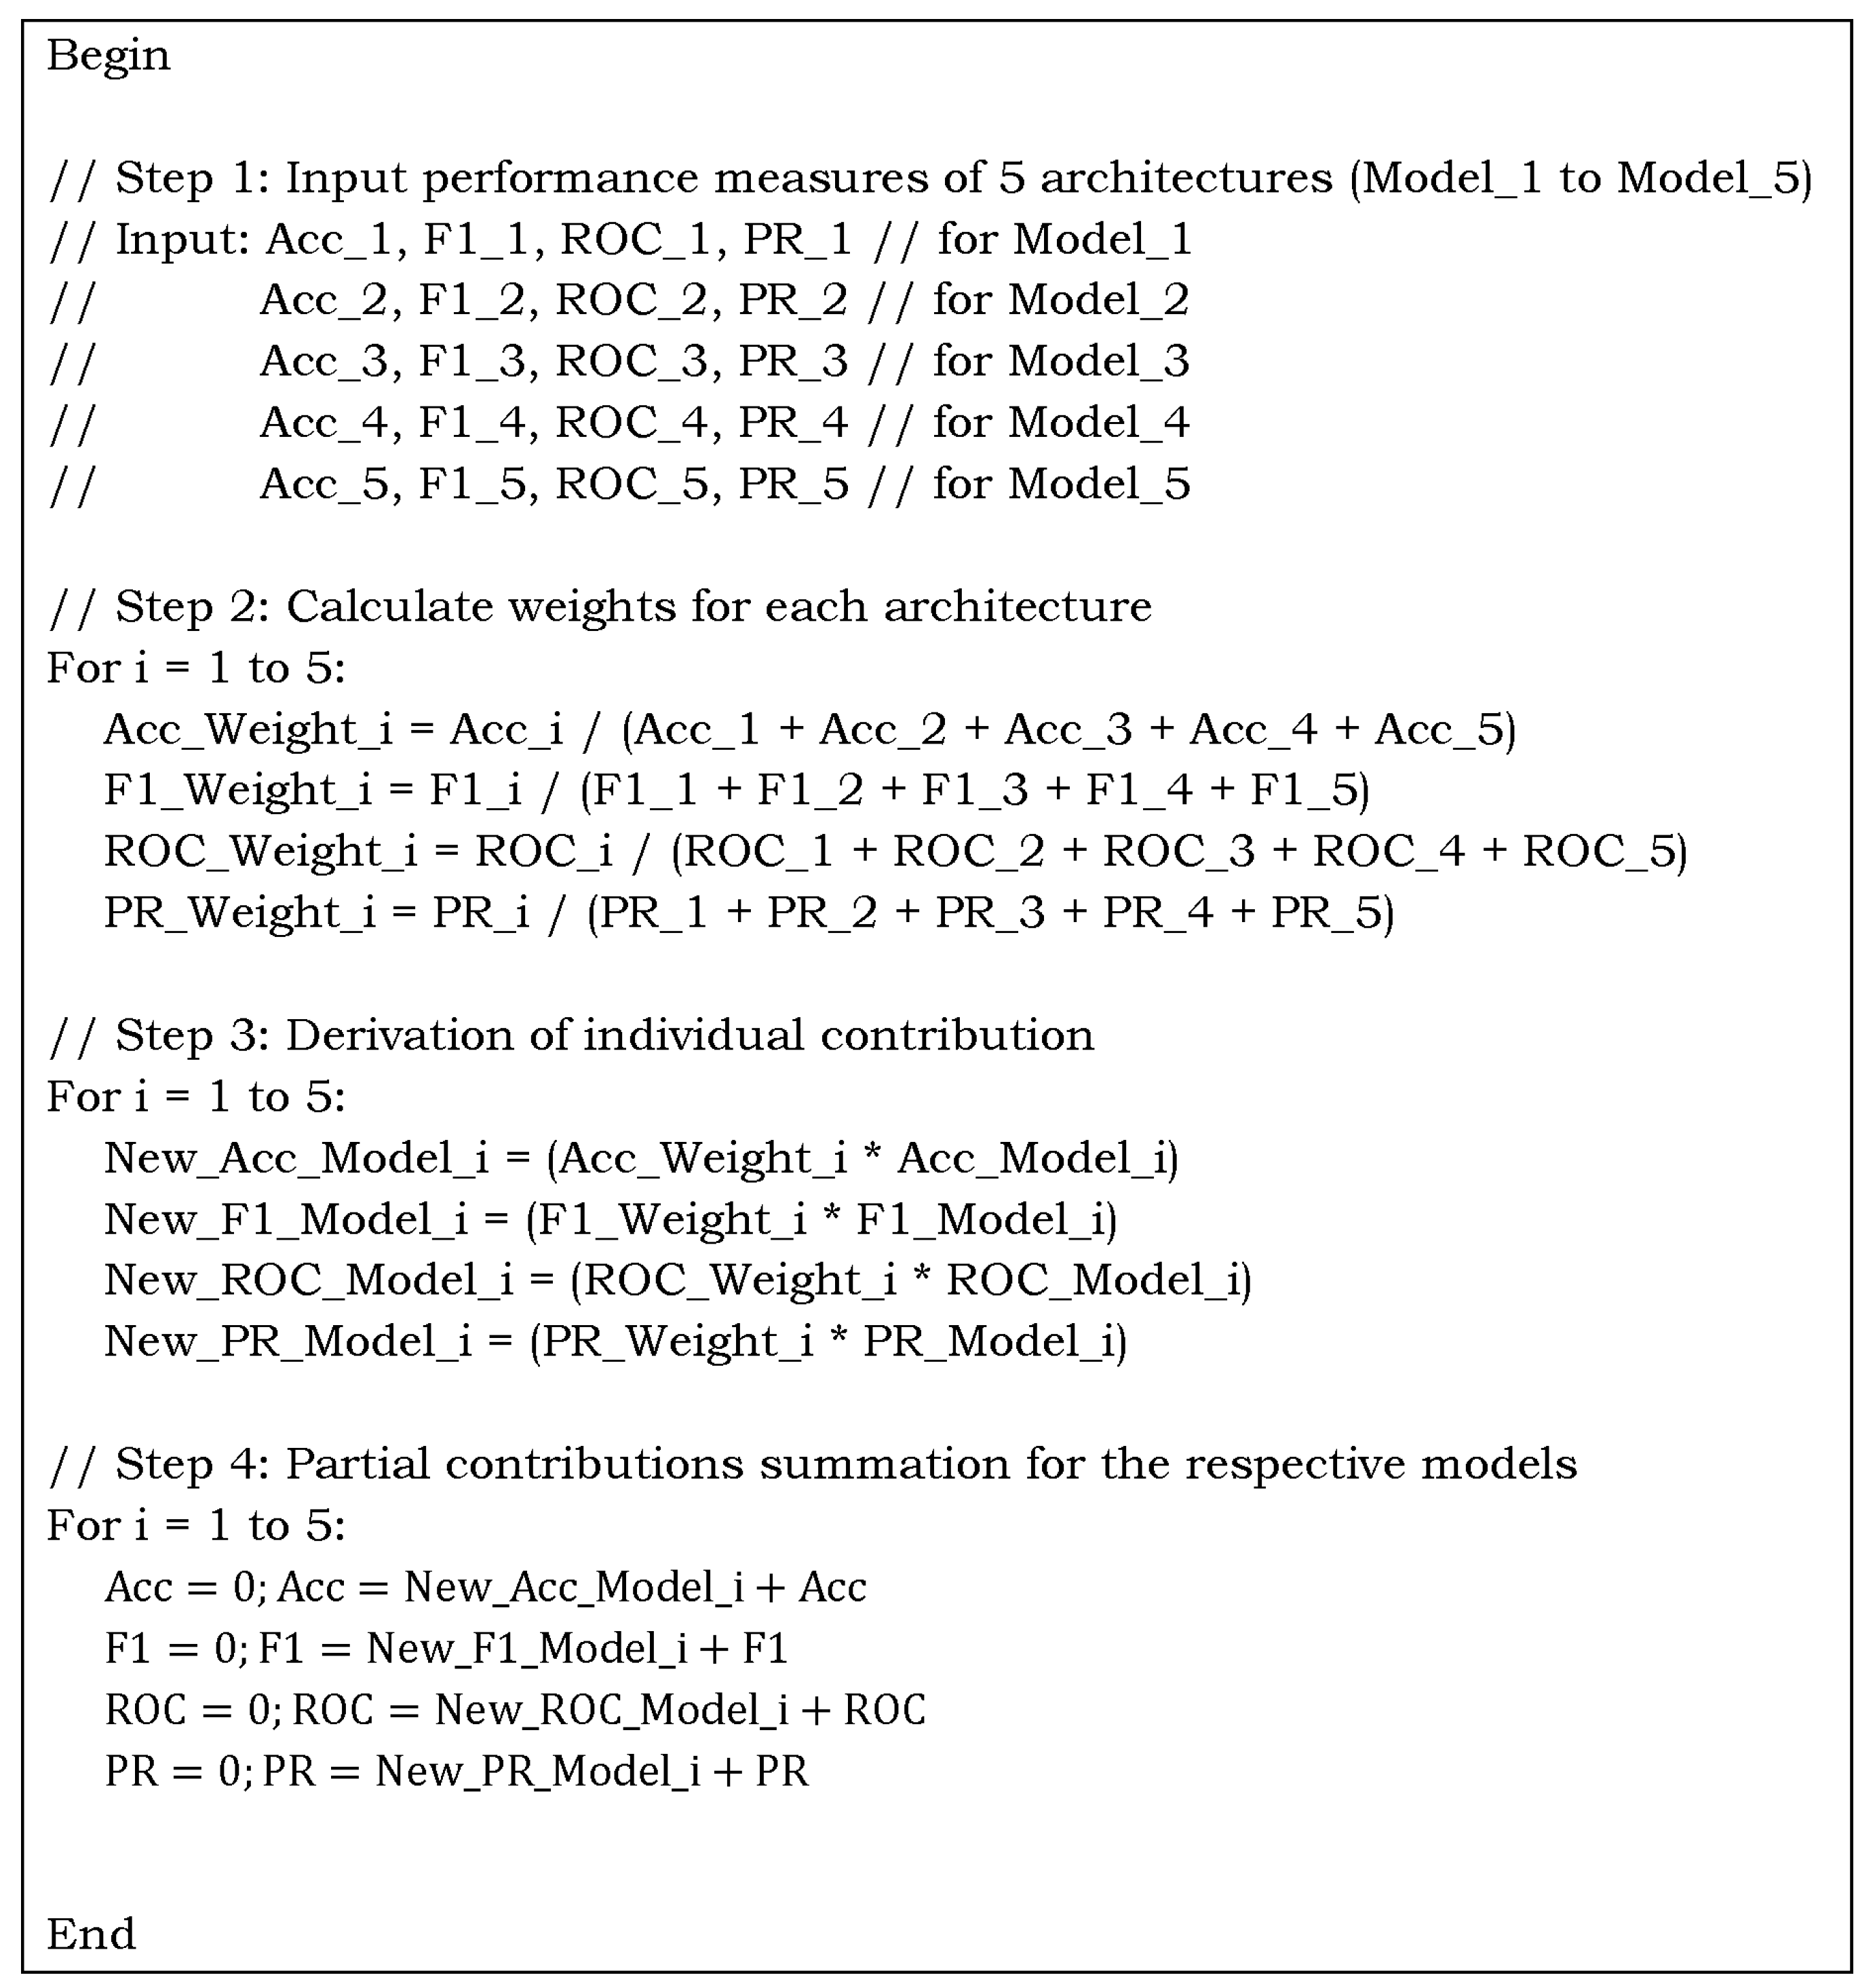
Optimized weighted algorithm for the ensemble contribution aggregation using performance measures for multiclass C19 dataset.
Figure 8.
Optimized weighted algorithm for the ensemble contribution aggregation using performance measures for multiclass C19 dataset.
Figure 9.
ROC curves for multiclass classification using pre-trained AlexNet classifier (classes: C19, LO, and N; chest X-ray preprocessed dataset; 5-fold CV).
Figure 9.
ROC curves for multiclass classification using pre-trained AlexNet classifier (classes: C19, LO, and N; chest X-ray preprocessed dataset; 5-fold CV).
Figure 10.
PR curves for multiclass classification using pre-trained AlexNet classifier (classes are C19, LO, and N in chest X-ray preprocessed dataset using 5-fold CV).
Figure 10.
PR curves for multiclass classification using pre-trained AlexNet classifier (classes are C19, LO, and N in chest X-ray preprocessed dataset using 5-fold CV).
Figure 11.
Confusion matrix for multiclass classification using pre-trained AlexNet classifier (the best fold result with classes as C19, LO, and N defined in the preprocessed dataset using 5-fold CV).
Figure 11.
Confusion matrix for multiclass classification using pre-trained AlexNet classifier (the best fold result with classes as C19, LO, and N defined in the preprocessed dataset using 5-fold CV).
Figure 12.
ROC curves for multiclass classification using pre-trained ResNet18 (classes: C19, LO, and N in chest X-ray preprocessed dataset using 5-fold CV).
Figure 12.
ROC curves for multiclass classification using pre-trained ResNet18 (classes: C19, LO, and N in chest X-ray preprocessed dataset using 5-fold CV).
Figure 13.
PR curves for multiclass classification using pre-trained ResNet18 model (classes: C19, LO, and N present in chest X-ray preprocessed dataset, and employing 5-fold CV).
Figure 13.
PR curves for multiclass classification using pre-trained ResNet18 model (classes: C19, LO, and N present in chest X-ray preprocessed dataset, and employing 5-fold CV).
Figure 14.
Confusion matrix for multiclass classification using pre-trained ResNet18 model (with classes C19, LO, and N in the chest X-ray preprocessed dataset using 5-fold CV).
Figure 14.
Confusion matrix for multiclass classification using pre-trained ResNet18 model (with classes C19, LO, and N in the chest X-ray preprocessed dataset using 5-fold CV).
Figure 15.
ROC curves for multiclass classification using pre-trained ResNet50 architecture (classes: C19, LO, and N for chest X-ray preprocessed dataset using 5-fold CV).
Figure 15.
ROC curves for multiclass classification using pre-trained ResNet50 architecture (classes: C19, LO, and N for chest X-ray preprocessed dataset using 5-fold CV).
Figure 16.
PR curves for multiclass classification using pre-trained ResNet50 (classes: C19, LO, and N in chest X-ray preprocessed dataset using 5-fold CV).
Figure 16.
PR curves for multiclass classification using pre-trained ResNet50 (classes: C19, LO, and N in chest X-ray preprocessed dataset using 5-fold CV).
Figure 17.
Confusion matrix for multiclass classification using pre-trained ResNet50 (classes: C19, LO, and N; Dataset: chest X-ray preprocessed dataset with 5-fold CV).
Figure 17.
Confusion matrix for multiclass classification using pre-trained ResNet50 (classes: C19, LO, and N; Dataset: chest X-ray preprocessed dataset with 5-fold CV).
Figure 18.
ROC curves for multiclass classification using pre-trained SqueezeNet framework (classes as C19, LO, and N in chest X-ray preprocessed dataset; 5-fold CV).
Figure 18.
ROC curves for multiclass classification using pre-trained SqueezeNet framework (classes as C19, LO, and N in chest X-ray preprocessed dataset; 5-fold CV).
Figure 19.
PR curves for multiclass classification using pre-trained SqueezeNet model (classes: C19, LO, and N forming the chest X-ray preprocessed dataset; 5-fold CV).
Figure 19.
PR curves for multiclass classification using pre-trained SqueezeNet model (classes: C19, LO, and N forming the chest X-ray preprocessed dataset; 5-fold CV).
Figure 20.
Confusion matrix for multiclass classification using pre-trained SqueezeNet model (classes: C19, LO, and N forming chest X-ray preprocessed dataset; 5-fold CV).
Figure 20.
Confusion matrix for multiclass classification using pre-trained SqueezeNet model (classes: C19, LO, and N forming chest X-ray preprocessed dataset; 5-fold CV).
Figure 21.
t-SNE plot showing the feature distribution of C19 (723 instances in blue), LO (1203 instances in brown) and N (2038 instances in teal) classes run during the testing phase.
Figure 21.
t-SNE plot showing the feature distribution of C19 (723 instances in blue), LO (1203 instances in brown) and N (2038 instances in teal) classes run during the testing phase.
Figure 22.
PR curves for multiclass classification using pre-trained VGG16 model (classes: C19, LO, and N forming chest X-ray preprocessed dataset; 5-fold CV).
Figure 22.
PR curves for multiclass classification using pre-trained VGG16 model (classes: C19, LO, and N forming chest X-ray preprocessed dataset; 5-fold CV).
Figure 23.
ROC curves for multiclass classification using pre-trained VGG classifier (classes: C19, LO, and N forming the chest X-ray preprocessed dataset; 5-fold CV).
Figure 23.
ROC curves for multiclass classification using pre-trained VGG classifier (classes: C19, LO, and N forming the chest X-ray preprocessed dataset; 5-fold CV).
Figure 24.
Confusion matrix for multiclass classification using pre-trained VGG16 model (for classes C19, LO, and N defining the chest X-ray preprocessed dataset using 5-fold CV).
Figure 24.
Confusion matrix for multiclass classification using pre-trained VGG16 model (for classes C19, LO, and N defining the chest X-ray preprocessed dataset using 5-fold CV).
Figure 25.
Graphical representation of model evaluation scores. The chart compares the A, PPV, NPV, and F1-score of different models, with the proposed framework.
Figure 25.
Graphical representation of model evaluation scores. The chart compares the A, PPV, NPV, and F1-score of different models, with the proposed framework.
Figure 26.
t-SNE plot showing the feature distribution of C19 (724 instances in blue), LO (1202 instances in red), N (2038 instances in pink), and VP (269 instances in cyan) classes run during the testing phase (SqueezeNet, 25 epochs, 5 Fold CV).
Figure 26.
t-SNE plot showing the feature distribution of C19 (724 instances in blue), LO (1202 instances in red), N (2038 instances in pink), and VP (269 instances in cyan) classes run during the testing phase (SqueezeNet, 25 epochs, 5 Fold CV).
Table 1.
Outline of the C19 Radiography Dataset containing 19,820 samples.
Table 1.
Outline of the C19 Radiography Dataset containing 19,820 samples.
| Feature |
Dataset |
| Dataset name |
C19 Radiography database |
| Year |
2020 |
| Number of subjects |
3616 C19 patients |
| Availability |
Publicly available |
| Site address |
https://www.kaggle.com/datasets/tawsifurrahman/covid19-radiography-database |
Table 3.
Geometric transformations, including rotation, reflection, translation, and affine adjustments, applied to address dataset imbalance.
Table 3.
Geometric transformations, including rotation, reflection, translation, and affine adjustments, applied to address dataset imbalance.
| Type |
Variation |
Extreme Range / Value |
| Rotation |
Clockwise / Anti-clockwise |
±10 degrees |
| Translation |
Horizontal and Vertical shift |
±10% of image dimensions |
| Reflection |
Horizontal (X-axis) |
Random flip (p=0.5) |
| Affine |
Random affine transformation |
Translation only (no shear) |
Table 4.
Hyper-parameters tuning, and the best of them is selected at which model gives the best results.
Table 4.
Hyper-parameters tuning, and the best of them is selected at which model gives the best results.
| Parameter |
Values under trial |
Selected value |
| Learning rate |
0.0001, 0.001, 0.01,0.1 |
0.001 |
| Epochs |
1,5,10,15,20,25,30,40,50 |
30 |
| Minibatch (size) |
32,64 |
64 |
| Kernel depth |
64 |
64 |
| Kernel size |
3 × 3 |
3 × 3 |
| Activation |
ReLU, Softmax |
ReLU, Softmax |
| Pooling type |
AvgPool, Max-Pool |
AvgPool, Max-Pool |
| FC layers (fully connected) |
1,2 |
1 |
| Dropout |
0.3, 0.4, 0.5 |
0.5 |
| Solver name |
ADAptive Moment estimation (ADAM) |
ADAM |
Table 2.
Parameterization of bilateral filtering optimized for optimal performance.
Table 2.
Parameterization of bilateral filtering optimized for optimal performance.
| Parameter |
Effect |
Selected Value |
| D |
Diameter of the pixel neighborhood. Larger values mean a stronger effect. |
9 |
| sigmaColor |
Color differences affect filtering; a larger value means more smoothing. |
75 |
| sigmaSpace |
How far in space does the filter look? Larger value considers more distant pixels. |
75 |
Table 5.
Classification performance of the pre-trained AlexNet model on the radiography-preprocessed dataset (dataset classes: C19, LO, and N; epochs represented by Es; and 5-fold CV).
Table 5.
Classification performance of the pre-trained AlexNet model on the radiography-preprocessed dataset (dataset classes: C19, LO, and N; epochs represented by Es; and 5-fold CV).
| Es |
Sp
(%) |
Rc/Sn
(%) |
Pr/PPV
(%) |
NPV
(%) |
AUC
(ROC) |
AUC
(PR) |
F1-score
(%) |
A
(%) |
| 1 |
90.39±0.72 |
79.76±2.90 |
81.05±2.16 |
90.54±0.77 |
0.94±0.00 |
0.89±0.01 |
79.42±1.24 |
81.93±1.11 |
| 5 |
92.65±0.55 |
85.40±1.45 |
85.70±2.20 |
92.73±0.90 |
0.96±0.00 |
0.93±0.00 |
85.45±1.33 |
86.12±1.30 |
| 10 |
94.19±0.26 |
88.83±0.81 |
88.95±0.32 |
94.27±0.20 |
0.97±0.00 |
0.95±0.00 |
88.85±0.50 |
89.49±0.40 |
| 15 |
94.55±0.32 |
89.40±0.70 |
90.75±0.50 |
94.80±0.30 |
0.97±0.00 |
0.95±0.00 |
89.95±0.57 |
90.40±0.52 |
| 20 |
94.44±0.25 |
88.96±0.95 |
90.62±0.32 |
94.74±0.20 |
0.97±0.00 |
0.95±0.00 |
89.68±0.61 |
90.21±0.42 |
| 25 |
95.05±0.23 |
90.43±0.50 |
91.77±0.48 |
95.27±0.25 |
0.97±0.00 |
0.96±0.00 |
91.04±0.44 |
91.29±0.41 |
| 30 |
95.23±0.29 |
90.89±0.64 |
92.00±0.501 |
95.42±0.148 |
0.97±0.0 |
0.96±0.00 |
91.38±0.53 |
91.60±0.39 |
| 40 |
95.21±0.17 |
90.85±0.39 |
91.88±0.30 |
95.36±0.16 |
0.97±0.00 |
0.96±0.00 |
91.33±0.35 |
91.53±0.30 |
| 50 |
95.23±0.17 |
90.94±0.49 |
92.02±0.23 |
95.37±0.11 |
0.97±0.00 |
0.96±0.00 |
91.44±0.33 |
91.57±0.25 |
Table 6.
Classification performance of the pre-trained ResNet18 model on the radiography-preprocessed dataset (dataset classes: C19, LO, and N; epochs represented by Es; 5-fold CV).
Table 6.
Classification performance of the pre-trained ResNet18 model on the radiography-preprocessed dataset (dataset classes: C19, LO, and N; epochs represented by Es; 5-fold CV).
| Es |
Sp
(%) |
Rc/Sn
(%) |
Pr/PPV
(%) |
NPV
(%) |
AUC
(ROC) |
AUC
(PR) |
F1-score
(%) |
A
(%) |
| 1 |
92.50±0.29 |
85.12±1.24 |
85.21±3.10 |
92.40±1.13 |
0.96±0.00 |
0.93±0.00 |
84.57±1.33 |
85.76±1.58 |
| 5 |
94.48±0.66 |
89.44±1.21 |
90.30±1.82 |
94.70±0.98 |
0.97±0.00 |
0.96±0.00 |
89.71±1.37 |
90.12±1.59 |
| 10 |
94.78±1.03 |
90.45±1.77 |
90.99±1.77 |
94.80±1.36 |
0.98±0.00 |
0.96±0.00 |
90.53±2.07 |
90.51±2.41 |
| 15 |
95.10±0.65 |
91.20±1.00 |
91.60±1.20 |
95.30±0.80 |
0.98±0.00 |
0.97±0.00 |
91.00±1.50 |
91.10±1.20 |
| 20 |
95.35±0.40 |
91.70±0.70 |
91.95±0.70 |
95.45±0.50 |
0.98±0.00 |
0.97±0.00 |
91.70±1.00 |
91.60±0.90 |
| 25 |
95.57±0.15 |
92.12±0.41 |
92.32±0.60 |
95.61±0.25 |
0.98±0.00 |
0.97±0.00 |
92.19±0.20 |
92.14±0.26 |
| 30 |
95.74±0.37 |
92.28±0.86 |
92.92±0.54 |
95.98±0.19 |
0.98±0.00 |
0.97±0.00 |
92.56±0.57 |
92.62±0.49 |
| 40 |
95.67±0.15 |
92.40±0.30 |
92.87±0.64 |
95.81±0.42 |
0.98±0.00 |
0.97±0.00 |
92.59±0.39 |
92.74±0.50 |
| 50 |
95.64±0.14 |
92.10±0.59 |
92.82±0.56 |
95.68±0.24 |
0.98±0.00 |
0.97±0.00 |
92.41±0.32 |
92.28±0.31 |
Table 7.
Classification performance of the pre-trained ResNet50 model on the radiography-preprocessed dataset (dataset classes: C19, LO, and N; epochs represented by Es; and 5-fold CV).
Table 7.
Classification performance of the pre-trained ResNet50 model on the radiography-preprocessed dataset (dataset classes: C19, LO, and N; epochs represented by Es; and 5-fold CV).
| Es |
Sp
(%) |
Rc/Sn
(%) |
Pr/PPV
(%) |
NPV
(%) |
AUC
(ROC) |
AUC
( PR) |
F1-score
(%) |
A
(%) |
| 1 |
92.43±1.52 |
85.55±2.60 |
84.81±4.08 |
92.04±2.18 |
0.96±0.00 |
0.94±0.00 |
84.30±4.33 |
85.17±4.28 |
| 5 |
94.76±0.15 |
90.00±0.43 |
90.18±1.38 |
94.80±0.55 |
0.98±0.00 |
0.96±0.00 |
89.94±0.61 |
90.44±0.61 |
| 10 |
95.28±0.26 |
90.89±0.93 |
92.40±0.45 |
95.75±0.18 |
0.98±0.00 |
0.96±0.00 |
91.54±0.44 |
91.92±0.29 |
| 15 |
95.75±0.21 |
92.03±0.59 |
92.88±0.21 |
95.95±0.07 |
0.98±0.00 |
0.97±0.00 |
92.43±0.38 |
92.57±0.25 |
| 20 |
95.98±0.13 |
92.69±0.32 |
93.25±0.70 |
96.21±0.31 |
0.98±0.00 |
0.97±0.00 |
92.93±0.21 |
93.00±0.26 |
| 30 |
96.24±0.09 |
93.24±0.30 |
93.66±0.25 |
96.36±0.10 |
0.98±0.00 |
0.97±0.00 |
93.44±0.13 |
93.41±0.12 |
| 40 |
96.06±0.19 |
92.96±0.54 |
93.48±0.20 |
96.21±0.11 |
0.98±0.00 |
0.97±0.00 |
93.21±0.34 |
93.13±0.27 |
| 50 |
95.99±0.18 |
92.77±0.60 |
93.48±0.33 |
96.16±0.12 |
0.98±0.00 |
0.97±0.00 |
93.11±0.44 |
93.04±0.29 |
Table 8.
Classification performance of the pre-trained SqueezeNet model on the radiography-preprocessed dataset (dataset classes: C19, LO, and N; epochs represented by Es; and 5-fold CV).
Table 8.
Classification performance of the pre-trained SqueezeNet model on the radiography-preprocessed dataset (dataset classes: C19, LO, and N; epochs represented by Es; and 5-fold CV).
| Es |
Sp
(%) |
Rc/Sn
(%) |
Pr/PPV
(%) |
NPV
(%) |
AUC
(ROC) |
AUC
(PR) |
F1-score
(%) |
A
(%) |
| 20 |
96.25±0.88 |
93.41±1.44 |
94.26±2.08 |
96.51±1.3 |
98.9±0.07 |
98.31±0.17 |
93.49±2.01 |
93.48±2.10 |
| 25 |
96.52±0.37 |
93.95±0.72 |
94.65±0.9 |
96.71±0.59 |
98.94±0.13 |
98.36±0.21 |
94.01±0.81 |
94.01±0.85 |
| 30 |
96.63±0.6 |
94.18±1.04 |
93.97±2.73 |
96.64±1.04 |
98.91±0.15 |
98.32±0.24 |
93.95±1.65 |
93.95±1.69 |
| 40 |
95.98±1.3 |
92.18±3.72 |
94.57±1.21 |
96.65±0.75 |
98.77±0.36 |
98.12±0.51 |
93.32±2.08 |
93.39±1.98 |
| 50 |
90.78±0.43 |
80.04±0.76 |
81.00±1.23 |
90.53±0.66 |
0.94±0.00 |
0.89±0.00 |
80.03±1.04 |
82.24±1.22 |
Table 9.
Classification performance of the pre-trained VGG16 model on the radiography-preprocessed dataset (dataset classes: C19, LO, and N; epochs represented by Es; and 5-fold CV).
Table 9.
Classification performance of the pre-trained VGG16 model on the radiography-preprocessed dataset (dataset classes: C19, LO, and N; epochs represented by Es; and 5-fold CV).
| Es |
Sp
(%) |
Rc/Sn
(%) |
Pr/PPV
(%) |
NPV
(%) |
AUC
(ROC) |
AUC
(PR) |
F1-score
(%) |
A
(%) |
| 1 |
90.43±1.25 |
79.04±3.99 |
81.36±0.89 |
91.47±0.89 |
0.93±0.02 |
0.93±0.12 |
82.12±2.99 |
83.12±1.70 |
| 5 |
91.43±1.14 |
81.04±3.67 |
86.36±0.81 |
92.41±0.85 |
0.96±0.01 |
0.92±0.01 |
82.37±2.96 |
84.87±1.70 |
| 10 |
92.10±0.90 |
82.50±2.80 |
87.50±0.70 |
93.00±0.80 |
0.96±0.00 |
0.93±0.01 |
83.90±2.20 |
86.00±1.30 |
| 15 |
92.75±0.65 |
83.80±2.00 |
88.25±0.60 |
93.60±0.60 |
0.96±0.00 |
0.93±0.01 |
85.25±1.80 |
87.20±1.00 |
| 20 |
93.00±0.40 |
84.60±1.30 |
89.00±0.40 |
93.85±0.45 |
0.96±0.00 |
0.94±0.00 |
86.20±1.20 |
87.90±0.70 |
| 25 |
93.05±0.35 |
85.00±1.10 |
89.40±0.30 |
93.90±0.35 |
0.96±0.00 |
0.94±0.00 |
86.60±1.00 |
88.10±0.60 |
| 30 |
93.11±0.30 |
85.40±0.98 |
89.79±0.19 |
94.02±0.27 |
0.97±0.00 |
0.94±0.00 |
87.14±0.76 |
88.33±0.53 |
| 40 |
94.62±0.11 |
88.76±0.47 |
91.63±0.25 |
95.27±0.09 |
0.97±0.00 |
0.95±0.00 |
90.01±0.24 |
90.82±0.14 |
| 50 |
94.83±0.22 |
89.11±0.69 |
91.77±0.33 |
95.34±0.16 |
0.98±0.00 |
0.96±0.00 |
90.26±0.54 |
91.04±0.37 |
Table 10.
Comparison of performance metrics for various deep learning models (AlexNet, ResNet18, ResNet50, SqueezeNet, and VGG16) on the preprocessed COVID-19 chest X-ray dataset(using 5-fold cross-validation; the best results for each of the architectures.).
Table 10.
Comparison of performance metrics for various deep learning models (AlexNet, ResNet18, ResNet50, SqueezeNet, and VGG16) on the preprocessed COVID-19 chest X-ray dataset(using 5-fold cross-validation; the best results for each of the architectures.).
| Method |
Sp
(%) |
Rc/Sn
(%) |
Pr/PPV
(%) |
NPV
(%) |
AUC
(ROC) |
AUC
(PR) |
F1-score
(%) |
A
(%) |
| AlexNet |
95.23 |
90.89 |
92.00 |
95.42 |
0.97 |
0.96 |
91.38 |
91.60 |
| ResNet18 |
95.67 |
92.42 |
92.87 |
95.81 |
0.98 |
0.97 |
92.59 |
92.74 |
| ResNet50 |
96.24 |
93.24 |
93.66 |
96.36 |
0.98 |
0.97 |
93.44 |
93.41 |
| SqueezeNet |
96.52 |
93.95 |
94.65 |
96.71 |
0.98 |
0.98 |
94.01 |
94.01 |
| VGG16 |
94.83 |
89.11 |
91.77 |
95.34 |
0.98 |
0.96 |
90.26 |
91.04 |
Table 11.
Weighted values computation for the predicted metrics using the optimized weight distribution algorithm (preprocessed radiography dataset).
Table 11.
Weighted values computation for the predicted metrics using the optimized weight distribution algorithm (preprocessed radiography dataset).
| Method |
Sp
(%) |
Rc/Sn
(%) |
Pr/PPV
(%) |
NPV
(%) |
AUC
(ROC) |
AUC
(PR) |
F1-score
(%) |
A
(%) |
| ResNet50 |
19.36 |
18.92 |
18.87 |
19.36 |
0.20 |
0.19 |
18.91 |
18.85 |
| ResNet18 |
19.13 |
18.58 |
18.55 |
19.14 |
0.20 |
0.19 |
18.57 |
18.58 |
| AlexNet |
18.95 |
17.97 |
18.20 |
18.98 |
0.19 |
0.19 |
18.09 |
18.13 |
| SqueezeNet |
19.47 |
19.21 |
19.27 |
19.50 |
0.20 |
0.20 |
19.14 |
19.10 |
| VGG16 |
18.79 |
17.28 |
18.11 |
18.95 |
0.20 |
0.19 |
17.65 |
17.91 |
| Optimized Results |
95.70 |
91.95 |
93.00 |
95.93 |
0.98 |
0.97 |
92.36 |
92.57 |
Table 12.
Comparison of different models for classifying C19 (using the same dataset).
Table 12.
Comparison of different models for classifying C19 (using the same dataset).
| Reference |
Methodology |
Data Split |
Classes |
A |
Limitation(s) |
| [63] |
|
80/20 single split for both scenarios |
4 (C19, LO, N, VP) |
|
Cross testing (only one dataset used) CV is absent, due to which the generalization check needs further study; Biasing due to the highly discriminative features of VP |
| [64] |
MobileNetV3 + Dense Block |
5-Fold CV |
3 (C19, N, VP) |
|
|
| [65] |
U-Net lung segmentation, Convolution-Capsule Network |
70% training, 15% validation, and 15% testing |
3 (C19, N, VP) |
(C19 86%, VP 93%, and N 85%)
|
|
| [66] |
Features from TL model, hybrid whale-elephant herding selection scheme, Extreme learning machine |
Two partitions of 50% each, and 10-Fold CV on each of the partition |
4 (C19, N, LO, VP) |
|
|
Proposed
framework |
Ensemble of Transfer Learning |
5-Fold CV |
3(C19, N, LO) |
|
|