
Submitted:
19 August 2025
Posted:
20 August 2025
You are already at the latest version
Abstract
Advanced control systems have been recently implemented in wastewater treatment plants (WWTPs) to optimize activated sludge processes and reduce operational costs. Real-time dynamic control of ammonium-N and nitrate-N concentrations is important for the optimization of biological nitrogen removal (BNR) processes. This study pre-sents an advanced control strategy based on continuous monitoring of ammonium-N and nitrate-N concentrations to enhance nitrogen removal performance. Specifically, performance parameters were optimized using an automated controller set in an in-termittently aerated and fed activated sludge (IAF-AS) system treating domestic wastewater under two distinct operating scenarios: (i) constant ammonium-N loading rate (ALR) and (ii) sudden increase in ALR. In both scenarios, optimal durations of ni-trification and denitrification phases were dynamically determined. In the first sce-nario, under constant ALR of 0.2 g L⁻¹ d⁻¹, the controller maintained nitrification and denitrification durations below 30 minutes, achieving complete nitrogen removal. In the second scenario, when ALR exceeded 0.3 g L⁻¹ d⁻¹, the controller dynamically ex-tended these phases (> 60 minutes) to meet the effluent setpoints of 2 mg L⁻¹ ammo-nium-N and 1 mg L⁻¹ nitrate-N. Results demonstrate that real-time dynamic control enables maximized nitrogen removal efficiency by applying minimal necessary nitri-fication and denitrification durations, thereby reducing aeration energy demands and operational costs.
Keywords:
intermittent aeration and feeding
; advanced process control
; biological nitrogen removal
; real-time dynamic control
; ammonium-N and nitrate-N sensors
1. Introduction
Advanced process control is essential for optimizing activated sludge processes in order to reduce energy consumption, maximize carbon and nitrogen removal efficiency, and simultaneously comply with the environmental disposal limits [1,2]. However, the implementation of advanced control methods remains limited worldwide due to complexities in online data measurement, sensor maintenance requirements, and the type of control strategy selection [3]. A well-designed control strategy should emphasize on the technical equipment. Adequate algorithms, suitable software and hardware for computational simulations, automatic control system, actuators, and on-line sensors are required [4].
Biological nitrogen removal (BNR) in activated sludge systems is governed by complex biochemical processes that require real-time monitoring and control [5,6,7]. Numerous techniques have been proposed for the online control of BNR processes, which remains a significant challenge in wastewater treatment [6,8,9]. Various control strategies have been applied for spatial monitoring of ammonium and nitrate concentrations in the aerobic and anoxic zones of conventional BNR systems [10,11,12]. Additionally, BNR processes can be achieved under intermittently aerated conditions within a single bioreactor [13,14,15,16]. Other studies have demonstrated that intermittent aeration can significantly reduce energy costs [17,18,19]. In many such cases, fixed ratios of anoxic to aerobic phase durations are usually applied. For instance, Song et al. [20] reported 25% energy saving in a sequencing batch reactor operating under intermittent aeration (consisting 40/60 min non-aeration/aeration phases) with an ammonium-N removal efficiency of 96.4%. More recently, strategies have been developed to dynamically adjust the duration of aerobic and anoxic phases in real time [6]. Azis et al. [21] comparatively evaluated the performance of an intermittently aerated membrane bioreactor using pH and ORP sensors versus ammonium-N and nitrate-N sensors, demonstrating superior performance with direct nitrification and denitrification monitoring and control using a real-time control strategy.
One of the primary challenges in wastewater treatment and a key motivation for process control is the presence of disturbances in WWTPs [22,23]. The plant operation and performance can be compromised due to external and/or internal disturbances. Some of the most important external disturbances include variations in influent hydraulic load, organic matter, nutrient content, or other compositional factors, which can fluctuate in a daily or seasonal basis. Process control in activated sludge systems can be applied to regulate the duration of nitrification and denitrification phases depending on the influent load [8]. The objective is to maintain the activated sludge systems in steady-state conditions by keeping control parameters at a constant level. To achieve this, advanced control strategies have been developed to support operators and engineers with practical control solutions in order to implement them at WWTPs [23,24]. Recent studies have demonstrated significant benefits of advanced control strategies implementation. Ferrentino et al. [25] reported reductions in energy consumption and excess sludge production by 15% and 12%, respectively, through the control of dissolved oxygen (DO) and ammonium nitrogen in the effluent of an activated sludge system.
Rule-based feedback controllers have been proven effective in advanced process control applications, managing precisely the process variability [10,26,27]. Online control systems incorporating such strategies can effectively respond to load fluctuations using robust controllers that integrate appropriate control strategies and modern ion-selective electrode (ISE) sensors [25,28,29]. Online ISE sensors provide critical information about the operational state of the plant and are among the most suitable tools for process control available to plant operators [30]. Indeed, in situ online sensors are generally more efficient and reliable for the real-time control of biological processes than traditional analyzers located at secondary settling tanks [30,31].
The objective of this study was to optimize the nitrification and denitrification processes in an intermittently aerated and fed activated sludge (IAF-AS) system by applying a rule-based dynamic feedback control strategy, integrated into a programmable logic controller (PLC). Nitrification and denitrification were controlled in real-time using ISE ammonium-N and nitrate-N sensors, taking into account variations in influent nitrogen loads. The study specifically aimed to: (1) regulate dynamically the durations of aerobic and anoxic phase using a feedback control strategy based on ammonium-N loading rates, (2) evaluate the dynamic control performance under constant and variable loading conditions, and (3) quantify energy consumption due to aeration using real-time dynamic control.
2. Materials and Methods
2.1. Experimental Apparatus
This study was carried out in a pilot-scale intermittently aerated and fed activated sludge (IAF-AS) system, receiving municipal wastewater from the University Campus in Xanthi, Greece, for a period of 15 months. The biochemical processes took place in a single bioreactor, achieving complete biological nitrogen removal. The IAF-AS system (Figure 1) consisted of a stirred equalization tank (total volume, 5 L; working volume, 3 L), a 50 L bioreactor (45 L working volume), and a 10 L secondary clarifier (working volume, 8 L). The bioreactor was equipped with an air blower (Q = 270 L h-1; P = 0.12 kW) providing dissolved oxygen concentrations higher than 2 mg L-1 to achieve complete nitrification during aerobic phases. An overhead stirrer equipped with a rotation inverter was placed in the bioreactor to mix the incoming raw wastewater with the activated sludge. The sedimentation tank was a glass cylindrical tank with downstream truncated cone design. The supernatant was discarded from the sedimentation tank at the end of each aerobic period. Sludge retention time was maintained at 10 ± 1 days through daily sludge wasting.
Wastewater (2-4 L) was fed at once into the bioreactor at the beginning of each anoxic phase within a short period of time (5 min) in order to promote higher heterotrophic denitrification rates by providing readily biodegradable COD. Daily load was determined by the frequency of wastewater feedings during a 24-hour period. Under steady-state conditions, the number of feed events and daily loading rate depended on the activity of nitrifiers and heterotrophic denitrifying bacteria (HDB) because they affected the phase length of nitrification and denitrification. Hydraulic retention time (HRT) was 32 ± 11 h, corresponding to an inflow rate of 36.9 ± 11.4 L d-1, while HRT decreased to 17 ± 5 h for double influent feed volume per cycle. Sewage characteristics are presented in Table 1. Physicochemical analysis of all parameters was conducted according to standard methods for the examination of water and wastewater [32].
Specific nitrification and denitrification rates were estimated in order to assess the dynamic behavior of biomass kinetics. Specific nitrification rates (SNR) were calculated as g NH4+-N oxidized per g volatile suspended solids (VSS) per day, whereas specific denitrification rates (SDR) were calculated as g NO3--N removed per g VSS per day.
2.2. Real-Time Control Strategy
Real-time control of nitrification and denitrification processes was performed by obtaining online measurements of ammonium-N and nitrate-N concentrations through the use of online in situ ion-selective electrode (ISE) sensors. The feedback controller compared the actual value of the IAF-AS system output with the reference input (desired value), determined the deviation, and produced a control signal resulting from this deviation. Rule-based feedback control strategies regarding the ammonium-N and nitrate-N parameters were applied in order to test the real-time control of intermittently aerated and fed process, and they were integrated into the PLC. Specifically, NH4+-N and NO3--N threshold limit values (endpoints) were set to regulate the alternating nitrification (aeration on) and denitrification (aeration off) processes, respectively. Further, upper time limits of 75 and 60 minutes were set in the controller as maximum durations for aerobic and anoxic phases, respectively. These practices are considered the basic rules in order to prevent excessive energy use in the case of high disturbances. After these time limits were reached, a new cyclic bioprocess was started, followed by wastewater addition. Also, another control practice to reduce energy consumption was the overhead stirrer operation at fast and slow rpm during the nitrification and denitrification periods, respectively.
The anoxic phase was stopped when the nitrate-N value reached the endpoint of 1 mg L-1 indicating denitrification completion. Afterwards, the air-blower was switched on and the aerobic phase was initiated. The aerobic phase duration was regulated by setting an endpoint of 2 mg NH4+-N L-1. When the ammonium-N concentration reached the endpoint, a pump discharged the treated effluent. A high ammonium-N loading rate increase would lead to a time-based extension of the air-supply. After ammonium-N depletion, the air-supply was switched off and a new cyclic bioprocess began. A flowchart of the control strategy is depicted in Figure 2.
This optimal control strategy offers the advantage of dynamic real-time control of BNR process under variable state conditions by adjusting the nitrification and denitrification phase lengths.
2.3. Instrumentation and Software
The instrumentation comprised ion selective electrode (ISE) sensors (WTW VARiON® Plus 700 IQ AmmoLyt® Plus and NitraLyt® Plus), which were used for online measurement of ammonium-N and nitrate-N concentrations, were connected to an IQ Sensor Net system (IQ2020XT). The ISE sensors’ cleaning frequency was once per month, whereas sensors were calibrated once both at the beginning of the experimental period and at the beginning of each disturbance period when high ammonium-N loading rate variations occurred. The output data from the sensors were recorded online once every minute in a database (xls. file). A programmable logic controller (PLC, FBs-20MC, FATEK, Taiwan) controlled system machinery including an overhead radial piston stirrer, an air-blower, a scraper and multistage peristaltic pumps). The PLC was programmed through the implementation of the WinProladder V3.21 software, while control strategies were developed using Indusoft Web Studio (IWS) software.
3. Results and Discussion
3.1. Performance of IAF-AS System and Operating Conditions
The IAF-AS system demonstrated excellent treatment performance throughout the study period. The effluent BOD5, COD, NH4+-N and TKN concentrations were measured as 12.7 ± 4.6 mg L-1, 49.2 ± 14.6 mg L-1, 2.0 ± 1.0 mg L-1 and 8.3 ± 2.2 mg L-1, respectively. Furthermore, the average PO43--P concentration was 0.72 ± 0.25 mg L-1 in the discharged effluent. The advanced process control implementation proved effective, with nitrogen removal efficiencies reaching 97% for ammonium-N, 100% for nitrate-N, and 91% for total Kjeldahl nitrogen (TKN). Correspondingly high nitrogen removal efficiencies were reported in WWTPs implementing intermittent aeration through rule-based control strategies [33]. The COD/NO3--N ratio varied from 4 to 15, with an average of 7, implying that there was always enough biodegradable COD to achieve complete denitrification [20]. The mixed liquor suspended solids (MLSS) were retained at 3.1 ± 0.64 g L-1 in the bioreactor, and the temperature varied from 22.8 to 25.1 oC.
3.2. Dynamic Control of Nitrification and Denitrification Process by NH4+-N and NO3--N Sensors
An example of dynamic process control through continuous NH4+-N and NO3--N monitoring during typical operating cycles is presented in Figure 3. Both aeration and non-aeration periods correspond to an operating cycle. The measurement accuracy and rapid response of the in-situ ion-selective sensors reinforced the dynamic control strategy to achieve the best nitrogen removal efficiency. The excellent accuracy of the ISE sensors that allows precise control strategy implementation is confirmed by Huang et al. [29].
Based on the nitrogen species profiles depicted in Figure 3, under steady-state conditions and for an influent ammonium-N concentration of 8.2 ± 0.3 mg L−1, 6.2 mg L−1 of NH4+-N was oxidized during the aerobic phase within 32 ± 2 minutes, reaching the setpoint (endpoint) of 2 mg L-1. A residual ammonium-N content (8%) of 0.6 mg L-1 was oxidized within 10 minutes until the end of discharged effluent timeframe. Thereafter, at the start of the anoxic phase when the DO concentration was below 0.5 mg L-1, nitrate-N was used as the electron acceptor by heterotrophic denitrifying bacteria (HDB). The intermittently fed method resulted in a NO3--N removal of 7.5 ± 0.3 mg L-1 till nether value of 1 mg L-1 within 27 ± 1 minutes, since the carbon source (COD/NO3--N rate, 6) was available to complete denitrification.
Dynamic control of the nitrification process through NH4+-N concentration profile under varying ammonium-N loading rates is illustrated in Figure 4a for an extended period of 6 days. At the beginning of this period, the ammonium-N loading rate (ALR) was 0.1 g L-1 d-1, corresponding to an initial NH4+-N concentration of 3.9 ± 0.14 mg L-1 measured within the mixed liquor. The NH4+-N concentration reached the 2 mg L-1 endpoint within 54 ± 7 minutes. An external disturbance (day 1) owed to changes in wastewater characteristics was observed by online monitoring increasing the ammonia value until 12.1 (11.3 ± 0.51) mg L-1. The dynamic control system aided to return the activated sludge system to steady-state conditions by extending the aerobic (nitrification) phase duration up to the maximum time limit (75 minutes). However, the NH4+-N concentration remained elevated in the bioreactor due to stress of ammonia oxidation bacteria (AOB) from the sudden ammonium-N loading increase. After adjustment of the nitrification phase length by the controller, AOB activity returned to high removal efficiencies after only 2 days, reaching the endpoint (setpoint) of 2 mg L-1. Between days 4.0-4.5, the controller setpoint was temporarily reduced from 2 to 1 mg L−1 to observe AOB behavior at lower NH4+-N concentrations. Results showed extended nitrification phase duration to the maximum 75 minutes due to ammonia depletion. Specifically, online data showed that nitrification lasted 26 ± 2 minutes with an endpoint of 2 mg L-1 set in the controller, while with a slight decrease to 1.0 mg L-1, the aerobic phase was extended by 50 minutes until the maximum duration limit for initial ammonium-N concentration of 5.6 ± 0.1 mg L-1 (ALR, 0.14 g L-1 d-1). In the following days, when the ALR value was 0.13-0.14 g L-1 d-1, the AOB oxidized the NH4+-N concentration of 5.3 ± 0.22 mg L-1 within 65 minutes.
Similar dynamic control effectiveness was observed for denitrification processes during the same experimental period by obtaining online measurements through nitrate-N sensor (Figure 4b). The nitrate-N removal efficiency depends on the available COD during the anoxic phase [19]. The optimal ratio to achieve complete denitrification in conventional systems was reported to be 6.0 - 8.0 mg COD mg -1 NO3--N [20]. In our case, the beneficial ratio for successful denitrification was 7 mg COD mg-1 NO3--N. Under normal conditions, initial NO3--N concentrations were 6.68 ± 0.1, 9.36 ± 0.68 and 5.19 ± 0.72 mg L-1 for days 0-1, 3.5-4.5 and 4.5-6, reaching the endpoint of 1 mg NO3--N L-1 within 21 ± 2, 31 ± 7 and 13 ± 1 minutes, respectively, at the end of the anoxic phase, achieving complete denitrification.
During the disturbance period (days 1-3), denitrification performance decreased with nitrate-N accumulation reaching 35.9 mg L-1, restricting the nitrogen removal rate due to insufficient organic carbon in the wastewater (COD/NO3--N < 4). From days 1-1.6, the controller automatically extended anoxic phase length to 66 ± 1 minutes to aid the denitrification process and HDB activity. However, despite the maximum anoxic duration length (upper time-limit in controller) being increased by the controller to 77 ± 5 minutes, the HDB activity was at too low level to eliminate nitrates. In this case, an external carbon source (glycerol, equivalent to 222 mg L−1 soluble COD) should be added to normalize the disturbance and achieve complete denitrification. Following carbon addition (day 3), nitrate-N removal improved significantly, achieving the 1 mg L−1 endpoint within 44 minutes. Subsequently, from day 3.5 to 4.5, nitrate-N removal of 8.4 ± 0.69 mg L-1 within 31 ± 7 min was achieved, and between days 4.5 and 6, dynamic control led to complete denitrification within only 13 ± 1 min, demonstrating both the successful performance of the control strategy and normalization with reference to the initial system performance.
3.3. Nitrification and Denitrification Process Control Outcomes After Interventions
The potential of dynamic process control regarding the optimization of nitrogen removal is depicted in Figure 5. An external disturbance (toxic spills addition) had a significant effect on control performance, extending the processes length due to ammonium-N concentration increase from 7.1 to 17.5 mg L-1. After the disturbance, the dynamic supervision control extended the nitrification phase length up to 92 ± 15 min to achieve the endpoint of 2 mg L-1.
Due to excess ammonium-N concentration and constant air-flow rate, the DO level was reduced below 1.5 mg L-1, a low value for AOB to oxidize ammonium-N over 18 mg L-1, resulting in NH4+-N accumulation. Two practices were employed (~day 3, equivalent to the 4320th minute) to solve this problem, as shown in Figure 5. The air supply was initially increased to obtain a DO concentration over 3 mg L-1 by using a second blower. The second practice was to extend the duration of the aerobic phase from 1 to 2 hours. After two days (corresponding to the 7200th minute), the AOB oxidized the excess ammonia, and the NH4+-N concentration reached the endpoint of 2 mg L-1.
Regarding denitrification, on ~day 2 (corresponding to the 2880th minute), a nitrate-N upward trend was noted due to nitrates accumulation caused by unavailable carbon content (COD/NO3--N < 5). The maximum anoxic duration length was increased from 60 to 120 minutes; however, HDB could not consume the formed nitrates within the new permitted timeframe. Afterwards, biodegradable organic carbon (20 mL dense glycerol, equivalent to 222 mg L-1 soluble COD) was instantly added to reduce nitrates. Therefore, nitrates decreased from 23.9 mg L-1 to the endpoint of 1 mg L-1 in a short time of 108 minutes. On day 7, HDB returned to steady-state conditions with initial reaction times. At the same time, biosolids addition led to an ammonium-N concentration increase until 14 mg L-1, extending the reaction time of nitrification and denitrification. However, AOB and HDB removed the excess ammonia and nitrates within a few hours, reaching the endpoints of 2 and 1 mg L-1 for the NH4+-N and NO3--N concentrations, respectively.
3.4. Dynamic Nitrification and Denitrification Process Control After Sudden and Deliberate External Disturbance
Most studies using real-time control strategies rely on indirect parameters such as ORP, OUR, DO and pH that become ineffective when influent loads fluctuate significantly. According to Kwon et al. [34], the direct monitoring of ammonia and nitrates in the bioreactor provides more effective control without requiring changes to automatic control strategies, even during substantial load variations, as confirmed in our results. As depicted in Figure 6, two experiments were conducted with external disturbances that suddenly increased the ammonium-N loading rate (ALR) to assess the effectiveness of real-time dynamic control of nitrification and denitrification. Specifically, the dynamic reaction and adaptation of nitrifying and denitrifying bacteria was estimated to ammonium-N concentration increase by 12.1 mg L-1 and 13.9 mg L-1.
Ammonium-N loading rates varied from 0.03 to 0.1 g L-1 d-1 for municipal wastewater according to Battistoni et al. [35]. In another study, a low ALR ranged from 0.01 to 0.08 g L-1 d-1 while a high ALR varied from 0.13-0.24 g L-1 d-1, applying an alternating aerobic/anoxic process in three full-scale applications [36]. In this study, the ALR ranged from 0.18 to 0.26 g L-1 d-1 for a working volume of bioreactor equal to 45 L. The initial NH4+-N concentration in the mixed liquor varied from 7.5 to 10.9 mg L-1 (average, 8.8 ± 1.1 mg L-1) in the bioreactor, achieving complete NH4+-N removal below the desired endpoint of 2 mg L-1 (average, 1.15 ± 0.39 mg L-1). The respective nitrification time lasted from 38 to 48 min (average, 42 ± 3 min) for this ammonium-N concentration range. A subsequent ALR increase of 0.5 g L-1 d-1 (day 1.6) caused an NH4+-N concentration increase from 8.9 to 21 mg L-1. Ammonia oxidation bacteria (AOB) were unable to oxidize all the ammonium-N content during the first ΝH4+-Ν concentration increase (21 mg L-1). This occurred because the current population of AOB was not sufficient to oxidize the instantaneous high ammonium-N concentration. For this reason, a temporary increase in the ammonium-N output was observed. AOB were able to oxidize 14.6 mg L-1 NH4+-N within 73 min. Free ammonia concentration was less than 0.2 mg L-1, which did not affect the nitrite oxidizing bacteria population (NOB) and the overall specific nitrification rate remained constant at 0.1 g NH4+-N g-1 VSS d-1 [37]. However, nitrifiers (AOB and NOB) adapted within a short time of three hours, returning to the initial steady-state conditions. Specifically, after only two operating cycles (day 2), 10.8 mg L-1 ΝH4+-Ν was oxidized to the endpoint within 53 min. In the following 10 hours (between days 2 and 2.5), complete nitrification was achieved in 38 ± 1 min for 6.9 ± 0.22 mg L-1 NH4+-N oxidation, reaching an effluent value of 0.62 ± 0.22 mg L-1 at the end of aeration. This potential to achieve high ammonium-N removal in the shortest time, combined with quick biomass adaptation that lasted 20 h, led us to proceed with a further ALR increase of 0.51 g L-1 d-1 in order to investigate the biomass behavior. The instantaneous NH4+-N value increased from 7.4 to 21.3 mg L-1 during the feeding time in the anoxic phase. Thus, AOB oxidized 16.1 mg L-1 NH4+-N in the aerobic phase (day 2.5) at a nitrification phase length of 74 min. In the following cycle, 15.1 mg NH4+-N L-1 was fully oxidized, reaching the endpoint. During the reference period, the AOΒ adapted (within 13 h) to the second ammonium-N increase, achieving NH4+-N removal of 12.5 ± 1.38 mg L-1 (initial NH4+-N concentration, 14 ± 1.4 mg L-1). The ammonium-N oxidation time was 69 ± 6 min, and the biomass returned completely to initial conditions after two days (day 4). Figure 6 confirms biomass adaptation and nitrogen removal progress after ammonium-N increase. Between the 3rd and 4th days, the NH4+-N removal was 9 ± 0.49 mg L-1 for an initial NH4+-N concentration range from 9.5 to 11.7 mg L-1 and an oxidation phase length of 54 ± 3 min. From days 4 to 5, the biomass returned to the initial steady-state conditions with NH4+-N removal of 6.5 ± 0.52 mg L-1. A very short oxidation time of 41 ± 3 min was achieved for an initial NH4+-N concentration of 7.4 ± 0.68 mg L-1, always reaching the endpoint of 2 mg L-1.
Heterotrophic denitrifying bacteria (HDB) in the absence of dissolved oxygen, consumed the formed nitrates during the entire experimental period, reaching the endpoint of 1 mg L-1. As shown in Figure 6, the IAF-AS process and the excess carbon content (COD/NO3--N ratio, 13.7) led to complete denitrification, reaching the endpoint. Before the first experiment, NO3--N concentration varied from 8.06 to 8.84 mg L-1 (8.39 ± 0.23 mg L-1), and the denitrifying bacteria reduced the nitrate-N to nitrogen gas (Ν2) within only 25 ± 2 min. During midday hours, the nitrate-N concentration increased to 9.29 ± 0.23 mg L-1 and the denitrification time was extended to 38 ± 4 min. Afterward, the first ALR increase of 0.5 g L-1 d-1 did not appear to affect the denitrifying bacteria, which converted all the nitrates (10.4 ± 0.5 mg L-1 NO3--N) to N2 within a reduction timeframe of 63 ± 7 min, with available biodegradable COD. Song et al. [20] proved that the ammonia oxidation rate decreased when the duration of the anoxic phase increased from 80 to 160 min, whereas the aeration phase length was stable at 60 min in an intermittently aerated sequencing batch reactor. This long anoxic stress duration affected the nitrification activity and led to a lower nitrification rate.
During the second experiment, the nitrate-N concentration increased from 7.89 ± 0.24 mg L-1 to 11.1 ± 0.41 mg L-1 and the denitrification time was longer (70 ± 5 min) than in the previous experiment. However, from days 3 to 4, the biomass adapted, and the nitrate-N concentration of 9.4 ± 0.29 mg L-1 was completely removed within a reduction time of 54 ± 8 min. Between days 4 and 5, the nitrate-N reduction time was minimized, reaching the endpoint in a short time of 23 ± 8 min for nitrate-N consumption of 7.14 ± 0.25 mg L-1 (initial NO3--N concentration, 8.1 ± 0.25 mg L-1). As depicted in Figure 7a, NH4+-N concentration up to 7.5 mg L-1 was oxidized within 26 ± 4 min for a C/N ratio of 7.3 until ammonium-N depletion. The ammonium-N oxidation time increased to 39 ± 9 min for an initial influent NH4+-N concentration of 8.4 ± 0.32 mg L-1. For ammonium-N concentrations from 10 to 20 mg L-1 NH4+-N, the nitrification time increased from 65 to 75 min, reaching the maximum timeframe of aerobic period. This period lasted twice as long at an ammonium-N concentration equal to 11 mg L-1 in a respective IAF-AS system [38].
The formed nitrates from 3.5 to 6.4 mg L-1 were consumed within 15 ± 2 min by HDB, while nitrates from 7.5 to 10 mg L-1 were reduced within 29 ± 5 min (Figure 7b). When the nitrate-N concentration increased from 11 up to 15 mg L-1, HDB consumed 14 mg L-1 NO3--N within a nitrate-N reduction time of 62 ± 2 min, with available organic substrate. discuss the results and how they can be interpreted from the perspective of previous studies and of the working hypotheses. The findings and their implications should be discussed in the broadest context possible. Future research directions may also be highlighted.
3.5. Specific Nitrification (SNR) and Denitrification (SDR) Rates
According to the Michaelis-Menten equation, the kinetic of ammonia oxidation depends on ammonium nitrogen concentration, dissolved oxygen concentration and carbon dioxide content. Keeping the dissolved oxygen concentration and carbon dioxide concentration at constant levels, the effect of ammonia nitrogen concentration on nitrification rates and ammonium nitrogen removal is evident. Specific nitrification rates (SNR) formed during the aeration phase ranged from 0.09 to 0.11 g NH4+-N oxidized per g VSS per day with an average of 0.1 g g-1 VSS d-1. These rates are comparable equal or higher than literature values for similar systems [14,35]. The specific denitrification rates (SDR) were observed in the anoxic phase combined with the electron donor, since heterotrophic denitrifying bacteria used the readily biodegradable COD corresponding to the fastest rate. Under normal conditions, SDR ranged from 0.45 to 0.51 g NO3--N removed per g VSS per day (average 0.47 ± 0.02 g g-1 VSS d-1). These rates exceeded those reported in previous studies [14,35,39], likely due to optimal carbon availability and intermittent feeding strategy. Further, the SNR and SDR in this study were higher than those reported for an intermittently aerated MBR system treating textile wastewater, which had maximum specific nitrification and dentification rates of 0.13 g N g-1 VSS d-1 [40].
The applied control strategy ensures process optimization, maximizing the denitrification efficiency (>99% nitrate removal). Table 2 presents a general overview of the variation of specific nitrification (SNR) and denitrification (SDR) rates, and the respective reaction times depending on the range of initial ammonium-N and nitrate-N concentrations within the mixed liquor. In the case that the initial nitrogen concentration was gradually increased, mainly the denitrification rates increased, indicating higher HDB activity and their numerical superiority over AOB activity in the total biomass.
3.6. Energy Consumption
Aeration accounts for a significant portion between 50% and 90% of the total electricity consumption in wastewater treatment plants (WWTPs), primarily due to the oxygen demand for oxidizing organic carbon and ammonia during the aerobic phase [4]. Therefore, selecting the appropriate duration of the aerobic phase requires balancing nitrogen removal efficiency with energy use. Intermittently aerated activated sludge systems have demonstrated considerable energy savings, achieving reductions of up to 45% compared to conventional systems [41], while Song et al. [20] reported a 25% decrease in aeration energy demand. In the present study, an energy saving of 33% in aeration was achieved compared to a continuously aerated conventional activated sludge (AS) system. This corresponds to a daily reduction of 1.92 kWh in aeration energy consumption, under an optimized alternating anoxic/aerobic cycle of 20 minutes anoxic followed by 40 minutes aerobic equivalent to 16 hours of aeration per day. Under these operational conditions, 24 feeding events occurred daily at the beginning of each anoxic phase, resulting in an applied loading rate (ALR) of 0.2 g L−1 d−1.
Aeration energy consumption was estimated based on the air blower’s operating time and power rating of 0.12 kW. For average wastewater loading rates ranging from 0.037 to 0.063 m3 day-1, this corresponded to an energy use of 52 to 30 kWh per m3 of treated wastewater. Assuming an average electricity price of €0.14 kWh-1 in Greece, the resulting daily aeration cost ranged from €0.019 to €0.033 per m3, depending on the flow rate.
4. Conclusions
The performance of an intermittently aerated and fed activated sludge (IAF-AS) system utilizing an advanced process control able to adjust the duration of both the aerobic phase and the anoxic phase, based on online ammonium-N and nitrate-N measurements, was monitored. Dynamic control of the nitrification and denitrification phase duration was implemented, depending on the variation of influent ammonium and nitrate nitrogen concentrations, respectively, while keeping all other operating parameters at constant levels. The aerobic phase duration was dynamically controlled by in-situ online ammonium nitrogen ion-selective electrodes (ISE) sensor, while the anoxic phase was dynamically controlled by in-situ online nitrate nitrogen ISE sensor. By setting the endpoints of ammonium-N (2 mg L-1) and nitrate-N (1 mg L-1) concentrations as control rules in the PLC, optimization of the nitrification and denitrification processes was attained according to the incoming ammonium-N loading rate (ALR). For initial ammonium-N concentrations of 3.5-7.5 mg L-1, which correspond to ALR between 0.08-0.18 g L-1 d-1, complete nitrification was achieved in an average phase length of 25-30 min, respectively. Complete denitrification was achieved in an average duration of 16 min. For initial ammonium-N concentrations from 7.5 to 11 mg L-1 which correspond to ALR between 0.18-0.26 g L-1 d-1, the average phase length was 43 min, and 90% of the load was nitrified within 30 min, whereas 13 min were required for nitrification of the residual load. In this case, the average denitrification time was 26 min. The implementation of the process control was assessed as successful as the high ammonium-N, nitrate-N and TKN removal efficiencies were found to be 97%, 100% and 91%, respectively. Ultimately, the current work demonstrates for the first time that dynamic nitrification and denitrification process control is the most suitable and optimal approach to improve ammonium-N and nitrate-N removal for both various ammonium-N loading rates and sudden nitrogen increases. Thus, dynamic control improves the reliability and robustness of biological nitrogen removal processes applied in the WWTPs while offering maximum energy savings. is not mandatory but can be added to the manuscript if the discussion is unusually long or complex.
Author Contributions
Conceptualization, P.M. and K.A.; methodology, P.M. and K.A.; software, P.M. and K.A.; formal analysis, K.A.; investigation, K.A.; resources, P.M.; data curation, P.M., S.N. and K.A.; writing-original draft preparation, K.A.; writing-review, editing, P.M, S.N. and K.A.; supervision, P.M. and S.N.; project administration, P.M. All authors have read and agreed to the published version of the manuscript.
Funding
This research received no external funding.
Institutional Review Board Statement
Not applicable.
Informed Consent Statement
Not applicable.
Data Availability Statement
The original contributions presented in this study are included in the article. Further inquiries can be directed to the corresponding authors.
Acknowledgments
The authors would like to thank Mr. Alexandros Alexandridis for his valuable contribution in designing the automated control system.
Conflicts of Interest
The authors declare no conflicts of interest.
References
- Marsili-Libelli, S.; Spagni, A.; Susini, R. Intelligent monitoring system for long-term control of sequencing batch reactors. Water Sci Technol 2008, 57, 431–438. [Google Scholar] [CrossRef] [PubMed]
- Avilés, A.B.L.; Velázquez, F.D.C.; Del Riquelme, M.L.P. Methodology for energy optimization in wastewater treatment plants. Phase iii: Implementation of an integral control system for the aeration stage in the biological process of activated sludge and the membrane biological reactor. Sensors (Basel) 2020, 20, 1–19. [Google Scholar]
- Iratni, A.; Chang, N.B. Advances in control technologies for wastewater treatment processes: Status, challenges, and perspectives. IEEE CAA J Autom Sin 2019, 6, 337–363. [Google Scholar] [CrossRef]
- Drewnowski, J.; Remiszewska-Skwarek, A.; Duda, S.; Łagód, G. Aeration process in bioreactors as the main energy consumer in a wastewater treatment plant. Review of solutions and methods of process optimization. Processes 2019, 7, 311. [Google Scholar] [CrossRef]
- Alattabi, A.W.; Harris, C.; Alkhaddar, R.; Alzeyadi, A.; Abdulredha, M. Online Monitoring of a Sequencing Batch Reactor Treating Domestic Wastewater. Procedia Eng 2017, 196, 800–807. [Google Scholar] [CrossRef]
- Wu, Z.; Mu, J.; Li, X.; Shan, R.; Li, K.; Liu, M.; Yu, M. A strategy for starting and controlling nitritation-denitrification in an SBR with DO and ORP online monitoring signals. Desalination Water Treat 2019, 151, 365–371. [Google Scholar] [CrossRef]
- Li, S.; Mu, J.; Du, Y.; Wu, Z. Study and application of real-time control strategy based on DO and ORP in nitritation–denitrification SBR start-up. Environ Technol 2021, 42, 114–125. [Google Scholar] [CrossRef]
- Jaramillo, F.; Orchard, M.; Muñoz, C.; Zamorano, M.; Antileo, C. Advanced strategies to improve nitrification process in sequencing batch reactors - A review. J Environ Manage 2018, 218, 154–164. [Google Scholar] [CrossRef]
- Miyake, M.; Hasebe, Y.; Furusawa, K.; Shiomi, H.; Inoue, D.; Ike, M. Enhancement of nutrient removal in an activated sludge process using aerobic granular sludge augmentation strategy with ammonium-based aeration control. Chemosphere 2023, 340, 139826. [Google Scholar] [CrossRef]
- Rieger, L.; Jones, R.M.; Dold, P.L.; Bott, C.B. Ammonia-based feedforward and feedback aeration control in activated sludge processes. Water Environ Res 2014, 86, 63–73. [Google Scholar] [CrossRef]
- Várhelyi, M.; Cristea, V.M.; Brehar, M. Improving Waste Water Treatment Plant Operation by Ammonia Based Aeration and Return Activated Sludge Control. Comput Aided Chem Eng 2019, 46, 1165–1170. [Google Scholar]
- Stewart, R.D.; Bashar, R.; Amstadt, C.; Uribe-Santos, G.A.; McMahon, K.D.; Seib, M.; Noguera, D.R. Pilot-scale comparison of biological nutrient removal (BNR) using intermittent and continuous ammonia-based low dissolved oxygen aeration control systems. Water Sci Technol 2022, 85, 579–590. [Google Scholar] [CrossRef] [PubMed]
- Mansouri, A.M.; Zinatizadeh, A.A.; Irandoust, M.; Akhbari, A. Statistical analysis and optimization of simultaneous biological nutrients removal process in an intermittently aerated SBR. Korean J Chem Eng 2014, 31, 88–97. [Google Scholar] [CrossRef]
- Melidis, P.; Ntougias, S.; Sertis, C. On-line monitoring of a BNR process using in situ ammonium and nitrate probes and biomass nitrification-denitrification rates in an intermittently aerated and pulse fed bioreactor. J Chem Technol Biotechnol 2014, 89, 1516–1522. [Google Scholar] [CrossRef]
- Regmi, P.; Bunce, R.; Miller, M.W.; Park, H.; Chandran, K.; Wett, B.; Murthy, S.; Bott, C.B. Ammonia-based intermittent aeration control optimized for efficient nitrogen removal. Biotechnol Bioeng 2015, 112, 2060–2067. [Google Scholar] [CrossRef]
- Singh, N.K.; Bhatia, A.; Kazmi, A.A. Effect of intermittent aeration strategies on treatment performance and microbial community of an IFAS reactor treating municipal wastewater. Environ Technol 2017, 38, 2866–2876. [Google Scholar] [CrossRef]
- Barana, A.C.; Lopes, D.D.; Martins, T.H.; Pozzi, E.; Damianovic, M.H.R.Z.; Del Nery, V.; Foresti, E. Nitrogen and organic matter removal in an intermittently aerated fixed-bed reactor for post-treatment of anaerobic effluent from a slaughterhouse wastewater treatment plant. J Environ Chem Eng 2013, 1, 453–459. [Google Scholar] [CrossRef]
- Wosiack, P.A.; Lopes, D.D.; Rissato Zamariolli Damianovic, M.H.; Foresti, E.; Granato, D.; Barana, A.C. Removal of COD and nitrogen from animal food plant wastewater in an intermittently-aerated structured-bed reactor. J Environ Manage 2015, 154, 145–150. [Google Scholar] [CrossRef]
- Santos, C.E.D.; Moura, R.B.; Damianovic, M.H.R.Z.; Foresti, E. Influence of COD/N ratio and carbon source on nitrogen removal in a structured-bed reactor subjected to recirculation and intermittent aeration (SBRRIA). J Environ Manage 2016, 166, 519–524. [Google Scholar] [CrossRef]
- Song, X.; Liu, R.; Chen, L.; Dong, B.; Kawagishi, T. Advantages of intermittently aerated SBR over conventional SBR on nitrogen removal for the treatment of digested piggery wastewater. Front Environ Sci Eng 2017, 11, 13. [Google Scholar] [CrossRef]
- Azis, K.; Ntougias, S.; Melidis, P. NH4+-N versus pH and ORP versus NO3--N sensors during on-line monitoring of an intermittently aerated and fed membrane bioreactor. Environ Sci Pollut Res 2021, 28, 33837–33843. [Google Scholar] [CrossRef]
- Tchobanoglous, G.; Abu-Orf, M.; Burton, F.L.; Bowden, G.; Stensel, H.D.; Tsuchihashi, R.; Pfrang, W. Wastewater Engineering: Treatment and Resource Recovery, 5th ed.; McGraw-Hill: New York, USA, 2014; p. 2048. [Google Scholar]
- Parsa, Z.; Dhib, R.; Mehrvar, M. Dynamic Modelling, Process Control, and Monitoring of Selected Biological and Advanced Oxidation Processes for Wastewater Treatment: A Review of Recent Developments. Bioengineering 2024, 11, 189. [Google Scholar] [CrossRef]
- Tejaswini, E.S.S.; Uday Bhaskar Babu, G.; Seshagiri Rao, A. Design and evaluation of advanced automatic control strategies in a total nitrogen removal activated sludge plant. Water Environ J 2021, 35, 791–806. [Google Scholar] [CrossRef]
- Ferrentino, R.; Langone, M.; Vian, M.; Andreottola, G. Application of real-time nitrogen measurement for intermittent aeration implementation in a biological nitrogen removal system: performances and efficiencies. Environ Technol 2019, 40, 2513–2526. [Google Scholar] [CrossRef] [PubMed]
- Åmand, L.; Olsson, G.; Carlsson, B. Aeration control – a review. Water Sci Technol 2013, 67, 2374–2398. [Google Scholar] [CrossRef] [PubMed]
- Olsson, G.; Carlsson, B.; Comas, J.; Copp, J.; Gernaey, K.V.; Ingildsen, P.; Jeppsson, U.; Kim, C.; Rieger, L.; Rodríguez-Roda, I.; Steyer, J.-P.; Takács, I.; Vanrolleghem, P.A.; Vargas, A.; Yuan, Z.; Åmand, L. Instrumentation, control and automation in wastewater - From London 1973 to Narbonne 2013. Water Sci Technol 2014, 69, 1373–1385. [Google Scholar] [CrossRef] [PubMed]
- Chen, Q.; Wang, Q.; Yan, H.; Chen, C.; Ma, J.; Xu, Q. Improve the performance of full-scale continuous treatment of municipal wastewater by combining a numerical model and online sensors. Water Sci Technol 2018, 78, 1658–1667. [Google Scholar] [CrossRef]
- Huang, Y.; Wang, T.; Xu, Z.; Hughes, E.; Qian, F.; Lee, M.; Fan, Y.; Lei, Y.; Brückner, C.; Li, B. Real-Time in Situ Monitoring of Nitrogen Dynamics in Wastewater Treatment Processes using Wireless, Solid-State, and Ion-Selective Membrane Sensors. Environ Sci Technol 2019, 53, 3140–3148. [Google Scholar] [CrossRef]
- Cornelissen, R.; Van Dyck, T.; Dries, J.; Ockier, P.; Smets, I.; Van Den Broeck, R.; Van Hulle, S.; Feyaerts, M. Application of online instrumentation in industrial wastewater treatment plants - A survey in Flanders, Belgium. Water Sci Technol 2018, 78, 957–967. [Google Scholar] [CrossRef]
- Dries, J. Dynamic control of nutrient-removal from industrial wastewater in a sequencing batch reactor, using common and low-cost online sensors. Water Sci Technol 2016, 73, 740–745. [Google Scholar] [CrossRef]
- Lipps, W.C.; Braun-Howland, E.B.; Baxter, T.E. Standard Methods for the Examination of Water and Wastewater, 24th ed.; American Public Health Association (APHA), American Water Works Association (AWWA) and Water Environment Federation (WEF): Washington, DC, USA, 2023; p. 1536. [Google Scholar]
- Srb, M.; Lánský, M.; Charvátová, L.; Koubová, J.; Pecl, R.; Sýkora, P.; Rosický, J. Improved nitrogen removal efficiency by implementation of intermittent aeration. Water Sci Technol 2022, 86, 2248–2259. [Google Scholar] [CrossRef]
- Kwon, H.; Kang, H.J.; Park, Y.; Bae, J. Optimization of a sequencing batch reactor with the application of the Internet of Things. Water Res 2023, 229, 119511. [Google Scholar] [CrossRef]
- Battistoni, P.; Fatone, F.; Cola, E.; Pavan, P. Alternate cycles process for municipal WWTPs upgrading: Ready for widespread application? Ind Eng Chem Res 2008, 47, 4387–4393. [Google Scholar] [CrossRef]
- Nardelli, P.; Gatti, G.; Eusebi, A.L.; Battistoni, P.; Cecchi, F. Full-scale application of the alternating oxic/anoxic process: An overview. Ind Eng Chem Res 2009, 48, 3526–3532. [Google Scholar] [CrossRef]
- Liu, Y.; Ngo, H.H.; Guo, W.; Peng, L.; Wang, D.; Ni, B. The roles of free ammonia (FA) in biological wastewater treatment processes: A review. Environ Int 2019, 123, 10–19. [Google Scholar] [CrossRef]
- Pan, M.; Chen, T.; Hu, Z.; Zhan, X. Assessment of nitrogen and phosphorus removal in an intermittently aerated sequencing batch reactor (IASBR) and a sequencing batch reactor (SBR). Water Sci Technol 2013, 68, 400–405. [Google Scholar] [CrossRef]
- Xu, Z.; Zhang, L.; Gao, X.; Peng, Y. Optimization of the intermittent aeration to improve the stability and flexibility of a mainstream hybrid partial nitrification-anammox system. Chemosphere 2020, 261, 127670. [Google Scholar] [CrossRef]
- Yilmaz, T.; Demir, E.K.; Başaran, S.T.; Çokgör, E.U.; Sahinkaya, E. Specific ammonium oxidation and denitrification rates in an MBR treating real textile wastewater for simultaneous carbon and nitrogen removal. J Chem Technol Biotechnol 2023, 98, 2859–2867. [Google Scholar] [CrossRef]
- Dotro, G.; Jefferson, B.; Jones, M.; Vale, P.; Cartmell, E.; Stephenson, T. A review of the impact and potential of intermittent aeration on continuous flow nitrifying activated sludge. Environ Technol 2011, 32, 1685–1697. [Google Scholar] [CrossRef]
Figure 1.
Graphical user interface of IAF-AS system including the mechanical parts.
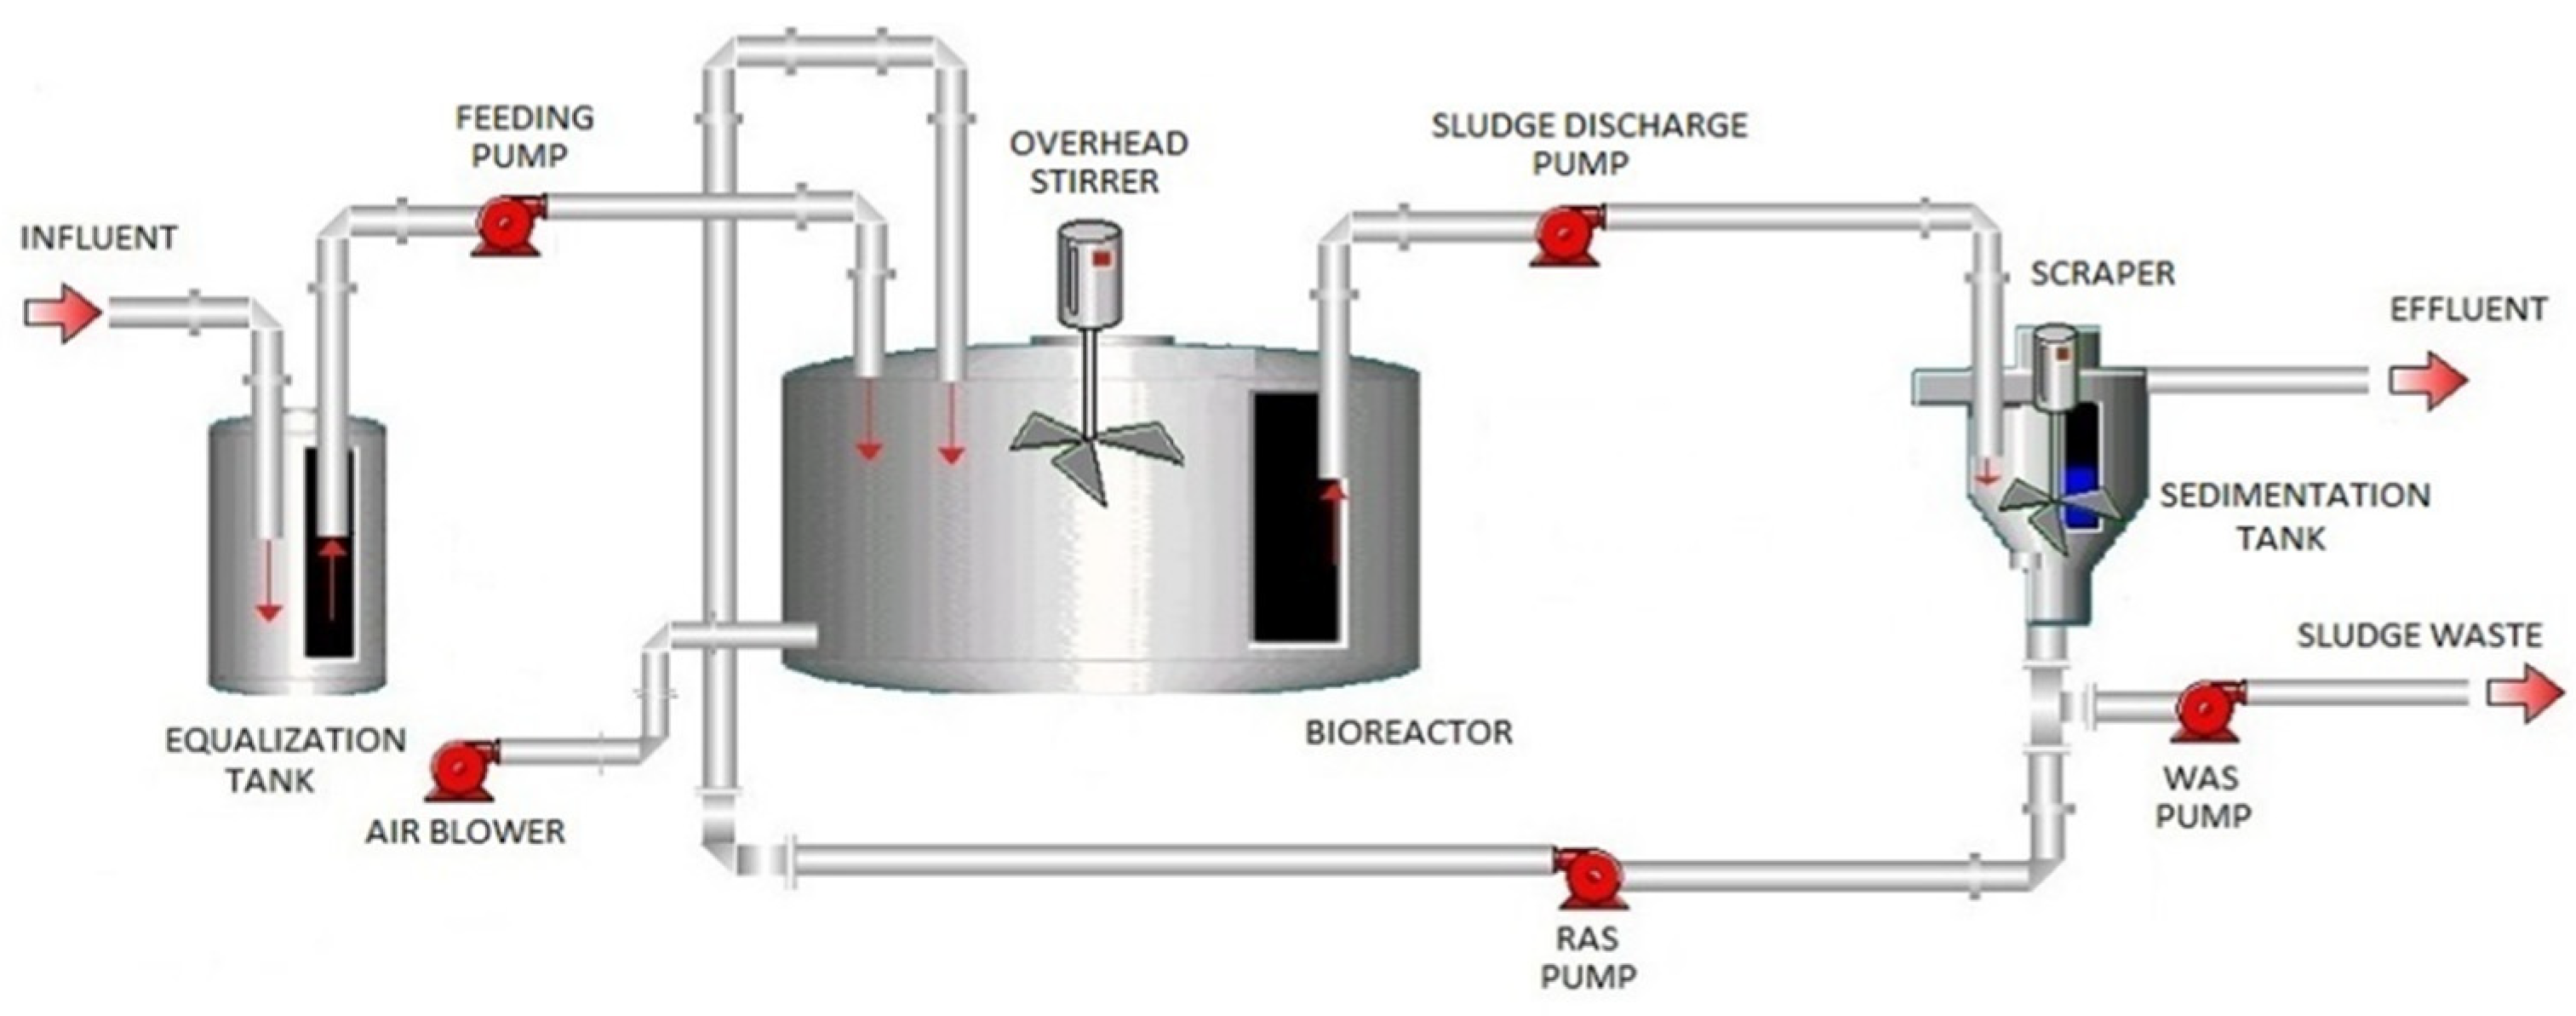
Figure 2.
Real-time control strategy of the aerobic and anoxic phase using online NH4+-N and NO3--N measurements.
Figure 2.
Real-time control strategy of the aerobic and anoxic phase using online NH4+-N and NO3--N measurements.
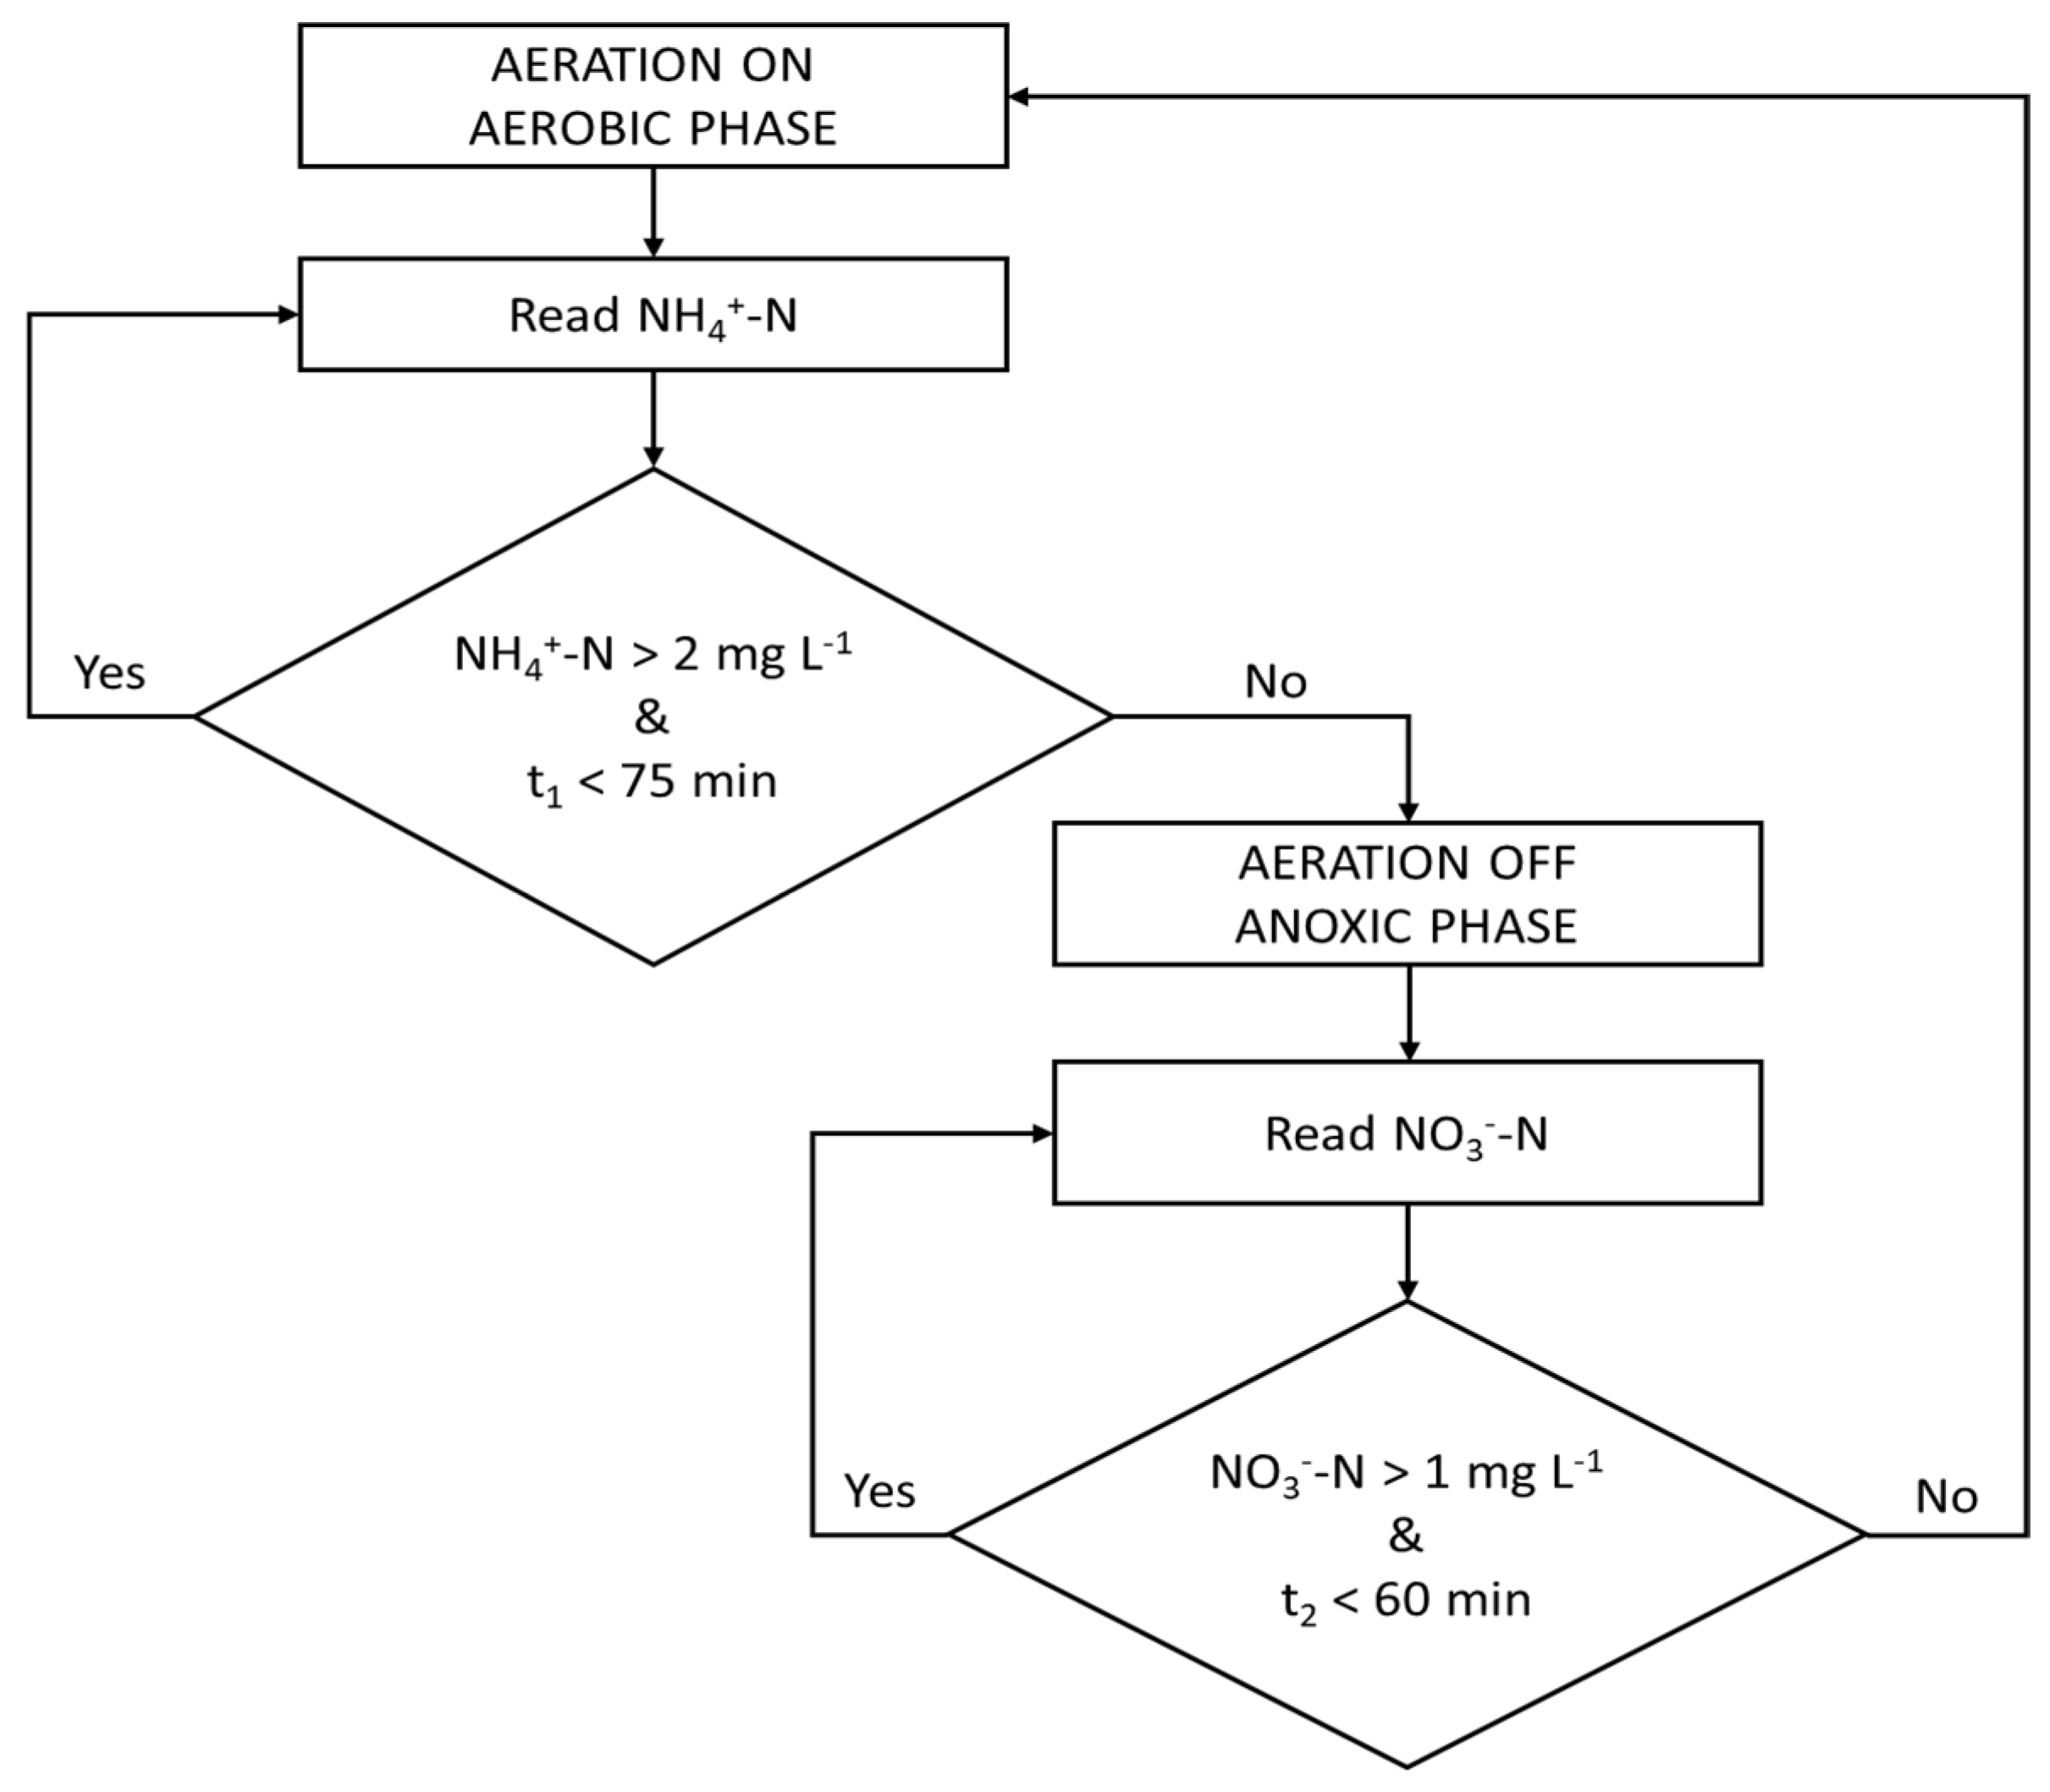
Figure 3.
Dynamic profile of NH4+-N and NO3--N concentrations during the intermittently aerated and fed strategy at two sequence operating cycles.
Figure 3.
Dynamic profile of NH4+-N and NO3--N concentrations during the intermittently aerated and fed strategy at two sequence operating cycles.
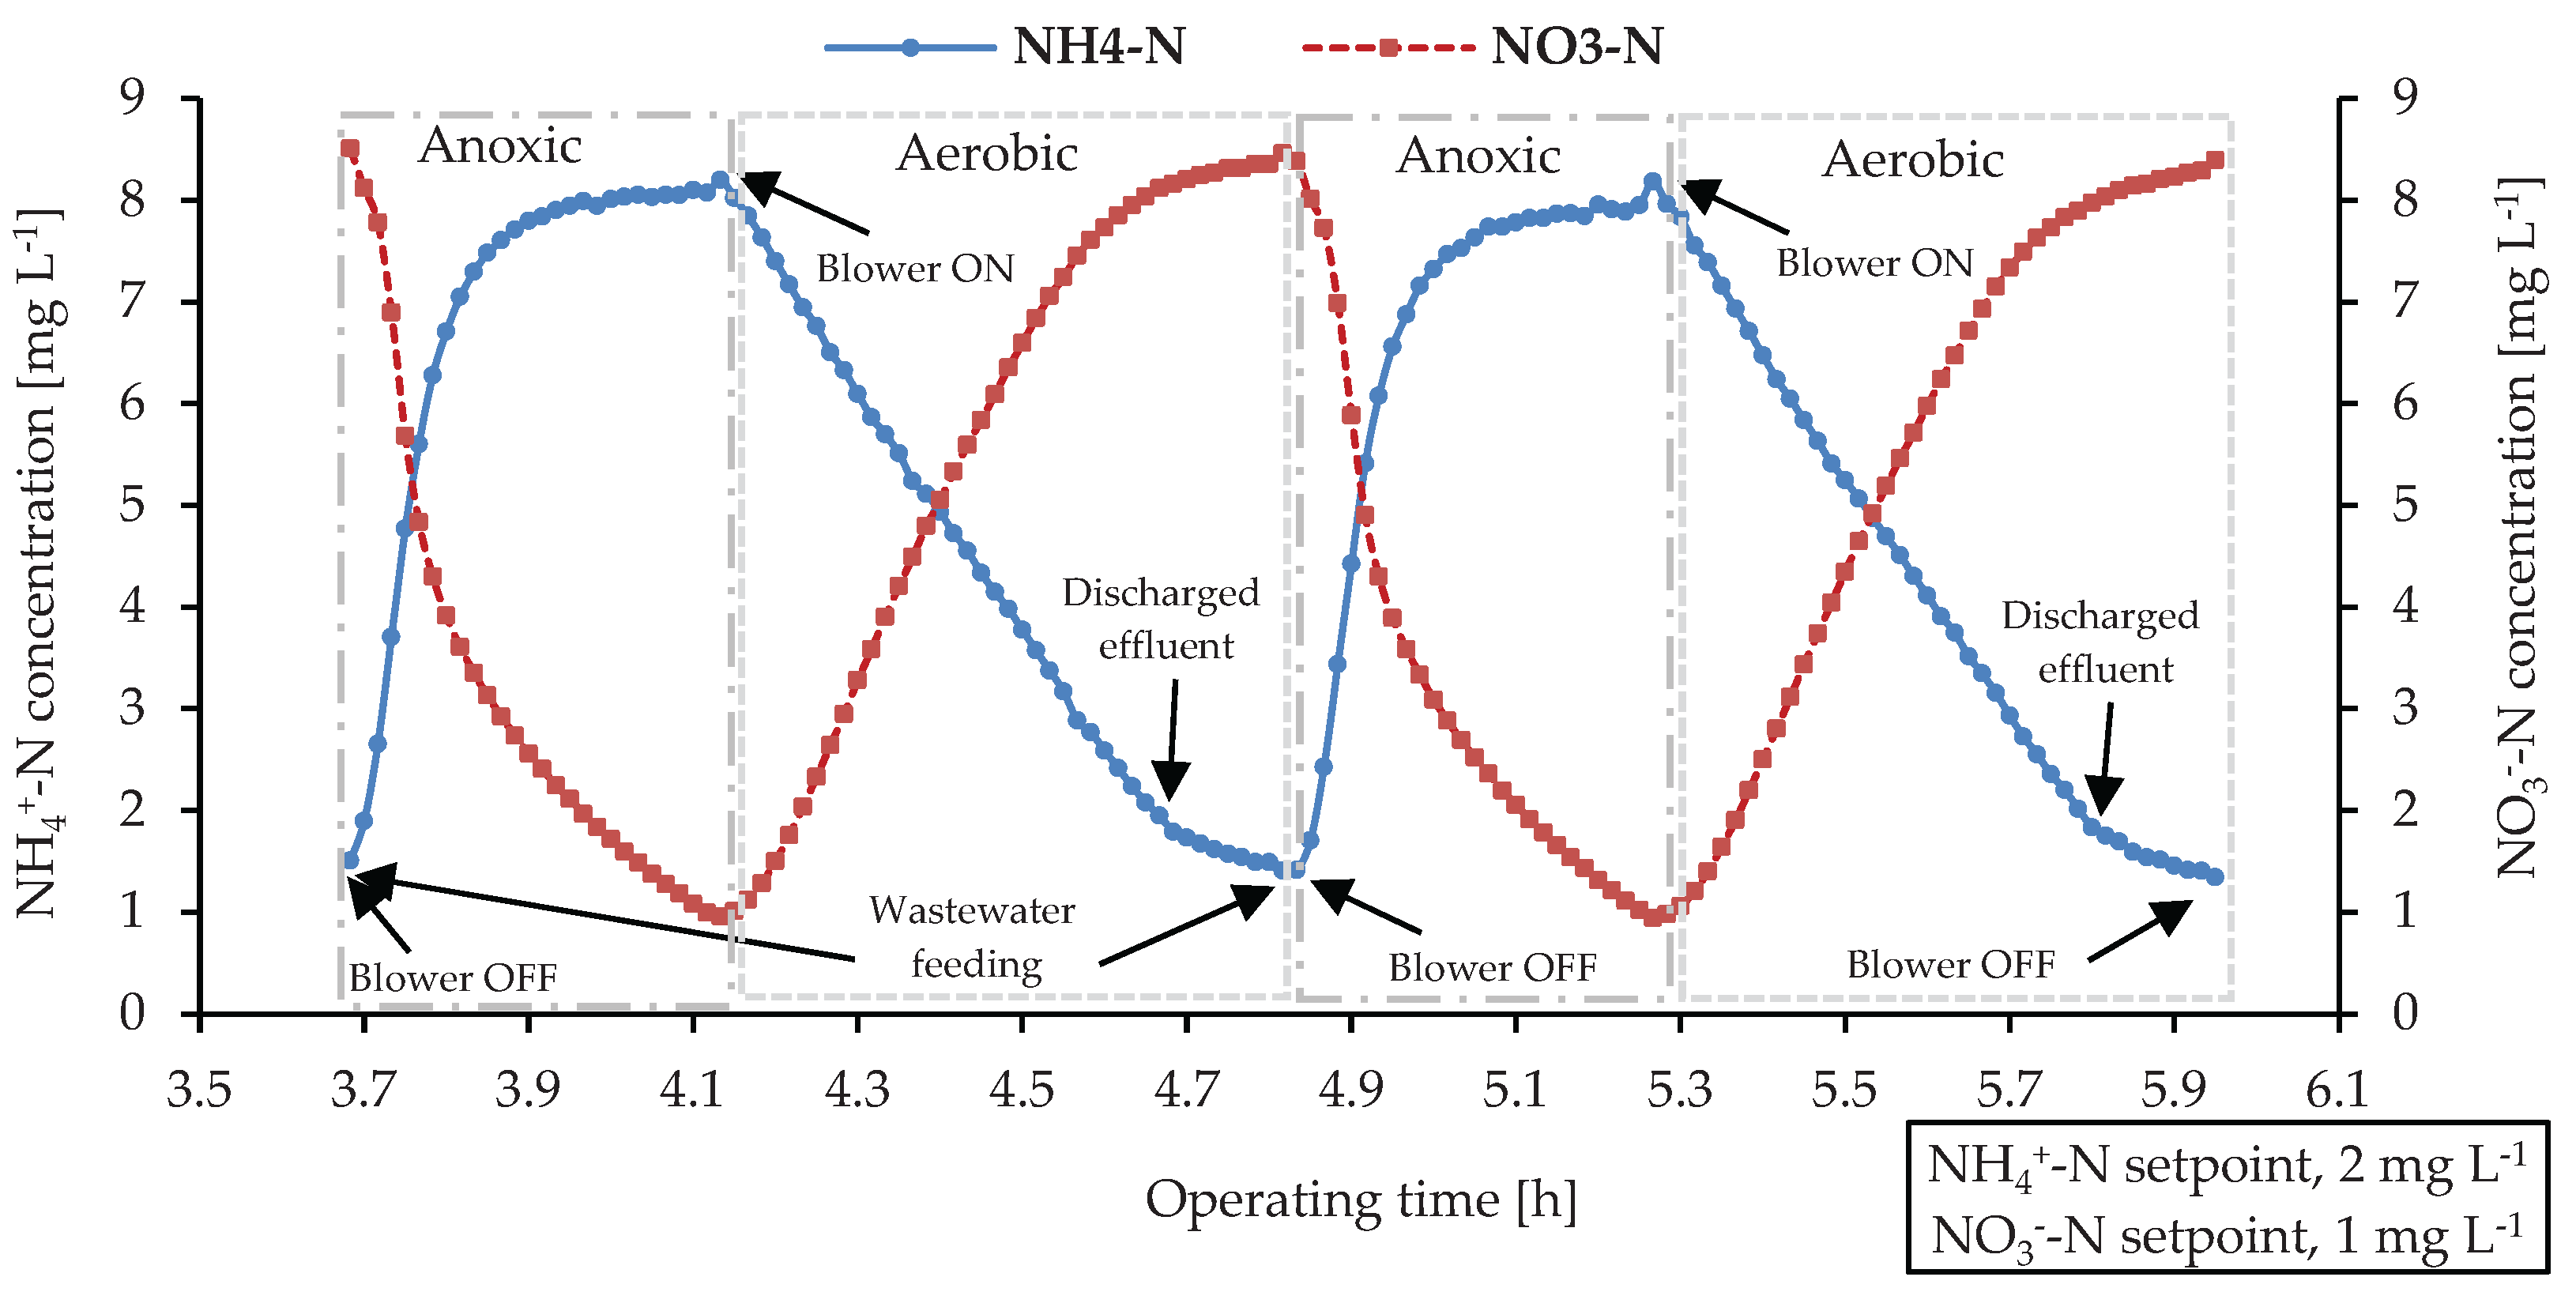
Figure 4.
a. NH4+-Ν profile in several ammonium-N loading rates (ALR). b. NO3--N profile in several nitrate loading rates (NLR).
Figure 4.
a. NH4+-Ν profile in several ammonium-N loading rates (ALR). b. NO3--N profile in several nitrate loading rates (NLR).
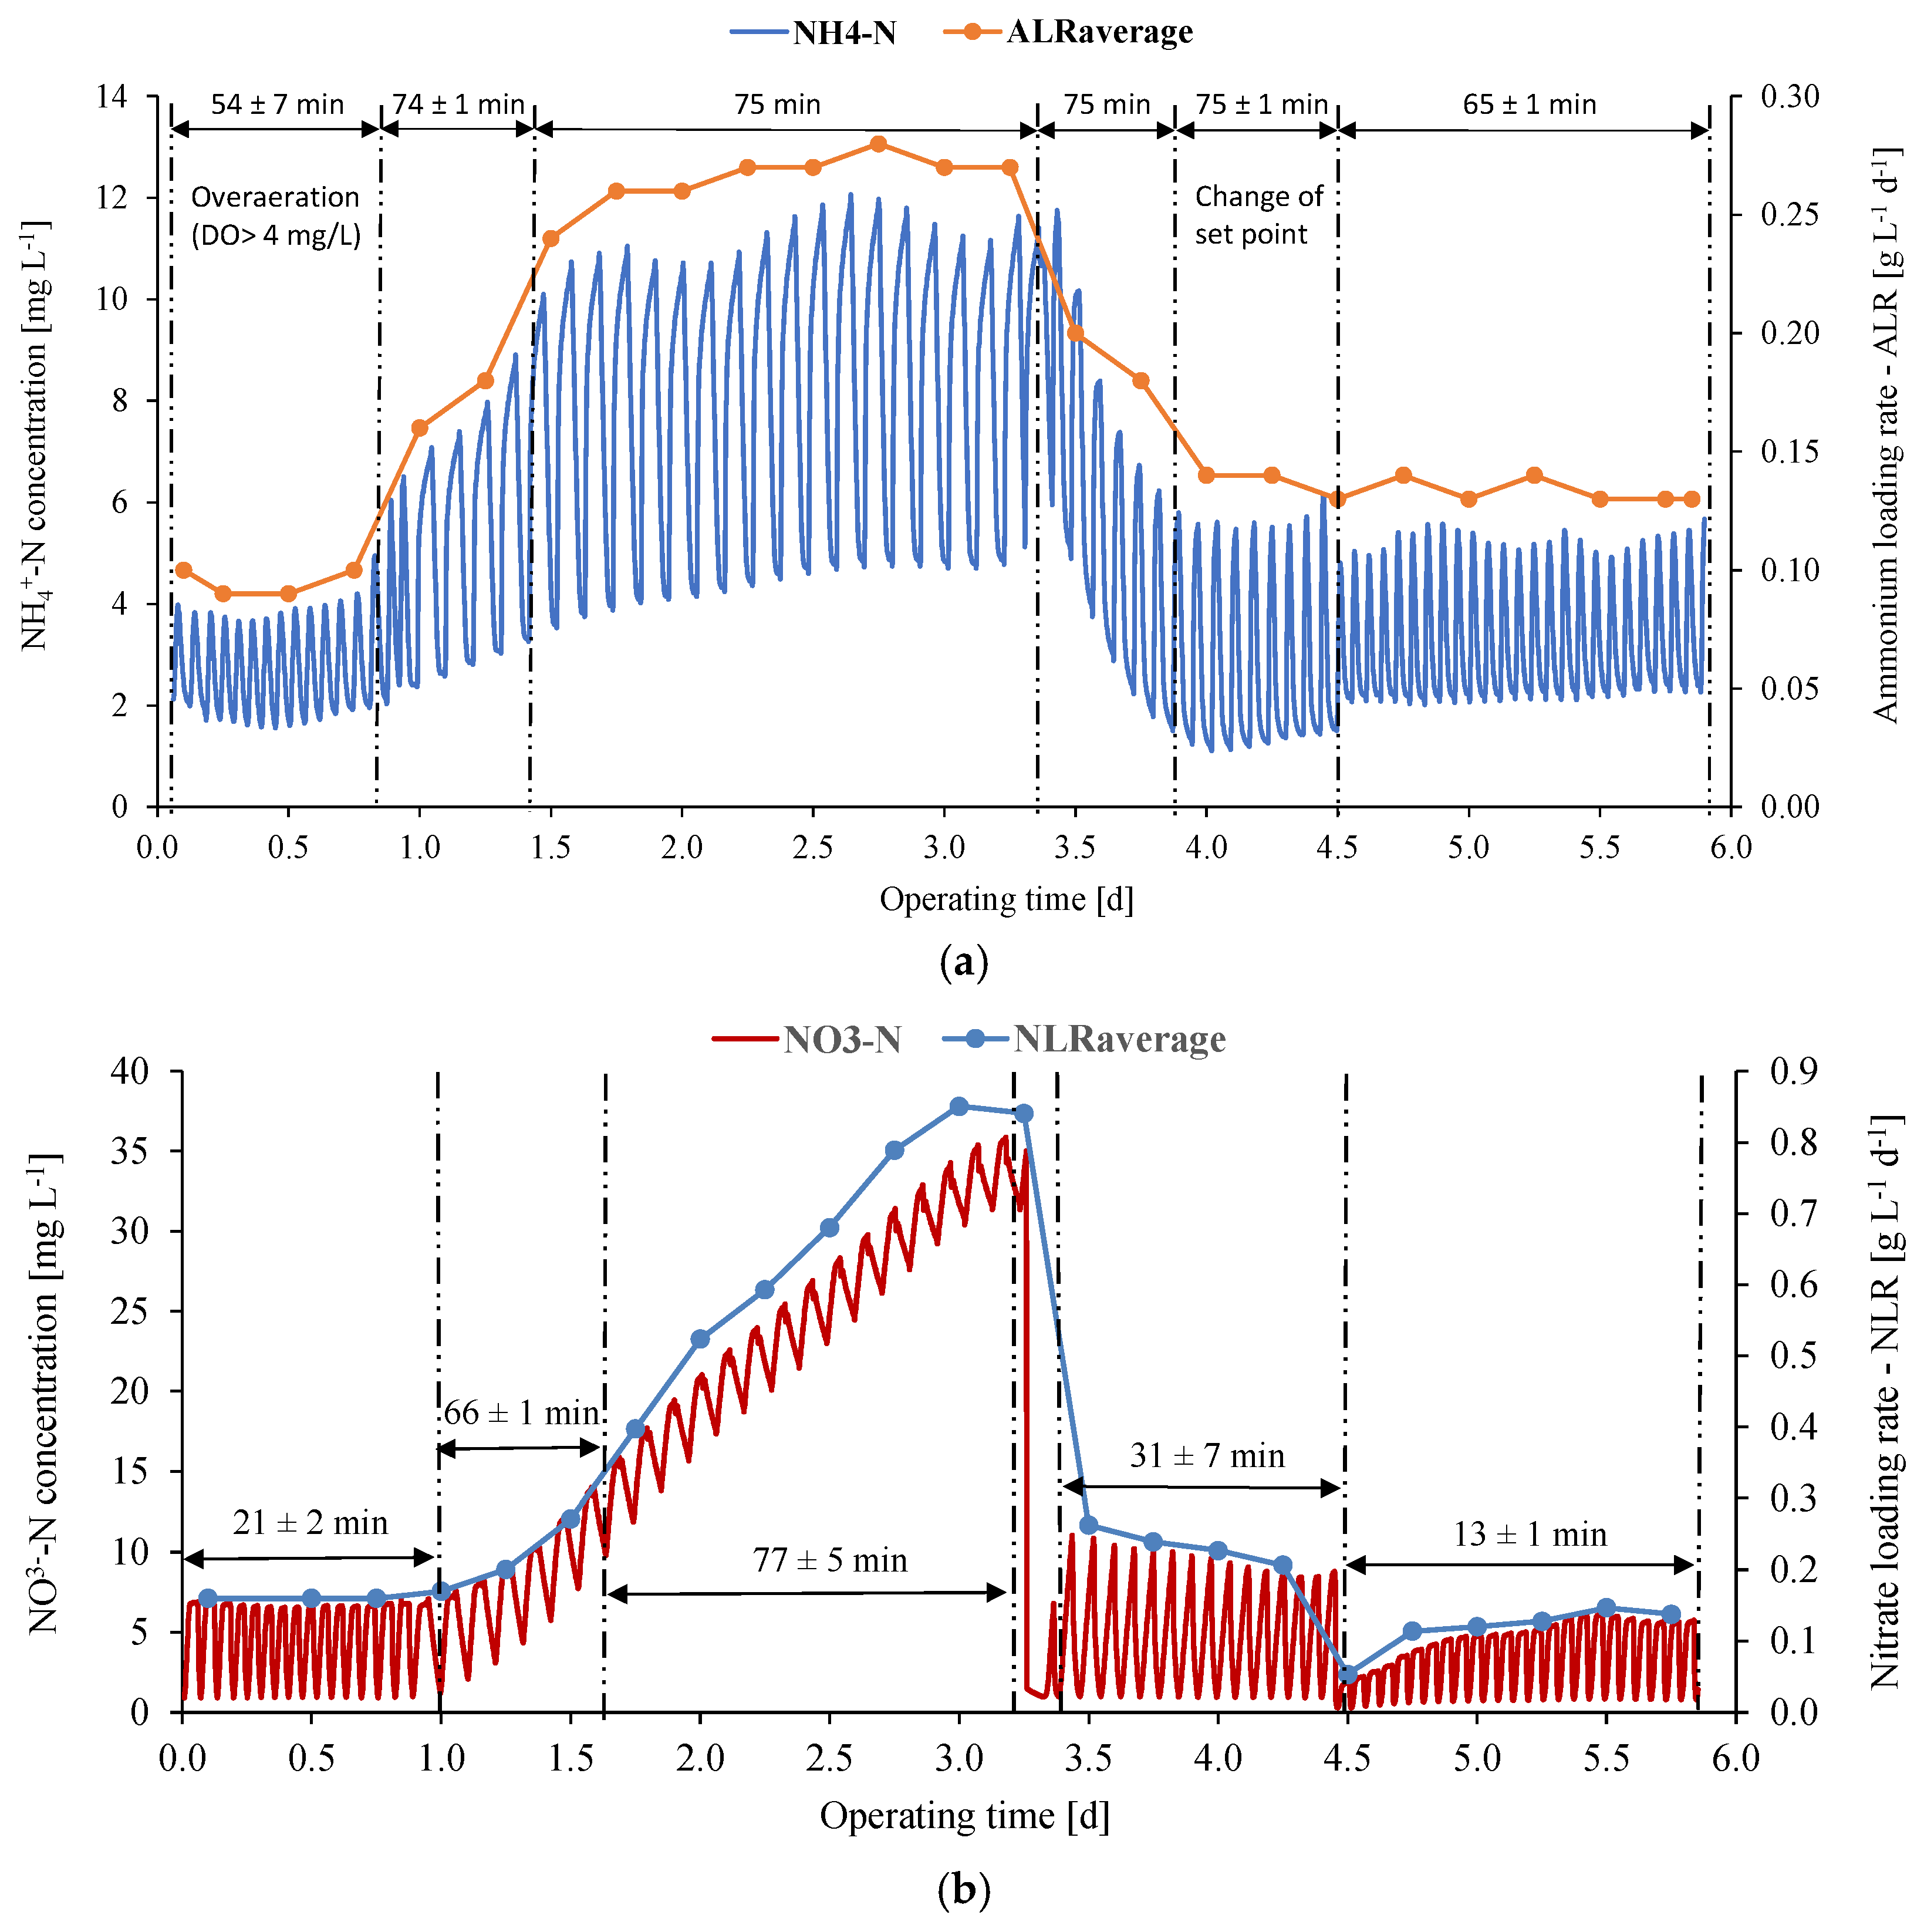
Figure 5.
Ammonium-N and nitrate-N profiles in different events.
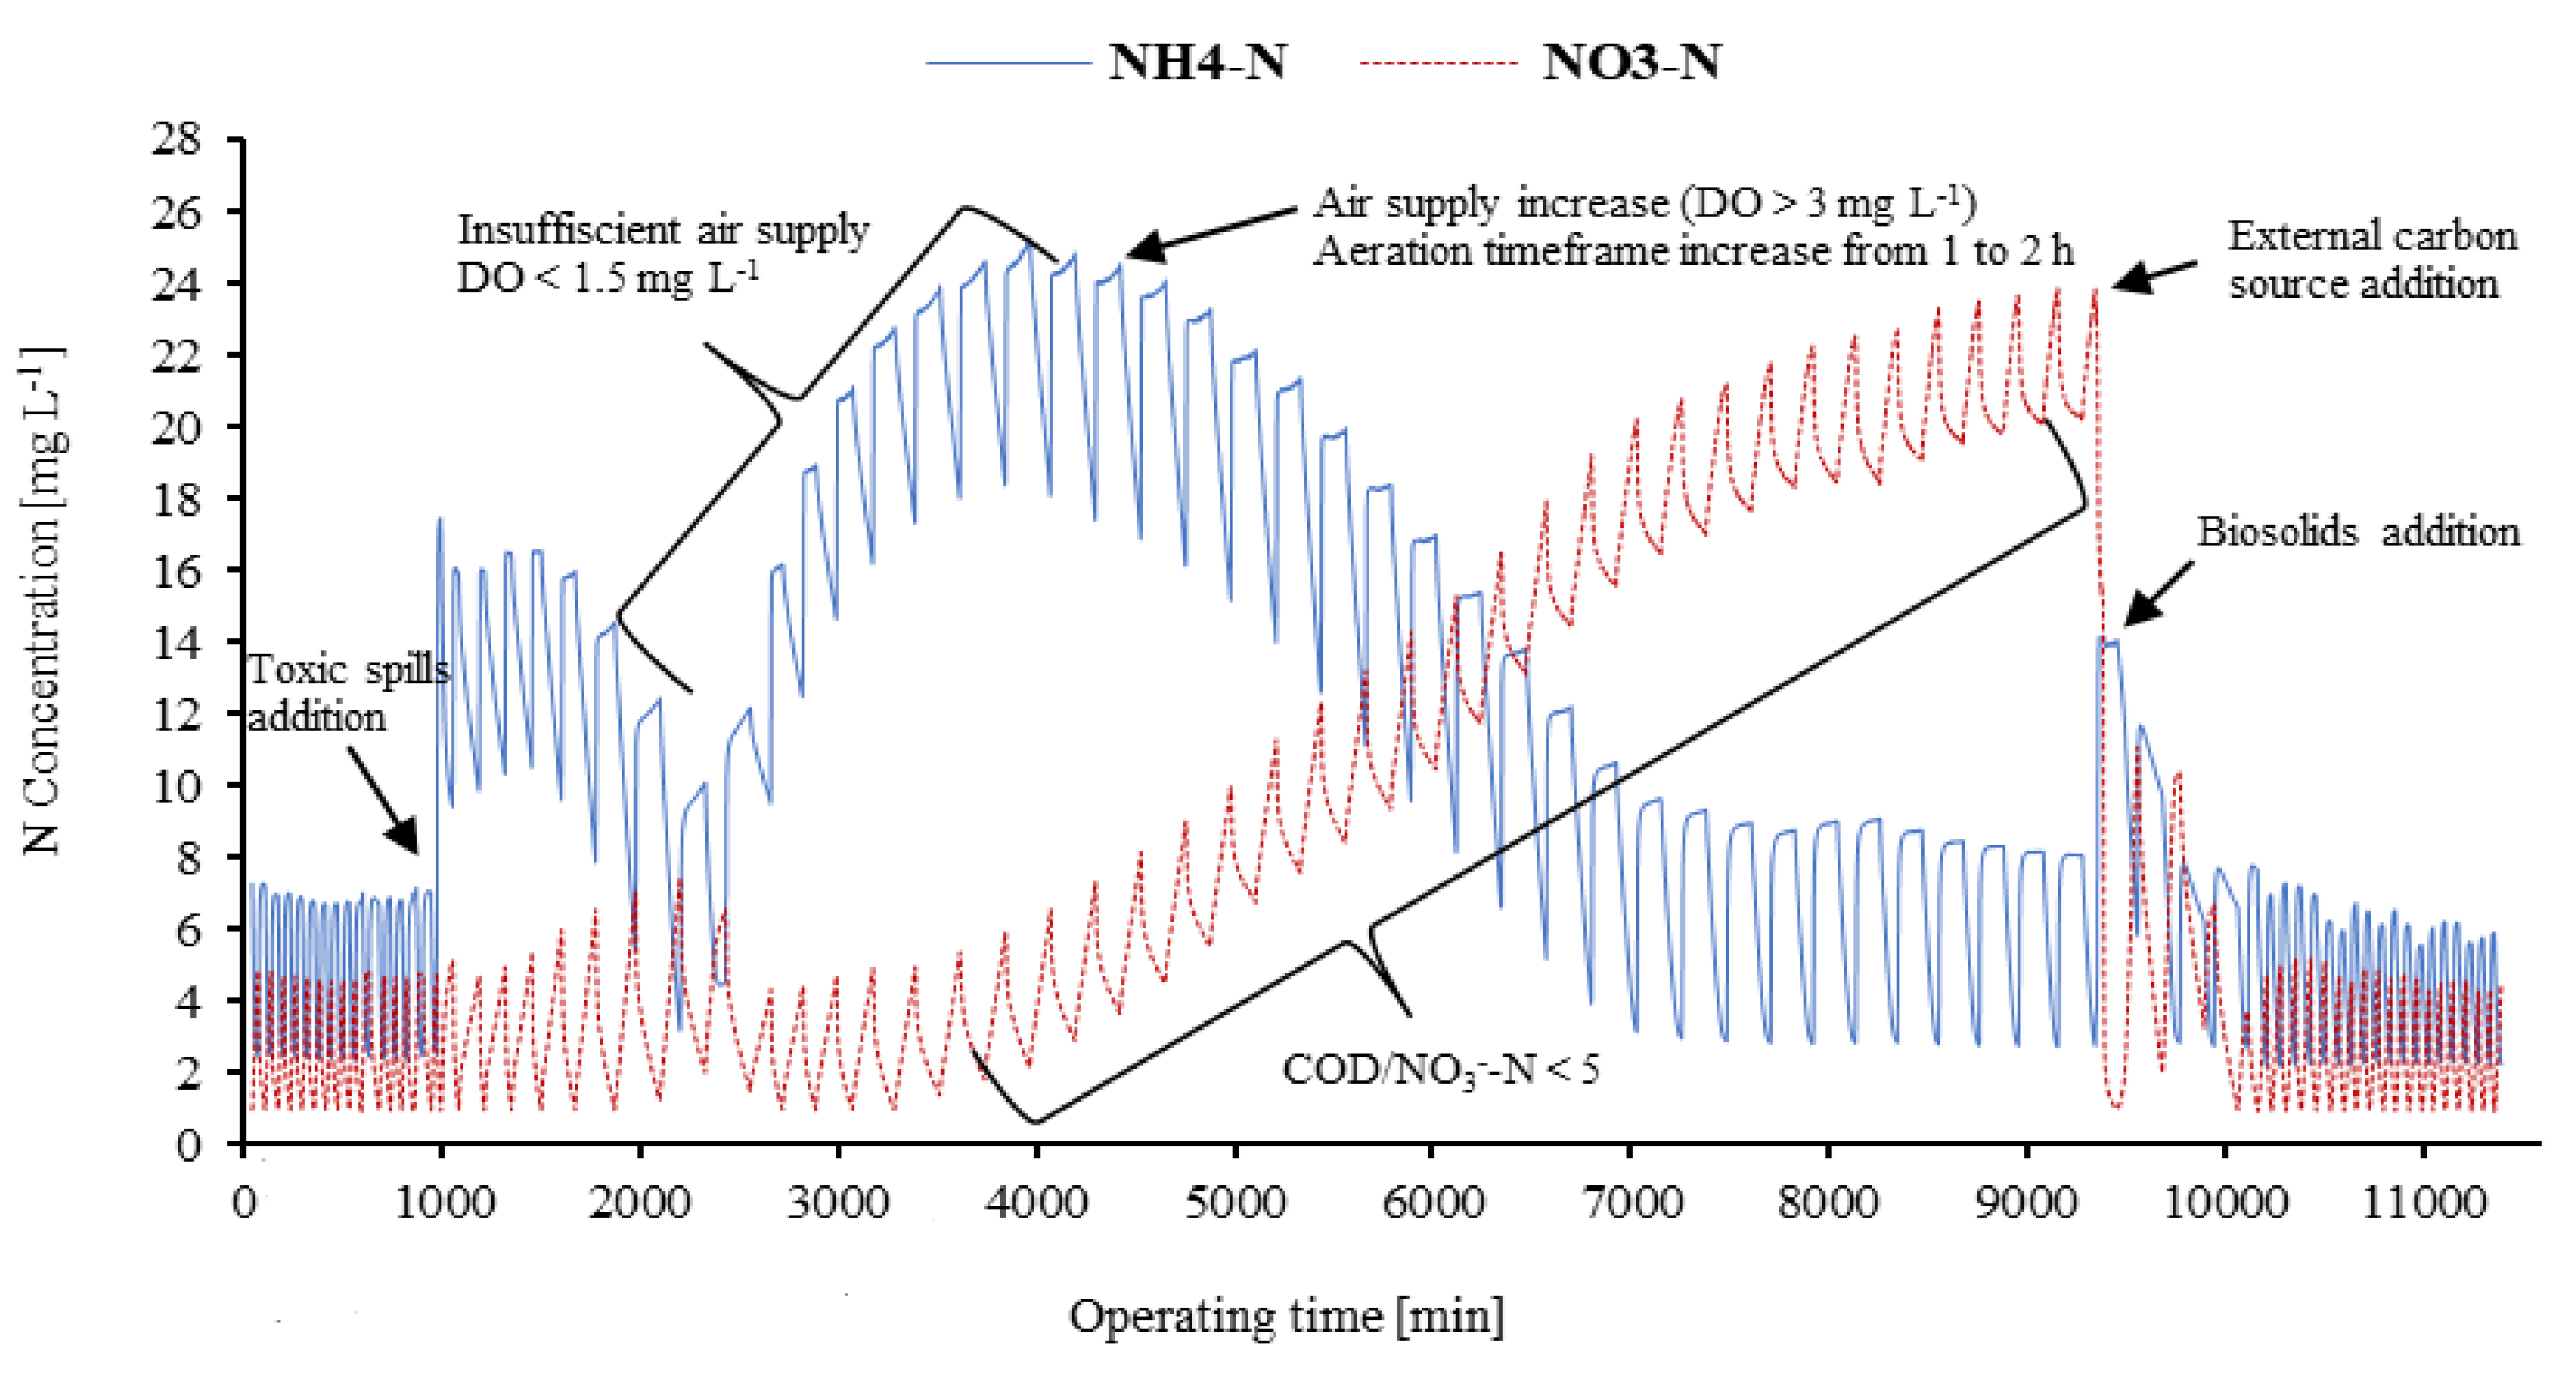
Figure 6.
NH4+-N and NO3--N profiles with respective N-removal and N- reaction time.
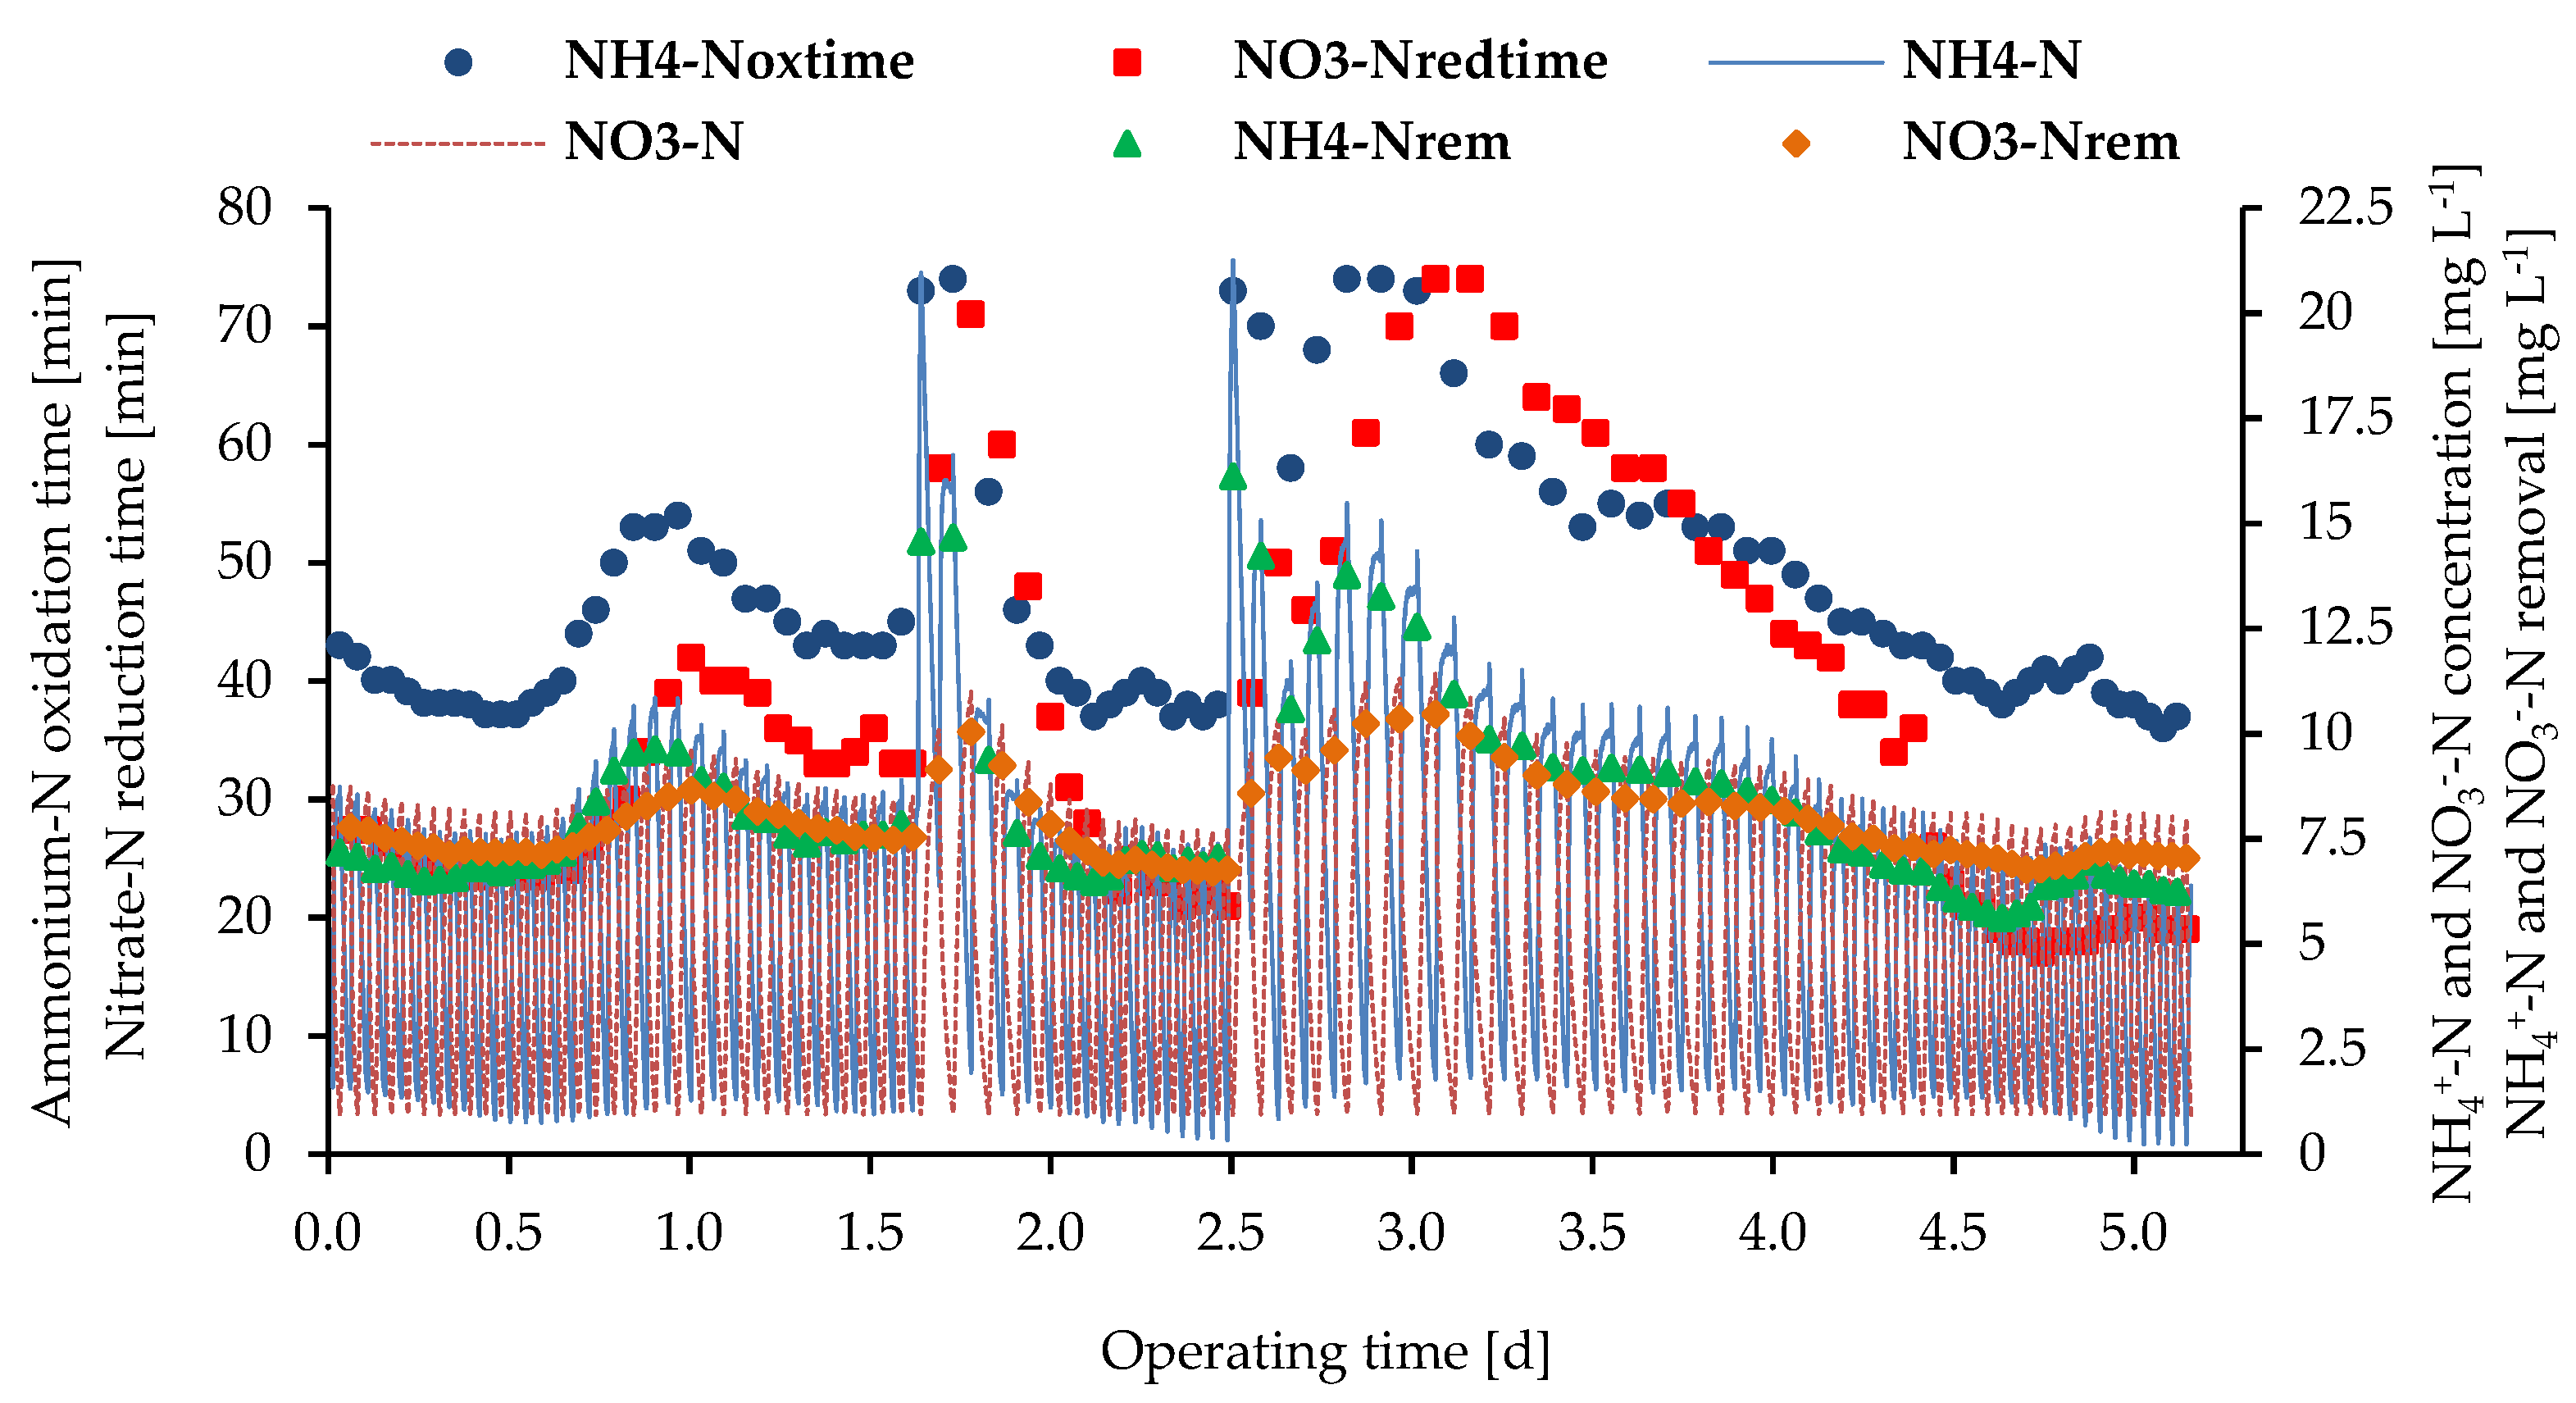
Figure 7.
a. Variation of ammonium-N oxidation time depended on the influent NH4+-N concentration during the whole experimental period. b. Variation of nitrate-N reduction time depended on the formed influent NO3--N concentration during the whole experimental period.
Figure 7.
a. Variation of ammonium-N oxidation time depended on the influent NH4+-N concentration during the whole experimental period. b. Variation of nitrate-N reduction time depended on the formed influent NO3--N concentration during the whole experimental period.
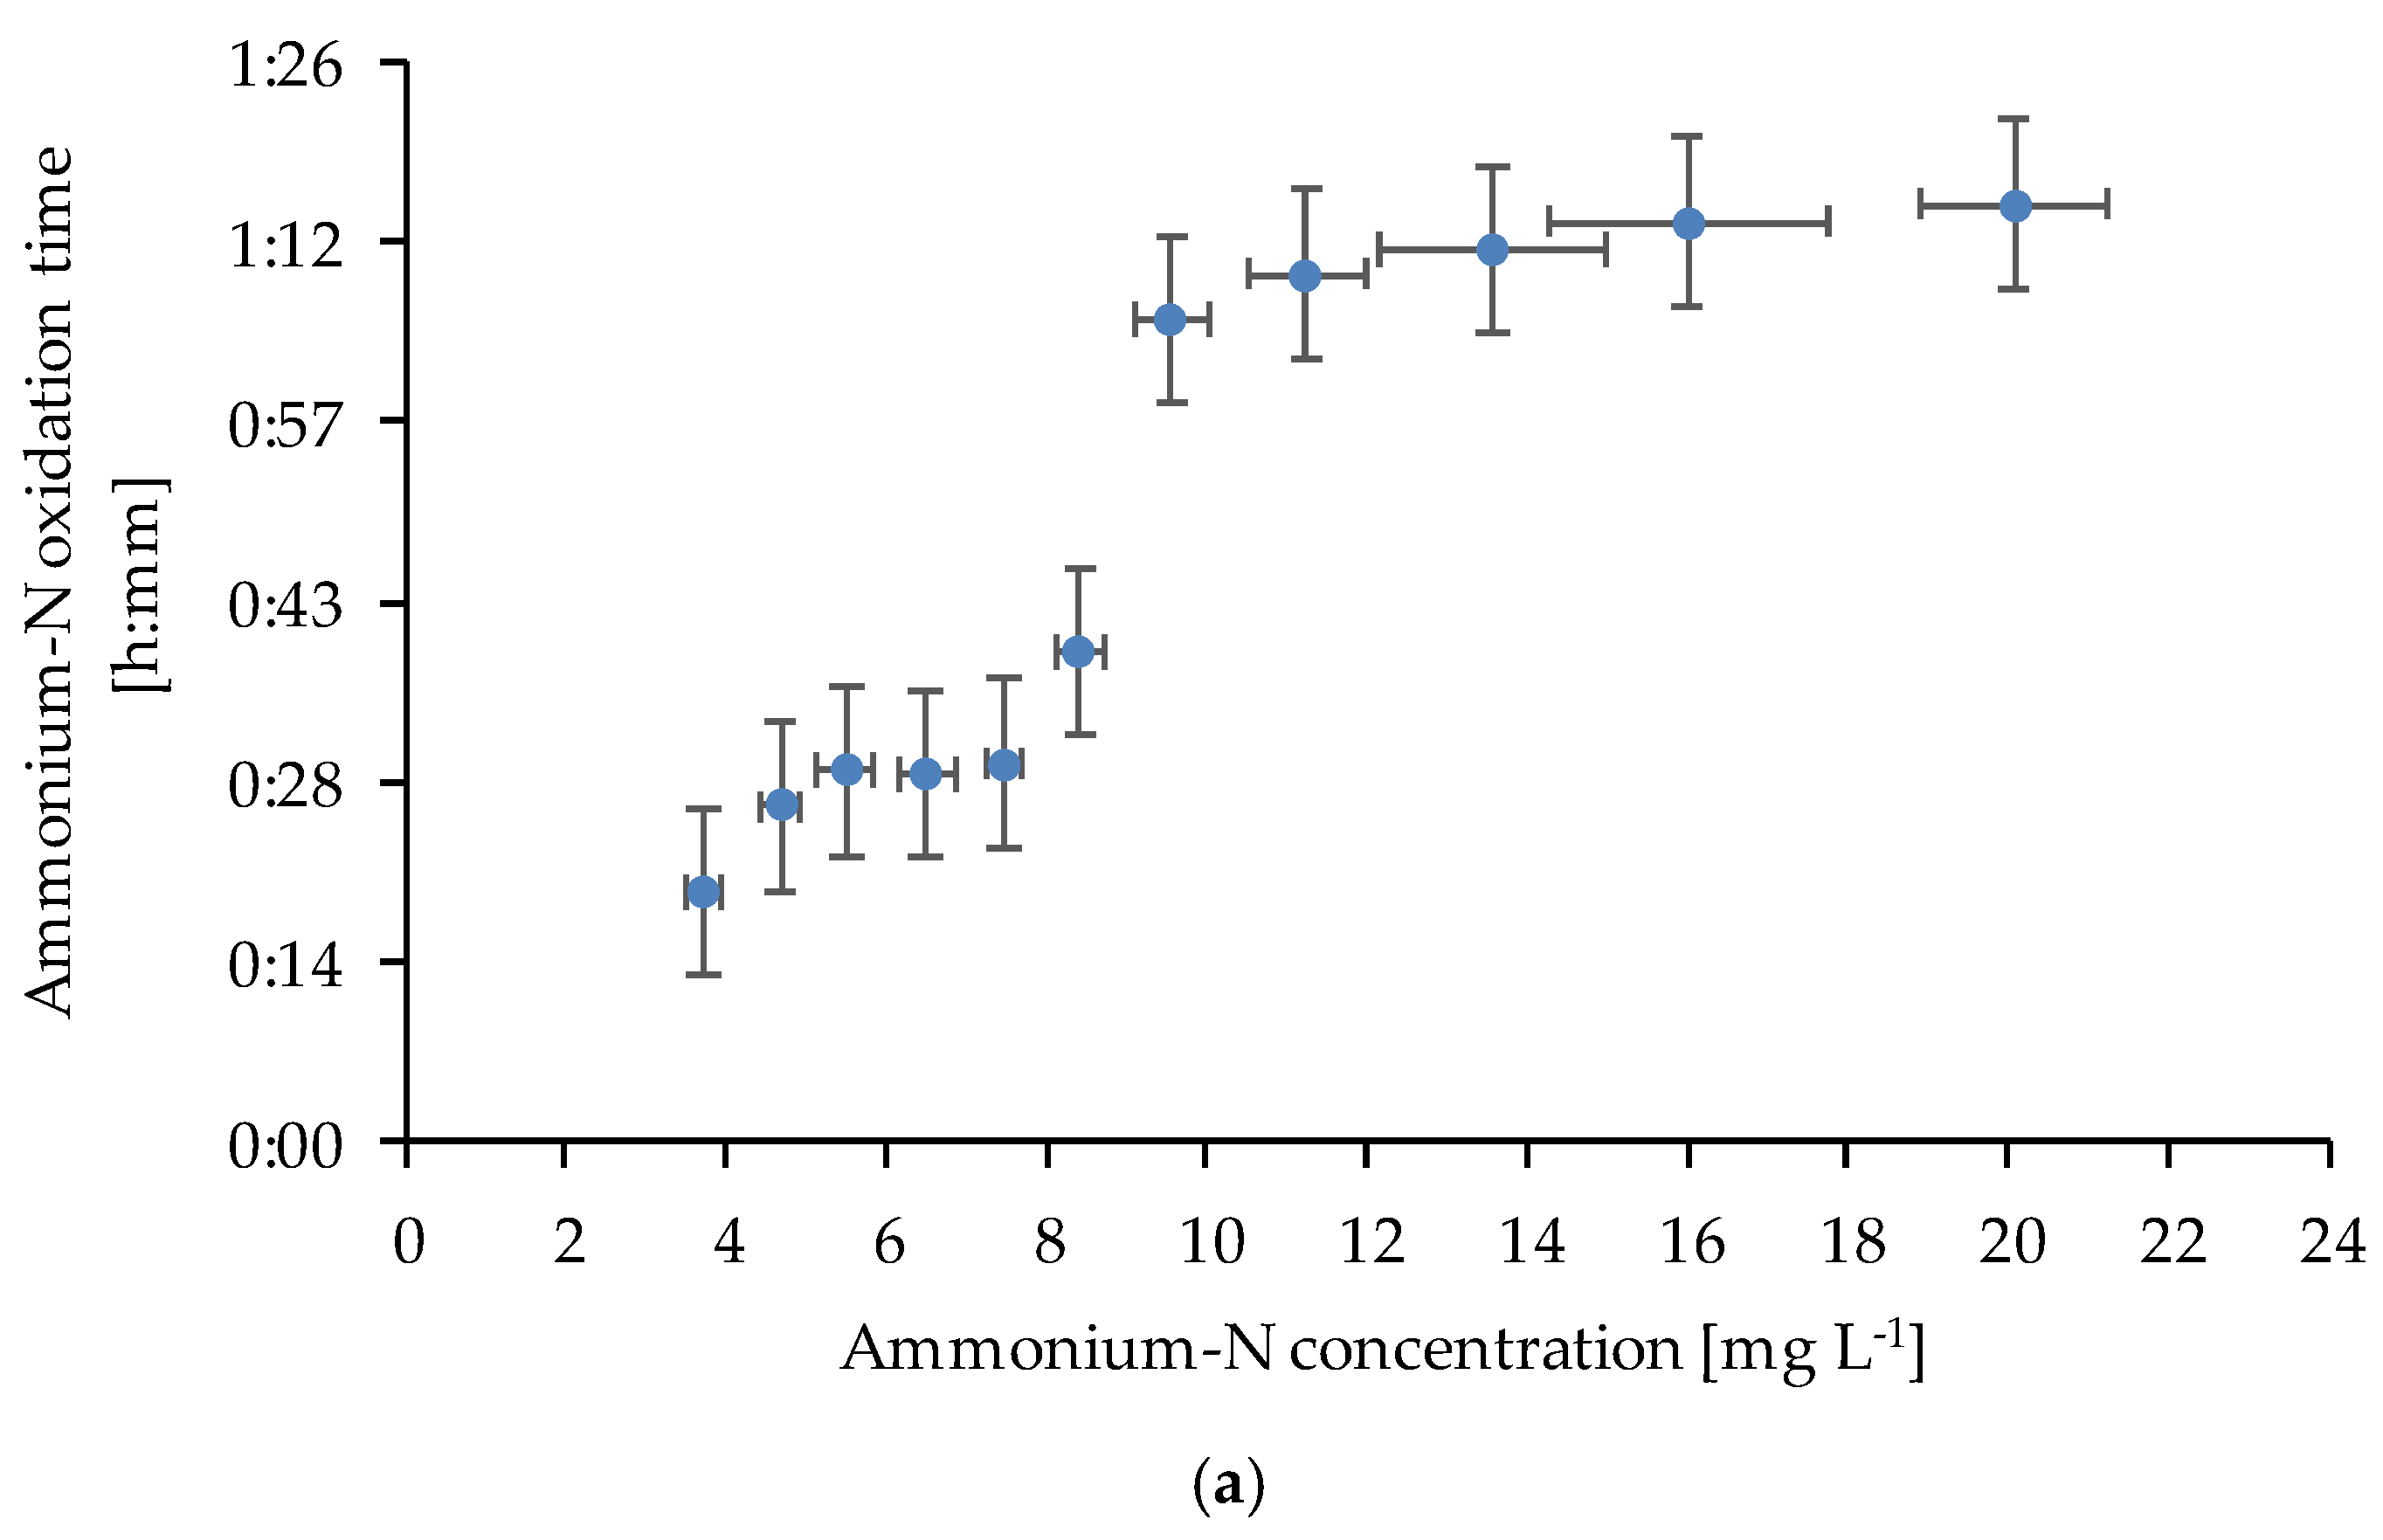
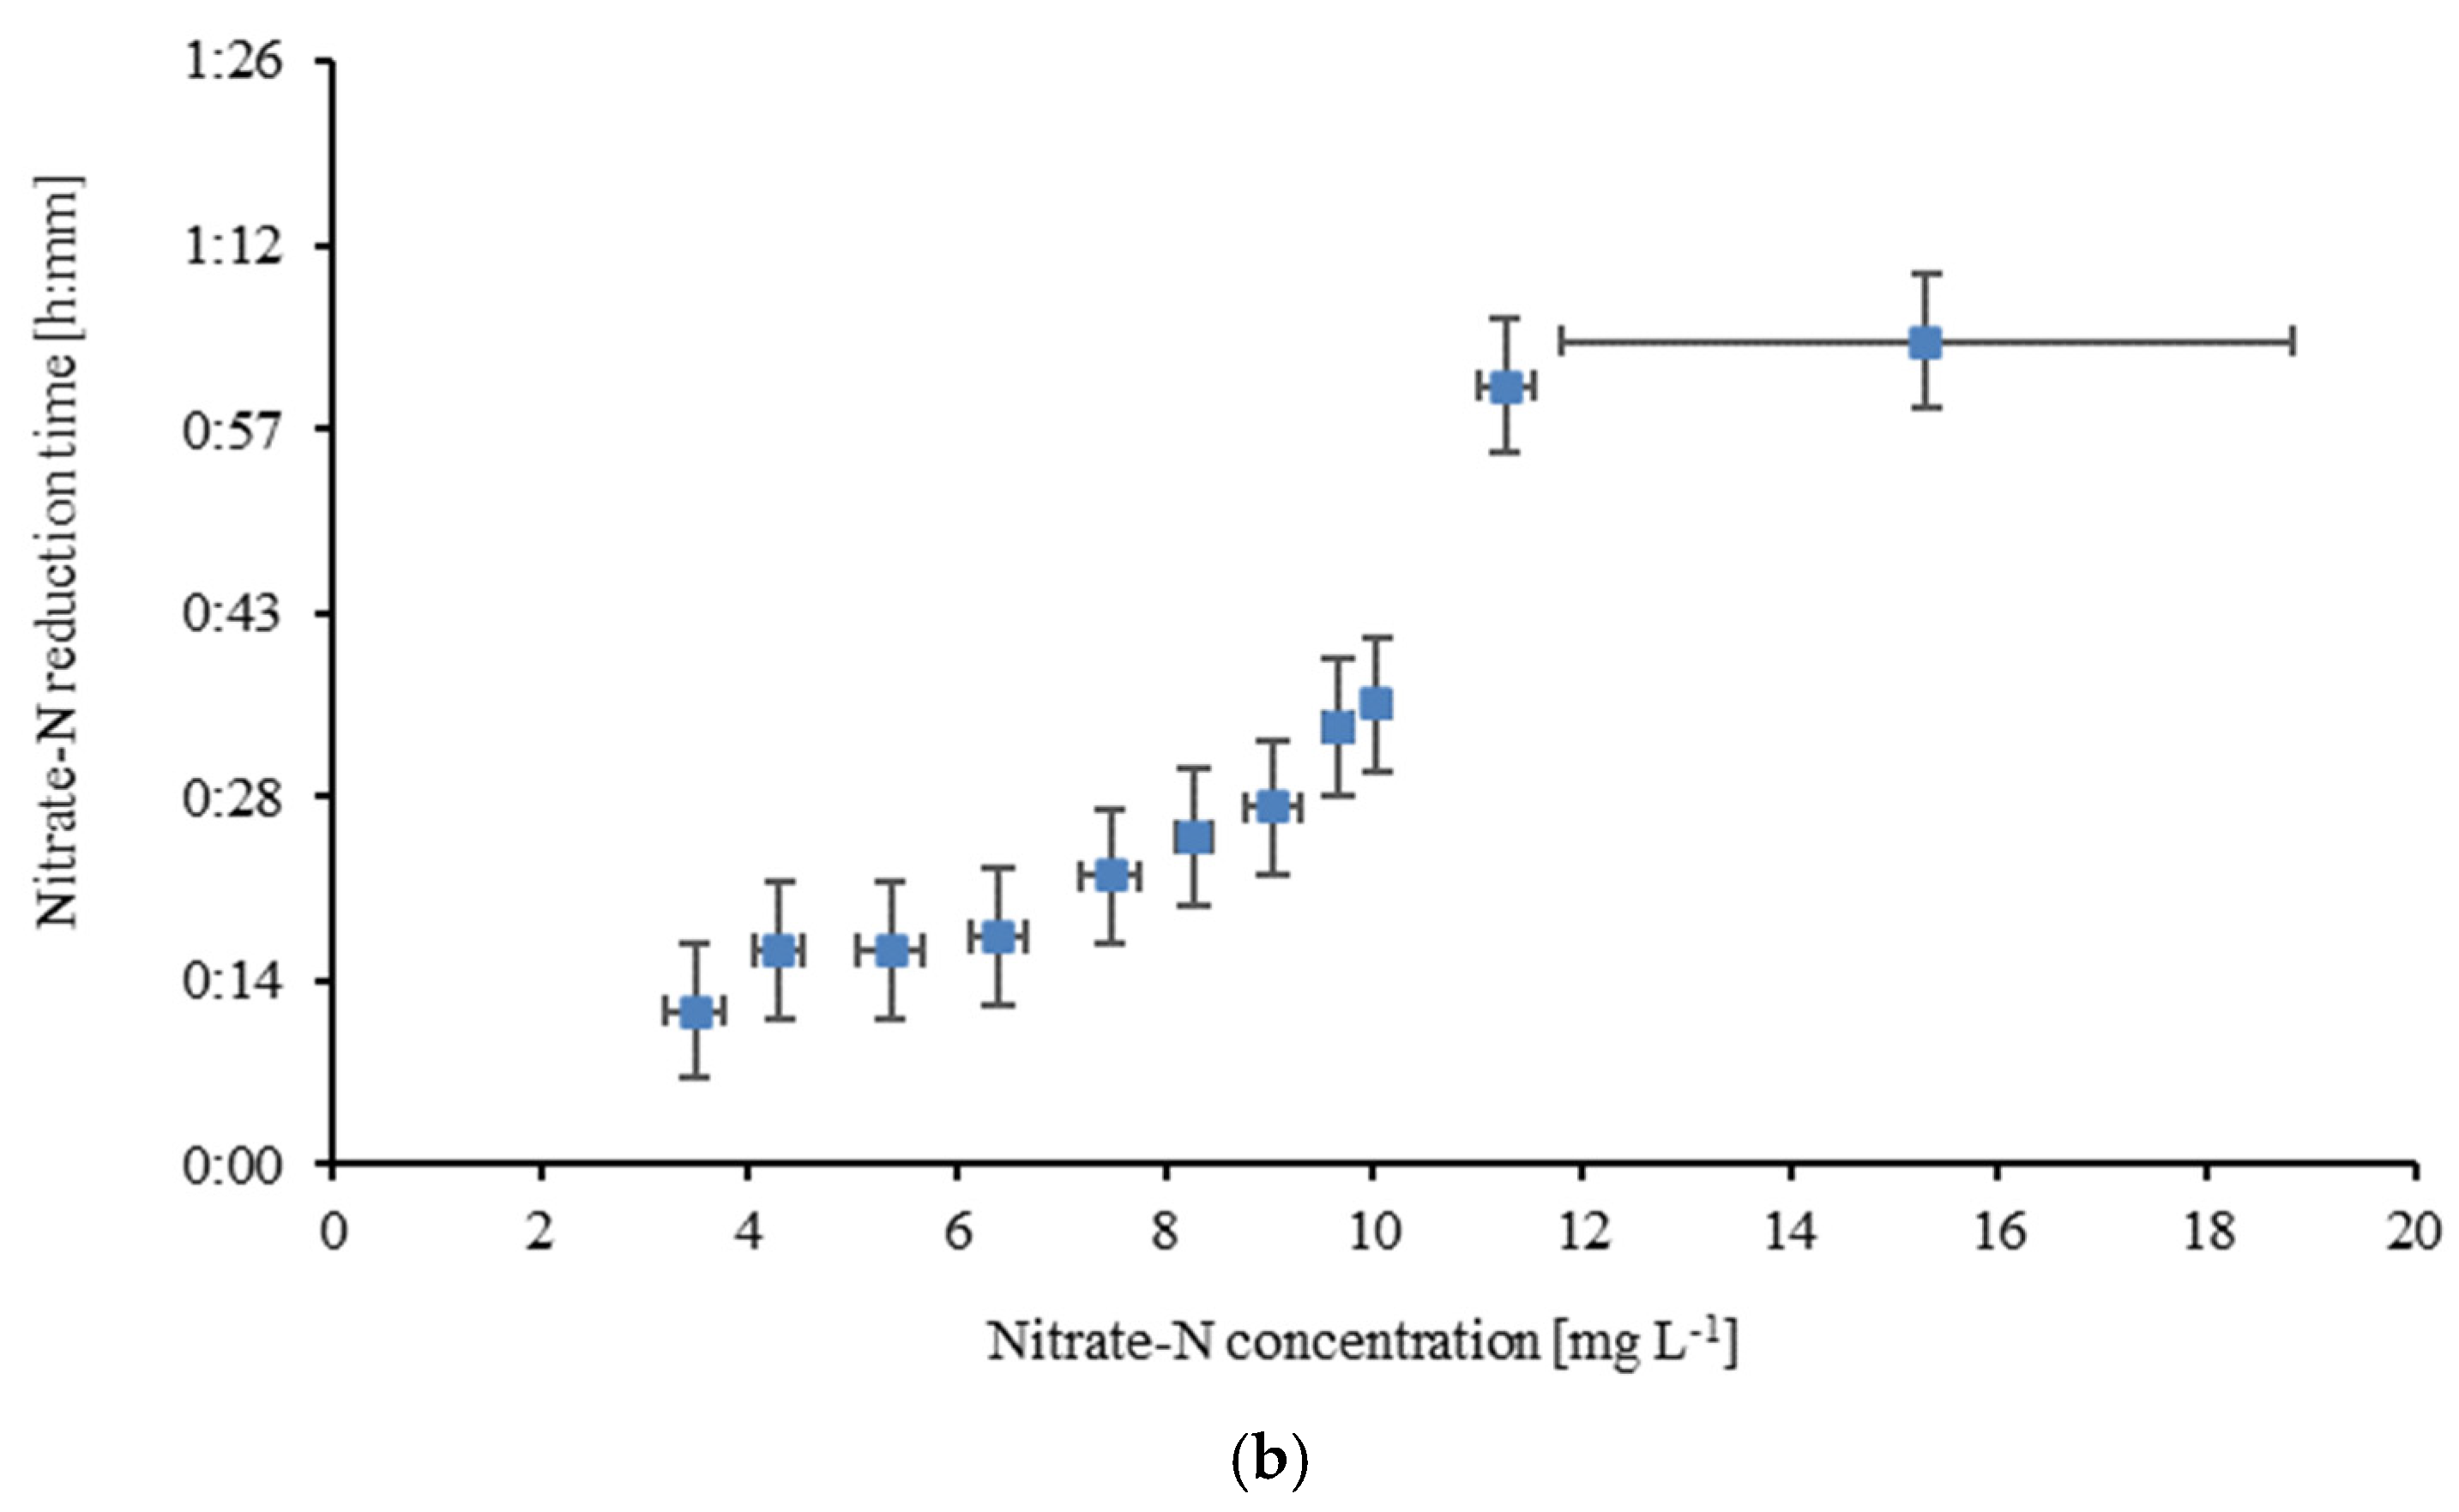

Table 1.
Sewage characteristics.
| Parameters | Average (± St. Deviation) |
|---|---|
| Total COD (mg L-1) | 375 ± 72.7 |
| Soluble COD (mg L-1) | 185 ± 68.9 |
| BOD5 (mg L-1) | 230 ± 33.2 |
| NH4+-N (mg L-1) | 57.3 ± 15.8 |
| TKN (mg L-1) | 73.8 ± 12.9 |
| SS (mg L-1) | 132 ± 39.1 |
| PO43--P (mg L-1) | 5.87 ± 1.4 |
| pH | 7.67 ± 0.19 |
| EC (μS cm-1) | 1318 ± 98.9 |
Table 2.
SNR, SDR and reaction times depending on initial nitrogen concentration.
| NH4+-Nin range (mg L-1) |
NH4+-N oxidation time (min) | SNR (g g -1 VSS d-1) | NO3--Nform range (mg L-1) |
NO3--N reduction time (min) | SDR (g g -1 VSS d-1) |
|---|---|---|---|---|---|
| 3.5-5.0 | 17-29 (25±3) | 0.103-0.119 | 3.0-5.0 | 6-24 (16±5) | 0.372-0.468 |
| 5.1-7.5 | 24-35 (29±2) | 0.092-0.143 | 5.1-7.5 | 9-31 (16±7) | 0.378-0.576 |
| 7.6-9.5 | 31-62 (43±11) | 0.089-0.099 | 7.6-9.0 | 15-33 (26±4) | 0.389-0.677 |
| 9.6-14 | 50-75* (69±7) | 0.09-0.099 | 9.1-10.5 | 31-40 (34±2) | 0.385-0.517 |
| 14.1-21 | 70-75* (73±1) | 0.097-0.14 | 10.6-15 | 37-64 (56±8) | 0.448-0.525 |
*Maximum time limit reached.
Disclaimer/Publisher’s Note: The statements, opinions and data contained in all publications are solely those of the individual author(s) and contributor(s) and not of MDPI and/or the editor(s). MDPI and/or the editor(s) disclaim responsibility for any injury to people or property resulting from any ideas, methods, instructions or products referred to in the content. |
© 2025 by the authors. Licensee MDPI, Basel, Switzerland. This article is an open access article distributed under the terms and conditions of the Creative Commons Attribution (CC BY) license (http://creativecommons.org/licenses/by/4.0/).
Copyright: This open access article is published under a Creative Commons CC BY 4.0 license, which permit the free download, distribution, and reuse, provided that the author and preprint are cited in any reuse.


