
Submitted:
19 August 2025
Posted:
21 August 2025
You are already at the latest version
Abstract
Background Relapsed or refractory Germ cell tumors are commonly treated with HDCT/ASCT, yet robust predictors of hematopoietic recovery are limited. Quantitative CT-based body-composition metrics are readily available in practice, but their prognostic value for post-transplant engraftment remains uncertain. We investigated whether muscle and fat indices derived from routine CT scans are associated with the pace of hematologic recovery after HDCT/ASCT Methods Retrospective single-center cohort (n=43) with relapsed/refractory GCT undergoing HDCT/ASCT. CT within ±6 months of ASCT was analyzed at L3 to derive SMI, PMI, SFA, VFA, TFA, and VFA/SFA. Primary endpoint: engraftment time post-ASCT. Univariable associations used Spearman ρ; multivariable linear regression adjusted for age, Hb, weight, and BSA evaluated independent effects. Significance: p< 0.05 Results Median hematologic engraftment duration was 12.0 days . Engraftment duration correlated positively with age and negatively with hemoglobin. In multivariable analysis, older age and lower hemoglobin independently predicted longer engraftment; body weight and BSA were not significant. Among morphometrics, only VFA/SFA associated with delayed engraftment. SMI, PMI, and TFA were not significant. As expected after HDCT, grade 4 neutropenia and thrombocytopenia occurred in all patients. Conclusions In relapsed/refractory GCT treated with HDCT/ASCT, older age and lower post-transplant hemoglobin independently predict prolonged engraftment. Beyond traditional muscle/fat areas, a higher VFA/SFA ratio—reflecting visceral adiposity—also associates with delayed recovery, suggesting fat distribution may influence hematopoietic regeneration. These variables may support pre-transplant risk stratification and individualized supportive care.
Keywords:
germ cell tumor
; high-dose chemotherapy
; autologous stem cell transplantation
; body composition
; visceral adiposity
; engraftment
1. Introduction
Germ cell tumors (GCTs) are curable even in the setting of relapsed or refractory disease, but treatment still remains challenging [1]. Approximately one-quarter of patients initially treated with cisplatin-based combination regimens will experience disease relapse or exhibit refractoriness, necessitating alternative therapeutic strategies [2]. Despite this, durable remission or even cure can often be achieved through salvage treatments. Current therapeutic options for second-line and beyond include conventional-dose chemotherapy (CDCT) and high-dose chemotherapy (HDCT), with both approaches widely utilized in clinical practice. Existing treatment guidelines indicate no definitive superiority between CDCT and HDCT in terms of efficacy [3]. HDCT, when administered in conjunction with peripheral autologous stem cell transplantation (ASCT), has demonstrated improved recovery outcomes in salvage settings [4]. Nonetheless, the requirement for HDCT to be conducted in high-volume, experienced centers presents a significant limitation to its widespread implementation [5]. Given the rarity of relapsed or refractory GCTs, conducting phase III randomized clinical trials remains a challenge; thus, treatment decisions are frequently guided by retrospective evidence. Notably, most phase III trials evaluating HDCT have not demonstrated a significant survival benefit [4].
Emerging evidence indicates that body composition parameters—specifically skeletal muscle mass and adipose tissue distribution—are associated with treatment-related toxicities and overall mortality in patients with cancer [6].
These parameters are commonly evaluated using diagnostic imaging modalities, including computed tomography (CT), dual-energy X-ray absorptiometry (DEXA), magnetic resonance imaging (MRI), or bioelectrical impedance analysis. Among these, CT imaging has become the predominant modality in oncology-related body composition research, primarily because cancer patients frequently undergo CT scans as part of routine care [7,8,9,10,11]. Most studies utilize axial CT images at the third lumbar vertebra (L3) level due to its consistent visualization of multiple muscle groups and visceral fat compartments, as well as its widespread availability in abdominal imaging. However, alternative anatomical landmarks such as the psoas muscle, temporalis muscle, and thoracic vertebral levels have also been explored in recent literature for body composition analysis [12,13,14,15] . CT-derived body composition analysis provides valuable quantitative metrics, including skeletal muscle area (used to define sarcopenia), intramuscular fat infiltration (indicative of myosteatosis), subcutaneous and visceral adiposity, and fat density. To date, most oncology studies have focused on the clinical relevance of sarcopenia and myosteatosis. For example, a recent study involving 78 lymphoma patients undergoing autologous hematopoietic stem cell transplantation (HSCT) demonstrated that those with sarcopenia exhibited significantly poorer progression-free survival, although adiposity-related parameters were not evaluated in that cohort [16]. Recently, research interest has expanded toward the prognostic value of adipose tissue metrics. Notably, some studies have reported paradoxical findings, such as improved overall survival among patients with hematologic malignancies who exhibit higher levels of visceral adiposity [17,18].
In adults with lymphoma undergoing autologous peripheral blood stem cell transplantation (aPBSCT), sarcopenic obesity—defined by the coexistence of low muscle mass and elevated body mass index (BMI >25 kg/m²)—has been associated with an increased incidence of early post-transplant complications, including prolonged hospitalization, intensive care unit (ICU) admission, and 30-day unplanned readmissions. Similarly, in multiple myeloma patients undergoing aPBSCT, reduced pretransplant high-density muscle mass (≤80%) was linked to a higher risk of cardiovascular toxicity within the first 100 days post-transplant [19,20]. These findings collectively underscore the prognostic significance of comprehensive body composition profiling in patients receiving high-dose chemotherapy followed by autologous stem cell transplantation.
Achieving a successful aPBSCT requires both effective eradication of the underlying malignancy and complete bone marrow engraftment. Timely hematologic recovery is particularly crucial, as delayed engraftment may lead to increased early transplant-related complications and higher healthcare costs. In this context, identifying clinical or morphological factors that influence engraftment kinetics—such as body composition and laboratory parameters—may provide valuable insights for optimizing outcomes in patients undergoing HDCT/ASCT [21].
In addition to body composition metrics, we aimed to investigate the potential impact of other factors—such as pretransplant blood parameters (e.g., hemoglobin level) and patient age—on the kinetics of hematologic recovery following autologous transplantation
2. Materials and Methods
This retrospective study included 43 patients diagnosed with relapsed or refractory germ cell tumors who underwent HDCT followed by ASCT at our institution. Demographic data, disease characteristics, treatment history, and clinical outcomes were extracted from electronic medical records.
CT-Based Body Composition Analysis and Image Processing Protocol
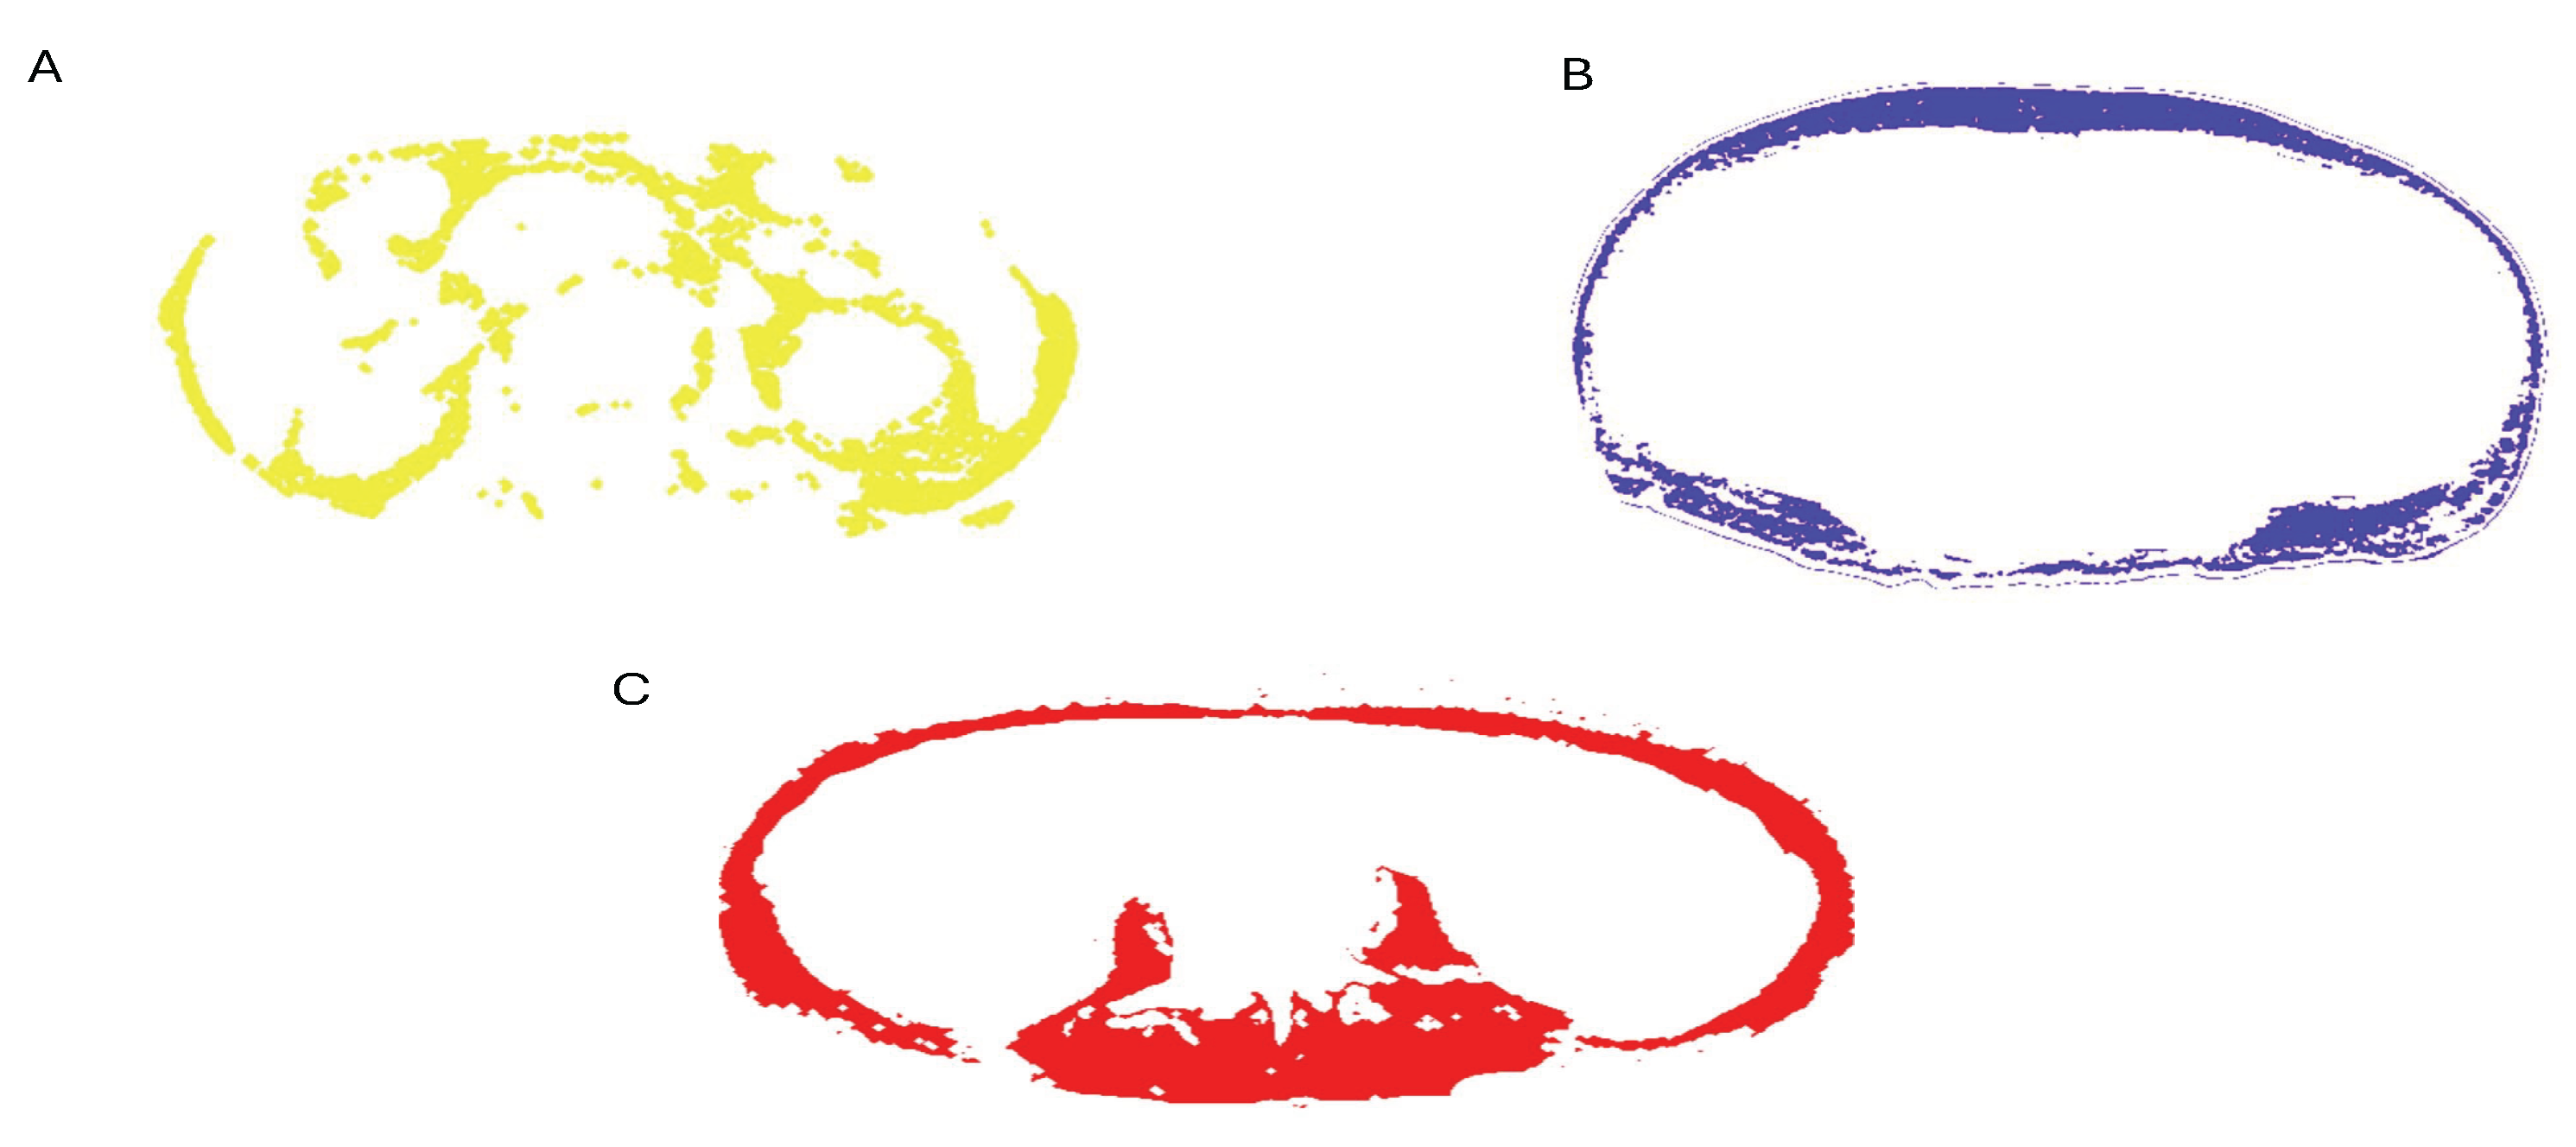
Body composition analysis was conducted using non-contrast abdominopelvic computed tomography (CT) scans obtained from two different multi-detector CT systems: Toshiba Aquilion One 320 and Toshiba Aquilion 64 (Otawara, Japan). Scans were acquired with standardized technical parameters, including a tube voltage of 100–140 kVp, tube current of 200–500 mA, rotation time of 0.4 seconds, and a field of view (FOV) of 400 mm. The CT images were retrieved in Digital Imaging and Communications in Medicine (DICOM) format via the institutional Picture Archiving and Communication System (PACS). Quantitative analysis of muscle and adipose tissue areas was performed by an experienced radiologist using the CS 1.0 software package. Measurements were obtained at the level of the third lumbar vertebra (L3), which was anatomically verified using coronal and sagittal multiplanar reformatted (MPR) images. A predefined attenuation range of –30 to +130 Hounsfield Units (HU) was applied to segment skeletal muscle tissue. The anterior abdominal wall muscles and bilateral psoas muscles were manually outlined using the software’s cursor tool. Following initial segmentation, the software automatically calculated tissue areas. Any discrepancies were corrected manually using a brush tool to ensure precision (Figure 1).
Figure 1.
SFA mask (blue): subcutaneous adipose tissue external to the abdominal wall (A). VFA mask (yellow): intra-abdominal/visceral adipose tissue enclosed by the abdominal wall (B). TAMA mask (red): total abdominal skeletal muscle, including psoas, paraspinal, and abdominal wall muscles (C).
Figure 1.
SFA mask (blue): subcutaneous adipose tissue external to the abdominal wall (A). VFA mask (yellow): intra-abdominal/visceral adipose tissue enclosed by the abdominal wall (B). TAMA mask (red): total abdominal skeletal muscle, including psoas, paraspinal, and abdominal wall muscles (C).
Assessment of Body Composition Parameters and Index Calculations
Body composition parameters—including subcutaneous fat area (SFA), visceral fat area (VFA), total muscle area (TAMA), and left and right psoas muscle areas—were evaluated using CT images obtained within 6 months before or after the HDCT/ASCT procedure. The images were acquired either from standard abdominal CT scans or from the CT component of PET-CT examinations conducted within this period. Notably, TAMA also refers to skeletal muscle area, as it represents the total cross-sectional area of muscles at the level of the third lumbar vertebra (L3) Skeletal muscle measurements were obtained at the level of L3 using standardized imaging analysis techniques.
The Skeletal Muscle Index (SMI) was calculated by dividing the cross-sectional area of skeletal muscle at the L3 level by the square of the patient's height (cm²/m²):
SMI = [skeletal muscle area at L3] / height²
The Psoas Muscle Index (PMI) was calculated similarly by dividing the sum of the bilateral psoas muscle areas at the L3 level by the square of the patient’s height (cm²/m²):
PMI = [sum of bilateral psoas muscle areas at L3] / height²
The Total Fat Area (TFA) was defined as the sum of the visceral and subcutaneous fat areas (TFA = VFA + SFA). In addition, the VFA/SFA ratio was calculated to evaluate the distribution pattern of abdominal fat. Body surface area (BSA) was computed using height and weight data recorded prior to HDCT.
Post-HDCT Laboratory Assessment and Engraftment Criteria
Laboratory data were obtained during the post-HDCT period. Specifically, the analysis used the lowest recorded values of hemoglobin, platelet count, neutrophil count, sodium, calcium, and albumin, and the highest recorded values of creatinine, alanine aminotransferase (ALT) and aspartate aminotransferase (AST) during the transplant-related follow-up. These values were selected to reflect the peak hematologic and metabolic disturbances experienced during the engraftment phase.
Platelet engraftment was defined as achieving a platelet count exceeding 20,000/mm³ for three consecutive days, and neutrophil engraftment was defined as an absolute neutrophil count of ≥2000/mm³. Reaching either of these thresholds was considered indicative of successful engraftment. Platelet and erythrocyte transfusions were administered as needed to maintain platelet counts above 10,000/mm3 and hemoglobin levels above 8 g/dL, respectively.
Statistical Analysis
Statistical analysis was performed using IBM SPSS Statistics (Version 27). Spearman’s rank correlation coefficient was used to assess associations between variables, as the data did not follow a normal distribution, included ordinal or non-parametric measurements, and the sample size was relatively small.Multiple linear regression analysis was conducted to identify independent predictors of engraftment duration. A p-value < 0.05 was considered statistically significant.
3. Results
Patients Characteristics
A total of 43 patients with primary gonadal germ cell tumors who underwent HDCT/ASCT were included in this study. The median age of the study was 29 years. The majority of patients (93.0%) had non-seminomatous histology, with mixed germ cell tumors being the most common subtype (74.4%). Pure seminoma was observed in 7.0% of cases. At initial diagnosis, the distribution of disease stage was balanced, with 48.8% of patients presenting with stage <3 and 51.2% with stage ≥3 disease. According to the IGCCCG risk classification, 58.1% of patients were categorized as poor risk, while 27.9% and 14.0% were classified as good and intermediate risk, respectively.Metastatic involvement at the time of diagnosis included the lungs in 60.5% of patients, liver in 20.9%, bone in 16.3%, and brain in 7.0%. Lymph node involvement was nearly universal, affecting 97.7% of the cohort. Regarding response to therapy prior to HDCT/ASCT, 55.8% of patients achieved complete response (CR) or partial response with negative tumor markers, while 41.9% showed partial response (PR) with positive markers or stable disease (SD). Only one patient (2.3%) demonstrated progressive disease (PD). HDCT/ASCT was administered as consolidation after two lines of chemotherapy in 79.1% of patients and after three lines in 20.9%. The most commonly used HDCT regimen was CE (carboplatin and etoposide), received by 93.0% of patients; ICE (Ifosfamide + Carboplatin + Etoposide)was used in the remaining 7.0%.Following HDCT/ASCT, 65.1% of patients achieved CR or marker-negative PR. However, 20.9% experienced stable disease or marker-positive PR, and 14.0% had progressive disease, indicating a subset of patients with treatment-resistant disease despite intensive therapy (Table 1).
In the present study, the median hematologic engraftment duration was 12.0 days. The mean duration was 13.67 ± 3.60 days, with a range of 9 to 25 days. The 25th and 75th percentiles were 11.0 and 16.0 days, respectively.
Correlations Between Engraftment Duration and Pre-Transplant Morphological Parameters
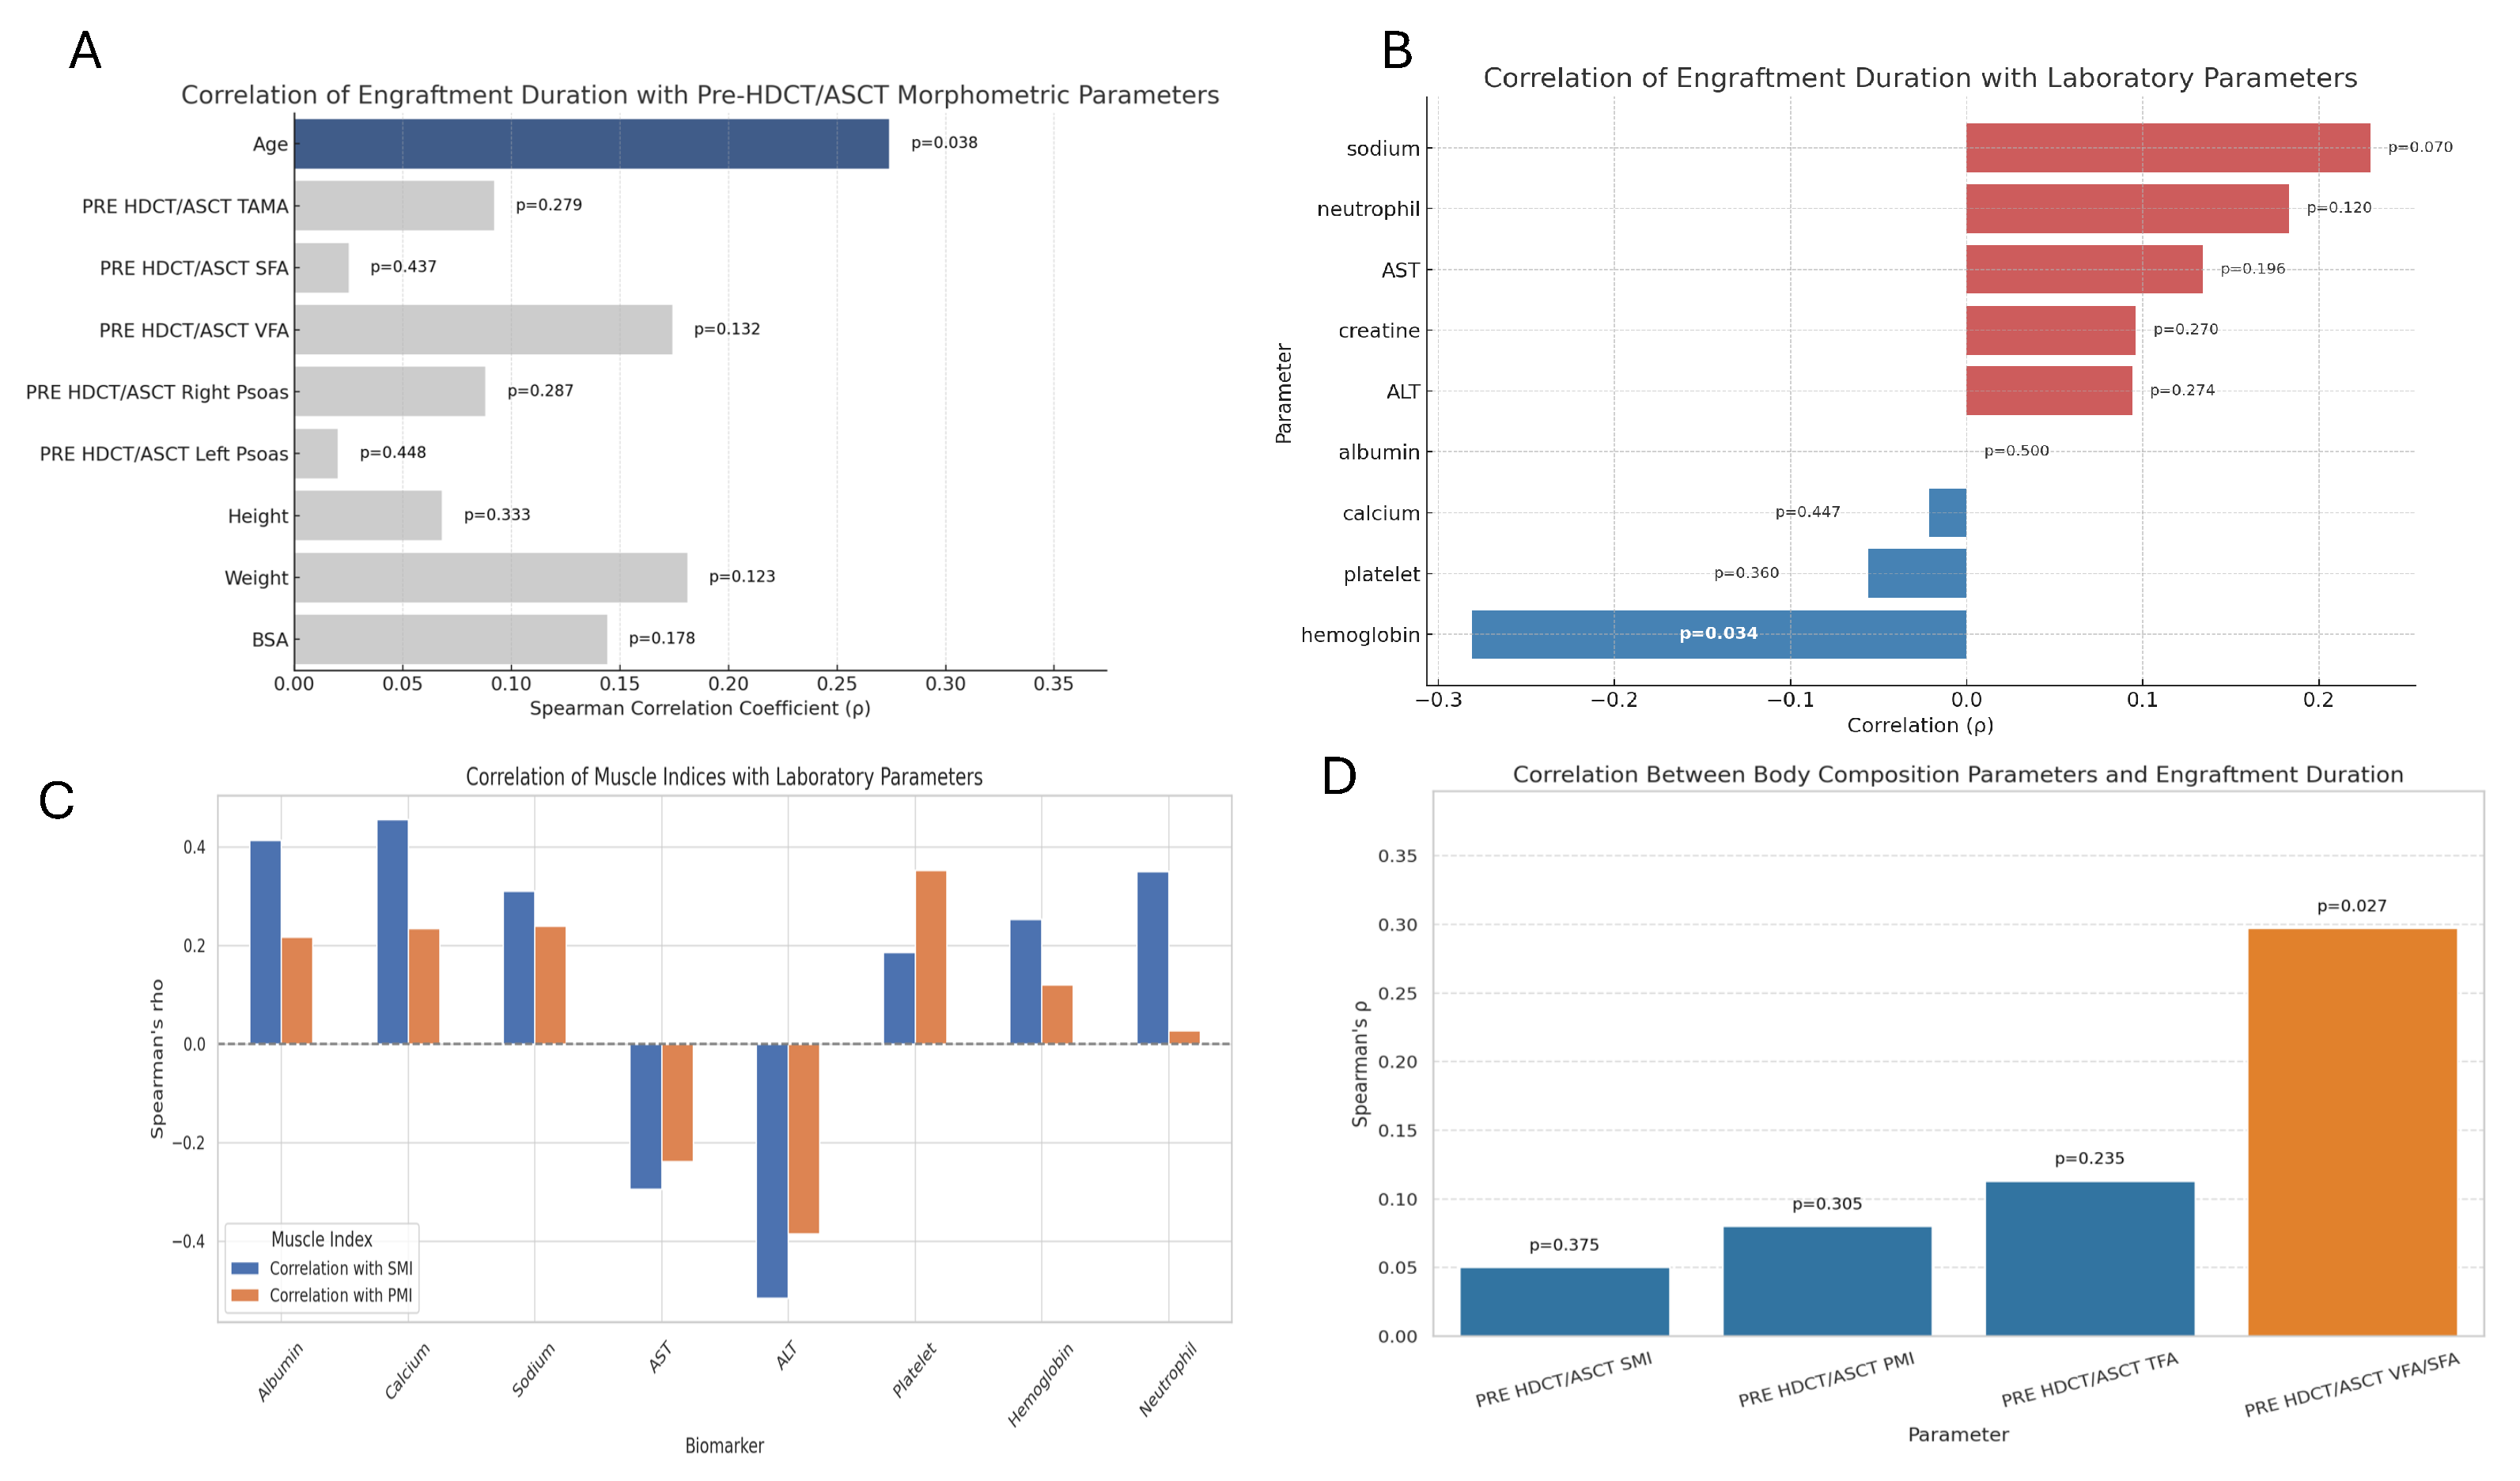
Spearman’s rank correlation analysis was performed to examine the association between engraftment duration and pre-HDCT/ASCT anthropometric and body composition metrics. A statistically significant positive correlation was observed between engraftment duration and age (ρ = 0.274, p = 0.038). No statistically significant associations were identified between engraftment duration and pre-transplant area TAMA, SFA, VFA, or psoas muscle measurements. However, weak positive but non-significant correlations were observed with body weight (ρ = 0.181, p = 0.123) and body surface area (BSA) (ρ = 0.144, p = 0.178) (Figure 2A and Figure 3A).
Figure 2.
Relationship Between Engraftment Duration and (A) Age and (B) Hemoglobin Levels.
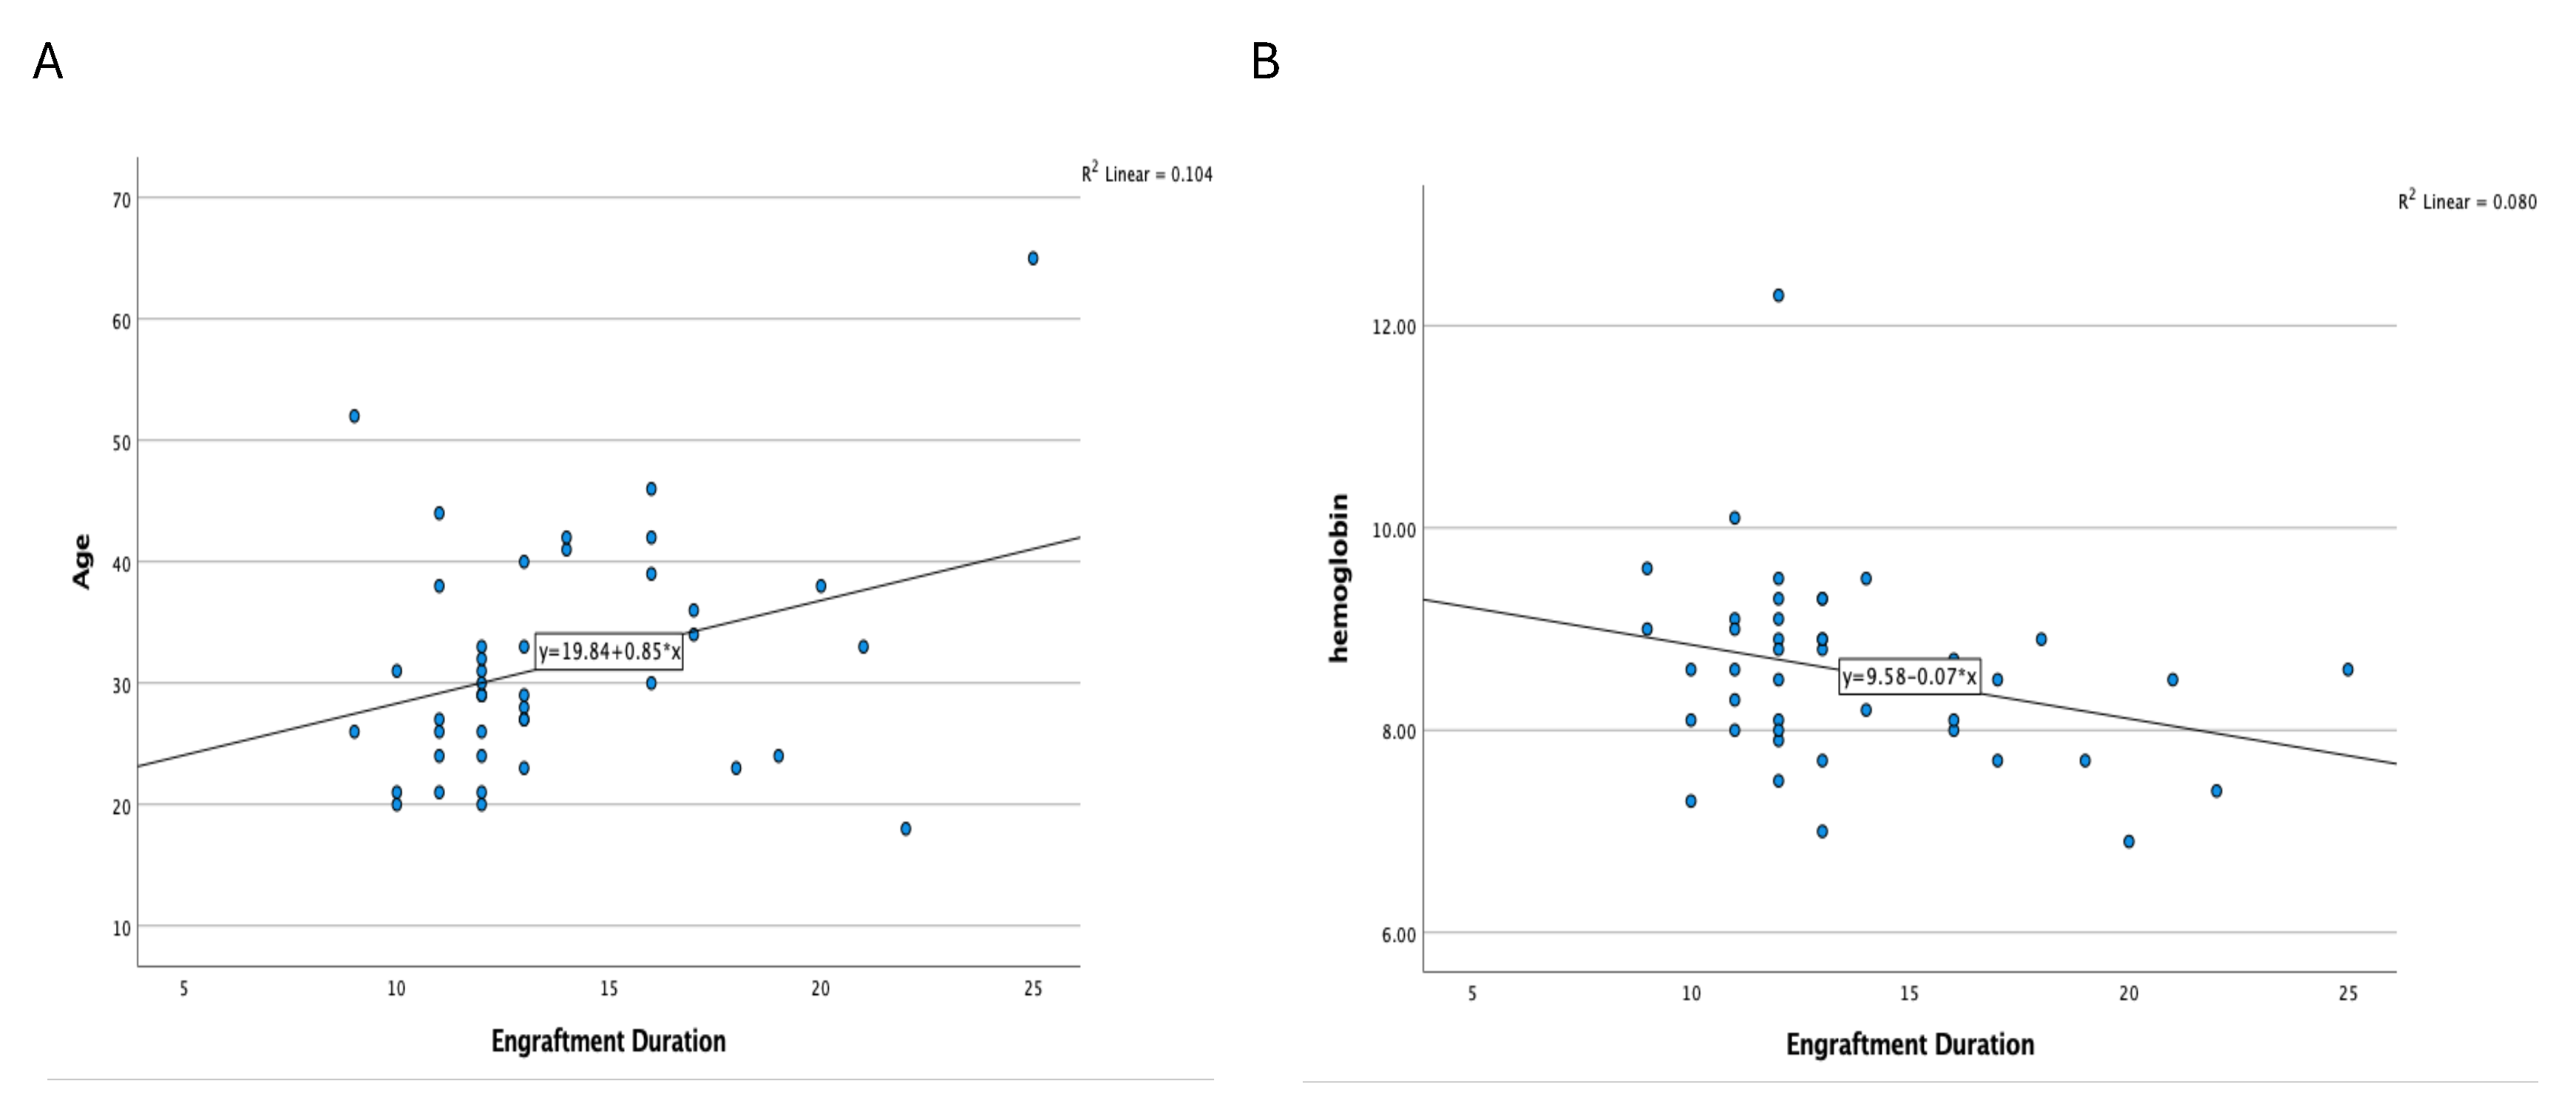
Figure 3.
Correlation Analyses of Engraftment Duration with Morphometric, Laboratory, and Body Composition Parameters.
Figure 3.
Correlation Analyses of Engraftment Duration with Morphometric, Laboratory, and Body Composition Parameters.
Correlation Between Engraftment Duration and Laboratory Parameters
Spearman’s correlation analysis was also conducted to assess relationships between engraftment duration and various biochemical and hematologic markers. A significant negative correlation was identified between hemoglobin level and engraftment duration (ρ = –0.281, p = 0.034), indicating that lower baseline hemoglobin levels may be associated with delayed hematopoietic recovery. Other laboratory markers, including neutrophil count (ρ = 0.183, p = 0.120) and serum sodium levels (ρ = 0.229, p = 0.070), exhibited weak positive correlations, but these were not statistically significant. No meaningful correlations were observed between engraftment duration and creatinine, AST, ALT, calcium, albumin, or platelet count (Figure 2B and Figure 3B).
Multiple Linear Regression Analysis of Engraftment Duration
A multiple linear regression analysis was conducted to identify predictors of engraftment duration. The dependent variable was engraftment duration, with age, hemoglobin level, body weight, and BSA included as independent variables. The model approached statistical significance (F(4, 38) = 2.588, p = 0.052), explaining approximately 21.4% of the variance in engraftment duration (R² = 0.214), with an adjusted R² of 0.131. Two variables were found to be statistically significant predictors of engraftment duration. Increasing age was positively associated with longer engraftment duration (B = 0.136, p = 0.018), whereas higher hemoglobin levels were negatively associated with engraftment duration (B = –1.256, p = 0.036).Body weight and BSA were not statistically significant predictors (p = 0.866 and p = 0.907, respectively). The residuals analysis indicated a standard error of ±3.19 days, reflecting a moderate level of prediction error.
Correlations Between Muscle Mass Indices and Laboratory Parameters
Associations between pre-HDCT/ASCT skeletal muscle indices—SMI and PMI—and selected laboratory parameters were explored. SMI showed significant positive correlations with albumin (ρ = 0.414, p = 0.003), calcium (ρ = 0.456, p = 0.001), and neutrophil count (ρ = 0.350, p = 0.011). Additionally, it was significantly negatively correlated with ALT (ρ = –0.516, p < 0.001) and AST (ρ = –0.295, p = 0.028). PMI was positively correlated with platelet count (ρ = 0.353, p = 0.010) (Figure 3C, Table 2).
Correlation of Pre-HDCT/ASCT Body Composition Indices with Engraftment Duration
In this study, the associations between pre-HDCT/ASCT body composition parameters and engraftment duration were evaluated. Among the variables analyzed, only VFA/SFA ratio exhibited a statistically significant correlation with engraftment duration (Spearman’s ρ = 0.297, p = 0.027). No significant associations were observed between SMI, PMI, or TFA and engraftment duration (p > 0.05) (Figure 3D, Table 3).
Treatment-Related Hematologic and Biochemical Toxicities
Severe hematologic toxicities were observed universally among patients. All individuals (100%) experienced grade 4 neutropenia and thrombocytopenia, reflecting the expected profound myelosuppression following HDCT. Anemia was also prominent, with the majority of patients exhibiting grade 2 anemia (69.8%), and a small subset developing grade 3 anemia (7.0%).
Regarding biochemical toxicities, mild to moderate creatinine elevation was detected in 27.9% of patients, although grade 3 toxicity was uncommon (4.7%) and no grade 4 renal toxicity was recorded. Hepatic enzyme elevations were relatively frequent; 76.7% of patients showed elevated ALT levels, and 74.4% had elevated AST levels, with grade 3 or higher elevations present in a notable proportion (ALT: 9.3%, AST: 16.3%).
Electrolyte imbalances were also prevalent. Hyponatremia affected over 80% of patients, predominantly grade 1–2, with only one case of grade 3. Hypocalcemia was observed in 55.8% of patients, most commonly at grade 1 severity. Additionally, hypoalbuminemia was frequent (93.0%), and over half of the cohort experienced grade 2 hypoalbuminemia (Table 4).
4. Discussion
In this retrospective study involving patients with relapsed or refractory germ cell tumors undergoing HDCT/ASCT, we investigated the relationship between pre-transplant clinical, laboratory, and morphometric parameters and hematopoietic recovery kinetics. Our results indicate that age and post-transplant nadir hemoglobin levels were independently associated with prolonged hematologic engraftment, whereas classical body composition parameters such as skeletal muscle and fat area showed no significant correlation, with the exception of the VFA/SFA ratio.
We found that increasing age was significantly associated with prolonged neutrophil engraftment time. This observation is in line with previous findings suggesting that hematopoietic recovery is affected by aging-related decline in bone marrow regenerative capacity. Specifically, Fedorov et al. demonstrated that patients over 75 years old experienced significantly longer WBC and platelet engraftment times compared to younger patients, despite similar transplant-related mortality and hospitalization durations [22]. Similarly, Elçin Erdoğan Yücel et al. observed a statistically significant difference in WBC engraftment between multiple myeloma patients aged above and below 65 years, with median engraftment durations of 12 and 10 days, respectively [23]. These observations are in concordance with our current findings and support the consideration of age as a clinically relevant factor in post-transplant recovery trajectories.
Furthermore, our study revealed a significant association between lower post-transplant hemoglobin nadirs and prolonged neutrophil engraftment. Despite erythrocyte transfusions administered during the post-transplant period, patients with lower nadir hemoglobin values exhibited delayed hematologic recovery. This suggests that not only symptomatic anemia but also optimal hemoglobin management may play a role in facilitating timely engraftment. As patients undergoing HSCT frequently require transfusional support until red blood cell and platelet engraftment is complete, better understanding of transfusion needs may help minimize complications due to overtransfusion. The American Association of Blood Banks (AABB) recommends transfusion in asymptomatic patients when hemoglobin levels fall below 7–8 g/dL [24]. Supporting this, Tabasi et al. reported that lower pre-transplant hemoglobin levels were associated with increased post-transplant transfusion requirements, highlighting the impact of pre-transplant hematologic status on recovery trajectory [25]. Although their study focused on pre-transplant hemoglobin, our findings expand this perspective by highlighting the predictive significance of post-transplant hemoglobin nadirs on engraftment kinetics.
Interestingly, although SMI, PMI, and TFA were not significantly associated with engraftment duration in our cohort, a significant positive correlation was observed between VFA/SFA ratio and prolonged neutrophil recovery. This observation aligns with the growing body of evidence suggesting that altered fat distribution—particularly increased visceral adiposity—may influence transplant-related outcomes. Notably, while sarcopenia and frailty have traditionally been linked to adverse post-transplant recovery trajectories, our findings highlight that visceral fat predominance, possibly through systemic inflammatory pathways or dysregulated metabolic signaling, may also play a detrimental role in delaying hematologic engraftment. In this context, the study by M. Pamukçuoğlu et al., which evaluated frailty in 98 patients (51 of whom underwent autologous transplantation), demonstrated that neutrophil engraftment time was significantly prolonged in frail patients compared to non-frail counterparts [26]. This finding supports the notion that sarcopenia and frailty may impair hematologic recovery, potentially through systemic inflammation, reduced physiological reserve, and altered bone marrow niche signaling. Taken together, our results reinforce the prognostic relevance of both chronological age, visceral adiposity, and sarcopenia-related frailty in influencing post-transplant recovery trajectories. Therefore, integrating body composition profiling—encompassing both muscle and fat metrics—into the pre-transplant assessment may enhance risk stratification and personalized supportive strategies in patients undergoing HDCT-ASCT.
Moreover, we observed strong associations between muscle indices and several biochemical markers. Higher SMI was positively correlated with serum albumin and calcium levels and inversely correlated with liver transaminases (ALT, AST), reflecting a more favorable nutritional and metabolic profile. Similarly, PMI was positively associated with platelet count. These correlations reinforce the concept that muscle mass may serve as a surrogate for physiological reserve and systemic homeostasis.
5. Conclusion
In conclusion, our study highlights the prognostic significance of both clinical and morphometric parameters in influencing hematopoietic recovery following HDCT-ASCT in patients with relapsed or refractory germ cell tumors. Increasing age and lower post-transplant nadir hemoglobin levels were independently associated with prolonged neutrophil engraftment, underlining the relevance of biological aging and hematologic reserve in post-transplant kinetics. While classical muscle and fat area indices did not predict engraftment duration, the visceral-to-subcutaneous fat area ratio emerged as a potential morphological marker associated with delayed recovery. These findings suggest that fat distribution, particularly visceral adiposity, alongside sarcopenia-related frailty, may affect hematologic regeneration possibly through systemic inflammation or bone marrow niche disruption.
The strong correlation observed between muscle indices and biochemical parameters such as albumin, calcium, transaminases, and platelet count further supports the utility of body composition profiling as a surrogate for physiological resilience. Integration of comprehensive clinical, laboratory, and morphometric assessments into the pre-transplant evaluation may therefore enhance risk stratification and enable the development of individualized supportive care strategies aimed at optimizing outcomes in patients undergoing HDCT-ASCT.
Limitations
This retrospective: single-center study with a small sample size (n=43) constrains external validity and statistical power, increasing the risk of overfitting and unstable estimates. Moreover, heterogeneity in salvage/conditioning regimens and supportive care (e.g., G-CSF timing, antimicrobial use, transfusion thresholds) may have introduced residual confounding of the observed associations.
Author Contributions
All authors contributed to the study conception and design. Material preparation, data collection and analysis were performed by Ömer faruk KUZU , Nuri KARADURMUS, Nebi Batuhan KANAT , Çağlar KÖSEOGLU, Ayşegül DUMLUDAG, Alper TOPAL, Doğan BAYRAM, Musa Barış AYKAN, Efe Cem Erdat, Ahmet Gazi ACAR, Uğur BOZLAR İsmail ERTÜRK The first draft of the manuscript was written by Ömer Faruk KUZU, and all authors commented on previous versions of the manuscript. All authors read and approved the final manuscript. To be used for non-life science journals.
Funding
This research did not receive any specific grant from funding agencies in the public, commercial, or not-for-profit sectors.
Declarations
The datasets used and/or analysed during the current study available from the corresponding author on reasonable request.
Ethics and Guidelines
Approval for the study was obtained from the Gulhane Education and Research Hospital Ethics Commibee on 10.04.2025 approved number: 2025/72 .The study was conducted in accordance with the guidelines approved by the ethics commibee.
Consent to participate
Due to the retrospective nature of the study, Gulhane Education and Research Hospital Ethics Commibee waived the need of obtaining informed consent.
Clinical Trial Number
not applicable.
Data Availability
This manuscript does not report data generation or analysis. Therefore, there are no datasets available for public access.
Conflicts of Interest
The authors report no conflict of interest.
References
- Gillessen S, Sauvé N, Collette L, et al. Predicting Outcomes in Men With Metastatic Nonseminomatous Germ Cell Tumors (NSGCT): Results From the IGCCCG Update Consortium. J Clin Oncol. 2021;39(14):1563-1574. [CrossRef]
- Motzer RJ. Paclitaxel (Taxol) combination therapy for resistant germ cell tumors. Semin Oncol. 2000;27(1 Suppl 1):33-35.
- High-dose chemotherapy for relapsed testicular germ cell tumours | Nature Reviews Urology. Accessed July 31, 2025. https://www.nature.com/articles/s41585-022-00683-1.
- Chovanec M, Adra N, Abu Zaid M, Abonour R, Einhorn L. High-dose chemotherapy for relapsed testicular germ cell tumours. Nat Rev Urol. 2023;20(4):217-225. [CrossRef]
- Connolly EA, Weickhardt A, Grimison P, et al. High-dose chemotherapy for relapsed germ cell tumours: outcomes in low-volume specialized centres. BJU Int. 2022;130 Suppl 1:5-16. [CrossRef]
- Shachar SS, Williams GR, Muss HB, Nishijima TF. Prognostic value of sarcopenia in adults with solid tumours: A meta-analysis and systematic review. European Journal of Cancer. 2016;57:58-67. [CrossRef]
- Cespedes Feliciano EM, Popuri K, Cobzas D, et al. Evaluation of automated computed tomography segmentation to assess body composition and mortality associations in cancer patients. Journal of Cachexia, Sarcopenia and Muscle. 2020;11(5):1258-1269. [CrossRef]
- Cespedes Feliciano EM, Chen WY, Lee V, et al. Body Composition, Adherence to Anthracycline and Taxane-Based Chemotherapy, and Survival After Nonmetastatic Breast Cancer. JAMA Oncol. 2020;6(2):264-270. [CrossRef]
- Cespedes Feliciano EM, Chen WY, Lee V, et al. Body Composition, Adherence to Anthracycline and Taxane-Based Chemotherapy, and Survival After Nonmetastatic Breast Cancer. JAMA Oncol. 2020;6(2):264-270. [CrossRef]
- Kroenke CH, Prado CM, Meyerhardt JA, et al. Muscle radiodensity and mortality in patients with colorectal cancer. Cancer. 2018;124(14):3008-3015. [CrossRef]
- Rollins KE, Gopinath A, Awwad A, Macdonald IA, Lobo DN. Computed tomography-based psoas skeletal muscle area and radiodensity are poor sentinels for whole L3 skeletal muscle values. Clinical Nutrition. 2020;39(7):2227-2232. [CrossRef]
- Alipour O, Lee V, Tejura TK, et al. The assessment of sarcopenia using psoas muscle thickness per height is not predictive of post-operative complications in IBD. Scandinavian Journal of Gastroenterology. 2021;56(10):1175-1181. [CrossRef]
- Lee B, Bae YJ, Jeong WJ, Kim H, Choi BS, Kim JH. Temporalis muscle thickness as an indicator of sarcopenia predicts progression-free survival in head and neck squamous cell carcinoma. Sci Rep. 2021;11(1):19717. [CrossRef]
- Go SI, Park MJ, Song HN, et al. A comparison of pectoralis versus lumbar skeletal muscle indices for defining sarcopenia in diffuse large B-cell lymphoma - two are better than one. Oncotarget. 2017;8(29):47007-47019. [CrossRef]
- Arayne AA, Gartrell R, Qiao J, Baird PN, Yeung JM. Comparison of CT derived body composition at the thoracic T4 and T12 with lumbar L3 vertebral levels and their utility in patients with rectal cancer. BMC Cancer. 2023;23(1):56. [CrossRef]
- Sumransub N, Cao Q, Juckett M, et al. Sarcopenia Predicts Inferior Progression-Free Survival in Lymphoma Patients Treated with Autologous Hematopoietic Stem Cell Transplantation. Transplantation and Cellular Therapy. 2023;29(4):263.e1-263.e7. [CrossRef]
- Kapoor ND, Twining PK, Groot OQ, et al. Adipose tissue density on CT as a prognostic factor in patients with cancer: a systematic review. Acta Oncologica. 2020;59(12):1488-1495. [CrossRef]
- Aleixo GFP, Sheu M, Mirzai S, Majhail NS. Prognostic Impact of Adiposity in Hematological Malignancies: A Systematic Review and Meta-analysis. Clinical Lymphoma, Myeloma and Leukemia. 2022;22(10):726-734. [CrossRef]
- Abnormal body composition is a predictor of adverse outcomes after autologous haematopoietic cell transplantation - Armenian - 2020 - Journal of Cachexia, Sarcopenia and Muscle - Wiley Online Library. Accessed July 31, 2025. https://onlinelibrary.wiley.com/doi/10.1002/jcsm.12570.
- Williams A, Baruah D, Patel J, et al. Prevalence and significance of sarcopenia in multiple myeloma patients undergoing autologous hematopoietic cell transplantation. Bone Marrow Transplant. 2021;56(1):225-231. [CrossRef]
- Henon PR, Liang H, Beck-Wirth G, et al. Comparison of hematopoietic and immune recovery after autologous bone marrow or blood stem cell transplants. Bone Marrow Transplant. 1992;9(4):285-291.
- Autologous stem cell transplantation in an older adult population | Haematologica. Accessed August 4, 2025. https://haematologica.org/article/view/haematol.2022.281020.
- Erdogan Yucel E, Kirmaz AT, Kakci M, et al. The Effect of Age on High-Dose Therapy with Autologous Stem Cell Support in Multiple Myeloma: A Single-Center Experience. Journal of Clinical Medicine. 2024;13(14):4142. [CrossRef]
- Carson JL, Grossman BJ, Kleinman S, et al. Red blood cell transfusion: a clinical practice guideline from the AABB*. Ann Intern Med. 2012;157(1):49-58. [CrossRef]
- Tabasi S, Parkhideh S, Roshandel E, et al. The association of disease type, pre-transplant hemoglobin level and platelet count with transfusion requirement after autologous hematopoietic stem cell transplantation. Caspian J Intern Med. 2021;12(4):544-550. [CrossRef]
- Pamukcuoglu M, Bhatia S, Weisdorf DJ, et al. Hematopoietic Cell Transplant–Related Toxicities and Mortality in Frail Recipients. Biology of Blood and Marrow Transplantation. 2019;25(12):2454-2460. [CrossRef]

Table 1.
Patients Characteristics.
| Variable | Category | N | % |
|---|---|---|---|
| Primary Tumor Localization | Gonadal | 43 | 100.0 |
| Histology | Non-seminomatous | 40 | 93.0 |
| Seminomatous | 3 | 7.0 | |
| Non-Seminomatous Subtypes | Mixed Germ Cell Tumor | 32 | 74.4 |
| Choriocarcinoma | 1 | 2.3 | |
| Embryonal Carcinoma | 2 | 4.7 | |
| Yolk Sac Tumor | 4 | 9.3 | |
| Immature Teratoma | 1 | 2.3 | |
| Stage At Diagnosis | Stage < 3 | 21 | 48.8 |
| Stage ≥ 3 | 22 | 51.2 | |
| IGCCCG Risk Classification | Good (Group 1) | 12 | 27.9 |
| Intermediate (Group 2) | 6 | 14.0 | |
| Poor (Group 3) | 25 | 58.1 | |
| Metastasis Sites | Lung | 26 | 60.5 |
| Lymph Nodes | 42 | 97.7 | |
| Liver | 9 | 20.9 | |
| Bone | 7 | 16.3 | |
| Brain | 3 | 7.0 | |
| Response to Pre- HDCT Therapy | CR or Marker-Negative PR | 24 | 55.8 |
| Marker-Positive PR or SD | 18 | 41.9 | |
| PD | 1 | 2.3 | |
| Timing of HDCT | After 2 Lines | 34 | 79.1 |
| After 3 Lines | 9 | 20.9 | |
| HDCT Regimen | CE | 40 | 93.0 |
| ICE | 3 | 7.0 | |
| Response to HDCT | CR or Marker-Negative PR | 28 | 65.1 |
| SD or Marker-Positive PR | 9 | 20.9 | |
| PD | 6 | 14.0 |
Table 2.
Correlation of Pre-HDCT/ASCT Body Composition Indices with Laboratory Parameters.
| Creatine | ALT | AST | Sodium | Calcium | Albumin | Platelet | Hemoglobin | Neutrophil | |||
|---|---|---|---|---|---|---|---|---|---|---|---|
| Spearman's rho | PRE HDCT/ASCT SMI | Correlation Coefficient | -.125 | -.516** | -.295* | .311* | .456** | .414** | .186 | .253 | .350* |
| Sig. (1-tailed) | .212 | .000 | .028 | .021 | .001 | .003 | .116 | .051 | .011 | ||
| N | 43 | 43 | 43 | 43 | 43 | 43 | 43 | 43 | 43 | ||
| PRE HDCT/ASCT PMI | Correlation Coefficient | .010 | -.385** | -.239 | .239 | .234 | .217 | .353* | .120 | .027 | |
| Sig. (1-tailed) | .473 | .005 | .061 | .061 | .065 | .082 | .010 | .222 | .432 | ||
| N | 43 | 43 | 43 | 43 | 43 | 43 | 43 | 43 | 43 | ||
| PRE HDCT/ASCT TFA | Correlation Coefficient | .214 | -.231 | -.150 | .215 | .083 | -.009 | .100 | .115 | .175 | |
| Sig. (1-tailed) | .084 | .068 | .169 | .083 | .297 | .477 | .261 | .232 | .130 | ||
| N | 43 | 43 | 43 | 43 | 43 | 43 | 43 | 43 | 43 | ||
| PRE HDCT/ASCT VFA/SFA | Correlation Coefficient | -.138 | -.049 | .004 | -.149 | -.179 | -.106 | .058 | .053 | .153 | |
| Sig. (1-tailed) | .189 | .377 | .489 | .171 | .126 | .250 | .357 | .367 | .164 | ||
| N | 43 | 43 | 43 | 43 | 43 | 43 | 43 | 43 | 43 | ||
Table 3.
Correlation Between Pre-HDCT/ASCT Body Composition Parameters and Engraftment Duration.
| PRE HDCT/ASCT SMI | PRE HDCT/ASCT PMI | PRE HDCT/ASCT TFA | PRE HDCT/ASCT VFA/SFA | |||
|---|---|---|---|---|---|---|
| Spearman's rho | Engraftment Duration | Correlation Coefficient | .050 | .080 | .113 | .297* |
| Sig. (1-tailed) | .375 | .305 | .235 | .027 | ||
| N | 43 | 43 | 43 | 43 | ||
Table 4.
Treatment-Related Hematologic and Biochemical Toxicities.
| Toxicity Type | Grade | Frequency (n) | Percentage (%) |
|---|---|---|---|
| Neutropenia | Grade 1 (2000–1500/mm³) | 0 | 0.0% |
| Grade 2 (1500–1000/mm³) | 0 | 0.0% | |
| Grade 3 (1000–500/mm³) | 0 | 0.0% | |
| Grade 4 (<500/mm³) | 43 | 100.0% | |
| Anemia | Grade 1 (Hemoglobin 12–10 g/dL) | 10 | 23.3% |
| Grade 2 (10–8 g/dL) | 30 | 69.8% | |
| Grade 3 (<8 g/dL) | 3 | 7.0% | |
| Grade 4 (Life-threatening) | 0 | 0.0% | |
| Thrombocytopenia | Grade 1 (150,000–75,000/mm³) | 0 | 0.0% |
| Grade 2 (75,000–50,000/mm³) | 0 | 0.0% | |
| Grade 3 (50,000–25,000/mm³) | 0 | 0.0% | |
| Grade 4 (<25,000/mm³) | 43 | 100.0% | |
| Creatinine Elevation | Normal | 31 | 72.1% |
| Grade 1 (up to 1.5× baseline) | 7 | 16.3% | |
| Grade 2 (1.5–3× baseline) | 3 | 7.0% | |
| Grade 3 (3–6× baseline) | 2 | 4.7% | |
| Grade 4 (>6× baseline) | 0 | 0.0% | |
| AST Elevation | Normal | 11 | 25.6% |
| Grade 1 (≤3× ULN) | 15 | 34.9% | |
| Grade 2 (3–5× ULN) | 10 | 23.3% | |
| Grade 3 (5–20× ULN) | 6 | 14.0% | |
| Grade 4 (>20× ULN) | 1 | 2.3% | |
| ALT Elevation | Normal | 10 | 23.3% |
| Grade 1 (≤3× ULN) | 18 | 41.9% | |
| Grade 2 (3–5× ULN) | 11 | 25.6% | |
| Grade 3 (5–20× ULN) | 3 | 7.0% | |
| Grade 4 (>20× ULN) | 1 | 2.3% | |
| Hyponatremia | Normal | 7 | 16.3% |
| Grade 1 (130–135 mmol/L) | 22 | 51.2% | |
| Grade 2 (125–129 mmol/L) | 13 | 30.2% | |
| Grade 3 (120–124 mmol/L) | 1 | 2.3% | |
| Grade 4 (<120 mmol/L) | 0 | 0.0% | |
| Hypocalcemia | Normal | 19 | 44.2% |
| Grade 1 (corrected Ca <8 mg/dL) | 20 | 46.5% | |
| Grade 2 (7–8 mg/dL) | 4 | 9.3% | |
| Grade 3 (6–7 mg/dL) | 0 | 0.0% | |
| Grade 4 (<6 mg/dL) | 0 | 0.0% | |
| Hypoalbuminemia | Normal | 3 | 7.0% |
| Grade 1 (3–3.4 g/dL) | 14 | 32.6% | |
| Grade 2 (2–3 g/dL) | 23 | 53.5% | |
| Grade 3 (<2 g/dL) | 3 | 7.0% | |
| Grade 4 (Life-threatening) | 0 | 0.0% |
Disclaimer/Publisher’s Note: The statements, opinions and data contained in all publications are solely those of the individual author(s) and contributor(s) and not of MDPI and/or the editor(s). MDPI and/or the editor(s) disclaim responsibility for any injury to people or property resulting from any ideas, methods, instructions or products referred to in the content. |
© 2025 by the authors. Licensee MDPI, Basel, Switzerland. This article is an open access article distributed under the terms and conditions of the Creative Commons Attribution (CC BY) license (http://creativecommons.org/licenses/by/4.0/).
Copyright: This open access article is published under a Creative Commons CC BY 4.0 license, which permit the free download, distribution, and reuse, provided that the author and preprint are cited in any reuse.


