Submitted:
19 August 2025
Posted:
20 August 2025
You are already at the latest version
Abstract
A study on the theory development of chevron-braced frame (CBF) systems, also known as inverted-V bracing, are a widely adopted lateral force-resisting system in steel structures, particularly in regions prone to seismic activity. Such steel structures are widely used for building construction in Japan. The seismic design of chevron-braced frames presents unique challenges due to their complex inelastic behavior under earthquake loading. Key issues include brace buckling, unbalanced vertical forces on the beam due to asymmetric brace yielding, and potential formation of plastic hinges in the beam. This paper aims to provide a comprehensive overview of the seismic design principles for chevron-braced frame systems, highlighting critical design considerations, common failure mechanisms, and advancements in analytical and experimental studies. A number of equations have been developed to co-relate among the relative strength of the braces with respect to the lateral strength of the braced bent (β0), the relative strength of the braces with respect to the beam (r0), and the strength of the beam intersecting braces with respect to the braces (K) which also presented in plots to help the designer efficiently. By understanding the strengths and limitations of CBF systems, engineers can develop more resilient and reliable structures capable of withstanding the demands of seismic loading.
Keywords:
steel brace
; steel building systems
; chevron-braced frames
; seismic design
; seismic performance
1. Introduction
Chevron-braced frame (CBF) systems offer an efficient means of enhancing the lateral stiffness and strength of a structure while allowing architectural flexibility through unobstructed openings. In a chevron configuration, braces are arranged in an inverted-V shape converging at a common point on a beam which enabling effective distribution of lateral loads to the foundation. These behavioral characteristics necessitate careful consideration in both the design and detailing stages to ensure adequate ductility, energy dissipation, and overall system stability during seismic events. In Japanese steel construction, chevron concentric braces are commonly incorporated within a moment-resisting frame (MRF). These systems, which will be referred to as chevron-braced MRFs, require that the beams intersected by the braces be designed to accommodate not only the forces generated by the moment-frame action but also the vertical force imbalance between the braces. Experiments conducted by [1], as well as [2], demonstrated that if a beam lacks sufficient strength to support an unbalanced vertical force, the yielding of the beam can significantly affect the seismic performance of a chevron-braced moment-resisting frame (MRF). Additionally, [3], along with [4], proposed design guidelines for proportioning beams that are intersected by braces.
In North America, the term "Concentrically Braced Frames" (CBFs) refers to structural systems that are designed with the assumption that all beam-to-column connections and column bases are pinned. These systems rely exclusively on concentric diagonal braces for resisting seismic loads. Research by [3,5] demonstrated that CBFs with braces arranged in a chevron pattern can experience two types of failure mechanisms: strong-beam and weak-beam. The weak-beam mechanism occurs when the beam yields due to an unbalanced force before the tension brace reaches its yield strength. In contrast, the strong-beam mechanism develops when the tension brace achieves its yield strength while the beam remains elastic. [5,6] cautioned that the weak-beam mechanism is undesirable for multi-story structures, as it can cause significant strength degradation, leading to the formation of soft stories. To mitigate this risk, the AISC Seismic Provisions for Structural Steel Buildings [7] require that the beam intersected by braces be proportioned to ensure that the tension brace reaches its full yield strength while the compression brace only carries a small portion of its original compressive strength.
In Japan, there are a limited number of design guidlines are available in Japanese building codes and provisions [8] for proportioning and detailing chevron-braced MRFs. A combined experimental and computational project has been conducted and reported by [9] to examine the seismic performance of chevron-braced moment-resisting frames designed and constructed according to the current practice in Japan. Moreover, a computational study was conducted by [10] to examine the seismic performance of steel chevron-braced moment-resisting frames to check the torsional and translational restraint of the beam intersected by braces as well as the relative strength of the beam with respect to the braces. However, in the above mentioned research the relationship between and , where value is based on an assumption that the tension brace and the compression brace will transfer the same amount of force during excitation, which is a hypothesis and not a realistic prediction. This paper summarizes a number of equations whose objective was to co-relate among the relative strength of the braces with respect to the lateral strength of the braced bent (), the relative strength of the braces with respect to the beam (), and the strength of the beam intersecting braces with respect to the braces () and to examine how the seismic performance of chevron-braced frame may be affected by primary design parameters. This research has allowed engineers to employ a wide variety of different design rules with a reliable failure prediction.
2. Design Principle
In a chevron configuration, braces form an inverted V-shape that meets at a common point on a beam, effectively channeling lateral loads down to the foundation. This innovative design not only maximizes structural stability but also enhances overall resilience against seismic events. However, it's important to recognize the unique challenges that arise in the seismic design of chevron-braced frames. These challenges stem from the complex inelastic behavior experienced during earthquakes, including brace buckling, unbalanced vertical forces on the beam due to asymmetric brace yielding, and the potential development of plastic hinges in either the beam or columns. Addressing these concerns is crucial for ensuring the safety and durability of buildings in earthquake-prone areas.
The CBFs were proportioned according to the assumed mechanisms illustrated in Figure 1 where the beam is proportioned not to yield due to the force imbalance under brace tension Ny and brace compression Nu = 0.3Ncr, which call “Strong-beam” mechanism and again, partial yielding of the beam is allowed under brace tension Nt (< Ny) and brace compression Nu, which call “Weak-beam” mechanism. In both conditions, the beam must be proportioned for the force unbalance.
A soft story can be formed in a multi-storied building due to lateral strength degradation at beam intersecting braces of CBFs because of poor seismic performance. CBFs need to design considering the above-mentioned design approaches and available bracing connections based on Japanese practice to investigate the performance due to seismic action. CBFs must be proportioned in such a way that at least 60% of the lateral strength should be from the moment resisting frame and no more than 40% should be from the braces to prevent the yielding of the beam at the intersecting point with braces. If the braces exert the lateral strength more than 40%, a severe inelastic deflection occurs on the beam due to energy dissipation mechanisms on it. These phenomena underscore the necessity for careful and precise design methodologies that prioritize ductility, energy absorption, and the overall stability of the system during seismic events.
This review aims to provide an in-depth examination of the fundamental seismic design principles associated with chevron-braced frame systems. It will delve into essential design considerations, such as the selection of materials and connection details, explore common failure mechanisms that engineers must anticipate, and highlight cutting-edge advancements in both analytical models and experimental research. By cultivating a comprehensive understanding of the strengths and weaknesses inherent to CBF systems, engineers will be aptly equipped to design resilient, dependable structures that can endure the relentless forces of nature, ultimately preserving lives and investments alike.
3. Design Equations
The seismic design of chevron-braced frames comes with its own set of challenges due to their intricate inelastic behavior under earthquake loads. Issues such as brace buckling, unbalanced vertical forces on beams from asymmetric brace yielding, and the formation of plastic hinges in beams or columns can pose significant risks. It is essential to address these complexities during the design and detailing phases to ensure that structures exhibit the necessary ductility, energy dissipation, and stability when faced with seismic events. This review sets out to deliver an in-depth exploration of the seismic design principles surrounding chevron-braced frame systems.
Figure 2 illustrates the decomposition of lateral force resistance in a braced frame system into two components: one resisted by the braces and the other by the frame itself. Leftmost diagram: Full Braced Frame System, a chevron-braced frame (CBF) is depicted with a triangular bracing configuration. An external lateral force () is applied at the top of the frame, which can be decomposed into: The horizontal force resisted by the braces () and The horizontal force resisted by the frame (). The relationship can be expressed as: ( = + ) The braces form an angle () with the horizontal. The frame height is denoted as (), and the bay width is represented as (). Middle diagram: Bracing System Contribution, this illustration focuses solely on the braces. The bracing system resists a horizontal force component () a vertical force component (). These forces occur due to the inclined orientation of the braces, isolating the bracing action from the full system. These forces arise due to the unique orientation of the braces, isolating their contribution from the full structural system and emphasizing their vital role in maintaining stability under load. Rightmost diagram: Frame Contribution, this diagram shows only the moment-resisting frame with no braces. It resists a horizontal force (). This diagram also indicates the internal reactions corresponding to the braces’ contribution: () and () at the top joint. This separation helps to clarify the frame action apart from the braced system. This clear delineation of actions allows for a better understanding of how the frame operates alongside the braces, emphasizing the architectural synergy between the two elements. The purpose of the decomposition of this figure is to be commonly used in structural analysis and to understand how lateral loads are distributed between braces and the frame. Design or analyze the system by assessing the forces in the braces (, ) and in the frame () and analyze internal forces at the joints.
3.1. Strong Beam Mechanism
Figure 3 illustrates the force decomposition in a braced frame system subjected to lateral loads. The structure shown is a concentrically braced frame (CBF), where braces intersect with beams and columns to resist lateral loads. In this arrangement, diagonal braces intersect with horizontal beams and vertical columns, forming an intricate web designed to counteract the forces exerted by lateral loads, such as those generated by seismic events. A lateral force () is applied at the top of the frame, simulating seismic loading. Braces are diagonal members that connect the beam-column joints. They resist lateral loads primarily through axial forces (tension and compression). Arrows on the braces indicate the internal axial forces generated in response to the lateral load. Columns carry vertical loads and part of the lateral load through bending and shear. Beams transfer loads between braces and columns, especially at their intersections. The lateral load at the top is distributed through diagonal braces provide stiff axial resistance, making them ideal for bracing against horizontal movement. The frame deforms and resists part of the load through bending and shear in the beams and columns. Structural Behavior Insights: the contribution () of the braced frame is generally dominant when the braces are strong and effective. On the other hand, the contribution () of the moment frame becomes more significant when the braces yield or buckle, or in ductile moment-resisting frames. This decomposition allows to understand and quantify how much of the lateral resistance comes from the braces versus the frame itself, which is essential for seismic design and performance-based engineering. The braces in this framework are critical structural elements, expertly placed diagonal members that connect at the joints where beams and columns meet. Their primary function is to resist lateral loads via axial forces—both in tension () and compression ()—and they play a crucial role in stabilizing the frame against sideways movement.
Figure 4 vividly depicts the force within a frame subjected to lateral loads, presenting a comprehensive overview of the structural mechanics involved. A lateral force () is applied at the pinnacle of the frame, simulating the powerful effects of seismic activity. Columns serve as the stalwart sentinels, supporting vertical weights while also bravely handling a portion of the lateral load through the mechanisms of bending and shear. The beams, acting as the connecting fibers of this structural tapestry, transfer loads between the braces and columns, particularly crucial at their intersections where forces converge. As the lateral load descends from the top of the frame, it is distributed in a structured manner. Simultaneously, the entire frame bends and adapts, resisting part of the load through the intricate interplay of bending and shear in the beams and columns.
Plastic hinge mechanism,
Figure 5 and Figure 6 illustrate two different approaches to force decomposition in a braced frame subjected to lateral loads (H). Each frame features a chevron brace configuration (inverted V). Figure 5 represents symmetrical brace force decomposition configuration. The frame employs symmetrical chevron bracing, with both braces assumed to carry equal axial forces (). This figure is a hypothesis which considered by [10]. Figure 6 represents asymmetrical (or post-buckling) brace force decomposition configuration. This frame features chevron bracing where one brace may have buckled, leading to unequal load sharing between braces. This figure is typically utilized in structural engineering contexts, such as the seismic design of concentrically braced frames, to demonstrate how lateral forces are distributed between braces and frames, depending on whether both braces are active or if one has buckled.
Here,
Hence,
Here,
Now,
Again,
3.1. Weak Beam Mechanism
Figure 7 discuss on plastic hinge formation in beams and resistance from braces. In a braced frame subjected to lateral forces (), deformation and rotation (θ) occur at various points, with red dots indicating the formation of plastic hinges, particularly in the beam. The red dots at the beam-column intersections and midspan of the beam signify the formation of plastic hinges, indicating flexural yielding due to large rotations (θ). The beam has three plastic hinges: two located at the ends and one at the midspan. This typical mechanism occurs when the beam yields under lateral displacement. The rotation angles suggest that the beam is experiencing double curvature bending, which is commonly observed in moment-resisting frames or partially braced frames. The braces are configured in a V-brace (chevron) arrangement, providing axial resistance (tension/compression), represented by () and () respectively. These braces help reduce lateral displacement by carrying a significant portion of the horizontal load (). As the beam deforms, the vertical deflection at the midspan causes the braces to either elongate (in tension) or shorten (in compression), depending on the direction of deformation. The axial force within the braces contributes to a restoring force that resists further sway, stabilizing the deformation mechanism in the beam. The interaction between beam and braces are critical as the formation of plastic hinges in the beam suggests that the braces may not be sufficiently stiff to completely prevent flexural yielding in the beam. However, their presence helps limit the magnitude of rotation and reduces the lateral load demand on the columns and beam. The angle (2θ) at the beam center illustrates the beam’s deformed shape and its interaction with the braces, which can either: - Take on additional force as the beam deforms, or - Buckle if in compression, depending on the slenderness of the braces. Plastic hinges in the beam indicate energy dissipation and a ductile response under seismic or lateral loading conditions. While braces provide essential resistance, they do not eliminate hinge formation unless they are adequately designed. The behavior of the overall system reflects a combination of moment frame action (via plastic hinges) and brace action (through axial forces). This phenomenon is typical in dual systems or concentrically braced frames employing flexible beams.
Here,
Figure 8 discuss on plastic hinge formation in beams and unbalanced shear at beam-brace intersections. This schematic illustrates a braced frame subjected to lateral loading, where plastic hinges form in the beam and unbalanced vertical shear is generated at the intersections with the braces. Here’s a clear breakdown of the mechanism and key discussion points: 1. Plastic Hinge Formation in the Beam- The red circles on the diagram indicate the locations of the plastic hinges. Due to lateral sway (), the beam rotates at an angle (θ) at both ends, which creates moments that lead to the formation of plastic hinges. The central plastic hinge denotes a mechanism known as a three-hinge plastic mechanism (with two hinges at the ends and one in the center). This signifies that the beam has reached its flexural capacity, and any further deformation is primarily plastic in nature. 2. Brace Interaction and Unbalanced Vertical Shear ()- The diagonal braces resist lateral forces and impose axial forces into the beam at their intersection points. As the structure sways laterally, the left and right braces may experience different axial deformations, especially if: - One brace is yielding (under tension or compression). - The other brace is buckled or in post-buckling. This imbalance in axial forces generates a net vertical force () at the intersection of the beam and braces. To identify the reasons for unbalanced shear, the vertical components of the axial forces in the braces no longer cancel each other out due to: - Post-buckling degradation in the compression brace. - Strain hardening in the tension brace. Consequently, the beam must resist this vertical shear () in addition to its flexural demand. 3. Kinematic Relationships- The rotation (θ) in the columns and the ends of the beam leads to: - Beam end vertical displacement approximately equal to hθ (based on geometry). - Relative rotation at the brace intersection: (l/2)θ. These rotations result in relative displacements across the braces, which contribute to the unbalanced axial forces. 4. Design and Analysis Implications- The beam at the brace intersection should be designed to accommodate: - Combined bending and shear. - Localized vertical shear demand (). Failure to consider these factors may result in web yielding, local buckling, or premature failure of the beam. Additionally, braces should be assessed for asymmetrical behavior, particularly under cyclic loading conditions. This mechanism is common in concentrically braced frames, especially those with chevron (inverted V) bracing configurations. Plastic hinge formation in the beam. - Vertical shear () at the brace-beam connection caused by the imbalance of brace forces. - Nonlinear behavior of braces, including buckling, yielding, and post-buckling effects must take into account.
Plastic hinge mechanism,
The energy dissipated by the pair of braces is computed as:
3.2.1. The tension brace develops its yield strength under the condition
The seismic design for chevron-braced frames is fraught with complexity. Their behavior during the violent shudders of an earthquake is a tapestry of intricate inelastic responses, where brace buckling and unbalanced vertical forces on beams can lead to catastrophic failures if not meticulously managed. The potential for plastic hinges to form in beams or columns poses further threats, underscoring the urgent need for thorough design considerations that ensure ductility, energy dissipation, and unwavering stability amidst the chaos of seismic activity. This review embarks on a comprehensive exploration of the seismic design principles intrinsic to chevron-braced frame systems.
The separation of actions helps clarify the frame's role distinctly from the rest of the braced configuration. The purpose of the decomposition is to compelling figure serves multiple purposes in structural analysis, including: - Enhancing the understanding of how lateral loads are deftly shared between the braces and the frame, fostering a comprehensive view of stability. - Facilitating the design and analysis of the system by evaluating forces acting within the braces (, ) alongside those in the frame (). Analyzing the internal forces experienced at the joints, which are vital to ensuring structural integrity.
Here,
Now,
Hence,
Now,
This intricate figure serves several critical purposes in the realm of structural analysis, including: - Advancing the understanding of how lateral loads are distributed between the braces and the frame, painting a clear picture of the structural response during events such as seismic activity. Assisting engineers in designing or analyzing the system by evaluating specific forces acting on the braces (, ) and those acting on the frame (), enabling more precise and resilient structural designs. - Facilitating the analysis of internal forces at the joints, which are crucial for maintaining the structural integrity and ensuring that the connections can withstand the anticipated loads. Supporting sophisticated modeling and simulation efforts of the individual behavior of components in advanced structural analysis software, such as OpenSees, further enhancing the predictability and performance of the engineered system. This detailed exploration not only aids in understanding individual components but also fosters a holistic appreciation of the intricate interplay between various structural elements.
The contribution () of the braced frame emerges as a dominant force, especially when the braces stand strong and are effectively engaged. - Conversely, the contribution (), belonging to the moment frame, gains significance when the braces begin to yield or buckle, or in moments when ductile moment-resisting frames come into play.
Again,
3.2.2. The tension brace is not develop its yield strength under the condition
Here,
Now,
Hence,
Now,
Again,
4. The Strength of the Beam Intersecting Braces
Figure 9 discuss on braced frame where plastic hinges form at specific locations along the beam. Let's explore this mechanism in detail, focusing on plastic hinge formation. The red dots in the diagram indicate the locations where plastic rotation (beyond the elastic limit) is expected during lateral loading events, such as earthquakes. (Mp) represents the plastic moment capacity of the beam section. These hinges enable the frame to develop a mechanism that allows it to deform plastically and dissipate energy during seismic events. A beam with plastic hinges forming at the midspan and the ends. Rotation (θ) observed at the ends of the columns and the beam. The plastic hinge rotations are distributed along the beam ends and at the midspan, indicating a plastic mechanism.
Plastic hinges develop at the beam ends and the midspan (a total of three hinges). The columns are assumed to rotate while remaining elastic, unless otherwise noted. The mechanism permits lateral displacement under the lateral load (), with energy being dissipated through plastic rotation at the hinges. The beam ends and midspan rotate by an angle θ. Due to symmetry, these rotations are distributed equally. The vertical sway (Δ) relates to the half-length (l/2) and rotation (θ). The beam deforms to accommodate these rotations at the hinge locations, which are represented in a dashed configuration. The plastic hinges must have sufficient rotation capacity to allow for large displacements without failure.
If more than three plastic hinges form in this determinate structure, a collapse is imminent, indicating that a plastic mechanism has formed. This mechanism dissipates seismic energy through controlled yielding, showcasing ductility. This constitutes a ductile design approach, especially desirable for seismic regions, as it allows the beam to yield before the column—a strong column–weak beam philosophy. The lateral force () generates a moment at the base, which is resisted by the plastic moments (Mp) at the hinges.
The figure illustrates a beam-sway plastic mechanism within a braced frame. Plastic hinges at the beam ends and midspan facilitate plastic rotation and system ductility. This mechanism is idealized for predicting collapse, energy dissipation, and seismic design. The behavior of this system ensures that failure occurs in a ductile and predictable manner, which is critical for life-safety design.
From Figure 9 (a),
From Figure 9 (b),
Here, =1.0
Figure 10 illustrates a mechanism analysis of a braced frame subjected to lateral loads, highlighting the formation of plastic hinges in the beams and columns. The red dots indicate the locations of plastic hinges (Mp = plastic moment capacity). The frame is experiencing lateral sway, likely due to seismic loading. This configuration represents a mechanism, meaning the structure has formed sufficient plastic hinges to become a kinematic system (i.e., it can deform without additional resistance, indicating potential collapse). Hinges form at both ends and at the mid-span of the beam. This is common in sway mechanisms where the beam helps resist lateral loads. The mechanism assumes that the beam develops its full plastic moment capacity at three locations, creating a three-hinge mechanism in the beam.
The frame rotates by a total angle (θ) from the base to the beam. The midspan vertical deflection is denoted by (Δ). The relative rotations of the components are labeled along the deformed shape. The total rotation at the beam midspan is 3θ/2, indicating combined rotation from both ends and the central hinge. This setup is often analyzed using the virtual work method in plastic analysis. This is done by the lateral force () and the vertical force () over the displacement Δ. Internal work can be calculated by the sum of plastic moments multiplied by the rotations at each hinge.
This demonstrates that the beam is not infinitely rigid; it yields and forms hinges under moment demand. It follows a capacity design principle: the beam yields before the column (i.e., in a weak beam–strong column scenario, this may not be enforced). This model can represent a collapse mechanism, which is useful in determining the ultimate lateral strength or plastic displacement capacity. Such models are utilized for: - Seismic design and assessment - Plastic (limit) analysis - Progressive collapse evaluation - Design of ductile moment frames.
From Figure 10 (a),
From Figure 10 (b),
Here, =1.5
Figure 11 discuss on plastic hinge formation in beams. The figure illustrates the mechanism of collapse for a braced frame, where plastic hinges form in the beam. This indicates a beam mechanism rather than a column or story mechanism. Plastic hinge locations are indicated by red dots on the beam, which are positioned two at the beam-column joints (at the left and right ends of the beam) and one at the midspan of the beam. This arrangement suggests the formation of a beam sway mechanism or beam plastic mechanism.
The frame is a symmetrical single-bay configuration. Left column rotate by an angle (θ/2) and right column rotate by an angle (θ) at the base. The beam rotates by (θ/2) at each end (relative to the columns). At the midspan, the hinge permits an additional rotation of (2θ). The horizontal displacement at the top of the columns leads to relative rotations and midspan deflection (Δ), generating a vertical shear force () due to the plastic moment capacity.
The beam behaves plastically with a moment capacity of (Mp). The columns are assumed to be strong enough, in line with the strong-column, weak-beam design philosophy. No plastic hinges form in the columns, indicating ideal braced behavior. The deformation is a result of plastic rotation, not elastic deformation. The external work done by lateral loads equals the internal plastic energy dissipation. The work done by lateral force () through displacement (Δ) is equal to the plastic moment work done by rotations at the hinges.
This mechanism is ductile and allows for the redistribution of moments. It ensures energy dissipation in beams, providing protection for the columns. This behavior is desirable in seismic design if the goal is for the columns to remain elastic. The collapse load can be computed based on these hinge locations and moment capacities. If the actual strength of the columns is lower than expected, hinges may form in the columns, leading to undesirable failures. Bracing or lateral stiffness must be sufficient to support vertical loads and prevent excessive drift.
From Figure 11 (a),
Here, =2.0
5. Braced Frame Capacity Design to Respond against Lateral Load
Figure 12 presents a detailed analysis of the relationship between the relative strength of the braces and the frame by using equations (2), (4) & (6), denoted as r₀ = / . It effectively captures how this ratio adapts and fluctuates in response to the normalized post-buckling strength of the braces, a concept represented by the ratio = /. Here, refers to the yield strength of the braces, while denotes the ultimate strength they can withstand before failure. This equation captures the essence of the normalized post-buckling strength of braces, illustrating how they perform after experiencing the critical stress of buckling. Denotes the strength of the brace at its initial yield point—the brace axial force (tension) when the material first begins to deform under load. Represents the brace strength in the post-buckling regime, highlighting the brace’s resilience and capacity to withstand forces even after it has buckled.
The figure further explores this relationship across several distinct beam-to-brace strength ratios (), which represent the comparative strength of the beams relative to the braces. This comprehensive examination sheds light on how varying к values influence the stability and performance of the structural system under different load conditions, ultimately guiding the design choices for enhanced safety and efficiency in structural engineering.
= / equation represents the normalized post-buckling strength of braces. As the value of increases, the brace retains more of its strength after buckling. It signifies that the brace retains a greater portion of its strength in the aftermath of buckling, showcasing its capacity to endure and support loads. r₀ = / is the ratio of the lateral force resisted by the braces to that resisted by the beam-frame system. A higher r₀ indicates that the braces play a more significant role in resisting lateral loads. This ratio embodies the relationship between the lateral forces resisted by the braces and those countered by the overall beam-frame system. = Beam Strength / Brace Strength. If ≤ 1, it indicates a strong beam mechanism (the beam is strong relative to the brace). This indicates a robust beam mechanism, where the beam exhibits considerable strength in relation to the brace, ensuring stability and safety under stress. If ≥ 1, it reflects a weak beam mechanism (the beam is weak relative to the brace). It points to a weak beam mechanism, revealing a scenario where the beam lacks the necessary strength compared to the brace, suggesting potential vulnerabilities in the structural design.
From the plot, it can be observed that the nonlinear growth of r₀ with across all values of , as increases, (r₀) increases nonlinearly, particularly sharply after ( approximately 0.7). This observation indicates that even small improvements in post-buckling strength can significantly enhance the lateral resistance provided by the bracing system. Influence of (к) (Beam-to-Brace Strength Ratio): For low () values (e.g., ( = 0.25, 0.5 )), (r₀) remains low across the range of (), suggesting that the beam carries more lateral load. These configurations fall into the "strong beam mechanism" category, as indicated by the red text and, :For high () values (e.g., ( = 1.25, 1.5, 1.75)), (r₀) increases steeply with (). In these cases, the braces take on more load as they maintain higher post-buckling strength, while the beam becomes comparatively weaker (characterized as the weak beam mechanism). When ( = 1.75), (r₀) exceeds 250 as () approaches 1, indicating that the braces dominate the system behavior. Transitional Behavior at ( = 1.0): This point represents the transition between strong and weak beam mechanisms. The curve at ( = 1.0) marks the threshold where neither the beam nor the brace overwhelmingly dominates the system.
Under design and behavioral implications where a critical importance of post-buckling strength need to maintaining a high ratio of = / (i.e., ensuring ductile and stable post-buckling behavior), allowing a brace to continue contributing significantly even after buckling occurs. This is essential in seismic design, as post-buckling behavior plays a crucial role in energy dissipation. Tuning beam strength ( Factor): By adjusting the к factor, designers can modify the lateral force-resisting mechanism, balancing between strong-beam (frame-dominated) and weak-beam (brace-dominated) behavior. For optimal ductile performance, a balanced mechanism (close to ( = 1)) is often desirable, depending on the intended failure mode. Caution against excessive bracing need to consider if (r₀) becomes excessively high (e.g., greater than 100 for high к and values), the frame may contribute minimally to overall stability. This situation can increase the risk of global instability if the braces fail suddenly. Therefore, careful capacity design is essential.
Figure 13 indicates the trend of (r₀) with () by using equations (2), (4) & (6). For all values of (), (r₀) increases nonlinearly with (). This indicates that as the brace retains more of its capacity after buckling (i.e., a higher ratio of = /, it contributes more to the lateral resistance of the structure compared to the frame. Lower values ( ≤ 1.0), represented by dashed black, red, green, and blue lines, correspond to strong beam mechanisms. These curves remain relatively low on the graph, indicating a more balanced contribution between the frame and the braces. Higher values ( > 1.0), shown in cyan, magenta, and yellow, indicate a weaker beam mechanism where the braces dominate the lateral resistance. These curves rise rapidly, especially as approaches 1.0.
The logarithmic scale on the y-axis illustrates that even small changes in () can lead to exponential increases in (r₀) for higher values of (). For example, at ( = 0.8), the value of (r₀) is approximately: - 10 for ( = 1.0) - 30+ for ( = 1.5) - 100+ for ( = 1.75). A strong beam mechanism ( ≤ 1.0) results in a more uniform distribution of lateral resistance, which minimizes the risk of excessive demand on braces and potential instability. In contrast, a weak beam mechanism ( > 1.0) concentrates lateral resistance in the braces. This concentration can lead to brace overloading, buckling, or other undesirable failure modes if not properly addressed.
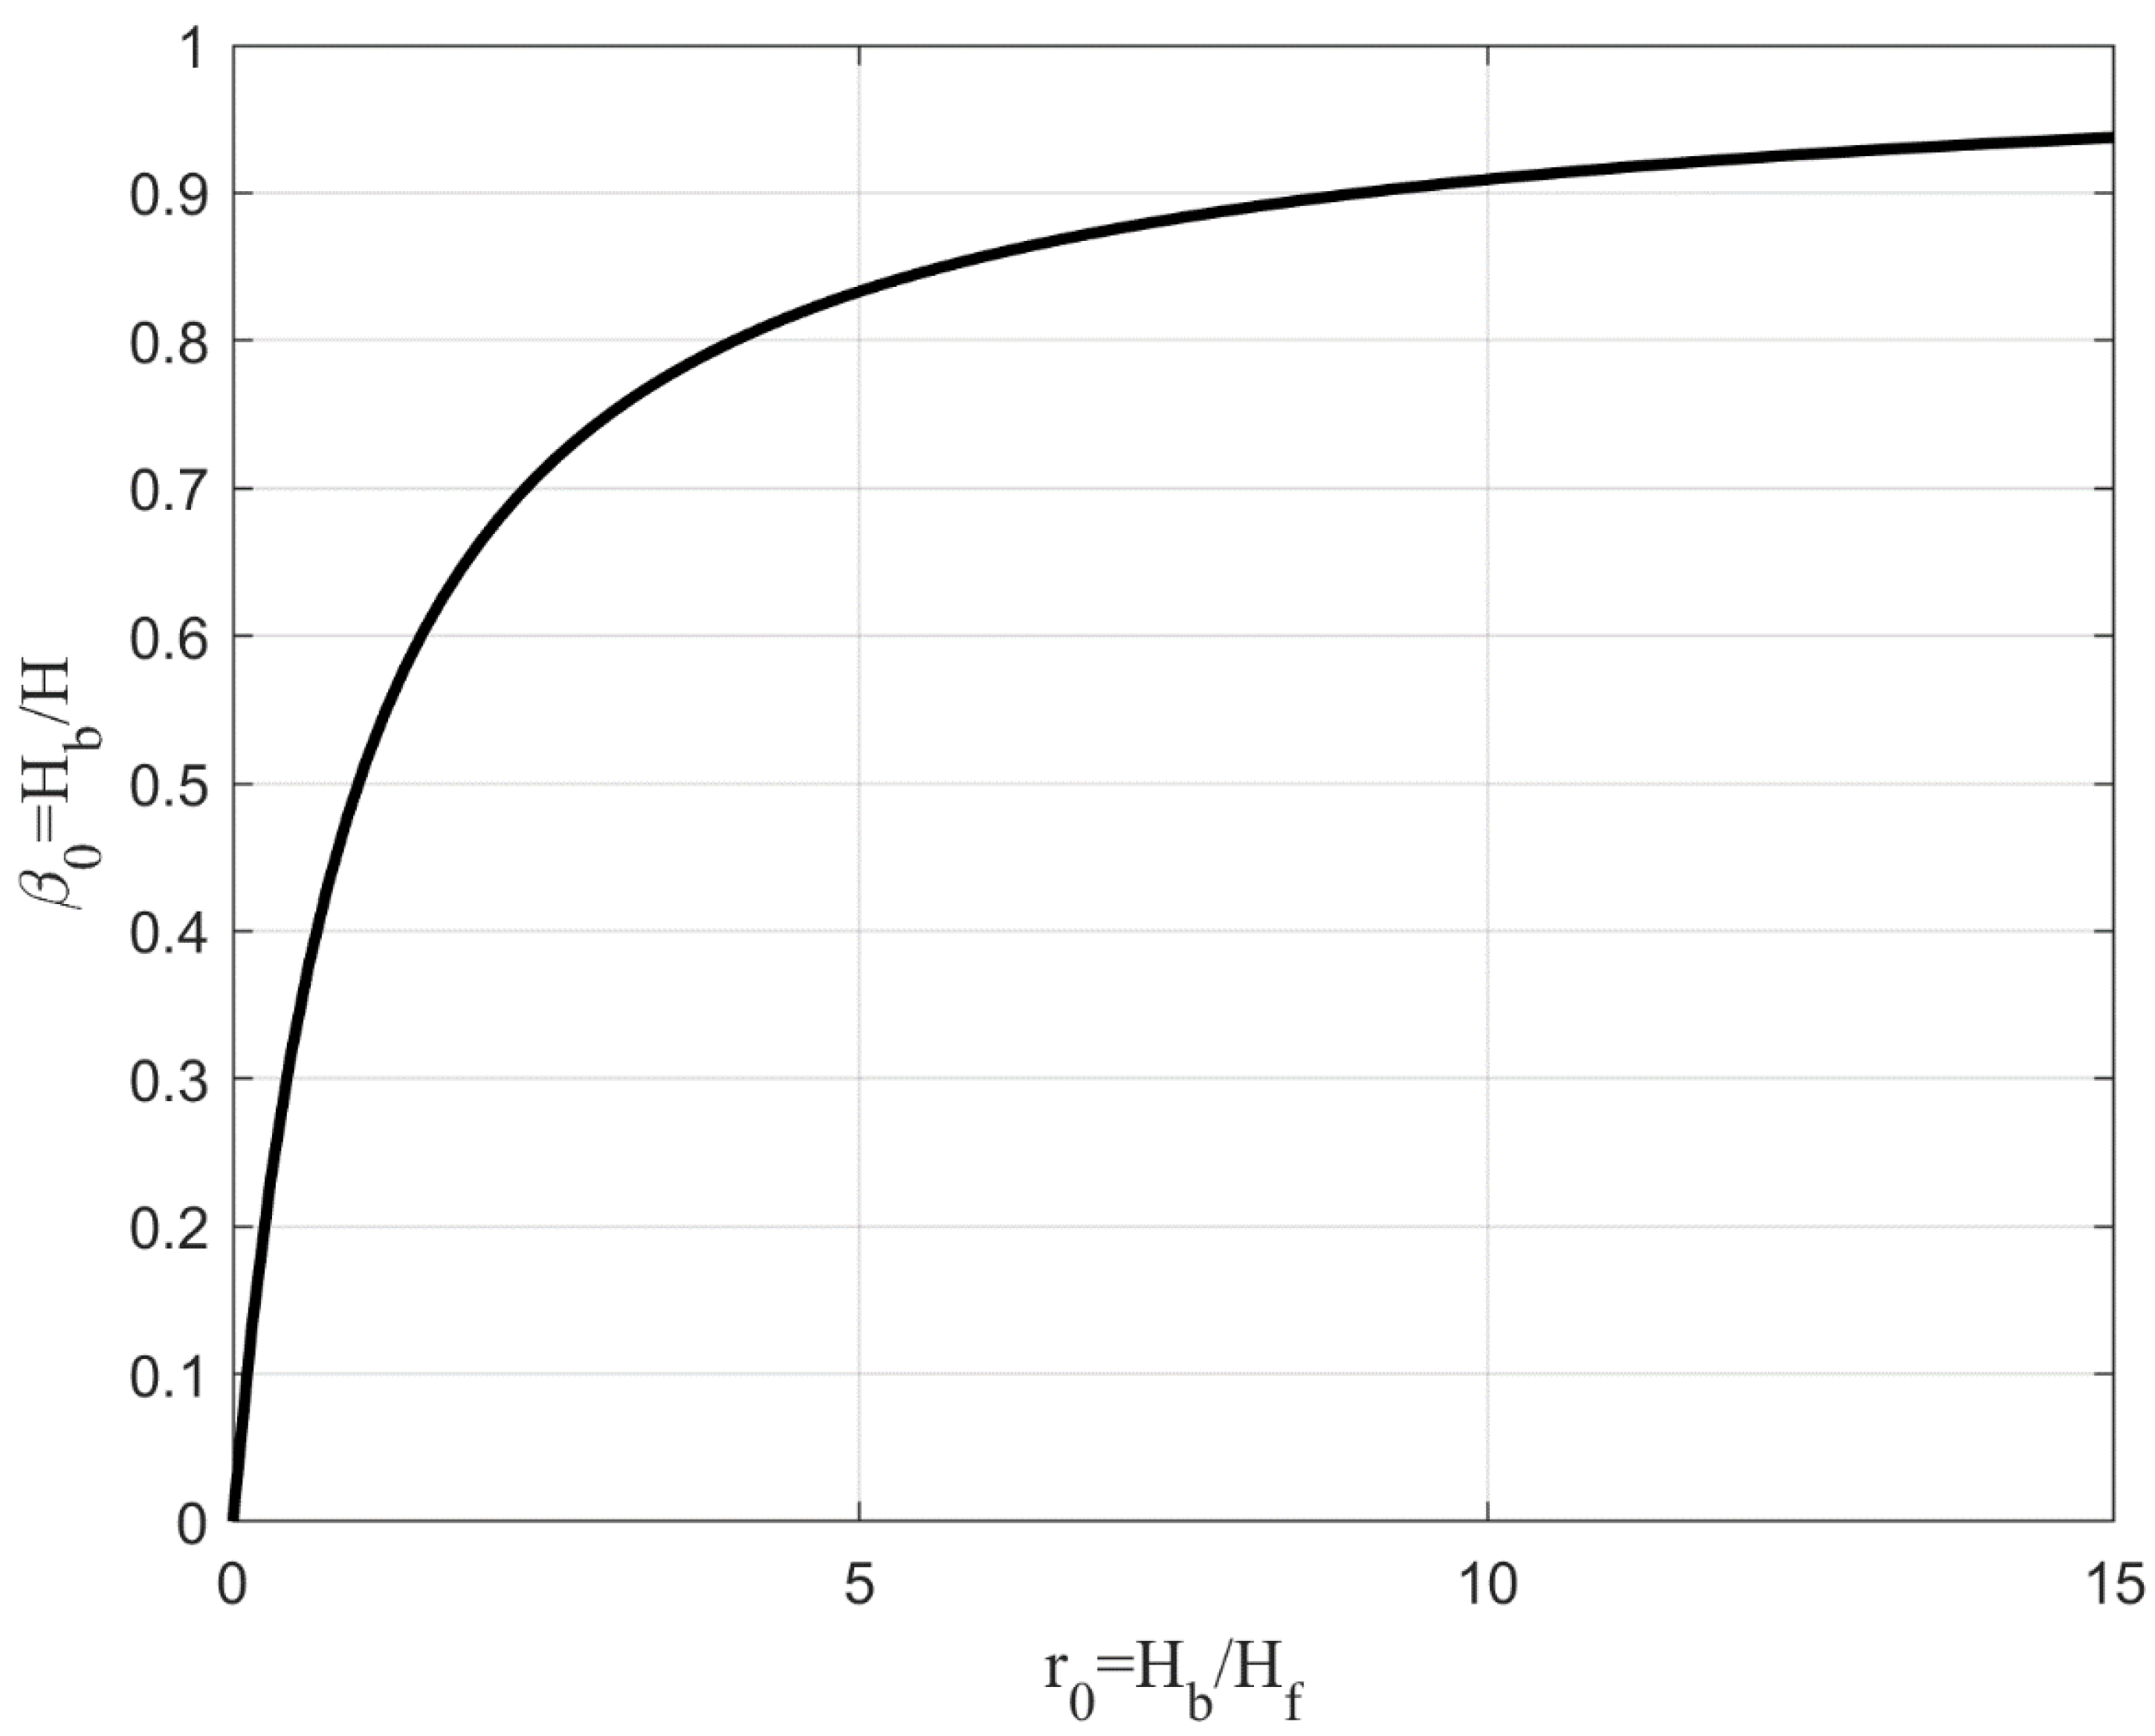
Figure 14 presents the relationship between βo and by using equations (1), (3) & (5) for different conditions. βo = / equation represents the proportion of the total lateral force that is resisted by the braces in a braced frame. It denotes the relative contribution of braces to the overall lateral resistance. = / represents the ratio of brace strength to the strength of the frame (beam-column system). It quantifies the strength of the bracing system in comparison to an unbraced moment-resisting frame.
The key observations from the plot is an asymptotic behavior as () approaches infinity, (βo) approaches a limit. This indicates that when the bracing system is significantly stronger than the frame, it effectively resists nearly all lateral forces, meaning that the braces dominate the lateral resistance. Conversely, as () approaches zero, (βo) approaches zero as well. This implies that if the braces are very weak compared to the frame, the frame will carry almost all of the lateral forces by itself. At small values of r₀ (e.g., 0 to 5), β₀ increases quickly. A modest increase in brace strength significantly enhances the lateral force contribution of the bracing system. When r₀ exceeds 5, the β₀ curve begins to flatten. Increasing brace strength beyond this point leads to smaller gains in lateral resistance contribution, indicating diminishing structural benefits.
The analysis helps determine how much strengthening of braces is necessary to achieve the desired level of lateral force resistance from the bracing system which presents an interpretation in structural design. For example: To ensure that the braces carry 80% of lateral forces (β₀ = 0.8), the required r₀ is approximately 4. If we want to increase this to 90% (β₀ = 0.9), r₀ must be raised to about 9, which is more than double the value needed for just a 10% increase in lateral force capacity. This is crucial for performance-based design, where specific deformation modes or ductility mechanisms are targeted. And also retrofitting point of view to balance brace efficiency with economic or architectural constraints. Here, performance-based design, a method focused on achieving specific behavior under load, where engineers meticulously target deformation modes or ductility mechanisms to ensure safety and functionality. Again, retrofitting, where the challenge lies in harmonizing the efficiency of the braces with budgetary limitations and the architectural beauty of the existing structure. This delicate balance ensures that both safety and aesthetic values are preserved in the design.
6. Conclusions
Chevron-braced frame (CBF) systems are a commonly used lateral force-resisting system in seismic design due to their ability to provide substantial stiffness and strength to steel structures. Their configuration, consisting of diagonal braces meeting at a beam's midspan, offers architectural flexibility but introduces distinct seismic performance challenges. These include the susceptibility of braces to buckling under compression, unbalanced vertical forces on the beam following brace yielding, and the development of plastic hinges in beam, which can compromise structural integrity if not properly addressed.
This seismic design review highlights the importance of addressing these challenges through appropriate decomposition, capacity design principles, and modern analytical methods. Special attention is given to post-buckling behavior, load redistribution mechanisms, and the need for ductility and energy dissipation under loading. Design codes and research advancements continue to evolve, aiming to improve the reliability and performance of CBF systems during strong ground motions. Overall, the review emphasizes that a thorough understanding of the complex seismic behavior of chevron-braced frames is essential to ensure safe, resilient, and code-compliant structural designs.
Data Availability Statement
All data that support the findings of this study are available from the corresponding author upon reasonable request.
Acknowledgments
The first author was supported by Japanese Government (Ministry of Education, Culture, Sports, Science and Technology-Japan, or MEXT) scholarship. The opinions expressed in this paper are those of the authors and do not necessarily reflect the views of the organizations and individuals mentioned herein.
References
- Shibata, M.; Wakabayashi, M. Experimental study on the hysteretic behavior of k-type braced frame subjected to repeat load. Transactions Architectural Institute of Japan 1983, 326, 10–16. [Google Scholar] [CrossRef] [PubMed]
- Yamanouchi, H.; Midorikawa, M.; Nishiyama, I.; Watabe, M. Seismic behavior of full-scale concentrically braced steel building structure. Journal of Structural Engineering 1989, 115, 1917–1929. [Google Scholar] [CrossRef]
- Fukuta, T.; Yamanouchi, H. Ultimate lateral shear capacity of steel chevron frames with inverted V braces. Journal of Structural and Constructional Engineering, Architectural Institute of Japan 1989, 398, 99–106. [Google Scholar] [CrossRef]
- Inoue, K.; Shimizu, N. Plastic collapse load of steel braced frames subjected to horizontal force. Transactions Architectural Institute of Japan 1963, 388, 59–69. [Google Scholar] [CrossRef]
- Khatib, I. F.; Mahin, S. A.; Pister, K.S. Seismic behavior of concentrically braced steel frames. in: UCB/EERC-88/01, Earthquake Engineering Research Center, Berkeley, CA 1988.
- Tremblay, R.; Robert, N. Seismic performance of low- and medium-rise chevron braced steel frames. Canadian Journal of Civil Engineering 2001, 28, 699–714. [Google Scholar] [CrossRef]
- AISC, Seismic provisions for structural steel buildings. in: ANSI/AISC Standard 341-10, American Institute of Steel Construction, (AISC), Chicago, Illinois, U.S.A. 2022.
- MLIT, Commentary on Structural Regulations of the Building Design Standard Law of Japan. Ministry of Land, Infrastructure, Transport and Tourism, [In Japanese.] Tokyo, Japan: Official Gazzete Co-operation of Japan. 2020.
- Seki, A.; Inoue, K.; Okazaki, T.; Hashioka, S.; Asada, H. Seismic performance of steel chevron braced frames designed according to Japanese practice. Journal of Constructional Steel Research 2022, 189, 107066. [Google Scholar] [CrossRef]
- Dias, I.; Seki, A.; Okazaki, T. Numerical simulation of the cyclic-loading behavior of steel chevron-braced moment-resisting frames. Jpn Archit Rev 2023, 6, e12326. [Google Scholar] [CrossRef]
Figure 1.
Mechanical behavior of the CBFs: (a) Strong-Beam Mechanism, and (b) Weak-Beam Mechanism.
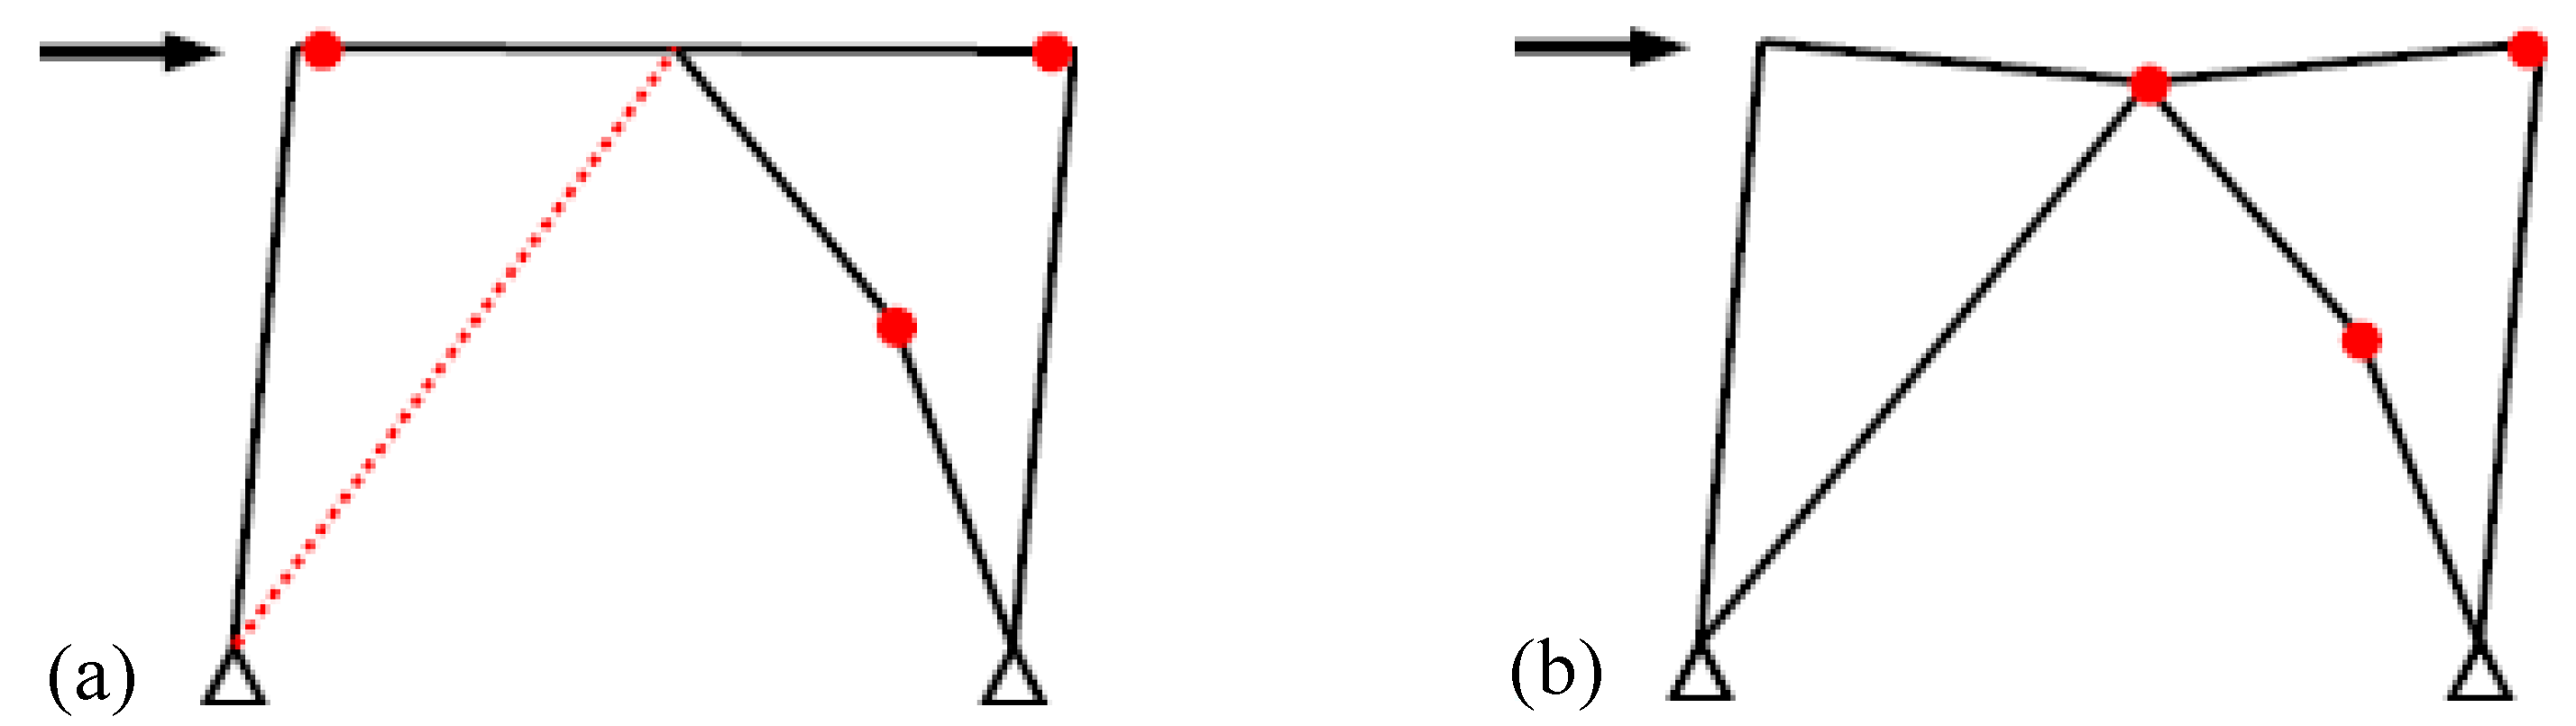
Figure 2.
Decomposition of lateral force resistance in a braced frame system.
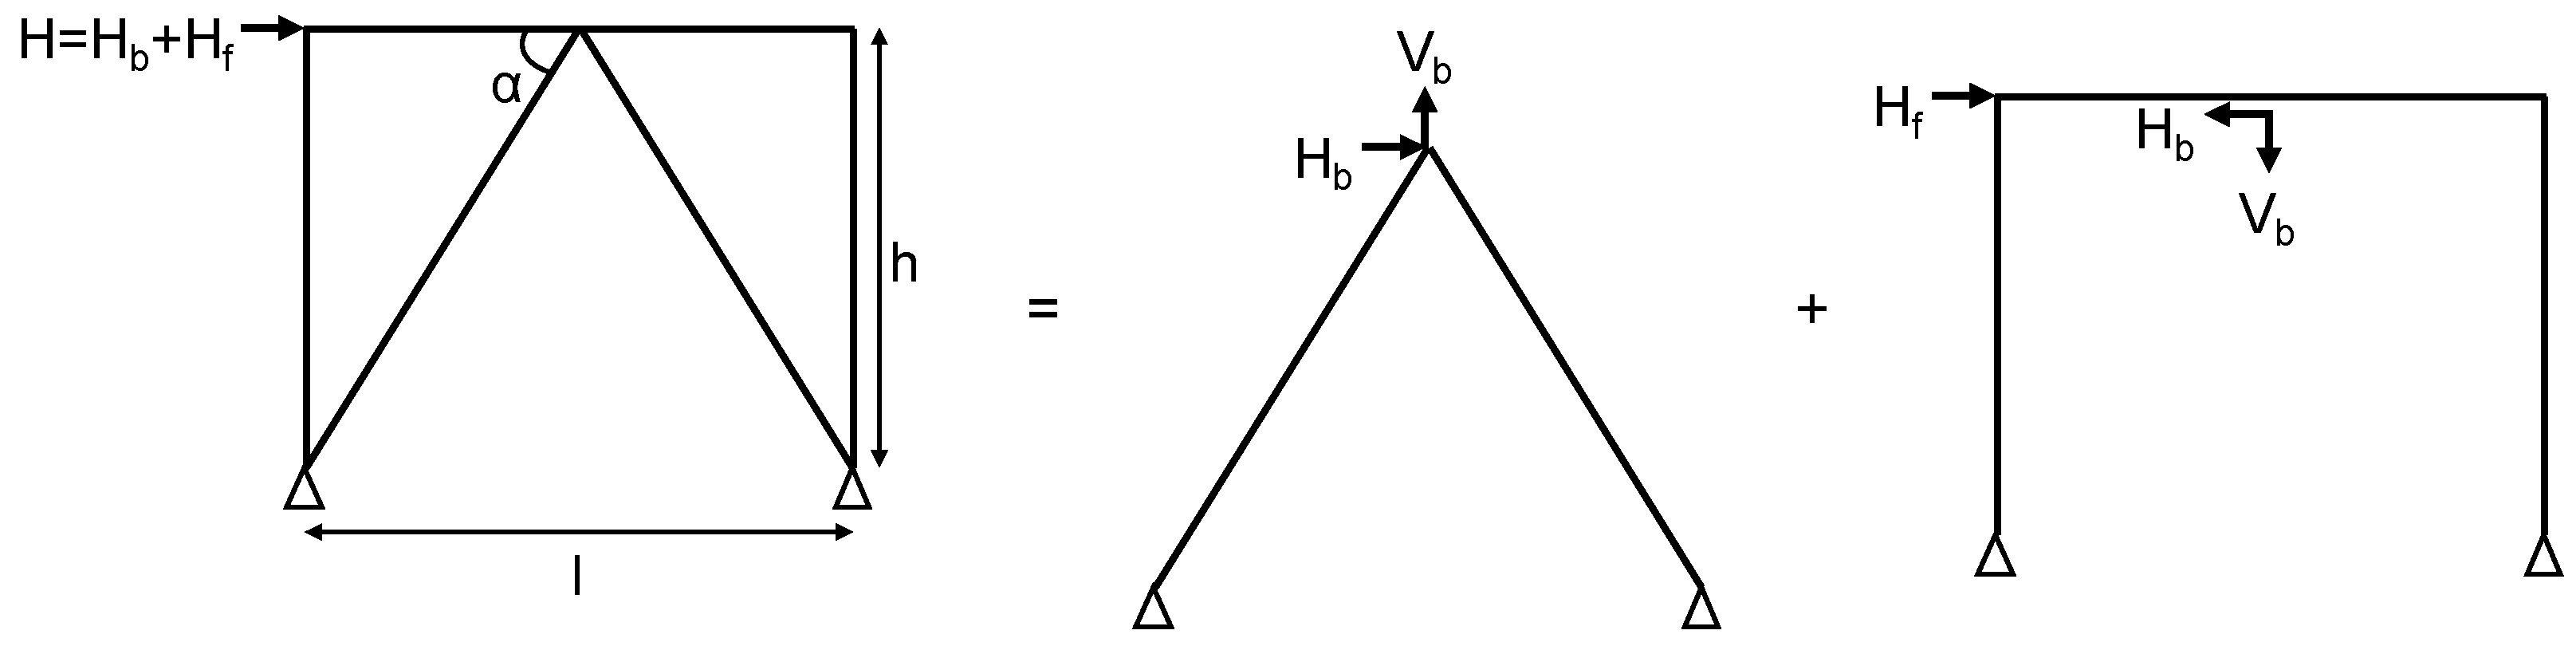
Figure 3.
Lateral force resistance in braced frame under strong beam mechanism.
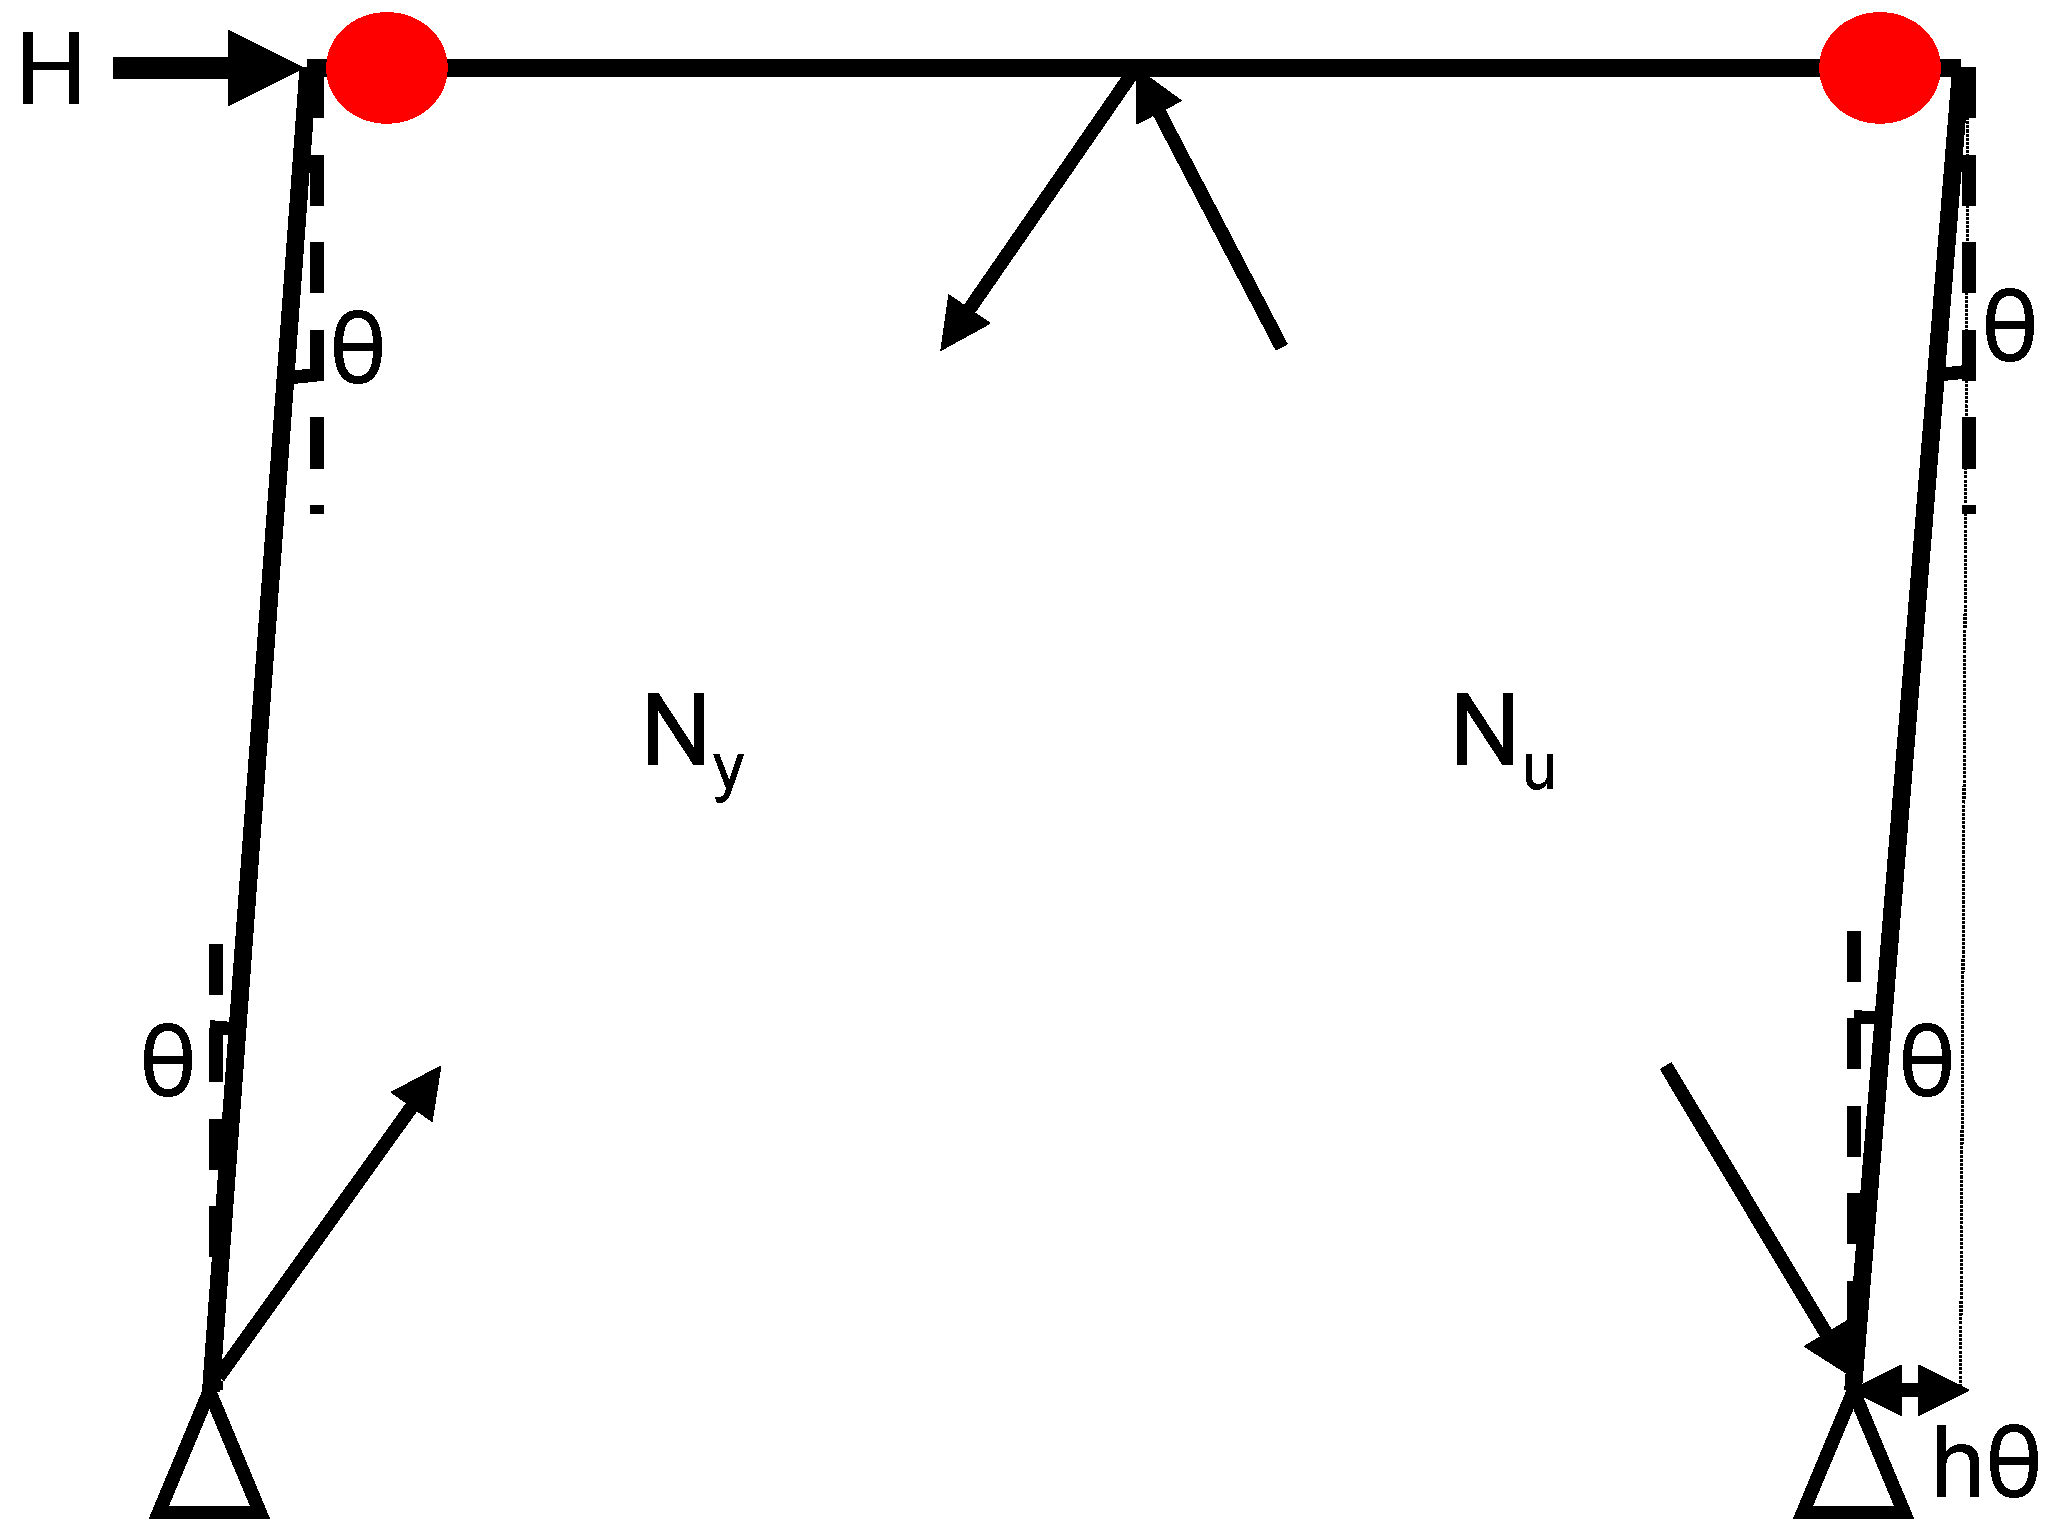
Figure 4.
Lateral force resistance in frame under strong beam mechanism.
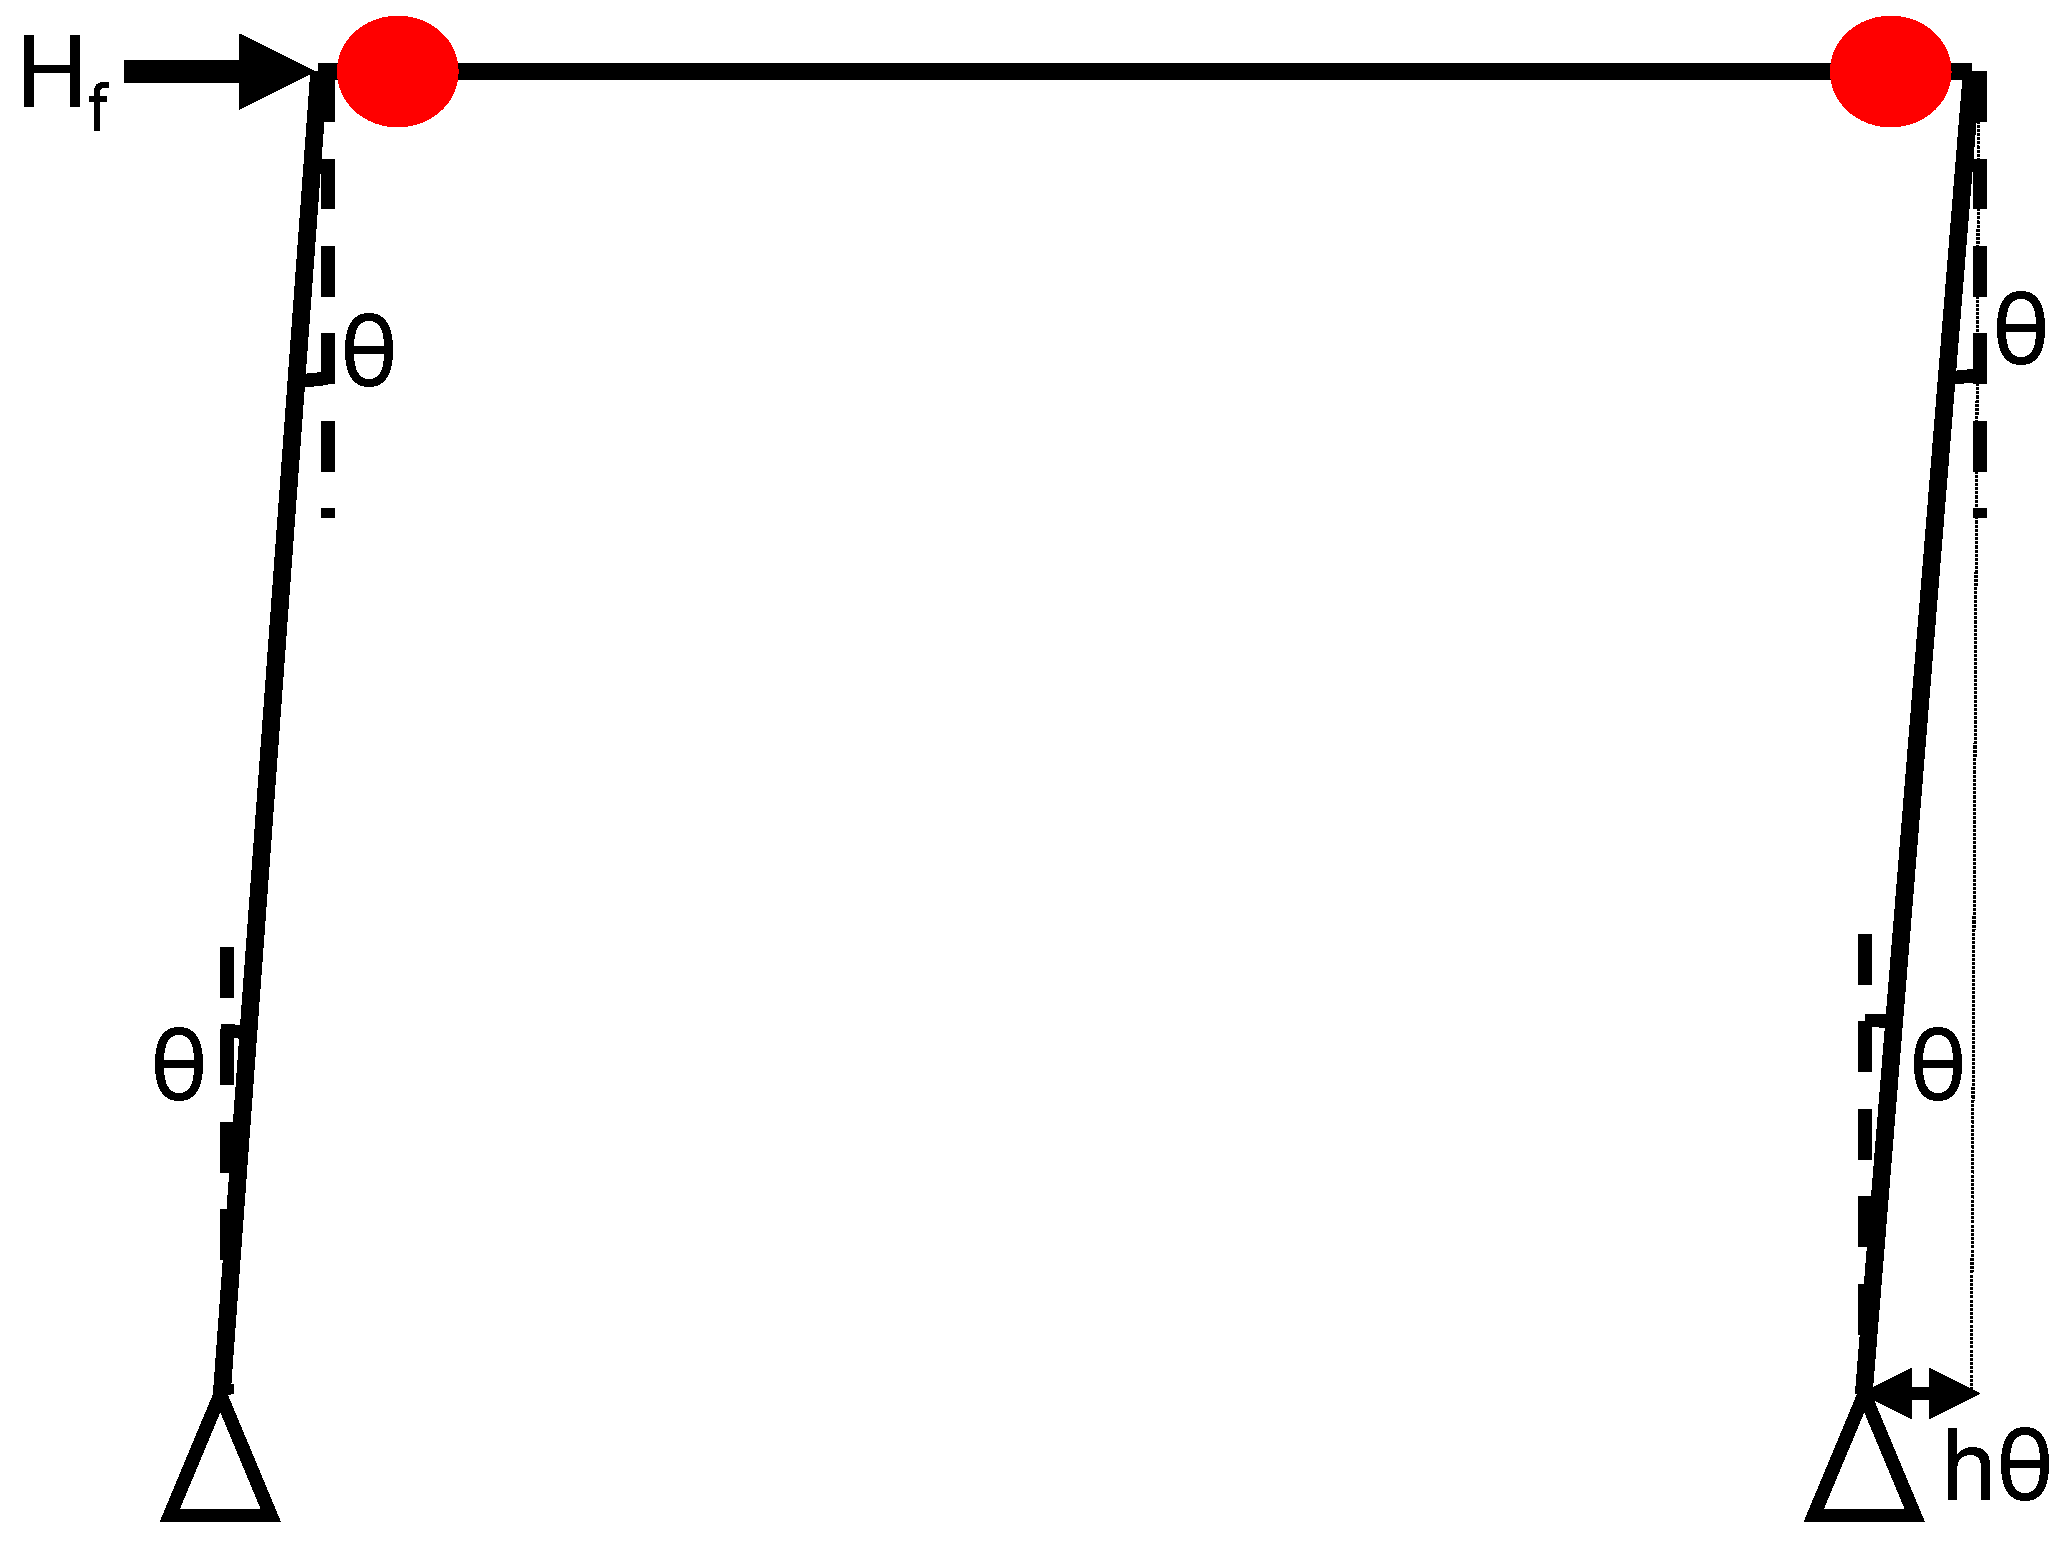
Figure 5.
Decomposition of lateral internal response in a braced frame system.
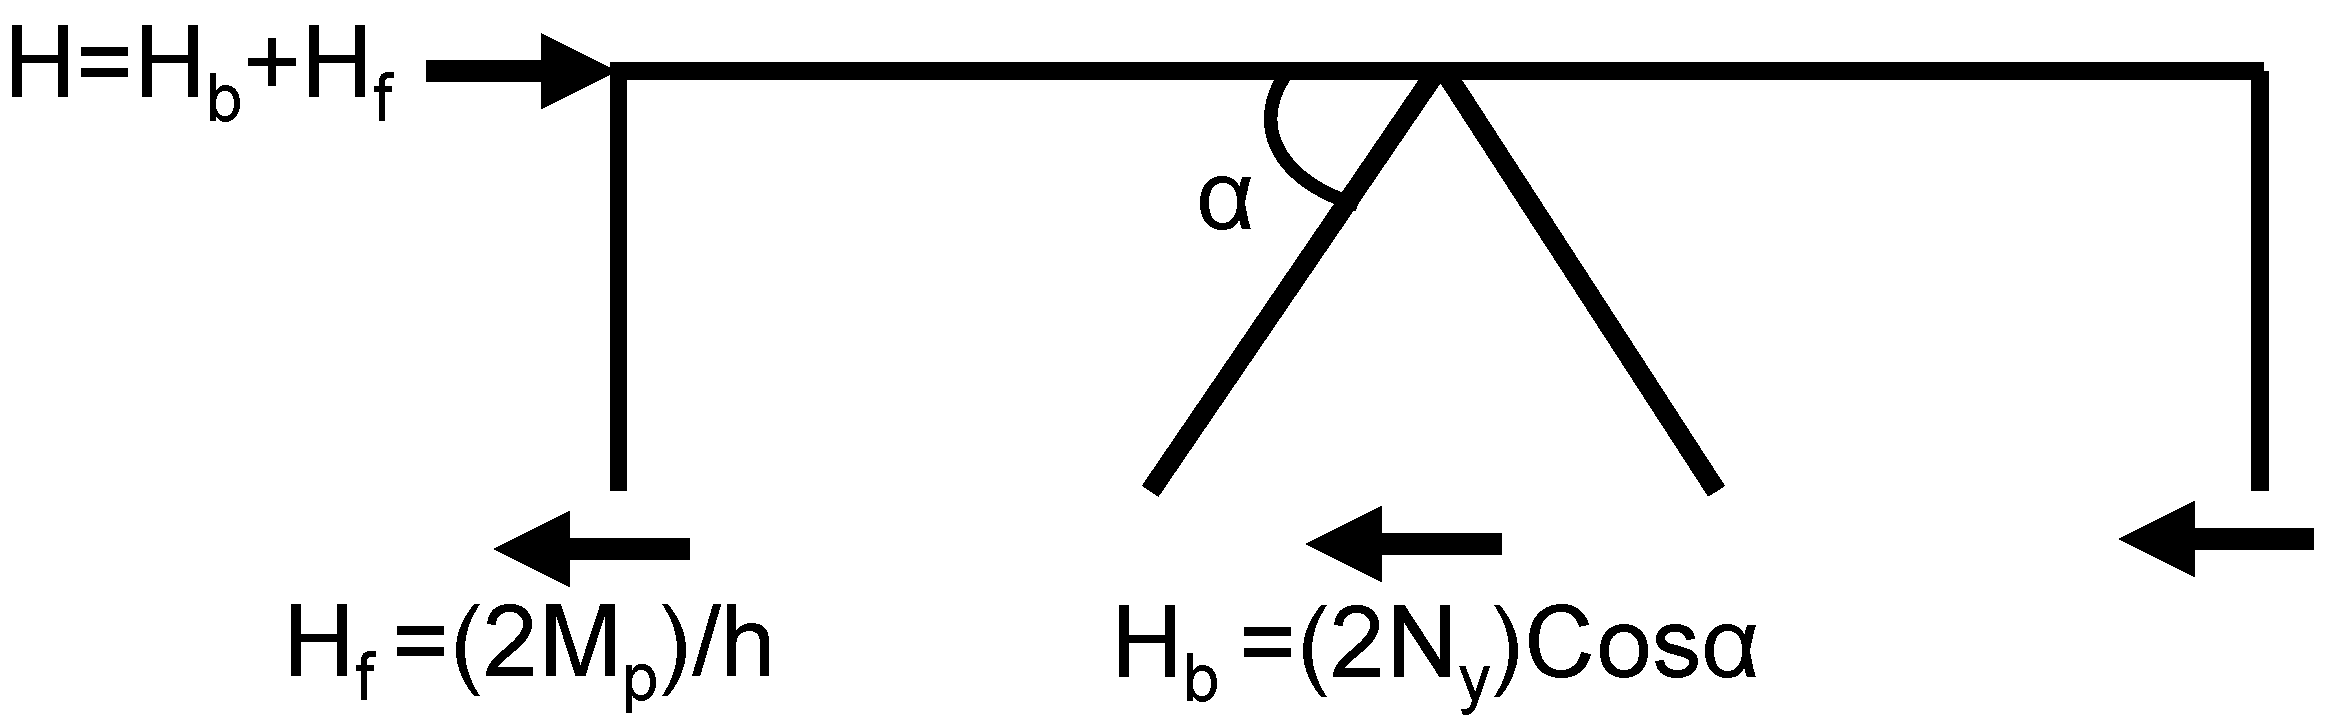
Figure 6.
Decomposition of lateral internal response in a braced frame system.
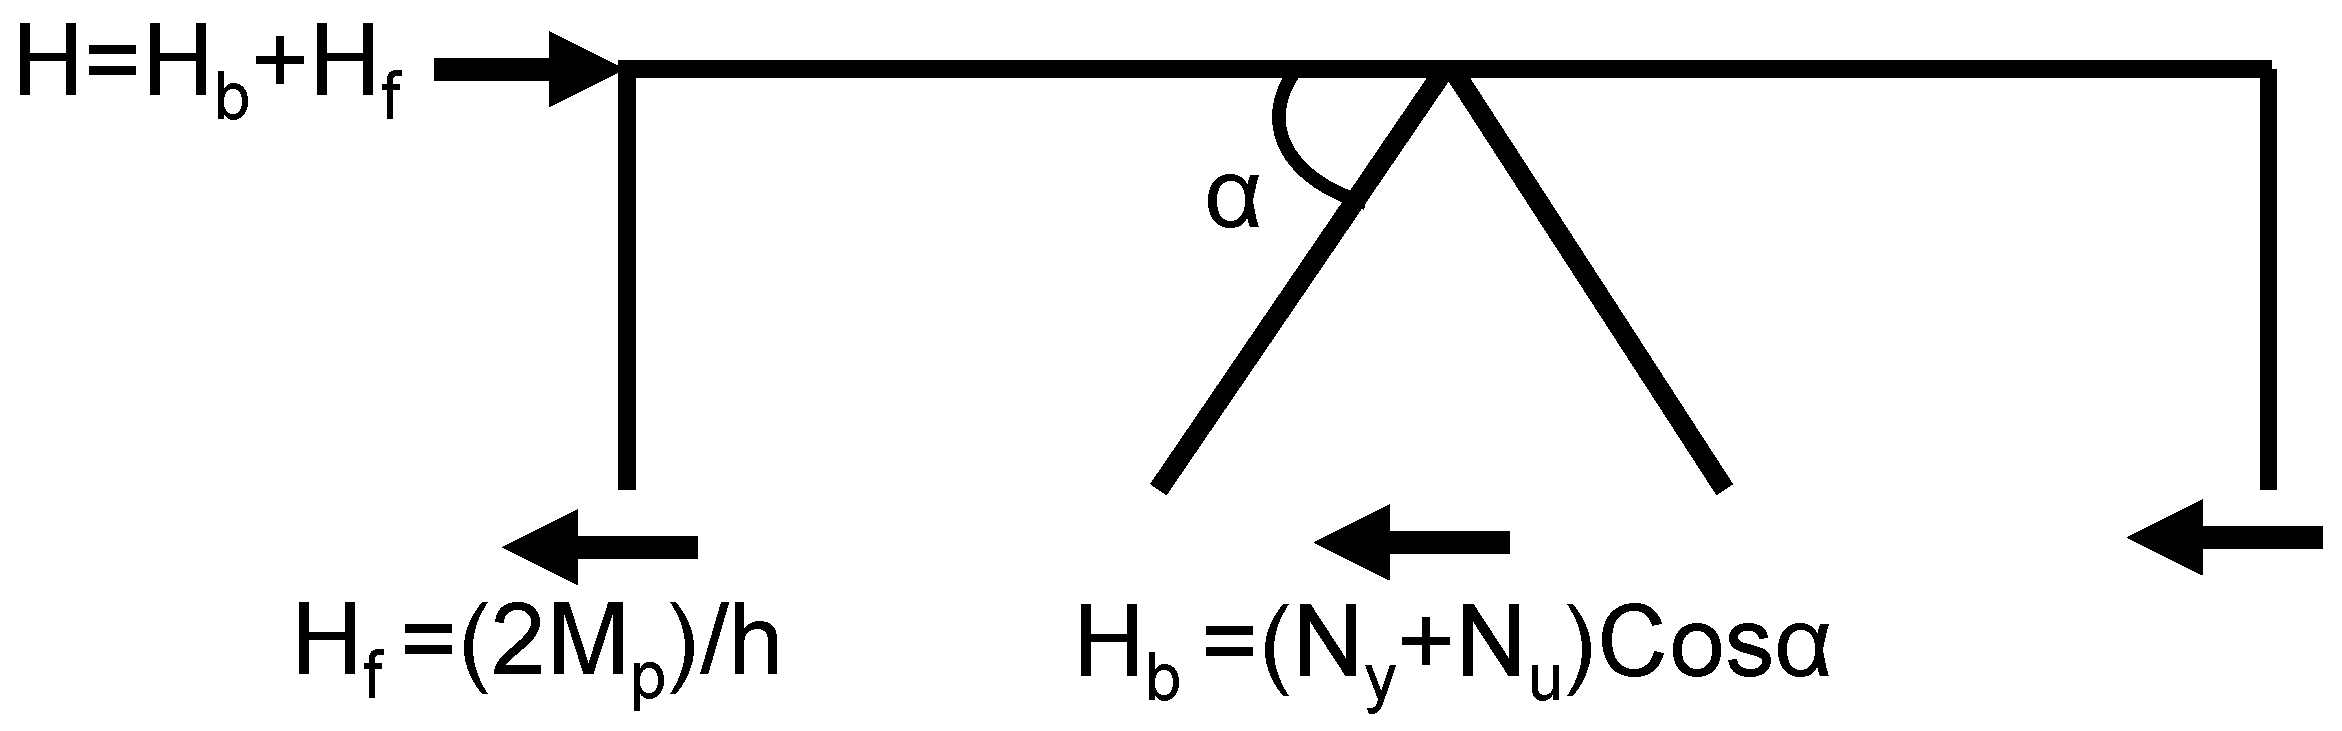
Figure 7.
Lateral force resistance in braced frame under weak beam mechanism.
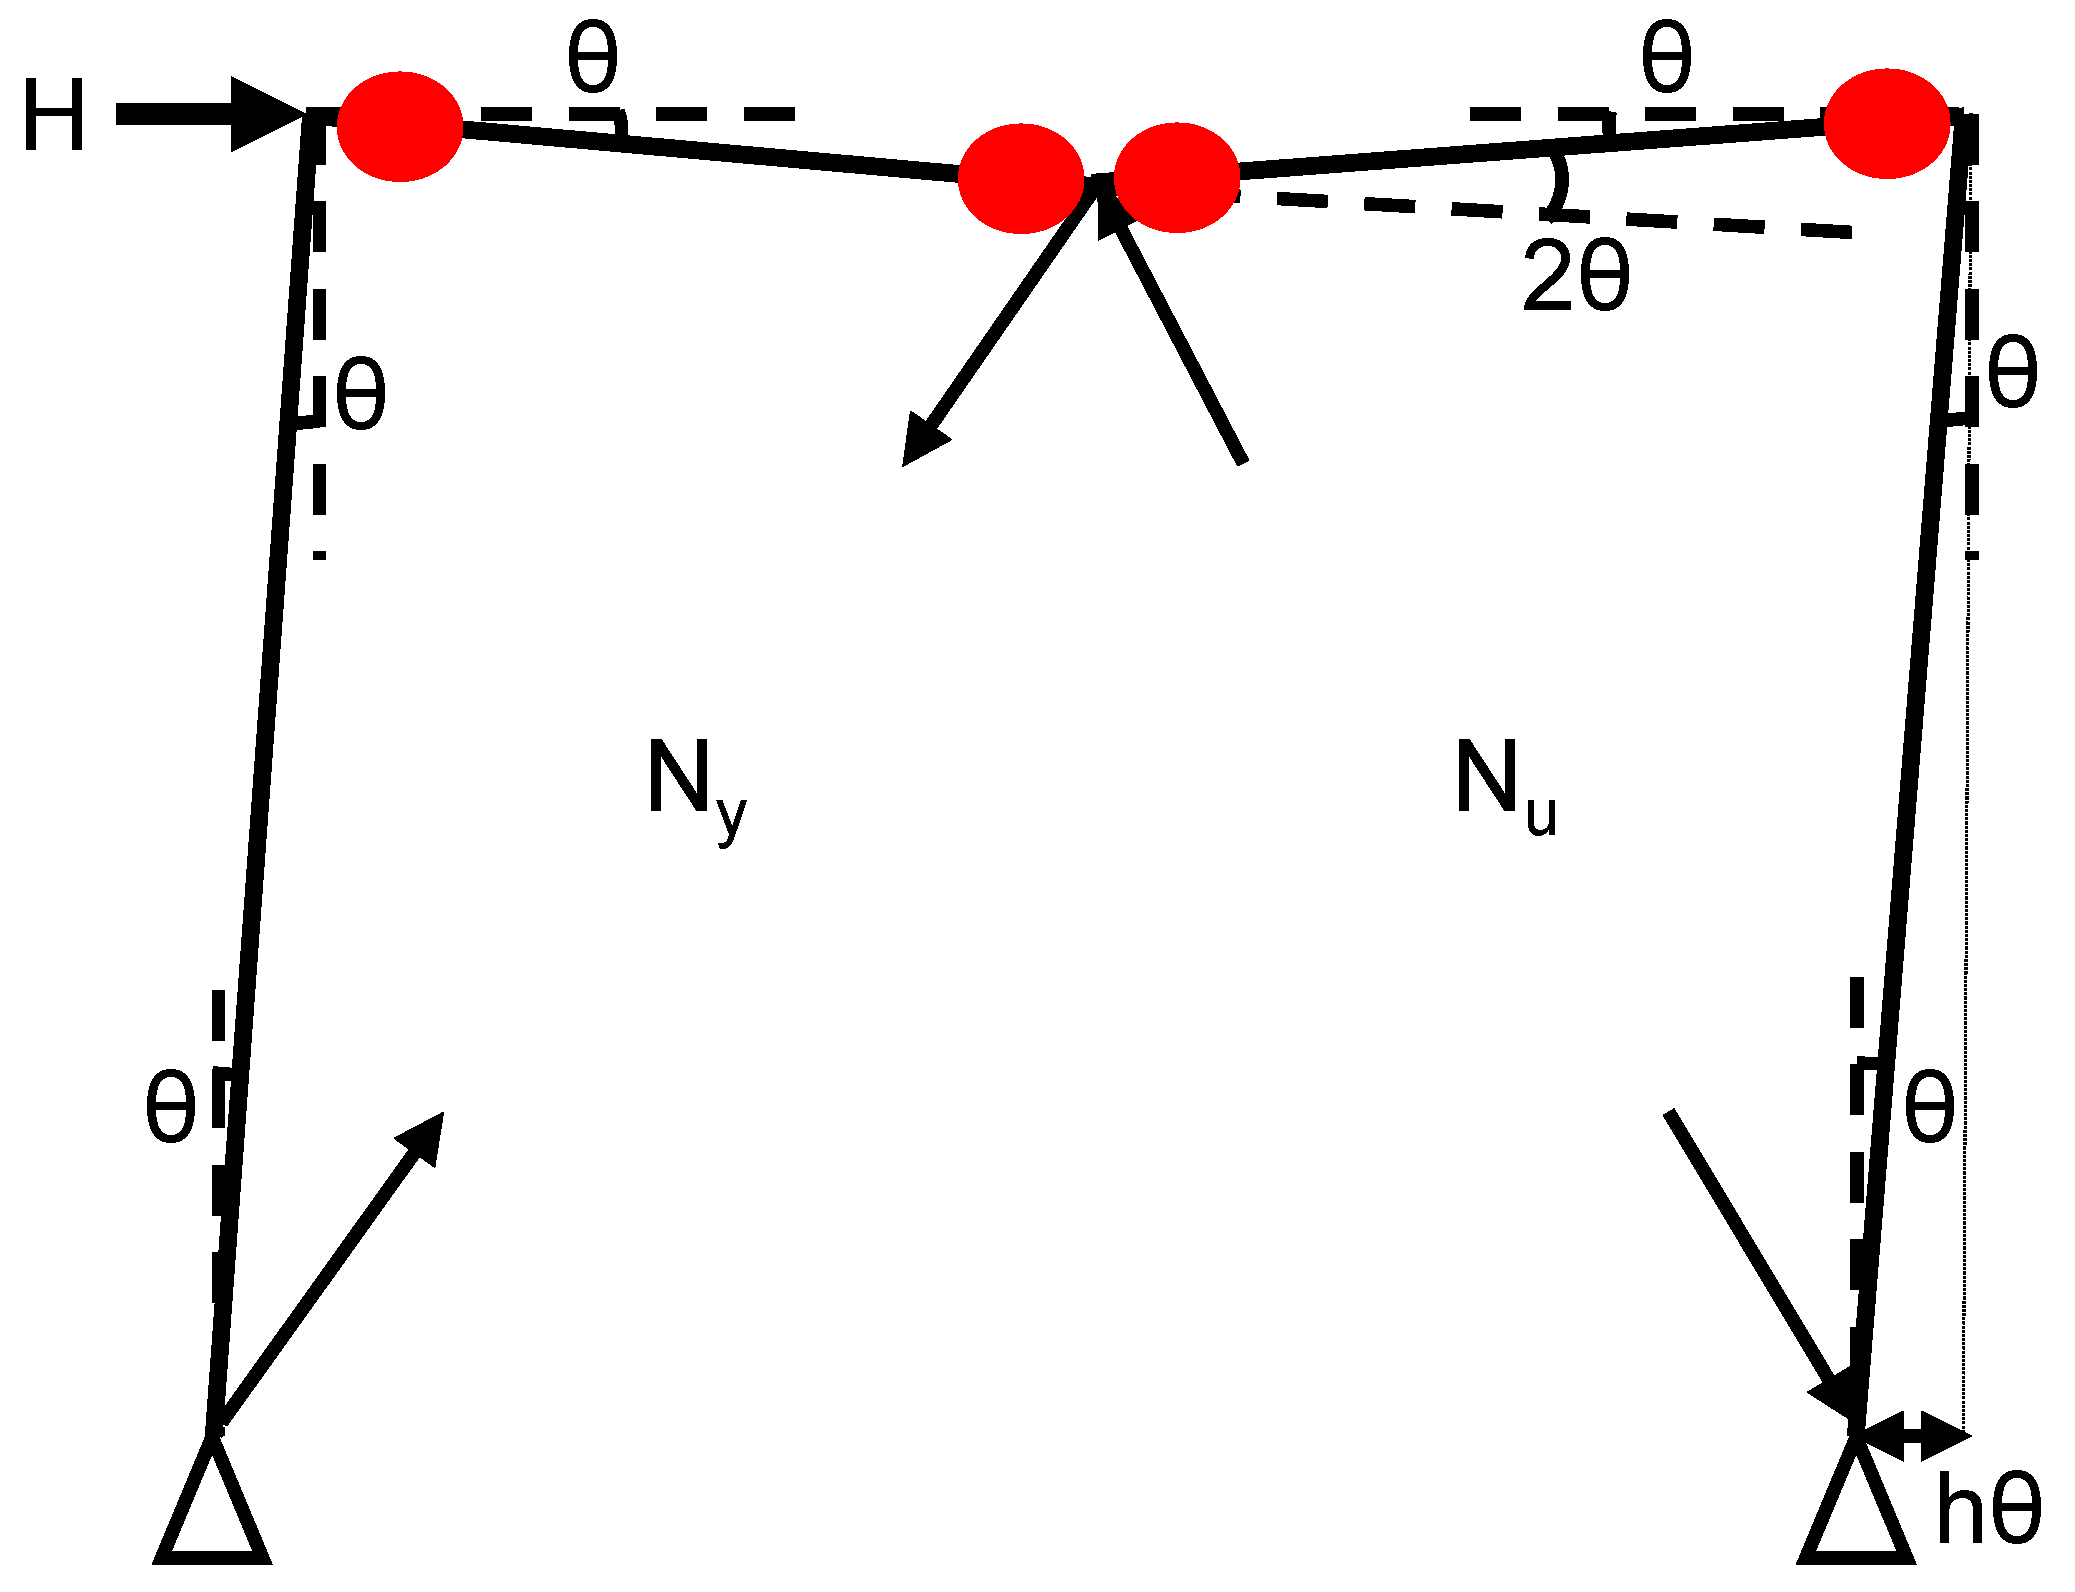
Figure 8.
Lateral force resistance in frame under weak beam mechanism.
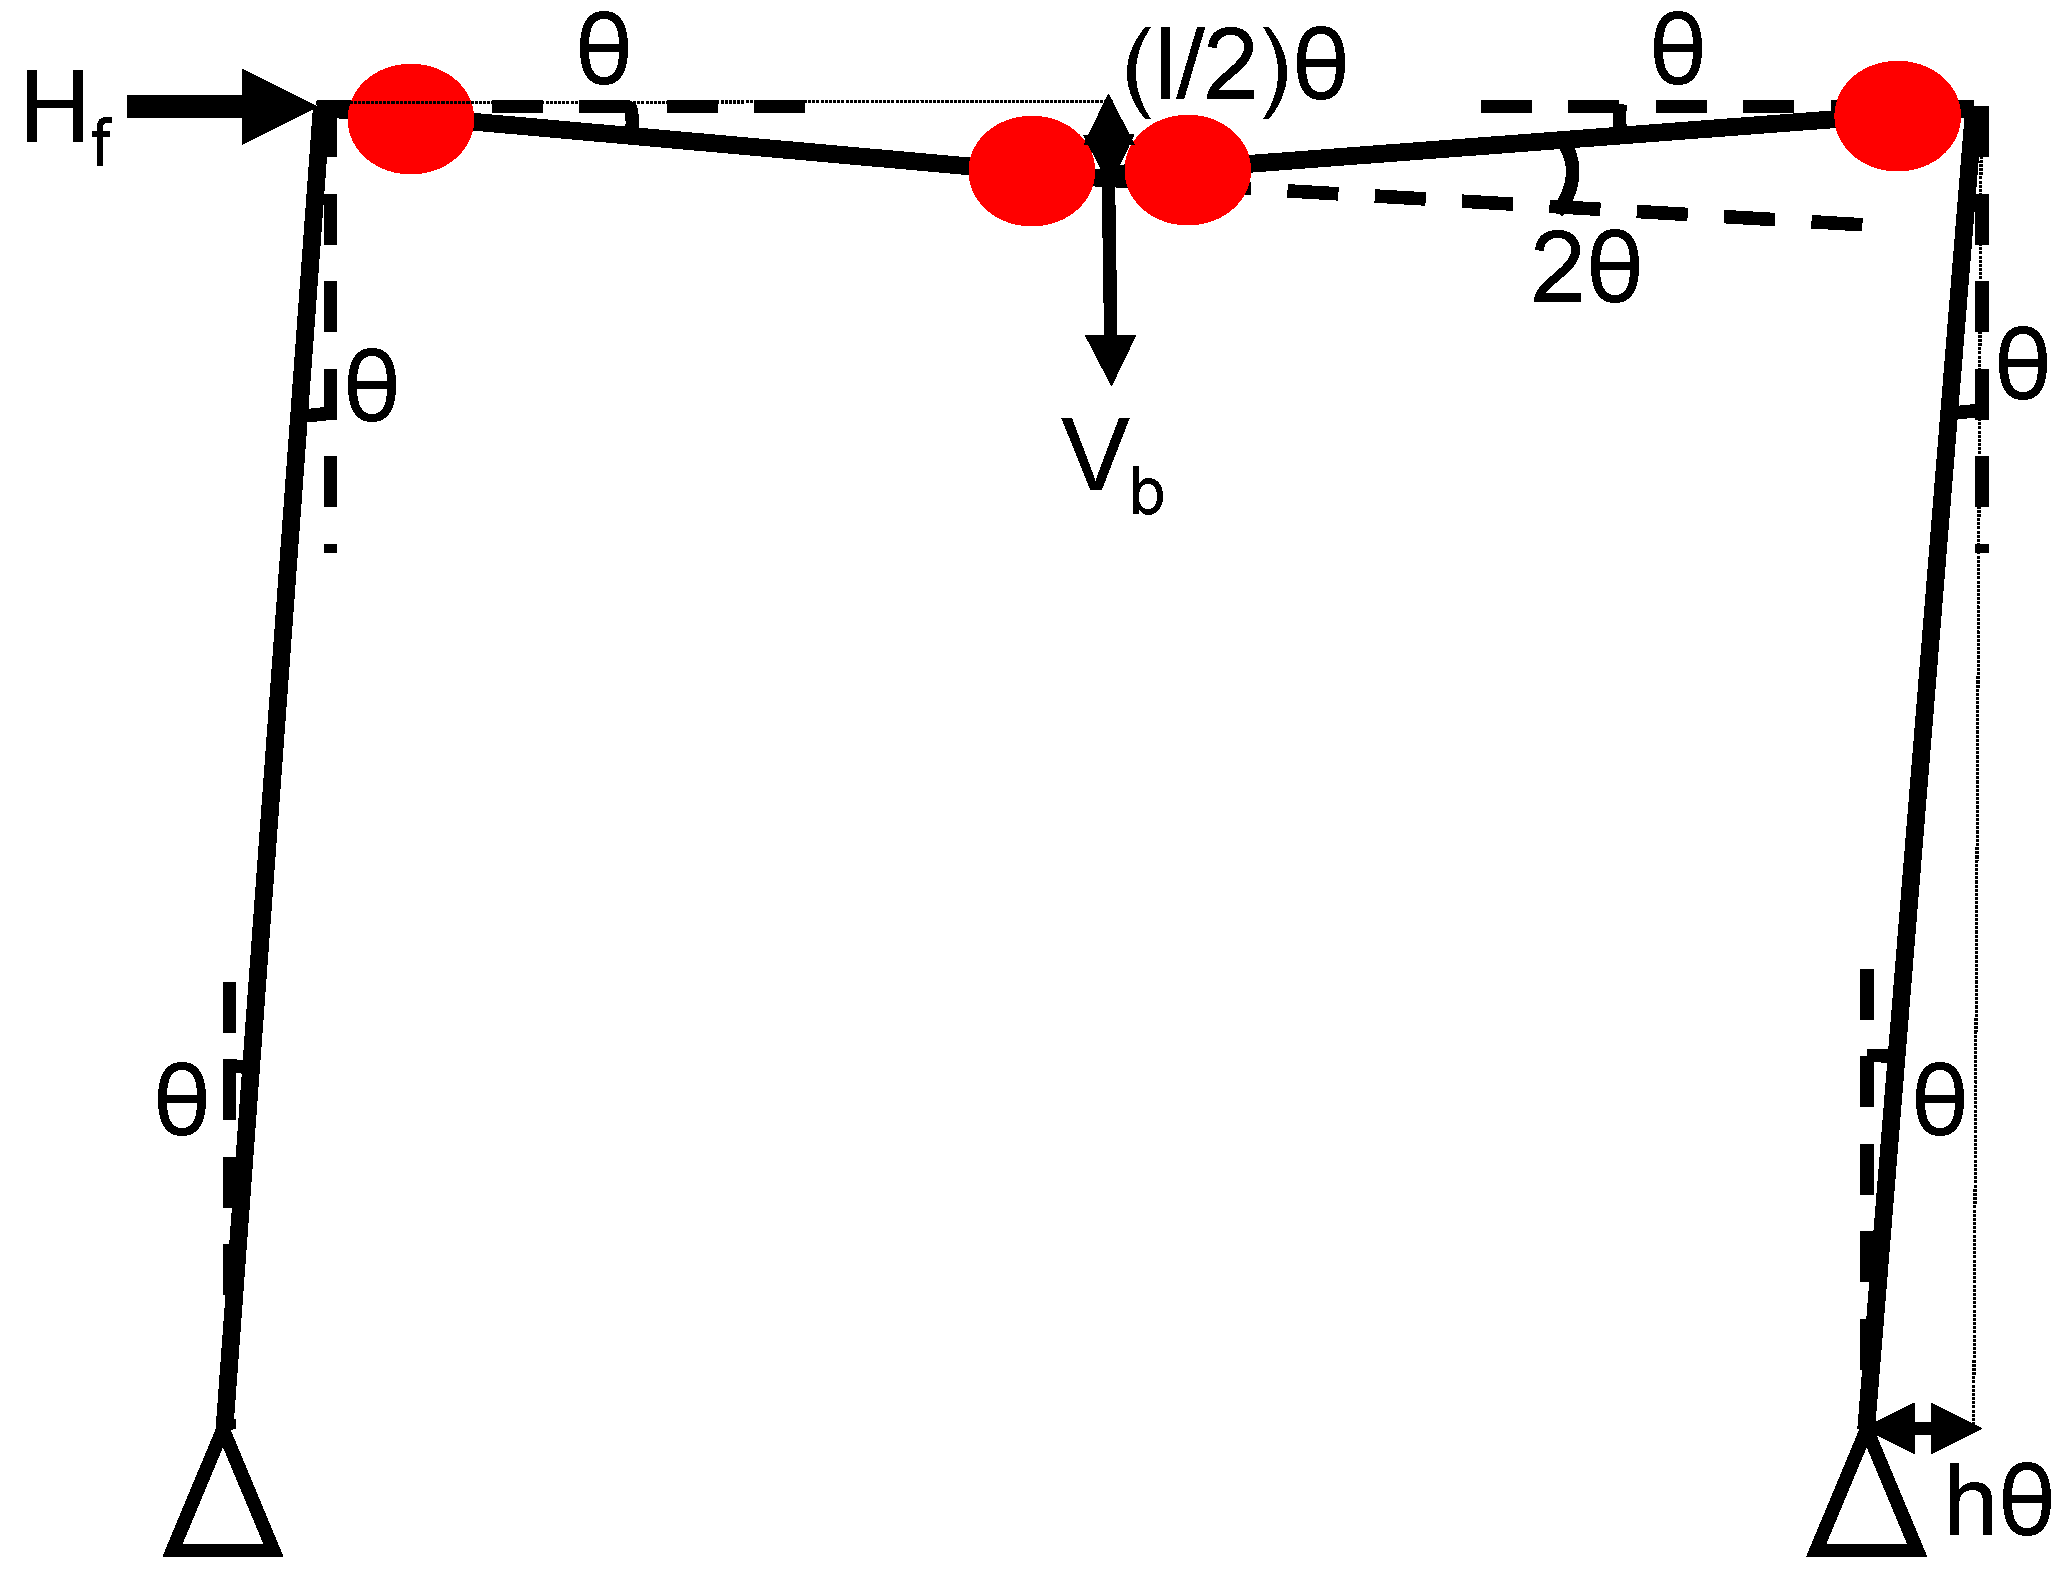
Figure 9.
Lateral force resistance in frame under weak beam mechanism when =1.0.
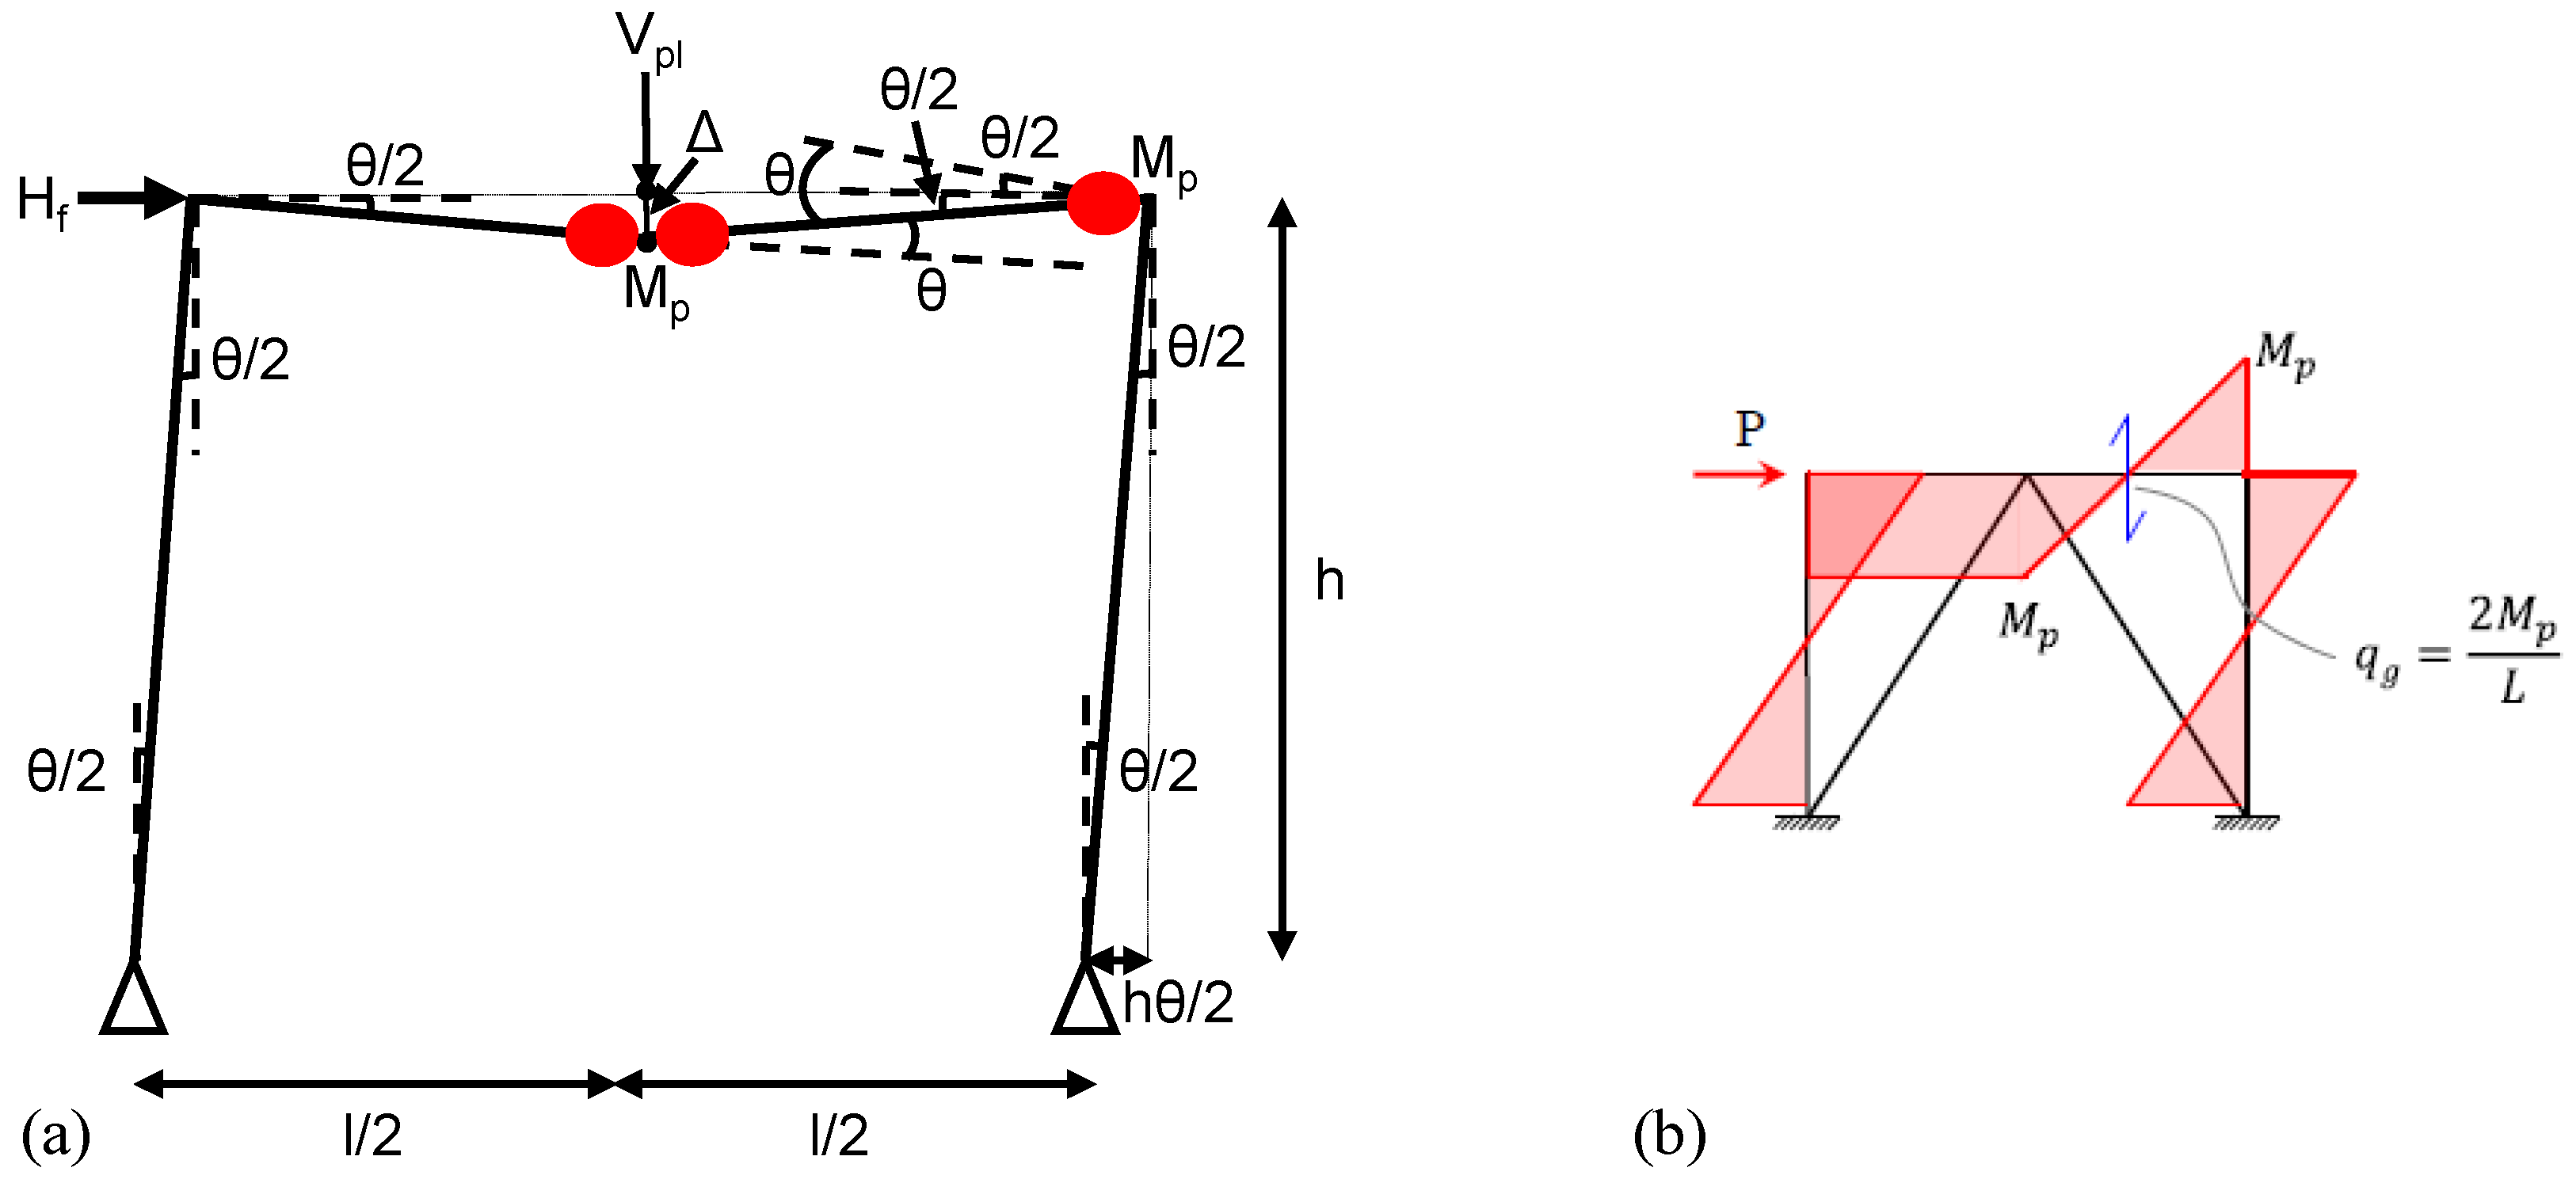
Figure 10.
Lateral force resistance in frame under weak beam mechanism when =1.5.
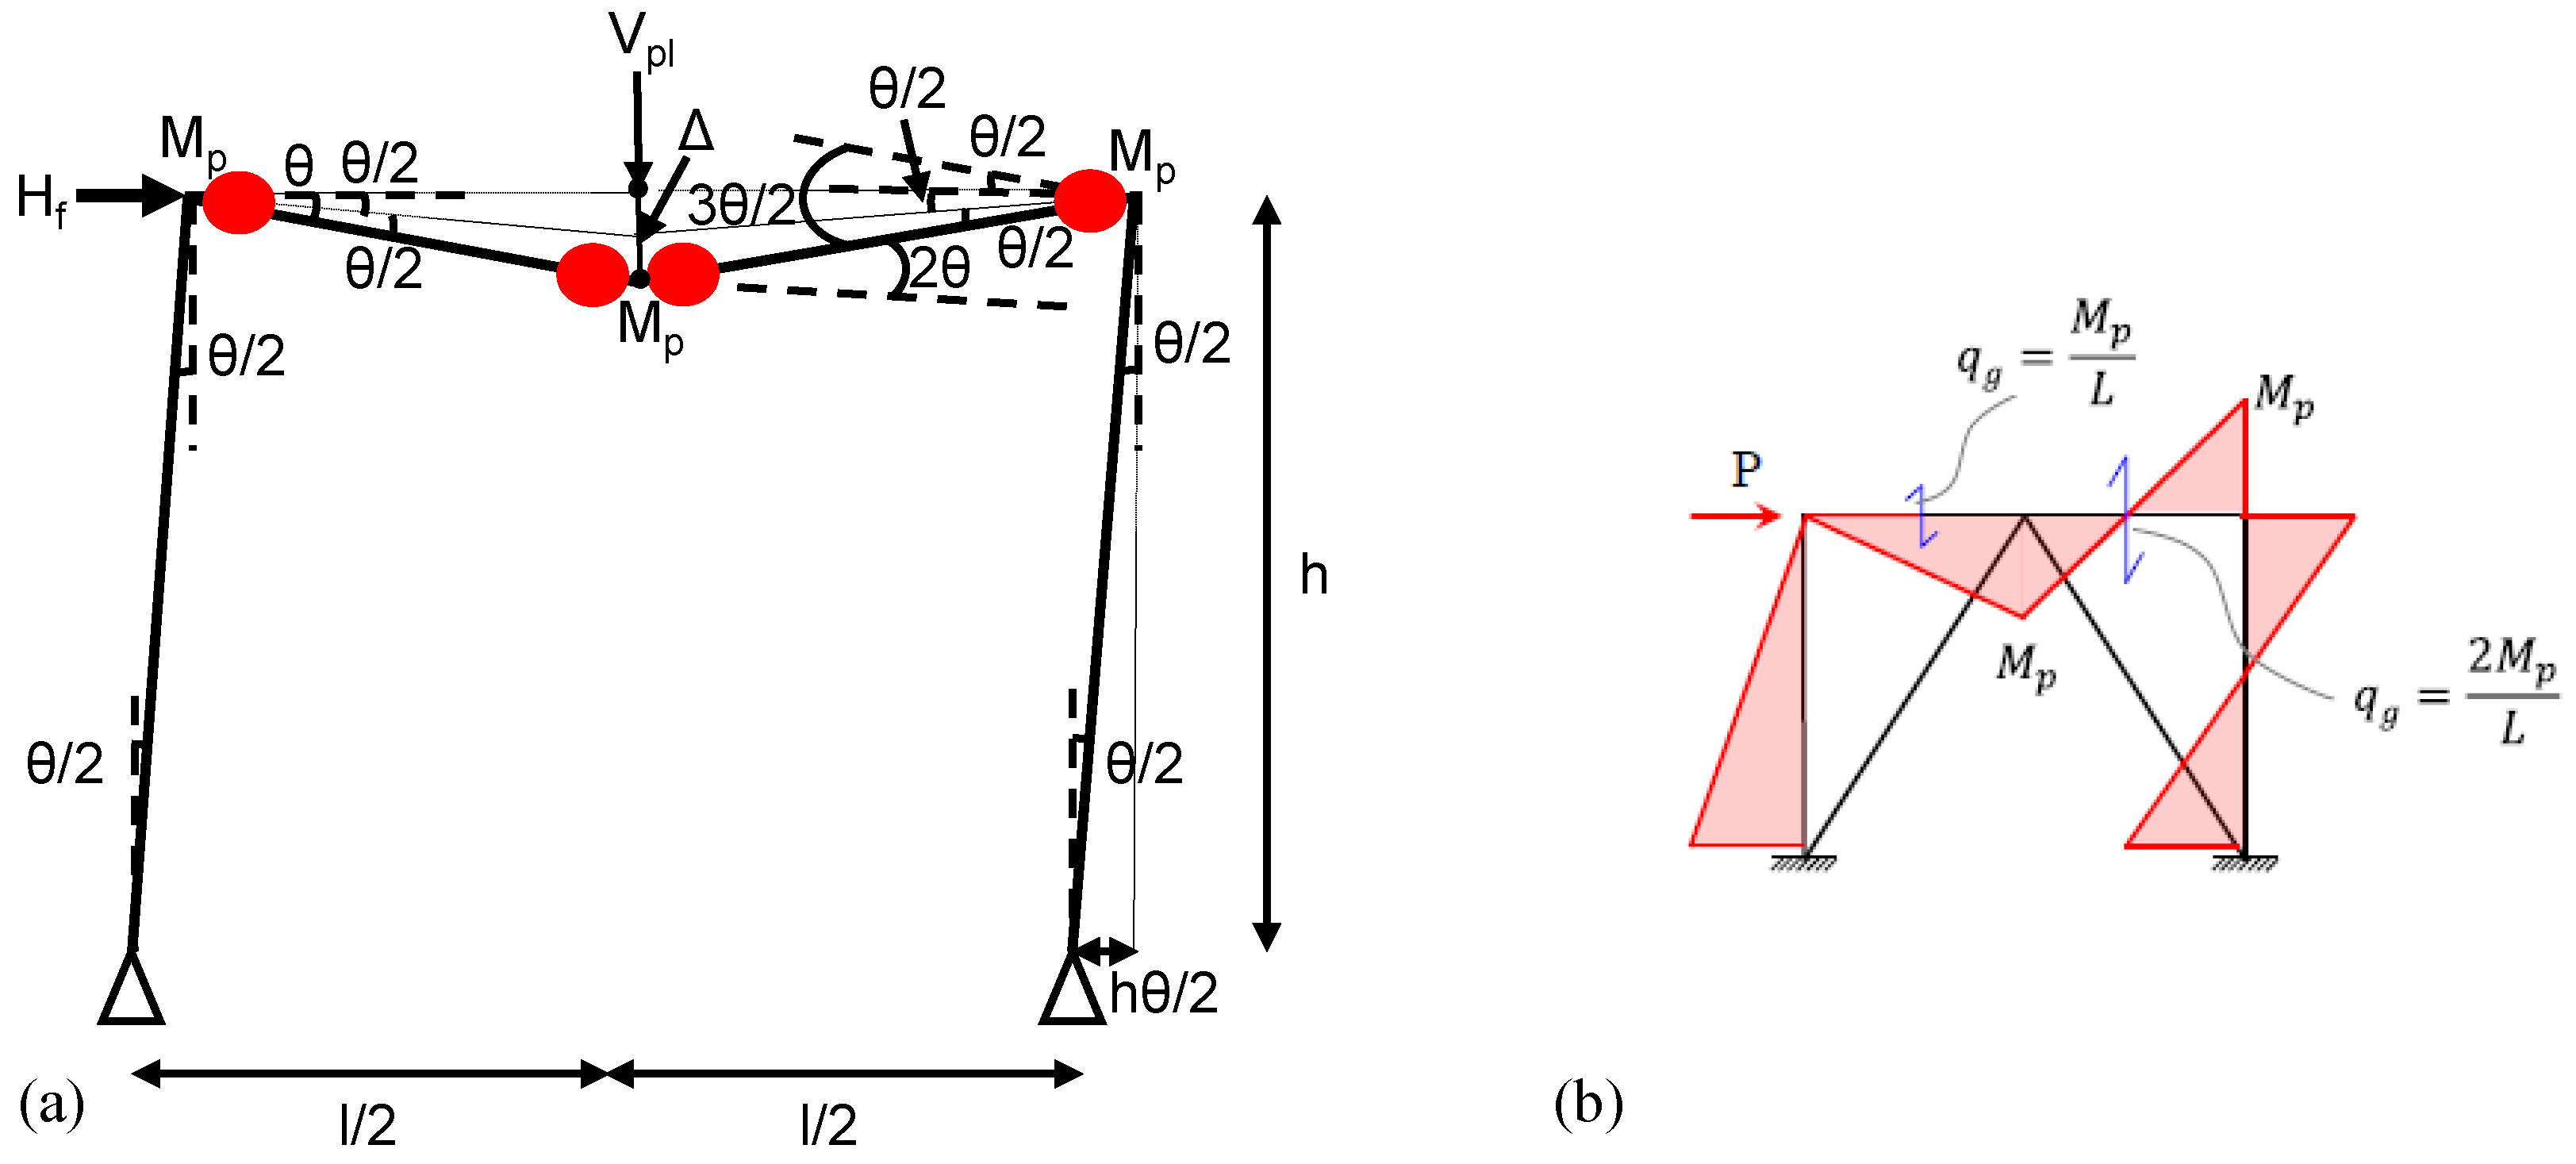
Figure 11.
Lateral force resistance in frame under weak beam mechanism when =2.0.
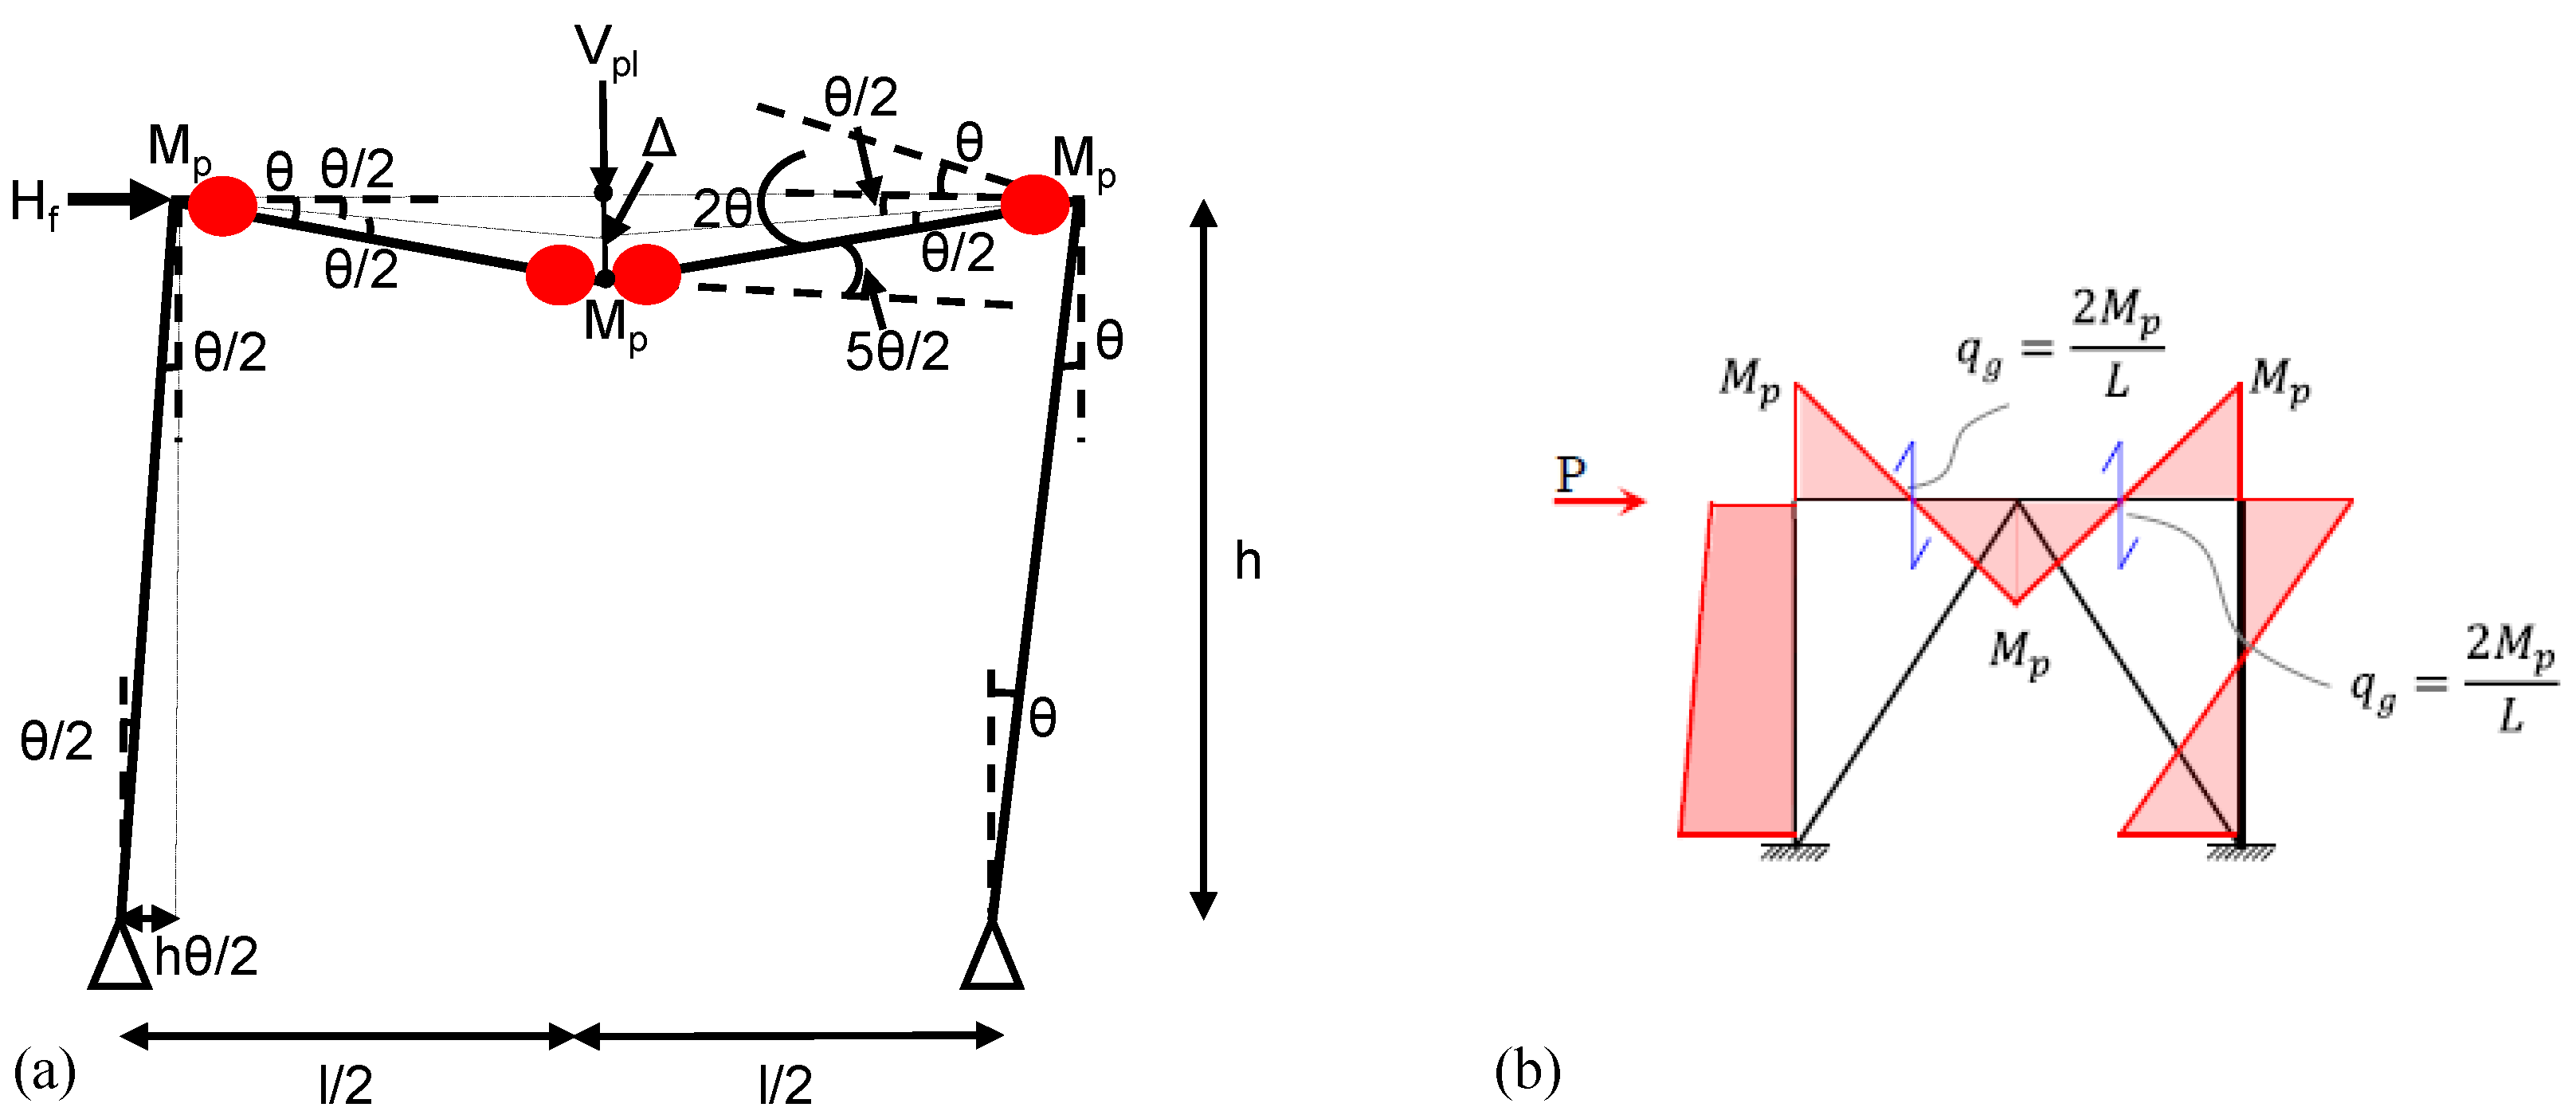
Figure 12.
Relationship between ro and with respect to .
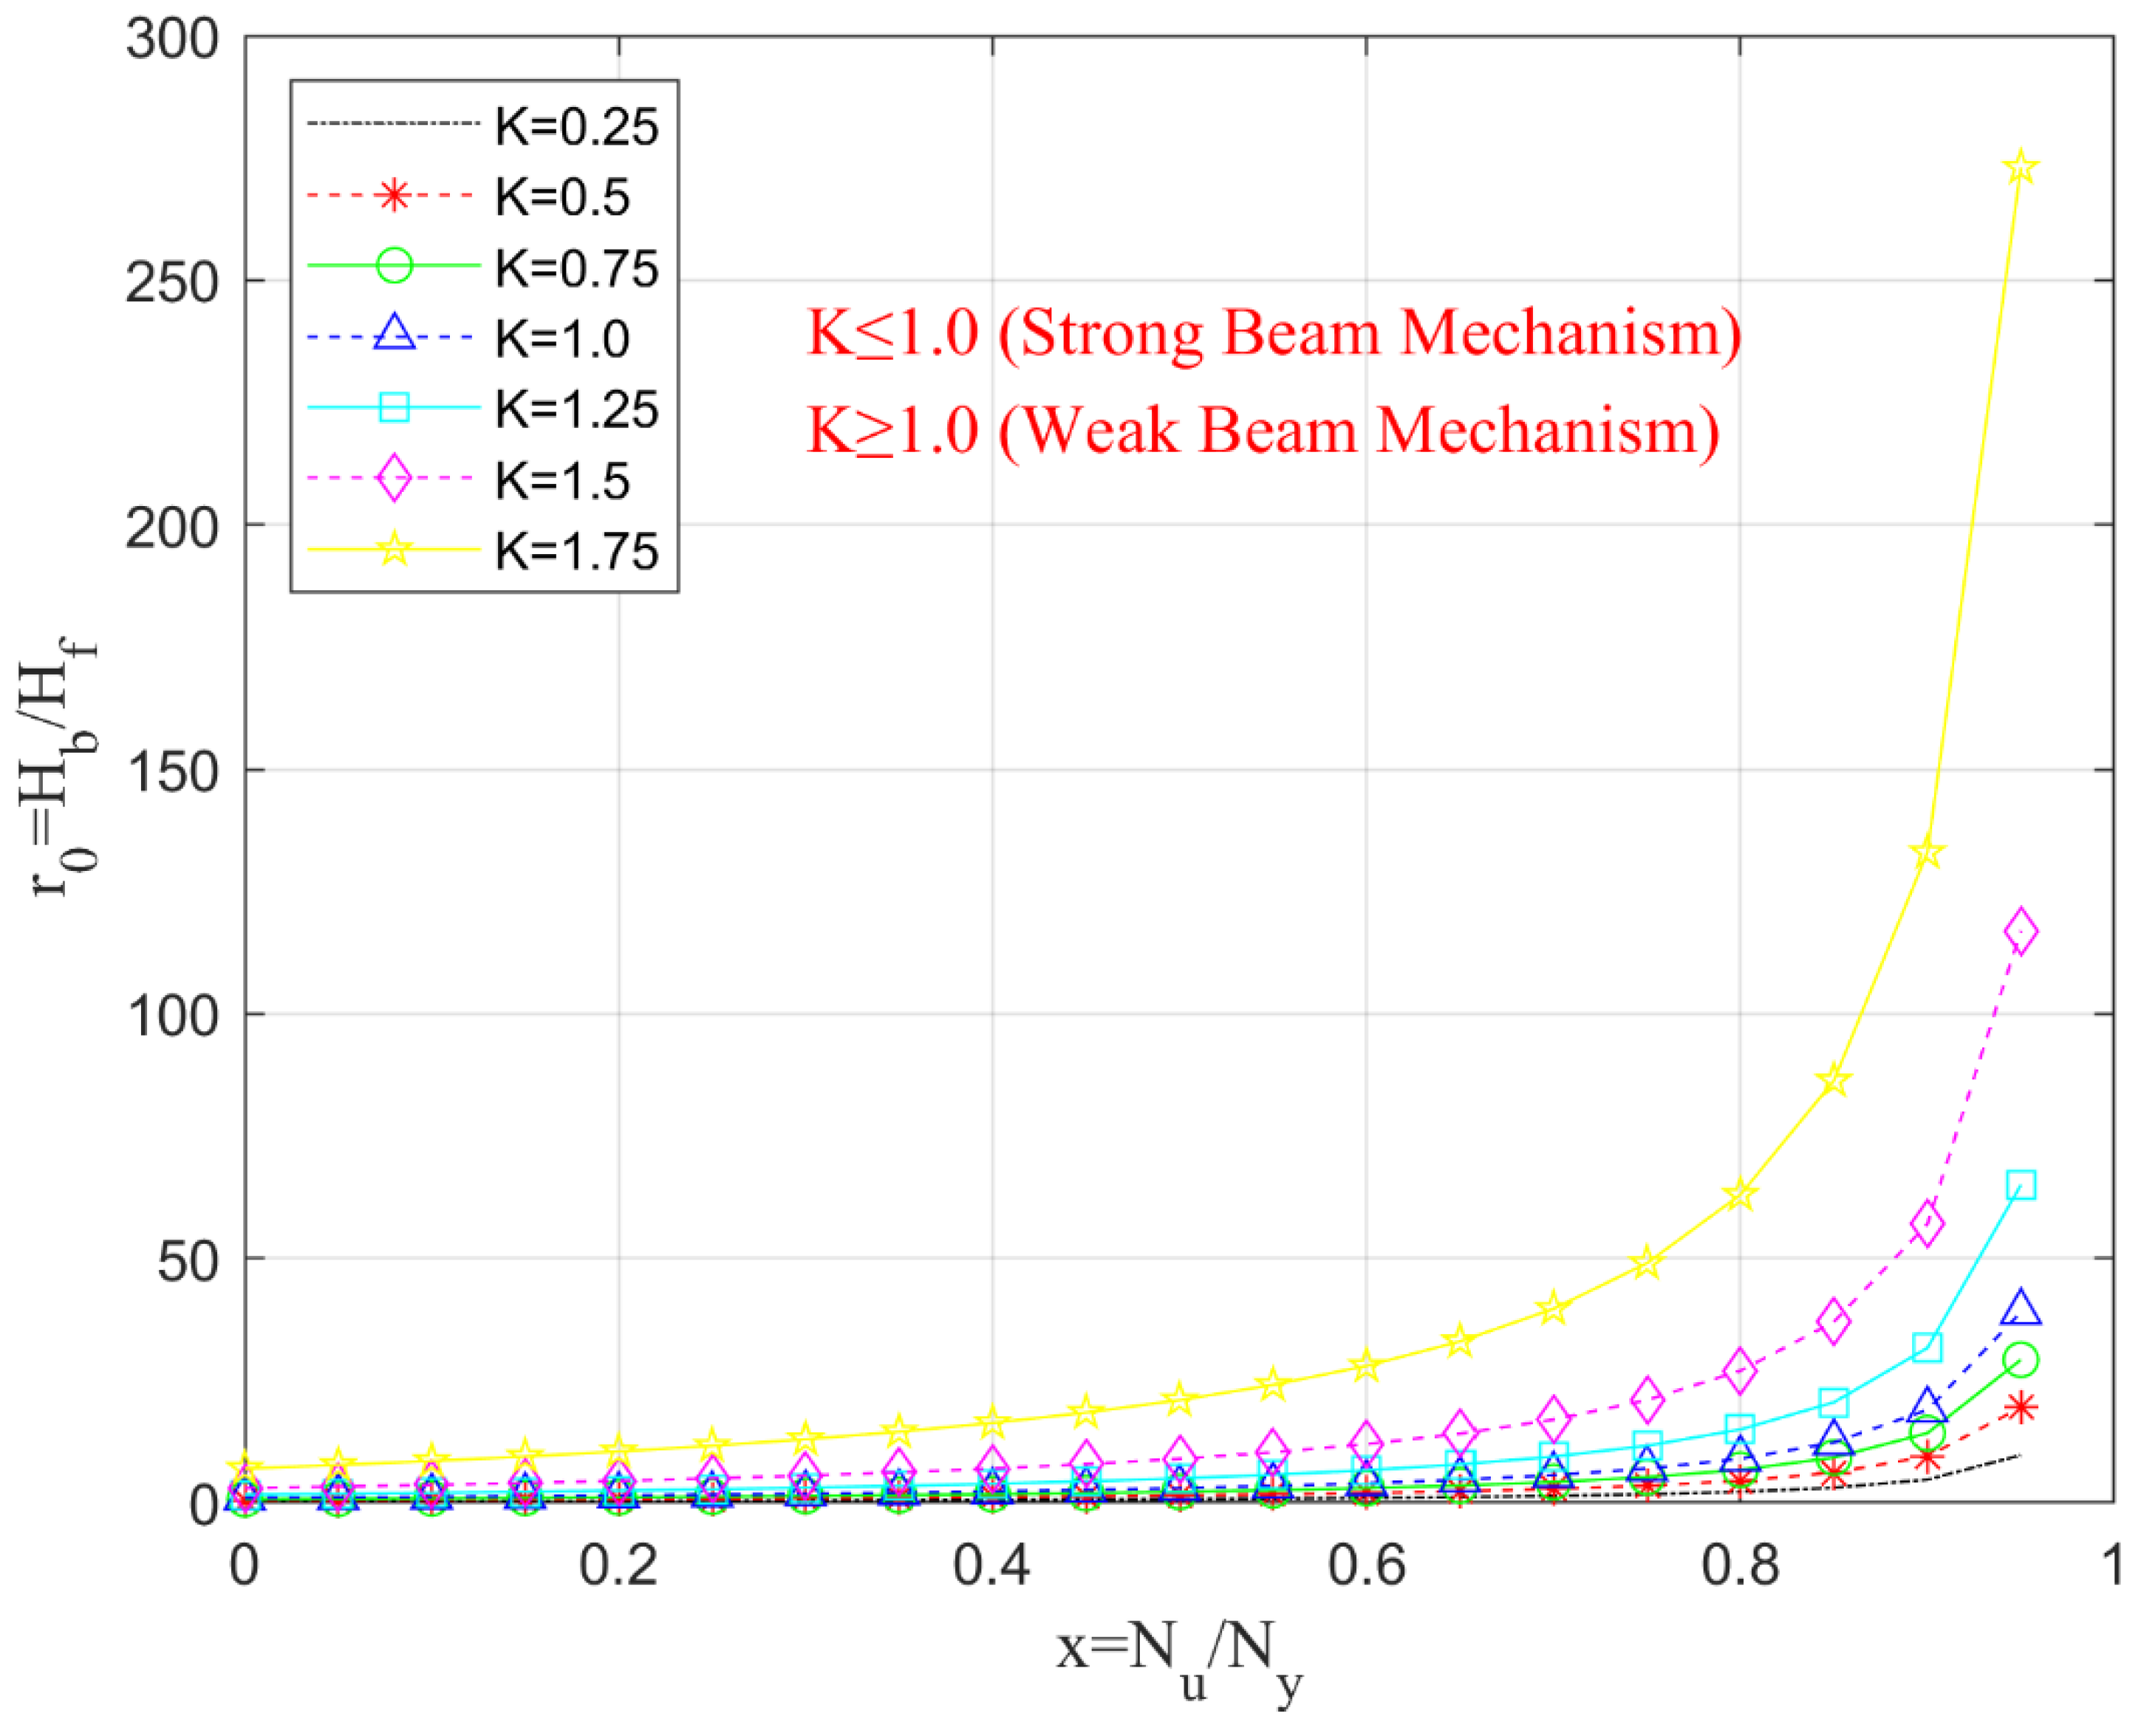
Figure 13.
Relationship between ro and with respect to in logarithmic Y-Axis.
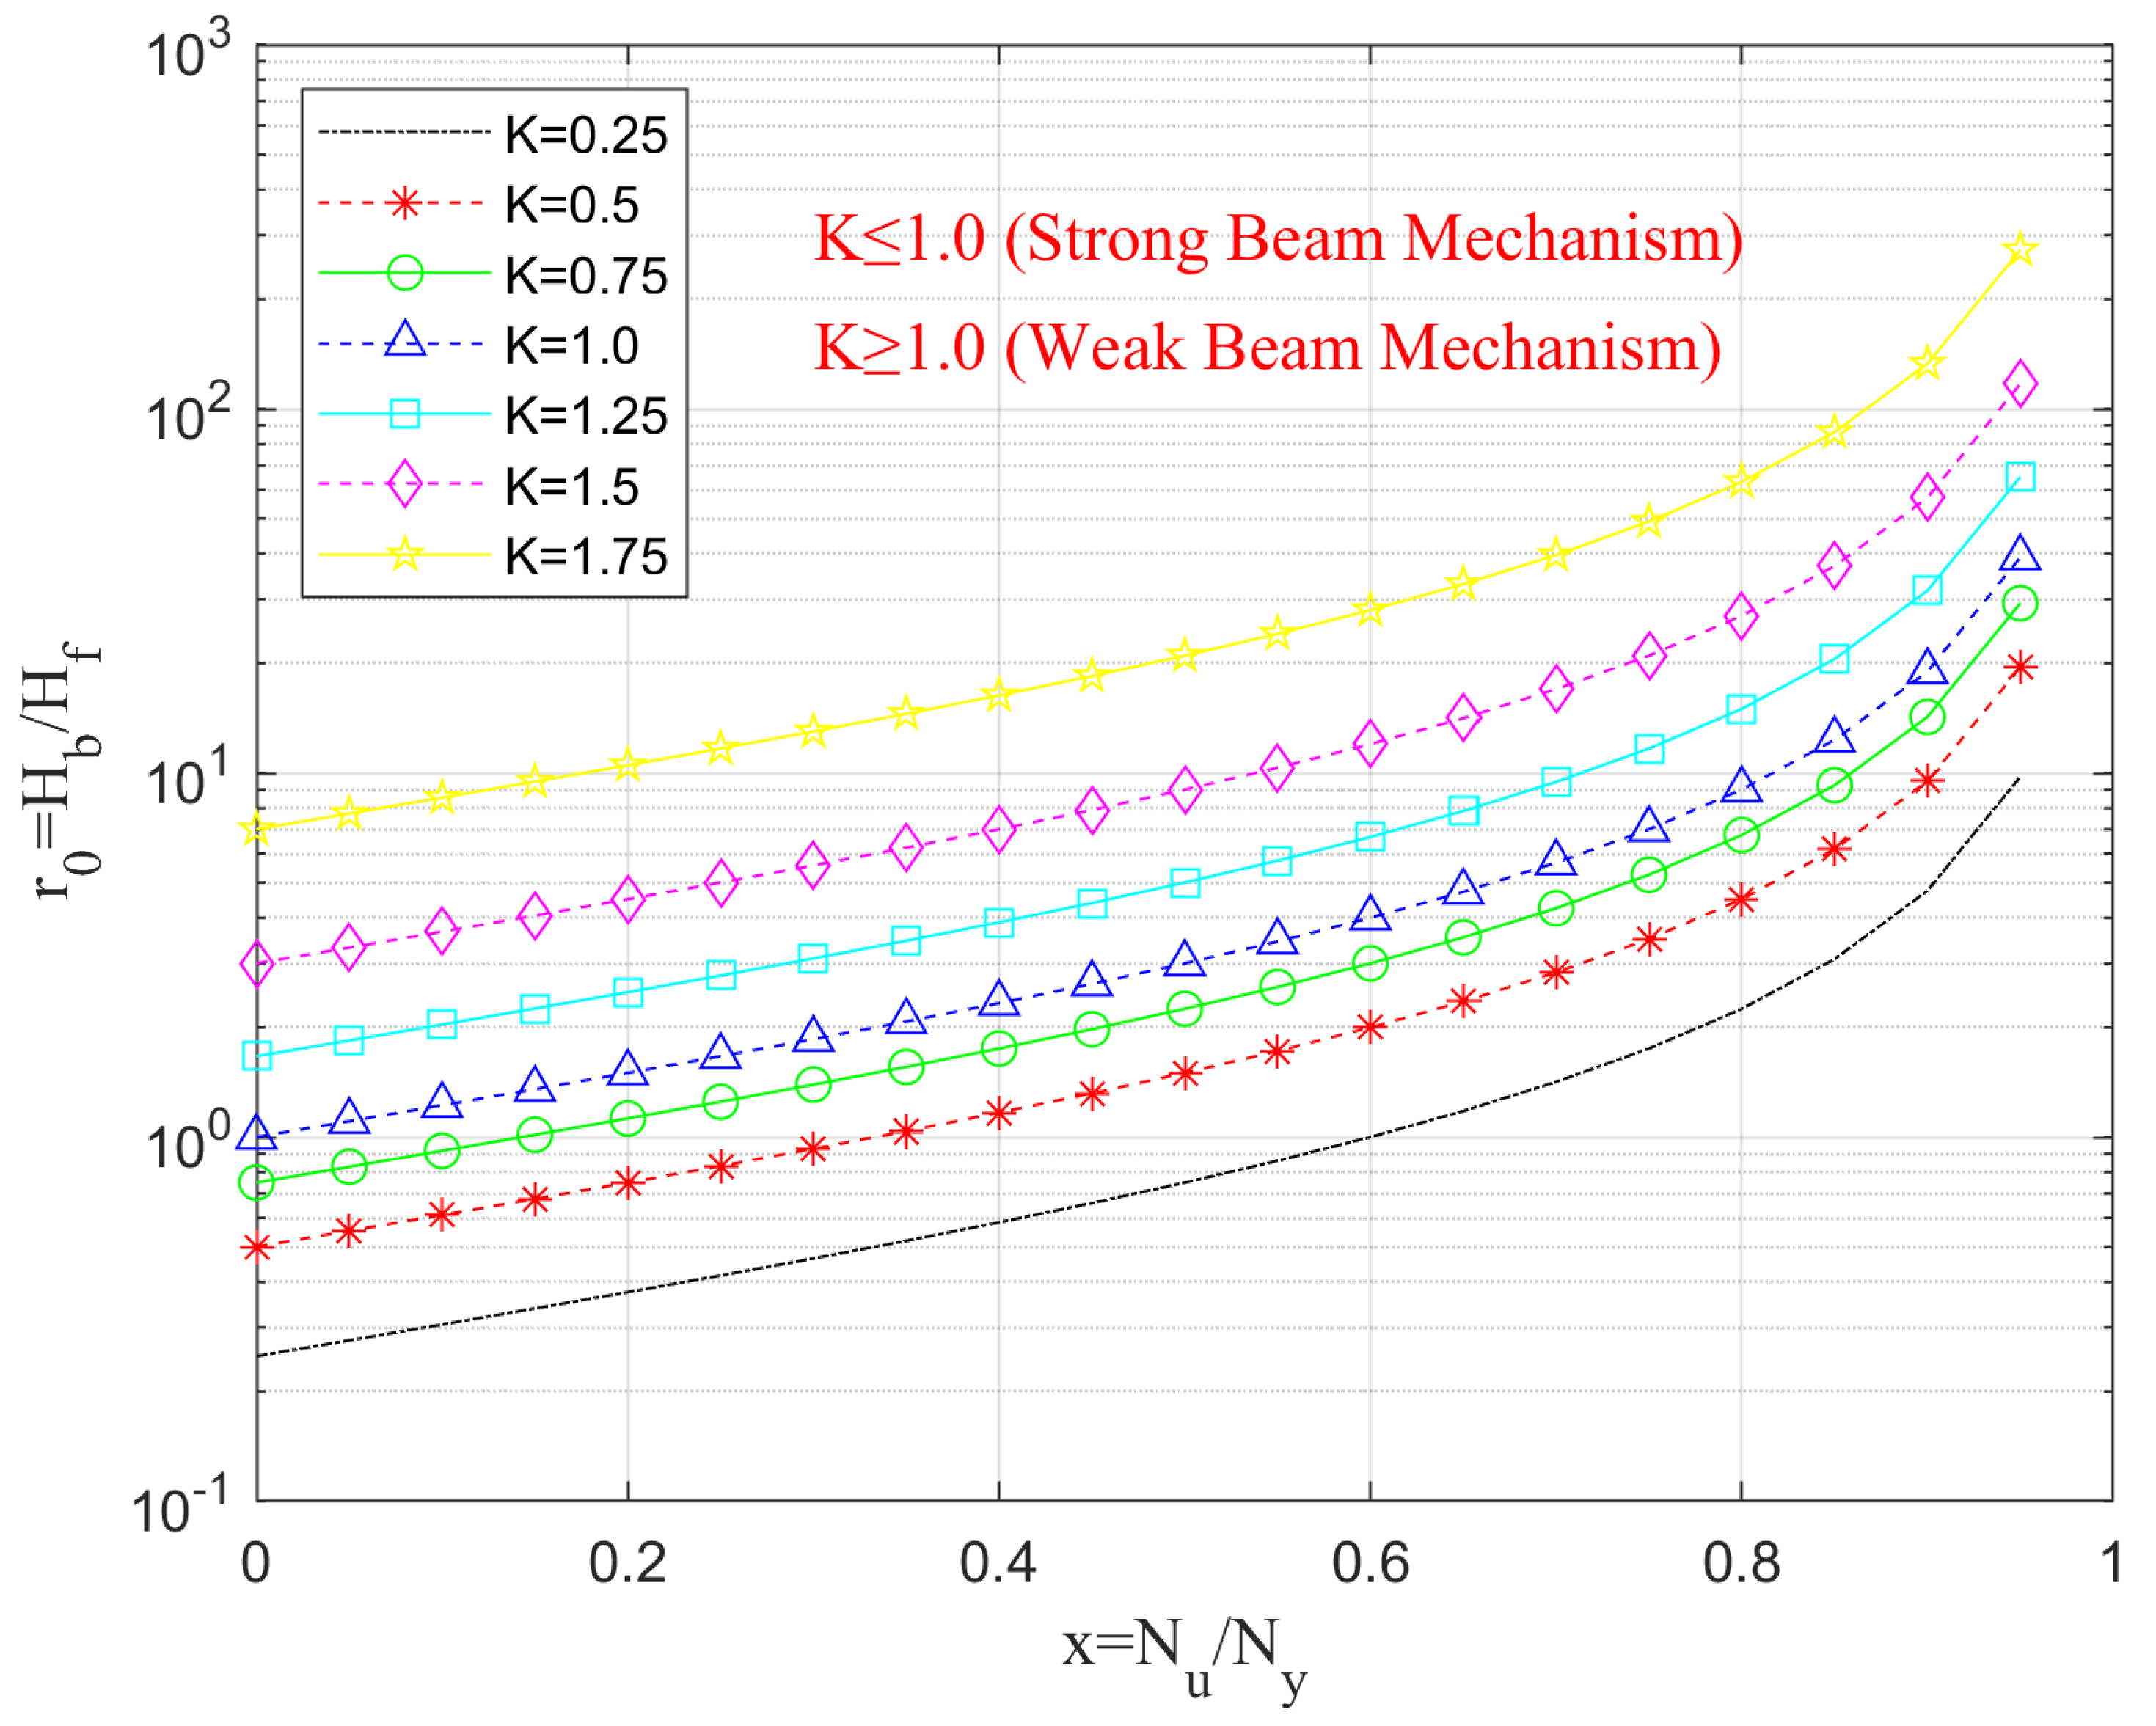
Figure 14.
Relationship between βo and .
Disclaimer/Publisher’s Note: The statements, opinions and data contained in all publications are solely those of the individual author(s) and contributor(s) and not of MDPI and/or the editor(s). MDPI and/or the editor(s) disclaim responsibility for any injury to people or property resulting from any ideas, methods, instructions or products referred to in the content. |
© 2025 by the authors. Licensee MDPI, Basel, Switzerland. This article is an open access article distributed under the terms and conditions of the Creative Commons Attribution (CC BY) license (http://creativecommons.org/licenses/by/4.0/).
Copyright: This open access article is published under a Creative Commons CC BY 4.0 license, which permit the free download, distribution, and reuse, provided that the author and preprint are cited in any reuse.


