

Submitted:
28 August 2024
Posted:
29 August 2024
You are already at the latest version
Abstract
The effectiveness of a hybrid technique for identifying seismic damage in planar, multistory, steel X or V-braced frames is demonstrated here through an example of a six-story frame. This proposed technique, referred to as “M and P”, combines the instrumental Monitoring (M) with Pushover analysis (P). According to the methodology, the diagram of stepping eigenfrequencies of the frame in the inelastic region is initially plotted against seismic roof displacement. The fundamental natural frequency detected via the monitoring process is then utilized in this key diagram to reveal the inelastic roof displacement that corresponds to the damage state of the steel braced frame. This displacement is subsequently used as the target in the pushover analysis, facilitating the identification of seismic damage in the existing steel braced frame. Finally, the damage image is correlated with the damage stiffness matrix of the frame at the same inelastic roof displacement. The investigation results indicate that combining instrumental monitoring with pushover analysis enables accurate identification of seismic damage potential in existing steel braced frames.
Keywords:
Damage identification
; Steel Braced Frames
; Concentric X or V-bracing
; Stepping Eigenfrequencies
; Capacity Curve
; Target Displacement
1. INTRODUCTION
Structural health monitoring (SHM) processes are essential for maintaining the safety and performance of significant structures, such as bridges, dams, and buildings. By continuously monitoring these structures, potential damage can be detected early, allowing for preventive measures to be taken to avoid catastrophic failures.
Detecting damage in structures is a critical task in engineering that involves analyzing data from various sensors and using algorithms to detect changes in dynamic characteristics relative to the health state of the structure. The recorded responses from a multi-channel network of accelerometers are processed by various stochastic or deterministic techniques to detect the eigenfrequencies, mode shapes and modal damping ratios of existing structures. The “frequency domain decomposition” (FDD) technique was used in “Operational Modal Analysis” (OMA) [1,2,3,4,5]. The “stochastic subspace identification” process [6] is also used in techniques which use OMA [7,8,9], by integrating three distinct analysis algorithms: principal component, canonical variate, and unweighted principal component. Based on these techniques, the “modal time-histories method” [10] was proposed for structures subjected to seismic ground excitation or strong wind loads [11]. In the “minimum rank perturbation theory” (MRPT) [12,13], a non-zero term in the structure’s damage matrix is interpreted as an indication of the damage location. Other techniques use the concept of “damage stiffness matrix” for damage detection [3,14,15]. Additionally, other techniques [16,17] use the discontinuities in structural mode shapes as an index of structural damage. Several techniques use the “modal strain energy-based damage index” [18,19,20,21] or the “modal flexibility” [21,22,23,24] for damage detection in structures. A review of comprehensive damage indices for rapid seismic monitoring of the structural health of structures is shown in [25]. Various techniques use artificial neural networks and machine learning tools for damage detection [21,26,27]. Integration of monitoring processes with pushover analysis is presented in several damage detection processes [28,29]. Other methodologies for damage detection involve acoustic emission (AE) measurements [30]. It is noted that sometimes in the abovementioned techniques multiple damage indices and machine learning tools are combined for damage identification in reinforced concrete (RC), steel or composite steel and concrete elements or whole structures.
Recently, Makarios [31] proposed an alternative technique for damage identification in existing, ductile, planar RC frames. This is the hybrid “M and P” technique, where “M” is for “Monitoring” and “P” for “Pushover” analysis. Subsequently, the “M and P” technique was validated by examining a five-story RC frame [32] in a seismic case. The same technique was suitably adapted by Bakalis et al. [33] for identifying seismic damage along the longitudinal direction of RC bridges. According to the “M and P” technique, the detected in the field fundamental eigenfrequency (Hz) by the monitoring process is inserted into the frequency diagram of the existing structure. This key diagram of the methodology is initially plotted as a function of the roof displacement in the nonlinear area and is then combined with the capacity curve of the frame. This is achieved by conducted a series of pushover analyses with increasing target roof displacement followed by corresponding stepping modal analyses. Using this diagram, the seismic roof displacement of the structure corresponding to the detected (in the field) fundamental eigenfrequency is revealed. All other higher eigenfrequencies of the structure can be also directly found in the previous diagram. Furthermore, the mode shapes of the damaged existing structure can be found by conducting stepping modal analysis at the same inelastic step corresponding to the seismic roof displacement found in the key diagram. Additionally, the stepping lateral stiffness matrix of the damaged structure at the same inelastic step can be found, considering all developed plastic hinges and stiffness degradation of the structural RC elements in the inelastic region. This matrix provides insights of the localization of damage in the stories and its severity. An accurate damage image of the structure can be obtained by examining the state of developing plastic hinges in the final step of the pushover analysis with target displacement equal to this found in the key diagram.
This paper validates the effectiveness of the “M and P” technique for identifying seismic damage in planar multistory, steel moment-resisting frames which are braced with concentric vertical links. An extensive parametric analysis on ductile frames of this type is conducted. The study focuses on steel frames with multiple spans of varying lengths and multiple stories of different heights, which are braced with X or V type of concentric braces in single-stack or in split configuration among the spans along elevation. Multiple concentric braces placed in single-stack or in split configuration along elevation are also considered. The behavior of steel X or V-braced frames is similar to that of dual reinforced concrete (RC) frames coupled with walls, where the bracing elements of the steel frame represent the bending subsystem while the frame elements represent the shear subsystem. In these ductile steel braced frames in which the beams are rigidly connected to the columns, severe seismic damage occurs mainly to the braces. In strong seismic motion, the seismic behavior of steel frames braced with concentric vertical braces is characterized in general by the complete failure of the compressed brace due to buckling and the high ductile behavior of the brace in tension. Additionally, the end-sections of beams or of some columns of ductile steel braced, moment-resisting frames can sustain moderate seismic damage. It is noted that the bracing columns of X-braced steel frames with the braces in single-stack configuration along elevation can sustain severe seismic damage due to high uplifting/settling axial force. For this reason, various researchers have suggested the use of staggered braces arranged in split-X configurations as compared to the conventional single-stack braced frame [34]. A numerical example of a six-story steel frame, braced with two concentric vertical X-braces in single-stack configuration in the first two floors and with staggered braces arranged in split-X configurations in the other floors, is presented in detail in this paper. This frame features four equal spans and a higher ground floor. The steps to perform the proposed “M and P” technique for the identification of damage in steel frames will be presented in detail in the following sections. The main aspects of the study are: (a) plotting the eigenfrequency curves of the existing steel frame, (b) evaluation of the seismic damage based on the results of pushover analysis and the degraded lateral stiffness matrix.
The results of the parametric analysis show that the integration of instrumental monitoring with an accurate mathematical analysis model of the structure in the “M and P” technique leads to a successful identification of seismic damage in the stories of steel braced, moment-resisting frames. This is due to the combination of the eigenfrequencies diagram with the capacity curve of the steel frame, which characterize the damage image of the frame and ensures that the structure presents a fundamental eigenfrequency very similar to that measured in the field. The direct correlation of the roof displacement with the fundamental monitored eigen frequency of the steel braced frame validates the accuracy of the “M and P” technique for structural health monitoring and evaluation of seismic damage in steel frames.
2. METHODOLOGY STEPS
2.1. Theoretical background
For a N x N multi-degree of freedom system, the equation of motion without damping in free vibration, because of an initial displacement or velocity, is as follows:
In Eq. (1), m and are respectively the N x N matrices of the mass and the stiffness of the structure in the health (without damage) state, and and are respectively the time N x 1 varying vectors of displacements and accelerations of the system. Next, it is assumed that the multi-degree of freedom system is an existing planar, steel, braced frame, with beams rigidly connected to columns, which presents a damage image due to various causes. Therefore, the stiffness matrix at any step i in the nonlinear area of behavior will change by . At the same i-step, the stiffness matrix of the steel braced frame is written as:
where is the damage stiffness matrix. Correspondingly, the equation of motion (Eq. 1) of the steel braced frame at the inelastic i-step is written as:
Next, the instantaneous mode shapes of the steel braced frame at various inelastic i-steps can be found by performing a modal analysis using the instantaneous stiffness matrix which includes the effects of damage in stiffness. These are vectors of order N x 1, where g = 1, 2, 3, …, N in a N-degree of freedom system. Assuming that the mass matrix does not vary, the eigenvalue problem at the inelastic i-step can be written as:
where (rad/s) is the instantaneous cyclic frequency (rad/s) of each mode shape at the inelastic i-step. The solution of the eigenvalue problem is achieved by setting the determinant of the terms inside brackets in the left side of Eq. (4) equal to zero and finding the roots of the respective algebraic equation:
The instantaneous mode shape vector can be found subsequently from Eq. (4) for each one eigenvalue . Moreover, by knowing an eigenvalue , Eq. (4) is pre-multiplied with the eigenvector :
Rearranging the terms in Eq. (6) leads to:
Eq. (7) is written as follows in condensed form:
where and are the modal stiffness and mass matrices respectively at the inelastic i-step. If the mode shapes are mass-normalized, then Eq. (8) can be written as:
As mentioned in Introduction, the instantaneous eigenfrequencies , and the instantaneous mode shapes of the structure are detected by structural health monitoring using various stochastic or deterministic procedures to analyze the time-history acceleration records. It is highlighted here that a sufficient time window where the natural frequency remains constant must be considered in the previous analysis. This condition applies only when the recordings come from the ambient vibration of the damaged structure and does not apply in seismic situations. Therefore, if are known from the recently proposed methodology [31,32] then Eq. (7) can be used at the end for verification purposes in advanced optimization and probabilistic analysis.
2.2. Phases of “M and P” technique
To assess the seismic damage of existing, ductile, planar, steel moment-resisting braced frames (with an X or V configuration) using the “M and P” technique the following phases should be performed:
(a) The fundamental natural frequency (Hz) of the existing damaged steel braced frame is detected by structural health monitoring. Note that up to the first three eigenfrequencies can be detected by the instrumental monitoring procedure.
(b) An appropriate mathematical non-linear model of the steel braced, moment-resisting frame with rigid beam-to-column connections and pin brace-to-joint (X-brace) or brace-to-beam (V-brace) connection is created. In this model, the nonlinear bending behavior of the end sections of the frame elements (both beams and columns) is represented by incorporating fiber P-M2-M3 hinges. These hinges are distributed over a distance approximately equal to the depth of the element’s section. Additionally, the nonlinear behavior of vertical concentric braces (with an X or V configuration) is best modeled using links (axial springs) with an axial force-deformation (P-δ) nonlinear law along their longitudinal direction. This modeling approach is preferred over using plastic hinges in a pinned frame element to represent the nonlinear behavior of the vertical brace, as these nonlinear links can more accurately capture significant drops in strength. The skeleton curve of the nonlinear P-δ law for the brace links is defined by points that characterize yield, ultimate (failure), residual strength, and fracture behavior, with buckling behavior anticipated for the compressed brace. This curve will be illustrated in the numerical example. A series of separate pushover analyses are conducted on the nonlinear model, each time targeting a gradually increasing roof displacement . For each target displacement, two pushover analyses, with positive and negative floor forces, are conducted. These analyses lead to the drawing of the capacity curve in terms of base shear and top displacement . Figure 1 shows the general form of the capacity curve of a steel braced frame, along with its elastoplastic idealization, which defines the idealized yield point and the effective stiffness at yield (secant stiffness at yield) of the frame. Additionally, various performance levels of the structure, corresponding to different roof displacements , are depicted within the figure. The characteristic damage states correspond to different performance levels (or Limit States). Starting from the health state (without damage), an increase in roof displacement leads the steel braced frame to the first yield state (formation of the 1st hinge). Further increasing the roof displacement leads the steel braced frame to the Damage Limitation (DL) state, subsequently to the Significant Damage (SD) state, and, finally, at the ultimate roof displacement , the Near Collapse (NC) state appears. This ultimate displacement is defined as the point where a sudden drop in strength exceeding 20% of the maximum observed strength occurs. Intermediate damage states are characterized by their location between the aforementioned characteristic states where they are observed. The general pattern of the capacity curve for ductile steel-braced frames is characterized by high effective stiffness at yield and sequential strength drops in the inelastic range. These drops are smaller when a compressive brace fails and larger when a tension brace fails. In general, the first change in the slope of the elastic branch of the pushover curve is due to the yielding of the braces and the following changes are due to the yielding of beams/columns [35]. Pushover analysis is conducted using the following elevation patterns for the horizontal floor forces (for a unit base shear, ): (i) the triangular pattern or that according to the fundamental mode shape is used in frames up to four floors, (ii) for taller frames, an additional pattern should be used, where an additional floor force equal to is applied at the top of the frame while the remainder of the unit base shear (i.e. ) is distributed to the storeys according to the triangular pattern or that according to the fundamental mode shape. This second pattern has been proposed for RC structures in [36] but it was found to be effective for steel buildings as well. The aim of the second additional pattern is to consider the influence of the higher modes on the seismic response of the frame. This is particularly important in the nonlinear region, where even tall steel frame buildings braced with vertical links can become flexible at high levels of roof target displacement. It is noted that a modified pattern for floor forces in pushover analysis of steel moment-resisting frames is also presented in equation (B.5) of the Informational Annex B of EN 1998-3 [37]. In this pattern, floor forces are distributed in elevation relative to the frame period; specifically, in more flexible frames, higher floor forces are applied as one moves towards the roof. It is emphasized that P-Δ effects should always be considered in pushover analysis, especially in more flexible frame structures.
(c) Following the final step of each pushover analysis with increasing target displacement from phase (b) of the methodology, a stepping modal analysis of the existing steel braced frame is performed. Specifically, the modal analysis corresponding to a roof displacement is conducted using the stiffness matrix of the damaged frame obtained at the final step of the corresponding pushover analysis with the same target displacement. Care must be taken when performing sequential modal analyses. These analyses should correspond to target roof displacements on the upward (positive) slop of the pushover curve. Conversely, if the target displacement corresponds to a point on a downward (negative) slope of the pushover curve, negative eigenvalues will result, which lack physical significance. Consequently, a diagram of the stepping eigenfrequencies (Hz) of the damaged frame is plotted as a function of the roof displacement (m). The general form of such a diagram is illustrated in Figure 2. In this key aspect of the methodology, the inelastic roof displacement is plotted on the x-axis (abscissa) while the eigenfrequency of the damaged frame is plotted on the y-axis (ordinate). By incorporating the fundamental natural frequency detected through the structural health monitoring in step (a), into this diagram, the seismic inelastic roof displacement of the existing damaged steel braced frame can be determined. This displacement is directly correlated with the seismic damage state of the frame. The next phase of the methodology involves identifying this seismic damage state.
It is emphasized that, unlike reinforced concrete structures that crack, the moment of inertia of the steel cross-sections in steel structures remains constant from the unloaded state to yielding and is equal to the geometric moment of inertia. Hence, the nonlinear model of the steel-braced frame in the sequential pushover and stepping modal analyses, which target increasing roof displacements, includes steel sections with a stable geometric moment of inertia.
(d) The known fundamental eigenfrequency (Hz) of the existing damaged steel braced frame of phase (a) is inserted into the diagram of stepping eigenfrequencies (Figure 2) and thus the corresponding target inelastic displacement at the top of the frame is revealed. All other stepping higher eigenfrequencies of the steel frame are depicted within the diagram along the same vertical line passing through the target displacement .
(e) The seismic damage status of the existing steel braced frame can now be identified based on the results of two pushover analyses. These analyses are conducted with positive and negative floor forces, applied according to the two floor force patterns discussed in phase (b) of the methodology. The target displacement in these analyses is equal to the roof displacement determined in the previous phase of the methodology. The locations and states of the plastic hinges observed in the final step of these pushover analyses provide an estimate of the damage state of the existing steel braced frame. An overall assessment of the damage can be derived by considering the envelope of the damage states obtained from both sets of pushover analyses.
(f) Following the final step of each pushover analysis in phase (e) with target displacement , a modal analysis is conducted. In this analysis, the stiffness matrix of the damaged steel frame from the final step of the pushover analysis serves as the initial condition. Through this stepping modal analysis, all cyclic eigenfrequencies and all mode shapes of the existing damaged steel frame are determined.
(g) The stepping lateral (condensed) stiffness matrix of the damaged steel braced frame is calculated at the specific inelastic i-step where the roof displacement was observed. To achieve this, it is more straightforward to first compute the flexibility matrix of the frame at the specific inelastic i-step. This involves conducting separate linear analyses where lateral unit floor forces are successively applied to each floor, aligned with the direction of the horizontal dynamic degrees of freedom of the frame. These analyses are conducted in the final step of each pushover analysis during phase (e), with a target displacement . The resulting horizontal displacements of the floors are then organized as columns in the flexibility matrix of the damaged steel frame, which is of order N x N for an N-degree frame structure. The inversion of this flexibility matrix results in the N x N stepping lateral stiffness matrix of the existing damaged steel frame at the same inelastic i-step where the roof displacement is observed. Therefore, the N x N damage stiffness matrix of the steel frame within the same inelastic i-step can be calculated from the general relation , where represents the initial lateral stiffness matrix of the steel frame in its health (undamaged) state. The calculation of follow the aforementioned procedure, which is conducted in the final step of a pushover analysis considering only the incremental action of the vertical loads from the seismic combination, .
The steps for applying the hybrid “M and P” technique to assess seismic damage in existing, ductile, planar steel frames, braced with X or V-links, are clearly outlined in the flow diagram depicted in Figure 3.
3. NUMERICAL EXAMPLE
In this section we examine an existing six-story planar steel frame, braced with X-links, as depicted in Figure 4. It is a moment-resisting steel frame braced with a combination of multiple X-braces and single X-braces arranged in a single-stack or staggered configuration. Specifically, there are two X-braces in a single-stack configuration on the first and second floors, with an additional X-brace on the third floor directly above one of the two X-braces on the second floor. On the remaining floors, there are single X-braces arranged in a staggered configuration. The connections between beams and columns are assumed to be rigid, forming a moment-resisting frame, while the X-bracing is pin-connected to the joints. The frame is assumed to be fixed at its base. This frame is part of a regular in-plan (symmetric) steel building, with reinforced concrete slabs at the floor levels acting as diaphragms. The composite action of the slabs on the behavior of steel beams is ignored as it is outside the scope of this study. The steel frame features four equal spans of 5 m each. The height of the first floor is 3.5 m, while each of the remaining floors is 3 m high, resulting in a total frame height of 18.5 m. The vertical uniform distributed loads on the beams of the frame are , which account for the self-weight, additional floor loads, and lightweight partition walls, and , which represent the live floor loads. The total vertical uniform distributed load of the seismic combination on the beams of the frame is , where represents the quasi-live loads with [38]. This results in a total load of . These loads result in each floor having an approximate mass of 78 t, contributing to a total frame mass of 468 t. The floor masses and degrees of freedom for the six-story planar steel braced frame, used in the modal analysis, are shown in Figure 4(b). Figure 4(a) presents the two elevation patterns of horizontal floor forces (P-1 and P-2) referenced in phase (b) of the methodology and used in the pushover analyses. The steel frame is constructed using steel grade S235, with an average strength of and a maximum strength of . The modulus of elasticity for the steel is . In Figure 5, the constitutive law for the structural steel is depicted along with the performance levels.
The existing steel braced frame was designed according to ΕΝ 1998-1 [38] for the high ductility class (DCH), to withstand a seismic ground acceleration 0.24g at its base, on soil category D, with a behavior factor of q=4. The columns in the first four floors are constructed with wide flange steel profile HEB 450, while the columns in the upper two floors are of HEB 400 steel profile. The beams on all floors are constructed with steel profile IPE 400. The braces on all floors are constructed with double channel steel profile (2UPN), with varying steel sections across different floors. The steel sections of the structural elements of the steel braced frame are depicted in Figure 6, which shows the mathematical analysis model. The Finite Element Analysis software SAP2000 [39] is used for all linear and nonlinear analyses within the context of the “M and P” technique. The columns and beams of the steel frame are modeled as Frames elements while the braces are modeled as Link elements to accurately capture significant drops in strength. Rigid zones are defined around the nodes to account for their rigidity. The frame is generally regular in elevation, although there is a minor irregularity due to the first floor being 17% taller than the subsequent floors.
According to phase (a) of the methodology, a multi-channel system of uniaxial accelerometers is installed in the existing six-story steel braced frame and the horizontal acceleration response due to ambient vibrations is recorded at each floor when the frame is at rest. From the analysis of these recordings, the fundamental natural frequency of the existing damaged steel braced frame is detected. This frequency will subsequently be associated with the i-step of the pushover analysis.
In the nonlinear model of the steel-braced frame, Fiber P-M2-M3 type plastic hinges (FH) are incorporated into the end cross-sections of the beams and columns (frame elements) to simulate their nonlinear behavior. Five fiber hinges (FH) are inserted at each beam/column end-section with a plastic hinge length of 0.1 m each to model distributed plasticity. These plastic hinges extend over a total distance approximately equal to the depth of the cross-section of beams/columns. The constitutive law governing the behavior of plastic hinges in nonlinear analysis is according to the steel kinematic model [40]. The double channel X-braces are modeled as links, with their axial constitutive relationships represented by a skeleton curve in terms of axial force (N) and axial deformation (u). Figure 7 depicts the nonlinear behavior of these links. The middle diagram in the first row presents the characteristic points of the skeleton curve with their values. As shown in this figure, the behavior of the links in compression is characterized by half the yield axial force and deformation compared to their tensile counterparts to account for buckling. At the ultimate state, this reduction in axial force and deformation for the links in compression exceeds the half-relative values in tension. Indeed, the axial deformation is reduced significantly at the ultimate state in compression to account for limited ductility under negative axial forces. A skew drop in axial strength is included in the constitutive law in tension and compression beyond the ultimate deformation to prevent unbalanced situations during analysis. A residual axial strength of 30% of the yield value is included in the skeleton curve following the ultimate state, remaining constant until fracture.
To plot the capacity curve of the planar steel braced frame up to the NC state, two pushover analyses should be conducted in both positive and negative directions. Since the multistory frame has six floors (>4), the pushover analyses will utilize the two loading elevation patterns described in phase (b) of the methodology: the triangular pattern and the triangular pattern with an additional top force, both corresponding to a unit base shear. These patterns will henceforth be referred to as P-1 and P-2 and are depicted in Figure 4. The four capacity curves of the six-story steel braced frame resulting from the two sets of pushover analyses with floor force patterns P-1 and P-2 are depicted in Figure 8. The capacity curve includes two ordinate axes: the first representing the roof displacement and the second representing the chord rotation profile angle , where m is the total height of the frame. This angle represents the mean drift ratio of the steel-braced frame, as shown in Figure 9. Also shown within the Figure 8 is the elasto-plastic idealization of these curves, which identifies the idealized yield point of the frame (DL state) at a approximately equal to rad. Additionally, in the figure, it is evident that for the P-1 pattern in the positive or negative direction, the NC state was reached at a value approximately equal to 0.32⁄18.5=0.0173 rad. As mentioned in phase (b) of methodology, the ultimate displacement m is defined as the point where a sudden drop in strength exceeding 20% of the maximum observed strength occurs. It is also noteworthy that the capacity curves for the second pattern P-2 exhibit similar values of at failure and slightly lower effective (secant) stiffness at yield.
The sequence of yielding and failure of all vertical X-braces in the developed plastic mechanism of the steel braced frame for the pushover analysis P-1 and P-2 along the positive direction is illustrated clearly in Figure 10(a) and 10(b), respectively, in terms of axial force and roof displacement. The behavior is similar for both pushovers along the negative direction. These graphs are not exactly linear because the axial force of the braces and the roof displacement of the frame do not align in the same direction. In the same figures, the capacity curve of the steel braced frame in terms of base shear and roof displacement, along with its counterpart due to base columns and base X-braces, is also shown. It is noted that the contribution of the base X-braces to the base shear is obtained by multiplication of their axial force with cos(α), where α is the angle of the base X-braces. This contribution accounts for approximately 80% of the total base shear, similar to that observed in dual RC frames as mentioned in the Introduction. As evident in Figure 10, at the NC state the braces in compression have failed on all floors except the top floor in P-1 and the first floor in P-2 pushover. The NC state occurs with the failure of the braces in tension on the third and fourth floors in the P-1 pushover, and on the fourth and third floors in the P-2 pushover, following this sequence. The first plastic hinge forms in the braces under compression very early in both pushovers P-1 and P-2, at a roof displacement of approximately 0.02 m. The DL state is reached at a roof displacement of 0.05 m in both pushovers P-1 and P-2, when the braces in tension begin to yield.
According to phases (b) and (c) of the methodology, a series of pushover analyses are conducted on the existing steel braced frame, each targeting a successively increased roof displacement until the NC state is reached. These analyses are performed along the positive and negative directions using the two loading patterns, P-1 and P-2. The objective of these analyses is to establish the natural eigenfrequency curves of the existing, damaged, steel braced frame. The first pushover analysis in the series focuses on zero target displacement and only considers the gradual action of vertical loads from the seismic combination, , representing the health state of the structure.
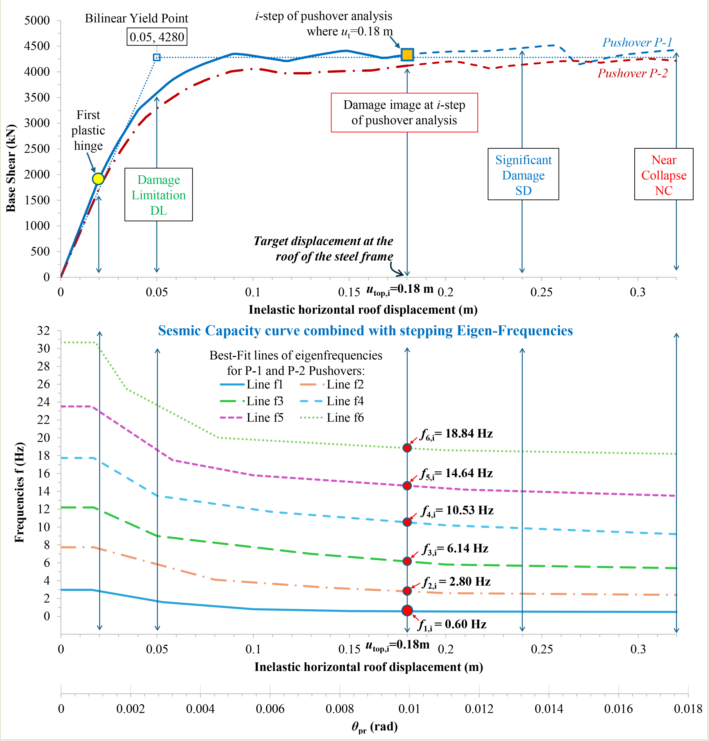
In the final step of each separate pushover analysis in the series, a stepping modal analysis is conducted, starting with the observed damage state from this last step. Specifically, each modal analysis considers the stiffness matrix of the damaged steel frame as determined in the final step of the respective pushover analysis. In each of these stepping modal analyses, the six stepping eigenfrequencies έως (in Hz) of the steel braced frame are recorded, corresponding to the number of dynamic degrees of freedom of the frame. As a result, the diagram showing the stepping eigenfrequencies (Hz) of the steel braced frame as a function of the top displacement can be plotted, up to a roof displacement , where the NC state is attained. Figure 11 illustrates this diagram for the two pushover analyses, P-1 and P-2, with horizontal floor forces applied in the positive and negative direction. The sudden peaks shown in this figure in each eigenfrequency line correspond to unbalanced situations caused by the sudden failure of braces in compression. This pattern becomes more pronounced near the NC state, where immediately before it, the braces in compression on the first floor fail, and immediately after it, the braces in tension on the third and fourth floors also fail (Figure 10). As the flexibility of the frame should be higher with increasing seismic damage (e.g. at NC state relative to the SD state), best-fit mean lines of the eigenfrequencies are plotted as smooth, wide colored lines in Figure 11. These best-fit lines can be used with good approximation, especially for the fundamental eigenfrequency under consideration. To further estimate the dynamic characteristics of the existing steel braced frame at the inelastic i-step, the mean values of the stepping eigenfrequencies for each pattern, P-1 and P-2, should be calculated. These mean eigenfrequency values to (Hz) derived from the best-fit lines are presented in Table 1 for characteristic values of . As shown in Table 1, the stepping periods Τ1 to Τ6 (s) of the existing steel braced frame (where period T is the inverse of frequency f, i.e. ) increase with the increasing roof displacement . Consequently, the flexibility of the six-story steel frame progressively increases due to the evolution of seismic damage. This increase in the periods Τ1 to Τ6 (s) of the existing steel braced frame between the health state and the NC state is clearly presented in Table 2. As is evident in this table, the fundamental period of the steel-braced frame is about six times higher at the NC state compared to the health state. In Figure 12, the diagram of stepping eigenfrequencies (Hz) is combined with the capacity curve of the existing steel braced frame for a target roof displacement equal to . The two diagrams are plotted up to a roof displacement of 0.32 m, corresponding to the NC state of the frame. These interconnected diagrams form the ‘key diagram’ of the hybrid ‘M and P’ technique, illustrating its application as follows:
(a) The fundamental eigenfrequency (Hz) of the existing steel braced frame, detected through structural health monitoring in the field, is inserted into the frequencies diagram (Figure 2). This reveals the corresponding roof displacement (or respectively).
(b) With the roof displacement known, we move upwards to the capacity curve of the existing steel braced frame. Here, the seismic damage state is visually identified based on the achieved performance level.
For clarity, only the capacity curves of pushovers P-1 and P-2 with positive floor forces are shown in Figure 12. The eigenfrequency diagram of the steel braced frame is plotted in Figure 12 with the best-fit lines determined in Figure 10. The best-fit line for the fundamental eigenfrequency provides an excellent approximation of its mean values across all pushover cases. According to phase (d) of the methodology, the fundamental eigenfrequency of the frame detected through structural health monitoring is inserted into the eigenfrequency diagram of Figure 12. This reveals the target displacement at the roof of the frame (or equivalently, a value approximately equal to 0.01 rad), which corresponds to the seismic damage state of the existing steel frame. All other higher eigenfrequencies () can also be determined within Figure 12 at the same inelastic i-step. Therefore, we focus on the part of the capacity curves up to , while the rest of the curves up to the NC state (dashed line) are not considered. This roof displacement is closely linked to the fundamental frequency of the existing steel braced frame, which was previously detected through the structural health monitoring in the field.
Table 3 presents the eigenfrequencies of the existing steel braced frame at a target displacement of , based on four pushover analyses (P-1 and P-2 in both positive and negative directions). This table highlights the minor differences between the mean values of the eigenfrequencies from these pushovers and the corresponding predictions of the fit-line, as seen in Table 1 and Figure 12 for .
Figure 13 illustrates the first three stepping mode shapes (φ1,i έως φ3,i) of the six-story, steel braced frame at the same inelastic i-step where is shown in the context of pushover analyses P-1 and P-2 along the positive direction. The mode shapes for the negative direction are similar. These mode shapes are determined through modal analysis following the last step of P-1 and P-2 pushovers with target displacement equal to .
Additionally, as described in phase (e) of the methodology, Figure 14 and Figure 15 present the seismic damage images of the steel braced frame at the same inelastic i-step where is shown in pushover analyses P-1 and P-2 along both positive and negative directions, respectively. The developing plastic hinges in these figures are depicted by: (i) filled black semi-circles, representing the damage state at the upper or lower fiber of the end cross-sections of the steel beam/column elements, indicating a condition between the DL and SD states, (ii) filled color circles (green for DL, blue for SD and red for NC), representing the damage state at the X-bracing elements, and (iii) X-signed black circle indicating the failure of various braces in compression. The yield and failure sequence of the braces of the steel frame at is depicted in Figure 16, in terms of axial force and roof displacement for P-1 and P-2 pushovers along the positive direction. The corresponding axial force–axial deformation behavior of the steel braces is illustrated in Figure 17, indicating their damage state. For the P-1 and P-2 pushovers along the negative direction, these aspects of behavior are shown in Figure 18 and Figure 19, respectively.
It is noted that in both pushover analyses P-1 and P-2, along both the positive and negative directions, severe damage occurs primarily at the X-braces, with several of the compressed braces failing. Meanwhile, the plastic mechanism that develops in the existing steel frame, particularly concerning the beams and columns, is a beam sway mechanism, with moderate damage observed only on the end-sections of the beams. No plastic hinge develops at the end-sections of the columns on any floor or at the base of the frame. Additionally, it is observed that the severity of seismic damage is slightly greater in the upper half of the existing steel frame and slightly lesser in the lower half for the P-2 pushover analysis. As previously noted, for a conservative assessment of the damage profile of the existing steel braced frame, it is advisable to consider the envelope of results from both pushover analyses, P-1 and P-2.
It is important to note that during a seismic event, the actual seismic load on the structure varies at each time step. Therefore, the seismic damage observed in the six-story steel braved frame may differ from that predicted by the pushover analysis. However, the critical parameter in the proposed methodology is the fundamental natural frequency (Hz) detected in the field through the structural health monitoring. By knowing the fundamental natural frequency of the existing planar steel frame, the corresponding seismic displacement at the top of the frame can be estimated using Figure 12. Additionally, the capacity curve linked in the figure allows for the identification and assessment of seismic damage. It is emphasized that the second elevation pattern (P-2) for the floor forces, which includes an additional force at the top of tall frames with more than four floors, should always be considered in pushover analysis. This consideration is crucial because, in the deep nonlinear range, the failure of several braces in compression causes the braced frame to become more flexible, making it more sensitive to the influence of higher modes and second-order effects.
Finally, the stepping lateral stiffness matrix of the six-story steel braced frame is calculated at the specific inelastic i-step where the top displacement occurs, corresponding to a chord rotation profile angle approximately equal to . This matrix reflects the reduction in lateral stiffness due to the progression of damage in the structure, particularly accounting for the failure of various braces in compression and the resulting changes in the frame’s behavior. To facilitate the computation of the stepping lateral stiffness matrix, the stepping flexibility matrix of the six-story steel braced frame is first determined at a top displacement and then inverted, following the procedure outlined in phase (h) of the methodology. Decimal places within the stiffness matrix are omitted for brevity. For the P-1 pushover analysis with positive floor forces, the damage stiffness matrix at a roof displacement is as follows:
| 389635 | -288907 | 113882 | -23766 | 8882 | -4922 | |||
| -288907 | 433530 | -316476 | 116213 | -23348 | 4029 | |||
| 113882 | -316476 | 426223 | -294602 | 101353 | -13897 | (10) | ||
| -23766 | 116213 | -294602 | 409167 | -269417 | 59041 | |||
| 8882 | -23348 | 101353 | -269417 | 437511 | -251167 | |||
| -4922 | 4029 | -13897 | 59041 | -251167 | 203664 |
The lateral stiffness matrix of the six-story steel braced frame in the health (undamaged) state is calculated using the same procedure outlined in phase (h) of the methodology:
| 1703412 | -994416 | 129131 | -19167 | -17371 | 10389 | |||
| -994416 | 1489715 | -681819 | 119026 | 11485 | -32439 | |||
| 129131 | -681819 | 1021146 | -568196 | 109771 | -12825 | (11) | ||
| -19167 | 119026 | -568196 | 871983 | -482707 | 78014 | |||
| -17371 | 11485 | 109771 | -482707 | 717627 | -327892 | |||
| 10389 | -32439 | -12825 | 78014 | -327892 | 279033 |
Therefore, the stepping damage stiffness matrix of the steel braced frame at the same inelastic i-step is calculated by the general relation . The resulting matrix is as follows:
| 1313778 | 705509 | 15249 | N.E. | N.E. | N.E. | ||||||||||
| 705509 | 1056185 | 365344 | 2812 | N.E. | N.E. | ||||||||||
| 15249 | 365344 | 594923 | 273594 | 8418 | N.E. | (12) | |||||||||
| N.E. | 2812 | 273594 | 462816 | 213289 | 18973 | ||||||||||
| N.E. | N.E. | 8418 | 213289 | 280115 | 76725 | ||||||||||
| N.E. | N.E. | N.E. | 18973 | 76725 | 75369 | ||||||||||
We observe that all the aforementioned matrices are symmetrical, as expected. The notation “N.E.” within the damage stiffness matrix denotes that the coupled terms are “Not Evaluated” due to their high sensitivity. Below is the stepping damage stiffness matrix of the six-story steel braced frame for the P-2 pushover analysis case with positive floor forces, at the specific inelastic i-step where occurs:
| 1161639 | 753503 | 57773 | 2958 | N.E. | N.E. | |||
| 753503 | 1155753 | 438387 | 17049 | N.E. | N.E. | |||
| 57773 | 438387 | 639968 | 287343 | 10022 | N.E. | (13) | ||
| 2958 | 17049 | 287343 | 502948 | 234327 | 5673 | |||
| N.E. | N.E. | 10022 | 234327 | 397925 | 173901 | |||
| N.E. | N.E. | N.E. | 5673 | 173901 | 182399 |
Within this matrix, it is noted that there are four coupled terms, , marked as “Not Evaluated” (N.E.). These terms also exhibit high sensitivity.
The respective damage stiffness matrices for the P-1 and P-2 pushover cases at along the negative direction are presented in Eqs. (14) and (15) below:
| 1298680 | 696030 | 13531 | N.E. | N.E. | N.E. | |||
| 696030 | 1050057 | 364496 | 2397 | N.E. | N.E. | |||
| 13531 | 364496 | 594367 | 271663 | 6013 | N.E. | (14) | ||
| N.E. | 2397 | 271663 | 507388 | 256748 | 15644 | |||
| N.E. | N.E. | 6013 | 256748 | 324954 | 75616 | |||
| N.E. | N.E. | N.E. | 15644 | 75616 | 76566 |
| 1166729 | 762212 | 62235 | 2907 | N.E. | N.E. | |||
| 762212 | 1169834 | 445774 | 17358 | N.E. | N.E. | |||
| 62235 | 445774 | 644331 | 287041 | 8897 | N.E. | (15) | ||
| 2907 | 17358 | 287041 | 498387 | 229395 | 4896 | |||
| N.E. | N.E. | 8897 | 229395 | 389799 | 169925 | |||
| N.E. | N.E. | N.E. | 4896 | 169925 | 179266 |
4. Discussion on the results
In this section, the location and severity of seismic damage of the existing six-story steel braced frame will be evaluated and compared to its health (undamaged) state. This evaluation is feasible because all the results presented for the stepping eigenfrequencies in Table 3, the target roof displacement in Figure 12, the plastic mechanism in Figure 14 and Figure 15, and the damage stiffness matrices (Eq. 12–15) are interconnected.
Indeed, by knowing the damage stiffness matrix of the planar steel braced frame, the final percent (%) degradation of the stiffness terms within the matrix can be calculated with respect to the stiffness matrix in the health (undamaged) state of frame. This degradation of the stiffness terms is shown in matrix form in Table 4 and Table 5 for the pushover analyses P-1 and P-2 with positive floor forces, respectively. For the pushover analyses P-1 and P-2 with negative floor forces, the corresponding Tables are Table 6and Table 7. The visual representation of the stiffness degradation matrices is shown in Figure 20, Figure 21, Figure 22, Figure 23 and Figure 24, respectively. The percentage (%) deviation observed in the terms of the main diagonal within the damage stiffness matrix with respect to the corresponding terms of the stiffness matrix , demonstrates the magnitude of the seismic damage developed within the floors of the existing six-story steel braced frame at the final step of the pushovers analyses P-1 and P-2 with target displacement . This is fully compatible with the damage images observed in Figure 14 and Figure 15. For an aggregated assessment of the seismic damage of the existing six-story steel braced frame in terms of stiffness degradation rates, the mean values of the respective matrices of Table 4, Table 5, Table 6 and Table 7 should be considered.
This study examines the seismic damage of ductile, planar, multistory steel frames with a concentric X or V-bracing system. In such structures, the developed plastic mechanism is characterized by severe damage or failure of the braces in compression, as well as moderate to severe damage of the braces in tension. Additionally, plastic hinges form at the end-sections of the beams, indicating a beam sway mechanism. However, plastic hinges can also develop in some columns, especially those with high axial forces. This latter issue can be mitigated by employing a staggered configuration for the concentric bracing system, as discussed in the Introduction. Such steel frames with a concentric X or V-bracing structural system, designed according to EN 1998-1 [38], exhibit significant ductile behavior, as demonstrated by the six-story steel braced frame considered in this study.
The terms on the main diagonal of the stiffness matrix correspond to the horizontal dynamic degrees of freedom of the floors of the steel frame (Figure 4). Therefore, the deviation of these terms in the matrix from the corresponding ones in the matrix demonstrates the overall damage occurring at the braces and the end cross-sections of the beams of each floor. It is noted that each dynamic degree of freedom accounts for the behavior of the columns and braces both above and below the respective floor, in addition to the behavior of the beams. From Table 4, Table 5, Table 6 and Table 7, it is observed that the stiffness degradation in the main diagonal due to seismic damage is similar for the P-1 pushover analysis in both the positive and negative directions. The same observation applies to the P-2 pushover analysis in both directions. Additionally, in the P-2 pushover analysis, where an additional top force is applied, the stiffness degradation in the main diagonal is higher on all floors except the first floor. Specifically, this degradation is approximately 40% and 140% greater on the two highest floors compared to the P-1 case. In contrast, on the first floor, stiffness degradation is 12% lower in the P-2 case compared to P-1.
These observations align with the plastic mechanisms illustrated in Figure 15 (P-2) compared to Figure 14 (P-1). In general, the severity of damage in elevation in the P-2 pushover is greater in the upper half and less in the lower half of the steel frame compared to the P-1 case. Specifically, at the fifth floor in the P-2 case, the brace in compression fails while the brace in tension experiences greater deformation. It is noted that in P-1 pushover along the negative direction the brace in compression (Link 14) is only marginally failed, as shown in Figure 19. At the highest floor (sixth floor), both braces in the P-2 case undergo significant deformation. Additionally, in the P-2 case, all the end-sections of beams with negative bending on the fifth-floor experience moderate inelastic deformation, unlike in the P-1 case, where no plastic hinges develop. On the other hand, in the P-2 case, the braces experience lower levels of deformation at the first two floors compared to the P-1 case. Specifically, the two braces in compression on the second floor do not fail, and one of the braces in tension on the first floor remains elastic. Additionally, the end-sections of the beams on the first floor do not develop plastic hinges in the P-2 case, unlike in the P-1 case.
Therefore, it is demonstrated that for a specific seismic damage image in an existing multi-story steel frame with a X or V-bracing system, the stiffness matrix at the health (undamaged) state of the structure degrades, leading to a change in the eigenfrequencies of the structure. These changes are experimentally detected in the field through an instrumental monitoring system. Subsequently, using the eigenfrequency diagram, which is the “key diagram” of the present methodology, the seismic displacement at the top of the frame is revealed. This displacement corresponds to the observed damage and ensures the same eigenfrequency values as those detected in the field. All parameters used in the hybrid “M and P” technique are interrelated, making it a self-proven and accurate damage identification process.
5. CONCLUSSIONS
This paper evaluates the effectiveness of a recently proposed methodology for seismic damage identification by investigating a set of existing, ductile, multistory, planar steel frames with an X or V-bracing structural system. One of these frames is presented here in detail. It is a ductile six-story, steel X-braced frame with four equal spans and a taller first floor. The X-braces are arranged in a staggered configuration in the upper half of the frame, while the first two floors feature two X-braces positioned in a stacked configuration. The proposed damage identification methodology employs a hybrid technique, called the “M and P” technique, which integrates the instrumental monitoring of the structure (M) with pushover analysis (P). According to this methodology, the capacity curve of the multistory steel frame at a specific target roof displacement is combined with the stepping eigenfrequency (Hz) diagram of the frame. This diagram is plotted as a function of the target seismic inelastic displacement at the top of the frame. To achieve this, a series of pushover and stepping modal analyses are performed with a gradually increasing target displacement, each corresponding to a specific value of the mean chord angle rotation profile (rad) of the frame. In the pushover analyses, two elevation patterns of floor forces are used, one with an additional top floor force to account for the influence of higher modes on the seismic behavior of steel frames with more than four floors. Subsequently, the fundamental eigenfrequency (Hz) of the existing multistory steel braced frame, previously detected through a multi-channel accelerometer network installed on the steel frame for instrumental health monitoring, is inserted into the eigenfrequencies (Hz) diagram. Consequently, the inelastic roof displacement of the steel frame is revealed, corresponding to the fundamental eigenfrequency measured in the field, and thereby indicating the seismic damage state of the existing steel braced frame. The damage image of the existing steel braced frame can now be directly identified in the final step of a pushover analysis with a target displacement . At this final step, the stepping stiffness matrix as well as the damage stiffness matrix of the existing steel braced frame can also be determined. The latter matrix is fully compatible with the location and magnitude of seismic damage within the stories of the existing steel braced frame, thereby confirming the seismic damage image as observed at the target displacement in the pushover analysis.
All parameters of the hybrid “M and P” technique are interrelated, ensuring an accurate estimation of the location and magnitude of seismic damage in multistory steel frames with concentric X or V-bracing systems. Specifically, the inelastic roof displacement, damage stiffness matrix, and eigenvalues are directly linked to the field-measured fundamental eigenfrequency, as determined through the instrumental monitoring process. Thus, the present methodology for seismic damage identification provided a highly reliable assessment of seismic damage in the existing six-story, planar, steel X-braced frame under investigation.
The effectiveness of the “M and P” technique for damage identification has been validated in regular in-plan RC buildings with a frame structural system or with a dual structural system equivalent to a wall system as per ΕΝ 1998-1. Also, it has also been confirmed in other structures, including RC bridges along their longitudinal direction. As demonstrated in this study, the “M and P” technique remains applicable to regular in-plan steel X or V-braced buildings that are regular in elevation or exhibit minimal irregularity. Future research should investigate its applicability in tall steel braced buildings with significant elevation irregularities, as well as in irregular in-plan steel braced buildings. It is important to note that the “M and P” technique is not suitable for steel buildings that exhibit a soft-floor plastic mechanism, particularly those with a frame structural system lacking capacity design.
References
- Basseville, M., Benveniste, A., Goursat, M., Hermans, L., Mevel, L., Auweraer, H. (2001). Output-only Subspace-based structural identification: From theory to industrial testing practice. J. Dyn. Syst. Meas. Control. Trans. ASME, 123, 668–676.
- Brincker, R., Zhang, L., Andersen, P. (2001). Modal identification of output-only systems using frequency domain decomposition. Smart Mater. Struct. J., 10, 441–445.
- Peeters, B. (2000). Identification and Damage Detection in Civil Engineering. Ph.D. Thesis, Katholieke Universiteit, Leuven, Belgium. Available online: https://www.researchgate.net/publication/238331491_System_Identification_and_Damage_Detection_in_Civil_Engineering.
- Peeters, B., Roek, G. (2001). Stochastic System Identification for Operational Modal Analysis: A Review. J. Dyn. Syst. Meas. Control., 123, 659–667.
- Wenzel, H., Pichler, D. (2005). Ambient Vibration Monitoring. John Wiley & Sons, Ltd.: England, UK.
- Overschee, P., De Moor, B. (1996). Subspace Identification for Linear Systems: Theory-Implemented-Applications. Kluwer Academic Publishers: Dordrecht, The Netherlands.
- Papoulis, A. (1985). Signal Analysis. International Student Edition, McGraw-Hill Book: New York, NY, USA.
- Oppenheim, A., Schafer, R. (1999). Digital Signal Processing. Prentice-Hall, Inc., Publication: Englewood Cliffs, NJ, USA. Available online: https://research.iaun.ac.ir/pd/naghsh/pdfs/UploadFile_2230.pdf.
- Bendat, J., Piersol, A. (2010). Random Data Analysis and Measurement Procedures. 4th ed.; JohnWiley & Sons, Inc. Publication: Hoboken, NJ, USA. Available online: https://www.wiley.com/en-gb/Random+Data:+Analysis+and+Measurement+Procedures,+4th+Edition-p-9780470248775.
- Makarios, T. (2012). Identification of the mode shapes of spatial tall multi-storey buildings due to earthquakes. The new “modal time-histories” method. J. Struct. Des. Tall Spec. Build., 21, 621–641.
- Dragos, K., Makarios, T.K., Karetsou, I., Manolis, G.D., Smarsly, K. (2020). Detection and Correction of Synchronization-induced Errors in Operational Modal Analysis. J. Arch. Appl. Mech. Springer, 90, 1547–1567.
- Zimmerman, D.C., Kaouk, M. (1994). Structural damage detection using a minimum rank update theory. J. Vib. Acoust., 116, 222–231.
- Kaouk, M., Zimmerman, D.C. (1994). Structural damage assessment using a generalized minimum rank perturbation theory. AIAA J., 32, 836–842.
- Amani, M.G., Riera, J.D., Curadelli, R.O. (2007). Identification of changes in the stiffness and damping matrices of linear structures through ambient vibrations. Struct. Control. Health Monit. J., 14, 1155–1169.
- Zhang, S., Wang, H., Wang,W., Chen, S. (2010). Damage Detection in Structures Using Artificial Neural Networks. In Proceedings of the International Conference on Artificial Intelligence and Computational Intelligence, Sanya, China, 23–24 October 2010; pp. 207–210. Available online: https://ieeexplore.ieee.org/document/5656766.
- Domaneschi, M., Limongelli, M.P., Martinelli, L. (2014). Damage Identification in a benchmark Cable-Stayed Bridge using the Interpolation Method. In Proceedings of the 7th European Workshop on Structural Health Monitoring, La Cité, Nantes, France, 8–11 July 2014. Available online: https://www.researchgate.net/ publication/281947001_Damage_Identification_in_a_Benchmark_Cable-StayedBridgeUsing_the_Interpola-tion _Method.
- Domaneschi, M., Limongelli, M.P., Martinelli, L. (2015). Damage detection and localization on a Cable-Stayed Bridge. Earthq. Struct., 5, 1113–1126.
- Stubbs, N., Kim, J-T., Farrar, C. (1995). Field verification of a nondestructive damage localization and severity estimation algorithm. SPIE International Society for Optical; 210-210.
- Cui, H., Xu, X., Peng, W., Zhou, Z., Hong, M. (2018). A damage detection method based on strain modes for structures under ambient excitation. Measurement; 125:438–46.
- Sadeghi, F., Yu, Y., Zhu, X., Li, J. (2021). Damage identification of steel-concrete composite beams based on modal strain energy changes through general regression neural network. Eng Struct; 244:112824.
- Hooman, N., Ashrafpoor, A., Aziminejad, A. (2023). Damage identification in steel frames using dual-criteria vibration-based damage detection method and artificial neural network, Structures, Volume 51, 1833-1851, ISSN 2352-0124. [CrossRef]
- https://www.sciencedirect.com/science/article/pii/S2352012423004393.
- Pandey, A.K., Biswas, M. (1994). Damage detection in structures using changes in flexibility. J Sound Vib; 169(1):3–17.
- Le, N., Nguyen, A., Thambiratnam, D., Chan, T., Khuc, T. (2020). Locating and quantifying damage in beam-like structures using modal flexibility-based deflection changes. Int J Struct Stab Dyn; 20(10):2042008.
- Bernagozzi, G., Ventura, C.E., Allahdadian, S., Kaya, Y., Landi, L., Diotallevi, P.P. (2020). Output only damage diagnosis for plan-symmetric buildings with asymmetric damage using modal flexibility-based deflections. Eng Struct; 207:110015.
- Reuland, Y., Martakis, P., Chatzi, E. (2023). A Comparative Study of Damage-Sensitive Features for Rapid Data-Driven Seismic Structural Health Monitoring. Appl. Sci., 13, 2708.
- Nazari, F., Baghalian, S. (2011). A new Method for Damage Detection in symmetric beams using artificial neural network and Finite Element Method. Int. J. Eng. Appl. Sci. (IJEAS), 3, 30–36. Available online: https://dergipark.org.tr/en/pub/ijeas/issue/23578/251156.
- Martakis, P., Reuland, Y., Stavridis, A., Chatzi, E. (2023). Fusing damage-sensitive features and domain adaptation towards robust damage classification in real buildings. Soil Dyn. Earthq. Eng., 166, 107739.
- Lubrano Lobianco, A., Del Zoppo, M., Di Ludovico, M. (2021). Seismic Damage Quantification for the SHM of Existing RC Structures. In Civil Structural Health Monitoring, CSHM 2021. Lecture Notes in Civil Engineering, Rainieri, C., Fabbrocino, G., Caterino, N., Ceroni, F., Notarangelo, M.A., Eds., Springer: Cham, Switzerland, Volume 156, pp. 177–195, ISBN 978-3-030-74257-7.
- Pepe, V., De Angelis, A., Pecce, M.R. (2019). Damage assessment of an existing RC infilled structure by numerical simulation of the dynamic response. J. Civil. Struct. Health Monit., 9, 385–395.
- Li, D., Nie, J.H., Wang, H., Yan, J.B., Hu, C.X., Shen, P. (2023). Damage location, quantification and characterization of steel-concrete composite beams using acoustic emission. Eng. Struct., 283, 115866.
- Makarios, T. (2023). Damage Identification in plane multi-storey reinforced concrete frame. Open Constr. Build. Technol. J., 17, 1–10.
- Makarios, T.K., Bakalis, A.P. (2023). Identification of Damage in Planar Multistory Reinforced Concrete Frames Developing a Beam-Sway Plastic Mechanism Using the “M and P” Technique. Buildings, 13, 2316.
- Bakalis, A., Makarios, T., Lekidis, V. (2024). The “M and P” Technique for Damage Identification in Reinforced Concrete Bridges. Infrastructures, 9, 18. [CrossRef]
- P.C. Ashwin Kumar, Dipti Ranjan Sahoo, Abhay Kumar. (2018). Seismic response of concentrically braced frames with staggered braces in split-x configurations, Journal of Constructional Steel Research, Volume 142, 17-30, ISSN 0143-974X. [CrossRef]
- Dia Eddin Nassani, Ali Khalid Hussein, Abbas Haraj Mohammed. (2017). Comparative Response Assessment of Steel Frames With Different Bracing Systems Under Seismic Effect, Structures, Volume 11, 229-242, ISSN 2352-0124. [CrossRef]
- Bakalis, A., Makarios, T. (2021). Seismic Enforced-Displacement pushover procedure on multistorey R/C buildings. Eng. Struct., 229, 111631. [CrossRef]
- EN 1998-3 (2005). Eurocode 8: Design of Structures for Earthquake Resistance—Part 3: Assessment and Retrofitting of Buildings. European Committee for Standardization: Brussels, Belgium.
- EN 1998-1 (2004). Eurocode 8: Design of Structures for Earthquake Resistance—Part 1: General Rules, Seismic Actions and Rules for Buildings. European Committee for Standardization: Brussels, Belgium.
- Structural Analysis Program SAP2000 v23 (2021). Computers and Structures, Inc.: Walnut Creek, CA, USA, Available online: www.csiamerica.com.
- Park, R., Paulay, T. (1975). Reinforced Concrete Structures. John Wiley & Sons, Inc.: New York, NY, USA.
Figure 1.
Pushover capacity curve of a multistory steel braced frame. Target displacement at NC.
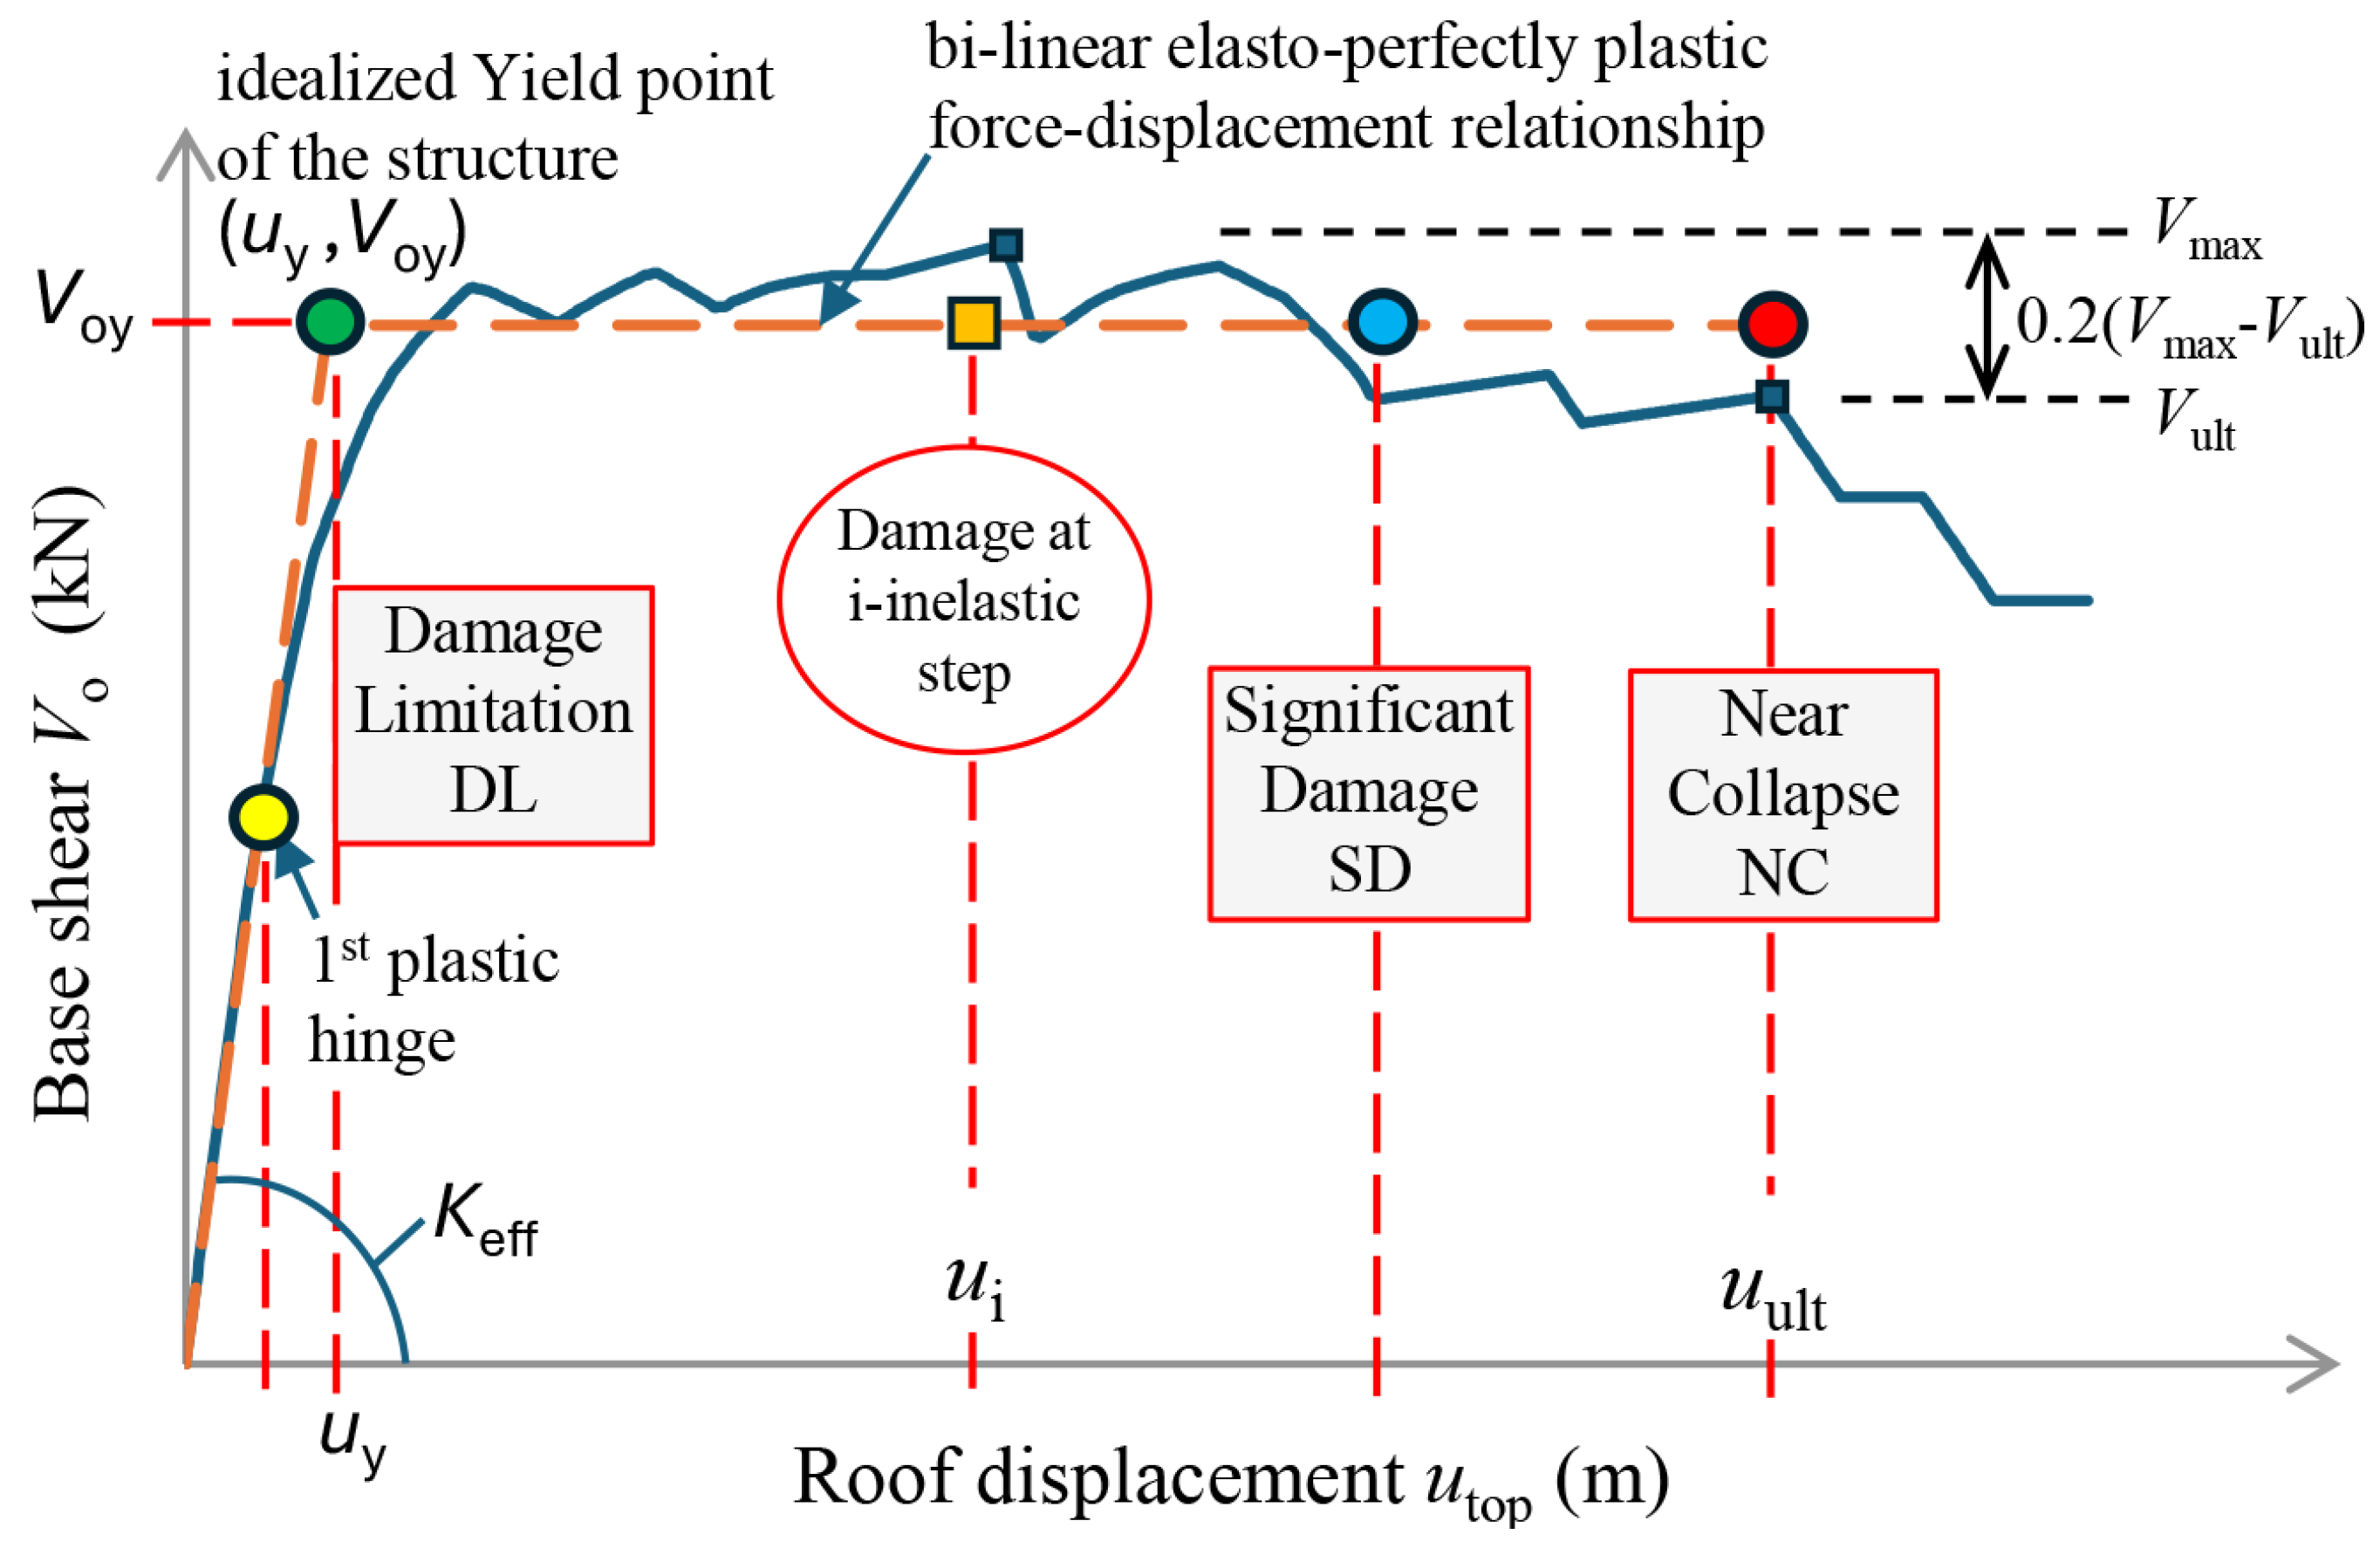
Figure 2.
Diagram of stepping eigenfrequencies f (Hz) of a multistory steel braced frame in the nonlinear area.
Figure 2.
Diagram of stepping eigenfrequencies f (Hz) of a multistory steel braced frame in the nonlinear area.
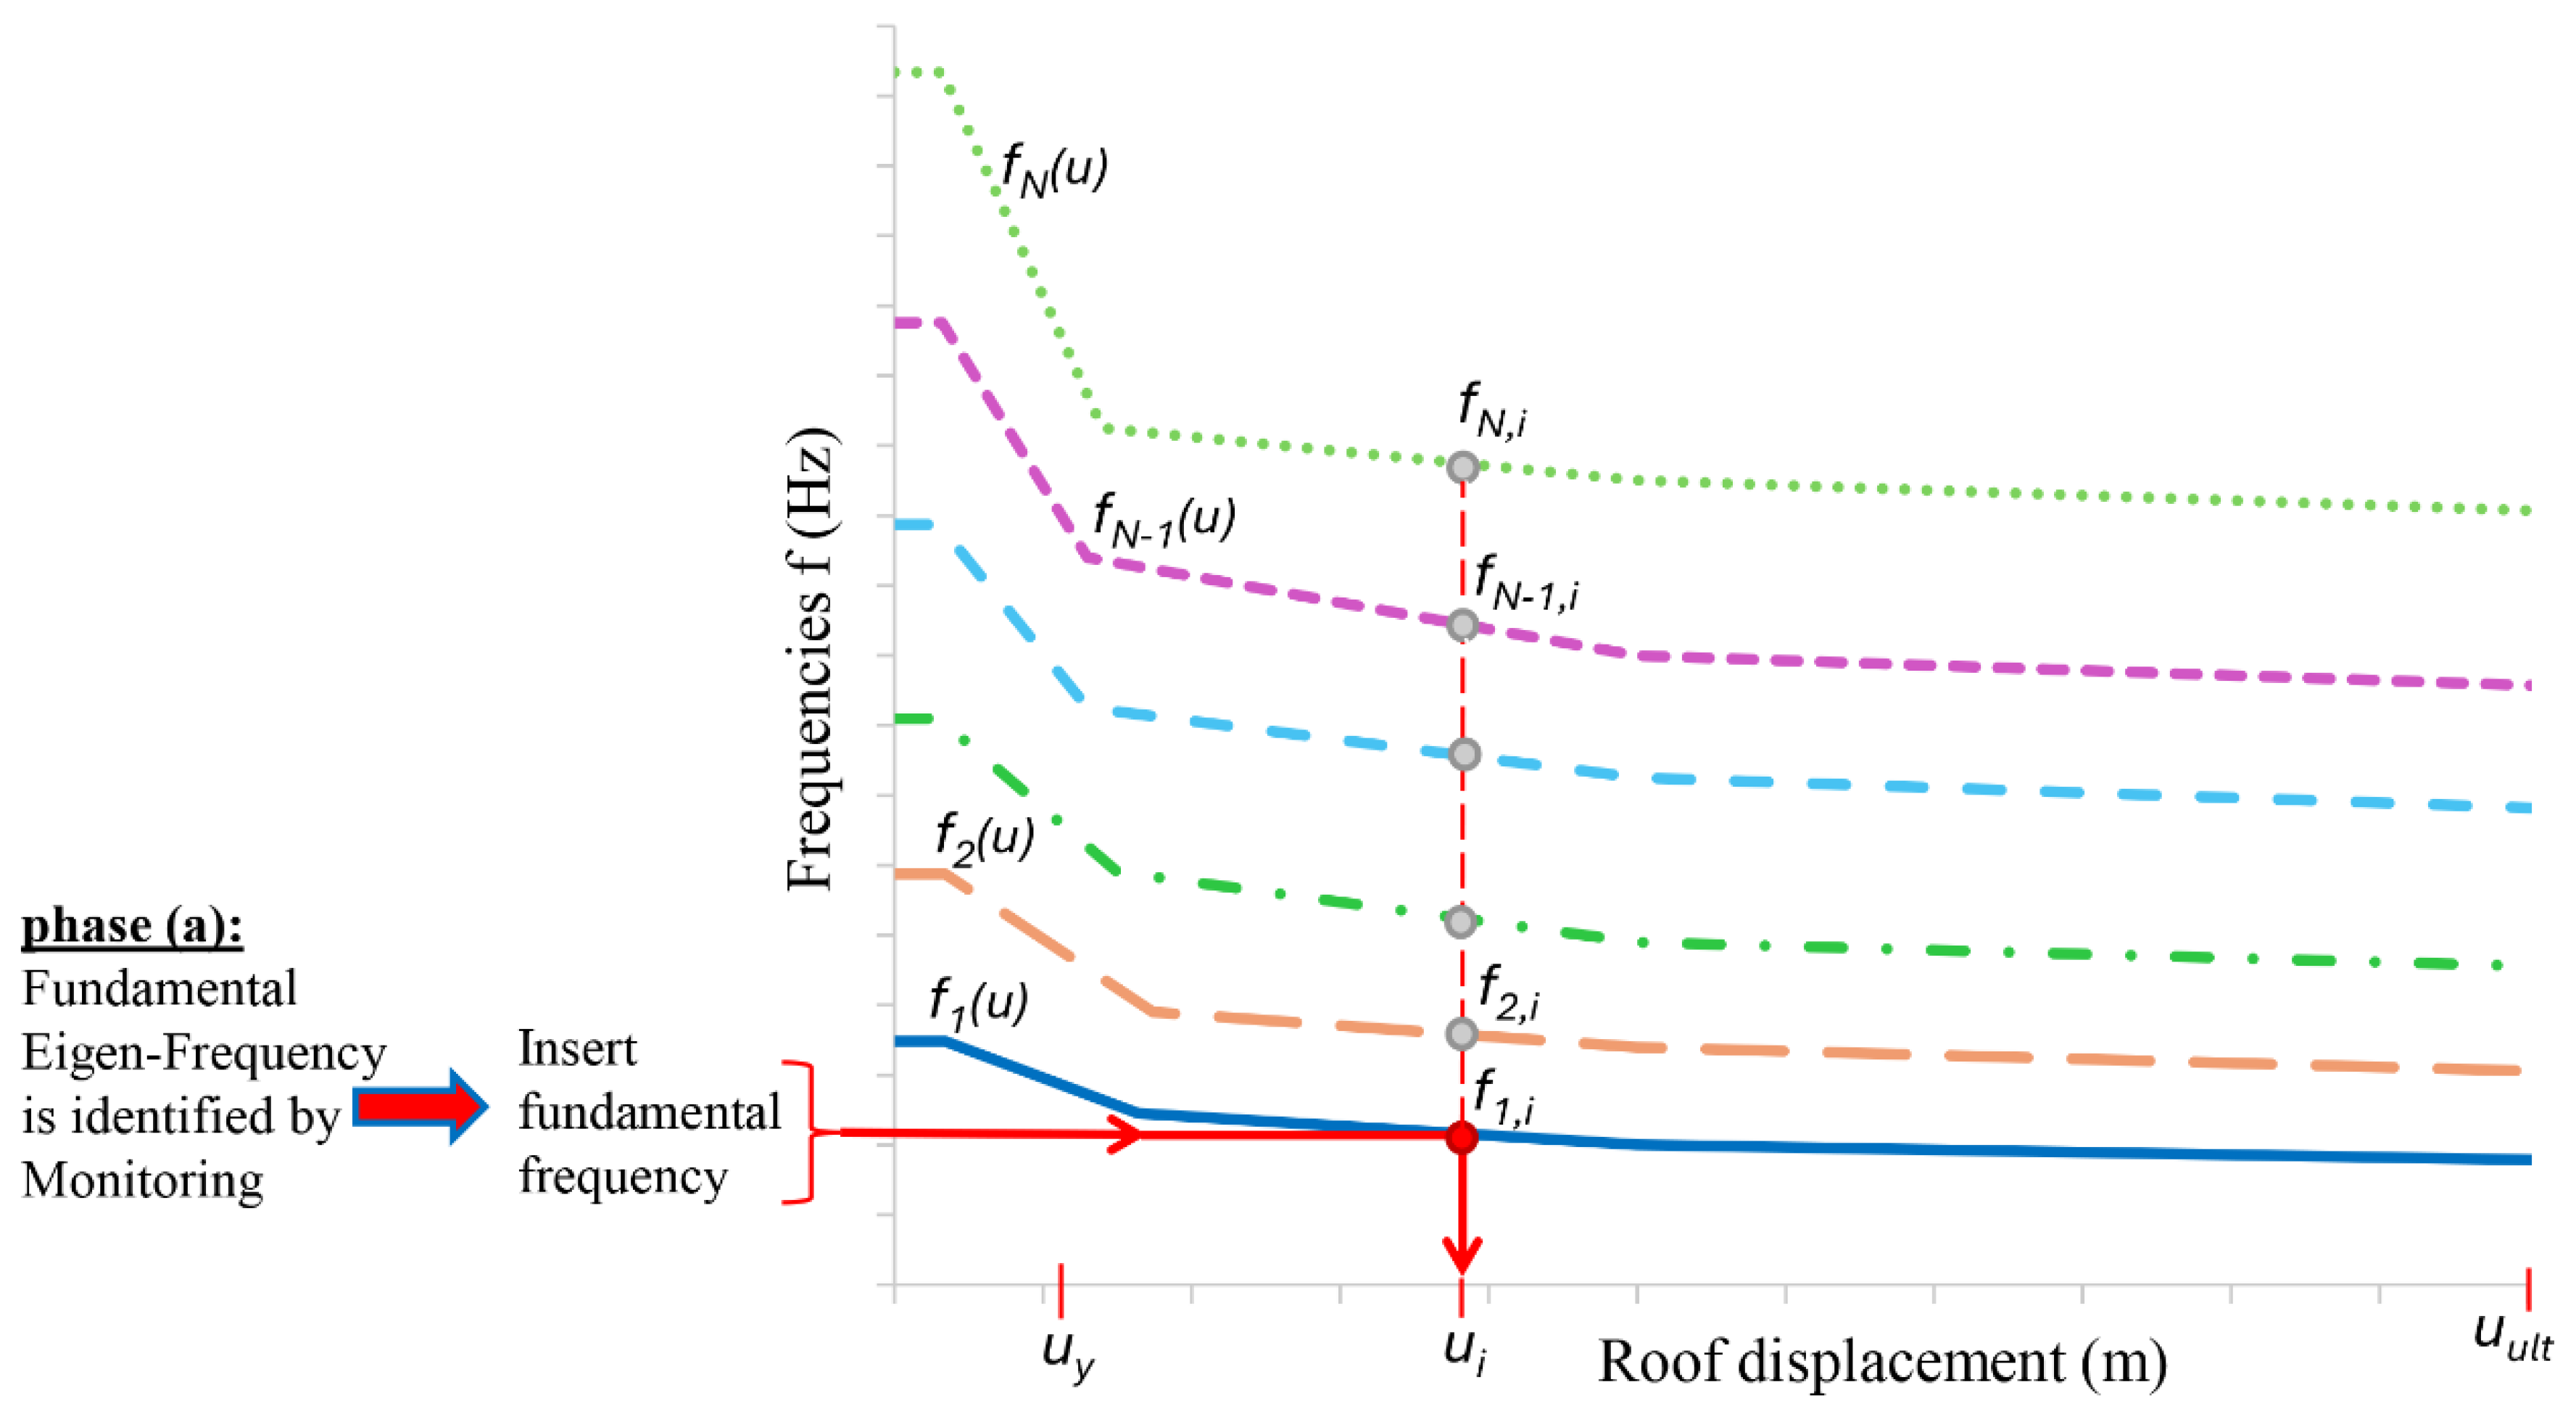
Figure 3.
Flowchart for identification of damage in existing steel braced frames using the “M and P” technique.
Figure 3.
Flowchart for identification of damage in existing steel braced frames using the “M and P” technique.
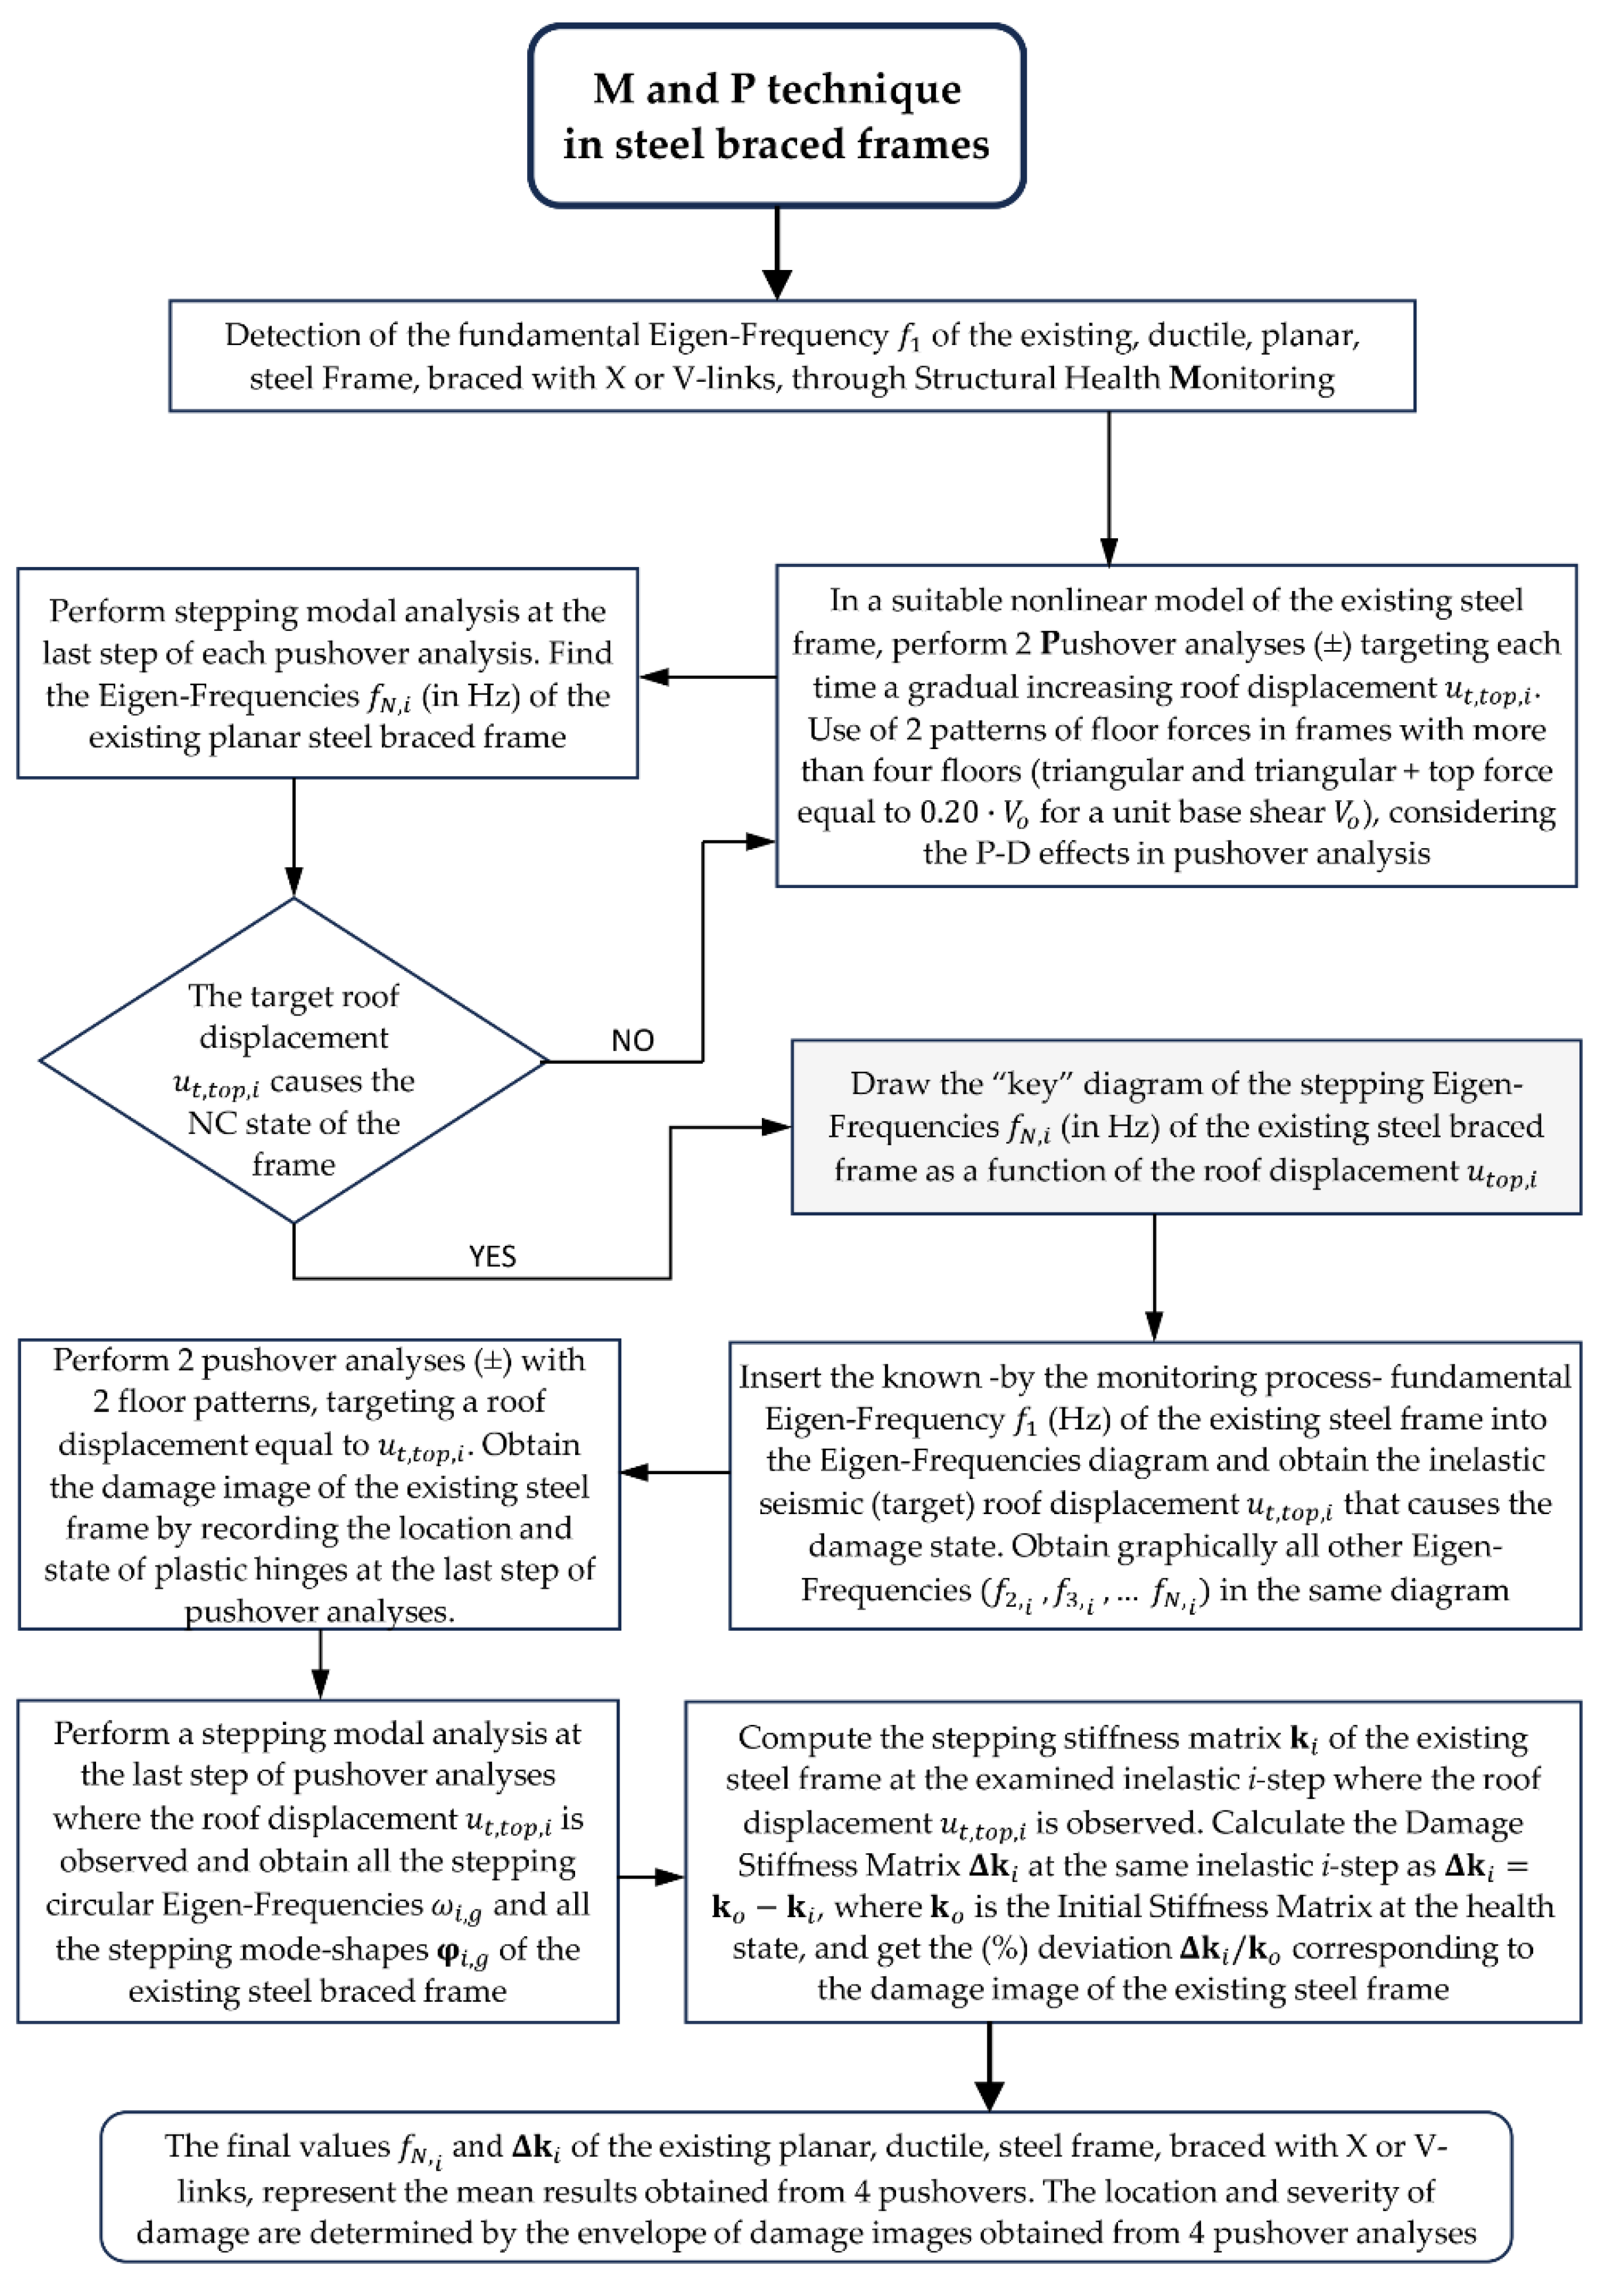
Figure 4.
Six-story, planar, steel braced frame: (a) static model for the pushover sets (P-1 triangular pattern, P-2 triangular pattern + top force), (b) dynamic model.
Figure 4.
Six-story, planar, steel braced frame: (a) static model for the pushover sets (P-1 triangular pattern, P-2 triangular pattern + top force), (b) dynamic model.
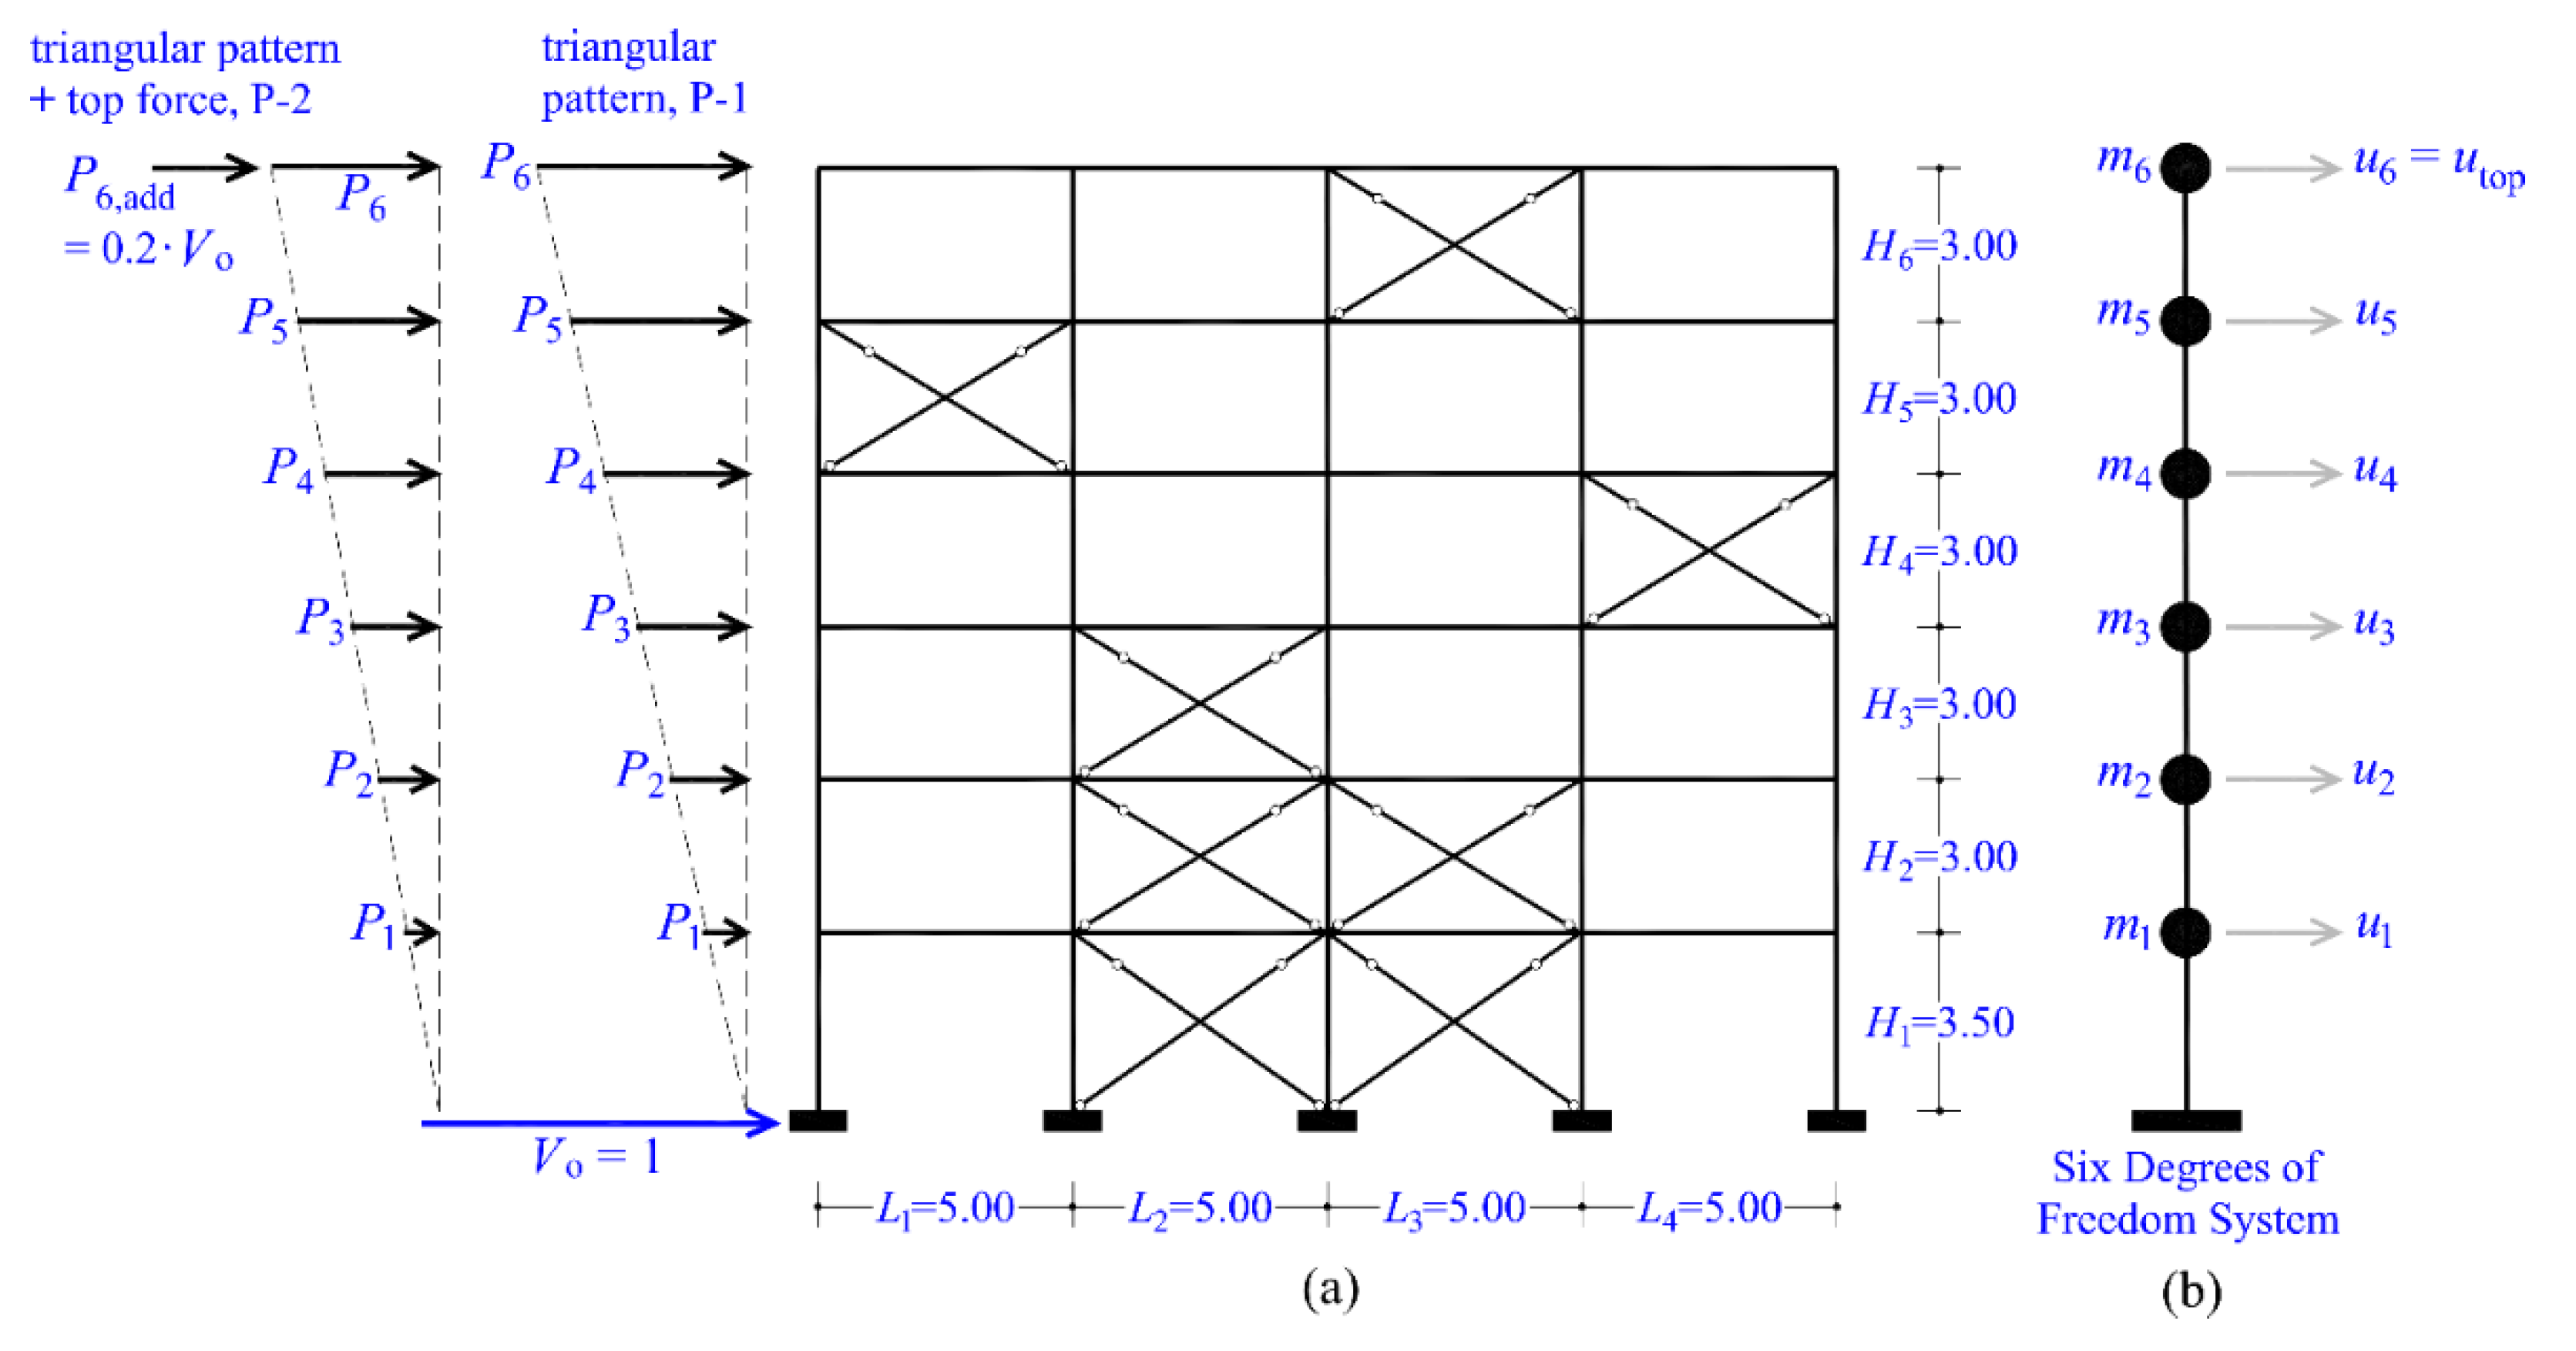
Figure 5.
Stress-strain diagram of structural steel S235.
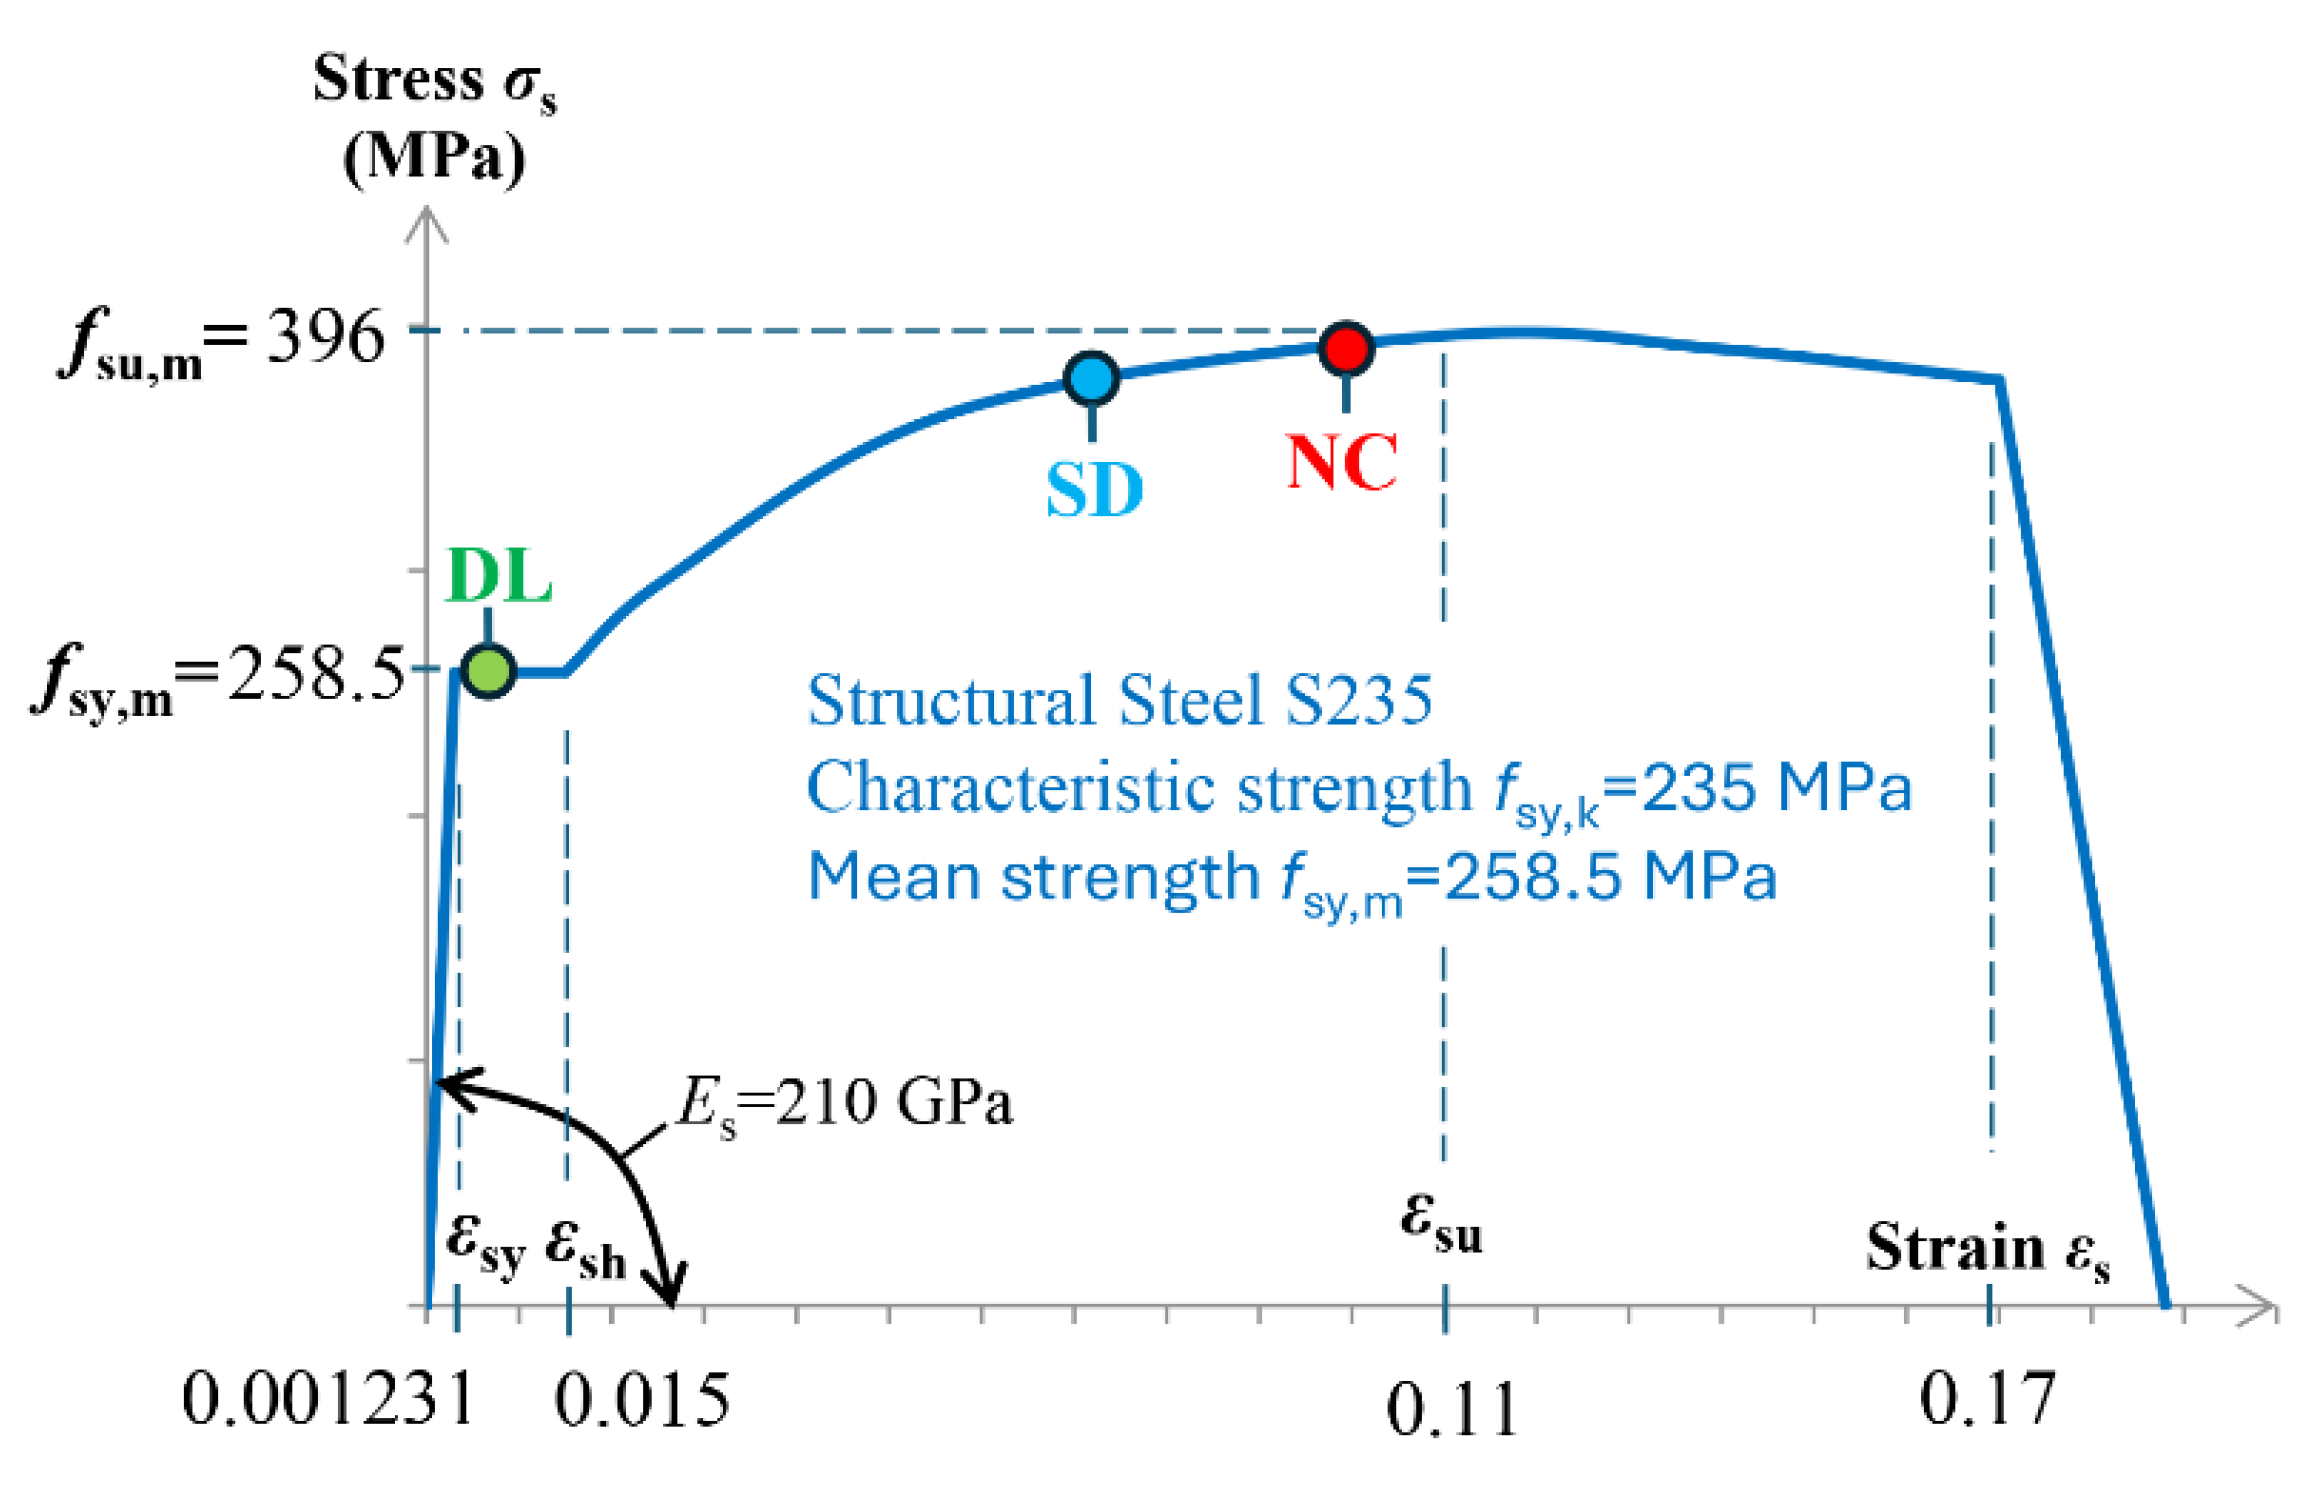
Figure 6.
Steel sections in steel braced frame. Columns/beams are modeled as Frame elements while braces as Links.
Figure 6.
Steel sections in steel braced frame. Columns/beams are modeled as Frame elements while braces as Links.
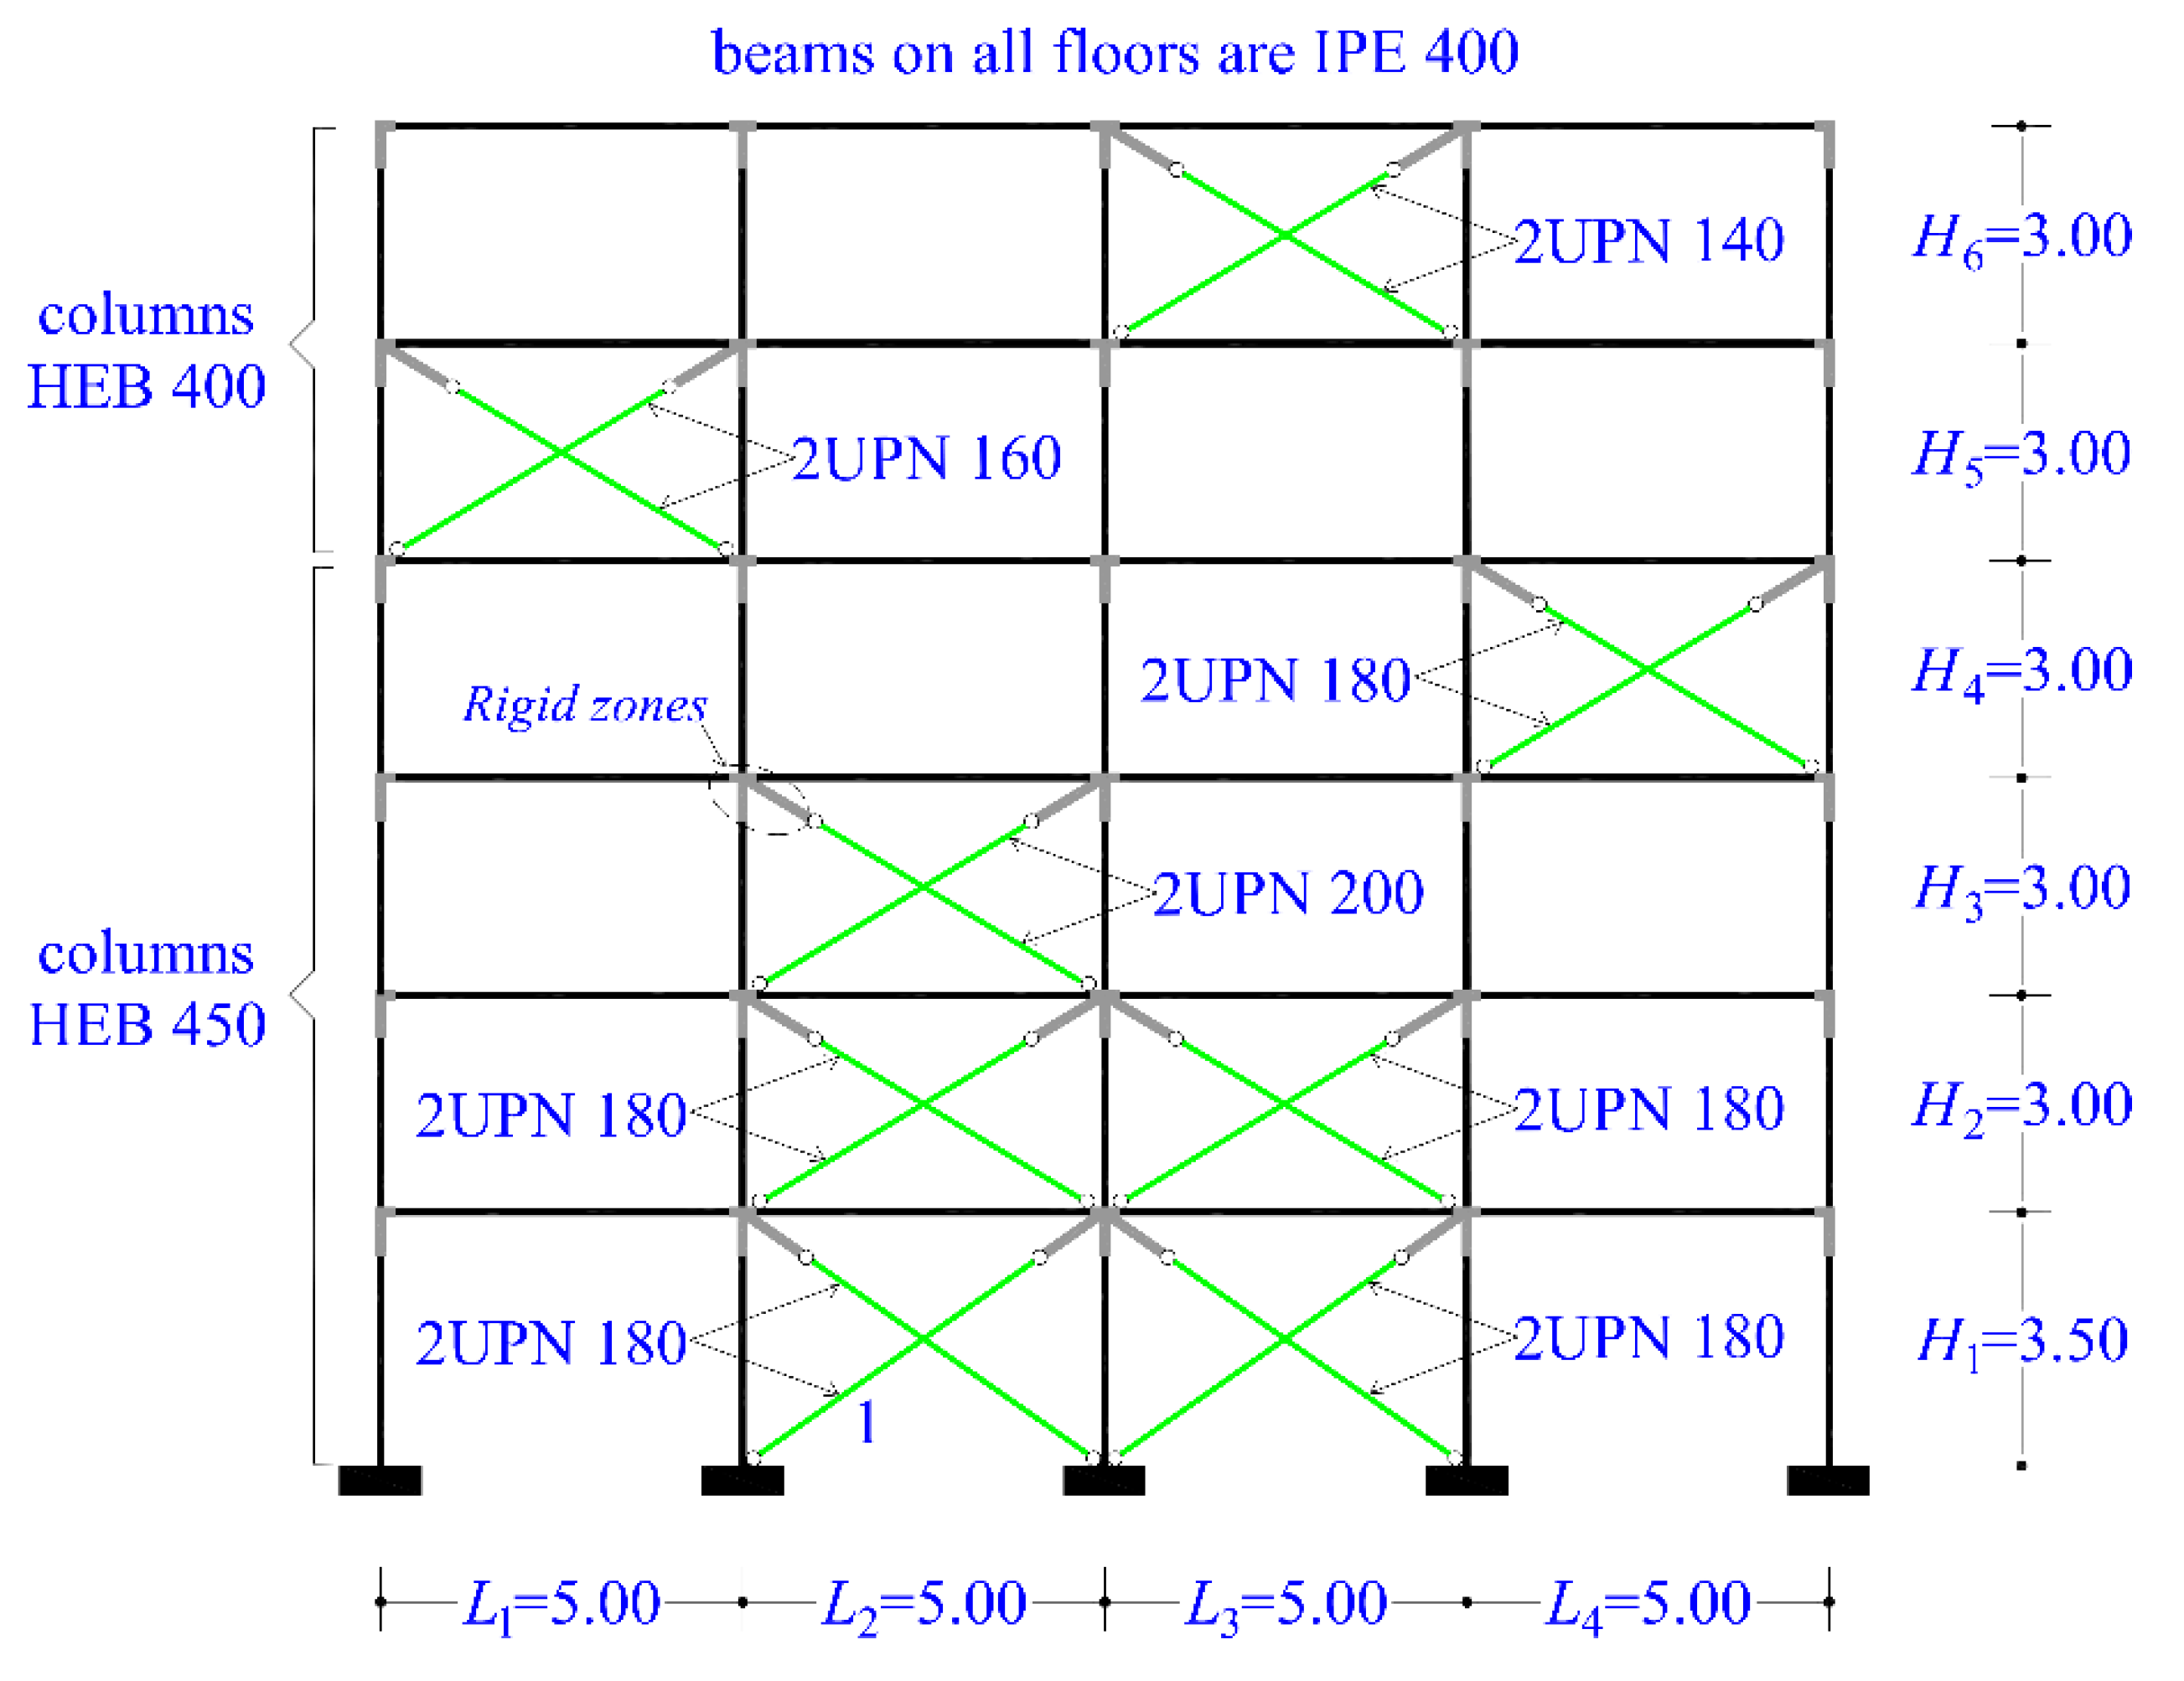
Figure 7.
Constitutive relationships of Link elements simulating the axial behavior of vertical X-braces.
Figure 7.
Constitutive relationships of Link elements simulating the axial behavior of vertical X-braces.
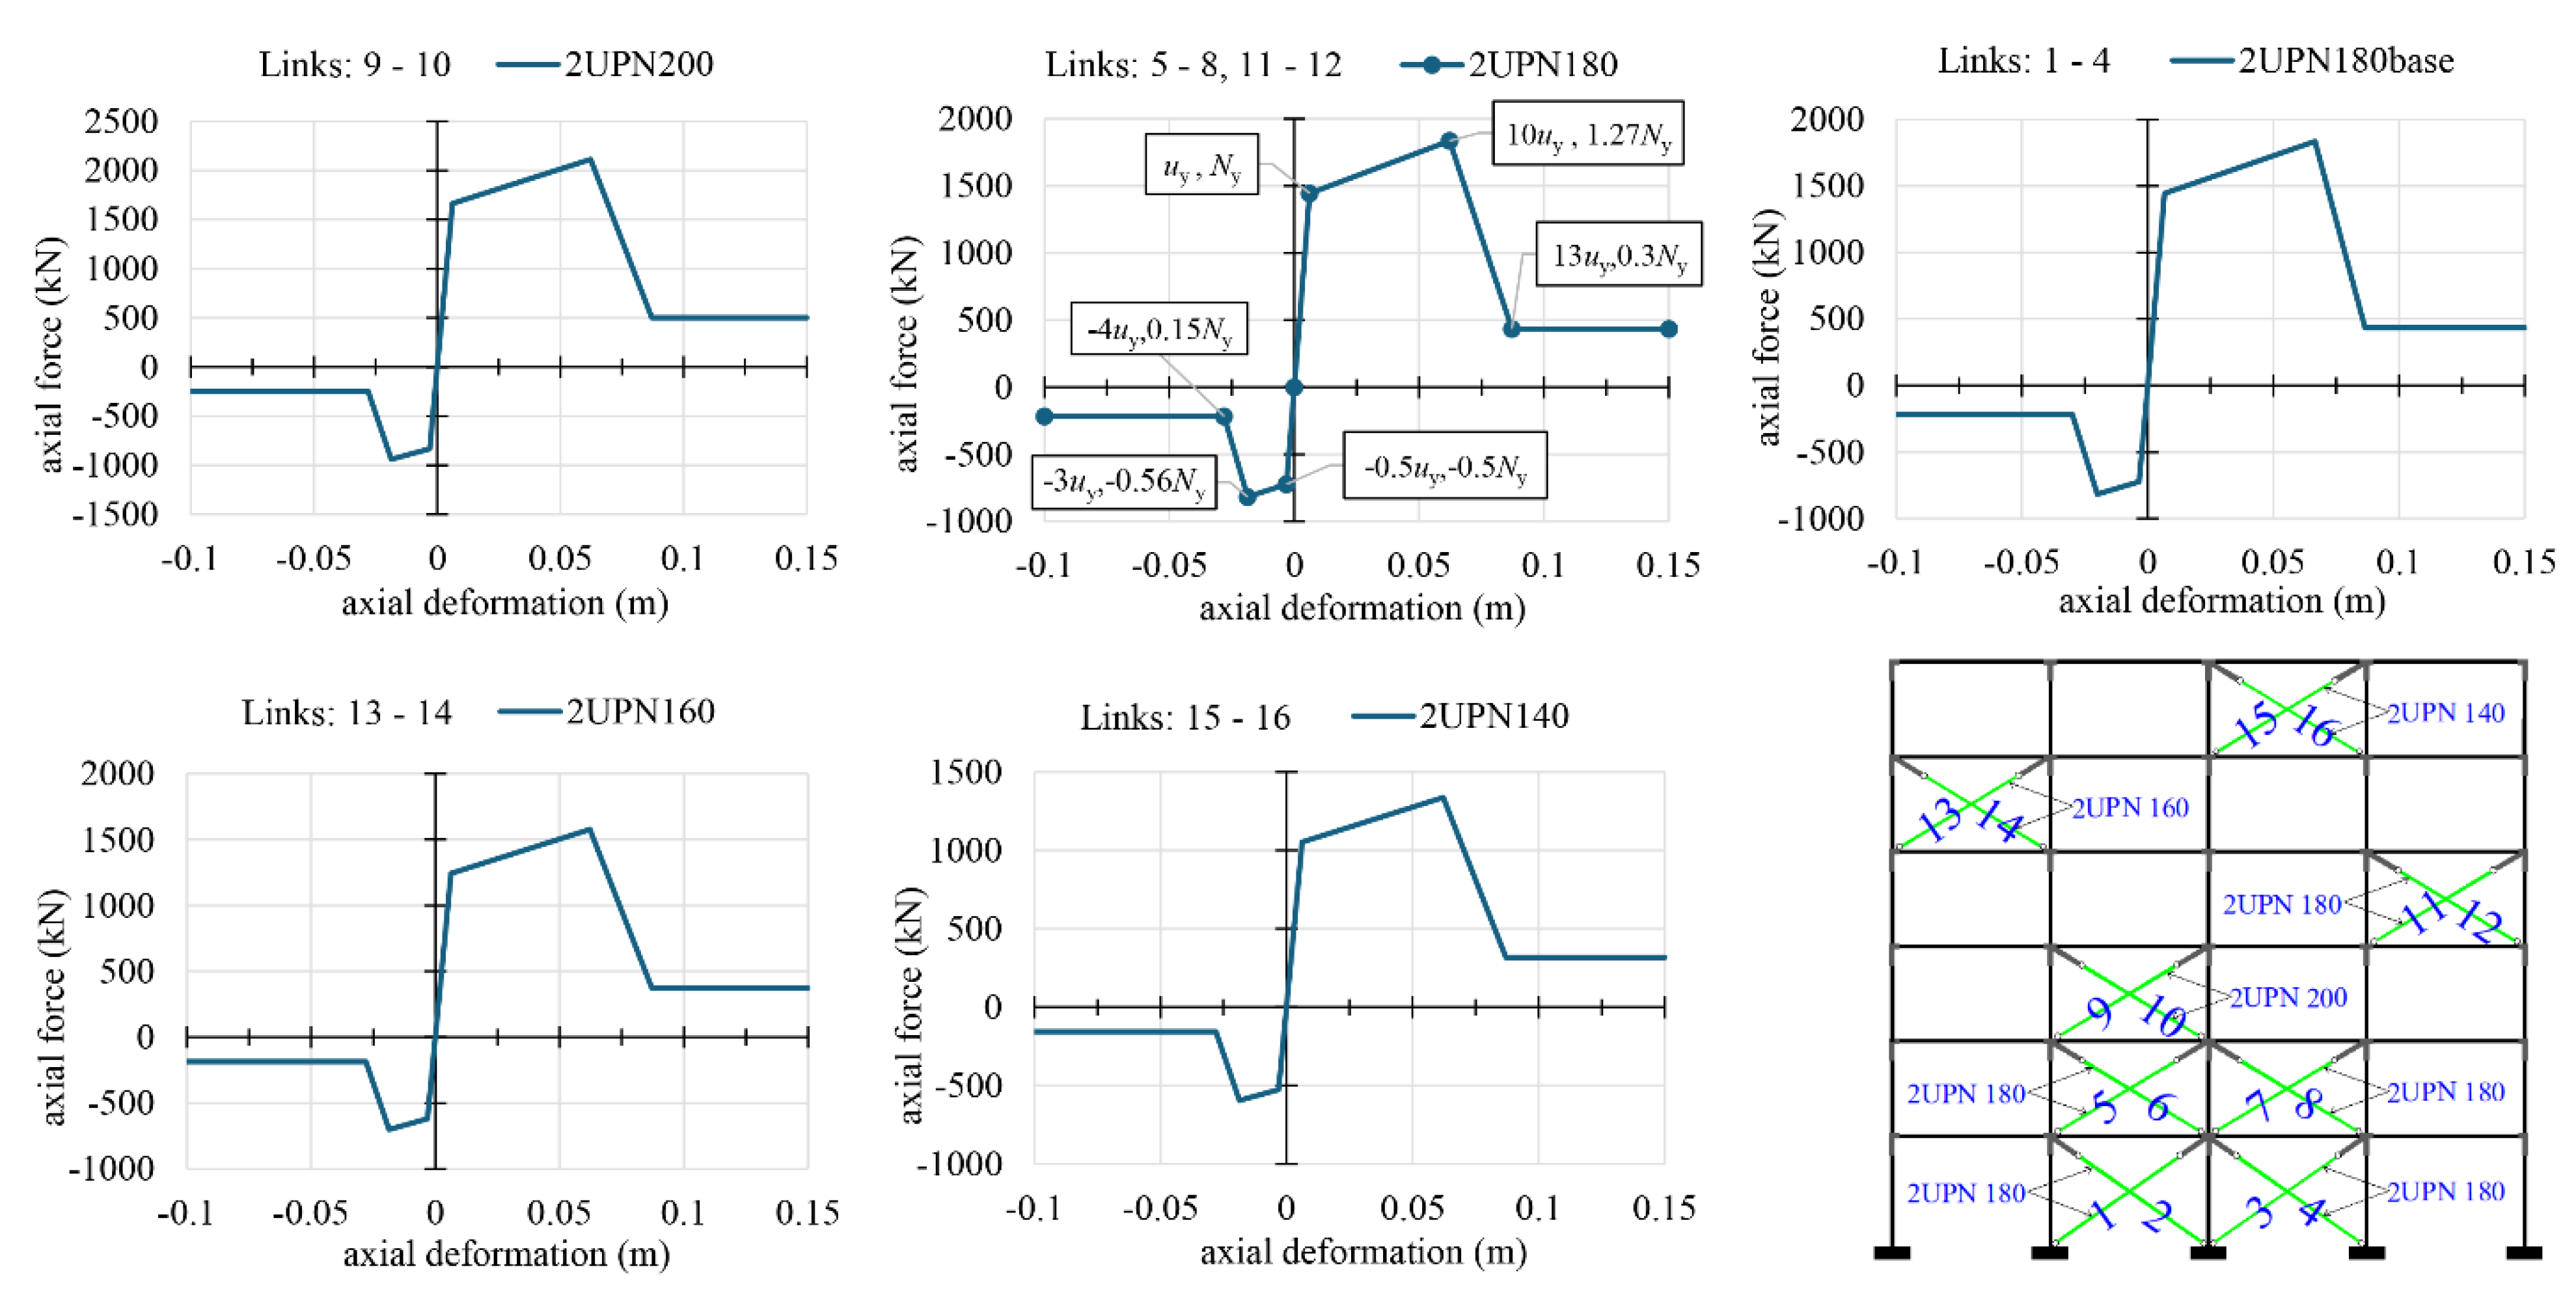
Figure 8.
Capacity curves of the steel braced frame resulted from pushover analyses along the positive and negative directions using the two floor force patterns P-1 and P-2 (target displacement to NC state).
Figure 8.
Capacity curves of the steel braced frame resulted from pushover analyses along the positive and negative directions using the two floor force patterns P-1 and P-2 (target displacement to NC state).
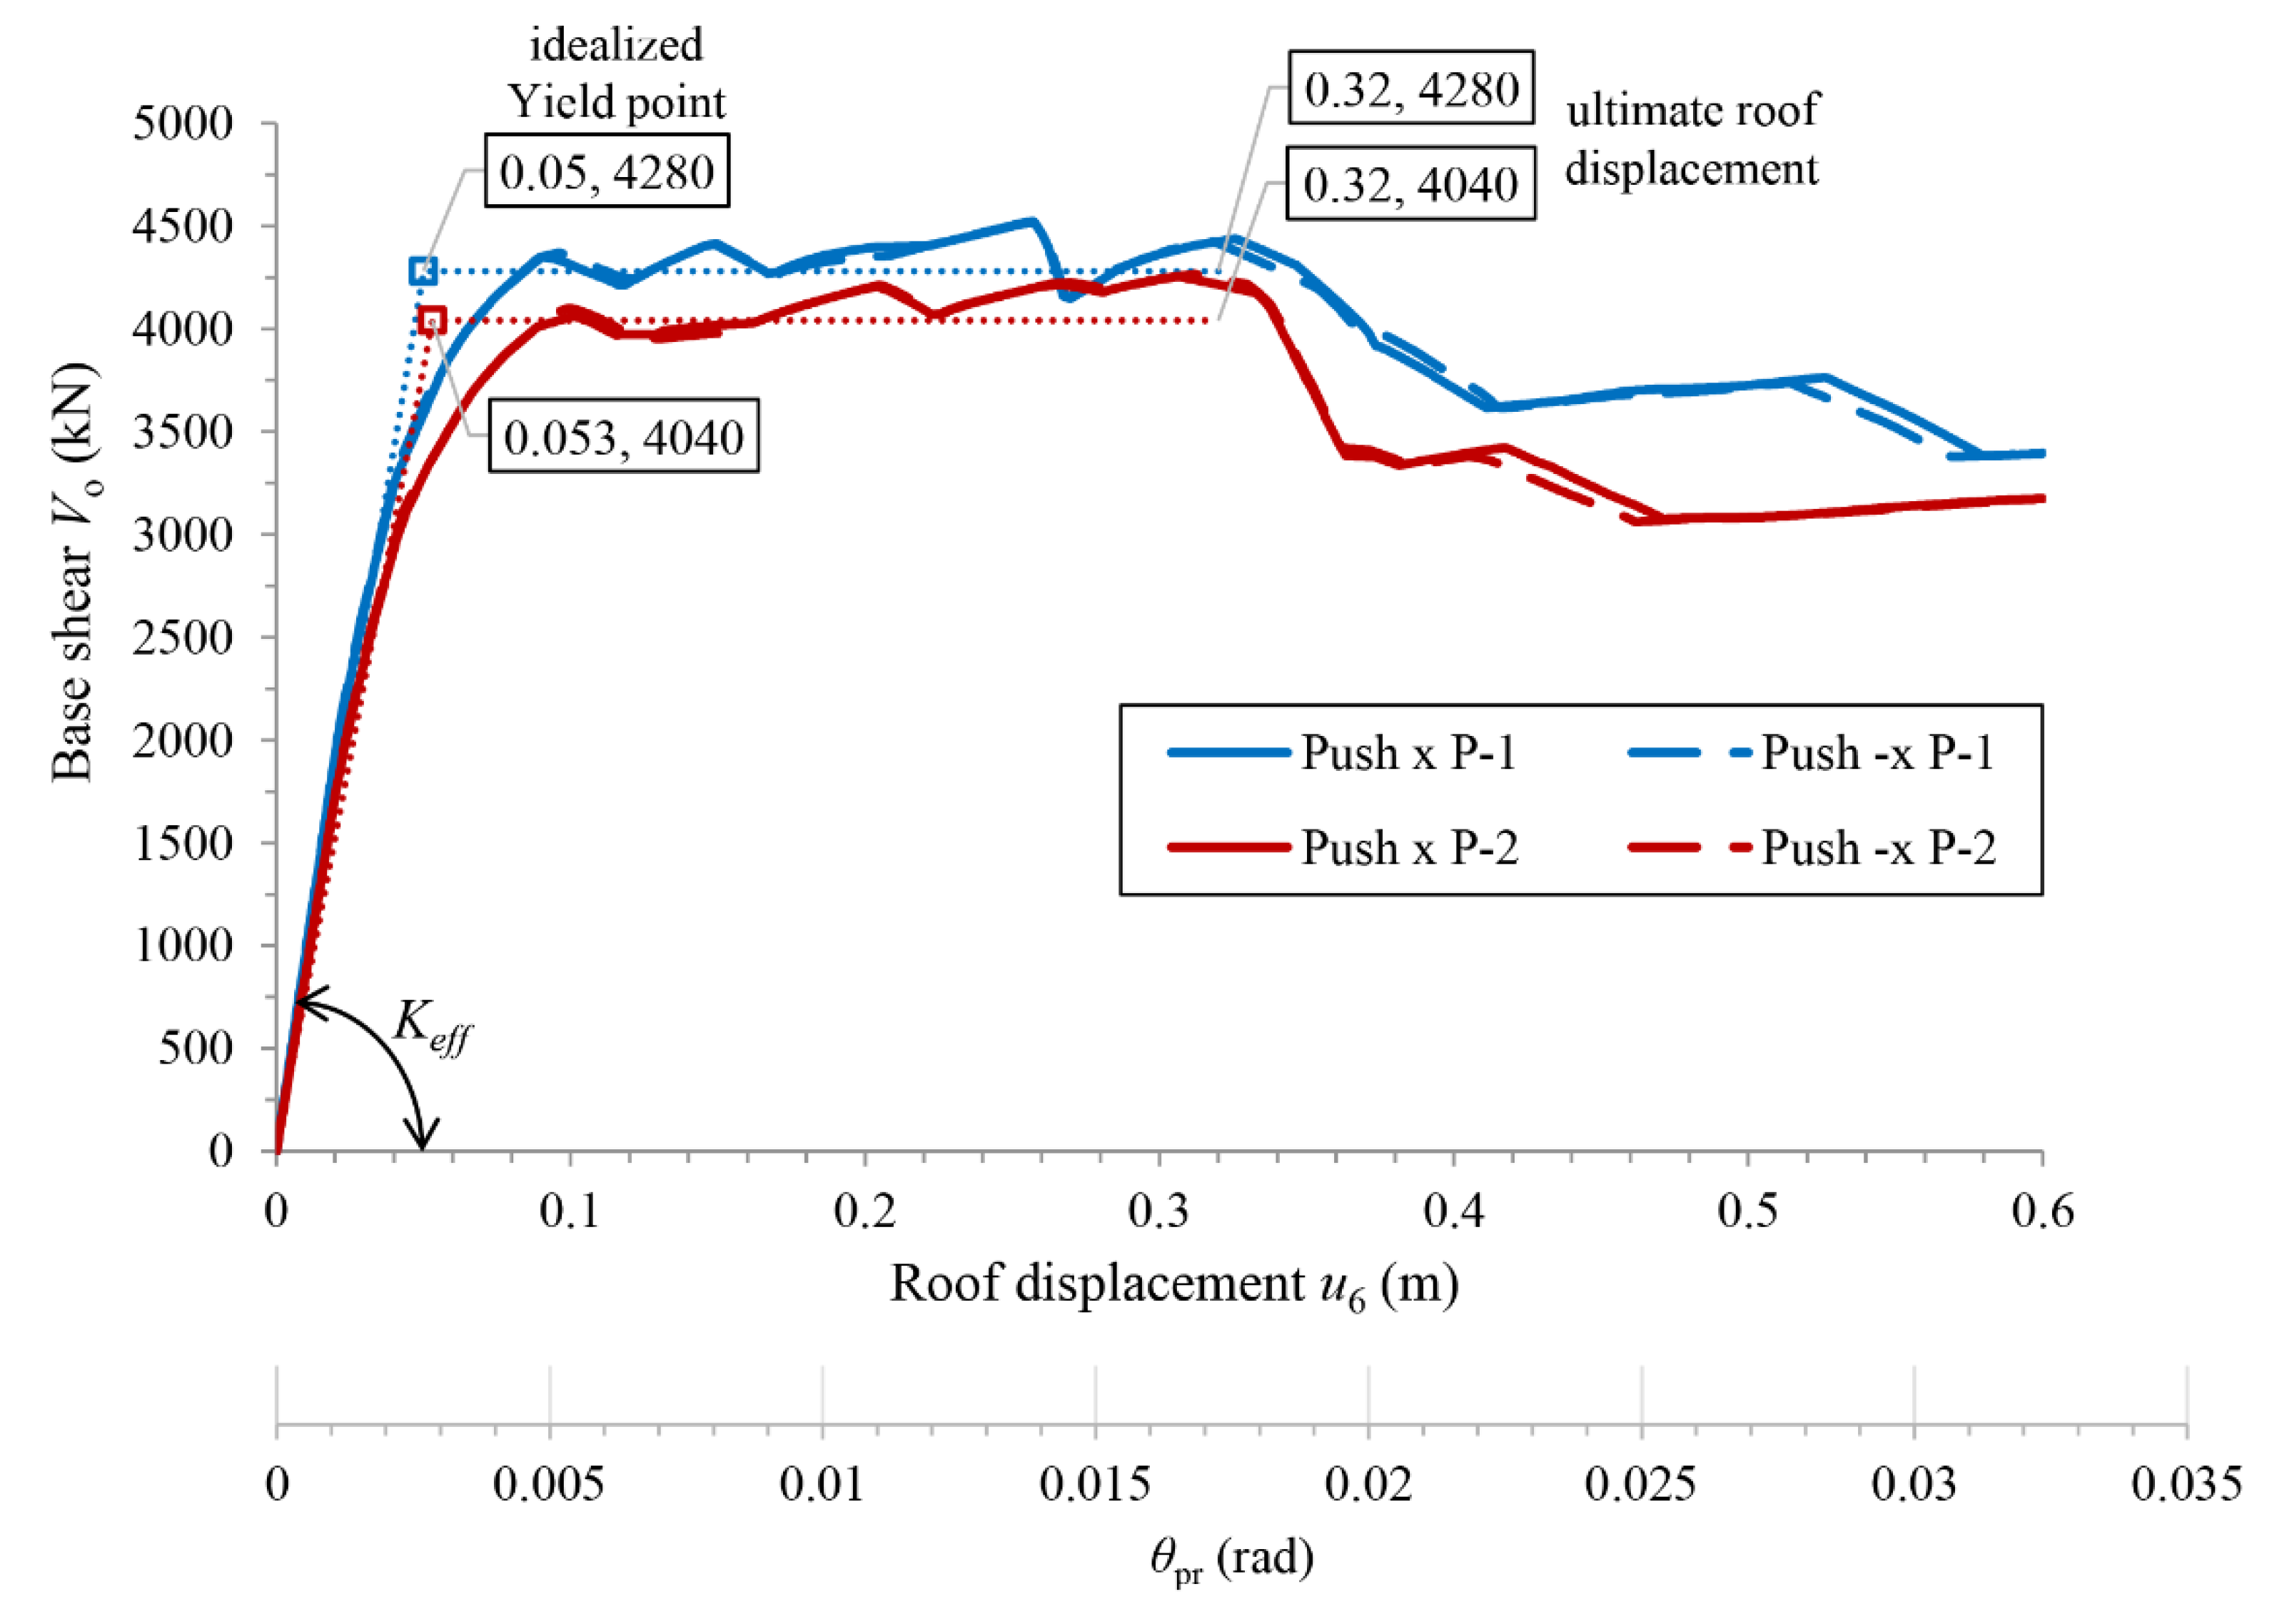
Figure 9.
The chord rotation profile angle of the steel braced frame in pushover analysis.

Figure 10.
Sequence of yielding and failure of the X-braces of the steel frame for the (a) P-1, (b) P-2 pushover along the positive direction.
Figure 10.
Sequence of yielding and failure of the X-braces of the steel frame for the (a) P-1, (b) P-2 pushover along the positive direction.
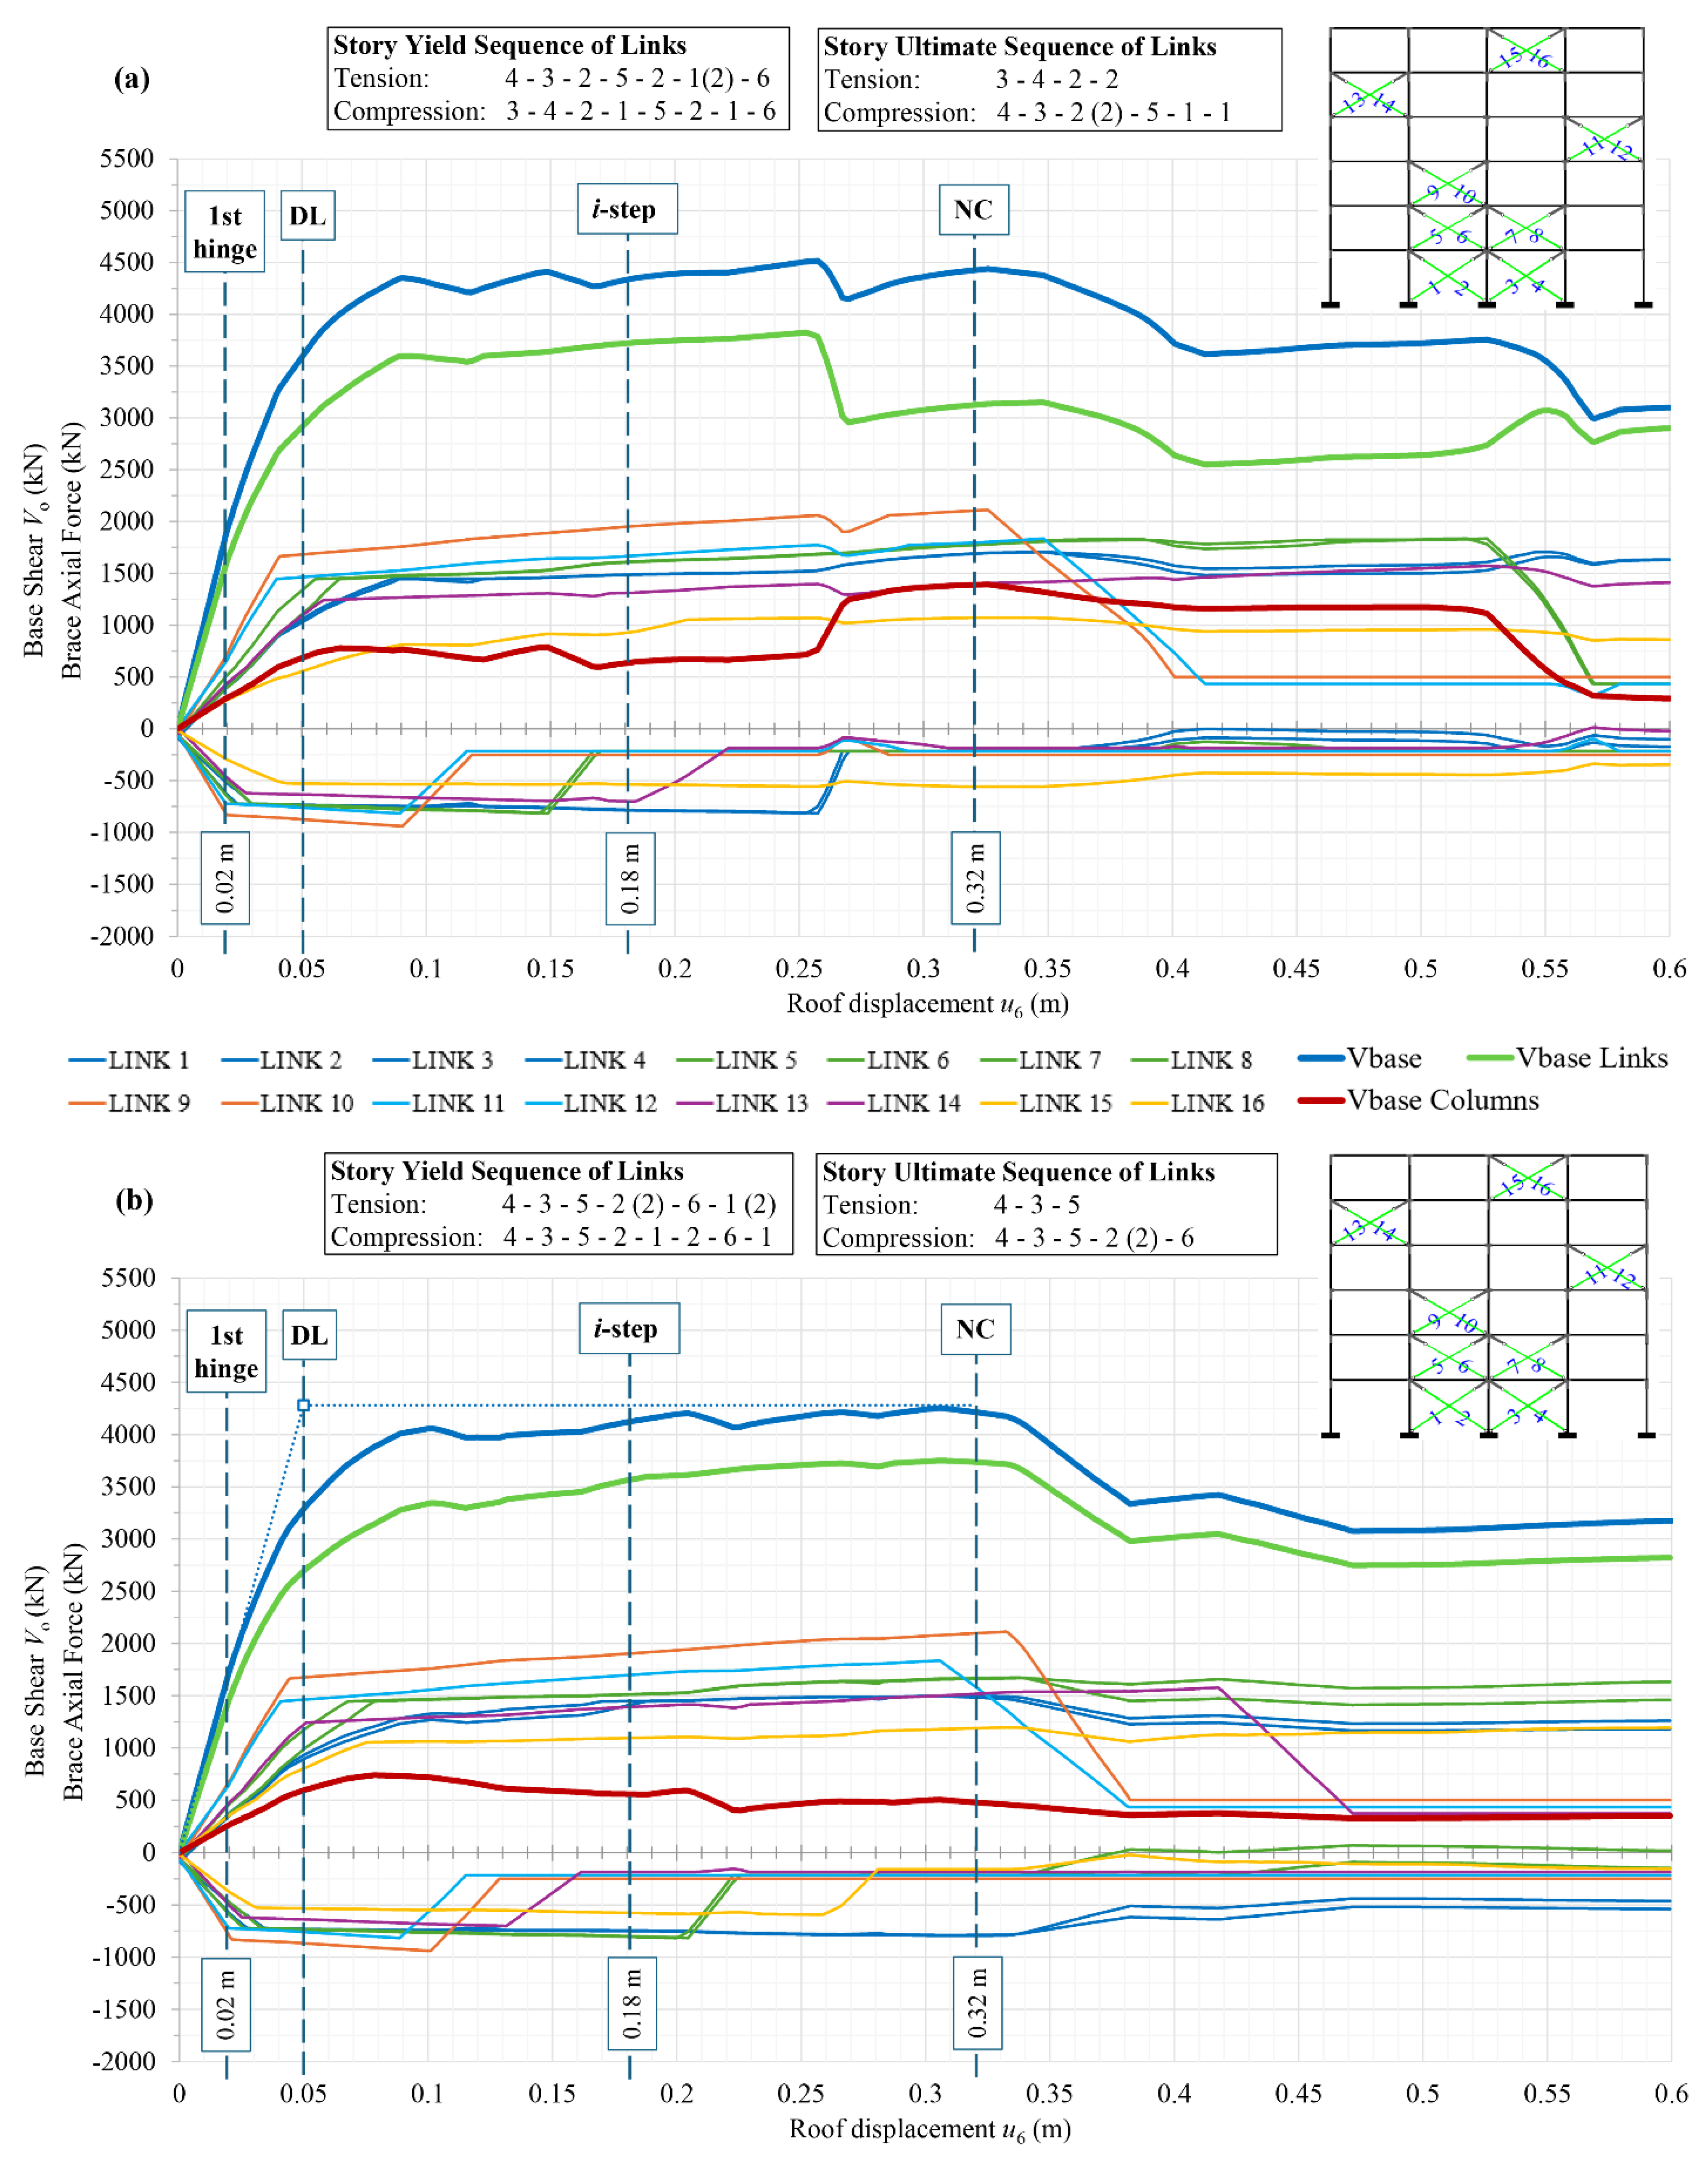
Figure 11.
Diagram of stepping frequencies (Hz) of the steel braced frame in the nonlinear area.
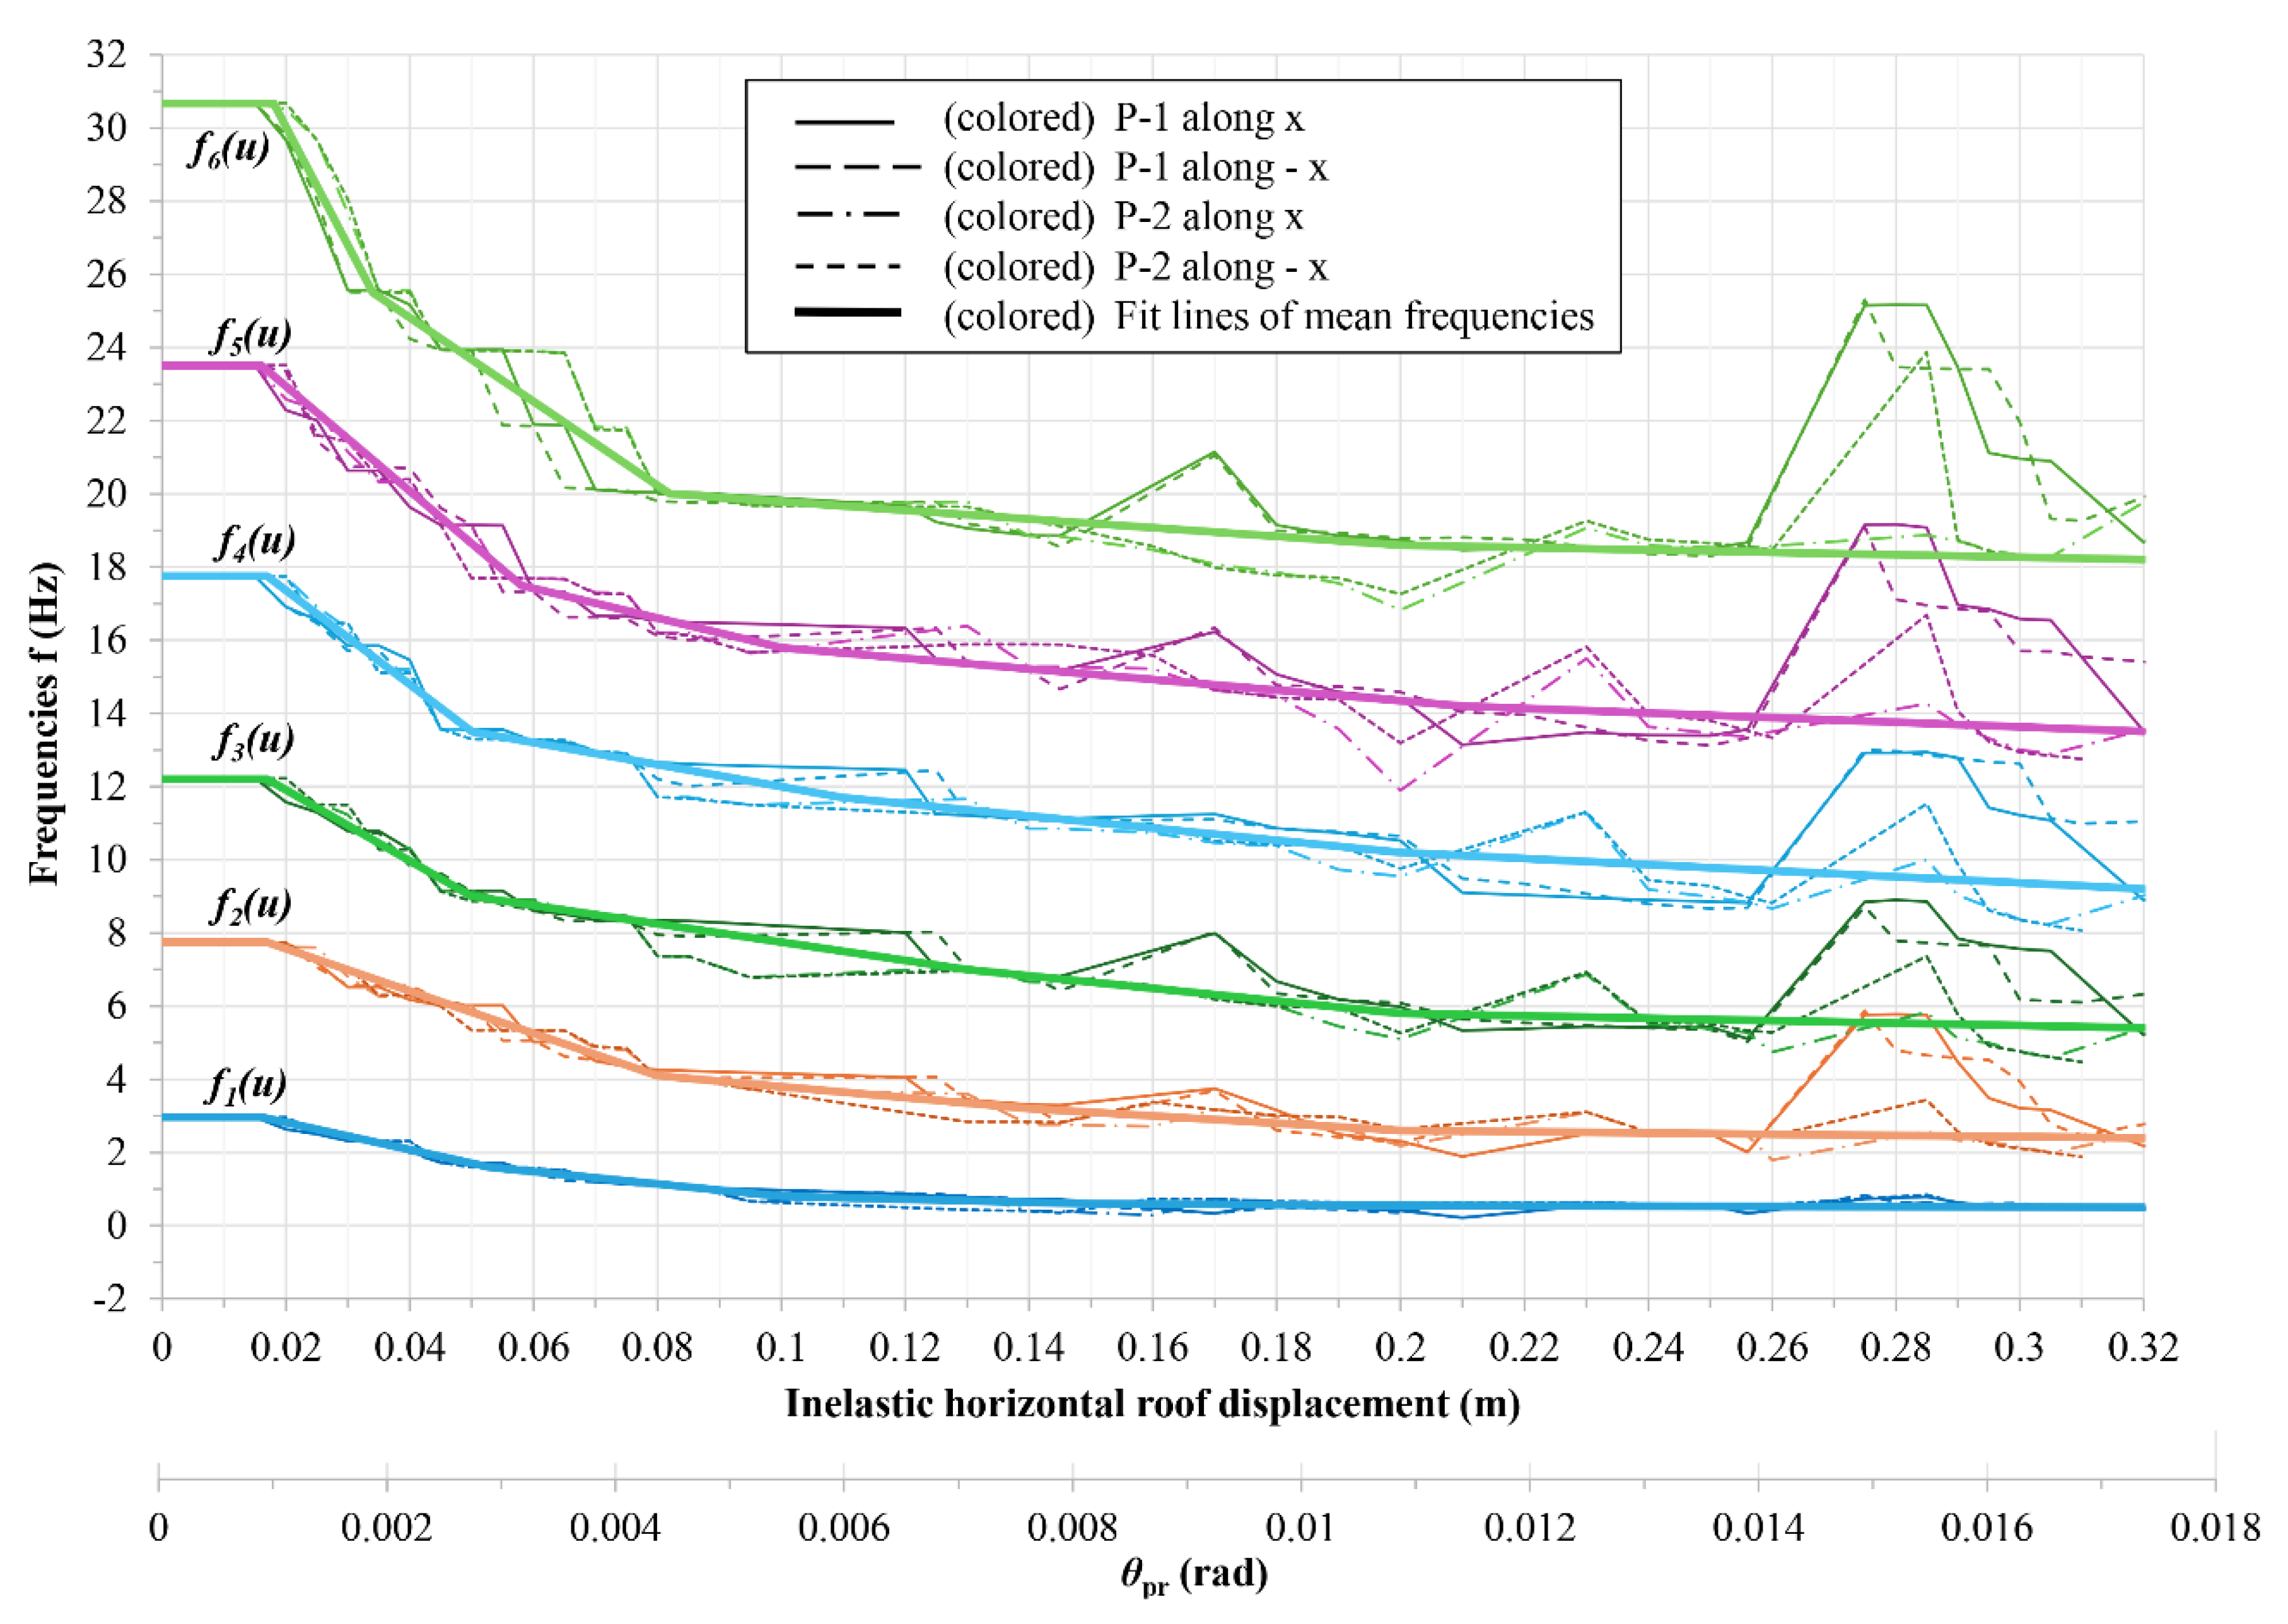
Figure 12.
Diagram of stepping frequencies (Hz) in the nonlinear area closely linked with the capacity curve of the existing six-story, steel braced frame (pushover analyses P-1 and P-2 with target displacement ).
Figure 12.
Diagram of stepping frequencies (Hz) in the nonlinear area closely linked with the capacity curve of the existing six-story, steel braced frame (pushover analyses P-1 and P-2 with target displacement ).
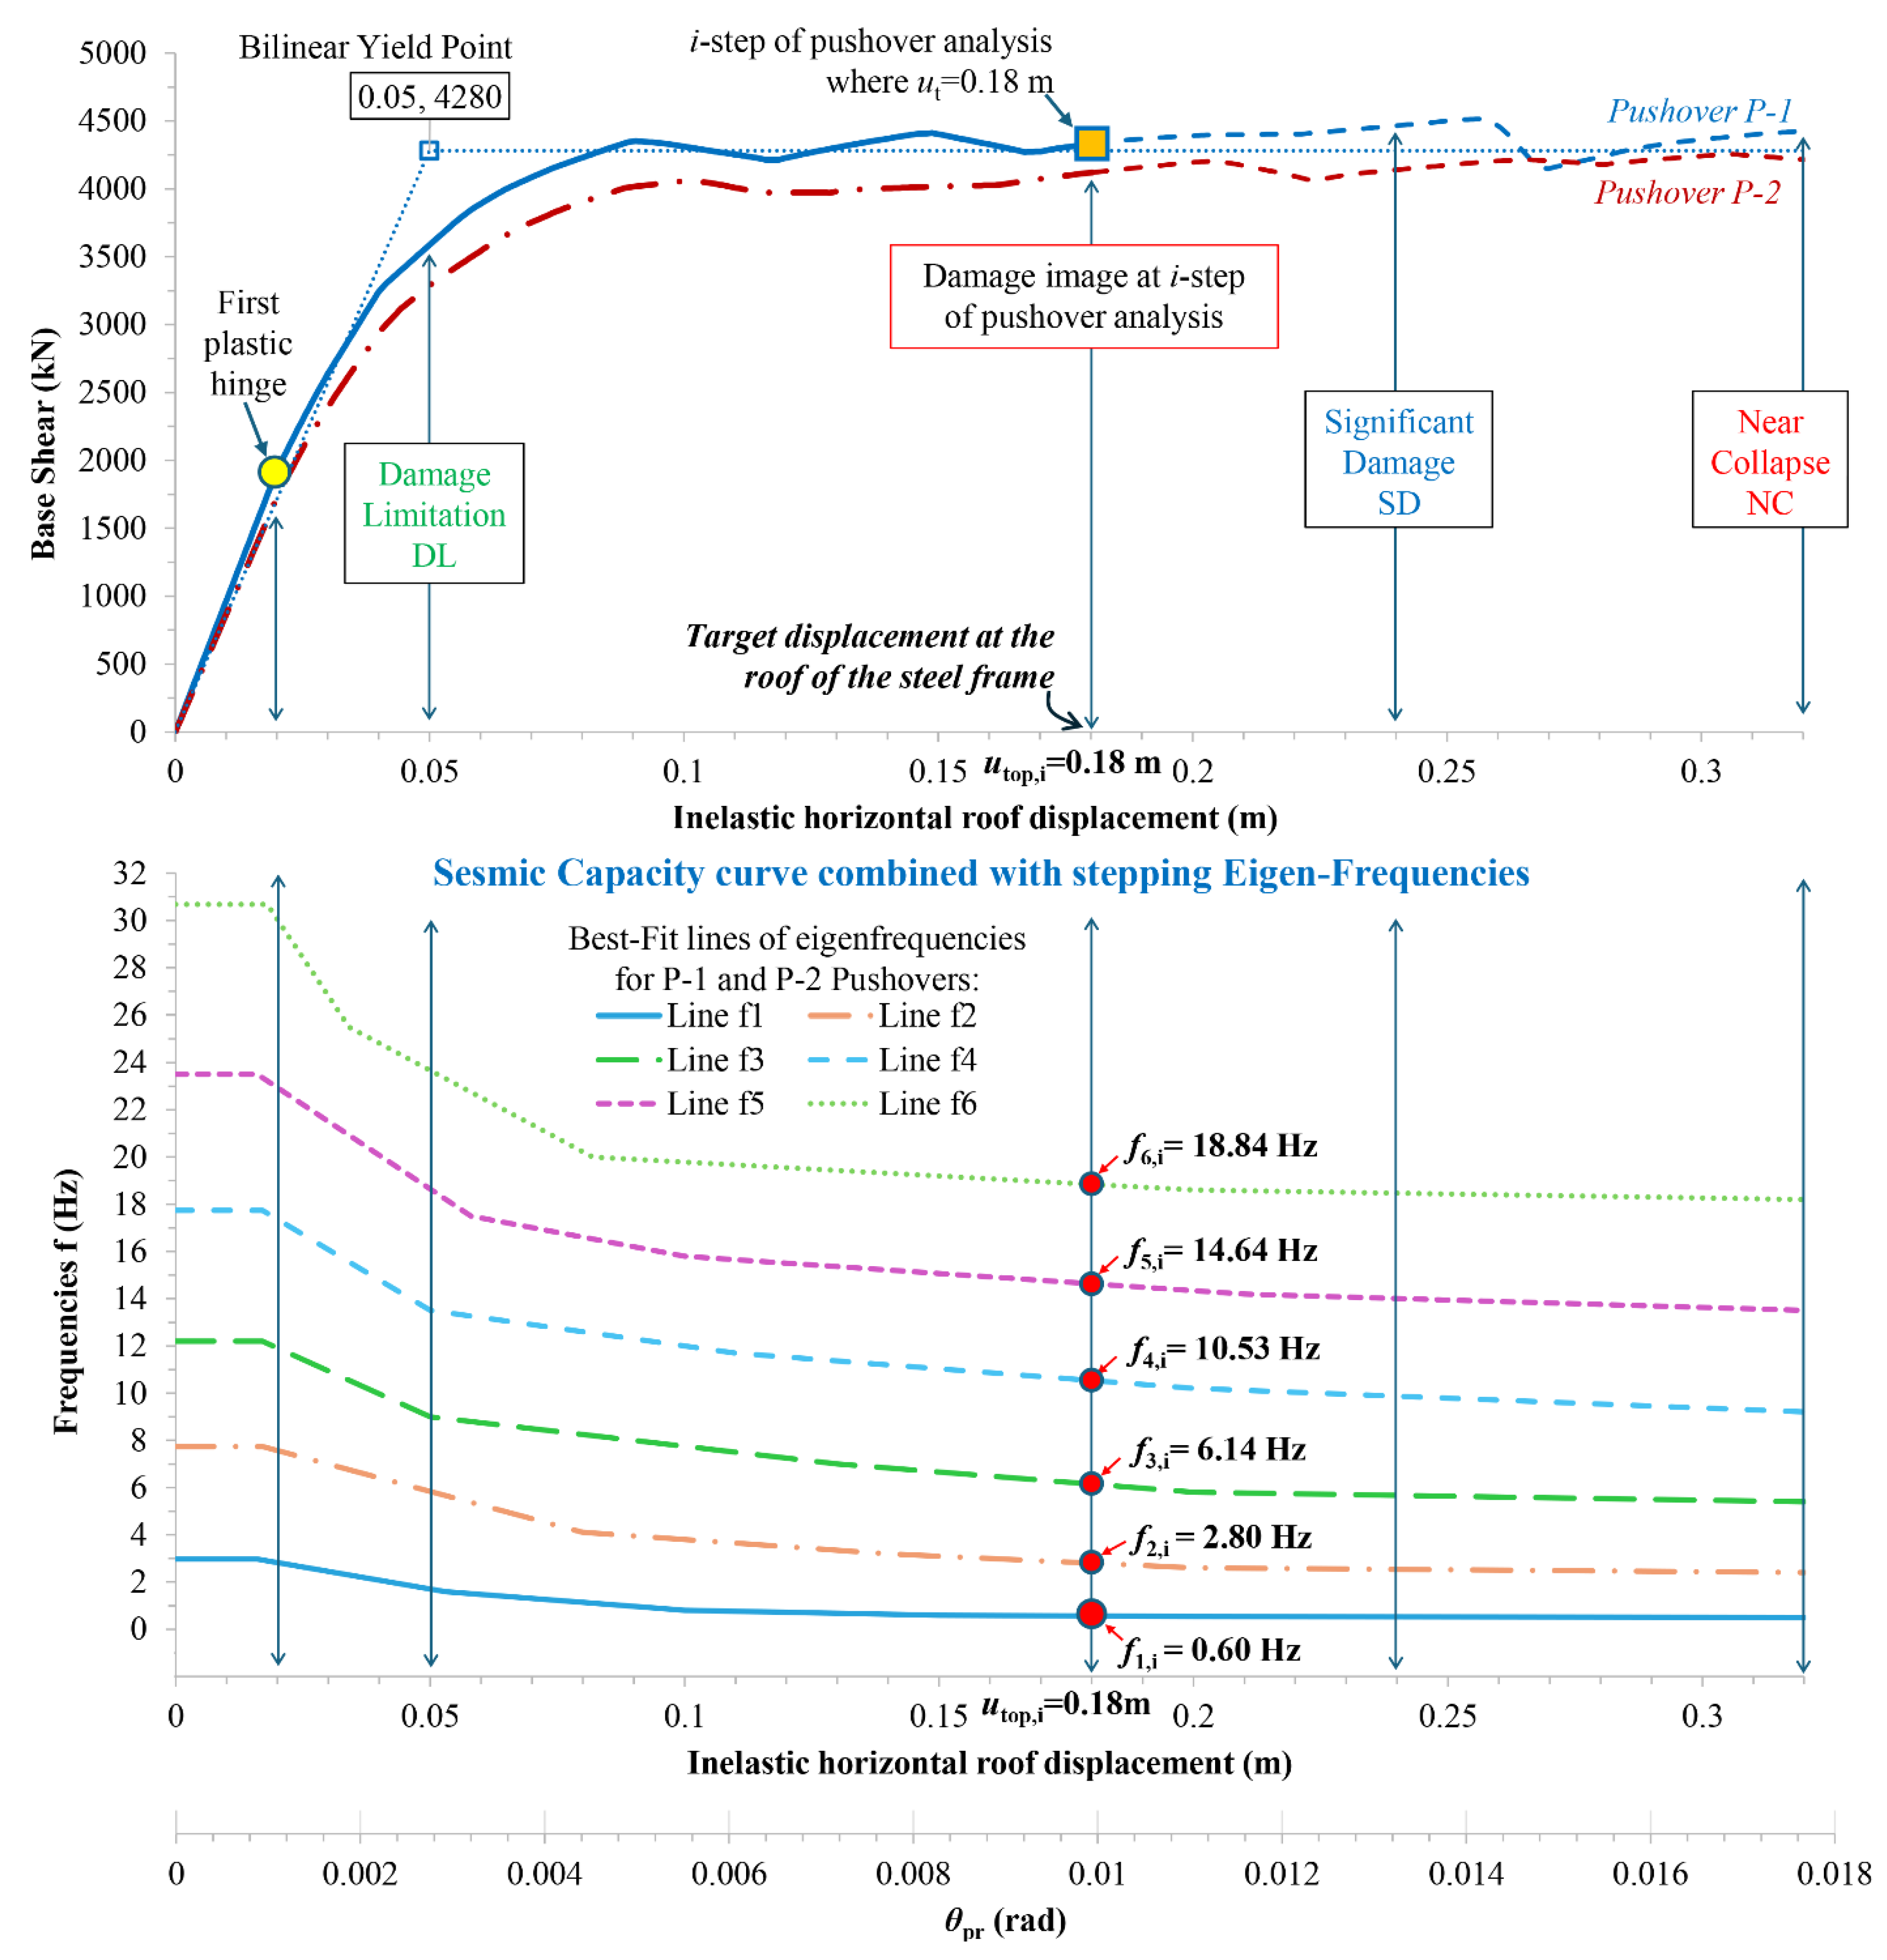
Figure 13.
The first three stepping mode shapes φ1,i to φ3,i of the existing steel braced frame in the nonlinear area, at the final step of pushover analyses P-1 and P-2 with positive floor forces at a target displacement .
Figure 13.
The first three stepping mode shapes φ1,i to φ3,i of the existing steel braced frame in the nonlinear area, at the final step of pushover analyses P-1 and P-2 with positive floor forces at a target displacement .
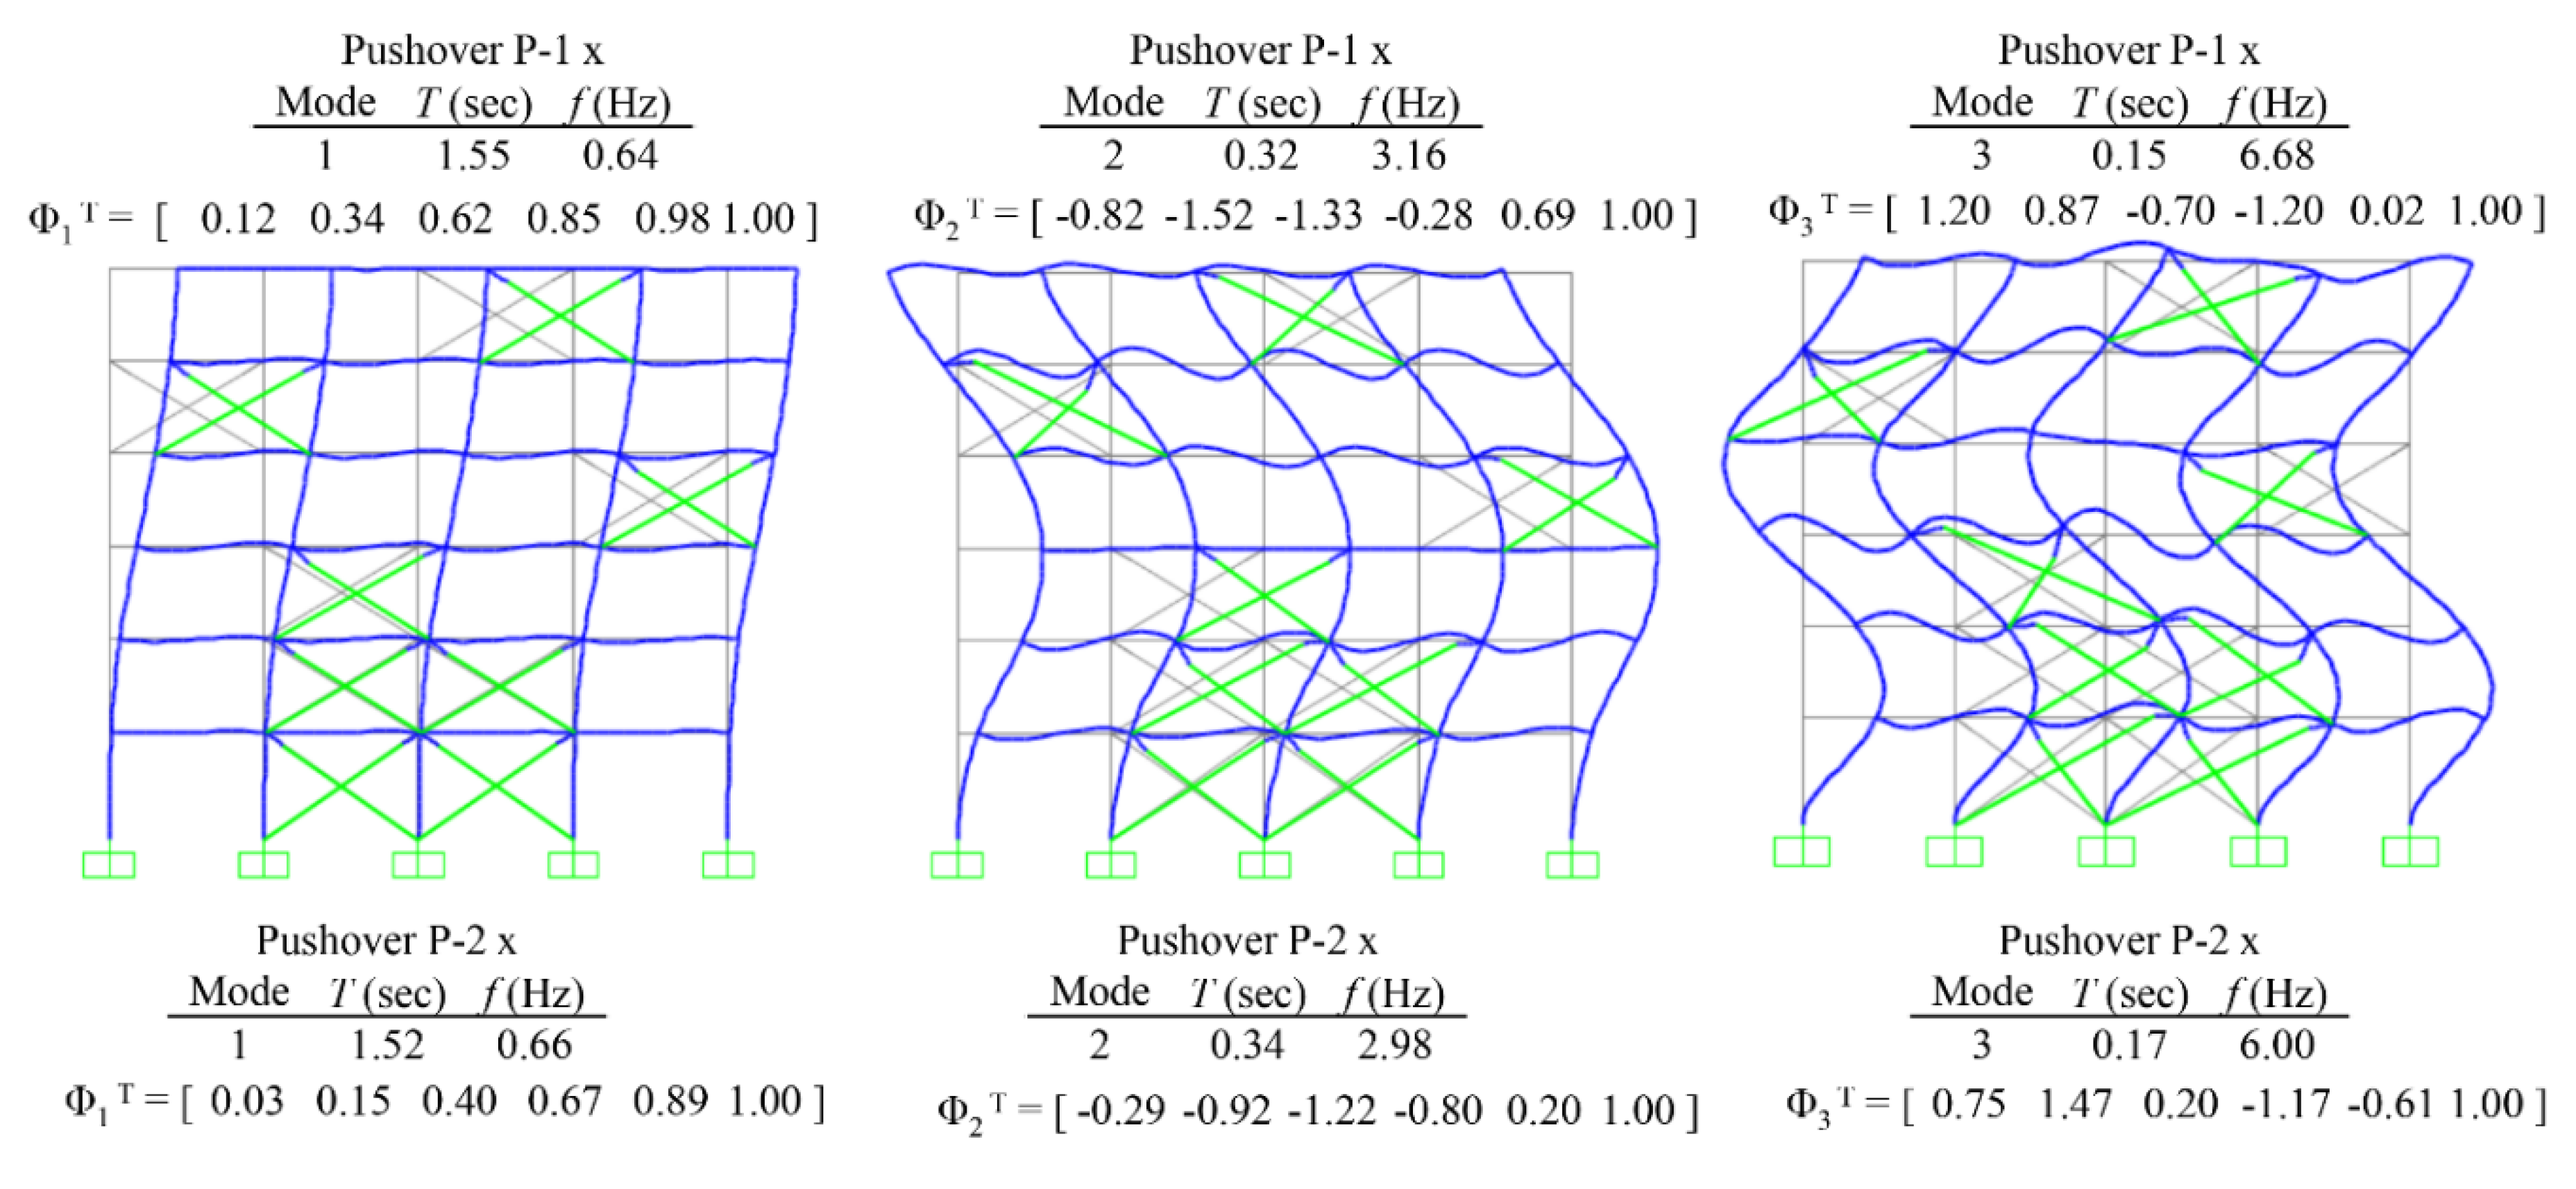
Figure 14.
Plastic mechanism of the existing, six-story, steel braced frame for the pushover analysis P-1 with (a) positive, and (b) negative floor forces, at a target roof displacement .
Figure 14.
Plastic mechanism of the existing, six-story, steel braced frame for the pushover analysis P-1 with (a) positive, and (b) negative floor forces, at a target roof displacement .
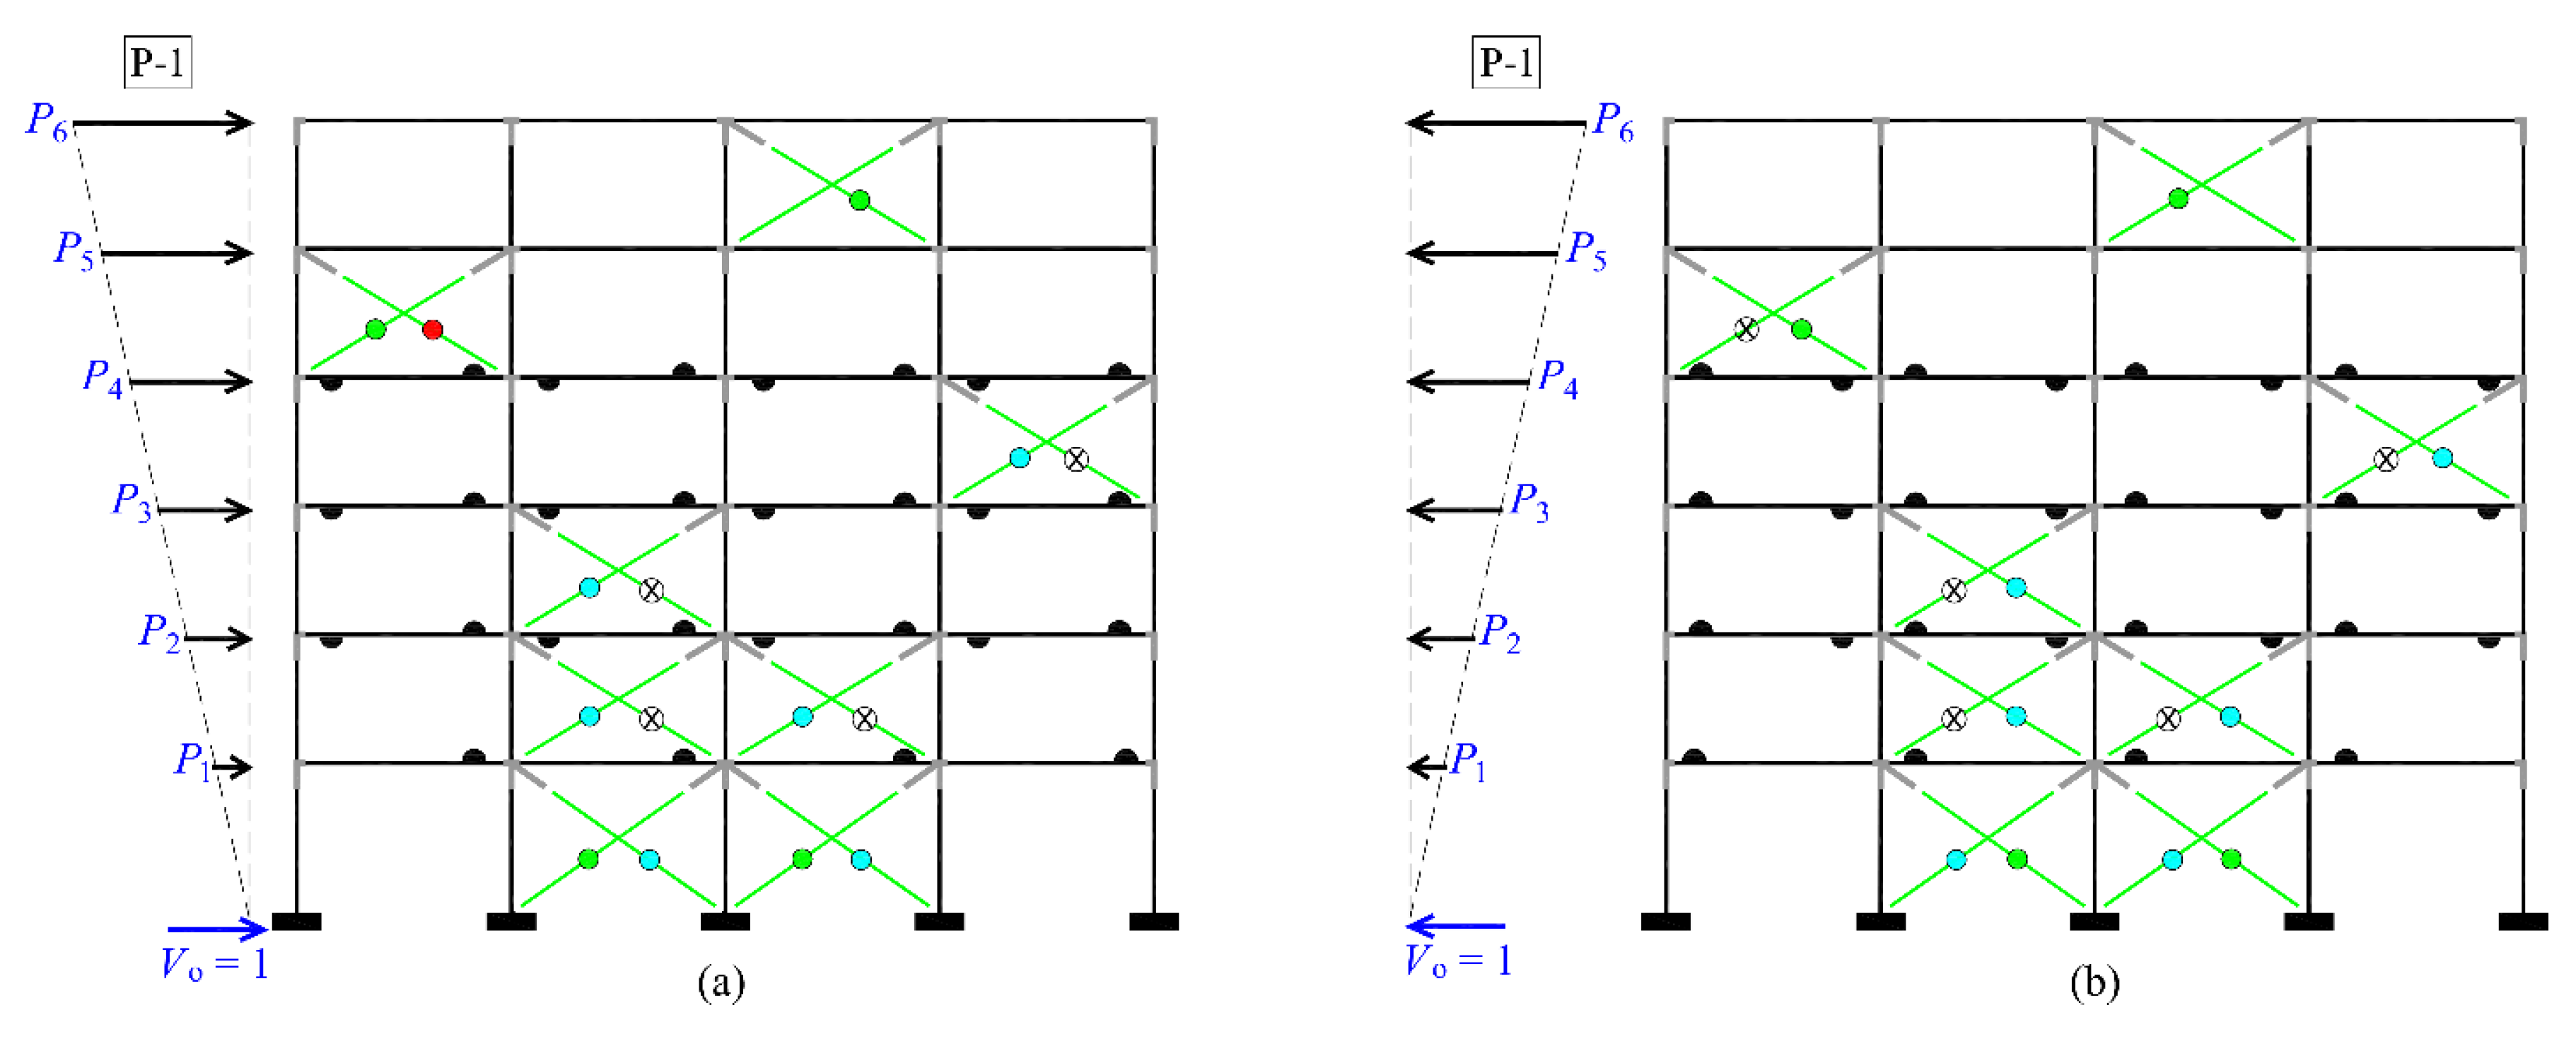
Figure 15.
Plastic mechanism of the existing, six-story, steel braced frame for the pushover analysis P-2 with (a) positive, and (b) negative floor forces, at a target roof displacement .
Figure 15.
Plastic mechanism of the existing, six-story, steel braced frame for the pushover analysis P-2 with (a) positive, and (b) negative floor forces, at a target roof displacement .
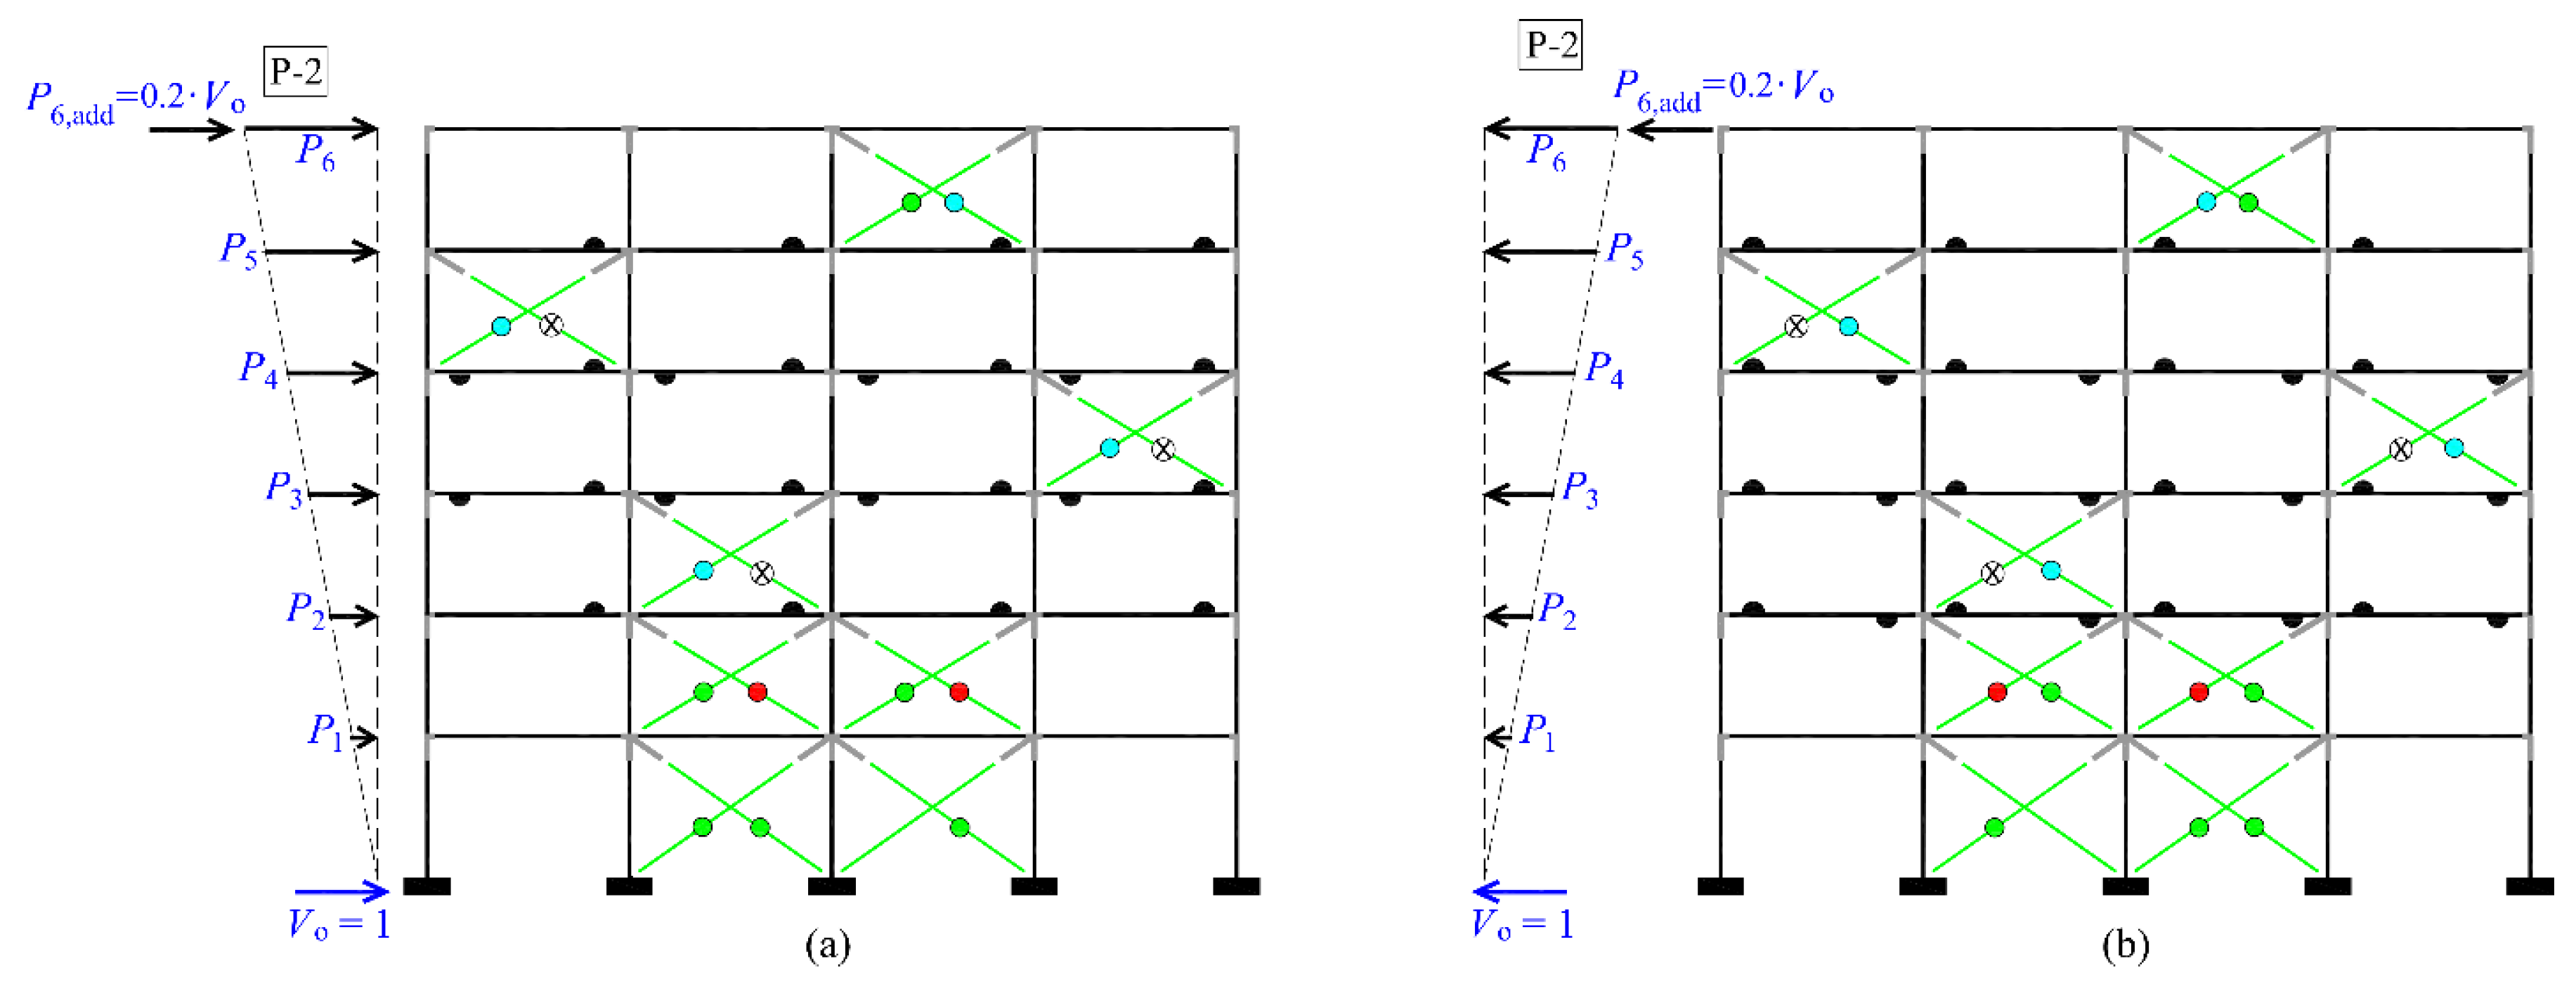
Figure 16.
Sequence of yielding and failure of the X-braces of the steel frame at roof displacement in pushover analyses (a) P-1, (b) P-2 along the positive direction.
Figure 16.
Sequence of yielding and failure of the X-braces of the steel frame at roof displacement in pushover analyses (a) P-1, (b) P-2 along the positive direction.
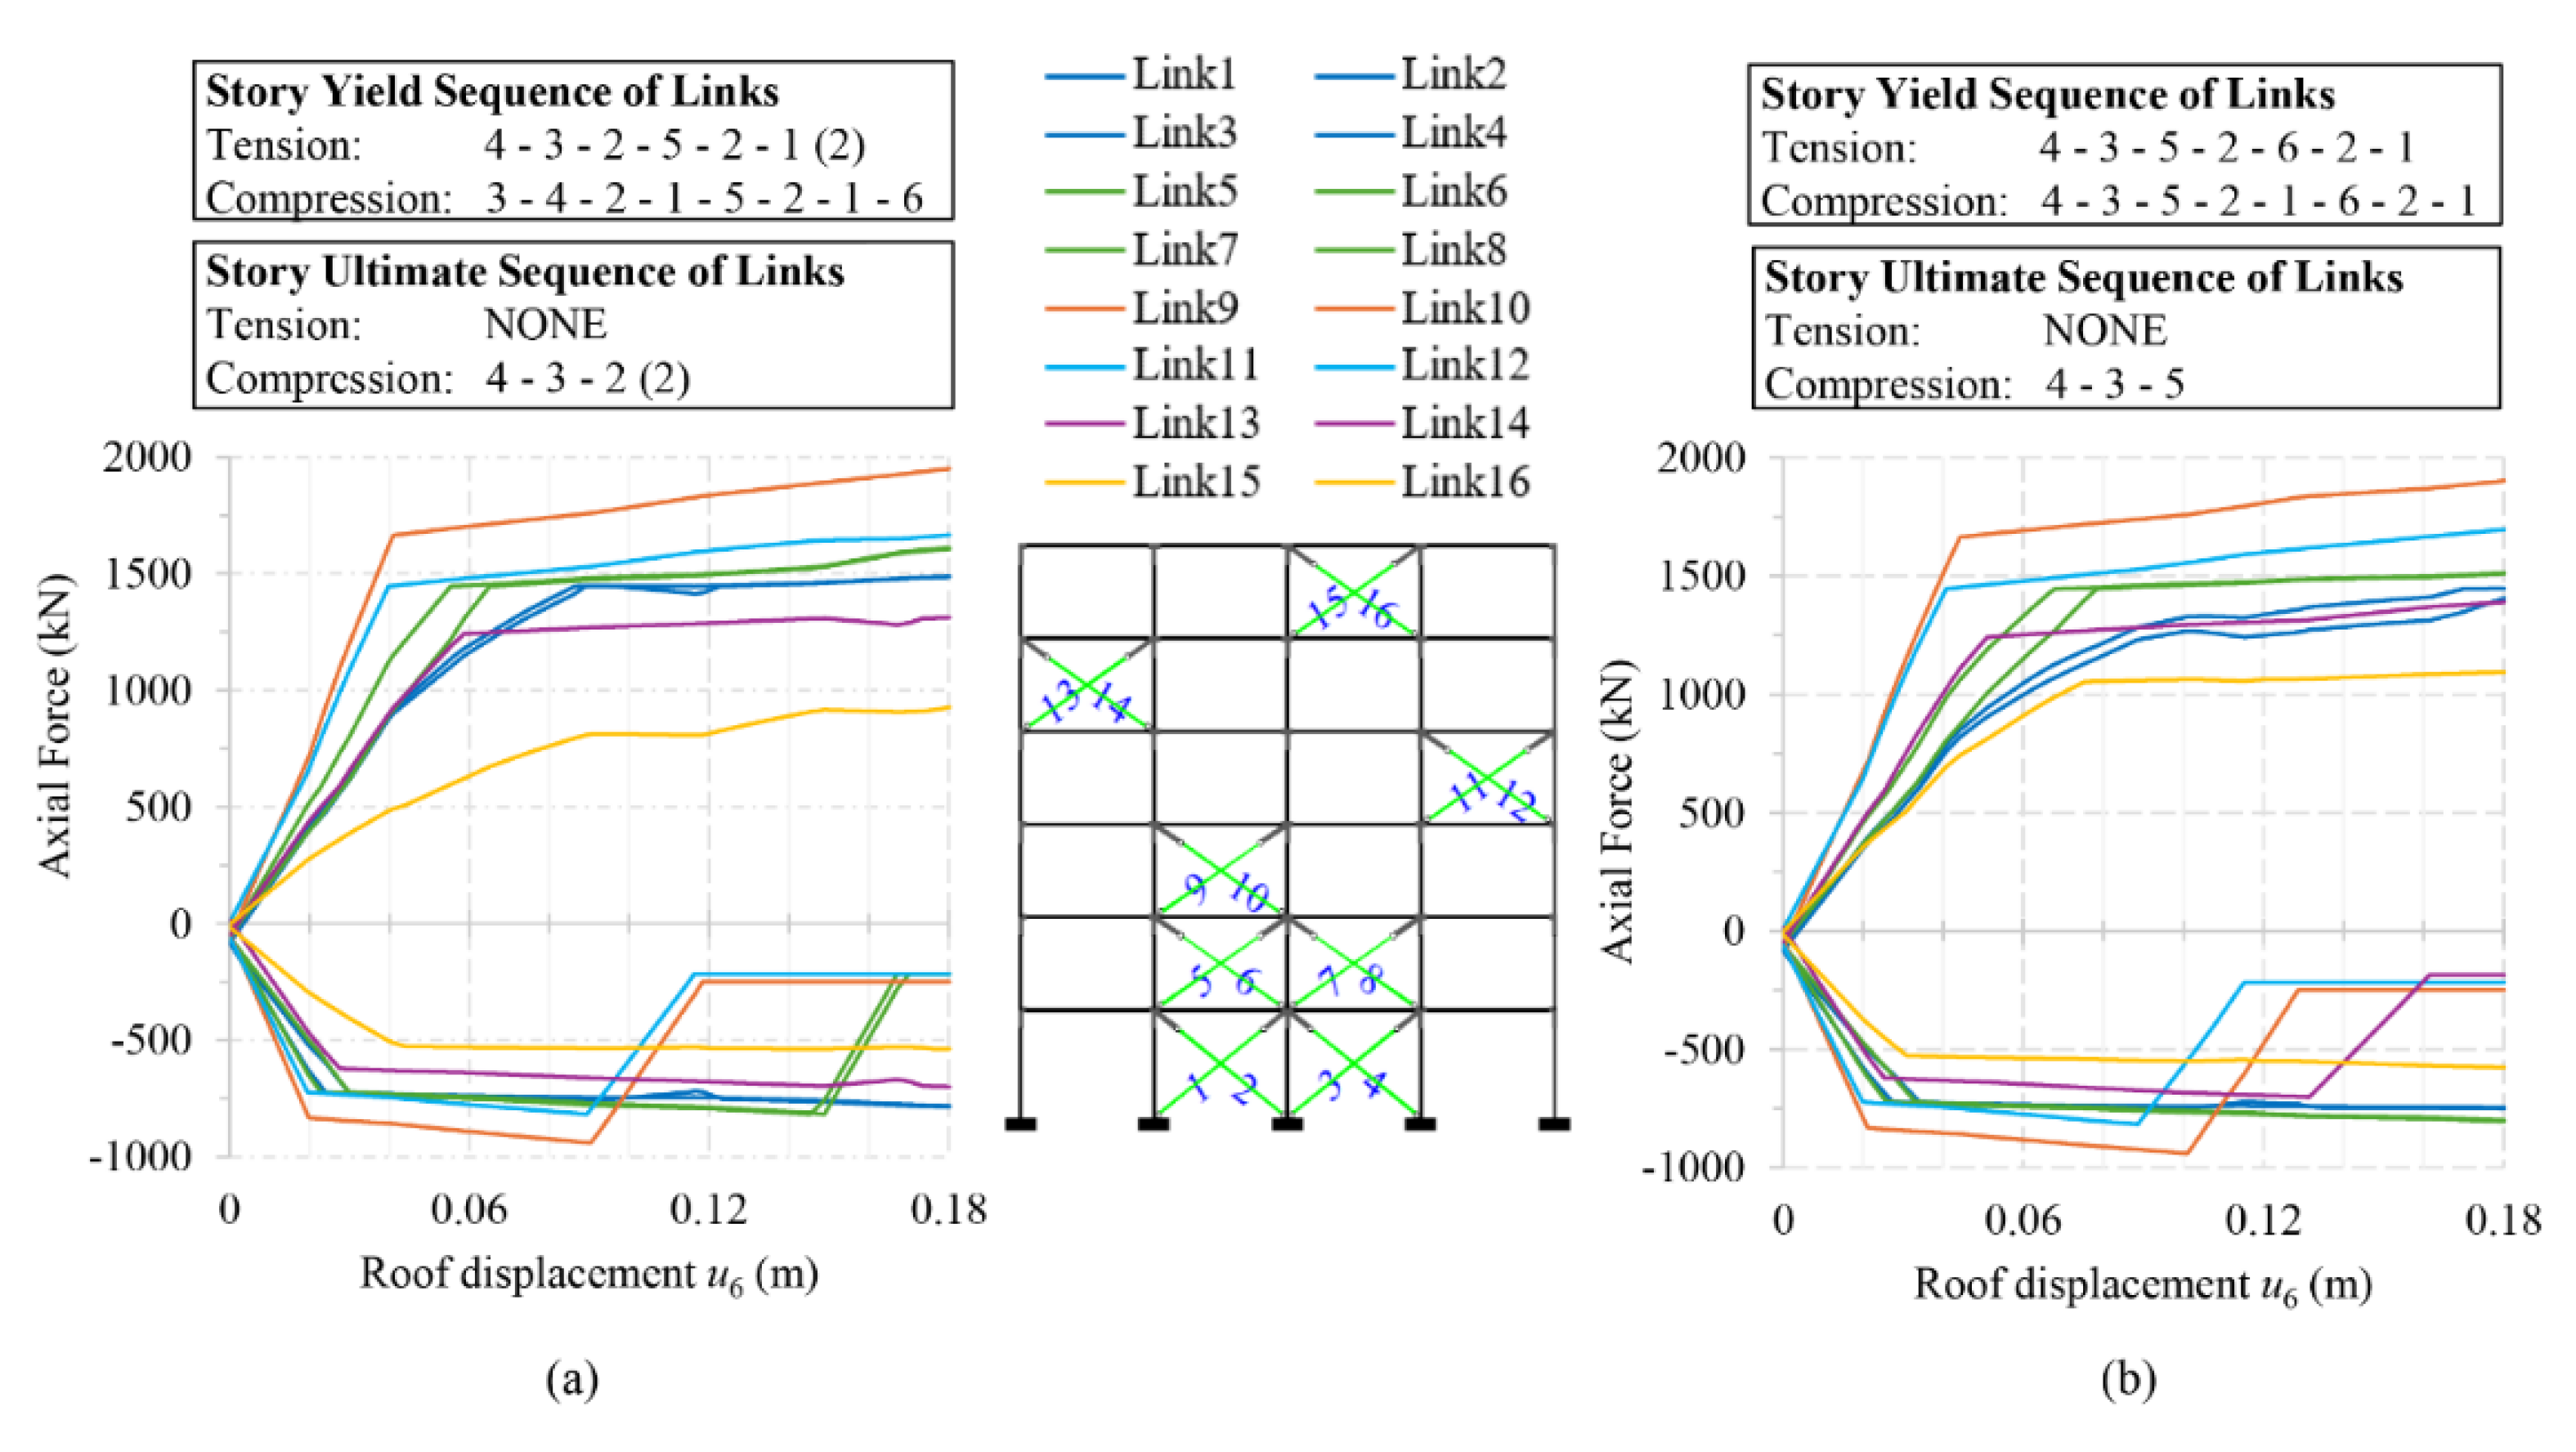
Figure 17.
Axial force- axial deformation behavior of X-braces of the steel frame at roof displacement in pushover analyses (a) P-1, (b) P-2 along the positive direction.
Figure 17.
Axial force- axial deformation behavior of X-braces of the steel frame at roof displacement in pushover analyses (a) P-1, (b) P-2 along the positive direction.
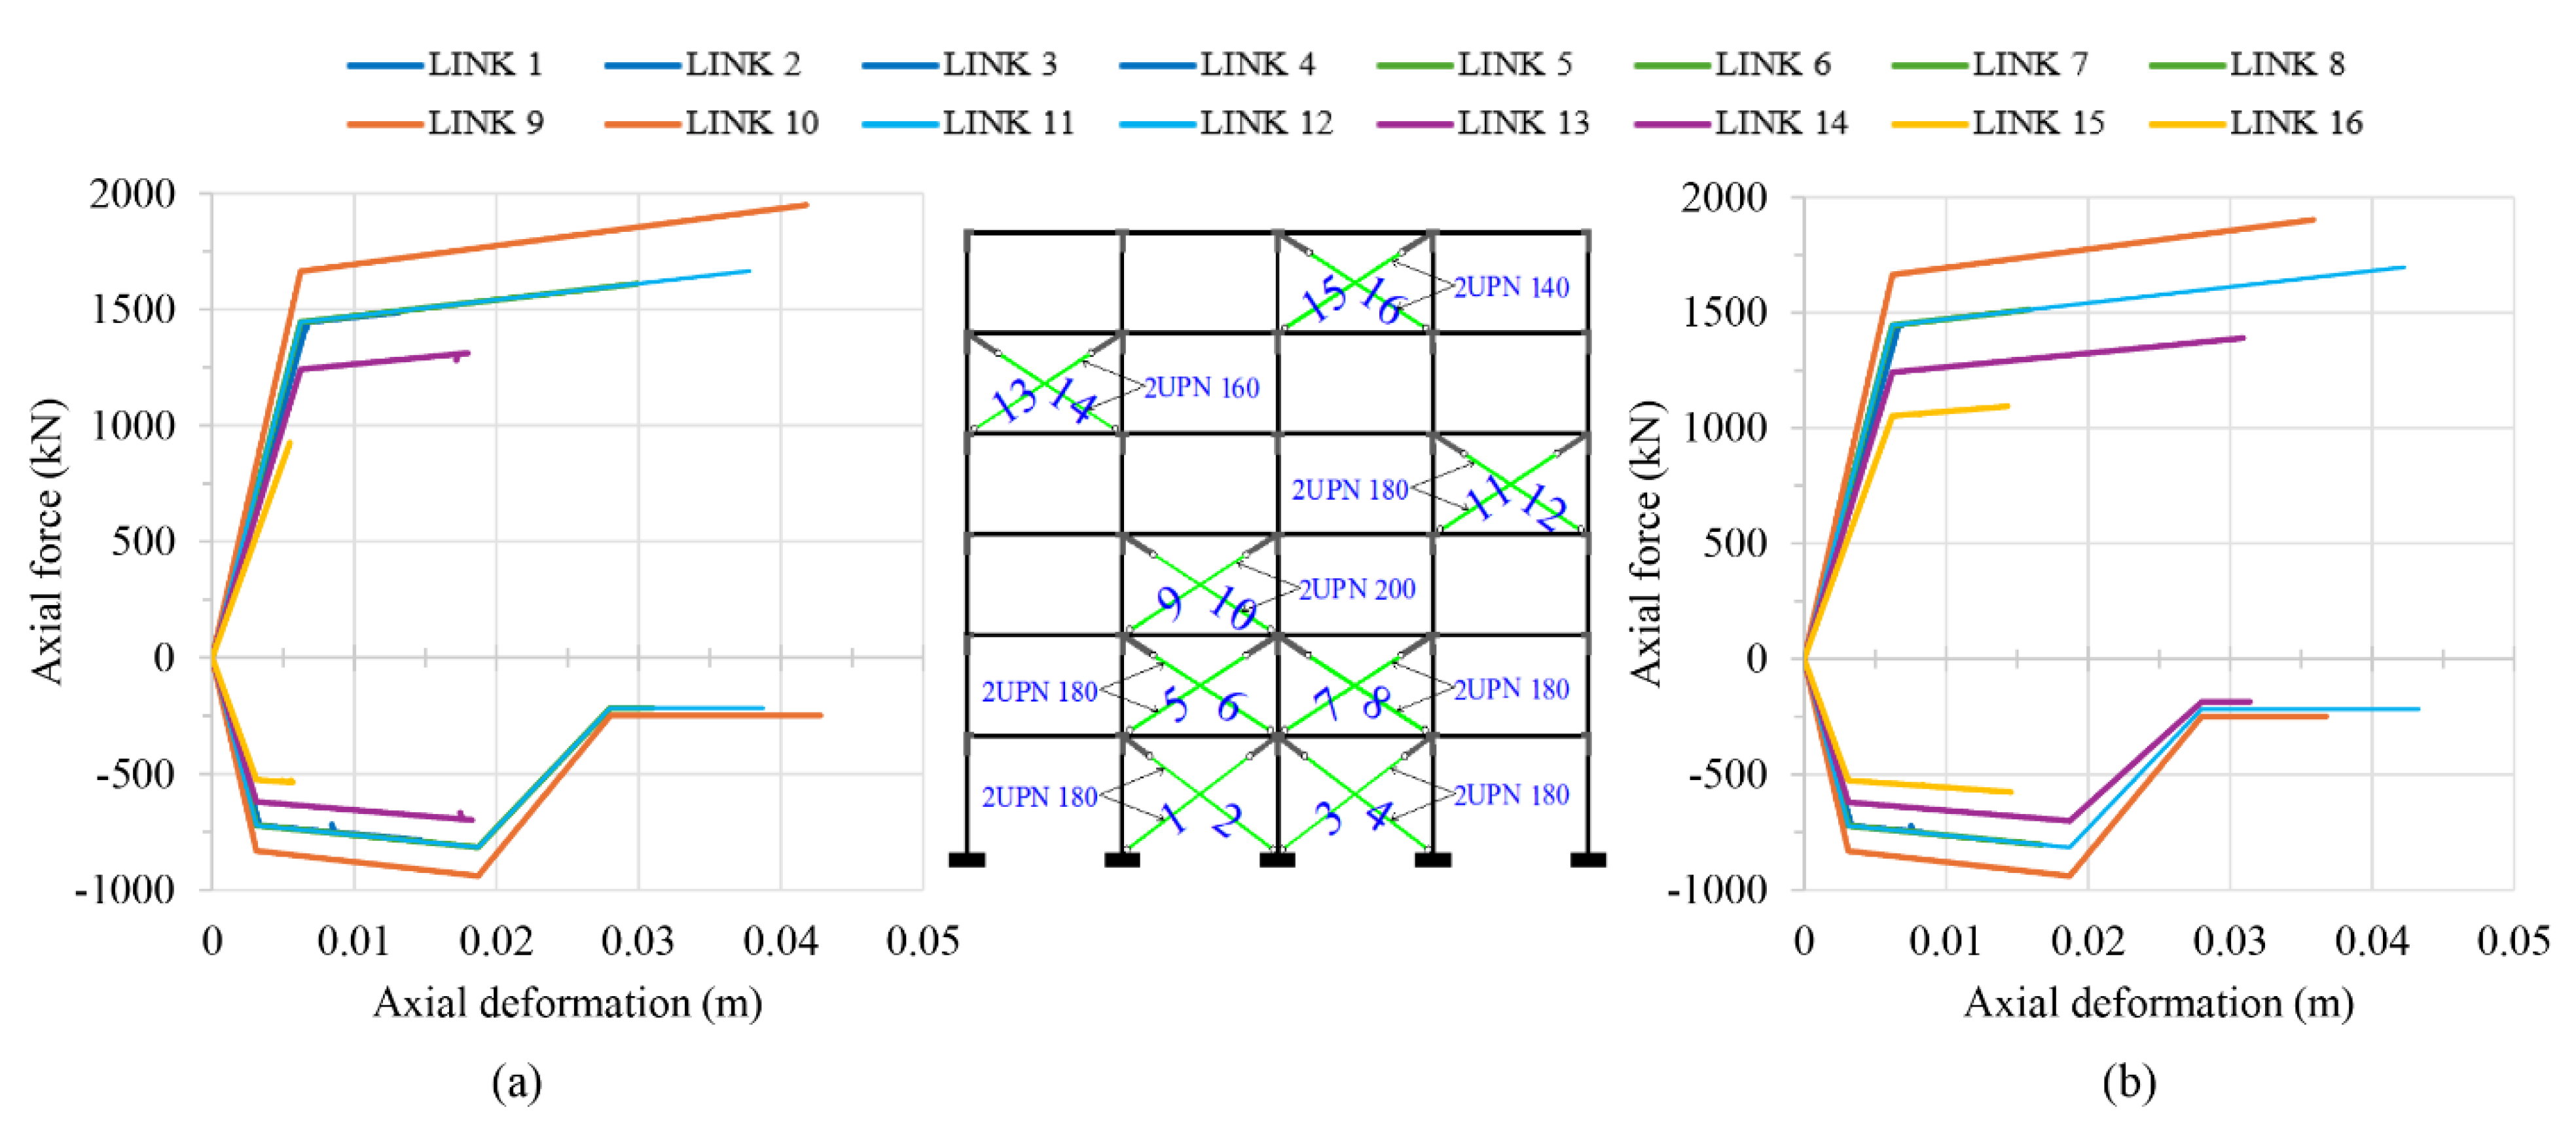
Figure 18.
Sequence of yielding and failure of the X-braces of the steel frame at roof displacement in pushover analyses (a) P-1, (b) P-2 along the negative direction.
Figure 18.
Sequence of yielding and failure of the X-braces of the steel frame at roof displacement in pushover analyses (a) P-1, (b) P-2 along the negative direction.
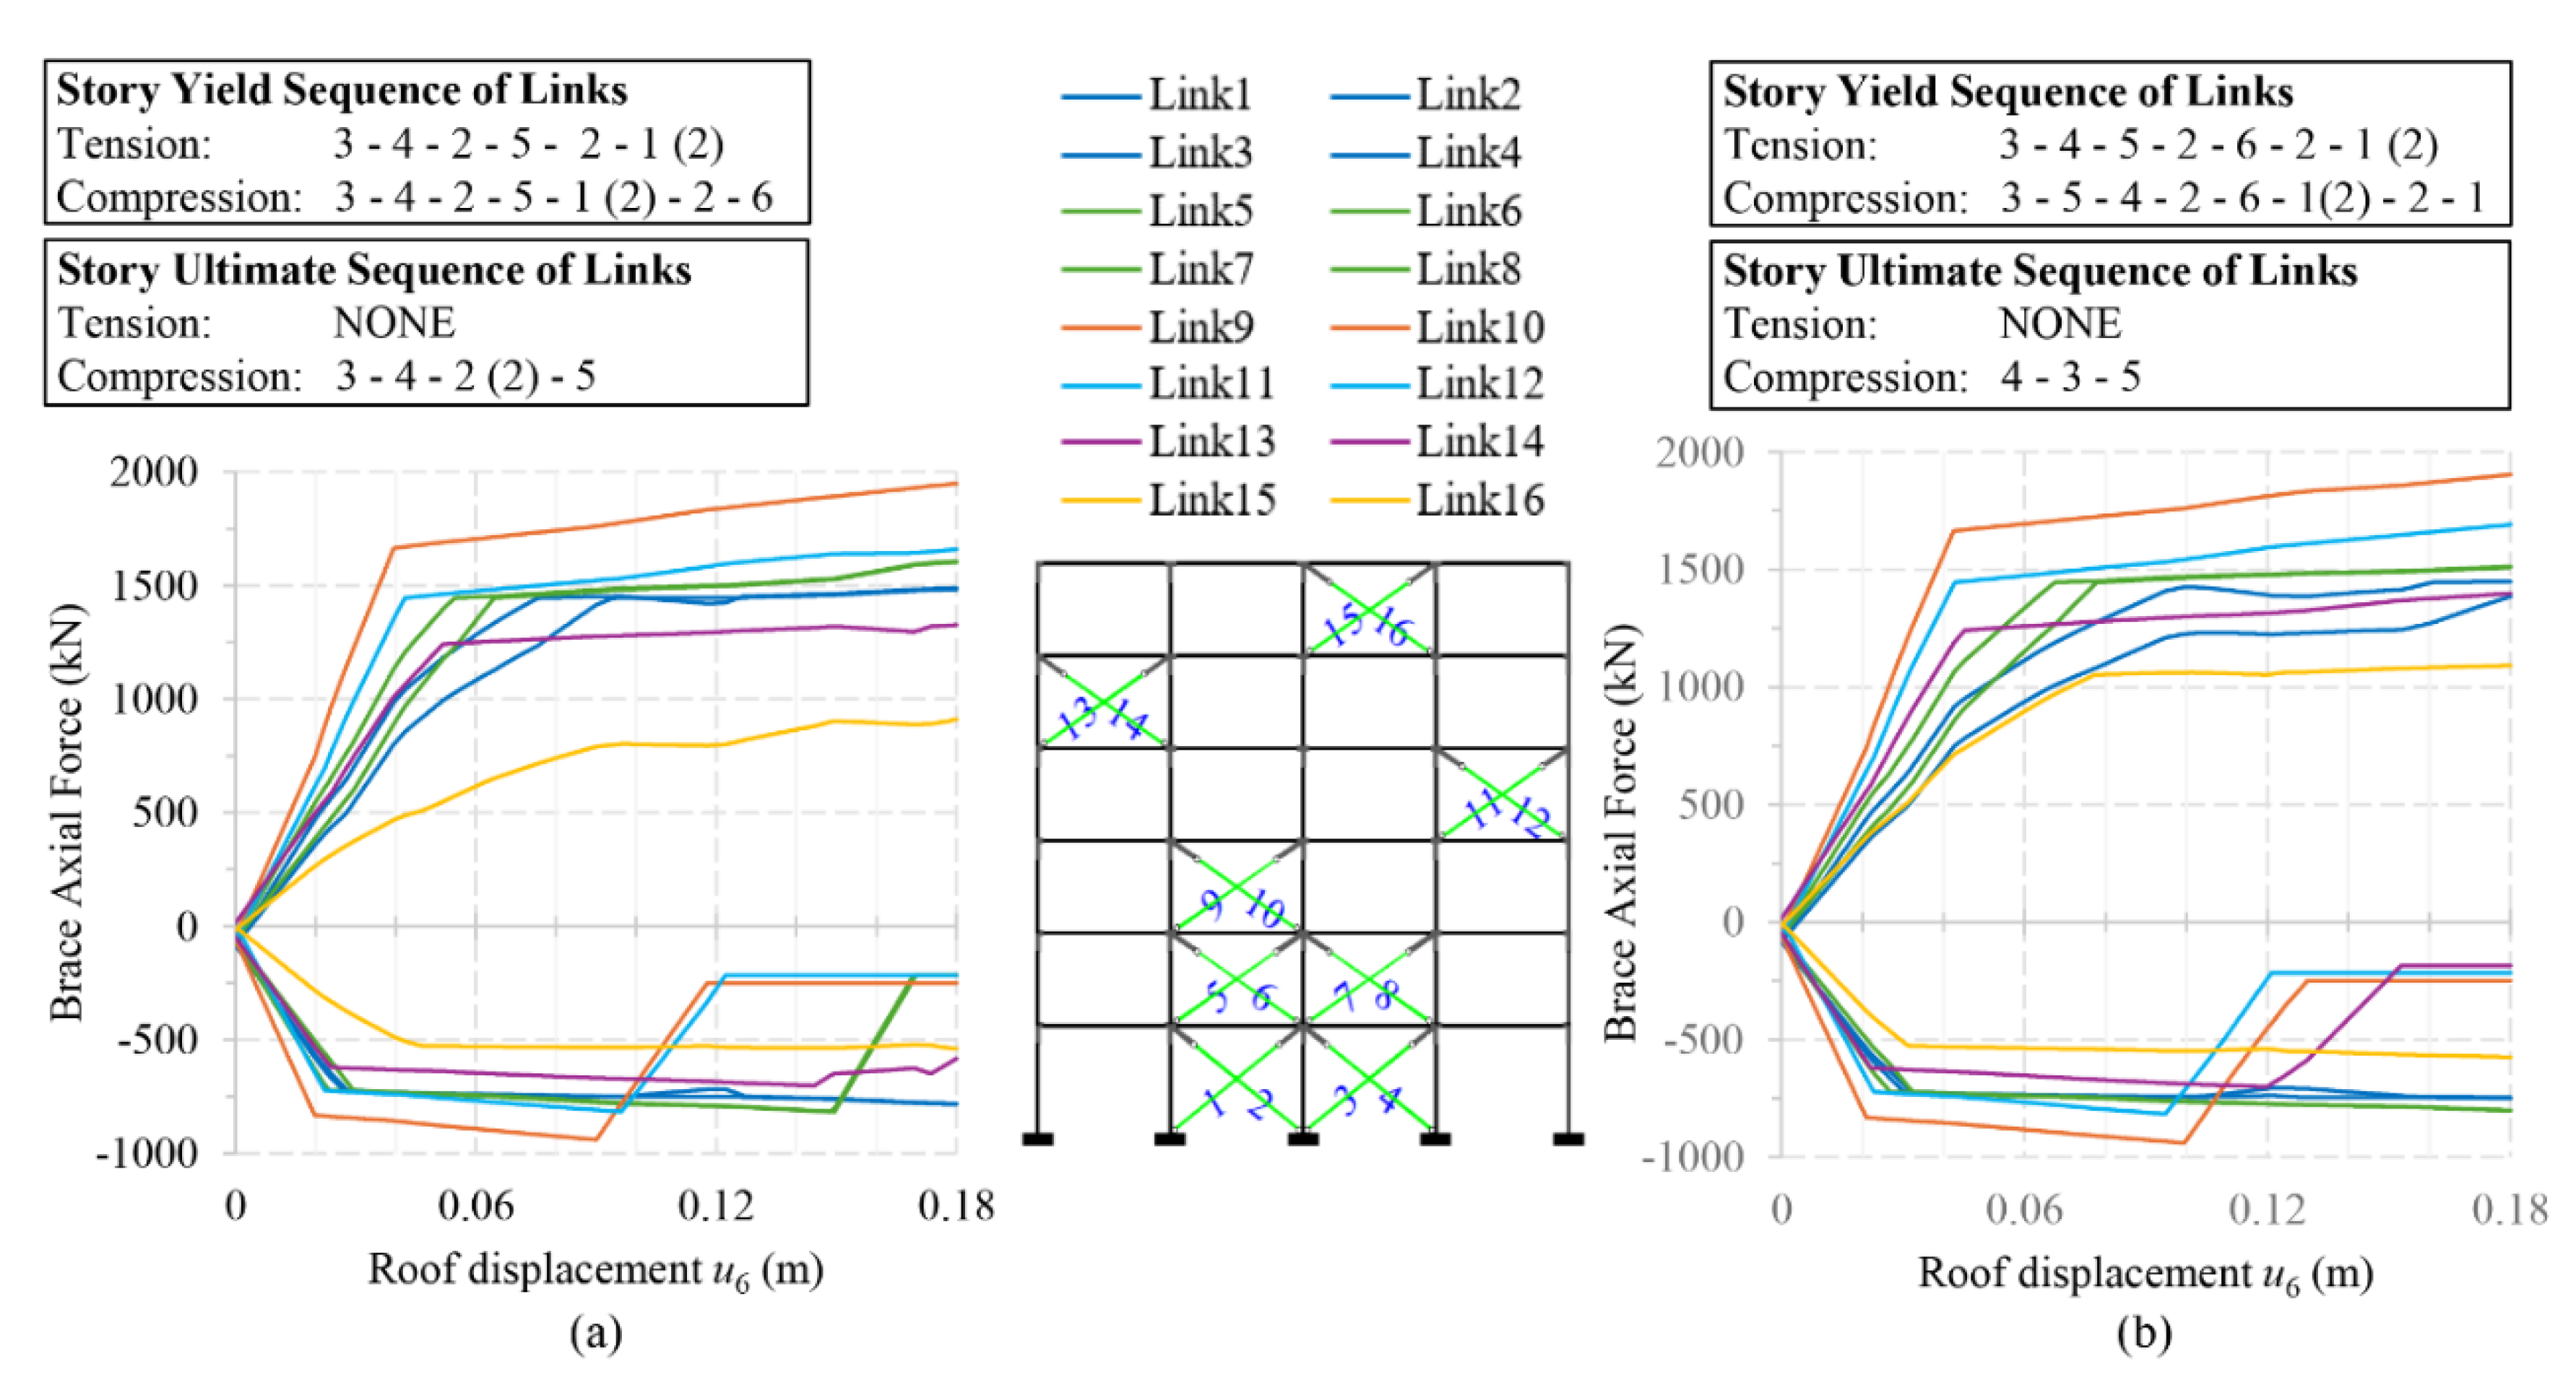
Figure 19.
Axial force- axial deformation behavior of X-braces of the steel frame at roof displacement in pushover analyses (a) P-1, (b) P-2 along the negative direction.
Figure 19.
Axial force- axial deformation behavior of X-braces of the steel frame at roof displacement in pushover analyses (a) P-1, (b) P-2 along the negative direction.
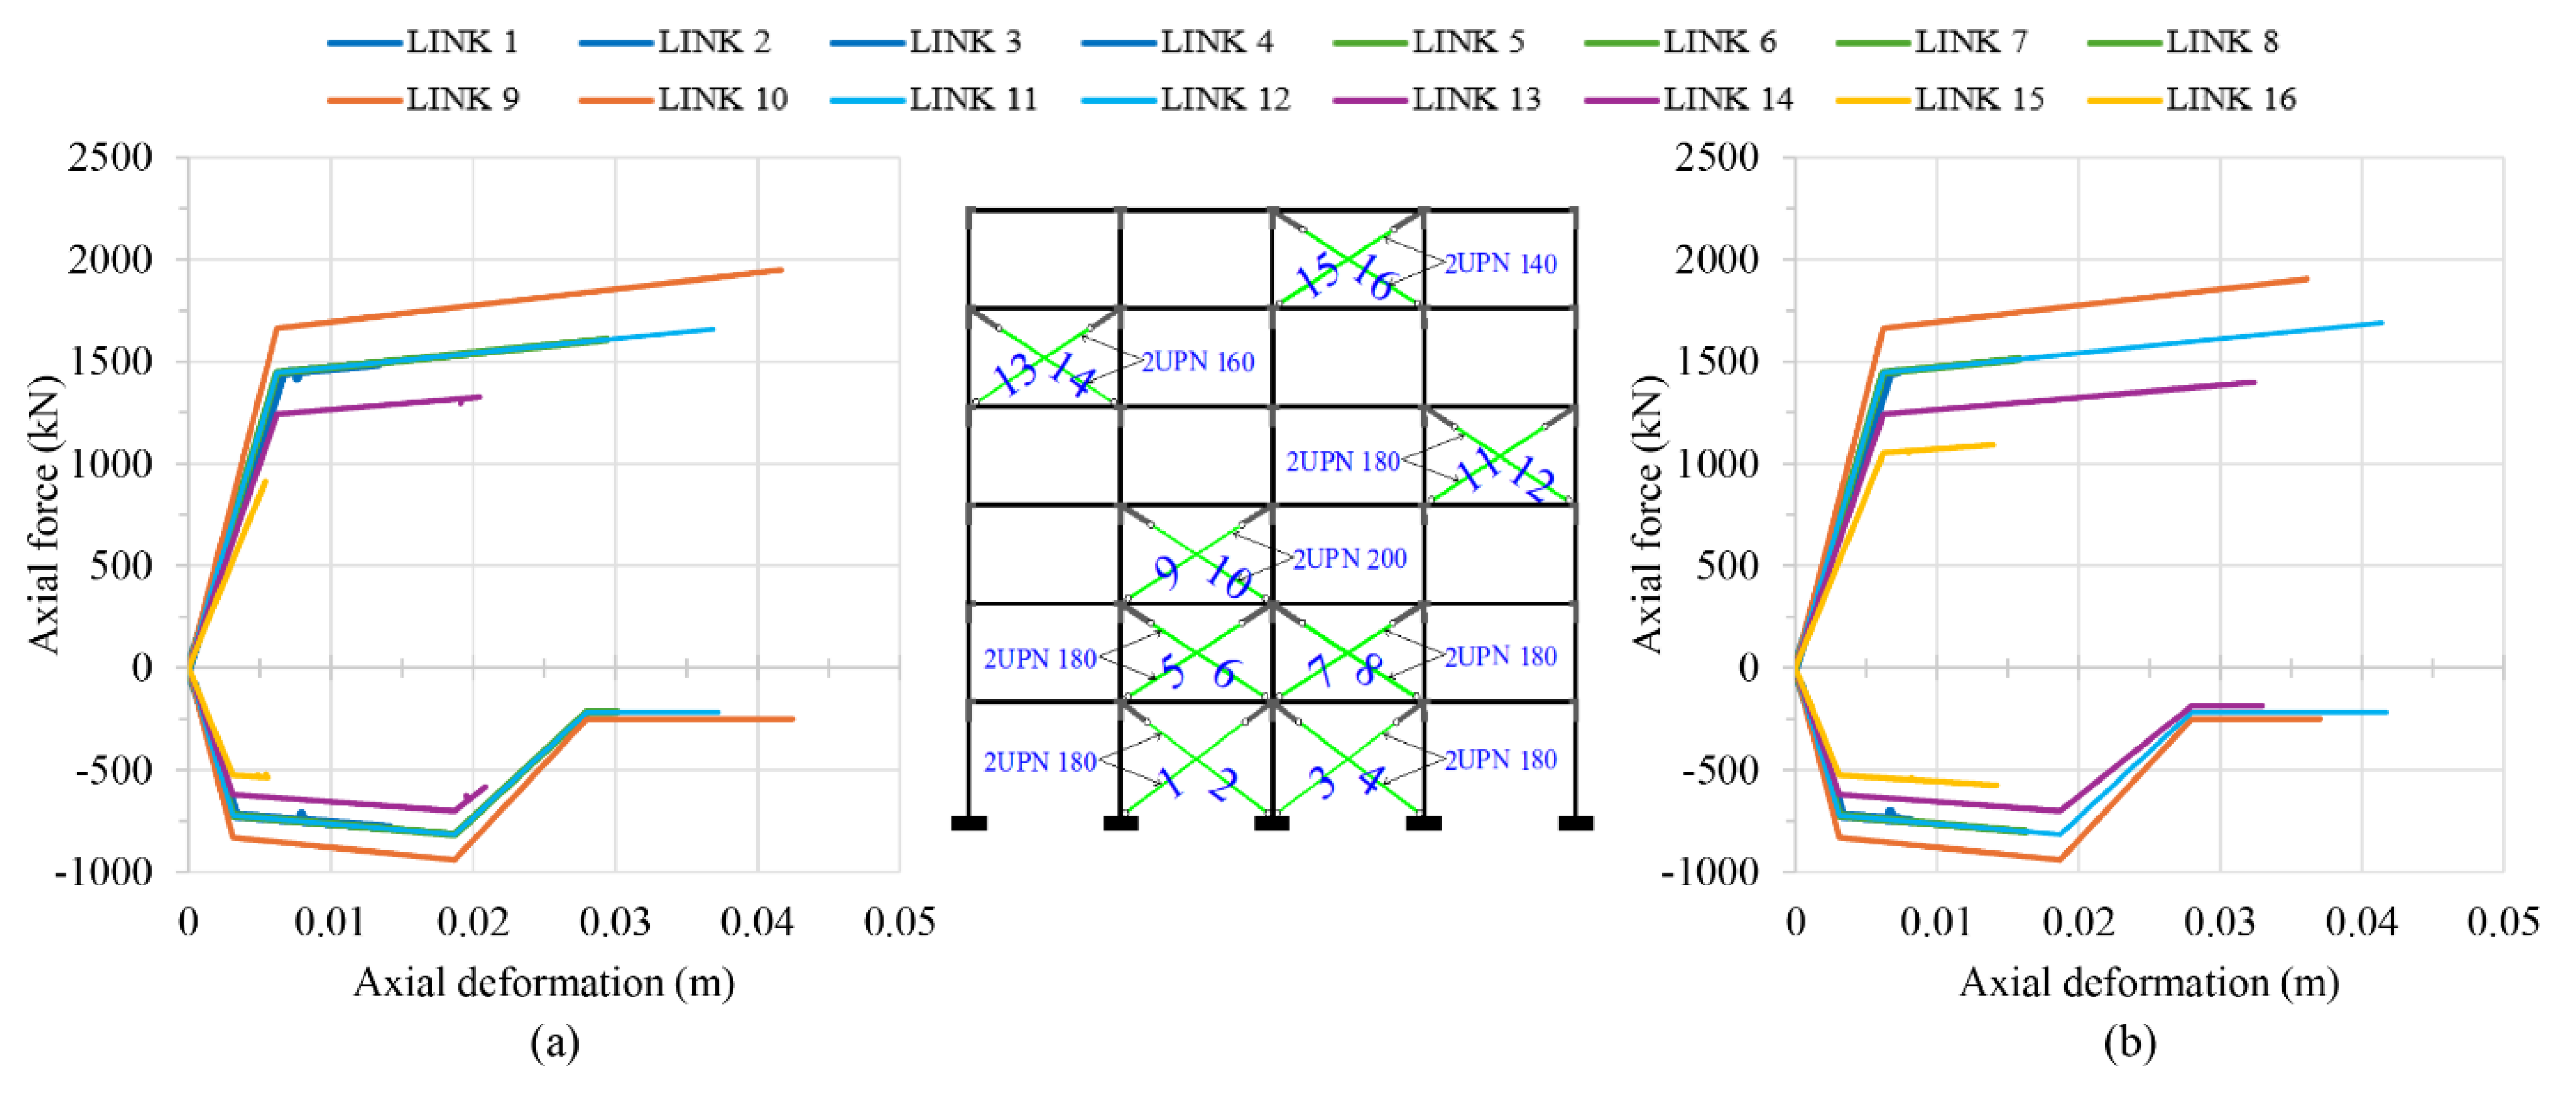
Figure 20.
Deviation (%) of the damage stiffness matrix terms of the six-story steel braced frame at the inelastic i-step where the roof displacement is observed in pushover analysis P-1 with positive forces.
Figure 20.
Deviation (%) of the damage stiffness matrix terms of the six-story steel braced frame at the inelastic i-step where the roof displacement is observed in pushover analysis P-1 with positive forces.
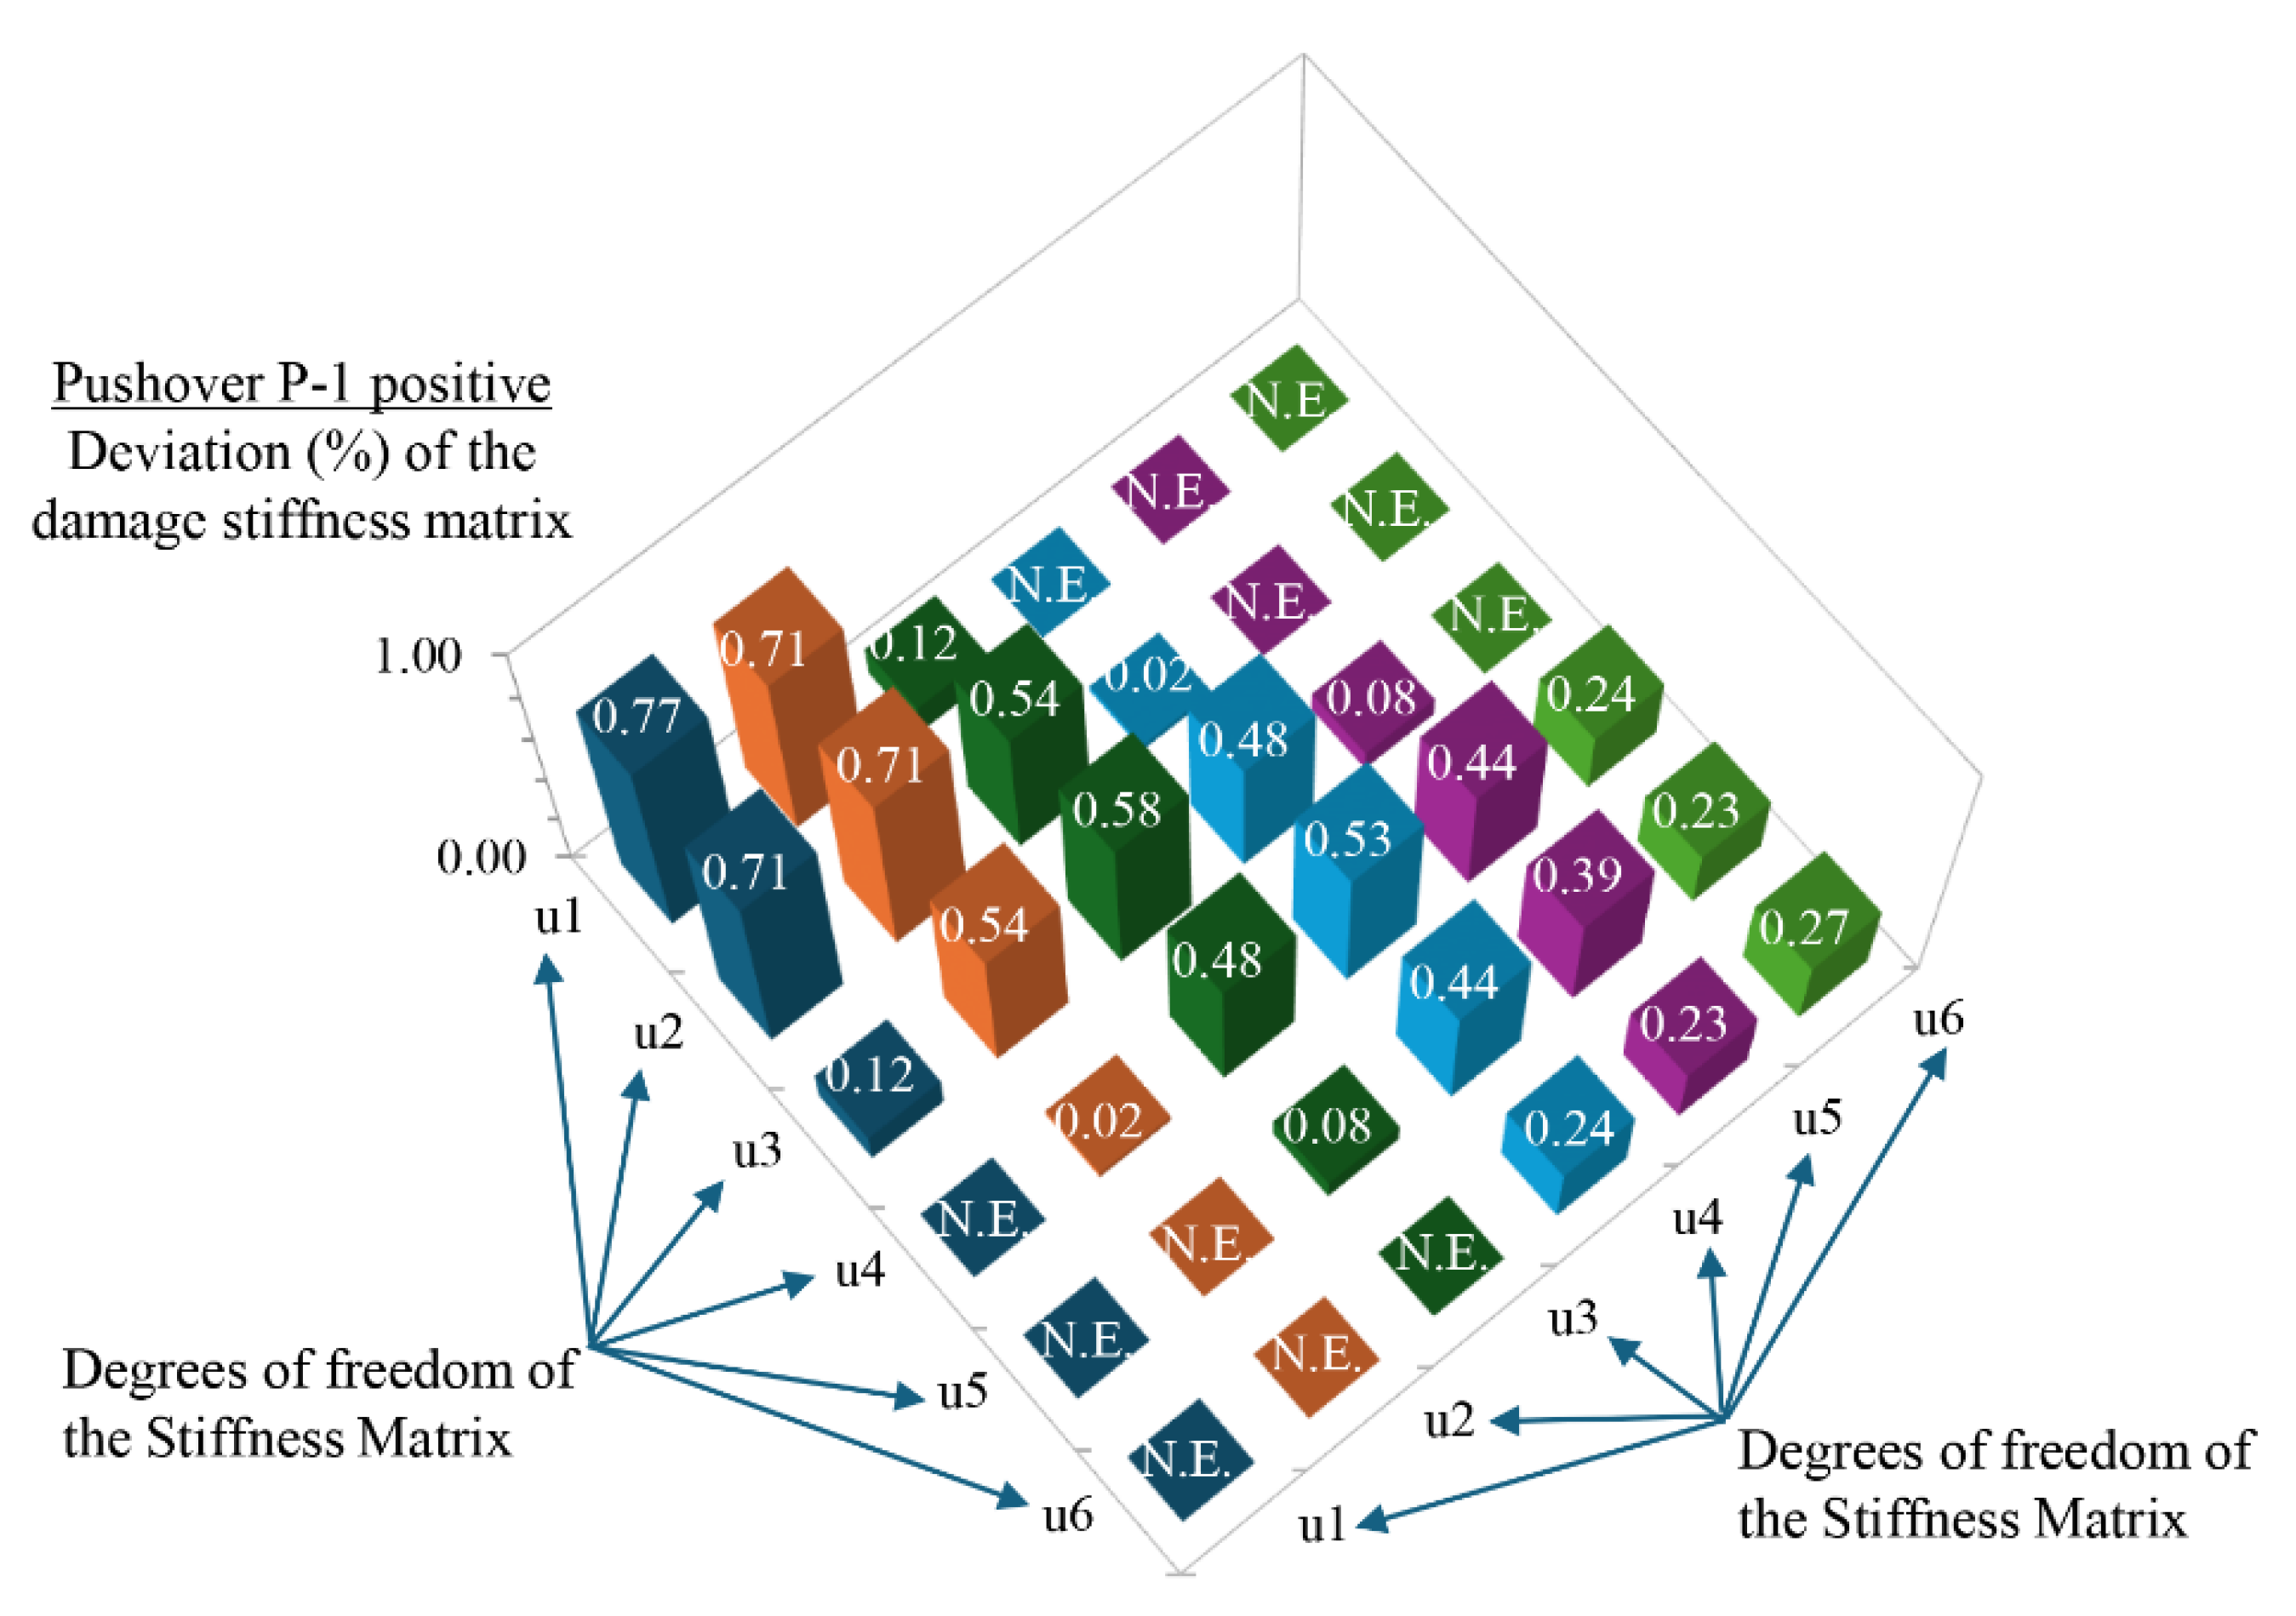
Figure 21.
Deviation (%) of the damage stiffness matrix terms of the six-story steel braced frame at the inelastic i-step where the roof displacement is observed in pushover analysis P-2 with positive forces.
Figure 21.
Deviation (%) of the damage stiffness matrix terms of the six-story steel braced frame at the inelastic i-step where the roof displacement is observed in pushover analysis P-2 with positive forces.
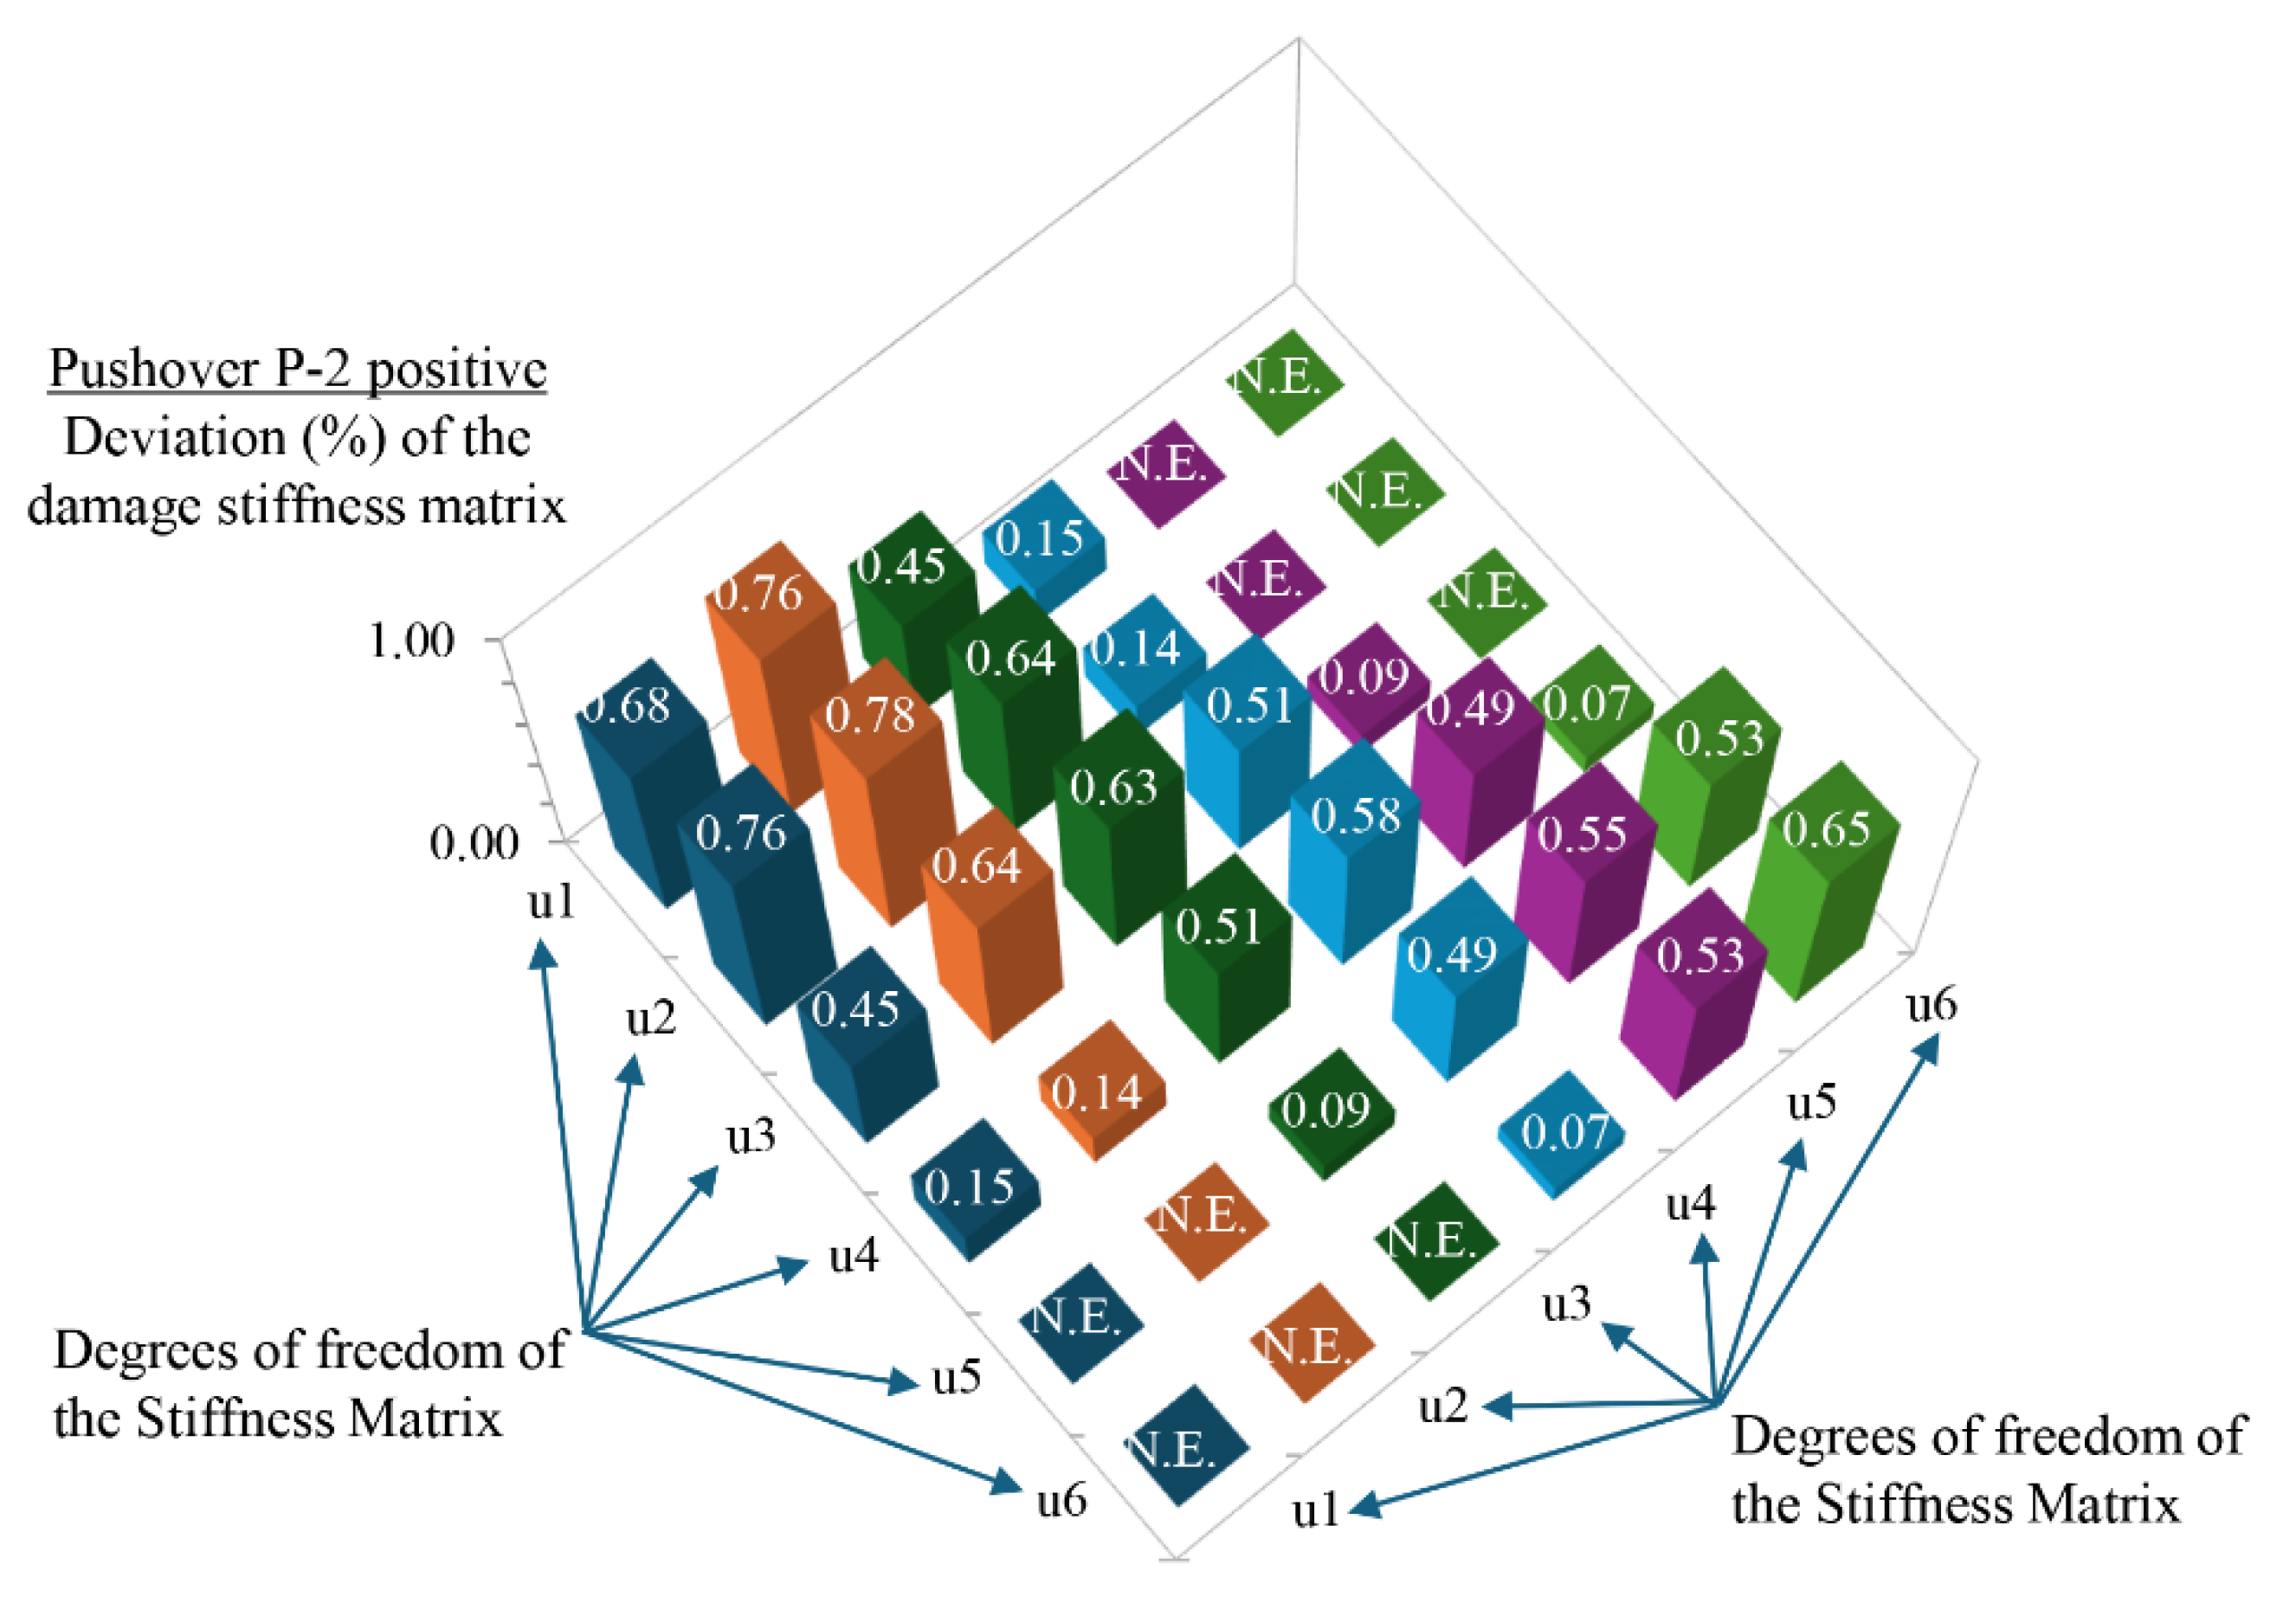
Figure 22.
Deviation (%) of the damage stiffness matrix terms of the six-story steel braced frame at the inelastic i-step where the roof displacement is observed in pushover analysis P-1 with negative forces.
Figure 22.
Deviation (%) of the damage stiffness matrix terms of the six-story steel braced frame at the inelastic i-step where the roof displacement is observed in pushover analysis P-1 with negative forces.
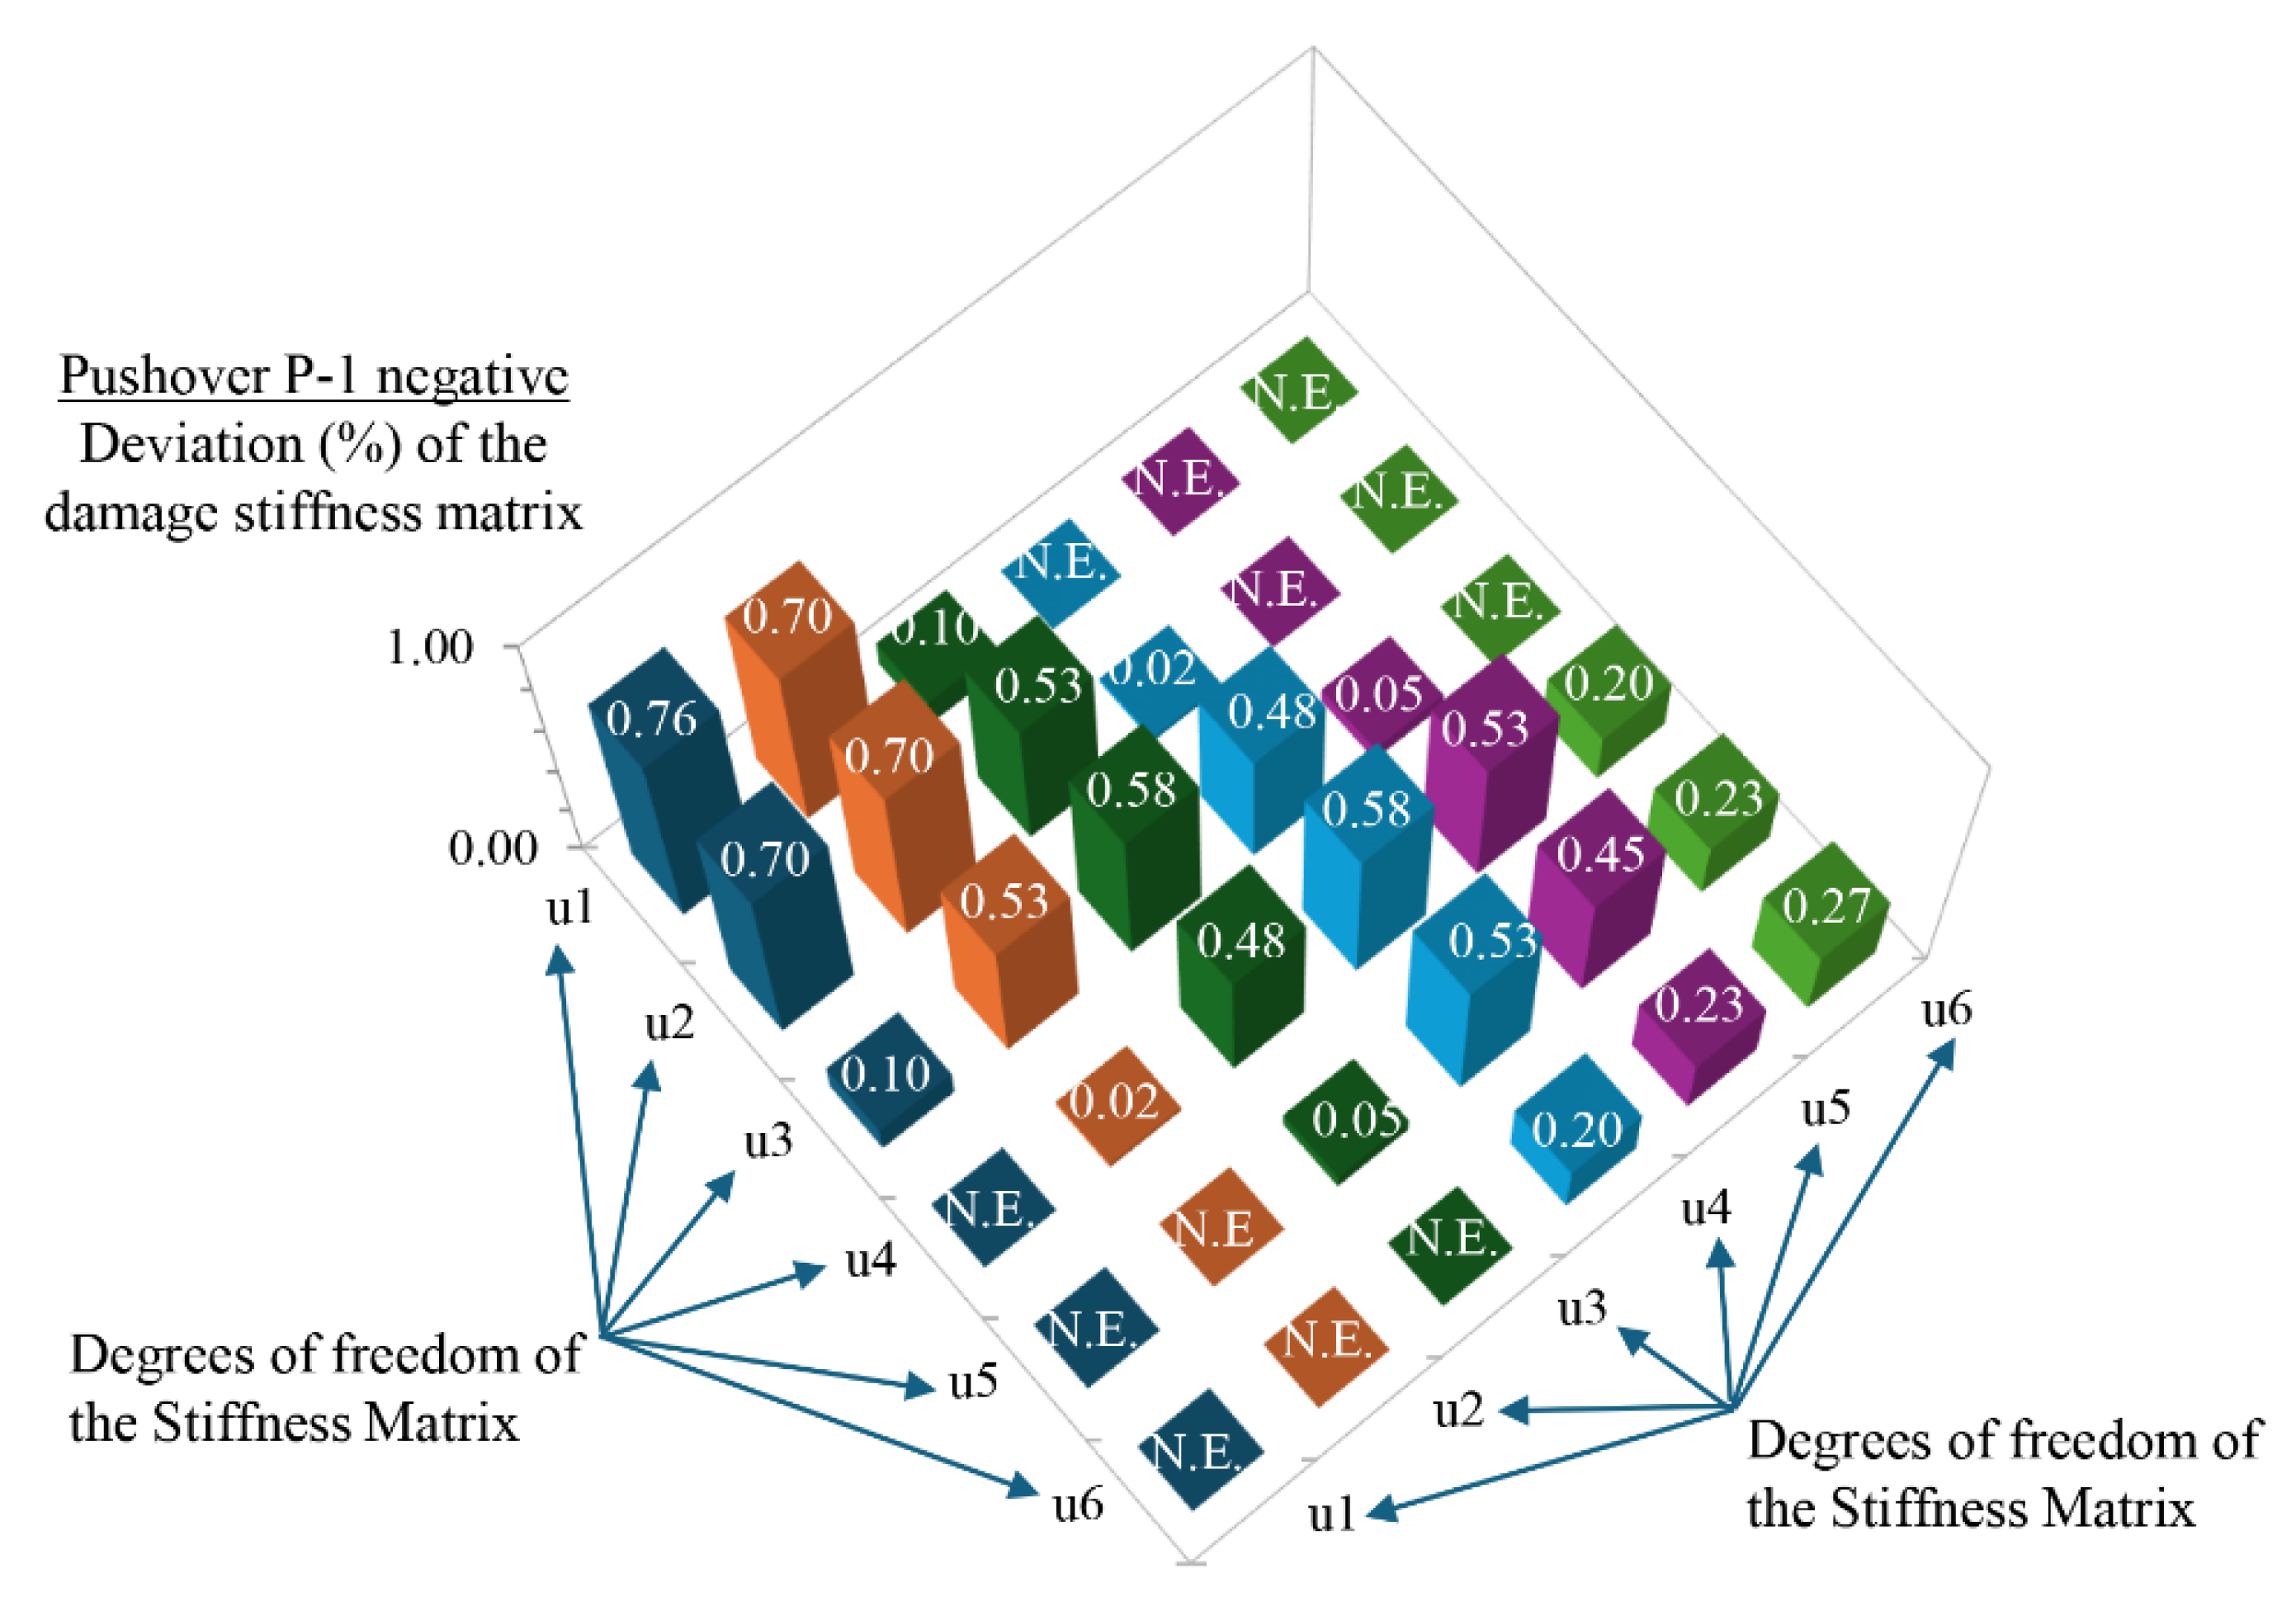
Figure 23.
Deviation (%) of the damage stiffness matrix terms of the six-story steel braced frame at the inelastic i-step where the roof displacement is observed in pushover analysis P-2 with negative forces.
Figure 23.
Deviation (%) of the damage stiffness matrix terms of the six-story steel braced frame at the inelastic i-step where the roof displacement is observed in pushover analysis P-2 with negative forces.
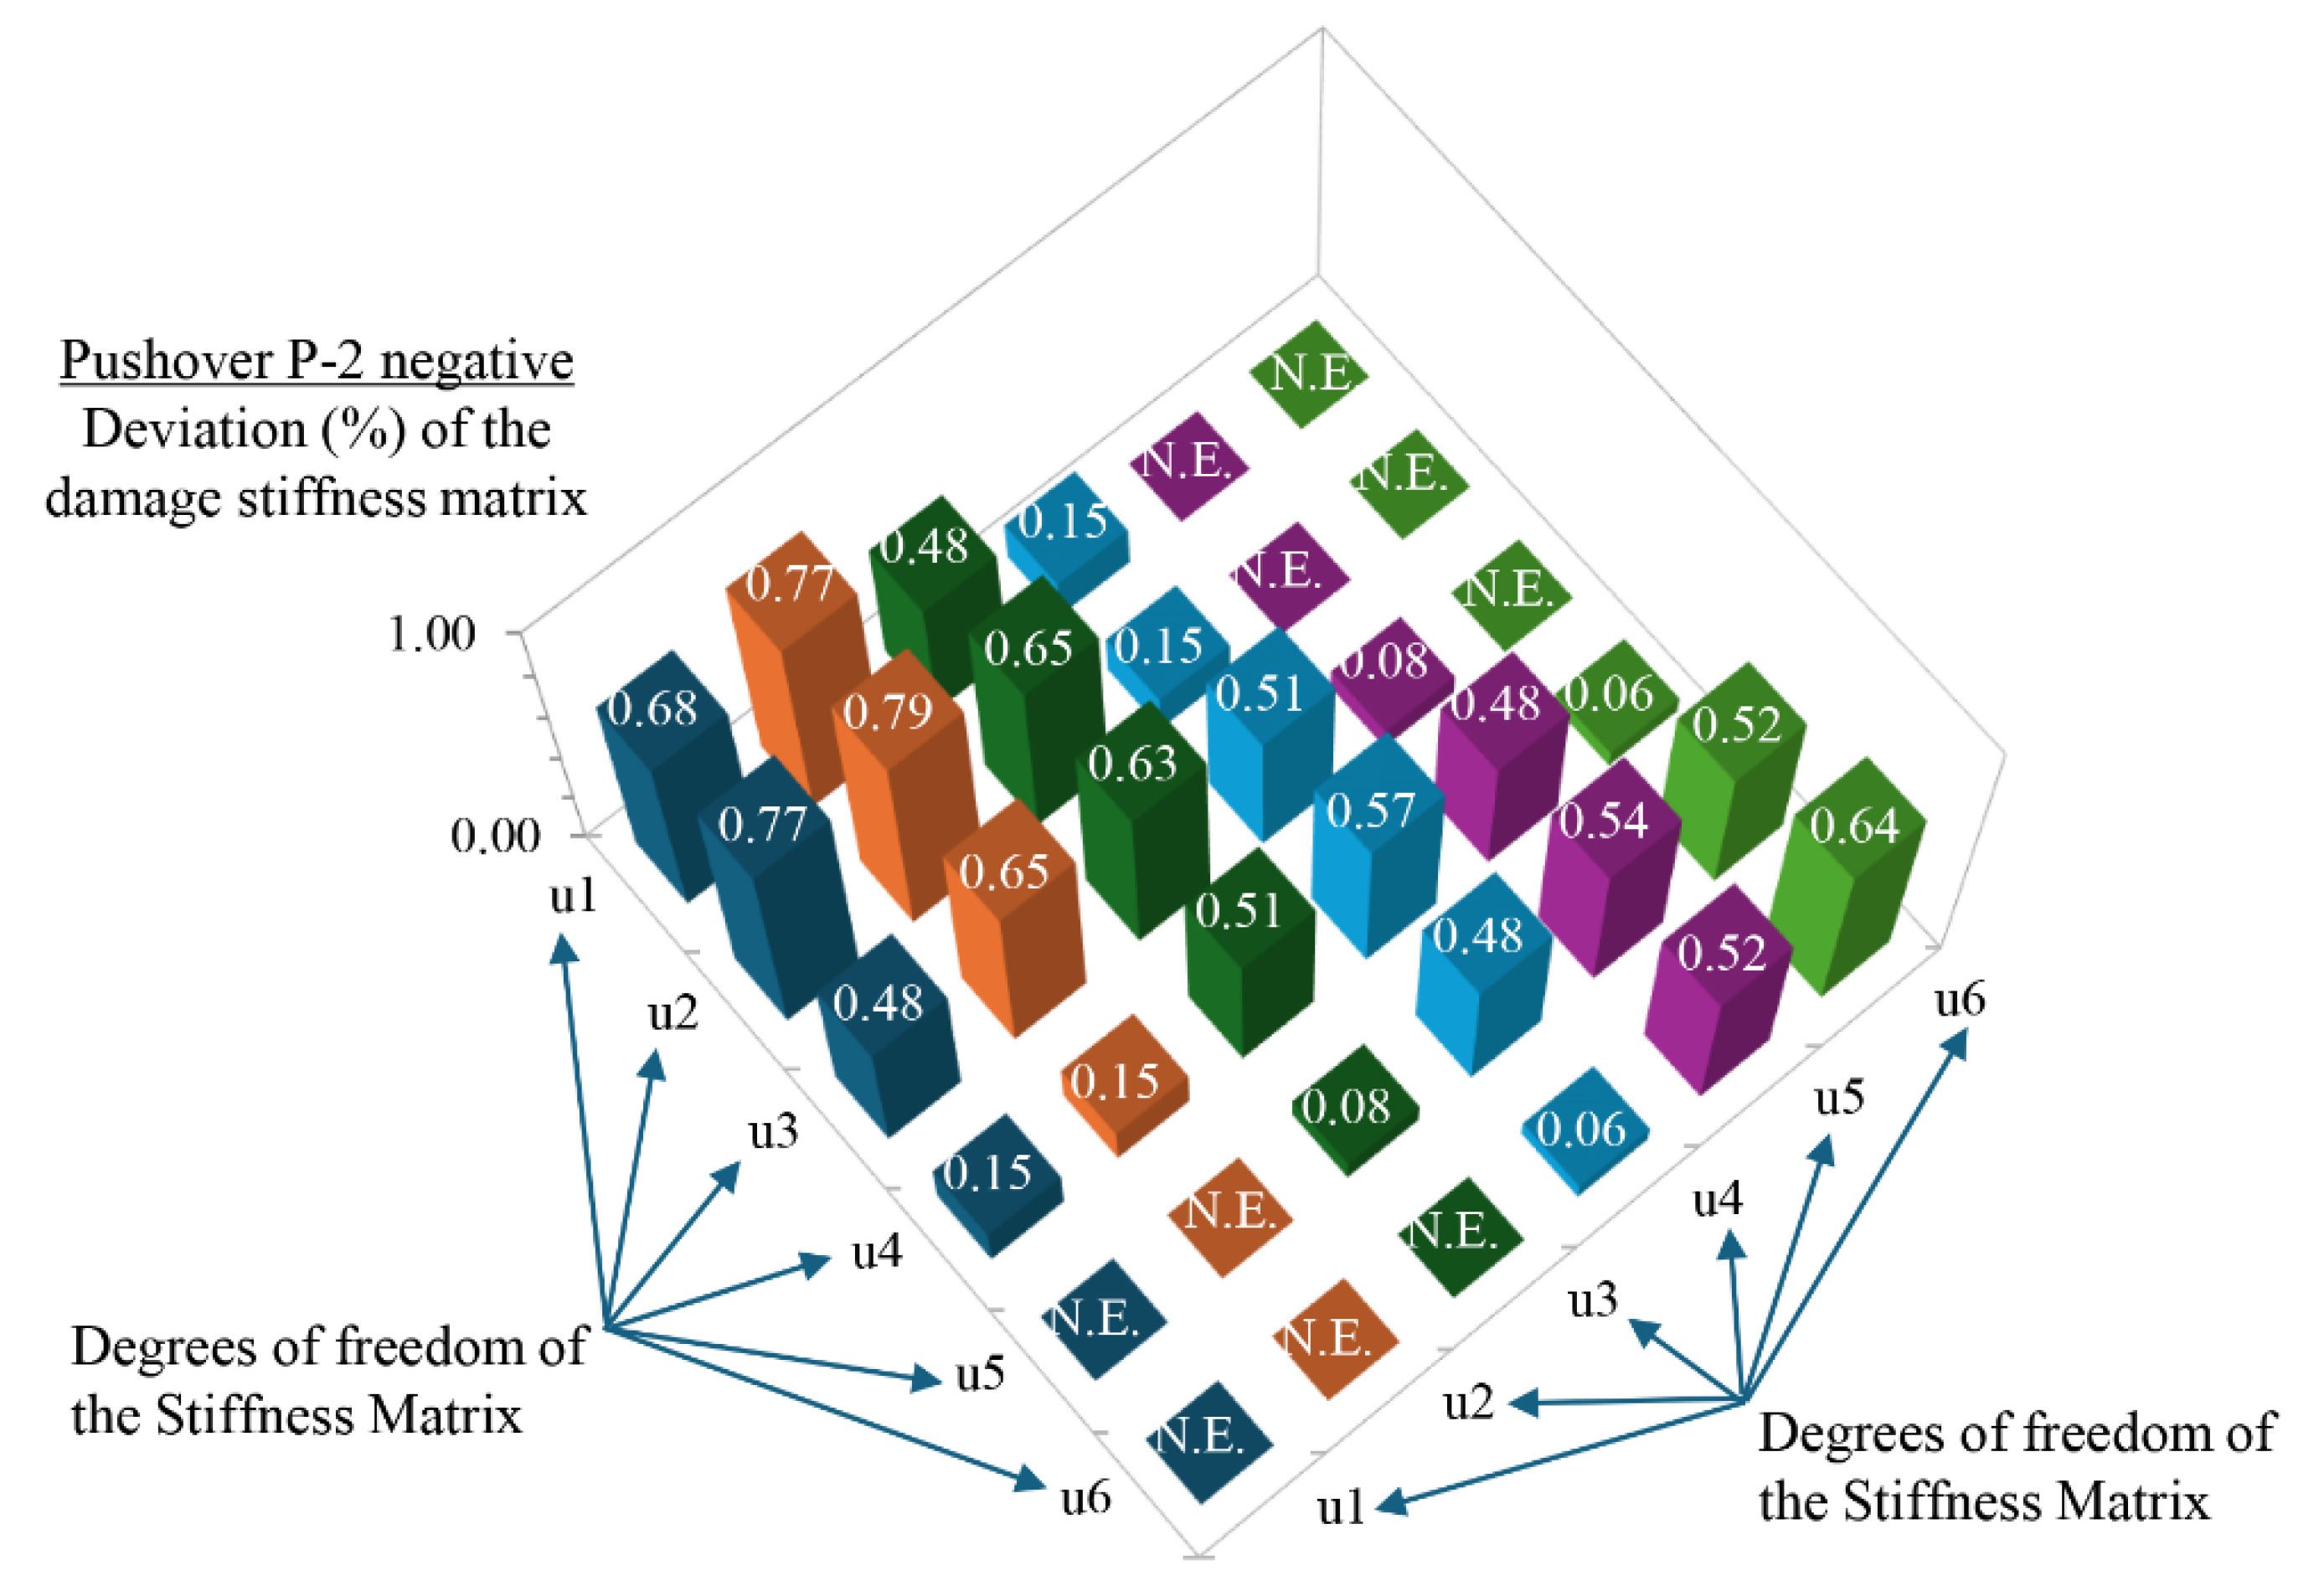

Table 1.
Mean values (best-fitted lines) of stepping eigenfrequencies (Hz) of the existing six-story, steel braced frame, for the two pushover sets P-1 και P-2.
Table 1.
Mean values (best-fitted lines) of stepping eigenfrequencies (Hz) of the existing six-story, steel braced frame, for the two pushover sets P-1 και P-2.
| (m) | (rad) | (Hz) | (Hz) | (Hz) | (Hz) | (Hz) | (Hz) |
|---|---|---|---|---|---|---|---|
| 0 | 0 | 2.97 | 7.74 | 12.20 | 17.75 | 23.51 | 30.67 |
| 0.02 | 0.0011 | 2.82 | 7.57 | 11.91 | 17.36 | 22.94 | 30.03 |
| 0.05 | 0.003 | 1.70 | 5.83 | 9.00 | 13.50 | 18.65 | 23.90 |
| 0.08 | 0.004 | 1.14 | 4.10 | 8.25 | 12.60 | 16.61 | 20.23 |
| 0.13 | 0.007 | 0.70 | 3.35 | 7.00 | 11.40 | 15.42 | 19.43 |
| 0.17 | 0.009 | 0.61 | 2.90 | 6.31 | 10.70 | 14.78 | 18.96 |
| 0.18 | 0.010 | 0.60 | 2.80 | 6.14 | 10.53 | 14.64 | 18.84 |
| 0.2 | 0.011 | 0.58 | 2.60 | 5.80 | 10.20 | 14.35 | 18.60 |
| 0.23 | 0.012 | 0.55 | 2.55 | 5.70 | 9.95 | 14.07 | 18.50 |
| 0.26 | 0.014 | 0.54 | 2.50 | 5.60 | 9.70 | 13.88 | 18.40 |
| 0.28 | 0.015 | 0.52 | 2.47 | 5.53 | 9.53 | 13.75 | 18.33 |
| 0.3 | 0.016 | 0.51 | 2.43 | 5.47 | 9.37 | 13.63 | 18.27 |
Table 2.
Increase in the period values (s) between the health state and the NC state of the existing steel frame.
Table 2.
Increase in the period values (s) between the health state and the NC state of the existing steel frame.
| Damage State | (s) | (s) | (s) | (s) | (s) | (s) |
|---|---|---|---|---|---|---|
| Health | 0.34 | 0.13 | 0.08 | 0.06 | 0.04 | 0.03 |
| 1st plastic hinge (utop=0.02m) | 0.35 | 0.13 | 0.08 | 0.06 | 0.04 | 0.03 |
| DL (utop=0.05m) | 0.59 | 0.17 | 0.11 | 0.07 | 0.05 | 0.04 |
| At detected frequency(utop=0.18m) | 1.67 | 0.36 | 0.16 | 0.09 | 0.07 | 0.05 |
| SD (utop=0.24m) | 1.83 | 0.39 | 0.18 | 0.10 | 0.07 | 0.05 |
| NC (utop=0.32m) | 2.00 | 0.42 | 0.19 | 0.11 | 0.07 | 0.05 |
Table 3.
Stepping eigenfrequencies (Hz) of the existing steel braced frame into the nonlinear area, at a target displacement of in pushover analyses P-1 and P-2 along the positive and negative direction.
Table 3.
Stepping eigenfrequencies (Hz) of the existing steel braced frame into the nonlinear area, at a target displacement of in pushover analyses P-1 and P-2 along the positive and negative direction.
| Mode | Pushover P-1 x | Pushover P-1 -x | Pushover P-2 x | Pushover P-2 -x | Mean values |
| 1 | 0.64 | 0.51 | 0.66 | 0.66 | 0.62 |
| 2 | 3.16 | 2.60 | 2.98 | 3.01 | 2.94 |
| 3 | 6.68 | 6.34 | 6.00 | 5.99 | 6.25 |
| 4 | 10.86 | 10.85 | 10.37 | 10.41 | 10.62 |
| 5 | 15.07 | 14.77 | 14.46 | 14.43 | 14.68 |
| 6 | 19.14 | 18.99 | 17.85 | 17.78 | 18.44 |
Table 4.
Deviation (%) of the damage stiffness matrix terms of the six-story steel braced frame at the inelastic i-step where the roof displacement is observed in pushover analysis P-1 with positive forces.
Table 4.
Deviation (%) of the damage stiffness matrix terms of the six-story steel braced frame at the inelastic i-step where the roof displacement is observed in pushover analysis P-1 with positive forces.
| β.ε. | ||||||
|---|---|---|---|---|---|---|
| 0.77 | 0.71 | 0.12 | N.E. | N.E. | N.E. | |
| 0.71 | 0.71 | 0.54 | 0.02 | N.E. | N.E. | |
| 0.12 | 0.54 | 0.58 | 0.48 | 0.08 | N.E. | |
| N.E. | 0.02 | 0.48 | 0.53 | 0.44 | 0.24 | |
| N.E. | N.E. | 0.08 | 0.44 | 0.39 | 0.23 | |
| N.E. | N.E. | N.E. | 0.24 | 0.23 | 0.27 |
Table 5.
Deviation (%) of the damage stiffness matrix terms of the six-story steel braced frame at the inelastic i-step where the roof displacement is observed in pushover analysis P-2 with positive forces.
Table 5.
Deviation (%) of the damage stiffness matrix terms of the six-story steel braced frame at the inelastic i-step where the roof displacement is observed in pushover analysis P-2 with positive forces.
| β.ε. | ||||||
|---|---|---|---|---|---|---|
| 0.68 | 0.76 | 0.45 | 0.15 | N.E. | N.E. | |
| 0.76 | 0.78 | 0.64 | 0.14 | N.E. | N.E. | |
| 0.45 | 0.64 | 0.63 | 0.51 | 0.09 | N.E. | |
| 0.15 | 0.14 | 0.51 | 0.58 | 0.49 | 0.07 | |
| N.E. | N.E. | 0.09 | 0.49 | 0.55 | 0.53 | |
| N.E. | N.E. | N.E. | 0.07 | 0.53 | 0.65 |
Table 6.
Deviation (%) of the damage stiffness matrix terms of the six-story steel braced frame at the inelastic i-step where the roof displacement is observed in pushover analysis P-1 with negative forces.
Table 6.
Deviation (%) of the damage stiffness matrix terms of the six-story steel braced frame at the inelastic i-step where the roof displacement is observed in pushover analysis P-1 with negative forces.
| β.ε. | ||||||
|---|---|---|---|---|---|---|
| 0.76 | 0.70 | 0.10 | N.E. | N.E. | N.E. | |
| 0.70 | 0.70 | 0.53 | 0.02 | N.E. | N.E. | |
| 0.10 | 0.53 | 0.58 | 0.48 | 0.05 | N.E. | |
| N.E. | 0.02 | 0.48 | 0.58 | 0.53 | 0.20 | |
| N.E. | N.E. | 0.05 | 0.53 | 0.45 | 0.23 | |
| N.E. | N.E. | N.E. | 0.20 | 0.23 | 0.27 |
Table 6.
Deviation (%) of the damage stiffness matrix terms of the six-story steel braced frame at the inelastic i-step where the roof displacement is observed in pushover analysis P-2 with negative forces.
Table 6.
Deviation (%) of the damage stiffness matrix terms of the six-story steel braced frame at the inelastic i-step where the roof displacement is observed in pushover analysis P-2 with negative forces.
| β.ε. | ||||||
|---|---|---|---|---|---|---|
| 0.68 | 0.77 | 0.48 | 0.15 | N.E. | N.E. | |
| 0.77 | 0.79 | 0.65 | 0.15 | N.E. | N.E. | |
| 0.48 | 0.65 | 0.63 | 0.51 | 0.08 | N.E. | |
| 0.15 | 0.15 | 0.51 | 0.57 | 0.48 | 0.06 | |
| N.E. | N.E. | 0.08 | 0.48 | 0.54 | 0.52 | |
| N.E. | N.E. | N.E. | 0.06 | 0.52 | 0.64 |
Disclaimer/Publisher’s Note: The statements, opinions and data contained in all publications are solely those of the individual author(s) and contributor(s) and not of MDPI and/or the editor(s). MDPI and/or the editor(s) disclaim responsibility for any injury to people or property resulting from any ideas, methods, instructions or products referred to in the content. |
© 2024 by the authors. Licensee MDPI, Basel, Switzerland. This article is an open access article distributed under the terms and conditions of the Creative Commons Attribution (CC BY) license (http://creativecommons.org/licenses/by/4.0/).
Copyright: This open access article is published under a Creative Commons CC BY 4.0 license, which permit the free download, distribution, and reuse, provided that the author and preprint are cited in any reuse.


