Submitted:
15 August 2025
Posted:
19 August 2025
You are already at the latest version
Abstract
Barfield Bay fills the 3.6km by 2.5km, semi-elliptical, center of a north-south-oriented, 15,000-year-old (OSL) parabolic dune with the primary tidal opening on its southern margin. Three vibracores were taken along the aeolian dune margin and three within Barfield Bay. The Barfield Bay vibracores penetrated a maximum thickness of 7-meters of mollusk-shell-rich, silty, fine-grained, quartz sand of Holocene age. Mastersizer 2000 granulometric analysis of 57 sediment samples produced volume percent histograms with distinct sand- and silt-size modes in 41 (72%) of the 57. However, 16 (28%) have histogram patterns without such a separation. The GRANULO [1] and ROKE [2] grain-size analysis programs identified 163 separate log-normal populations that comprise 6 distinct clusters on a Mean grain-size versus Sorting plot; individual clusters contain log-normal populations from aeolian, modern intertidal, and subtidal environments. Twenty-one samples from the Barfield Bay cores were processed for mollusk-shell identification. The mollusk population is diverse with 63 species (D=0.075, Dmax=0.015) but very uneven (SEQ=0.21). Modern salinity data for the 12 most abundant and widely distributed mollusks indicate a long-term, ambient salinity range of 25-32 psu during the deposition of the sediment-fill. This sedimentary fill is thoroughly bioturbated and contains no mangrove peat material and thus is interpreted to have been deposited in the subtidal environment of a flood-tidal delta that prograded north through the southern opening of Barfield Bay. At a depth of 7-meters MSL there is a terrestrial, allogenic peat (6900±50 Cal years BP) sandwiched between subtidal, shell-rich, quartz-sand. This terrestrial peat records a relative pause in the Holocene transgression. At a depth of 2-meters there is mangrove debris (2410±50 Cal years BP) at the contact between aeolian dune and overlying intertidal deposits. This MSL indicator fits on the RSL curve [3] developed from mangrove material in the nearby Florida Keys but is 2-meters lower than the RSL position indicated by coeval beach ridges 2.5 kilometers seaward of Barfield Bay.
Keywords:
Southwest Florida Holocene
; sedimentology
; granulometry
; paralic mollusks
; Holocene sea-level
; Holocene Paleosalinity
1. Introduction
Barfield Bay is a north-south oriented, near-elliptical feature on the east margin of Marco Island, Collier County, Florida, Figure 1, that is surrounded by aeolian dunes that reach elevations of 9 to 18 meters MSL [4]. The top of the Indian Hill dune at 18 meters MSL is the highest natural feature in peninsular Florida south of Lake Okeechobee. The bay is very shallow with depths less than 0.5 to 0.7 meters [5] and has intertidal to supratidal sand shoals that support mangroves. Sedimentologic, palaeontologic, and stratigraphic data from seven (7) vibracores, between 5-7 meters long, were used to interpret the depositional environment, sediment sources, and sea level history of the Holocene deposits that fill Barfield Bay.
1.1. Geographic, Oceanographic, and Geologic Settings
Geography: Barfield Bay is located a kilometer east of the southern half of Marco Island, Collier County, Florida. This bay has a pronounced, near-elliptical shape which is emphasized by three surrounding aeolian dunes that rise out of the mangrove swamp: 1) the Indian Hill transverse (1, Figure 1), 2) the Barfield Bay parabolic (2, Figure 1), and 3) the Horrs Island transverse, Figure 1. As well as possessing a narrow, shoreline fringe of mangroves, Barfield Bay itself contains only small, isolated clumps of mangroves that are growing on the tops of intertidal sand shoals, Figure 2. The westward adjacent Marco Island is composed of two parts: 1) an eastern, Pleistocene, coastal sand-body, and 2) a western, Holocene beach-ridge plain that directly abuts the western edge of the Pleistocene coastal sand-body, Figure 1. The Holocene, barrier-island chain (Keewaydin, Little Marco, Marco, Kice, Morgan, and Cape Romano Islands, Figure 1) is separated from the mainland by a “lagoon” consisting of a series of semi-isolated bays segmented by an inter- to shallow subtidal, mangrove swamp. This mangrove-swamp-filled “lagoon” becomes the open-water Gullivan Bay south of Cape Romano Island, the southernmost, quartz-sand, barrier along the Florida Gulf coast. The low-lying (less than 1.5m MSL in elevation), nearly flat mainland is covered with fresh-water ponds and marshes; Pleistocene coastal sand-deposits are <50cm below the surface. In several places the underlying Pleistocene sand forms low-relief mounds or hammocks; the 8-m high, Pleistocene Sand Hill transverse dune is the major topographic feature of the adjacent mainland, Figure 1.
Oceanography: The Marco Island region is microtidal with a diurnal tidal range of 0.9m [7] and experiences a relatively low, incident, wave energy. Two, present-day, flood-tidal deltas have prograded into Barfield Bay: 1) a larger, north-directed delta from Caxambas Pass, and 2) a smaller, west-directed delta from Blue Hill Creek, A and B in Figure 2. Barfield Bay is very shallow with MLW water depths between 1 and 2 feet (0.3-0.6 meters) [5]. A wave hindcast model [8] estimates an average significant wave height (average of the highest one-third of the incident wave spectrum) along this part of the southwest Florida Gulf coast to be 50+40 cm with a period of 5+1.5 seconds. Wave-gauge data from the Naples, Florida, pier located 26 km to the north indicate somewhat lower values of 30+20 cm and 4.4+1.8 seconds [9].
Geology: The Marco Island region “bedrock” is the Ochopee Member of the Tamiami Formation of Pliocene age. This unit contains limestone and calcareous quartz sandstone. Data from water and other wells place the top of the Tamiami Formation some 8-10 meters below MSL in the Marco Island/Barfield Bay region, Panels 1 and 2 in Figure 3. The decimeter-thick, clay layer that commonly occurs at the top of the Tamiami has been interpreted to have resulted from the in situ, karstic erosion of the underlying limestone, water well No. 17115 [10]. Pleistocene coastal deposits, which consist primarily of quartz sand, overlie the clay with an arguable disconformable contact, based on the superposition of a marine deposit on top of the non-marine, karst-generated, clay layer. The Pleistocene isopach map defines two separate sand bodies (A and B of Panel 3 in Figure 3) with the older body A being most likely a coastal barrier. The younger body B (eastern Marco Island) may also be a coastal barrier; however, it also could be a late Pleistocene dune given that it is essentially an isolated mass some 4 to 5 times thicker than body A, Figure 3. Holocene sediments in the Marco Island region are quartz sand, shell-rich quartz sand, Crassostrea virginica reefs, Vermetid sp. reefs [11], carbonate and siliciclastic silt, and organic debris of various sizes. The most significant sediments by volume are the quartz sand and shell-rich quartz sand. The Holocene isopach map, Panel 4 of Figure 3, shows a major “thick” extending southeast from Marco Island/Barfield Bay region down to the Cape Romano shoals. Barfield Bay itself contains the thickest Holocene section in this region, between 7-8 meters. This Holocene “thick” dramatically thins offshore over a distance of less than 4 kilometers. The onshore “thinning” across Gullivan Bay and the Ten Thousand Islands occurs over a 35-kilometer distance, Panel 4 of Figure 3. This geometry is a classic “clastic wedge” that indicates the sediment source to be the offshore Gulf of Mexico and not the Florida mainland. In addition, the Pleistocene and Holocene deposits are arranged in an overall off-lapping pattern. Although there are few deep wells with cuttings in the Marco Island region, the ones that are present clearly indicate a pronounced deepening of the Tamiami Limestone to the west. A coastal barrier interpretation of the Pleistocene isopach “thick” shown at location B in Panel 3 is somewhat anomalous given that the Pleistocene immediately to the north and east is primarily 2-meters thick. Perhaps a better interpretation is that it represents an aeolian dune formed during the Wisconsin glacial lowstand prior to the deposition of the 25,000- year-old Indian Hill dune. The orange color in Panel 4 identifies the presence of Pleistocene coastal deposits at the ground surface.
The isopach pattern of the Holocene coastal deposits in Panel 4 defines a depo-center “thick” that extends southwest, parallel to the mainland shoreline, from Marco Island to well out onto the Cape Romano Shoal. Barfield Bay contains a thick depo-center isolated behind its “high”, surrounding, terrestrial dunes.
The Marco Island Region contains the southernmost, quartz-sand, barrier islands along the Florida Gulf coast. The transition zone between the northern siliciclastic sediment province and the southern carbonate province is 35 km farther south for shelf sediment and 80 km farther south for littoral sediment [12]. The carbonate silt-size material in the Marco Island Region comes primarily from the mechanical breakdown of carbonate shells [13,14] and secondarily from dust blown from the Sahara Desert [15]. There is essentially no siliciclastic clay in this region.
Archaeology: Late Archaic middens, composed primarily of Crassostrea virginica with minor Mercenaria sp. and Busycon sp. shells, are found on all of the dunes that surround Barfield Bay [16,17,18,19]. These sites provide a minimum age estimate of 5000-4000 years BP for the construction/deposition of the dunes that surround Barfield Bay. Two major such sites are located on Horrs Island (8Cr209) and at the eastern end of the Indian Hill dune (8Cr107) at the historic Caxambas town site, Figure 2. Portions of the Horrs Island site have been preserved, but the Caxambas site has been almost completely covered with houses constructed since the mid-1970s. The shell middens that comprise archaeologic sites 8CR48 and 8CR49 underlie the historic Key Marco village, Figure 1. These sites yielded wooden artifacts [20]. The evidence from utility trenches across portions of the historic Key Marco village strongly suggests that these sites most likely were originally located offshore, probably as pile dwellings, and not on the Pleistocene sand body that comprises the eastern portion of Marco Island [21,22].
2. The Barfield Bay Aeolian Dunes
2.1. Geomorphology
The Indian Hill, Barfield Bay, and Horrs Island terrestrial aeolian dunes define the near-elliptical shape of Barfield Bay. The vast majority of these sand ridges rise to between 8-9 meters MSL, however, portions of the Indian Hill dune rise to 18 meters MSL and are the highest natural elevations in Florida south of Lake Okeechobee. The 5-foot (1.5-meter) contour lines on the topographic maps depict essentially symmetric ridges (Figure 2). The Barfield Bay dune has an overall elliptical shape that is open to the south; there are isolated sections along its western limb that appear to have steeper west-facing slopes. These observations support the interpretation that the Barfield Bay dune is a parabolic dune that migrated from south to north. Detailed topographic profiles measured during archaeological excavations at Horrs Island, now a gated community called Key Marco, clearly show a markedly steeper angle to portions of the north-facing slope [19] that along with the nearly linear crest support the interpretation that it is a transverse dune with a north-facing slip or avalanche face. The sand ridge that forms the Indian Hill dune has the shape of a north-facing crescent that suggests either an incipient parabolic dune or the subsequent modification of a transverse dune with a north-facing avalanche or slip face. We favor the interpretation that all three of the dunes that surround Barfield Bay resulted from northward sand transport from a local, nearby, southerly, sand source.
2.2. Sand Characteristics
Sediment samples (25) from vibracores that penetrated the Horrs Island transverse dune (Core 2, Figure 2) and Barfield Bay parabolic dune (Cores 6 and 7, Figure 2) are composed primarily (100% to 75% by volume) of moderately well sorted (0.5-0.7 phi units), medium grain-size (1.75-2.0 phi) quartz sand with a secondary silt component. The granulometry of these samples will be discussed in detail in the following Granulometry Section. Though these grain size characteristics can be found in sediments from a variety of depositional environments, they are consistent with aeolian deposition. Cross stratification, while expected, is absent, though the intense reworking and disruption by the vibracoring process could have obliterated these fabrics.
2.3. Chronometry
Sand samples for Optically Stimulated Luminescence (OSL) dating were collected from 1-meter deep, hand-dug pits on the crests of all three dunes that surround Barfield Bay, see sites 1-3 marked with pentagons in Figure 2. The Indian Hill dune is the oldest at 25,700+1400 years, the Barfield Bay Parabolic dune is 15,100+1000 years old, and the Horrs Island transverse dune is 7700+1000 years old. Thus, the Indian Hill and Barfield Bay Parabolic dunes are late Pleistocene and the Horrs Island Transverse dune is early Holocene. The Sand Hill transverse(?) dune which is on the adjacent mainland 25 km north of Marco Island (Figure 1) is 14,700+1000 years old. Basic details of these four OSL analyses are presented in Figure 4A; complete details are found in Appendix A (Appendices 1 and 2).
These OSL ages require that both the Indian Hill and Horrs Island dunes are separate and distinct from the Barfield Bay Parabolic Dune that surrounds the majority of Barfield Bay, despite their locations on the southern ends of the parabolic limbs. The occurrence of 3 major aeolian dunes in this restricted geographic area indicates a juxtaposed, long-term, sand source located immediately to the south. A chronological interpretation of the development of the three dunes which surround Barfield Bay is presented in Figure 4B.
2.4. Barfield Bay Parabolic Dune in Relation to Barfield Bay Basin
It is reasonable to expect that the growth and migration of the Barfield Bay Parabolic Dune created some of the 7-meter depth of Barfield Bay that is now filled with Holocene sediment. An estimate of the importance of any aeolian erosion can be obtained by comparing the volume of sediment contained in the parabolic dune ridge with the volume of the Holocene sediment-fill within the basin. The areas of the closed contour lines that define the Barfield Bay Parabolic Dune were measured and volumes calculated using the contour intervals. An estimate was made of the potential sand volume that could occur beneath ground level on top of the sloping surface of the underlying Pleistocene coastal (?) deposits of east Marco Island. These measurements suggest a total sand volume of 7x10⁶ cubic meters for the Barfield Bay Parabolic Dune. The volume of the Holocene sediment-fill of Barfield Bay can be estimated by measuring the map area of the shoreline and multiplying by the 4- to 7-meter thicknesses of the various vibracores. This technique produces a sediment volume estimate of 22x106 cubic meters. This suggests that no more than one third of the pre-Holocene depth of Barfield Bay could result from the direct erosion of the sand that presently resides in the parabolic dune. The only available, nearby sub-surface data come from borings made prior to the construction of the Horrs Island Road bridge over Blue Hill Creek [23], Figure 4C. These borings indicate that Pleistocene deposits may well not be continuous over the entire Barfield Bay region. The pronounced thickness of the Pleistocene body B (Panel 3, Figure 3) is an indication of considerable local relief in this region prior to the deposition of the terrestrial aeolian dunes that surround Barfield Bay. We hypothesize that the Barfield Bay Parabolic Dune migrated across and up the pre-existing slope of Pleistocene body B with the dune’s constituent sand coming from a southerly source. Pleistocene body B could well be the remnant of a coastal deposit; however, it appears to be some 5 times the thickness of the more landward and more linear Pleistocene coastal deposit labeled A in Panel 3, Figure 3. Alternatively, Body B could be a Pleistocene, terrestrial dune formed prior to the Indian Hill dune.
3. The Holocene Sediment-Fill of Barfield Bay
3.1. Granulometry
3.1.1. Introduction
The Holocene sediments filling Barfield Bay (Cores 3, 4, and 5) consist of mollusk shell-rich, silty, quartz sand with a “massive”, homogeneous texture, Figure 5. The vibracoring process can, and typically does, destroy or significantly modify existing stratification, however, subsequent bioturbation is most probably responsible for most of the “massive”, homogeneous character of the Barfield Bay sediment-fill. Thus, the samples of the bay-fill, in all likelihood, include sediment from multiple, originally separate layers.
Fifty-seven (57) sediment samples were collected from six (6) vibracores taken in the following locations, see Figure 2: A) Cores 3, 4, and 5 from the Holocene material filling Barfield Bay, B) Cores 6 and 7 from the western and eastern arms respectively of the Pleistocene parabolic dune that surrounds the bay, and C) Core 2 from the Horrs Island Holocene dune that forms the southeast margin of the bay, Figure 6A,B. Each sample consisted of material collected over a 5-centimeter, vertical interval. The Pleistocene dune samples consist of essentially homogeneous, quartz sand, however, a portion of Core 6, which penetrated Pleistocene dune sand on the western margin of the bay, contains numerous centimeter-thick layers defined by tan and gray coloration. Samples of these centimeter-thick layers have essentially the same granulometric characteristics as the bulk samples from the 5-centimeter intervals in this core and in cores from the other Pleistocene and Holocene dunes.
3.1.2. Analytical Techniques
Carbonate-shell material was removed by sieving through a 1-mm screen; only the material that passed through the 1-mm screen is represented in the granulometric characterizations of these 57 samples. No attempt was made to separate the sand-, silt-, or clay-size fractions from each other prior to size analysis. Sub-samples taken from material collected over the 5-cm intervals were 1) converted into aliquots of dispersed sediment, made according to manufacturer protocols, and then 2) analyzed in a MasterSizer 2000 which 3) yielded the volume percent of quarter Phi-sizes from 0 to 9 Phi, effectively coarse sand through very fine silt. All volumes in those intervals between 0 to 4 Phi represent sand sizes and those volumes in intervals between 4 to 9 Phi are silt sizes. The MasterSizer 2000 data were used to construct total sample histograms showing the volume-percent frequency of the quarter-Phi size classes, Figure 7.
HP Group A consists solely of sand. The sand and silt modes in HP HP Group B are separated by an interval of zero values at 4 Phi (the red arrow, Figure 7) and thus are two distinct populations. The red outline box in HP HP Group C (Figure 7) identifies a “saddle” of very low values, less than 1.5 volume percent, that connects sand and silt modes; these two modes can be truncated at the minimum value and can be treated as two distinct populations with minimal loss of information. The HP Group D pattern, restricted to the silt-rich samples of Core 3 (Figure 6A), describes a gradual transition across the 4 Phi boundary between the volumetrically prominent sand sizes and the volumetrically subordinate silt sizes. This gradual transition indicates the presence of a mode containing both very fine sand and coarse silt. HP Group E has a prominent sand mode that connects with a flat, silt mode of nearly equal volume percent values across the entire silt sizes. HP Group F is a prominent, asymmetric silt mode that has a downward sloping contact with the sand sizes.
The distinct sand populations present in HP Groups A, B, and C were entered into the GRANULO program [1] for a determination of their respective statistical moment measures. Because samples from HP Groups D, E, and F have no such readily apparent separation points they were analyzed with ROKE [2], a program for the non-linear, least-squares, decompaction of mixtures of normal distributions. Inputs to ROKE include the mean, standard deviation, and relative proportion of two or more preliminary estimates.
3.2. Results of GRANULO [1] and ROKE [2] Analyses
3.2.1. HP HP Groups A and B-Sand
The sand populations of the thirty (30) samples of HP HP Groups A and B were analyzed with the GRANULO program [1] to determine their statistical moment measures of mean, standard deviation, skewness, and kurtosis, Figure 8A. The near zero skewness values of sand populations in HP HP Groups A and B describe essentially symmetric distributions which support an interpretation that they can be considered to have a normal or Gaussian distribution. The kurtosis values are somewhat lower than the 3.0 value of a normal distribution and indicate “fat-tails”, an excess of observations in the extreme tails of these distributions relative to a normal distribution. Furthermore, HP Groups A and B sand populations moment measures are statistically indistinguishable from each other.
3.2.2. HP Group C-Sand
A ROKE [2] analysis, limited to searching for two normal populations (2ND, Figure 8A) was made on the eleven (11) HP Group C sand populations because their order of magnitude-higher skewness values, blue numbers in Figure 8A, suggest that the sand mode consists of at least two distinct populations. ROKE only searches for normal distributions and thus there are no resulting skewness or kurtosis values. The ROKE program identified two normal distributions, Pop 1 and Pop 2, that could have been combined to produce the measured distribution, Figure 8A. HP Group C Pop 1 is statistically indistinguishable from the sand distributions in HP Groups A and B. Pop 2, magenta numbers in Figure 8A, contains sand of a significantly finer mean grain-size than sand of Pop 1 and HP Groups A and B.
3.2.3. HP Groups B and C-Silt
The silt frequency distributions of HP HP Groups B and C have a definite polymodal geometry with prominent coarser modes between 5 and 6 Phi and less prominent finer modes between 6.5 and 7.5 Phi, Panels A and B in Figure 8B. ROKE was used to identify the two prominent modes present in these distributions. HP HP Group B silt has a coarser mode with a HP Group-averaged mean of 5.3±0.17 Phi and a HP Group-averaged standard deviation of 0.49±0.04 phi units. The HP Group B finer mode has HP Group-averaged mean of 7.11±0.23 Phi and a HP Group-averaged standard deviation of 0.89±0.07 phi units. These two modes represent 5% and 7% respectively of the total sample volume, Panel C in Figure 8B.
The silt fractions of HP Group C are polymodal with well-defined coarser modes in the 5-6 Phi range and poorer-defined finer modes in the 6.5-7.5 Phi range, similar to the silt distributions in HP Group B, Panels A and B in Figure 8B. ROKE identified two modes present in these distributions. The coarser mode has a HP Group-averaged mean of 5.16±0.25 Phi and a HP Group-averaged standard deviation of 0.64±0.05 phi units and the finer mode has a HP Group-averaged mean of 7.0±0.31 Phi and a HP Group-averaged standard deviation of 0.93±0.07 phi units, Panel C in Figure 8B. These two components have nearly equal volumes of 10% of the respective total sample volumes.
3.2.4. HP Groups A, B, and C-Summary
GRANULO [1] and ROKE [2] analysis of the sand modes in the forty-one (41) samples in HP Groups A, B, and C has identified a primary, log-normal, sand population with cluster-averaged values for mean grain-size of 2.03±0.17 Phi and for standard deviation of 0.55±0.06 phi units, Cluster 1 in Figure 8C. There is a secondary sand log-normal population with cluster-averaged values for mean grain-size of 2.86±0.1 Phi and for standard deviation of 0.61±0.05 phi units, Cluster 2 in Figure 8C. These mean grain-size values differ by nearly an entire Phi interval; however, the sorting values are essentially equal. GRANULO [1] and ROKE [2] analysis of the silt modes in the thirty-two (32) samples in HP HP Groups B and C has identified two distinct, log-normal silt populations. The coarser-grained population has a cluster-averaged, mean grain-size of 5.3±0.2 Phi and a cluster-averaged standard deviation of 0.54±0.1 Phi units, Cluster 3 in Figure 8C. The finer-grained one has a cluster-averaged mean grain-size of 7.1±0.3 Phi and a HP Group-averaged standard deviation of 0.91±0.1, cluster 4 in Figure 8C. Eight of the nine HP Group A samples were collected from the terrestrial aeolian dune deposits penetrated by Cores 2, 6, and 7, Figure 6B. HP Groups B and C samples were collected from all six cores, Figs 6A and 6B. However, eight of the ten samples collected in Core 5 are in HP Group B as are six of the eight samples collected in Core 6, Figure 6A,B. HP Group A samples contain no silt. HP Group B samples contain 88±6.5 volume percent sand and HP Group C samples contain 79±10 volume percent sand.
3.2.5. HP Group D
The volume percent distributions of these 10 samples from Core 3 contain a dominant sand mode that is highly skewed toward the finer grain-sizes. Furthermore, there is no pronounced break, such as a HP HP Group C-type saddle, between the sand and silt sizes, but rather a relatively steep, uniform slope from sand to medium silt. There is a significant reduction in slope angle going from medium to fine silt, Figure 6. This highly skewed geometry strongly argues for the existence of at least three subordinate components: 1) a sand-size mode, 2) a mode that includes both very fine sand and coarse silt grain-sizes, and 3) a medium- to fine-grained silt mode. The HP Group D samples were collected in the silt-rich portion of Core 3.
A ROKE-analysis that searched for 3 normal distributions in these HP Group D samples yielded the results presented in Figure 9. The initial estimates for these ROKE analyses included the 2Phi±0.5Phi units quartz sand population identified in HP HP Groups A, B, and C and the two silt populations identified in HP Groups B and C. However, none of these initial estimates from HP HP Groups B and C were identified by the ROKE analysis in the 10 HP Group D samples. The populations containing both very fine-grained sand and coarse-grained silt (red outline boxes in Figure 9) explain the continuous volume percent frequency curve across the 4 Phi sand-silt boundary.
3.2.6. HP Group E
The four HP Group E samples have volume-percent-histogram geometries somewhat similar to those of HP Group C but with 1) markedly wider and less voluminous sand components, 2) much more voluminous silt components, and 3) the connection between sand and silt is a very low relief “saddle” resulting in a nearly flat “terrace” of silt values, Figure 6. This histogram geometry indicates the presence of sand components that are more poorly sorted than those of HP Groups A-C and multiple silt components of possibly near equal volumes. Because the connection between sand- and silt-sizes is so poorly defined, a truncation separation as used in HP Group C is not justified. The results of a ROKE analysis used to identify three hypothesized, log-normal components are shown in Figure 10. The ROKE-identified sand components are finer-grained and have larger standard deviations than do the sand populations in HP Groups A, B, and C. Only one HP HP Group E coarse-grain, silt population contains very fine-grained sand as do all the HP Group D coarse-grained silt populations, red outline box in Figure 10. Three of these HP Group E samples came from the silt-rich portion of Core 5 and one came from the Core 6, Figure 6A,B.
3.2.7. HP Group F
The two samples in HP Group F are unlike any of the other 55 samples collected from the six Barfield Bay vibracores. They contain primarily silt-size material. Their histogram geometries describe a prominent, very wide silt component that slopes downward into the sand-sizes. The results of a ROKE-analysis that searched for three constituent populations are presented in Figure 10. The two silt populations comprise 80 and 60 volume percent of these two samples. The four silt populations have mean grain-sizes and standard deviations similar to the silt populations in the other 57 samples. There is one very fine-sand/coarse silt population, magenta outlined box in Figure 10, identical to those present in HP Group D. These two samples are from the silt-rich portion of Core 5.
3.2.8. HP Groups D, E, and F-Summary
HP Groups D, E, and F contain 27.2±10.3, 42.3±5.9, and 75±7 volume percent silt, respectively. A ROKE analysis that searched the original sixteen (16) samples for three (3) log-normal components that could have been combined to produce the original sixteen distributions yielded 48 components, Figure 11. These components have a wide scatter on a bivariate plot of mean grain-size versus standard deviation, however Clusters 1, 2, and 3 are relatively small and well-defined, Figure 11. Cluster 1 has a cluster-averaged mean grain-size of 2.37±0.23 Phi and a standard deviation of 0.64±0.08 Phi units and, although dominated by HP HP Group D components, it also has one representative each from HP Groups E and F. Cluster 2 contains populations with very fine sand and coarse silt with a cluster-averaged mean grain-size of 3.97±0.16 Phi and a standard deviation of 1.13±0.13 Phi units and, again although dominated by HP Group D components, it also has one representative each from HP Groups E and F. Cluster 3 also contains populations with very fine sand and coarse silt with a cluster-averaged mean grain-size of 4.41±0.16 Phi and a standard deviation of 1.56±0.06 Phi units. The identification of log-normal components that contain very fine sand and coarse silt, Clusters 2 and 3, is an unexpected result of NOT separating sand and silt prior to grain-size analysis. Cluster 4 clearly shows a decreasing standard deviation with decreasing Phi grain-size in the fine to very fine silt size components, Figure 11.
3.2.9. Summary of GRANULO [1] and ROKE [2] Analyses
The GRANULO and ROKE computer programs have identified 163 individual log-normal populations within the 57 sediment samples collected from the cores that penetrated the Barfield Bay sediment-fill (Cores 3, 4, and 5) and the shoreline margins of the surrounding terrestrial aeolian dunes (Cores 2, 6, and 7). These 163 log-normal populations have been grouped into seven (7) clusters with similar means and standard deviations, Figure 12A. The sand and the silt clusters are to be expected, however, the identification of log-normal components containing both very fine sand and coarse silt (Clusters 4A and 4B) are the result of not separating sand from silt prior to grain-size analysis. The cluster-averaged means and standard deviations, and the number of populations are shown in Figure 12B.
3.3.10. Interpretation of Granulometry and Sediment Source
3.31 Granulometry. The concept that a deposit of individual grains that were independently moving in dynamic equilibrium with their energizing fluid, water or air, will, after deposition, have a log-normal distribution of grain-sizes, characterized only by a mean and standard deviation, is clearly supported by statistical moment measures of the sand samples in HP Group A and the sand component of HP Group B in which its silt component is an entirely separate population. Using the ROKE program to decompose the polymodal volume percent frequency curves has resulted in the identification of 163 separate log-normal populations in the fifty-seven (57) analyzed samples. Each of these log-normal populations represent a depositional situation in which the constituent grains were in equilibrium with the energizing fluid. This should result in the creation of a single depositional layer of a thickness related to the duration of the deposition and the effects of subsequent modification. Unfortunately, the Barfield Bay sediment-fill has been so thoroughly bioturbated (see Figure 5) that any original stratification has been destroyed subsequent to deposition with the exception of two mollusk-shell-rich tempestites, Tp1(Core 5) and Tp2 (Core 4) and a granular peat at the base of Core 3, Figure 6A. Clusters of similar mean grain-size and standard deviation indicate the repetition of similar hydrodynamic/aerodynamic conditions of energy, grain-size, and mineralogy, but NOT necessarily a particular depositional environment. That is very clearly demonstrated in the occurrence of log-normal populations of HP Groups A, B, and C in both terrestrial aeolian dune and subtidal deposits, Figure 6A,B.
Log-normal populations in Cluster 1 (Figure 12A,B) have the coarsest mean grain-sizes and the smallest standard deviations. These log-normal populations come from samples located in the terrestrial aeolian dunes (Cores 2, 6, and 7) and Core 5 located in the main flood-tidal channel into Barfield Bay from present-day Caxambas Pass, Figure 2. It is reasonable to expect that these two environments should experience the highest and most consistent energy levels and thus contain resulting deposits with the coarsest sand grains available and most uniform in texture. Log-normal populations in Cluster 2 (Figure 12A,B) have mean grain-sizes 18% smaller and standard deviations 15% larger than those of Cluster 1, an indication that they were deposited at energy levels lower and less consistent than Cluster 1. These Cluster 2 log-normal populations come, with two exceptions, from HP Group D found in the more silt-rich portion of Core 3 which is located on the southern margin of the Southeast Basin (SEB in Figure 2).
It is of considerable interest that log-normal populations containing both very-fine sand and coarse silt (Clusters 4A and 4B, Figure 12A) have been identified in the silt-rich samples from Cores 5 and 3; both are on the margins of the Northwest and Southeast Basins, respectively, Figure 2. Furthermore, these log-normal populations consisting of very fine sand and coarse silt emphasize that there is no physical boundary between sand and silt at a grain-size of 4 Phi but only a man-made one. Currents of low energy and consistency are hypothesized to be responsible for their deposition. Sedimentary structures are the critical missing factor in interpreting the origin of these deposits.
Interpreting the deposition of the medium and fine silt clusters (5 and 6, Figure 12A,B) is also greatly limited by the absence of sedimentary structures and/or bedding. These two clusters occur in locations of the highest and most consistent energy levels, those of HP Groups B and C. It is possible they represent 1) secondary grainfall deposition on terrestrial aeolian avalanche faces and 2) deposition during the slack periods of tidal flow producing flaser bedding, depending on the specific high energy environment.
3.32 Sediment Source. There are no rivers supplying siliciclastic sand, silt, or clay to this part of southwest Florida and thus the adjacent and underlying Pleistocene, siliciclastic, coastal deposits are the geographically and geologically most reasonable candidates to supply the sediment contained within the late Pleistocene terrestrial aeolian dunes (Indian Hill and the Barfield Bay Parabolic), the early Holocene Horrs Island transverse dune, and the Holocene subtidal deposits that fill Barfield Bay. The occurrence of the predominant quartz-sand log-normal components comprising Cluster 1 (Figure 12A,B) in both the terrestrial aeolian dunes and the Holocene subtidal deposits of Barfield Bay suggest 1) that a common source has been “reworked” and 2) that these products experienced a relatively short transport path to their Holocene depositional location with the most reasonable such path being the adjacent nearshore shelf.
A microscopic inspection of five (5) silt samples from Core 4 has identified the following items: 1) granules of silt-size, carbonate particles; 2) quartz silt; 3) biogenic silica, including possible sponge spicules and diatom frustules; and 4) organic matter. The silt-size carbonate particles may well be from the bioerosion of larger skeletal fragments [14]. The total grain-size range for the silt present in the Barfield Bay sediment-fill is 5-7 Phi. This is one of the three size-ranges of carbonate silt resulting from the mechanical fragmentation of mollusk shells on the West Florida Shelf [13]. Five silt samples from Barfield Bay Core 4 have weight percent carbonate values from 45-73%. Geochemical data [15] indicate that Saharan dust is a recognizable, and possibly significant, component of the siliciclastic, dust-size particles (fine silt) found in soils and nearshore sediments of south Florida.
4. Barfield Bay Mollusk Populations
4.1. Introduction
The Holocene subtidal fill of Barfield Bay consists of mollusk-shell-bearing, silty, quartz-sand. All three cores (Figure 2 for locations) taken within Barfield Bay and Core 1, located in the adjacent Caxambas Pass, contained mollusk shells. Crassostrea virginica clusters occur on the intertidal, prop roots of the red mangroves (Rhizophora mangle) that surround Barfield Bay and are present on various intertidal shoals within the bay. These are the most probable sources of the oyster shells in the uppermost 1-1.5 meters of Cores 4 and 5 that are within the bay and Cores 2, 6, and 7 located on the intertidal margins of the surrounding terrestrial aeolian dunes, Figure 2. The core images in Figure 5 are representative of the bioturbation that comprises the vast majority of Cores 1, 3, 4, and 5 with the mollusk shells being dispersed in a silty, quartz-sand matrix. The two major exceptions to the ubiquitous bioturbated texture are 5-7 cm-thick layers in Cores 4 and 5 labeled Tp1 and Tp (Figure 6A) in which the constituent shells touch one another, and the silty, quartz-sand matrix is minimal. These layers are interpreted to be tempestites and are the result of in situ storm winnowing followed by possible transport a short distance across the floor of Barfield Bay and subsequent deposition. The mollusks and benthic foraminifera identified in this study are used to estimate the salinity conditions during the deposition of the Barfield Bay sediment-fill.
4.2. Methods
A vibracore device with a 7-cm diameter barrel was used in this study. Therefore, only shells smaller than 7-centimeters could be retrieved for identification. However, the upper size-limit of most shells recovered was no more than 3cm and thus this population of “smaller” mollusks is probably a reasonable representation of the actual mollusk population. Fifteen cubic-centimeter portions of each of the twenty-one (21), 5-10-centimeter-long samples taken from Cores 3, 4, and 5 and the fourteen (14) samples taken from Core 1 were processed for mollusk shell and benthic foraminifera examination, Figure 13 for sample locations within each core. Processing included washing through nested sieves, the openings of the finest sieve being 64 microns, to remove the mud sediment fraction. The sieve fraction larger than one millimeter (or 0.6 millimeter in some cases) was reserved for mollusk analysis and the material from sieve interval 64 microns to less than 1 mm was dried and analyzed for benthic foraminifera. A modified Otto microsplitter was used to achieve a desired sample size of about 300 foraminifers. Diversity [27,28] and Evenness [28,29,30] indices were determined for the mollusk populations of Barfield Bay (Cores 3, 4, and 5) and the Caxambas Pass Core 1. Critical Mollusks, those most indicative of paleosalinity, were identified based on occurrence in both the three cores (3, 4, and 5) and the 21 samples as well as the stratigraphic distribution within the three cores. The salinity ranges of these Critical Mollusks in southwest Florida [31,32] were used to construct a diagram of overlapping ranges to determine the minimum possible salinity range common to all of the Critical Mollusks. A similar process was used to estimate the long-term salinity in the Caxambas Pass Core 1.
4.3. Results
4.3.1. Mollusk Identifications and Abundances
The authors Ronald Echols and Michael Savarese identified the mollusk and foraminifera specimens. The total number of mollusk shells identified in the 21 samples of the bioturbated sediment-fill in the three Barfield Bay cores is 686 and 388 in the tempestite sample for a total of 1074. An additional 144 shells were identified in the 14 samples from the Caxambas Pass Core 1. The number of species identified within Barfield Bay is sixty-three (63); thirty-eight (38) species were found in the Caxambas Pass Core 1. The mollusk identifications from Barfield Bay Cores 3, 4, and 5 are in Figure A1, Figure A2 and Figure A3, respectively, and those from the Caxambas Pass Core 1 are presented in Figure A4.
Only nineteen (19) Crassostrea virginica shell fragments (out of 1101 individual shells) were identified in the 15-cubic centimeter samples from the three cores that penetrated the subtidal sediment-fill of Barfield Bay. However, more oyster shells were identified during the inspection of the recently sliced core and are shown by the Crassostrea virginica symbol in Figure 13. This situation argues that the 15-cubic centimeter sampling strategy may well have reduced access to the actual oyster population.
4.3.2. Mollusk Species Diversity and Evenness
Species Diversity is a function of the number of species or richness (S) and the evenness of the number of individuals in each species. The identification of 63 species present in the 21 samples from the Barfield Bay sediment-fill is a strong indication of a rich, diverse, molluscan fauna. The Shannon Diversity H [27] of 3.27 (Hmax of 4.16) and the Simpson Diversity D [28] of 0.075 (0-1.0 range, maximum diversity = 0.0) indicate a relatively high degree of diversity. However, the relative abundances of these species produce a markedly uneven distribution, Panel A in Figure 14. Equal abundance or maximum evenness of species would produce a set of equal-length bars with a value of 1.56% of total individuals per species (the dashed line in Panel A, Figure 14A).
The Simpson Equitability or Evenness SEQ [28] of 0.21 (range of 0 to 1 with 1= maximum evenness) indicates a high degree of unevenness or the dominance of a few species, which is clearly suggested by an examination of the black bars in Panel A, Figure 14. The Polieu (1966) J [29] index (equivalent to the Shannon Equitability Index) is 0.78 (1=maximum evenness) is numerically much larger than the Simpson SEQ [28] of 0.21, however, both H and SEI/J are sensitive to species richness and this Barfield Bay, mollusk population has 63 species. Twenty-eight (28) pelecypod and 36 gastropod species (1 to 1.3 ratio) have been identified in this Barfield Bay mollusk population. Thus, the 686 mollusk-shells identified in the 21 samples of the Disperse-shell Facies of the Holocene, Barfield Bay sediment-fill come from a rich (S=63), diverse (D=0.21, H=3.23), and markedly uneven (SEQ=0.21) population that is dominated by the two pelecypods, Parastarte triquetra and Anomalocardia cuneimeris, with 154 and 61 identified individuals, respectively, out of 686 identified individuals.
The long “tail” of the distribution in Panel A of Figure 14 indicates that many species are represented by very few individuals; twenty of these 63 species are represented by 1 individual and seven by 2 individuals. Thus, 27 of the 63 species contain 42 individuals or 6% of the 686 total. A distribution of 38 species with three or more individuals (total of 679) is shown in Panel B of Figure 14. This 3-or-more “cut-off” permits each remaining species the ability to occur in all three Barfield Bay cores. It has essentially the same overall shape, minus the elongate tail, as well as very similar Diversity and Evenness indices as does the Panel A distribution.
Only eleven (11) of the 36 species with three or more individuals (Panel B, Figure 14) that could occur in all three cores actually do occur in all three cores. The bivalve Anomalocardia cuneimeris, the second most abundant species with 61 identified individuals, does NOT occur in all three cores. Furthermore, of these eleven species that occur in all three cores only seven (7) have numbers of individuals equal to or greater than 21 so that they could occur in all 21 samples, Panel C in Figure 14A. The ecologic characteristics, especially salinity, of these seven Critical Mollusk Species should characterize the ecologic conditions that existed in Barfield Bay during the nearly 7000-year-long deposition of its sediment-fill. Images of individuals of the seven Critical Mollusk Species are shown in Figure 14B.
The stratigraphic and geographic distributions of the seven Critical Mollusk species and the six “extra” Salinity Mollusk species, that are relatively abundant and have modern salinity data [30,31], over the twenty-one (21) samples of the Barfield Bay bioturbated sediment-fill are shown in Figure 15. The bivalve Parastarte triquetra is present in 81%, the gastropod Houbricka incisa in 71%, the gastropod Acteocina canaliculata in 67%, and the bivalve Cardites floridanus in 58% of the twenty-one (21) samples. The seven Critical Mollusks are present in only 81 (55%) of 147 possible “locations” (7 species times 21 samples), furthermore, only 8 (10%) of the 81 filled locations contain double digit numbers of individuals. There is considerable variability in the stratigraphic and geographic distributions of the Barfield Bay mollusk populations. Even though the abundances of Anomalocardia cuneimeris (B), Phrontis vibex (G), and Abra aequalis (B) are 61, 32, and 31, respectively, each does not occur in all three Bayfield Bay cores and thus cannot be considered a Critical Mollusk, Figure 15.
4.4. Barfield Bay Tempestites
The mollusk population data for tempestite Tp1 (Core 5) are found in Figure 16. Tempestite Tp1 contains 388 individual shells which is equal to 54% of the 686 individuals identified in the 21 samples of the bioturbated sediment-fill from the three Barfield Bay cores. Forty-one (41) mollusk species have been identified in these 388 shells. The constituent shells of tempestite Tp1 are basically touching each other and are oriented in various directions with vertical being common; there is little silty-sand matrix, Figure 16, Panel A. The mollusk population of Tp1 is moderately diverse (D [27] of 0.32, Dmax of 0.0625) and markedly uneven (SEQ [27] of 0.22, max evenness = 1). This shell population is very much dominated by four of the 16 species, Panel C of Figure 16. The evenness indices SEQ and J have values of 0.22 and 0.56, respectively, with a range of 0-1 with 1 being maximum evenness. Anomalocardia cuneimeris and Parastarte triquetra are the two most abundant species with 173 and 121 individuals, respectively, and together comprise 76% of the total individuals, Figure 16, Panel C. It should be emphasized that this 7-cm-thick mass of shells is the best-defined layer in the entire bioturbated sediment-fill of Barfield Bay.
Tp1 clearly shows an expected modification of the bioturbated sediment-fill after experiencing a high-energy event of unknown duration. The pelecypods Anomalocardia cuneimeris and Parastarte triquetra are the most abundant members which is to be expected given that they are the most abundant species in the 21 samples of the Barfield Bay bioturbated sediment-fill. Furthermore, their predominant occurrence in Tp1 can be an argument that the bioturbated sediment-fill is the most likely source material and not some material external to Barfield Bay that was introduced through Caxambas Pass during a storm.
4.5. Caxambas Pass Core 1
The Holocene, nearshore-marine deposits of the Caxambas Pass shoal are immediately south of Barfield Bay, Figure 1 and Figure 2. Today Caxambas Pass forms the northern margin of the extensive, intertidal, mangrove swamp of Kice, Morgan, and Cape Romano Islands, Figure 1. However, prior to the formation of the Kice and Morgan barriers, now completely eroded away, the southern entrance into Barfield Bay faced the open Gulf of Mexico. The sediments in Core 1 were deposited initially on a shoreface open to the Gulf of Mexico and then, after the deposition of the Kice, Morgan, and Cape Romano barriers, open to the northern portion of Gullivan Bay. The stratigraphic position of the boundary between these two potentially different types of deposits was not identified.
4.5.1. Mollusk Species Diversity and Evenness
The identification of 38 species present in the 14 samples is a good indication of a rich, diverse, molluscan fauna. However, the relative abundances of these species produce a markedly uneven distribution, Panel A, Figure 17. Equal abundance or maximum evenness of species would produce a set of equal-length bars indicating a value of 2.7% of total individuals per species, the dashed line in Panel A, Figure 17. The Shannon Diversity H [27] of 3.132 (Hmax of 3.64) and the Simpson Diversity D [28] of 0.063 (0-1.0 range, maximum diversity = 0.0) indicate a relatively high degree of diversity.
The Simpson Equitability [28] SEQ of 0.42 (range of 0 to 1 with 1= maximum evenness) indicates a moderate degree of unevenness or the dominance of a few species, which is clearly suggested by an examination of the black bars in Panel D, Figure 17. The J [29] index (equivalent to the Shannon Equitability Index) is 0.86 (1=maximum evenness) which is twice the Simpson (1949) and indicates a high degree of evenness. However, both Shannon [27] indices, H and SEI/J, are sensitive to species richness and this Caxambas Pass, flood-tidal delta, mollusk population has 38 species which apparently is sufficient to inflate this evenness index. The observation that the 13 most abundant species account for 76% (Panel A, Figure 17) of the 144 individual mollusks identified in these samples further indicates the uneven character of this mollusk population. Twenty-two (22) pelecypod and 16 gastropod species (1.4 to 1 ratio) have been identified in this mollusk population. Thus, the 144 mollusk-shells identified in the 14 samples of Core 1 describe a rich (S=38), diverse (D=0.063, H=3.132), and moderately uneven (SEQ=0.46) population that is dominated by the two pelecypods Nucula proxima and Chione elevata and the gastropod Acteocina canaliculata, Panel A, Figure 17.
4.5.2. Comparison of the Barfield Bay and Caxambas Pass Shoal Mollusk Populations
Ten or 26% of the species present in Core 1 are not found in any of the three Barfield Bay cores with the two numerically significant missing species being the bivalves Tellina versacolor and Parviculina crenella, Panel B in Figure 17. Fourteen (14) or 39% of the Barfield Bay species, with at least 3 individuals, are not found in Core 1, Panel C in Figure 17. Nine of the 38 Core 1 species are present in all three Barfield Bay cores, 12 are found in two Barfield Bay cores, and seven are found in one Barfield Bay core, Figure A4. Acteocina canaliculata (G), Chione elevata (B), Abra aequalis (B), and Phrontis vibex (G) are relatively numerous in both populations. However, Parastarte triquetra and Anomalocardia cuneimeris, the two most abundant species in the Barfield Bay mollusk population, occur as only one (0.07%) and four (2.8%) individuals, respectively, in the 144 shells identified in the Core 1 mollusk population, Figure A5. Nucula proxima, the most abundant mollusk in the Caxambas Pass population, occurs as 21 individuals or 14.5% of the 144 identified individuals in the Core 1 mollusk population. It occurs as eleven (11) individuals or 1.5% of 686 identified individuals in the Barfield Bay mollusk population. These two mollusk populations that are geographically juxtaposed can only be considered to be similar.
4.6. Mollusk Species as Salinity Indicators
4.61 Barfield Bay Salinity. The more abundant and widely distributed mollusk species identified in the bioturbated sediment-fill can serve as indicators of the ancient salinity in Barfield Bay. Present-day salinity data [30,31], collected in south Florida, for twelve (12) of these more abundant species are presented in Panel A of Figure 18A. Six (6) of these twelve species are from the seven (7) Critical Mollusks, three (3) are from the HP Group that is present in all three cores, and three are from the HP Group of fourteen (14) most abundant. Abra aequalis, Houbricka incisa, Phrontis vibex, and Transennella conradina are the most stenohaline mollusks in this set of 12 with mean values of 28-29 psu and 1 standard deviation values of 3-4 psu. Acteocina canaliculata, Anomalocardia cuneimeris, Brachiodontes exustus, Olivella pusilla, and Parastarte triquetra are the more euryhaline mollusks in this set of 12 and have mean values of 18-30 psu and 1 standard deviation values of 9-11 psu. Cardites floridanus, Chione elevata, and Cerithium muscarum comprise a set with salinity characteristics intermediate between the more steno- and euryhaline sets. All the salinity ranges of the mollusks in this set of twelve overlap in the 25-32 psu interval, the upper part of the polyhaline and the lower part of the euryhaline divisions, Figure 18A, Panel A. The stratigraphic ranges in the three Barfield Bay cores of six of the seven Critical Mollusks and the salinity-critical mollusks suggest that the salinity range of 25-32 psu has characterized the entire period of deposition of the sediment-fill, Figure 15. The stenohaline Houbricka incisa occurs in 71% of the 21 Barfield Bay samples. The stenohaline Phrontis vibex occurs throughout Cores 3 and 5 and the stenohaline Abra aequalis occurs throughout Core 4, Figure 15. Because the stenohaline Transennella conradina occurs in only 5, widely scattered samples, it provides only minimal stratigraphic support, Figure 15. The widespread stratigraphic occurrence of these three stenohaline species over the entire Holocene sediment-fill of Barfield Bay makes a compelling argument that the long-term salinity range was indeed 25-32 psu.
The stratigraphic distributions of the five salinity-critical mollusks in the Caxambas Pass Core 1 are more discontinuous than those in the Barfield Bay cores, Figure 18B. The stenohaline Abra aequalis occurs in 7 (50%) of the 14 samples and is distributed over the entire 7-meter thickness. In addition, the stenohaline Phrontis vibex occurs in 5 (38%) samples with a concentration in the lower-most three samples, Figure 18B. This stenohaline coverage, in addition with the low-range euryhaline Chione elevata, supports the interpretation that the 25-32 psu salinity estimate has characterized this area throughout the deposition of this shoreface/shoal feature. Thus, the mollusk-based, salinity range of 25-32 psu has characterized both Barfield Bay and the Caxambas Pass flood-tidal delta during the deposition of some 7-meters of Holocene sediment.
The present-day salinity ranges of the six Critical Mollusks and the six, abundant Salinity Critical Mollusks in combination with their stratigraphic ranges throughout the 7-meters of Barfield Bay and Caxambas Pass cores indicate a long-term salinity range of 25-32 psu during the deposition of the 7-meters of silty, quartz-sand sediment. This upper polyhaline to lower euhaline salinity range instead of a euhaline range may be somewhat unexpected. Barfield Bay and the Caxambas Pass flood-tidal delta are only 3 kilometers away from the open Gulf of Mexico, some 10 kilometers away from the Florida mainland, have a tidal range of 0.9 meters, and there are no rivers that drain into this region.
4.7. Barfield Bay Critical Mollusks in Relation to Silt Content
The distribution of individuals of the seven Critical Mollusk Species identified in the Barfield Bay mollusk population among the 5 established volume percent silt classes was analyzed to determine if specific mollusk species occur more frequently in muddy substrates. The number of specific volume percent silt classes identified in the three Barfield Bay cores ranges from 1 to 10, the “samples” in Panel A of Figure 19. This variability was accounted for by dividing the total number of individuals in a specific volume percent silt class by the number of that volume percent classes, the column labeled “samples” in Panel A of Figure 19, identified in the 21 mollusk samples. This correction allowed for the identification of mollusk species preference for a specific volume percent silt class. Percentages are used in Panel B of Figure 19 to account for differences in the magnitudes of individuals among the various species.
Four of the seven Critical Mollusk Species, with the exceptions of Parastarte triquetra, Cardites floridanus, and Anomia simplex, “prefer” the <15 Volume % silt class. Anomia simplex is the only species that “prefers” the >60 Volume % silt class. All seven Critical Mollusk Species have a secondary mode scattered in the 15-29, 30-44, and 45-60 Volume % silt classes. The >60 Volume % silt class contains the lowest percentages of the seven Critical Mollusk species, with the exception of Anomia simplex. As long as the volume % silt is below 60%, volume % silt appears to not be a major factor in the occurrence of the seven Critical Mollusks. The Individuals per Silt Class column indicates that the largest concentration of Critical Mollusks will be in the <15 Volume percent silt class.
4.8. Barfield Bay Mollusk Data and Other Regional Studies
The three “classic” studies of the molluscan fauna in the Barfield Bay region of southwest Florida [11, 32, and 33] concentrated on the nearby Ten Thousand Islands. Their mollusks were collected from specific environments such as the open ocean shoreface, a restricted lagoon, and a tidal marsh, just to name the three major environments. Scholl [32] and Parkinson [33] used bottom grab samples and reported 32 and 14 species, respectively, and collected no or limited, semi-qualitative abundance data. Shier [11] collected mollusks from cores and reported 14 species and no abundance data. A summary of their results compared with the seven Critical Mollusks and the 12 salinity-critical mollusk HP Groups identified in this Barfield Bay study is presented in Figure A6. There is some agreement overall with the results of the present Barfield Bay study in that seven of the twelve salinity-critical mollusks identified in this study were placed in the open ocean environment of these previous studies. Only 3 of the seven Barfield Bay Critical Mollusks (Cardites floridanus, Chione elevata, and Transennella conradina) were identified in these three “classic” studies. However, there are three, possibly significant, differences: 1) Shier [11] has Cardites floridanus present in a back-reef lagoon, which is the Parkinson [33] Chain of Bays, 2) Scholl [32] has Transennella conradina in the Ten Thousand Islands proper instead of our open ocean shoreface prediction based the recent, southwest Florida salinity data [31], and 3) Acteocina canaliculata, Houbricka incisa, and Parastarte triquetra are not identified in any of these three “classic” studies, however, Parkinson [33] mentions in his text that Parastarte triquetra is “ubiquitous” in most, if not all, of his samples.
The most directly comparable study [34] used vibracores to sample the Holocene deposits ranging from the northern margin of Gullivan Bay landward to the coastal marsh adjacent to the southwest Florida “mainland”. The core 0706-19 [34] is located at the mouth of Fakahatchee Bay approximately 11 km southeast of Barfield Bay, Panel C in Figure 19. The fossiliferous packstone facies is the most distal facies that is encountered in core 0706-19 [34] which could be considered comparable to the environment of Barfield Bay. Mollusks identified, along with their abundances, in the two samples of this “distal” facies are presented in Figure A7. Two of the seven (7) Bayfield Bay Critical Mollusks and seven of the twelve (12) salinity-critical mollusks are present in the fossiliferous packstone facies of this core. These seven common species indicate that the paleo-salinity of the subtidal region during deposition of the Core 0706-19 fossiliferous packstone was essentially equal to that of Barfield Bay during the deposition of its siliciclastic sediment-fill.
5. Benthic Foraminifera Identification and Distribution
Benthic foraminifera species and genera were identified and counted in 47 samples of the dispersed-shell lithofacies in Barfield Bay Cores 3, 4, and 5 and Caxambas Pass Core 1. These counts were then summed by genus so that Poag’s synthesis of generic predominance facies for the modern Gulf of Mexico [35] could be applied to interpret Holocene environments of the sediment fill of Barfield Bay. A predominant genus is “…a genus in a given sample that is represented by the most abundant specimens” [35]. “A generic predominance facies is a benthic foraminifera assemblage characterized by a particular predominant genus” [35].
Three predominant genera are represented in the benthic foraminifera assemblages in the Barfield Bay and Caxambas Pass core samples. Two of these are the hyaline taxa Ammonia spp. and Elphidium spp., and the third is the miliolids. Poag [35] combined all miliolids into a Miliolid Predominance Facies because, in his words, “(1) miliolid genera are difficult to separate consistently and (2) low latitude miliolids seem to have generally similar environmental requirements” [35]. The sum of these three predominant genera comprises 95% to 100% of the foraminifera in all Barfield Bay samples studied here.
Elphidium spp. dominates the entire thickness of the bioturbated sediment-fill in Cores 5 and 3, Figure 13. It is the most abundant genus throughout the lower 4 meters of Core 4, and it is second to Ammonia spp. in abundance throughout Core 1, Figure 13. Ammonia spp. is second in overall abundance and is the most abundant benthic foraminifer in the upper meter of Core 4, Figure 13. Miliolids are the least abundant benthic foraminifers present in the Barfield Bay samples; they comprise 40-50% of the basal meter in Cores 5 and 4 and 10-20% of the basal meter in Cores 3 and 1, Figure 13.
Because of the close proximity of Barfield Bay to their study area, the benthic foraminifera study of Benda and Puri [36] is a useful modern analog for interpreting Holocene environments of Barfield Bay. These authors analyzed benthic foraminifera species (and ostracods which are not reviewed here) at 116 stations arrayed across coast-parallel environments from marsh river, lagoon, and mangrove islands in the Ten Thousand Islands area and from environments offshore of the mangrove islands in Gullivan Bay. The predominant genera in their data [36] are the same as for the Barfield Bay core samples, namely, Ammonia spp., Elphidium spp., and miliolids. The generic percentages in the 116 bottom samples [36], contoured at 10, 30, 50, and 70 percentage values, are shown in genus-specific panels in Figure 20. The Ammonia spp. distribution consists of a coastal, or proximal, high-concentration band and a miliolids distribution of a more open Gulf, or distal, high-concentration band, Panels A and C of Figure 20. Elphidium spp. has a much more complicated distribution with “pockets” of extremely high values, in both coastal and offshore locations, interspersed in a more blanket-like distribution of values in the 20-40% range, Figure 20.
The primary tidal opening into Barfield Bay lies near the middle of the Elphidium spp. blanket [37] and on the gulfward boundary of the Ammonia spp. band, therefore, Elphidium spp. and Ammonia spp. should be and are the two prominent components of the benthic foraminifera population in the three Barfield Bay cores as well as in the Caxambas Pass core, Figure 13. In addition, Ammonia spp. is enriched in the uppermost 1-1.5 meters of the three Barfield Bay Cores and the Caxambas Pass Core, Figure 13. Miliolids, however, are present primarily in the basal 1-1.5 meters of the three Barfield Bay Cores as well as in the Caxambas Pass Core, Figure 10. A possible explanation for this miliolid restriction to the oldest portions of these cores is that deposition of the adjacent Kice, Morgan, and Cape Romano barrier islands as well as the mangrove-covered islands immediately south of Barfield Bay (shown in gray in Figure 20) greatly reduced access to the open Gulf of Mexico. In summary, the benthic foraminifera population of Barfield Bay, dominated by Elphidium spp. and, to a lesser extent, Ammonia spp., is consistent with the overall benthic foraminifera distributions identified in the Benda and Puri [36] data.
6. Summary of Mollusk and Benthic Foraminifera Content of the Barfield Bay Bioturbated Sediment-fill
The mollusks (smaller than the 7cm diameter of the vibracore barrel) identified in this study comprise 686 individuals organized into 63 species. The two dominant species in the bioturbated sediment-fill, in terms of total individuals, are the bivalves Parastarte triquetra and Anomalocardia cuneimeris. The tempestite Tp1 sample contains 388 individuals. This tempestite deposit can be considered a taphocoenosis derived from a thanatocoenosis by a storm event.
Species diversity of the mollusks in the Barfield Bay bioturbated sediment-fill, as indicated by the Shannon Diversity Index H=3.227 (Hmax =4.16) [27] and the Simpson Concentration Index D=0.075 [28] (possible range of 0-1 with 0 being more diverse), is high. However, these two diversity indices are known to over emphasize species richness (S=63) at the expense of species abundance. The degree of evenness of individuals per species is indicated by the Shannon Evenness Index SEI/J=0.78 (range of 0-1) [27] which indicates a fairly high degree of evenness and the Simpson Equitability Index SEQ=0.21 [28] which indicates a low degree of evenness and the dominance of a few species. An inspection of the actual distribution of percentages of total individuals per species, Panels A and B in Figure 14A, clearly shows a highly skewed distribution that is dominated by 14 species out of the total 63. The mollusk population of the bioturbated sediment-fill is very uneven with forty-three (43) of the sixty-three (63) species containing only 109 individuals out of the total 686 or 15%. Stated another way, one-third (33%) of the identified species contain 85% of the individuals. Thus, the smaller (<7cm) mollusk population of Barfield Bay is characterized as being rich in number of species (S=63) and is dominated by a relatively few species with the two pelecypods, Parastarte triquetra and Anomalocardia cuneimeris, being the most prominent. Twelve (12) of the fourteen (14) most abundant species occur in all three Barfield Bay cores and seven of these twelve are represented by numbers greater than 21 so that they potentially can occur in all 21 mollusk samples. These seven Critical Mollusks, along with their respective percentage occurrence in the 21 samples, are Parastarte triquetra (81%), Houbricka incisa (71%), Acteocina canaliculata (67%), Cardites floridanus (57%), Chione elevata (48%), Anomia simplex (43%), and Transennella conradina (19%).
The twelve most abundant mollusks present in the bioturbated sediment-fill have been used to estimate the paleo-salinity during the deposition of the Barfield Bay sediment-fill. The present-day salinity ranges for these 12 mollusks [30,31] overlap in the range 25-32 psu, which is the upper half of the polyhaline to the lower 2 psu units of the euhaline zone, Figure 18A. This 7 psu range is basically the range of the four, most stenohaline, mollusks in this HP Group of 12. Because members of this more abundant HP Group occur throughout the entire 7-meter-thick stratigraphic section (Figure 11A), this paleo-salinity regime most likely characterized Barfield Bay during the deposition of the entire sediment-fill.
The number of species (63) identified in this Barfield Bay study is much greater than the number of species identified in studies of the nearby Ten Thousand Islands, both from bottom grab samples [32,33] and cores [11,34]. However, many of the 12 salinity-critical species of this Barfield Bay study are identified in samples of the open shoreface and proximal inner shelf depositional environments of the Ten Thousand Islands studies [11, 32, 33, and 34].
All twenty-one (21) Barfield Bay mollusk samples have a minimum of 5% volume silt. Five of the seven Critical Mollusk Species, with the exceptions of Cardites floridanus and Anomia simplex, “prefer” the >15 Volume % silt class. Anomia simplex is the only species that “prefers” the >60 Volume % silt class. All seven Critical Mollusk Species have a secondary mode in the 30-44 and 45-60 Volume % silt classes. As long as the volume % silt is below 60%, volume % silt appears not to be a major factor in the occurrence of the seven Critical Mollusks.
The identification of 38 species in the 14 samples of Core 1 in the Caxambas Pass flood-tidal delta is a good indication of a rich, diverse, molluscan fauna. However, the relative abundances of these species produce a markedly uneven distribution. The Shannon Diversity H [27] of 3.132 (Hmax of 3.64) and the Simpson Diversity D [28] of 0.063 (0-1.0 range, maximum diversity = 0.0) indicate a relatively high degree of diversity. The Simpson Equitability [28] SEQ of 0.42 (range of 0 to 1 with 1= maximum evenness) indicates a moderate degree of unevenness or the dominance of a few species. The J [29] index (equivalent to the Shannon Equitability Index) is 0.86 (1=maximum evenness) which is twice the Simpson [28] and indicates a high degree of evenness. However, both Shannon [27] indices, H and SEI/J, are sensitive to species richness and this Core 1 mollusk population has 38 species which apparently is sufficient to inflate this evenness index. Nucula proxima (B), Chione elevata (B), Acteocina canaliculata (G), Abra aequalis (B), and Phrontis vibex (G) are the dominant mollusks. However, Parastarte triquetra and Anomalocardia cuneimeris, the two most abundant species in the Barfield Bay mollusk population, occur as only one (0.07%) and four (2.8%) individuals, respectively, in the 144 shells identified in the Core 1 mollusk population. The Caxambas Pass Core 1 and the Barfield Bay mollusk populations, geographically juxtaposed and with the same long-term salinity as well as overall silt content, can only be considered to be similar.
The benthic foraminifera population of the Holocene, Barfield Bay sediment-fill is dominated by Elphidium spp. with a secondary Ammonia spp. component, Figure 13. These two foraminifers are the main constituents of the adjacent Gullivan Bay shallow, nearshore region to the southeast [36]. Miliolids, the most gulfward, benthic foraminifera [36] are a significant component of the basal 1-1.5 m of Cores 3 and 5. The Caxambas Pass, flood-tidal delta Core 1 has a much more equal ratio of Elphidium spp. and Ammonia spp. throughout its 7-meter length with a slight occurrence of miliolids in the basal meter. The lack of a larger miliolid component, especially in the basal portion of in Core 1, is puzzling given that prior to the deposition of the Kice, Morgan, and Cape Romano barrier islands this location faced the open Gulf of Mexico.
7. Discussion and Interpretation of Mollusk Populations
The mollusk data collected in this study are interpreted to indicate an environment with a long-term salinity range of 25-32 psu. With the exception of the Crassostrea virginica shells, all mollusks identified in this study of the Barfield Bay, Holocene, sediment-fill are subtidal. No Crassostrea virginica clusters, or even portions of clusters small enough to fit into the 7-cm-diameter vibracore barrel, were identified. This argues that the oyster shells identified in this study can reasonably be considered clasts, originating from oysters encrusting the prop-roots of red mangrove (Rhizophora mangle) trees that covered the bay margins and/or nearby intertidal islets (as they do today), and were transported into the bay proper.
Sixty-three (63) mollusk species were identified in the 21 samples collected from the three Barfield Bay vibracores. This number of species indicates a species-rich and, by definition, diverse population with Shannon [27] and Simpson [28] diversity indices of H of 3.27 (Hmax of 4.16) and D of 0.075 (0-1.0 range, maximum diversity = 0.0), respectively. However, this mollusk population is very uneven with Polieu [29] (equivalent to the Shannon Equitability Index [27]) and Simpson [28] unevenness indices of J=0.78 (1=maximum evenness) and SEQ=0.21 (range of 0 to 1 with 1= maximum evenness), respectively. It is this unevenness that is the more interesting. Previous mollusk populations identified in this region [11,32,33,34] are only broadly similar to this one identified in the Barfield Bay sediment-fill. The bivalve Parastarte triquetra is the most abundant mollusk identified in the Barfield Bay population, however, its variability of occurrence in the twenty-one (21) mollusk samples is pronounced with a range of 0 to 30 individuals per sample, and it is represented in the fourteen (14) samples in the nearby Caxambas Pass Core 1 by a single individual. However, it is not identified in most other studies [11, 32, and 34]. It is mentioned in [33] as being ubiquitous and prominent in surface grab samples, but no quantification is provided. Anomalocardia cuneimeris, the second-most abundant mollusk in the Barfield Bay population, also has considerable variability in the twenty-one (21) mollusk samples with a 0 to 15 range in numbers per sample; furthermore, it is essentially the principal mollusk component of Tempestite Tp1. It likewise is present in the Caxambas Pass core (4 individuals) and in single-digit numbers in other studies [32, 33, and 34]. This pronounced variability suggests that none of the existing studies have adequately characterized the mollusk population, especially the variability of its constituent species, in the Barfield Bay/Ten Thousand Island region of southwest Florida. In addition, the “classic” indices of unevenness may not be useful in describing a population containing species that have geographically localized occurrences of numerous individuals.
The small “bump” in the Miliolid component of the benthic foraminifera population near the bases of the three Barfield Bay cores may be a subtle, possibly significant, sea level indicator. This “bump” is above the granular, terrestrial peat in Core 3, Figure 13. This Miliolid concentration may suggest that the flooding event at the top of the terrestrial peat at the base of Core 3 submerged the entrance to Barfield Bay to depths sufficient for easier access of the distal, offshore Miliolid benthic foraminifera.
8. Depositional Environment of the Holocene Sediment-fill of Barfield Bay
8.1. Methods and Results
Pervasive bioturbation has destroyed all clastic sedimentary structures within the silty, mollusk-shell-rich, quartz-sand that comprises the Barfield Bay sediment-fill. The handful of 5 cm-thick, bivalve-shell-rich, “massive” units possessing abrupt, planar to irregular contacts with the silty quartz-sand, interpreted to be tempestites, are the only units that show “layering”, Figure 16. Furthermore, the silt content-defined layering shown in the stratigraphic sections of Barfield Bay and Caxambas Pass cores, Figure 21, are essentially artefacts based on the placing of contacts halfway between adjacent sediment samples whose silt-content was determined by Mastersizer 2000 analysis. The “layering” in the Caxambas Pass Core 1 was determined by comparing images of Core 1 material with images of Barfield Bay core material of “known” silt-content. Radiocarbon dates were obtained on granular peat, plant debris, two disarticulated mollusk shells, and two articulated mollusk shells; all these dates were determined by accelerator mass spectrometry (AMS) and calibrated [37].
8.2. Discussion and Interpretation
Any interpretation of a depositional environment is based on 1) the geographic position of Barfield Bay adjacent to the Gulf of Mexico, 2) the geomorphic setting within the sheltering walls of the three terrestrial aeolian dunes, 3) the interpretation of original layering consisting of interbedded sand-rich and silt-rich units based on granulometric analysis, and 4) the subtidal nature of the mollusk population.
A 1995 aerial photograph clearly shows flood tidal channels entering Barfield Bay from both Caxambas Pass and the Blue Hill Creek region, Figure 22. The western Caxambas Pass channel leads to a prominent, flood-tidal delta complete with tidal flats, ebb-shields, and distributaries [38,39], area A, Figure 21. There are several, smaller eastern channels, now largely abandoned, which lead to the Southeast Basin area and the Core 3 location, Figure 21. There are two tidal channels in the northern part of Barfield Bay that connect to present-day Blue Hill Creek, Figure 22. The northernmost one, adjacent to the bay’s northern shoreline, is largely abandoned. The southern channel leads to a flood-tidal delta, area Bh, Figure 22.
There are only two sediment sources that could have supplied sand-size material for deposition in Barfield Bay: 1) rain and wave erosion of the surrounding aeolian dunes, and 2) wave erosion of the adjacent nearshore shelf with onshore transport [40] and subsequent flood-tide transport through the Caxambas Pass and Blue Hill Creek openings. The surrounding aeolian dunes probably contributed a bare minimum of sand, and that only to their adjacent, mangrove-covered, intertidal fringes, because 1) they are covered with grasses, shrubs, and trees and 2) the 2-5-kilometer fetch across Barfield Bay should produce only very small waves and only during extreme wind events. Thus, wave erosion of the nearshore shelf with subsequent flood-tide transport into Barfield Bay is the more reasonable scenario for producing sand-size sediment and transporting it into Barfield Bay.
The sediment present in the three Barfield Bay cores consists of shell-rich, quartz sand that contains carbonate and siliciclastic silt that varies between 10-70 volume percent. This sediment is devoid of sedimentary structures with the exception of rare, centimeter-scale, shell beds that contain little of the silty, quartz-sand matrix. Grain-size analysis indicates the presence of three, distinct, quartz-sand populations and two, distinct silt populations. These distinct grain-size populations strongly suggest that the initial depositional processes produced discrete layers of similar grain-size that subsequently have been homogenized by the pervasive and intensive bioturbation by in- and epifaunal organisms. Molluscan faunas, with the exception of rare occurrences of Crassostrea virginica, in the three Barfield Bay cores are all subtidal and indicate a long-term salinity regime of 28-32 psu. The vast majority of the sediments in these three cores most likely were deposited in a subtidal environment, some depth below MLW, by hydrodynamic processes of different energy levels. The only exception to the subtidal environment is the uppermost 30 or so centimeters of Core 5 which was deposited in the lower part of the present-day intertidal zone. The rare tempestite shell-rich layers (Tp units) represent subtidal deposition during geographically and temporally restricted, high-energy events such as storms.
We hypothesize that the sediment contained in Barfield Bay Cores 3, 4, and 5 was deposited in a flood-tidal delta that migrated to the north from the Caxambas Pass opening. A delta setting enables the episodic operation of hydrodynamic processes of different energy-levels in essentially the same location, highest energy levels for sand deposition, intermediate levels for silt deposition, and lowest levels for in- and epifaunal bioturbation. The silt-poor sediments in Core 4 represent the central and proximal portions of this delta; the silt-rich sediments in Cores 3 and 5 are the lateral and distal portions to the east and north, respectively. A flood-tidal delta migrating west from the Blue Hill Creek opening probably contributed sediment to the northern third of Barfield Bay, the distal portion of which may be represented in the silt-rich sediments of Core 5. Thus, Barfield Bay was filled by sediments deposited in flood-tidal deltas, the volumetrically more important one migrating north from the Caxambas Pass opening and the less important migrating west from the Blue Hill Creek opening, Figure 22.
The Holocene deposits of the mangrove fringe immediately adjacent to the surrounding aeolian dunes consist of silty, quartz sand, fibrous peat (mangrove), and discrete plant debris, Figure 6B. The amount of carbonate and siliciclastic silt is variable and ranges from <10 to <39 volume percent. The water/sediment contact in Core 7 is 50 cm below MLW, 10 or so cm above MLW in Core 6, and essentially at MLW in Core 2; yet all of these interfaces are covered in red mangroves, a situation which questions the interpretation that mangrove peats, by themselves, are a uniformly, reliable indicator of intertidal deposition. Furthermore, the position of the contact between aeolian dune sand and overlying, fibrous, mangrove peat is not uniform in these three cores. This contact is within several cms in Cores 7 and 6, but it is lower by at least a decimeter in Core 2, Figure 19. The underlying aeolian dune sand contains root casts that go down several meters, however, these casts all stop at the contact with the overlying fibrous peat. This contact is a disconformity and flooding surface combined. The predominant, quartz-sand, grain-size population is identical with the dominant grain-size population in the adjacent/underlying aeolian dune and suggests that the quartz sand present in these Holocene, relatively low-energy, mangrove-covered deposits came from the aeolian dunes and not from quartz-sand migrating into Barfield Bay via flood tidal-deltas. Crassostrea virginica shells are a major constituent of the uppermost decimeters of these three cores, Figure 6B. They were deposited from oysters which colonized the prop roots of the red mangroves that cover this peritidal [24] fringe.
9. Stratigraphy of the Barfield Bay Sediment-fill
9.1. Methods and Results
The very few stratigraphic surfaces exposed in the Barfield Bay vibracores consist of the following: 1) the boundaries of the shell-rich, silt-poor, tempestite beds (Figure 16), 2) the bounding surfaces of the allogenic, granular, peat layer near the base of Core 3 (Figure 21 and Figure 23) and, 3) the basal contacts of the mangrove-peat units in the three cores along the bay margins that penetrate the surrounding aeolian dunes (Figure 6B). The Miliolid-rich intervals near the bottoms of Cores 3, 4, and 5 (Figure 21) can be hypothesized to be a biostratigraphic abundance zone.
The most significant stratigraphic interval in the three vibracores taken within Barfield Bay itself is the basal 23-centimeters of Core 3, Figure 23. This interval contains the deepest and, arguably, the oldest record of the Holocene transgression within the Marco Island-Ten Thousand Islands region of southwest Florida. Unfortunately, this 23-centimeter interval does NOT contain the Holocene-Pleistocene disconformity. The oldest Holocene deposit penetrated in the three Barfield Bay core is Unit A in Core 3. Unit A is a rooted, organic-stained, silty, quartz-sand beneath the allogenic, granular, peat layer that contains rare nearshore-marine mollusks (Anomalocardia?) as well as a sparse assemblage of calcareous foraminifera dominated by Elphidium spp. (E. gunteri (1), E. delicatulum (15), E. mexicanum (1)), plus (3) Ammonia parkinsoniana). The marine mollusks and foraminifera strongly indicate, almost require, that this unit be Holocene in age because the subjacent, Pleistocene, quartz-sand does not contain marine shells and benthic foraminifera. In this region the uppermost Pleistocene quartz sand penetrated in cores is yellow in color, is locally capped with an oxidized zone (paleosol?), and its only carbonate material occurs locally within intrusive burrows that are filled with shells from the overlying Holocene sediments [40,41]. Thus, this 23-centimeter-thick interval most likely records only Holocene events.
The oldest Unit A (Figure 23) is a marine, quartz-sand containing subtidal mollusk shells that was subsequently colonized by rooted plants which may or may not have been terrestrial. The overlying Unit B is an allogenic or transported, granular peat that was deposited in a sub-aqueous environment, possibly supratidal but more likely lacustrine; material from this unit has a radiocarbon age of 6900±50 yrs BP (Figure 23), which indeed is the age of the granular clasts, but it may only be a maximum age for the deposition of the clasts. In addition, Unit B contains intrusive burrows filled with quartz-sand. The contact between Units A and B is interpreted to be a disconformity for two reasons: 1) the Unit A roots cannot belong to plant material in the overlying transported, granular peat, and 2) there are no intervening, intertidal deposits that would be expected if the granular peat had been deposited in a contiguous, supratidal environment.
Unit C (Figure 23) is a marine quartz-sand containing subtidal mollusk shells. A single Anomalocardia cuneimeris shell from Unit C has a radiocarbon age of 6180±85 years BP (Figure 23) which is a maximum estimate for the time of deposition. Unit C is a prime candidate for both the source of the quartz-sand that fills and the infauna that created the intrusive burrows in Unit B. The contact between Units B and C is a disconformity/marine flooding surface Fs 1 in Figure 21. The shell-rich unit at the base of Unit C may be a reworked bed indicative of erosive winnowing during the marine transgression.
The 5690±90 years BP (Cal) Cardita floridana from near the base of Core 5 (Figure 21 and Figure 24) provides only a maximum estimate for the depositional age of these sediments, they could be younger but no older. Disarticulated bivalve shells and gastropod shells should be considered to be sedimentary clasts and thus the surrounding sediment can be no older but may well be much younger.
Articulated shells of the bivalves Parastate triquetra and Anomalocardia cuneimeris, collected from tempestite Tp1 (Figure 16, Figure 21 and Figure 24), have radiocarbon ages of 5980±40 years BP and 6230±75 years BP, respectively, Figure 23. The 1σ and 2σ ranges of these two dates do not overlap and thus these articulated bivalves have different ages, perhaps by as much as 250 years. It should be noted that even articulated bivalves can be secondarily transported and redeposited and thus, if not in life or growth position, may only provide maximum estimates for the depositional ages surrounding sediment.
Although there are several interfaces scattered throughout these three Barfield Bay cores that superpose more silty material on top of less silty material, they were not considered to be flooding surfaces given the essentially arbitrary manner in which they were determined. The pervasive bioturbation has severely limited the identification of significant stratigraphic surfaces within the bioturbated sediment-fill.
The contact between the Barfield Bay sediment-fill and the aeolian dune margins is present at the tops of Cores 2, 6, and 7 (Figure 22 for locations) as a flooding surface that superposes mangrove-root and silt-rich quartz sand on top of largely, silt-poor quartz-sand, Figure 6B. The underlying aeolian sand contains root casts but no actual root fibers. Plant material, primarily(?) mangrove-roots, at this contact in Core 2 has a radiocarbon date of 2410±60 years BP (Cal), Figure 21 and Figure 24. The elevation of this contact is not identical in these three cores, differences that may reflect 1) their different positions on the sloping, proximal portion of this flooding/disconformity surface or 2) each core penetrates different flooding surfaces, Figure 6B.
The stratigraphy adjacent to the Horrs Island terrestrial aeolian dune is expected to be complex given that the 7800 year-dune has been onlapped during the subsequent Holocene marine transgression. At present Fs 2 (Figure 21) is the only identified portion of this onlap; its continuation into Barfield Bay proper is unknown as is the facies relationship with the bay sediments (the red facies contact symbol in Figure 21 between Cores 2 and 3). The existence of an onlap disconformity at depth is shown by the blue-dashed line at the margins of the Horrs Island dune, Figure 21. The red question mark at the contact between the light blue Fs 2 and the dark, blue-dashed line indicates this uncertainty.
9.2. Stratigraphy Discussion and Interpretation
Stratigraphic organization of the Holocene Barfield Bay sediment-fill penetrated by Cores 3, 4, and 5 is essentially limited to the lowermost twenty-three centimeters of Core 3 where there is evidence for a disconformity and an overlying flooding surface. These surfaces record two episodes that occurred some 6900 years ago at a depth of 6.7-meters below present-day mean sea level (MSL). All the overlying sediment-fill consists of mollusk-shell-rich, bioturbated, silty, quartz-sand without recognizable layering except for a handful (<5) of 5-cm thick, shell-rich tempestites. With the exception of the 6-cm thick granular, terrestrial peat at a depth of 6.6-meters (MSL), the sediment-fill was deposited in a subtidal environment as part of a flood-tidal delta that prograded north from the southern Caxambas Pass opening. Barfield Bay Core 4 is located in the proximal, silt-poor, flood channel and ramp [38,39] of this delta; Cores 3 and 4 are located in the north and southeast, silt-rich, distal basins, respectively.
The flooding surface separating peritidal, silty quartz sand containing mangrove vegetative debris from the underlying terrestrial aeolian dune sand in Cores 2, 6, and 7 is the other major type of stratigraphic surface recognized in the Barfield Bay region. These three surfaces are not at the same elevation in all three cores and thus may be 1) on different portions of the same sloping surface and/or 2) be different surfaces altogether. The Fs2 surface in Core 2, Figure 6B and Figure 21, contains plant fragments (mangrove?) that are 2410±60 years BP (Cal) and thus records a sea level position in the Holocene marine transgression that reached an elevation of some 2.1-meters below present-day MSL at that time.
10. Holocene Sea level Record in the Barfield Bay Region
The granular, allogenic peat near the base of Core 3, Figure 21 and Figure 23, provides an upper bound for MSL 6900 years BP, namely, it can have been no higher than some 6.5 meters below present-day. This upper bound is somewhat deeper and older than the 5.5-meter depth and 6200 years BP age of wooden burial stakes from a submerged archaeological site in the Gulf of Mexico offshore of Manasota Key, Sarasota County, Florida [42,43,44].
Cores 2, 6, and 7 that were taken on the terrestrial aeolian dune margins of Barfield Bay record a sea level transgression at the bases of their Holocene intra- and peritidal sections, Figure 6B and Figure 21. This transgressive surface occurs at elevations ranging from 162 cm to 210 cm below MSL. These different positions could well be 1) on a single sloping and/or irregular transgressive surface or 2) are three different surfaces altogether. In Core 2 a sample of mangrove roots and other vegetative debris located immediately on top of the transgressive surface at a depth of approximately 2-meters below MSL has a radiocarbon age of 2410±60 years BP, Figure 6B and Figure 20. A recent study [3] determined that mangrove peat deposition in South Florida occurs in the upper 50 centimeters of the 1-meter intertidal zone, a conclusion based on 5 ground surveys and extensive Lidar mapping. Hence, this Barfield Bay sample of mangrove-derived, vegetative debris, absent any foraminifera data, was most likely deposited at a MSL position 2 to 2.5 meters below present-day. This Core 2 deposit fits on both of the relative sea level (RSL) curves [3], each of which are based on 47 (Snipe Key) and 43 (Swan Key) C-14 ages of subsurface samples of mangrove peat and wood fragments that extend back to 5500 years BP, box BBC2 in Figure 25.
The beach-ridge that was located at what now is Joy Street, Marco Island, was the oldest ridge in the Holocene beach-ridge plain on the Gulf of Mexico margin of Marco Island, Figure 26A. It was deposited at a mean sea level essentially equal to present-day based on the paradigm of equating beach-ridge swale elevation to mean-higher-high water (MHHW) [45]. The youngest shell in the spectrum of ten radiocarbon dates made on ten individual shells collected at the Joy St. beach-ridge has an age of 2270±200 years BP (Cal), Panel B in Figure 26B. The next five, younger shells have 1σ range-estimates that overlap the 1σ-range of the youngest shell. This 1σ “cluster” has a mean age of 2440±200 years BP that provides support for the hypothesis that the 2270±200 years BP shell is a reasonable estimate of the actual age of deposition and not just a maximum estimate. Thus, the Joy St. beach ridge and the Barfield Bay Fs2 flooding surface indicate two different MSL elevations over the same time interval, Figure 26.
Two independent and coeval mean sea level indicators, located within 5-kilometers of each other, identified in a microtidal and low wave energy environment, producing contemporaneous elevation estimates differing by 2-meters call into question the ability of both techniques to estimate mean sea level. This apparent conundrum, however, may be caused by one technique interpolating continuity between discrete data points when continuity does not actually exist. Relative sea level (RSL) curves based on subsurface, intertidal, vegetative debris [3,46] can promote interpretations of stratigraphic completeness, with few, if any, disconformities and, more importantly, cannot identify the presence of highstand events. RSL curves from the southeastern US that are based on subsurface, intertidal data always result in a sloping, linear distribution of age/depth values such that younger material is always higher in elevation and older material is always lower ever since the pioneering work of D. W. Scholl and colleagues in the Ten Thousand Islands of southwest Florida [47]. The depositional ages of beach ridges comprising Holocene barrier islands in the southeastern United States identify an intermittent sequence of sea level “highstands”, equal to present-day, that extend back 5000-6000 years BP [45,48,49]. Thus, the apparent misfit between the contemporaneous MSL elevations predicted by Fs2 in Barfield Bay Core 2 and that of the Joy St. beach ridge can be explained by the existence of a short-term sea level “highstand” that was not and could not have been identified in a RSL curve [3] based on subsurface, intertidal data.
Figure 26.
Panel A. The 1952 aerial photo shows Marco Island prior to residential development. The white star locates the beach-ridge site at Joy Street where nearshore-marine, mollusk shells were collected at the Joy St. locality during the dredging of a finger canal. The black star is the location of Water-well W-4937, which provides a minimum subsurface depth for the Holocene deposits. Profile AA’ was made from a proprietary map with a 1-foot contour interval surveyed by the Deltona Corporation prior to development. Fs2 is the estimated MSL for Flooding surface 2 in Core 2. Panel B. Radiocarbon date list on individual mollusk shells collected from the Joy St. locality. Marine reservoir corrections (MRC) were not applied in the Marine20 calibration because these MRC values for the Ten Thousand Islands region of southwest Florida are known only for Crassostrea virginica shells [50], none of which were analyzed in this study. The youngest shell in the spectrum of radiocarbon dates made on 10 shells collected at the Joy St. beach-ridge has an age of 2270±198 years BP. This is the maximum possible age for this deposit, it could be much younger. The next five, younger shells, highlighted in blue, have 1σ range-estimates that overlap the 1σ-range of the youngest shell. The following next 3 younger shells (highlighted in light blue) have 2σ range-estimates that overlap the 2σ range of the youngest shell.
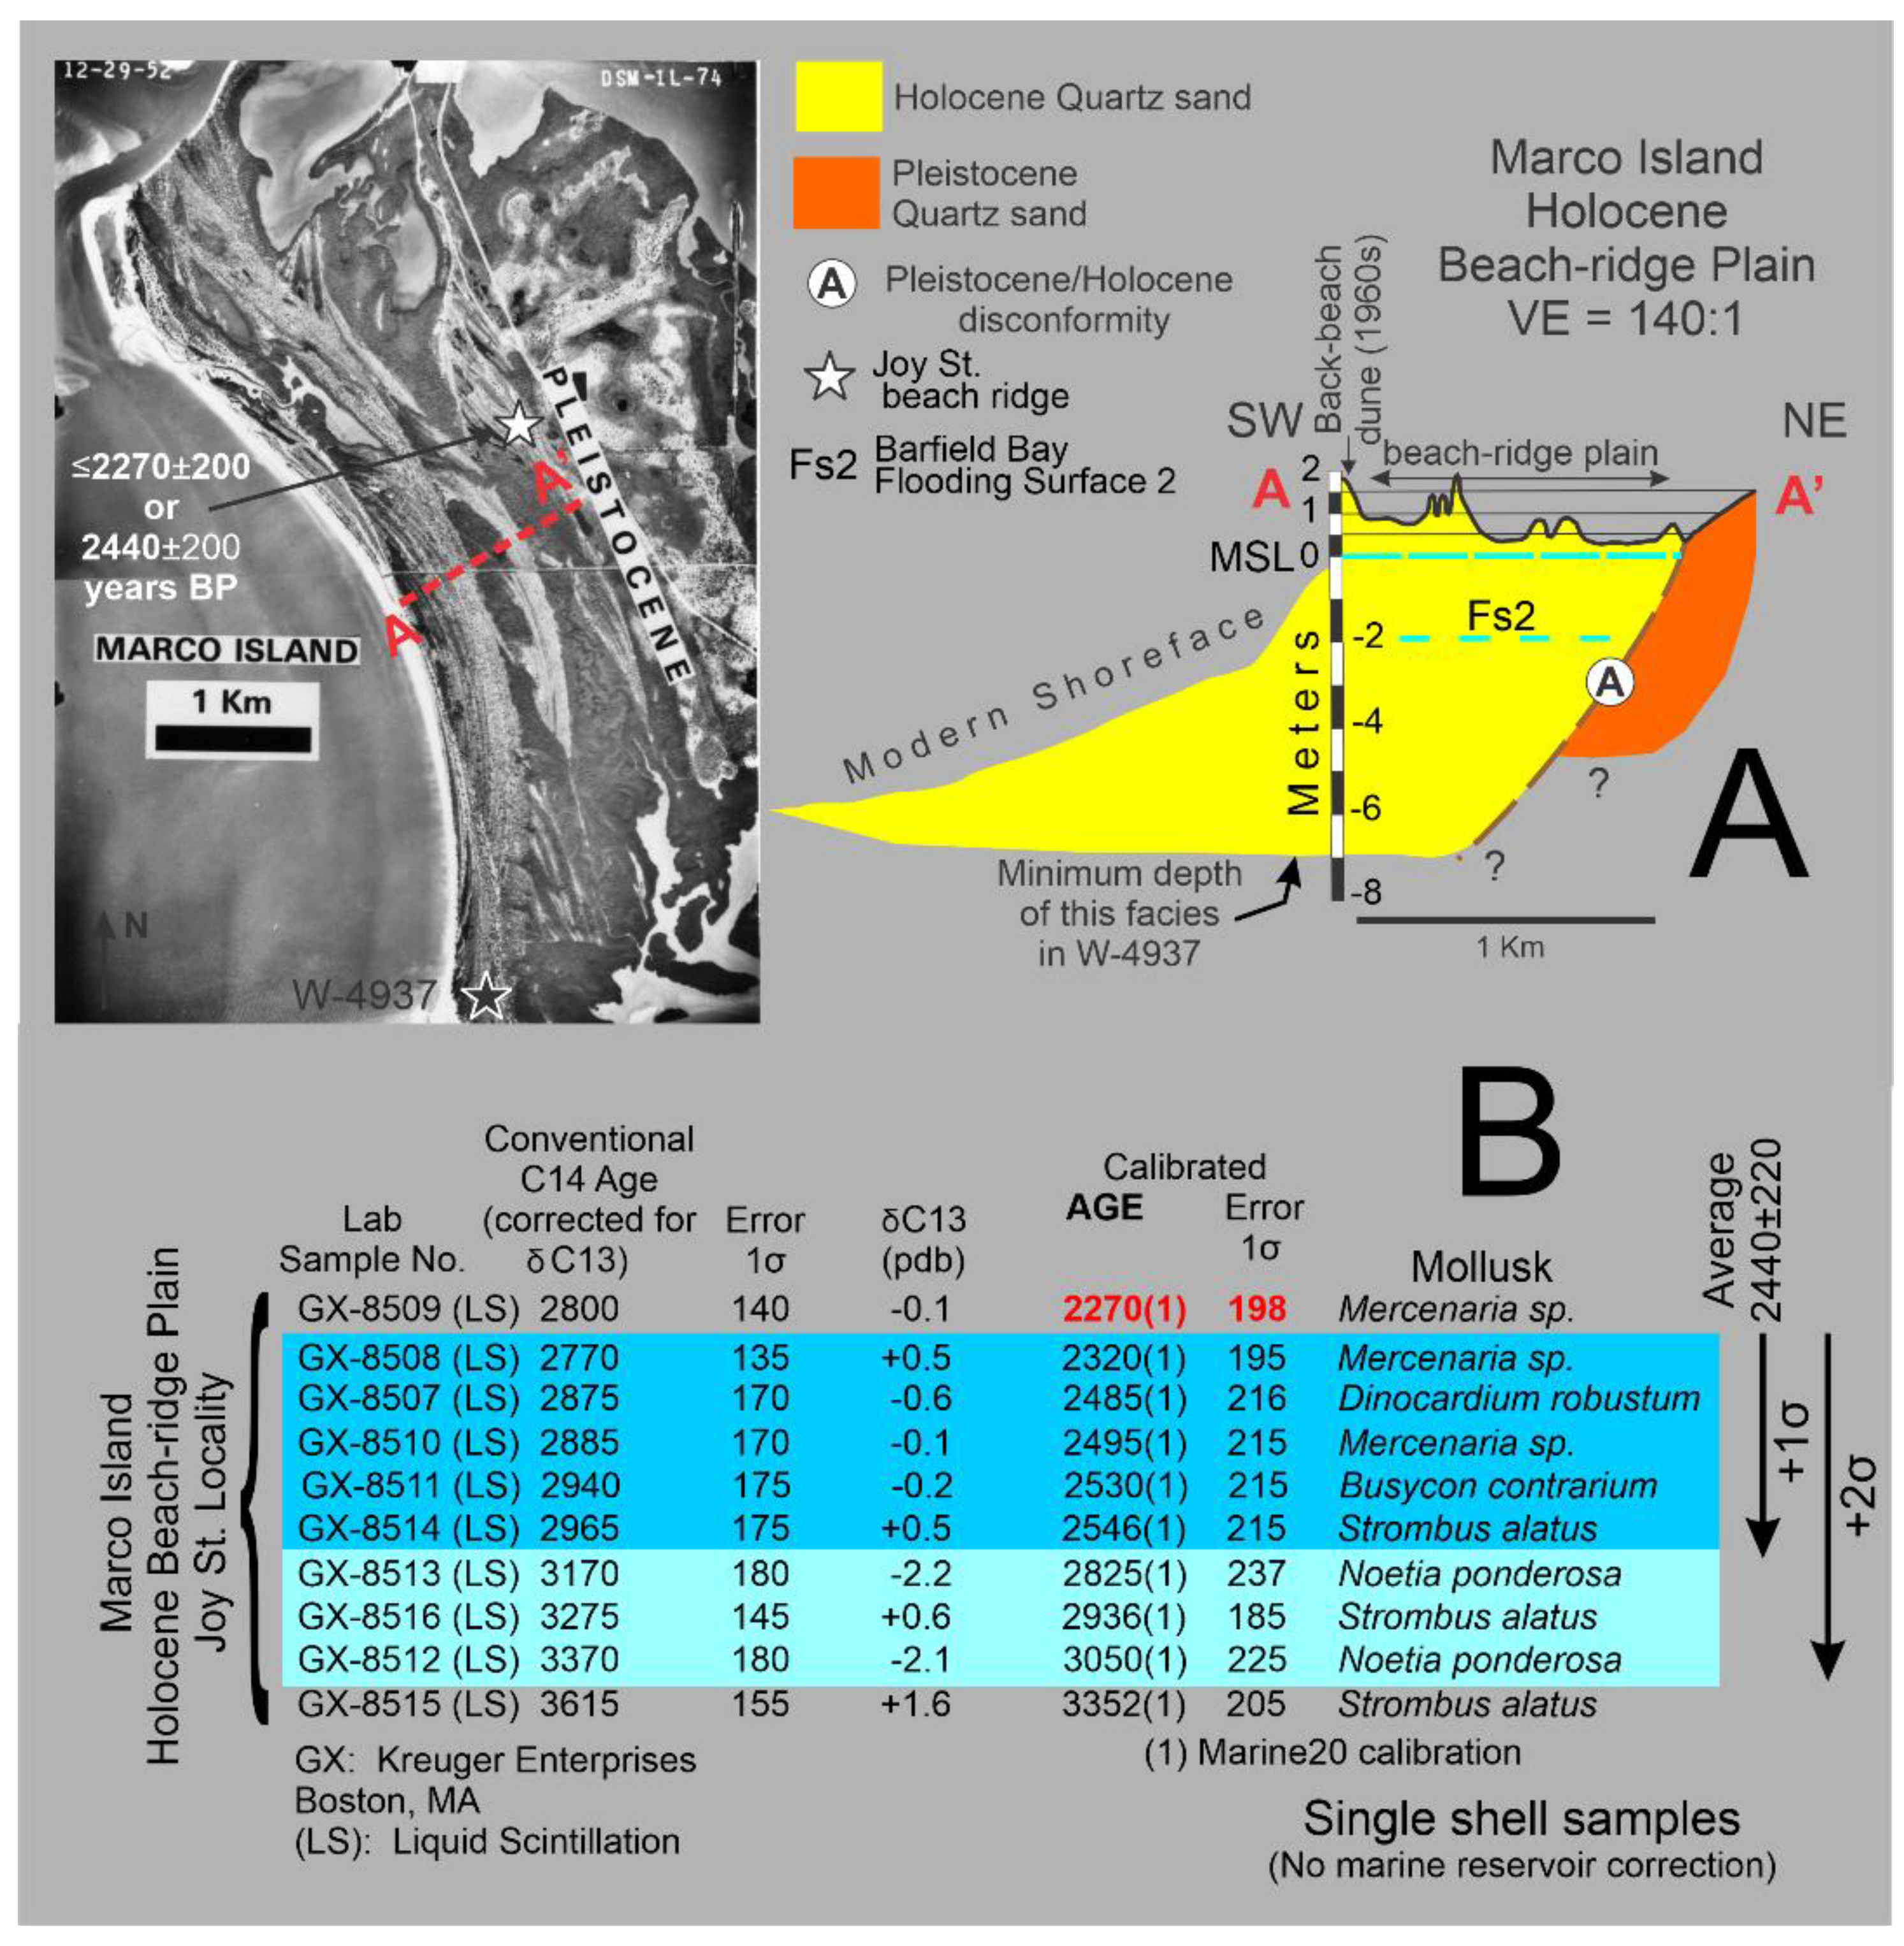
11.Conclusions and Interpretations of the Origin, Sedimentology, Paleontology, and Holocene Stratigraphy of Barfield Bay, Marco Island Region, southwest Florida
Barfield Bay fills the semi-elliptical center of a north-south-oriented parabolic dune that has a southern opening. The southern ends of the two parabolic arms terminate against east-west-oriented transverse dunes, the Indian Hill at the western arm and the Horrs Island at the eastern arm. Both transverse dunes have steeper, north-facing slopes which indicate northward migration. Optically stimulated luminescence (OSL) dates on the quartz-sand from the crests of these dunes indicate that the Indian Hill transverse dune is 26,000, the Barfield Bay parabolic dune is 15,000, and the Horrs Island transverse dune is 8000 years old. All these dunes are terrestrial in origin because the Gulf of Mexico shoreline was hundreds to many tens of kilometers farther west during the times of their formation. Local, pre-existing Pleistocene coastal sand deposits, MIS Stage 5E [51], are the most reasonable local sources for the sand mobilized into these terrestrial, aeolian dunes. It is possible that the immediately adjacent Marco Island Pleistocene deposit, now interpreted as a barrier-island remnant, could also be a terrestrial aeolian dune given that its isopach pattern defines an isolated, elliptical, 10-meter-thick mass which is 4-5 times thicker than the Pleistocene coastal deposits on the adjacent Florida mainland.
Two possible alternative hypotheses for the origin of Barfield Bay are 1) a Carolina Bay, a shallow (2-4 meters deep) elliptical feature with a several meter-high sand rim, and 2) an impact crater. Both are untenable given the differences in ages of the terrestrial dunes that surround Barfield Bay because rim deposits of both Carolina Bays [52,53] and the proximal deposits of an ejecta blanket surrounding an impact crater [54] must be the same age. Carolina Bays typically occur in HP Groups, are no more than 4-meters deep, and are filled with significant quantities of vegetative material; furthermore, they do not contain marine mollusk shells [52,53].
The three vibracores that sampled the Barfield Bay sediment-fill penetrated between 5- and 7-meters of thoroughly bioturbated, silty, mollusk-shell-rich, quartz sand. Layered material consists of a handful of 5-7-centimeter-thick layers composed of mollusk-shells with minor silty sand matrix which are interpreted to be tempestites. In addition, the lowermost 23 cm of the deepest core has a 5-centimeter-thick layer of granular, terrestrial peat that is over- and underlain with mollusk-shell-rich, silty quartz-sand. It should be emphasized that 97% of the 17.82-meters of sediment recovered in these three cores consists of non-layered, bioturbated, mollusk-shell-rich, silty quartz-sand.
Granulometric analysis of forty (40) bay-fill and seventeen (17) terrestrial dune sediment samples resulted in the recognition of six, distinct, volume-percent histogram-patterns, four of which occur in both the bay-fill and terrestrial dune samples. The sand and silt fractions of all fifty-seven (57) samples were NOT separated prior to grain-size analysis with a Mastersizer 2000 device; mollusk-shell material was removed by sifting through a 1-mm screen. The computer programs GRANULO [1] and ROKE [2] were used to identify 163 log-normal populations present within the sand and silt material comprising these 57 sediments. These 163 log-normal populations formed seven distinct, at the 2σ level, clusters on a mean versus standard deviation plot. The major sand cluster (41 members out of the 57 samples) of the coarsest, best sorted grain-sizes (2.03±0.17 Phi; 0.17±0.06 Phi units) contained log-normal populations from both bay-fill and terrestrial dune samples as did both the medium- (5.3±0.2 Phi; 0.54±0.1 Phi units) and fine-silt (7.1±0.3 Phi; 0.91±0.1 Phi units) clusters. These grain-size characteristics did not discriminate depositional environments. The one non-expected, grain-size result is the identification of log-normal populations containing both very fine sand and coarse silt; undoubtedly the result of not separating sand and silt prior to the analysis of silt-rich, clastic sediment. The identification of these 163 log-normal components strongly suggests that prior to bioturbation the clastic sediment consisted of numerous, distinct layers of sand and silt. Furthermore, the result that the major sand component of both the bay-fill and terrestrial aeolian dunes is of the same grain-size suggests a similar, if not identical, source.
A total of 686 mollusk shells were identified in the 21 samples of the bioturbated silty quartz-sand in the three Barfield Bay cores and 388 in tempestite Tp1. Species diversity of the mollusks in the Barfield Bay sediment-fill, as indicated by the Shannon Diversity Index H=3.227 (Hmax =4.16) [27] and the Simpson Concentration Index D=0.075 [28] (possible range of 0-1 with 0 being more diverse), is high. However, these two diversity indices are known to over emphasize species richness (S=63) at the expense of species abundance. The degree of evenness of individuals per species is indicated by the Shannon Evenness Index SEI/J=0.78 (range of 0-1) [27] which indicates a fairly high degree of evenness and the Simpson Equitability Index SEQ=0.21 [28] which indicates a low degree of evenness and the dominance of a few species. Thus, the 686 mollusk-shells identified in the 21 samples of the Barfield Bay sediment-fill come from a rich (S=63), diverse (D=0.21, H=3.23), and markedly uneven (SEQ=0.21) population that is dominated by the two bivalves, Parastarte triquetra (B) and Anomalocardia cuneimeris (B), with 154 and 61 identified individuals, respectively, out of 686 identified individuals. Seven critical species were identified on the basis of 1) occurring in all three Barfield Bay cores and 2) having 21 or more identified individuals so that they could occur in all 21 Barfield Bay mollusk samples. These Critical Mollusks are the following: Parastarte triquetra (B), Houbricka incisa (G), Acteocina canaliculata (G), Cardites floridanus (B), Chione elevata (B), Anomia simplex (B), and Transennella conradina (B). Although Anomalocardia cuneimeris (B) is the second-most abundant mollusk, it does not occur in all three cores and thus cannot be considered as a Critical Mollusk. These seven Critical Mollusks occur in 55% of their possible stratigraphic positions (147) in the 21 samples of the three Barfield Bay cores.
Environmental factors of salinity and silt content were evaluated for the Critical Mollusks and some additional abundant species of wide distribution. Salinity data collected in southwest Florida [30,31] for six of the Critical Mollusks and six additional abundant and widely (among the three cores and stratigraphically within the three cores) distributed species indicate a salinity range of 25-32 psu during the deposition of the Barfield Bay sediment-fill. From a substrate perspective, as long as the volume % silt is below 60%, which it overwhelmingly is, volume % silt appears not to be a major factor in the occurrence of the seven Critical Mollusks. Perhaps the most significant sedimentologic aspect of the identified mollusk population is that it is subtidal.
The Barfield Bay, silty quartz-sand, sediment-fill was most likely deposited in flood-tidal deltas that entered primarily through the Caxambas Pass opening and secondarily through the Blue Hill Creek region. Aerial photos clearly show the present-day Caxambas Pass main-channel as a bright, white ribbon (sand-rich, shallow) separating two darker (deeper, more silt-rich?) areas off to the southeast and northwest. This hypothesized flood-tidal delta interpretation is almost required by the geographic/geomorphic setting of the bay, namely, isolated from the open Gulf of Mexico and/or Gullivan Bay by terrestrial aeolian dunes several tens of meters high when the Holocene marine transgression arrived in this area. The surrounding aeolian dunes probably contributed a bare minimum of sand, and that only to their adjacent, mangrove-covered, intertidal fringes, because 1) they probably were covered with grasses, shrubs, and trees as they are today, and 2) the 2-5-kilometer fetch across Barfield Bay should produce only very small waves and only during extreme wind events. Basically, flood-tidal transport is the most reasonable mechanism to introduce sand and silt into this restricted depositional site. Core 4 is located in this main-channel region and indeed has a much lower, overall silt content. Cores 3 and 5 are located in the southeast and northwest basin areas, respectively, and both have much higher, overall silt contents. No bedding surfaces or indications of sedimentary structures were recognized in the bioturbated, mollusk-shell-rich sediment-fill sampled with the three, Barfield Bay vibracores. Original bedding and sedimentary structures have been destroyed by burrowing organisms, pelecypods and various marine invertebrates. The actual depositional processes can only be hypothesized. The sediment could have come in as turbid mixtures of sand and silt or separately, as an overwash-like sand sheet which was then followed by the suspension-settling of silt. The mollusk species comprising the identified mollusk population are all subtidal as are the rare tempestites. These two observations basically require that the entire Barfield Bay sediment-fill was deposited at subtidal depths.
The overall lack of sedimentary structures and various bedding surfaces essentially prohibits the organization of the Barfield Bay sediment-fill into distinct stratigraphic units. Only two verifiable flooding surfaces have been identified, and these are at the base and top of the sediment-fill. The basal surface (Fs1, Figure 20) is located at a depth of 657-664 cm (MSL) and occurs on top of a terrestrial, allogenic, granular peat (6900±50 years BP Cal) sandwiched between subtidal, shell-rich, quartz-sand. This terrestrial peat records a relative pause in the Holocene transgression followed by a flooding event and continued transgression. This sea level position is within the error estimates for elevation and age indicated by a Caribbean-wide RSL (relative sea level curve) [55] but is beyond the range of the recent south Florida RSL curve [45]. The other (Fs2, Figure 6B and Figure 20) is located at a depth of 210 cm (MSL) below the top of Core 2 and separates peritidal, silty quartz sand containing mangrove vegetative debris (2410±60 years BP Cal) from the underlying quartz sand of the 7800-year-old Horrs Island terrestrial aeolian dune. The Fs2 sea level position is 2-meters lower than that indicated by the nearly coeval (2270±200 years BP Cal), inter- and supratidal beach ridge on the Gulfward margin of Marco Island. This elevation difference for two coeval, equally rigorous sea level indicators can be reconciled with a “highstand” event that was not, and could not be, recorded in the recent RSL curve [45] based on intertidal, subsurface core data. The pervasive bioturbation experienced by the Barfield Bay sediment-fill has destroyed all stratigraphic information except for the identification of flooding surfaces Fs1 and Fs2. Future studies seeking to extract sea level information from this exceptional 7-plus meters of Holocene marine deposits should concentrate on the narrow band, no more than the 150-meter distance between Cores 2 and 3, along the margins of the surrounding dunes. This band is the best location for the preservation of onlapping, intertidal deposits.
Author Contributions
The author Stapor collected the OSL sand samples, interpreted the granulometry data, and wrote the text. The authors Echols and Savarese were 1) part of the field party that collected the vibracores, 2) described the vibracores,3) directed the collection of core samples and the granulometric analyses, and 4) identified the mollusk shells. The author Woodward 1) obtained the access to the private properties on which the OSL samples were collected as well as assisting in their collection; in addition, he obtained funds from the Marco Island Historical Society for the OSL dates.
Funding
We gratefully acknowledge the Marco Island Historical Society for their role in raising funds to finance the OSL age-dating part of the project. Funds from the following South Florida Water Management District projects were used in the Barfield Bay study: 1) 2007, Late Holocene history of the Coastal Everglades: implications for landscape development and estuarine restoration. Savarese, M., Volety, A., Loh, A.N., and Hoye, B. and 2) 2004, Molluscs as environmental indicators of salinity change in southern Florida’s estuaries. Savarese, M. & Wingard, L.
Acknowledgements
Personnel of the Rookery Bay National Estuarine Research Reserve provided field logistic assistance. Boch Hoeflein and Lara Medwedeff (graduate students at the Florida Gulf Coast University) provided field and laboratory assistance. We thank the owners of the properties at the following Marco Island locations for permission to take OSL sand samples: 1) 680 Inlet Dr. (Barfield Bay Parabolic Dune) and 2) 1938 Indian Hill St. (Indian Hill Dune). We thank the owner of the Horrs Island property at 1096 Blue Hill Creek Dr. for permission to take OSL sand samples. Dr. Roger Portell of the Florida State Museum provided the photos of the Seven Critical Mollusks shown in Figures 14B.
Conflicts of Interest
The authors declare no conflicts of interest. The funders had no role in the design of the study; in the collection, analyses, or interpretation of data; in the writing of the manuscript; or in the decision to publish the results.
Appendix A
Appendices 1 and 2 are archived at the Marco Island Historical Society, Marco Island, Florida. They can be accessed at: curator@themihs.org.
Figure A1.
The mollusks identified in the 6 samples taken from the bioturbated sediment-fill in Core 3. A total of 222 individuals were identified in this core; the individuals identified in Core 3 comprise 31% of all mollusks identified in the bioturbated sediment-fill in the 3 Barfield Bay cores. The pelecypod Parastarte triquetra is the most abundant species present, however, it is dramatically abundant in only sample C3-6, the sample taken from the deepest position, 646 centimeters (decompacted) below the MSL datum. The eleven mollusks in boldface are used to estimate the salinity during the deposition of the Barfield Bay sediment-fill, Figure 18A, Panel A. Bivalve and gastropod species are almost evenly represented (ratio of 1/1.125).
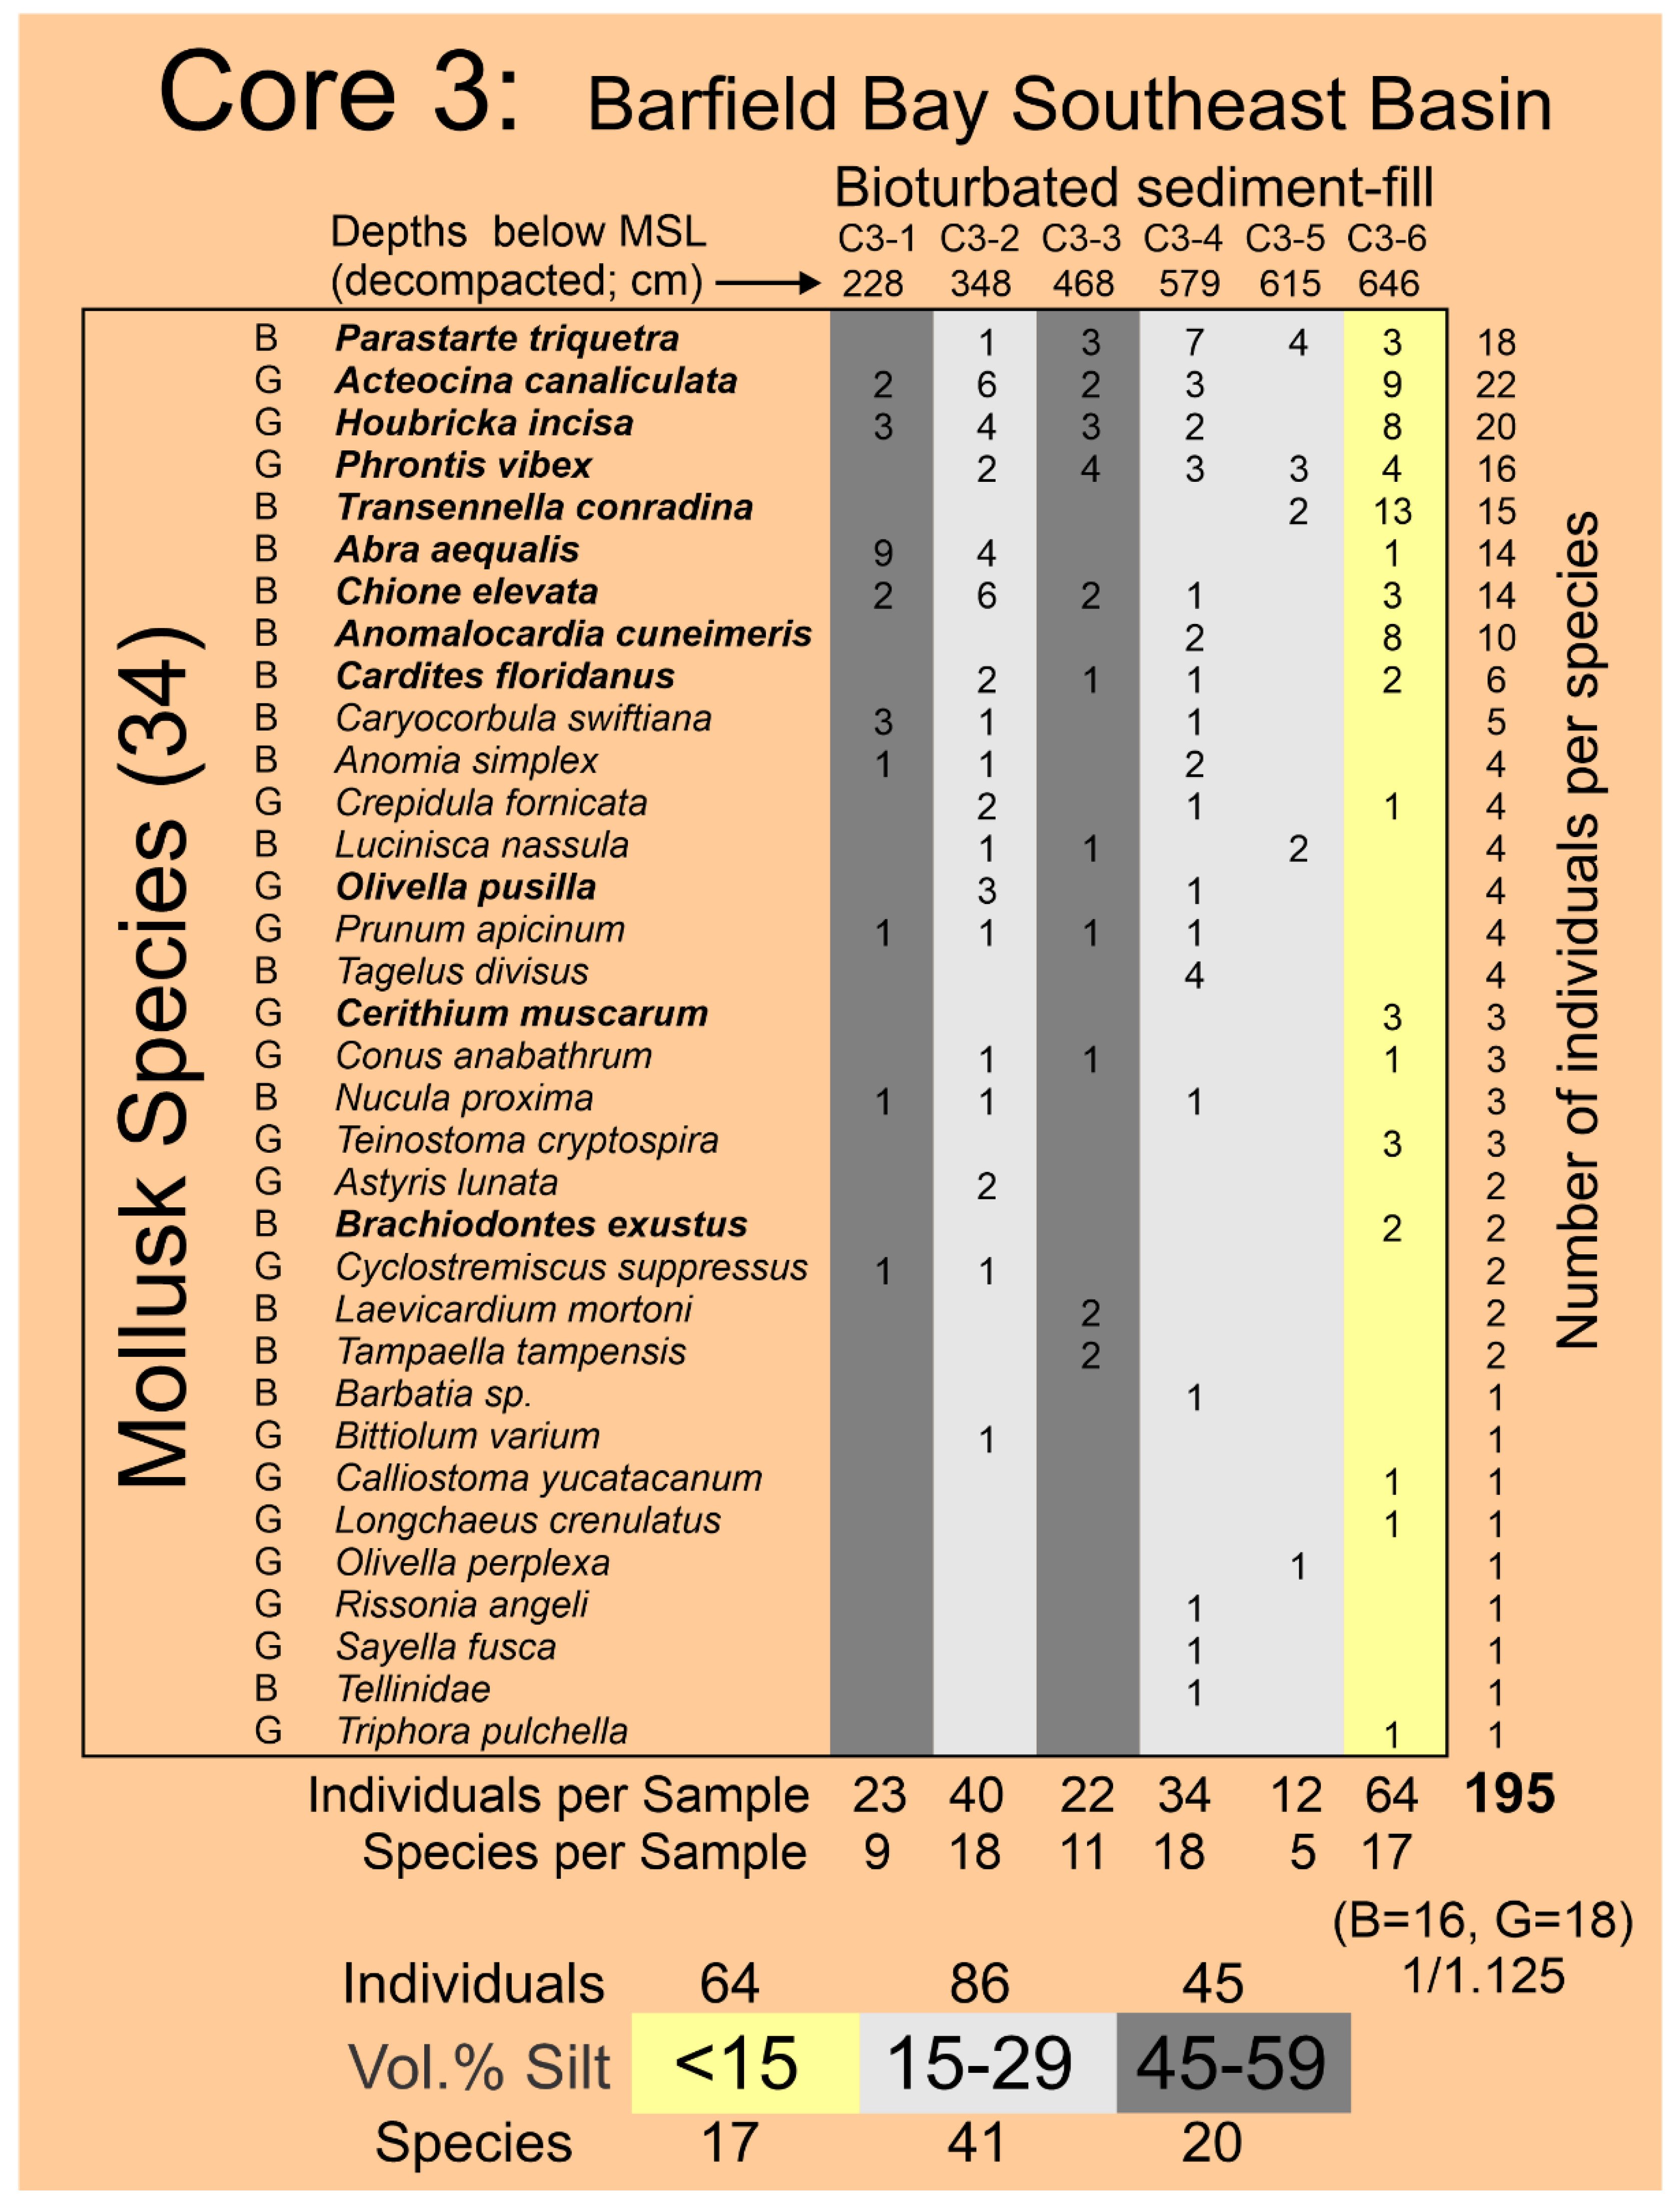
Figure A2.
The mollusks identified in the 7 samples taken from the bioturbated sediment-fill in Barfield Bay Core 4. A total of 171 individuals were identified in this core; the individuals identified in Core 4 comprise 24% of all mollusks identified in the Dispersed-shell Facies in the 3 bay-fill cores. The eleven mollusks in boldface are used to estimate the salinity during the deposition of the Barfield Bay sediment-fill, Figure 18A, Panel A. Bivalve and gastropod species are almost evenly represented (ratio of 1.08/1).
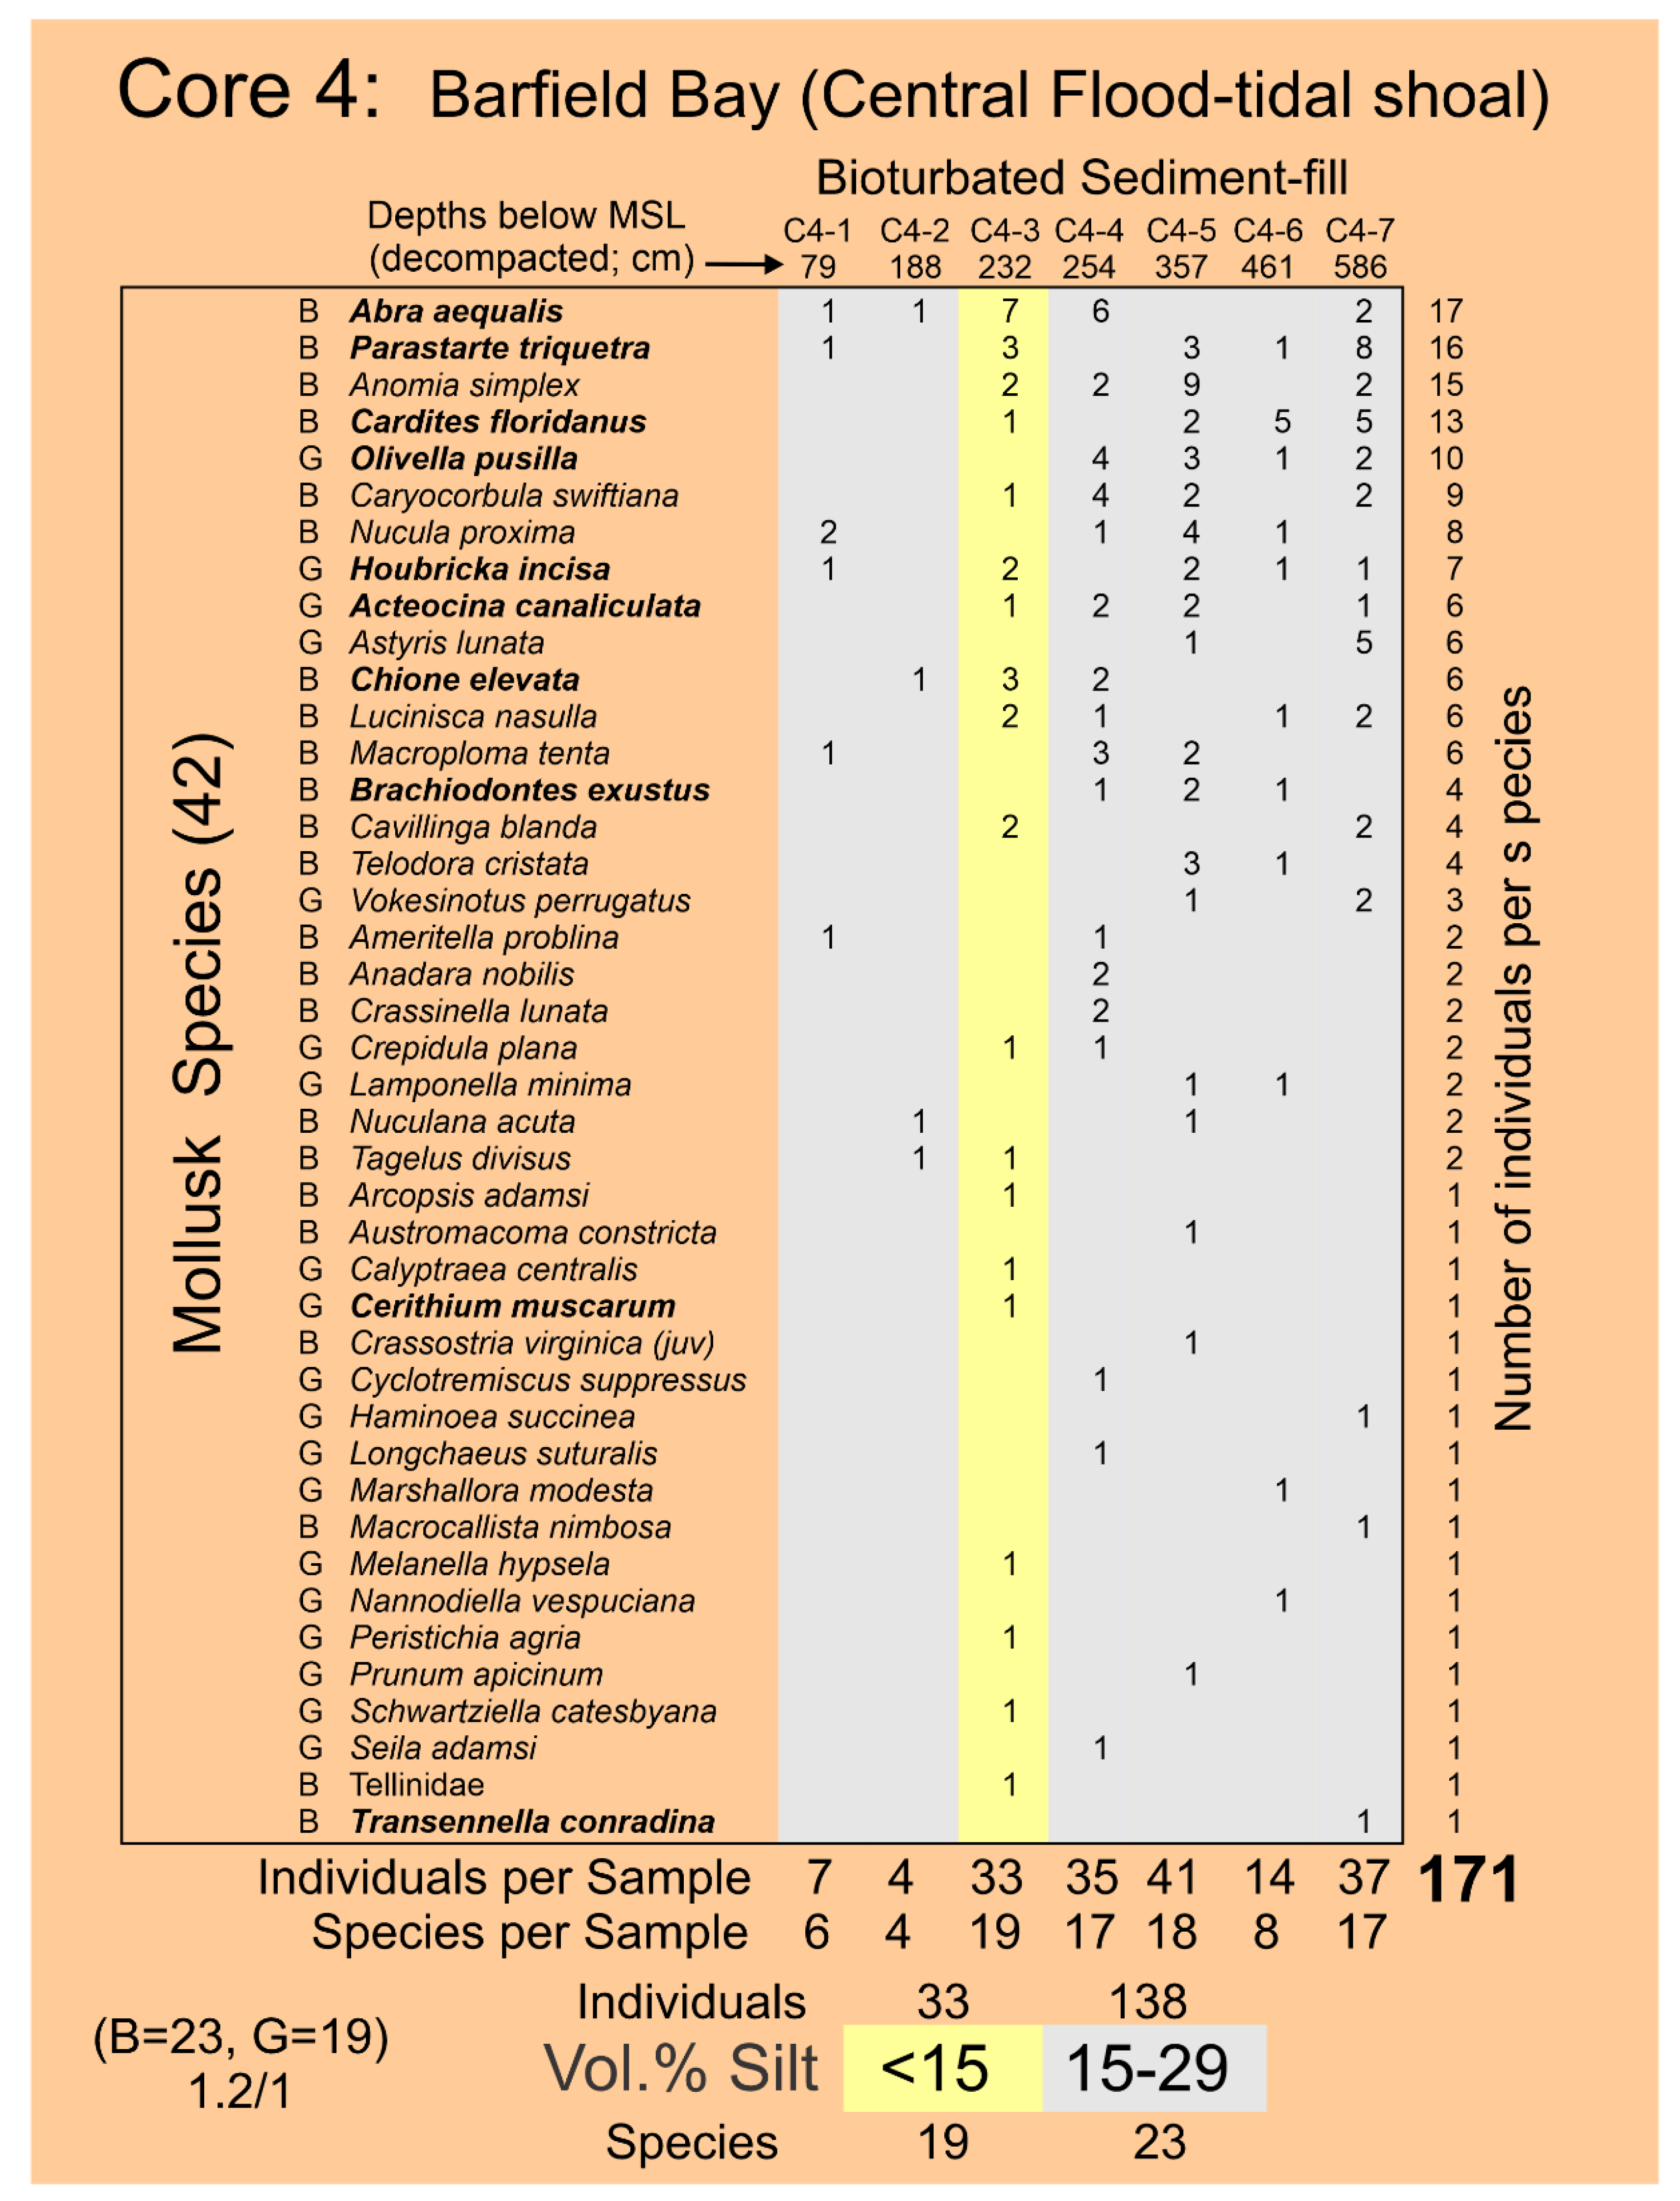
Figure A3.
The mollusks identified in the 7 samples taken from the bioturbated sediment-fill in Barfield Bay Core 5. A total of 322 individuals were identified in this core; the individuals identified in Core 5 comprise 45% of all mollusks identified in the bioturbated sediment-fill in the 3 Barfield Bay cores. The bivalves Parastarte triquetra and Anomalocardia cuneimeris are the most abundant species present; they are not concentrated in any one sample. The twelve mollusks in boldface are used to estimate the salinity during the deposition of the Barfield Bay sediment-fill, Figure 18A, Panel A. There are fewer bivalve species than gastropod species (ratio of 1/1.54).
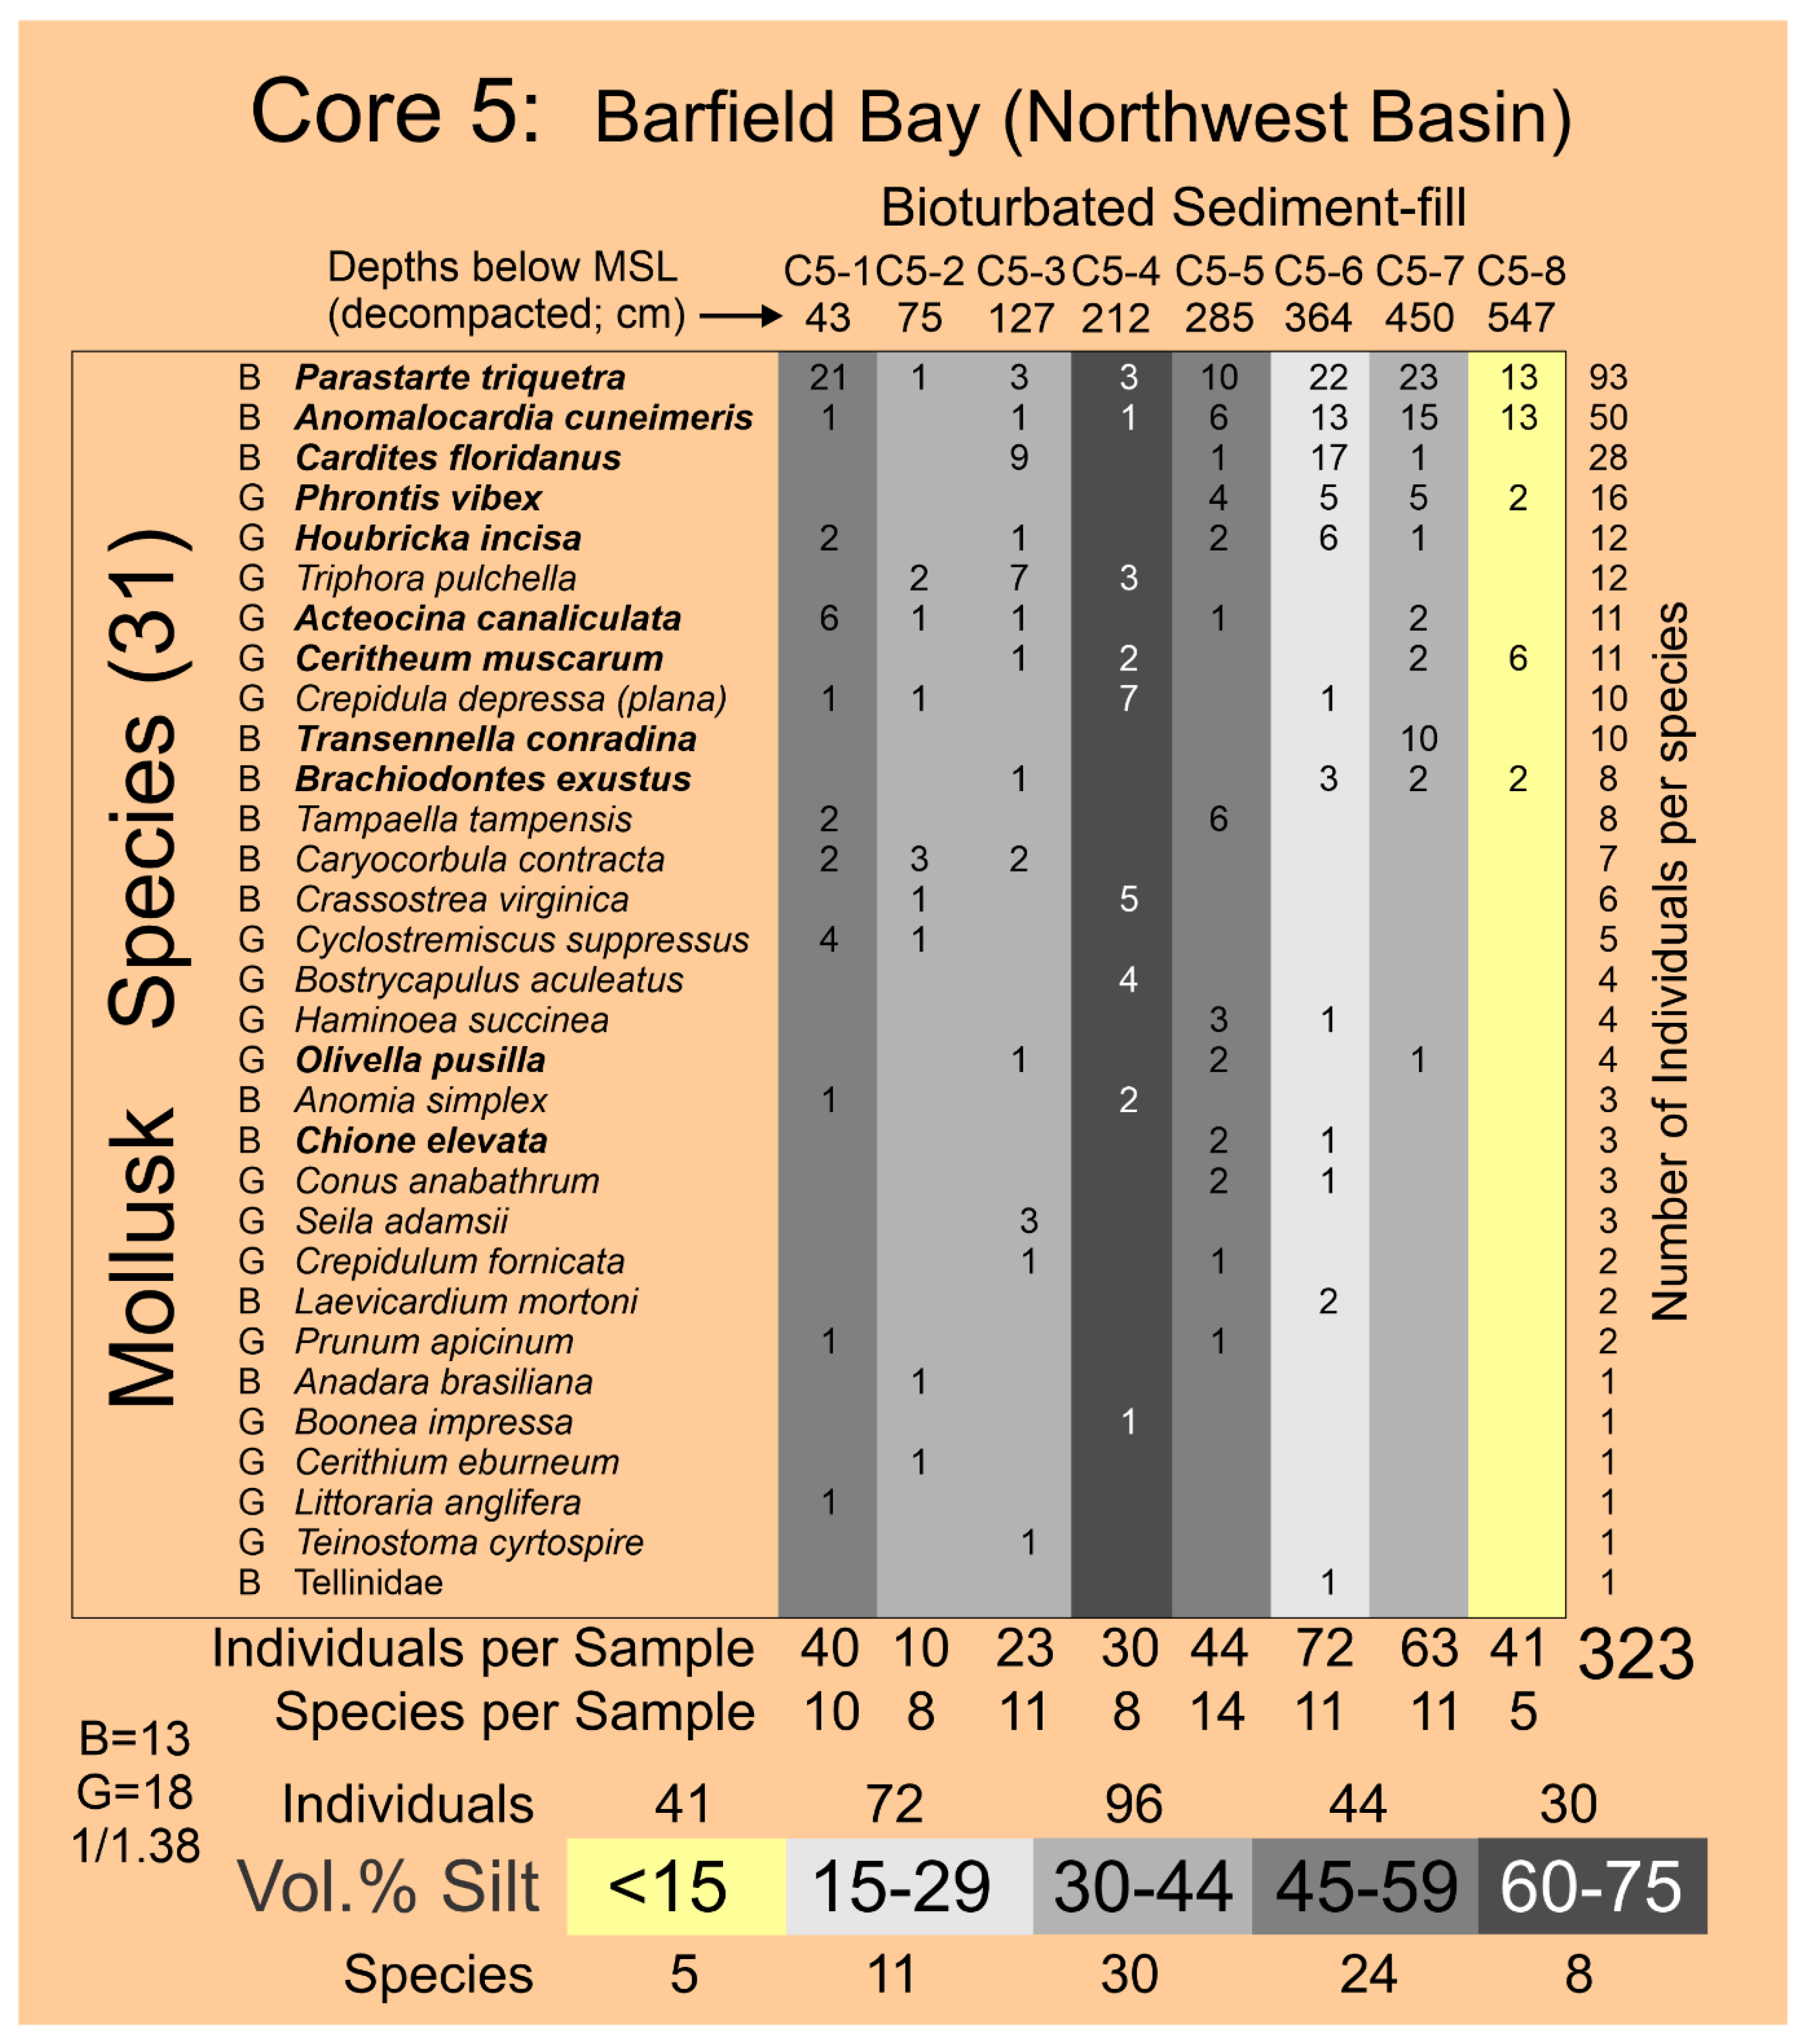
Figure A4.
The mollusks identified in the 14 samples taken from the bioturbated sediment-fill in the Caxambas Pass Core 1. A total of 144 individuals were identified in this core. Nucula proxima, Acteocina canaliculata, and Chione elevata are the more abundant mollusk species present and comprise 35% of all individuals; they are not concentrated in any one sample. The five mollusks in boldface are used to estimate the salinity during the deposition of the Caxambas Pass flood-tidal shoal, Figure 18A (Panel B). The are more bivalve than gastropod species (ratio of 1.4/1). The gray-shaded species have not been identified in the Barfield Bay mollusk population.
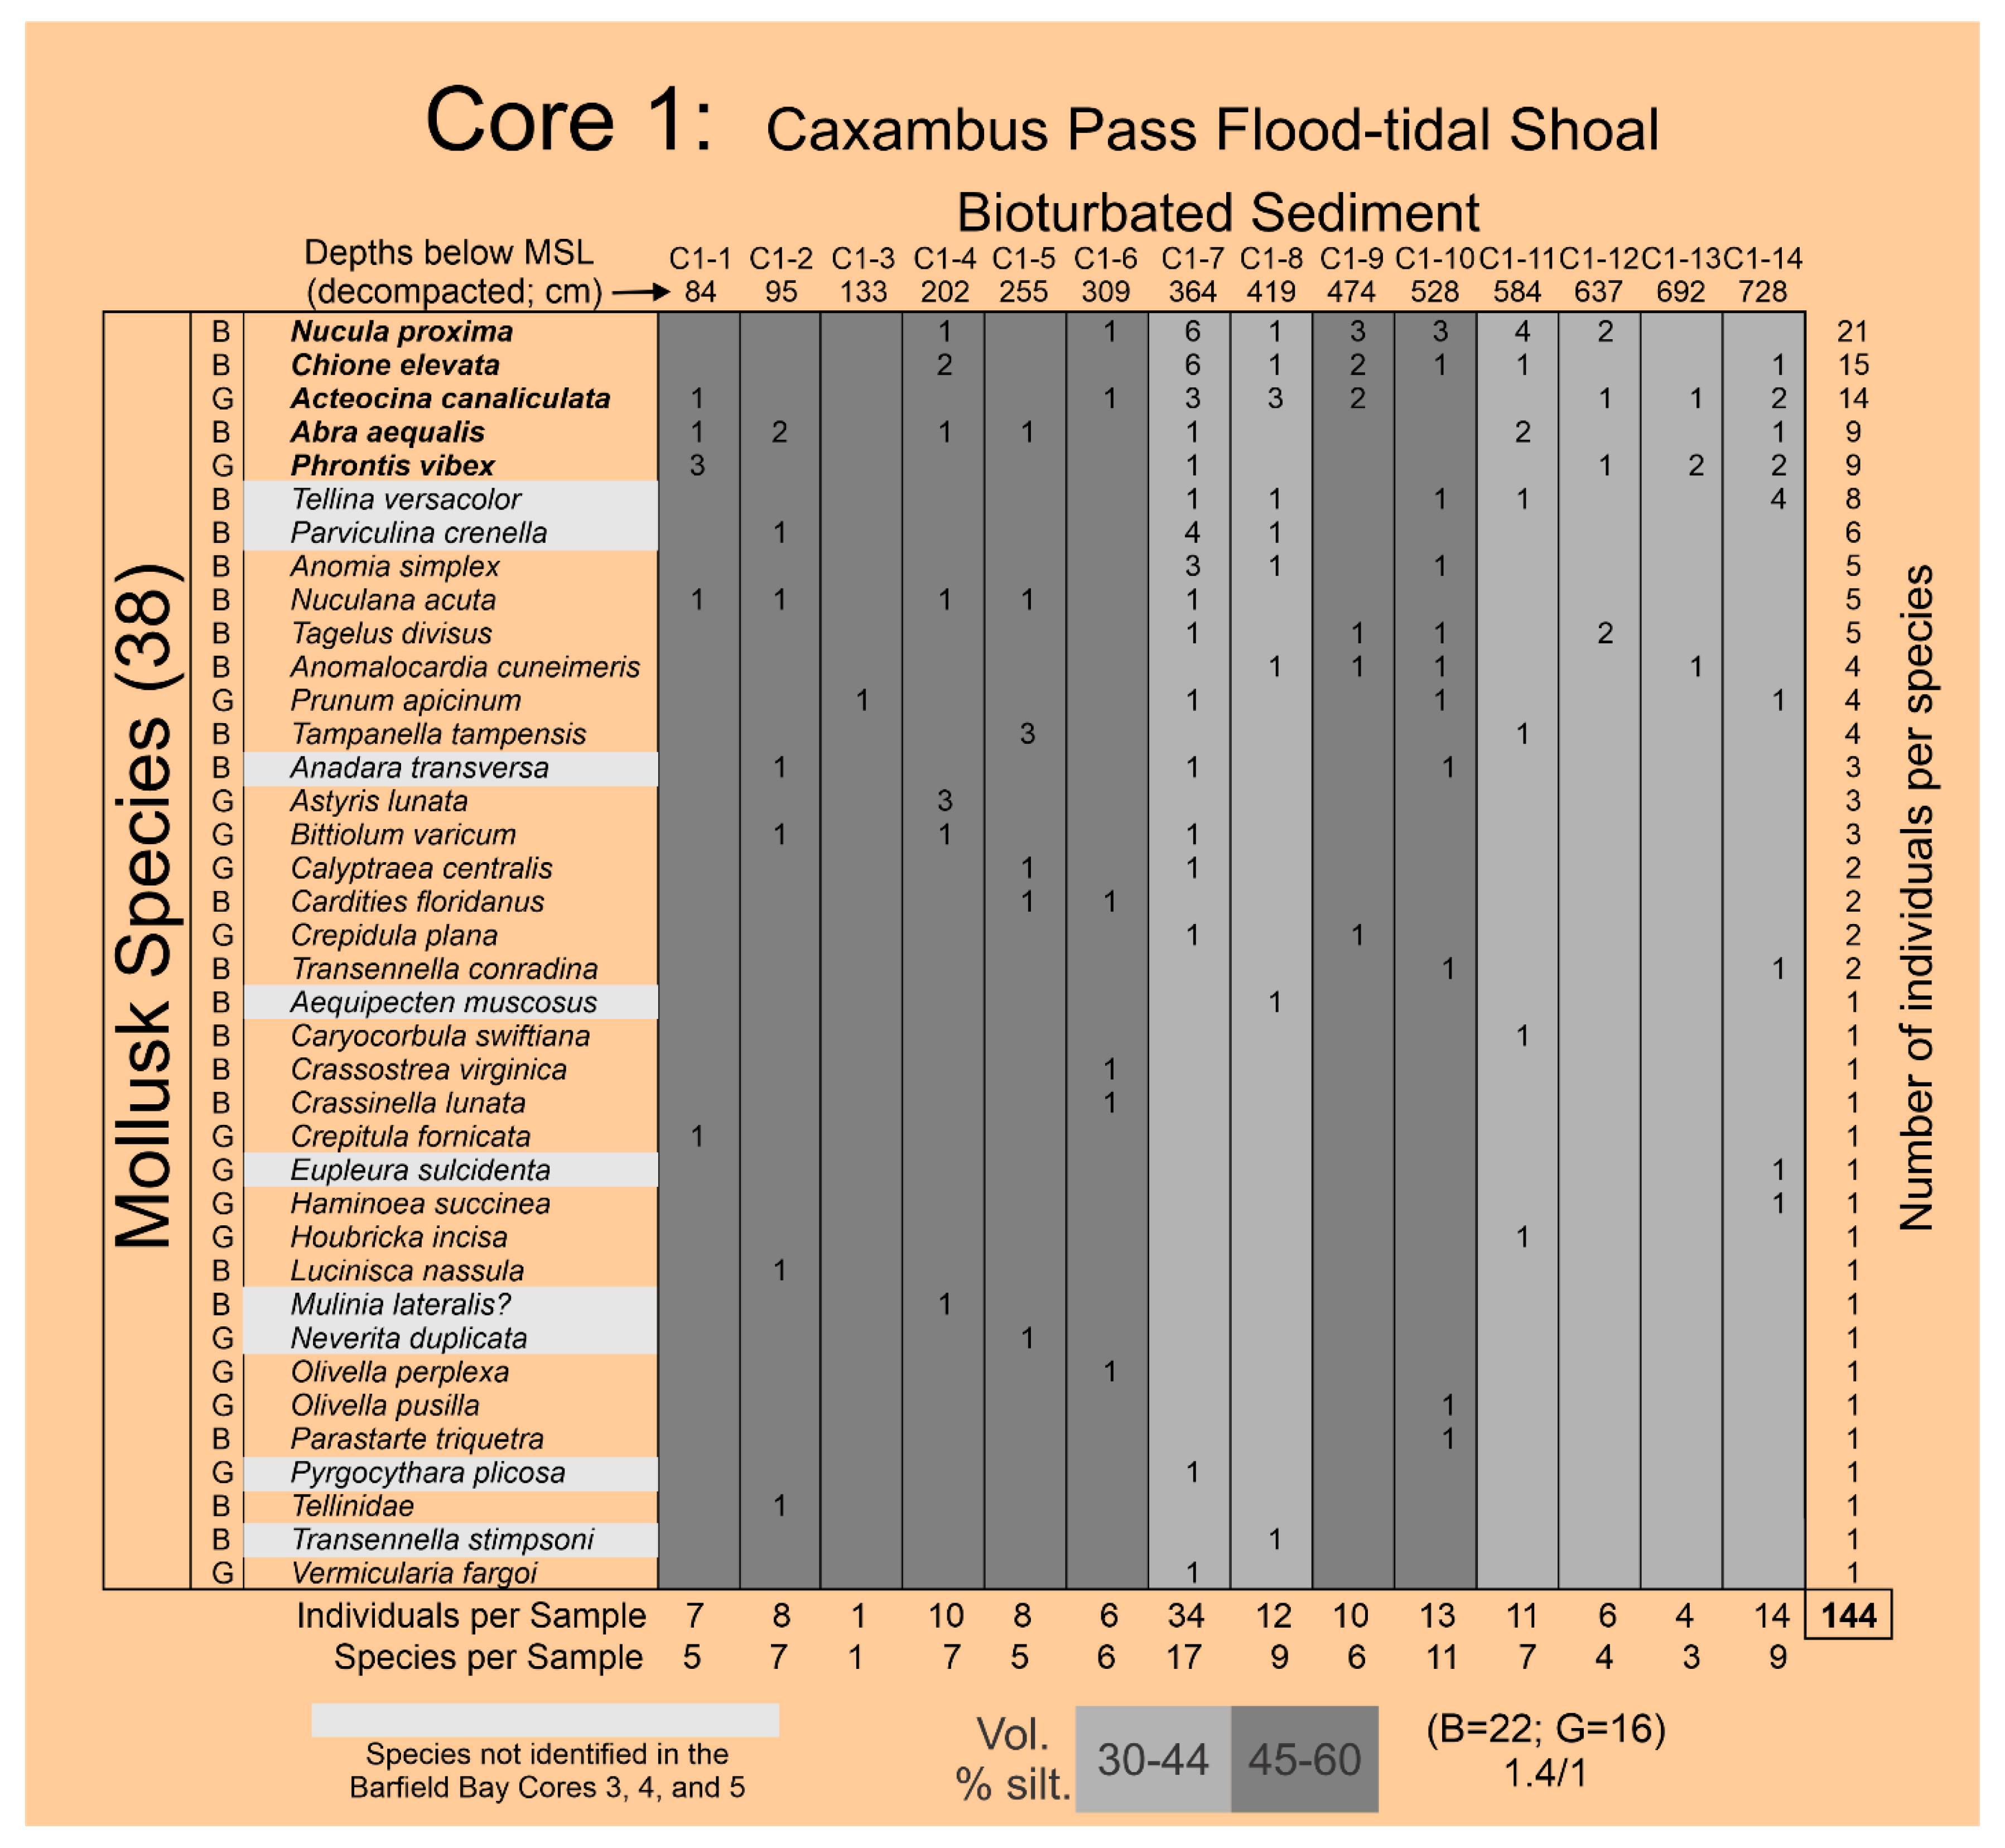
Figure A5.
A comparison of the occurrence of Core 1 mollusk species with their respective occurrence in the three Barfield Bay cores. HP Group A Core 1 species occur in all three Barfield Bay cores, HP Group B Core 1 species in two Barfield Bay cores, HP Group C Core 1 species in one Barfield Bay core, and HP Group D Core 1 species do not occur in any Barfield Bay cores. The yellow-, shaded mollusk species are under-represented in Core 1 relative to their occurrences in the three Barfield Bay cores. The blue-shaded mollusk species (white type) are over-represented in Core 1 relative to their occurrences in the three Barfield Bay cores. The species in RED type are Critical Mollusks in the Barfield Bay mollusk population. The Core 1 and the Barfield Bay mollusk populations are clearly similar, but have differences, perhaps significant, in particular species, numbers of individuals per species, and total mollusk abundance.
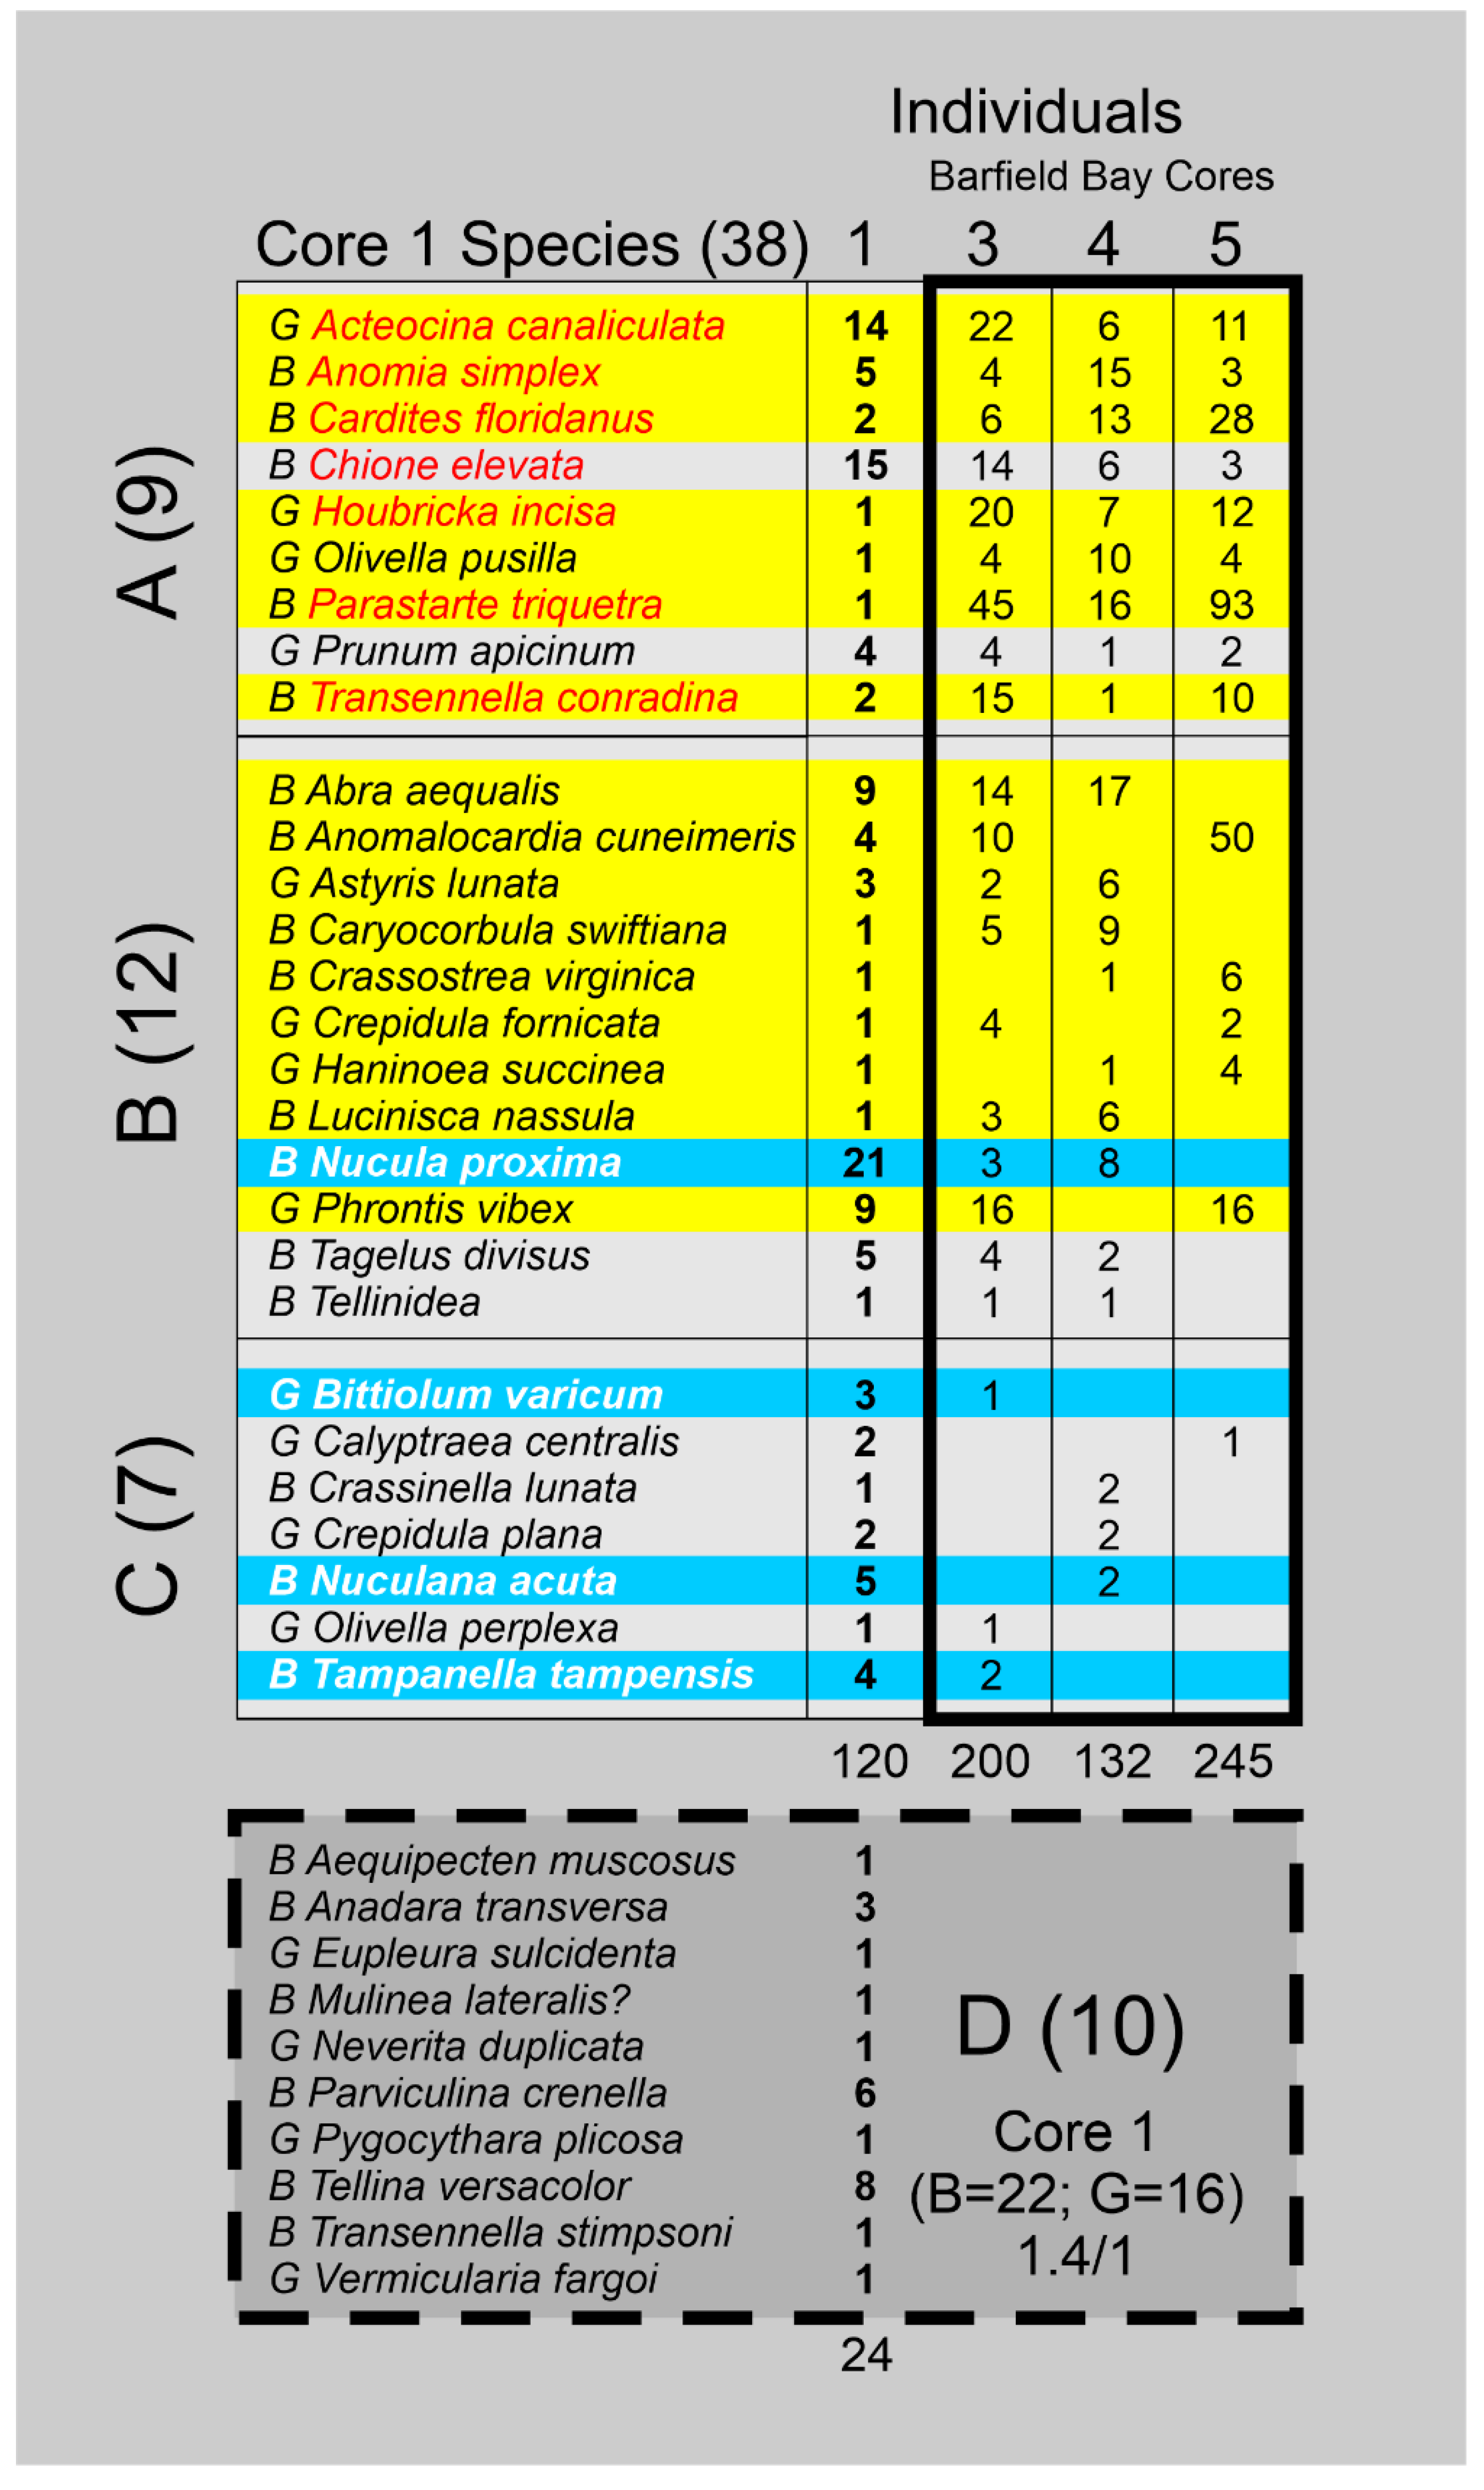
Figure A6.
A comparison of mollusks reported by Scholl [32], Parkinson [33], and Shier [11] with the 12 salinity-critical mollusks, shown in blue highlight, identified in this study of the Barfield Bay mollusk population. The species in Red type are Critical Mollusks in the Barfield Bay mollusk population; the species in yellow type is the second-most abundant in the Barfield Bay population. Parastarte triquetra, the most abundant species in the Barfield Bay population is not identified by Scholl [32] or Shier [11], however, Parkinson [33] comments that is everywhere and in the vast majority of his samples. Note that 6 of the 13 salinity-critical mollusks of this study were placed in the Open Ocean Shoreface environment by Scholl [32], 6 by Parkinson [33], and 3 by Shier [11]. A major difference between these three “classic” studies and this one of Barfield Bay is the placement of Transennella conradina (stenohaline in the uppermost 5 psu units of the polyhaline category); 1) Scholl [32] puts it in the Ten Thousand Island environment, 2) Shier [11] places it in the bottoms of tidal channels, and 3) Parkinson [32] doesn’t identify it anywhere.
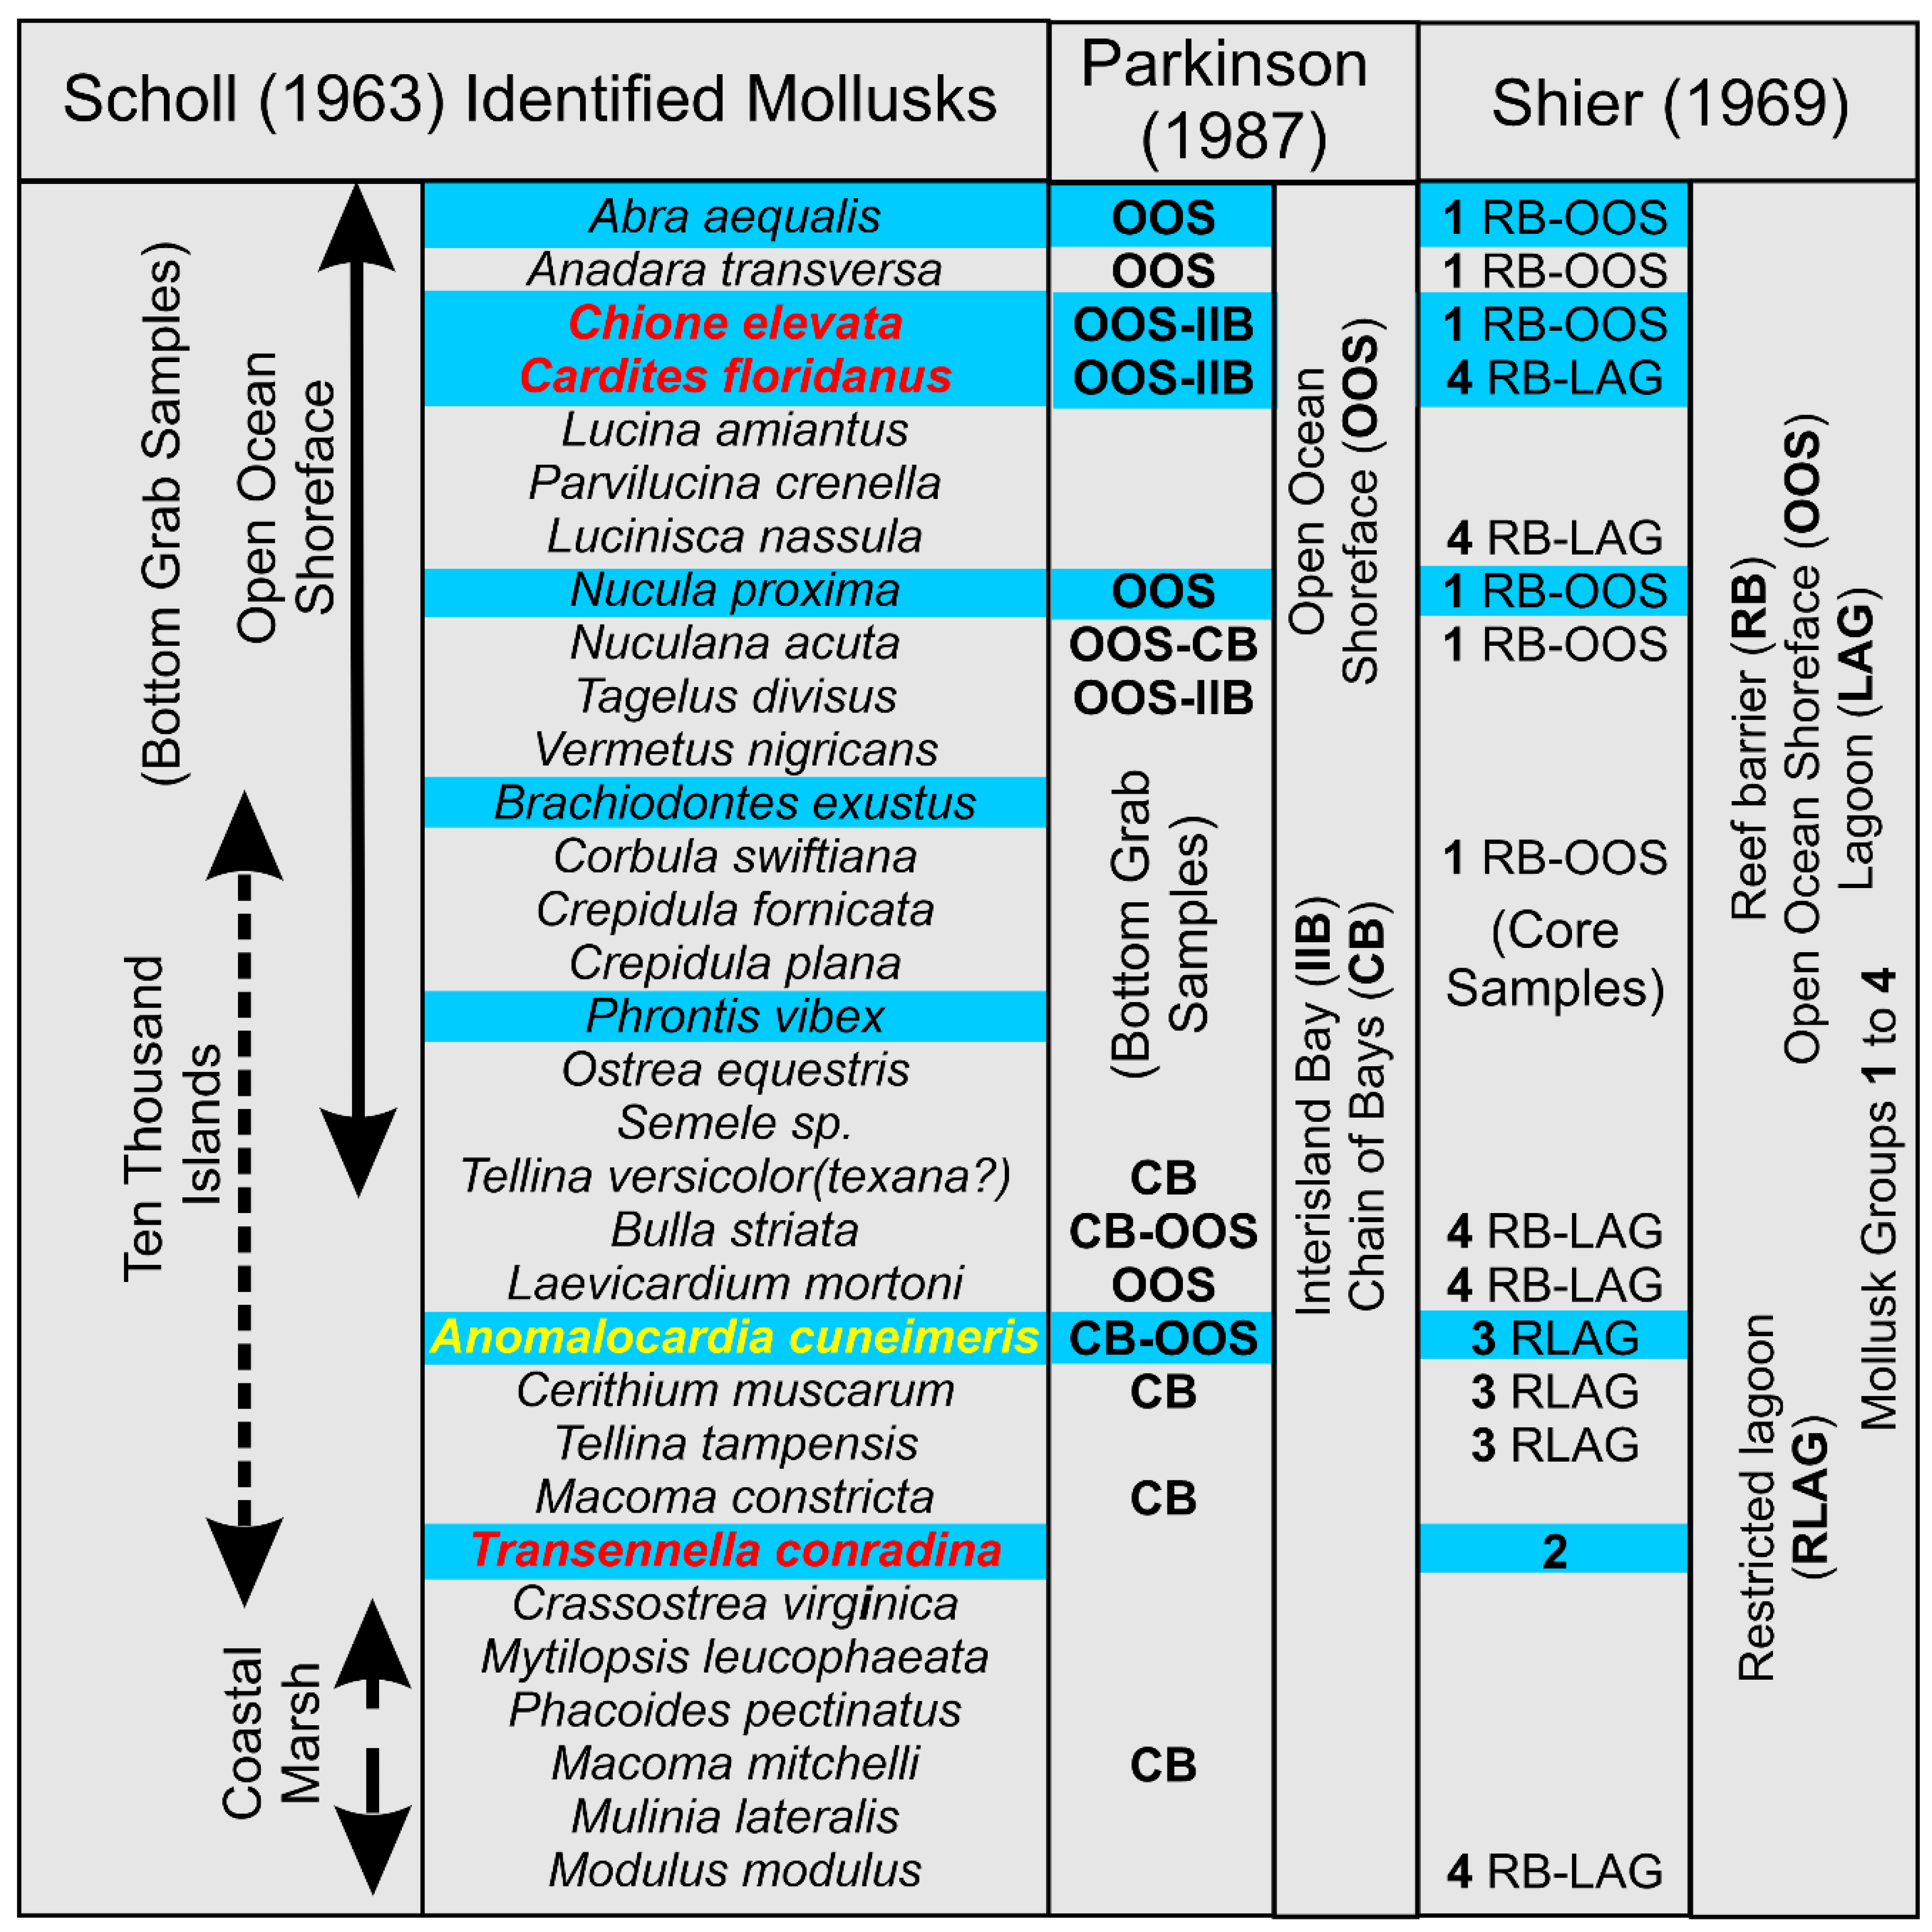
Figure A7.
Mollusks identified in Core 0706-19 of Hoye [34]. The six mollusks high-lighted in blue are in the set of salinity-critical species identified in the Barfield Bay and Caxambas Pass mollusk populations. These six common species indicate that the paleo-salinity of the subtidal region during deposition of the Core 0706-19 fossiliferous packstone was essentially equal to that of Barfield Bay/Caxambas Pass during the deposition its siliciclastic sediment-fill.
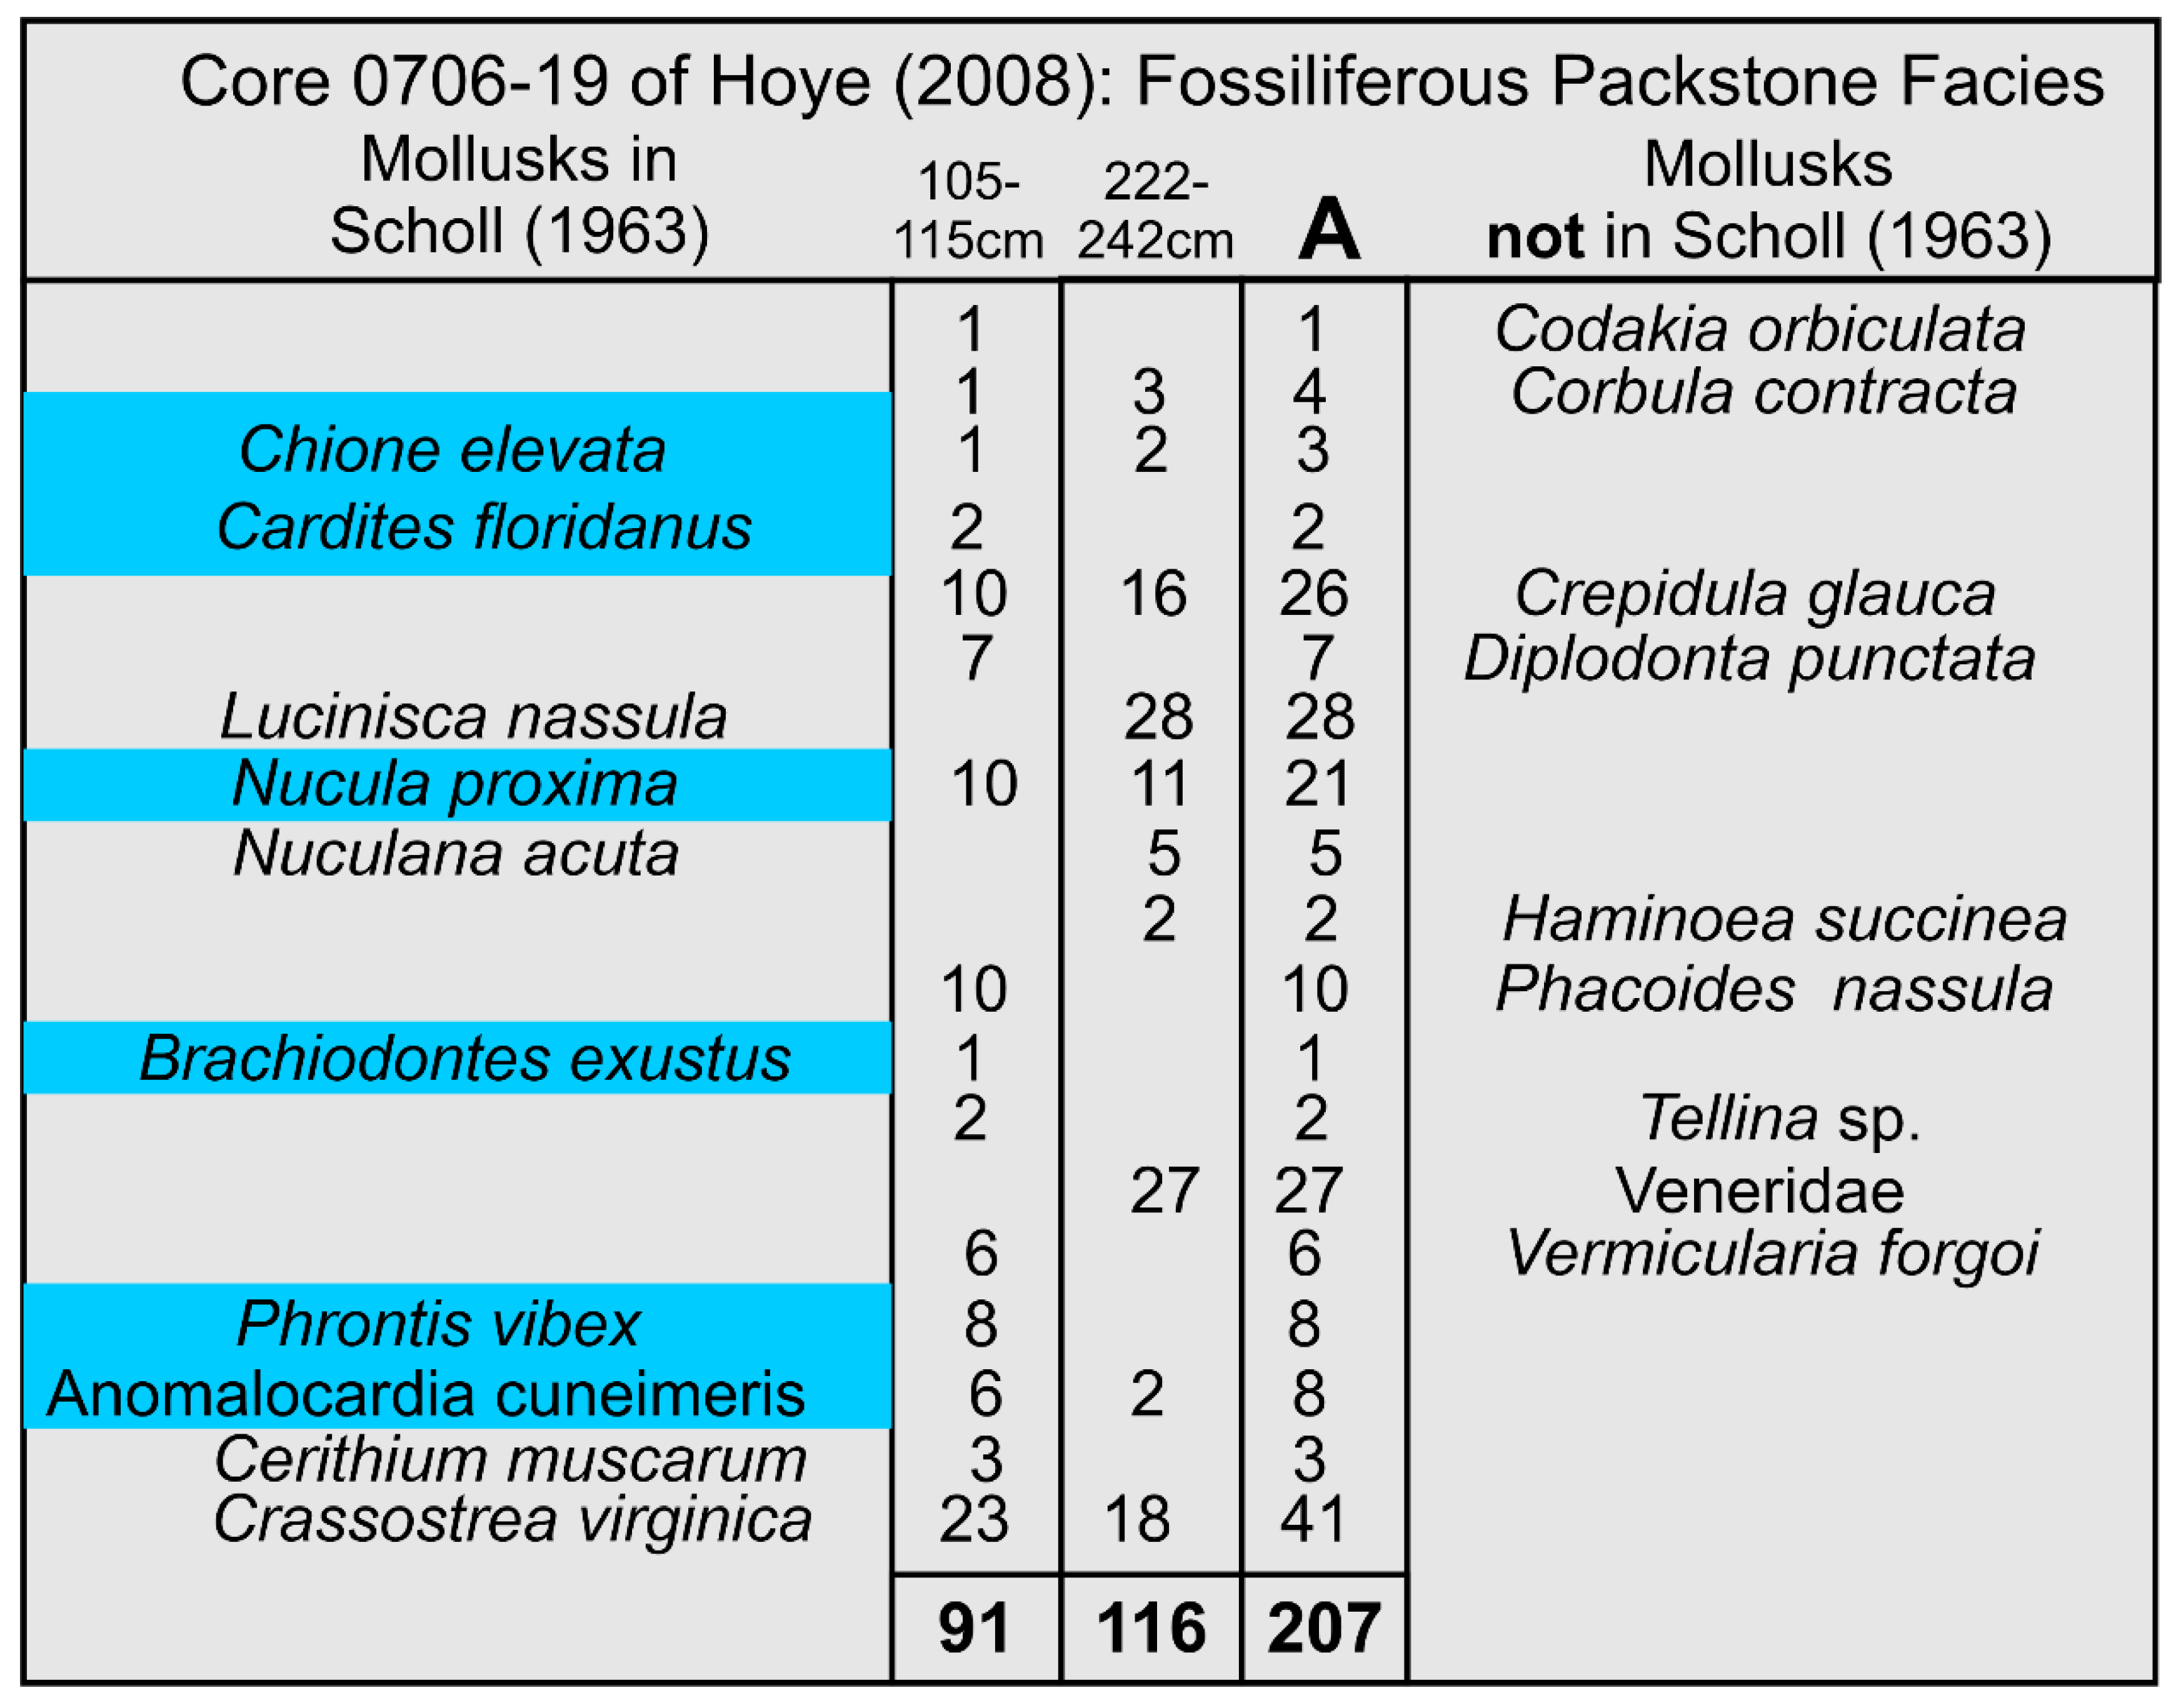
References
- Balsillie, J. H., Donoghue, J. F., Butler, K., and Koch, J. L., 2002, Plotting Equation for Gaussian Percentiles and a Spreadsheet Program for Generating Probability Plots, Journal of Sedimentary Research, V. 72, No. 6, P. 929–943. [CrossRef]
- Clark, I., 1977, ROKE, A Computer Program for Nonlinear Least-squares Decomposition of Mixtures of Distributions, Computers & Geosciences, V. 3, pp. 245-256. [CrossRef]
- Khan, N. S., Ashe E, Moyer, R. P., Kemp, A. C., Engelhart, S. E., Brain, M., J., Toth, L.T, Chappel, A, Christie, M., Kopp, R. E., Horton, B. P., 2022, Relative sea level change in South Florida during the past ~5000 years. Global and Planetary Change. Sep 1; 216:103902.
- United States Geological Survey, 1995, Marco Island, Florida quadrangle, 1:24000 scale, 7.5- minute series: Reston, VA., US Dept. of the Interior, USGS, 1995, https://usgs.gov/programs/national-geospatial-program/topographic-maps, last accessed on June 2025.
- U.S. Dept. of Commerce (USDC), 2023b, Nautical Chart USFL1JT (Gordon Pass to Gullivan Bay, 1:40000), https://nauticalcharts.noaa.gov, last accessed on August 2023.
- US Coast and Geodetic Survey, 1927, Cape Romano and Coon Key to Little Marco Pass, Aerial Photographic Surveys, Register Numbers 4371 and 4372, Scale 1:20,000: US Dept. of Commerce (USDC), NOAA Historic Maps and Charts.
- U.S. Dept. of Commerce (USDC), 2023a, NOAA Tide Predictions (Marco Island, Caxambas Pass, Florida, Station 8724967), https://tidesandcurrents.noaa.gov/noaatidepredictions.html?id=8721649, last accessed on August 2023.
- Appendini, C. M, Torres-Freyermuth, A., Salles, P., Lopez-Gonzalez, Mendoza, E. T., 2014, Wave Climate and Trends for the Gulf of Mexico: A Thirty-yr Wave Hindcast: Journal of Climate, v. 27, p. 1619-1632.
- Thompson, E. F., 1977, Wave climate along selected portions of US Coasts: Technical Report 77-1, Coastal Engineering Research Center, U. S. Army Corps of Engineers, 364p.
- Missimer, T. M., 2002, Late Oligocene to Pliocene Evolution of the Central Portion of the South Florida Platform: Mixing of Siliciclastic and Carbonate Sediments: Florida Geologic Survey Bulletin 65, 184 p.
- Shier, D. E., 1969, Vermetid reefs and coastal development in the Ten Thousand Islands, southwest Florida: Bulletin of the Geological Society of America, v. 80, p. 485-508. [CrossRef]
- Sussko, R. J. and Davis, R. A., 1992, Siliciclastic-to-carbonate transition on the inner shelf embayment southwest Florida, southwest Florida: Marine Geology, v. 107, p. 51-70. [CrossRef]
- Force, L., 1969, Calcium carbonate size distribution on the West Florida Shelf and experimental studies on the microarchitectual control of skeletal breakdown, Jour. Sed. Pet., vol. 39, p. 902-934.
- Barron, E. J., 1976, Suspended Sedimentation Processes, Marco Island, Florida: unpublished MS thesis, Univ. of Miami, Rosenstiel School of Marine and Atmospheric Sciences, 177p.
- Muhs, D. R., Budahn, J. R., Prospero, J. M., and Carey, S. N., 2007, Geochemical evidence for African dust inputs to soils of western Atlantic islands: Barbados, the Bahamas, and Florida, Journal of Geophysical Research, v. 112, FO2009. [CrossRef]
- Hrdlicka, A., 1922, Anthropology of Florida, Publications of the Florida State Historical Society, No. 1, p. 21-22.
- Cockrell, W. A., 1970, Glades I and Pre-Glades settlement and subsistence patterns on Marco Island (Collier County, Florida), unpublished MS Thesis, Florida State University.
- Widmer, R. J., 1988, The Evolution of the Calusa: A Nonagricultural Chiefdom on the Southwest Florida Coast: Univ. of Alabama Press, Tuscaloosa, AL, 334p.
- Russo, M., 1991, Archaic Sedentism on the Florida Coast: A Case Study from Horr’s Island, Ph.D. dissertation, Department of Anthropology, University of Florida, Gainesville.
- Durnford, C. D., 1895, The discovery of aboriginal netting, rope, and wood implements in a muck deposit in west Florida. American Naturalist 29, 1032-1039.
- Van Beck, J. C. and Van Beck, L. M., 1965, The Marco Midden, Marco Island, Florida. The Florida Anthropologist, 16:1-20.
- Carr, R. S. and Beriault, J. G., 2014, Archaeological Monitoring of Utility Trenching, North Marco Island, Collier County, Florida. Archeological and Historical Conservancy Technical Report No. 908 for the North Marco Utility Company.
- Jenkins and Charland, 1989, Diagram of soil borings, Blue Hill Creek Bridge, Key Marco Developments. Consulting Engineers, 12381 Cleveland Ave., Suite 204, Ft. Myers, Florida 33907.
- Folk, R. L., 1973, Evidence for peritidal deposition of Devonian Caballos Novaculite, Marathon Basin, Texas. American Association of Petroleum Geologists, Vol. 57, pp. 702-725. Krumbein, W. C., 1934, Size frequency distribution of sediments: Jour. Sed. Petrology, vol. 4, p. 65-77.
- Krumbein, W. C.,1937, Sediments and exponential curves: Jour. Geol., v. 45, p. 577-601.
- Krumbein, W. C., 1938, Size frequency distributions and the normal phi curve: Jour. Sedimentary Petrology, v. 8, p. 84-90.
- Shannon, C. E. 1948. A mathematical theory of communication. Bell Syst. Tech. J., v.27, No. 3, pp 379-423.
- Simpson, E. H., 1949, Measurement of diversity, Nature, v. 168, no. 4148, p. 688.
- Pielou, E. C., 1966, The measurement of diversity in different types of biological collections: Journal of Theoretical Biology, v. 13, p. 131-144.
- Wingard, G. L., Stackhouse, B. M., Daniels, D. M., 2022, Using mollusks as indicators of restoration in nearshore zones of south Florida’s estuaries, Bull. Mar. Science, v. 98, no. 3, p. 351-380. [CrossRef]
- Wingard, G. L. and Stackhouse, B. M., 2023, Salinity data for selected mollusks, personal communication.
- Scholl, D.W., 1963. Sedimentation in modern coastal swamps, southwestern Florida. AAPG Bulletin, 47(8), pp.1581-1603. [CrossRef]
- Parkinson, R.W., 1987. Holocene sedimentation and coastal response to rising sea level along a subtropical low energy coast, Ten Thousand Islands, southwest Florida. Ph.D. Thesis, Univ. Miami, Fla., 224 pp.
- Hoye, B. R., 2009, Holocene history of the coastal geomorphology of Everglades National Park: the roles of reef development, tidal pond formation, and sea level rise, Unpublished MS thesis, Florida Gulf Coast Univ., Ft. Myers, FL: pp 211.
- Poag, C. W., 2015, Benthic foraminifera of the Gulf of Mexico: Distribution, Ecology, Paleoecology, Texas A&M University Press, College Station, Texas, pp. 79-189.
- Benda, W. K. and Puri, H. S., 1962, The Distribution of Foraminifera and Ostracoda Off the Cape Romano Area, Florida. Transactions of the Gulf Coast Association of Geological Societies, vol. 12, pp. 303-341.
- Heaton TJ, Köhler P, Butzin M, Bard E, Reimer RW, Austin WE, Ramsey CB, Grootes PM, Hughen KA, Kromer B, Reimer PJ. 2020. Marine20—the marine radiocarbon age calibration curve (0–55,000 cal BP). Radiocarbon, Aug 1:1-42.
- Hayes, M.O., 1976. Lecture Notes. In: Hayes, M.O. and Kana, T.W.,1976. Terrigenous Clastic Depositional Environments. Technical Report 11-CRD, Columbia, South Carolina: Geology Department, University of South Carolina, pp. 1-1-1-117.
- Hayes, M.O. and FitzGerald, D.M., 2013. Origin, Evolution, and Classification of Tidal Inlets. In: Kana, T.; Michel, J., and Voulgaris, G. (eds.), Proceedings, Symposium in Applied Coastal Geomorphology to Honor Miles O. Hayes, Journal of Coastal Research, Special Issue No. 69, 14–33. Coconut Creek (Florida), ISSN 0749-0208.
- Parkinson, R. W., 1991. Geologic evidence of net onshore sand transport throughout the Holocene marine transgression, southwest Florida: Marine Geology, v. 96, pp. 269-277. [CrossRef]
- Davis, R. A. Jr., Klay, J., and Jewel, P. IV, 1993: Sedimentology and stratigraphy of tidal sand ridges, southwest Florida Inner Shelf, Jour. Sedimentary Petrology, v. 63, no. 1, p. 91-104.
- Duggins, Ryan M. and Franklin H. Price, 2016, A drowned prehistoric burial site in the Gulf of Mexico. Paper presented at the 73rd Annual Meeting of the Southeastern Archaeological Conference, Athens, Georgia.
- Duggins, Ryan M., Franklin H. Price, Melissa R. Price, Ivor R. Mollema, and Neil N. Puckett, 2018, Manasota Key Offshore: A Prehistoric Cemetery in the Gulf of Mexico. Paper presented at the 51st Annual Meeting of the Society for Historical Archaeology, New Orleans.
- Duggins, Ryan M. and Heather Walsh-Haney, 2022, Inundated Wet-Site Archaeology: Manasota Key Offshore and the Future of Submerged Precontact Archaeology on the Continental Shelf. Paper Presented at the 87th Annual Meeting of the Society for American Archaeology Conference, Chicago, Illinois.
- Rodrigues, K., Stapor, F.W., Rink, W.J., Dunbar, J.S. and Doran, G., 2022. A 5700-year-old beach-ridge set at Cape Canaveral, Florida, and its implication for Holocene sea level history in the southeastern USA. The Holocene, 32(1-2), pp.40-56.
- Hawkes, A.D., Kemp, A.C., Donnelly, J.P., Horton, B.P., Peltier, W.R., Cahill, N., Hill, D.F., Ashe, E. and Alexander, C.R., 2016. Relative sea level change in northeastern Florida (USA) during the last∼ 8.0 ka. Quaternary Science Reviews, 142, pp.90-101.
- Scholl, D.W., Craighead Sr, F.C. and Stuiver, M., 1969. Florida submergence curve revised: its relation to coastal sedimentation rates. Science, 163(3867), pp.562-564.
- Stapor, F. W., Jr., Mathews, T. D., and Lindfors-Kearns, F. E., 1991, Barrier-island progradation and Holocene sea level history in Southwest Florida: Journal of Coastal Research, v. 7, no. 3, p. 815-838.
- Blum, M. D. Sivers, A. E., Zayac, T., Goble, R. J., 2003. Middle Holocene Sea level and Evolution of the Gulf of Mexico Coast: Transactions of the Gulf Coast Association of Geological Societies, vol. 53, pp. 64-77.
- Hadden, C. S. and Schwadron, M., 2019, Marine Reservoir Effects in Eastern Oyster (Crassostrea virginica) from Southwestern Florida, USA. Radiocarbon, 61(5), p.1501-1510. [CrossRef]
- Railsback, L.B., Gibbard, P.L., Head, M.J., Voarintsoa, N.R.G., and Toucanne, S., 2015. An optimized scheme of lettered marine isotope substages for the last 1.0 million years, and the climatostratigraphic nature of isotope stages and substages. Quaternary Science Reviews 111, 94-106. [CrossRef]
- Prouty, W. F. (1952). Carolina Bays and Their Origin: Geological Society of America Bulletin 63 (2), pp. 167-.
- Kaczorowski, R. T. (1977) The Carolina Bays: a Comparison with Modern Oriented Lakes, Technical Report no. 13-CRD, Coastal research Division, Department of Geology, University of South Carolina, Columbia.
- Melosh, H.J., 1989, Impact cratering: A geologic process: New York, Oxford University Press, 245 p.
- Khan, N. S., Ashe, E., Horton, B. J., Dutton, A., Kopp, R. E., Brocard, G., Engelhart, S. E., Hill, D. F., Peltier, W. R., Vane, C. H., Scatena, F. N., 2017, Drivers of Holocene sea-level change in the Caribbean. Quaternary Science Reviews 155:13-36. [CrossRef]
Figure 1.
This diagram shows the general terrestrial ecology of the Barfield Bay region in 1927 [6] prior to its subsequent, extensive, and continual development which began in the1950s. BB refers to Barfield Bay. 1 refers to the Indian Hill transverse dune; 2 refers to the Sand Hill dune (located 25 km north of Marco Island on the mainland); 3 refers to the Barfield Bay parabolic dune; and 4 refers to the Horrs Island transverse dune. JI and IoP refer to Johnson Island and the Isle of Palms, respectively, and KMV refers to the historic Key Marco village.
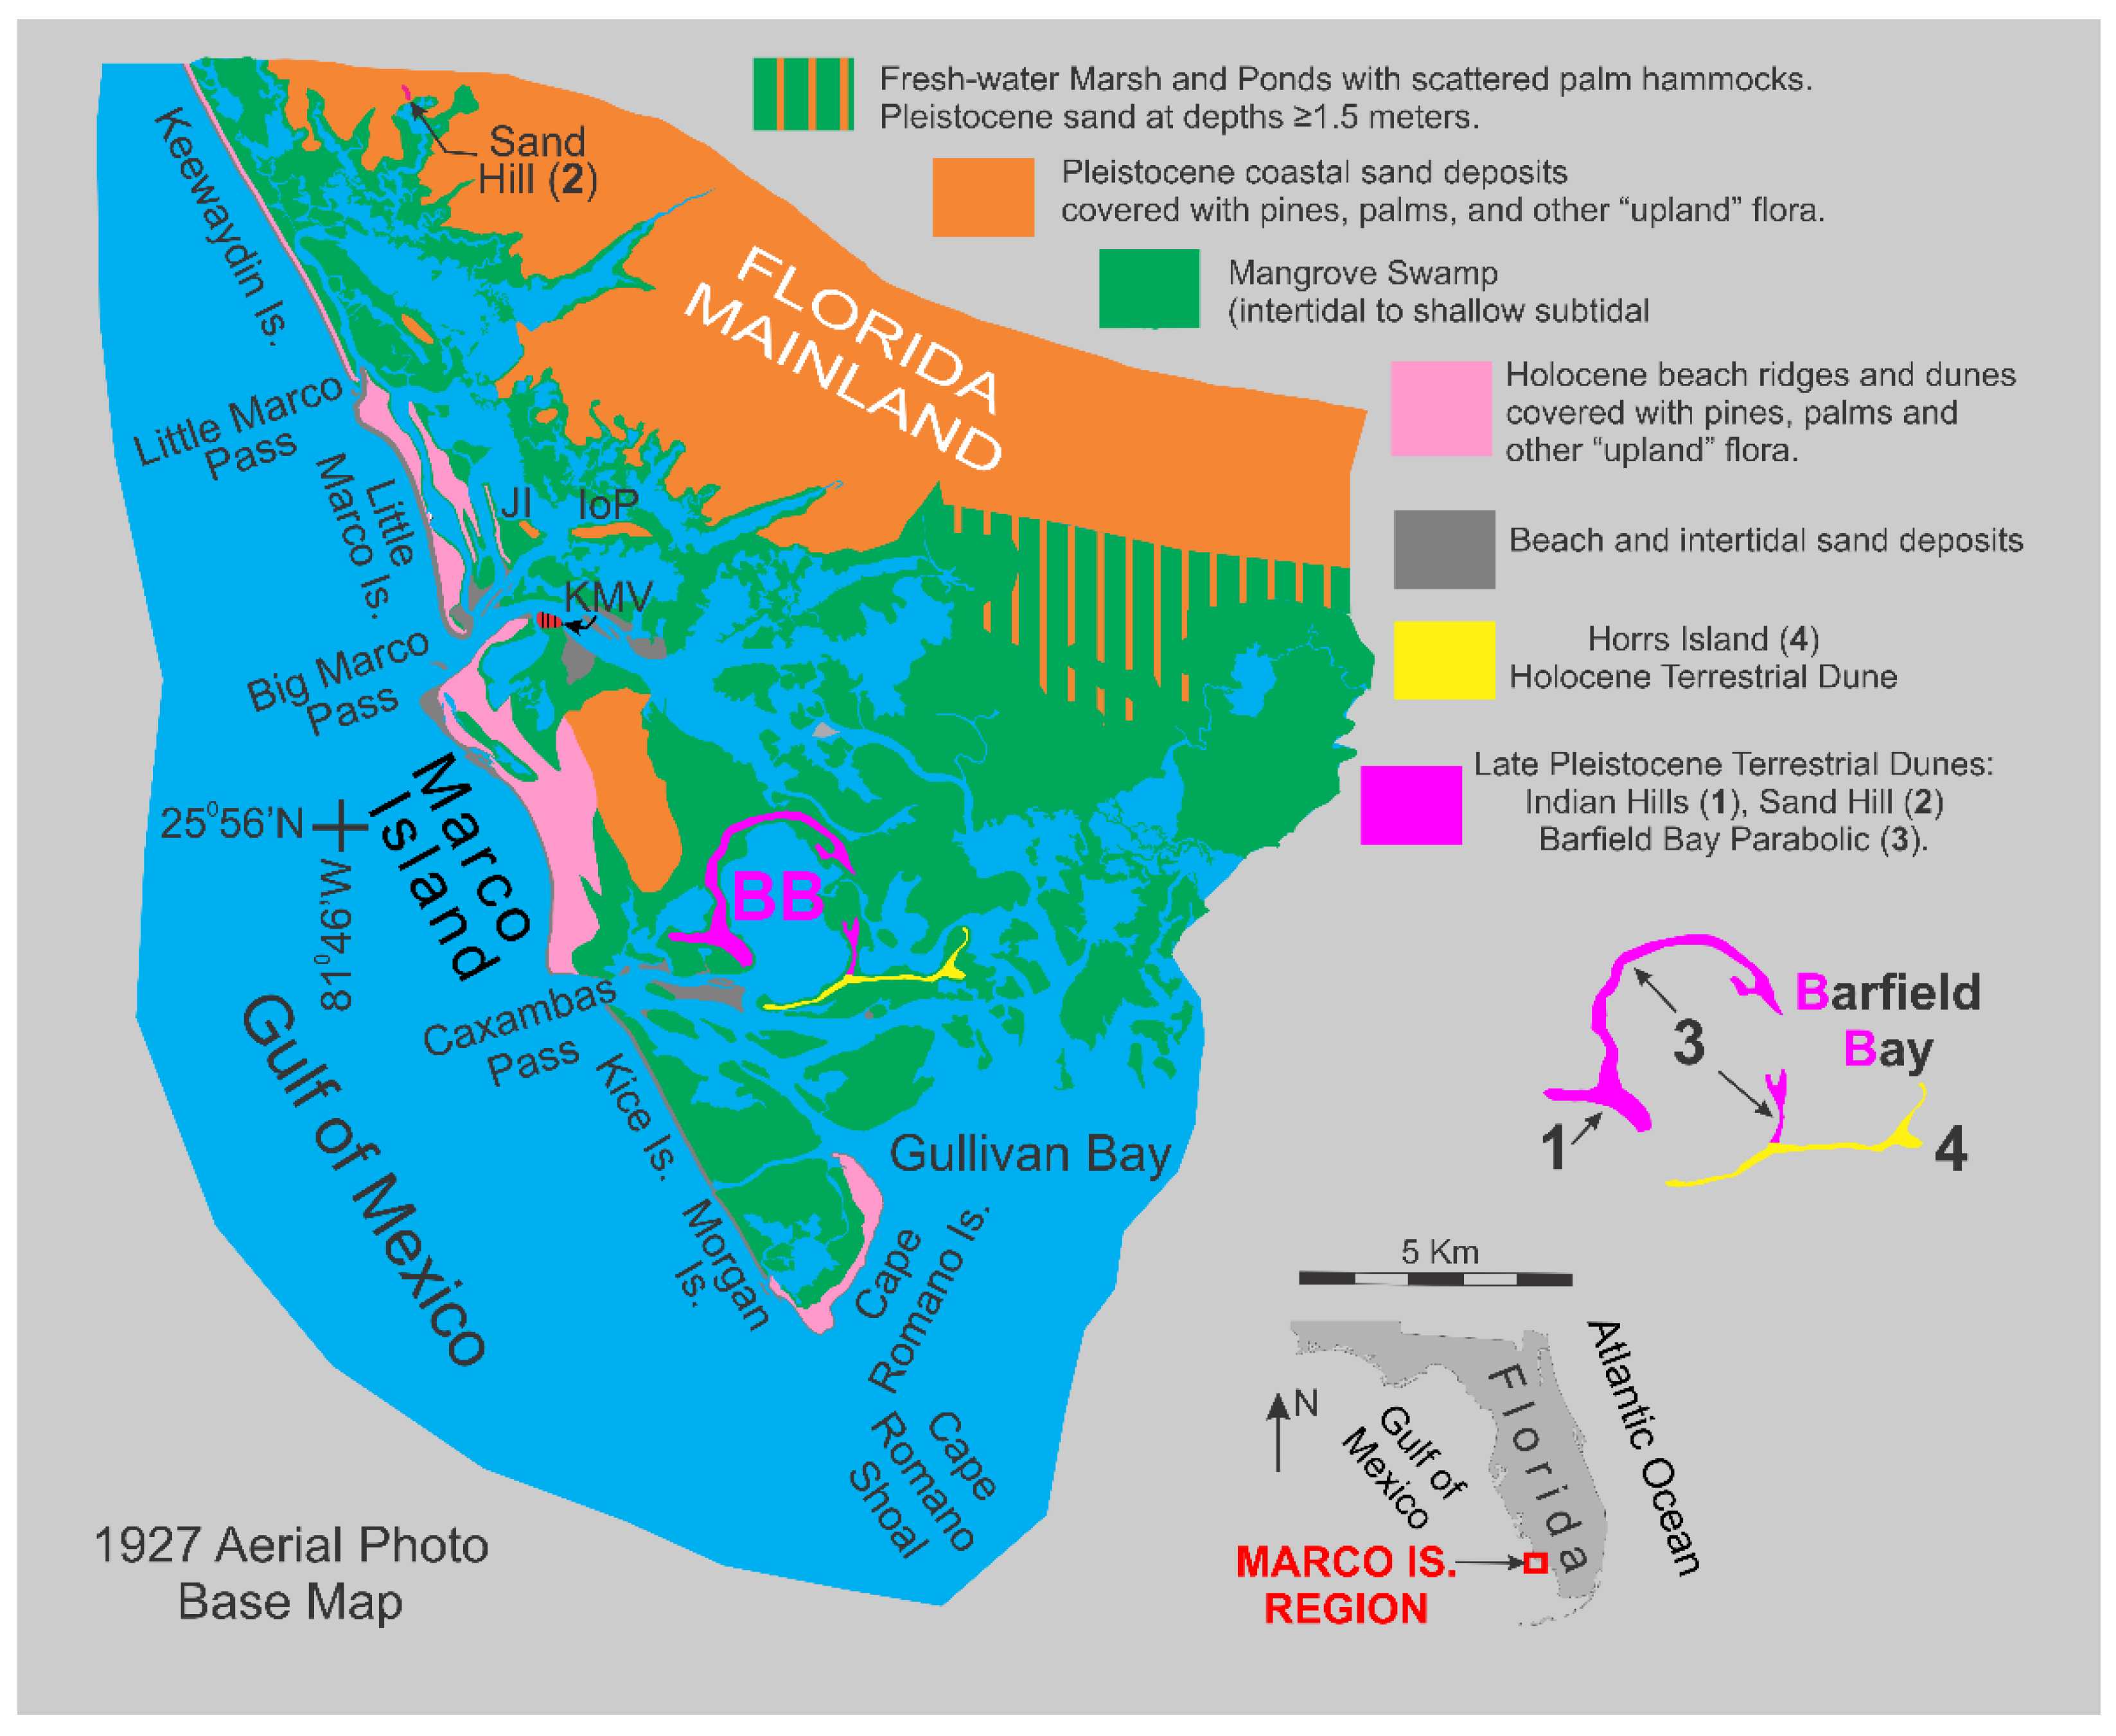
Figure 2.
Detailed map [4] of the Barfield Bay region showing the 5-foot (1.5 meter) contour lines that define the terrestrial aeolian dunes that surround Barfield Bay. The two entrances into the bay are shown by the black letters A and B which identify the flood-dominant, tidal channels of Caxambas Pass and Blue Hill Creek, respectively. Intertidal shoals, shown in light blue, cover some 40% of the bay with the remainder being only 0.3-0.6 meters deep at MLW [5]. The magenta-colored Indian Hill transverse dune and the Barfield Bay parabolic dune are Pleistocene in age, 24,000 and 15,000 years old, respectively. The yellow-colored Horrs Island transverse dune is early Holocene in age, 7800 years old. The orange-colored Marco Island is Pleistocene in age, either a coastal deposit 110,000 years old or, possibly, a late Pleistocene terrestrial aeolian dune formed sometime during the sea level fall after the 110,000-year-old highstand and the 24,000-year-old Indian Hill dune.
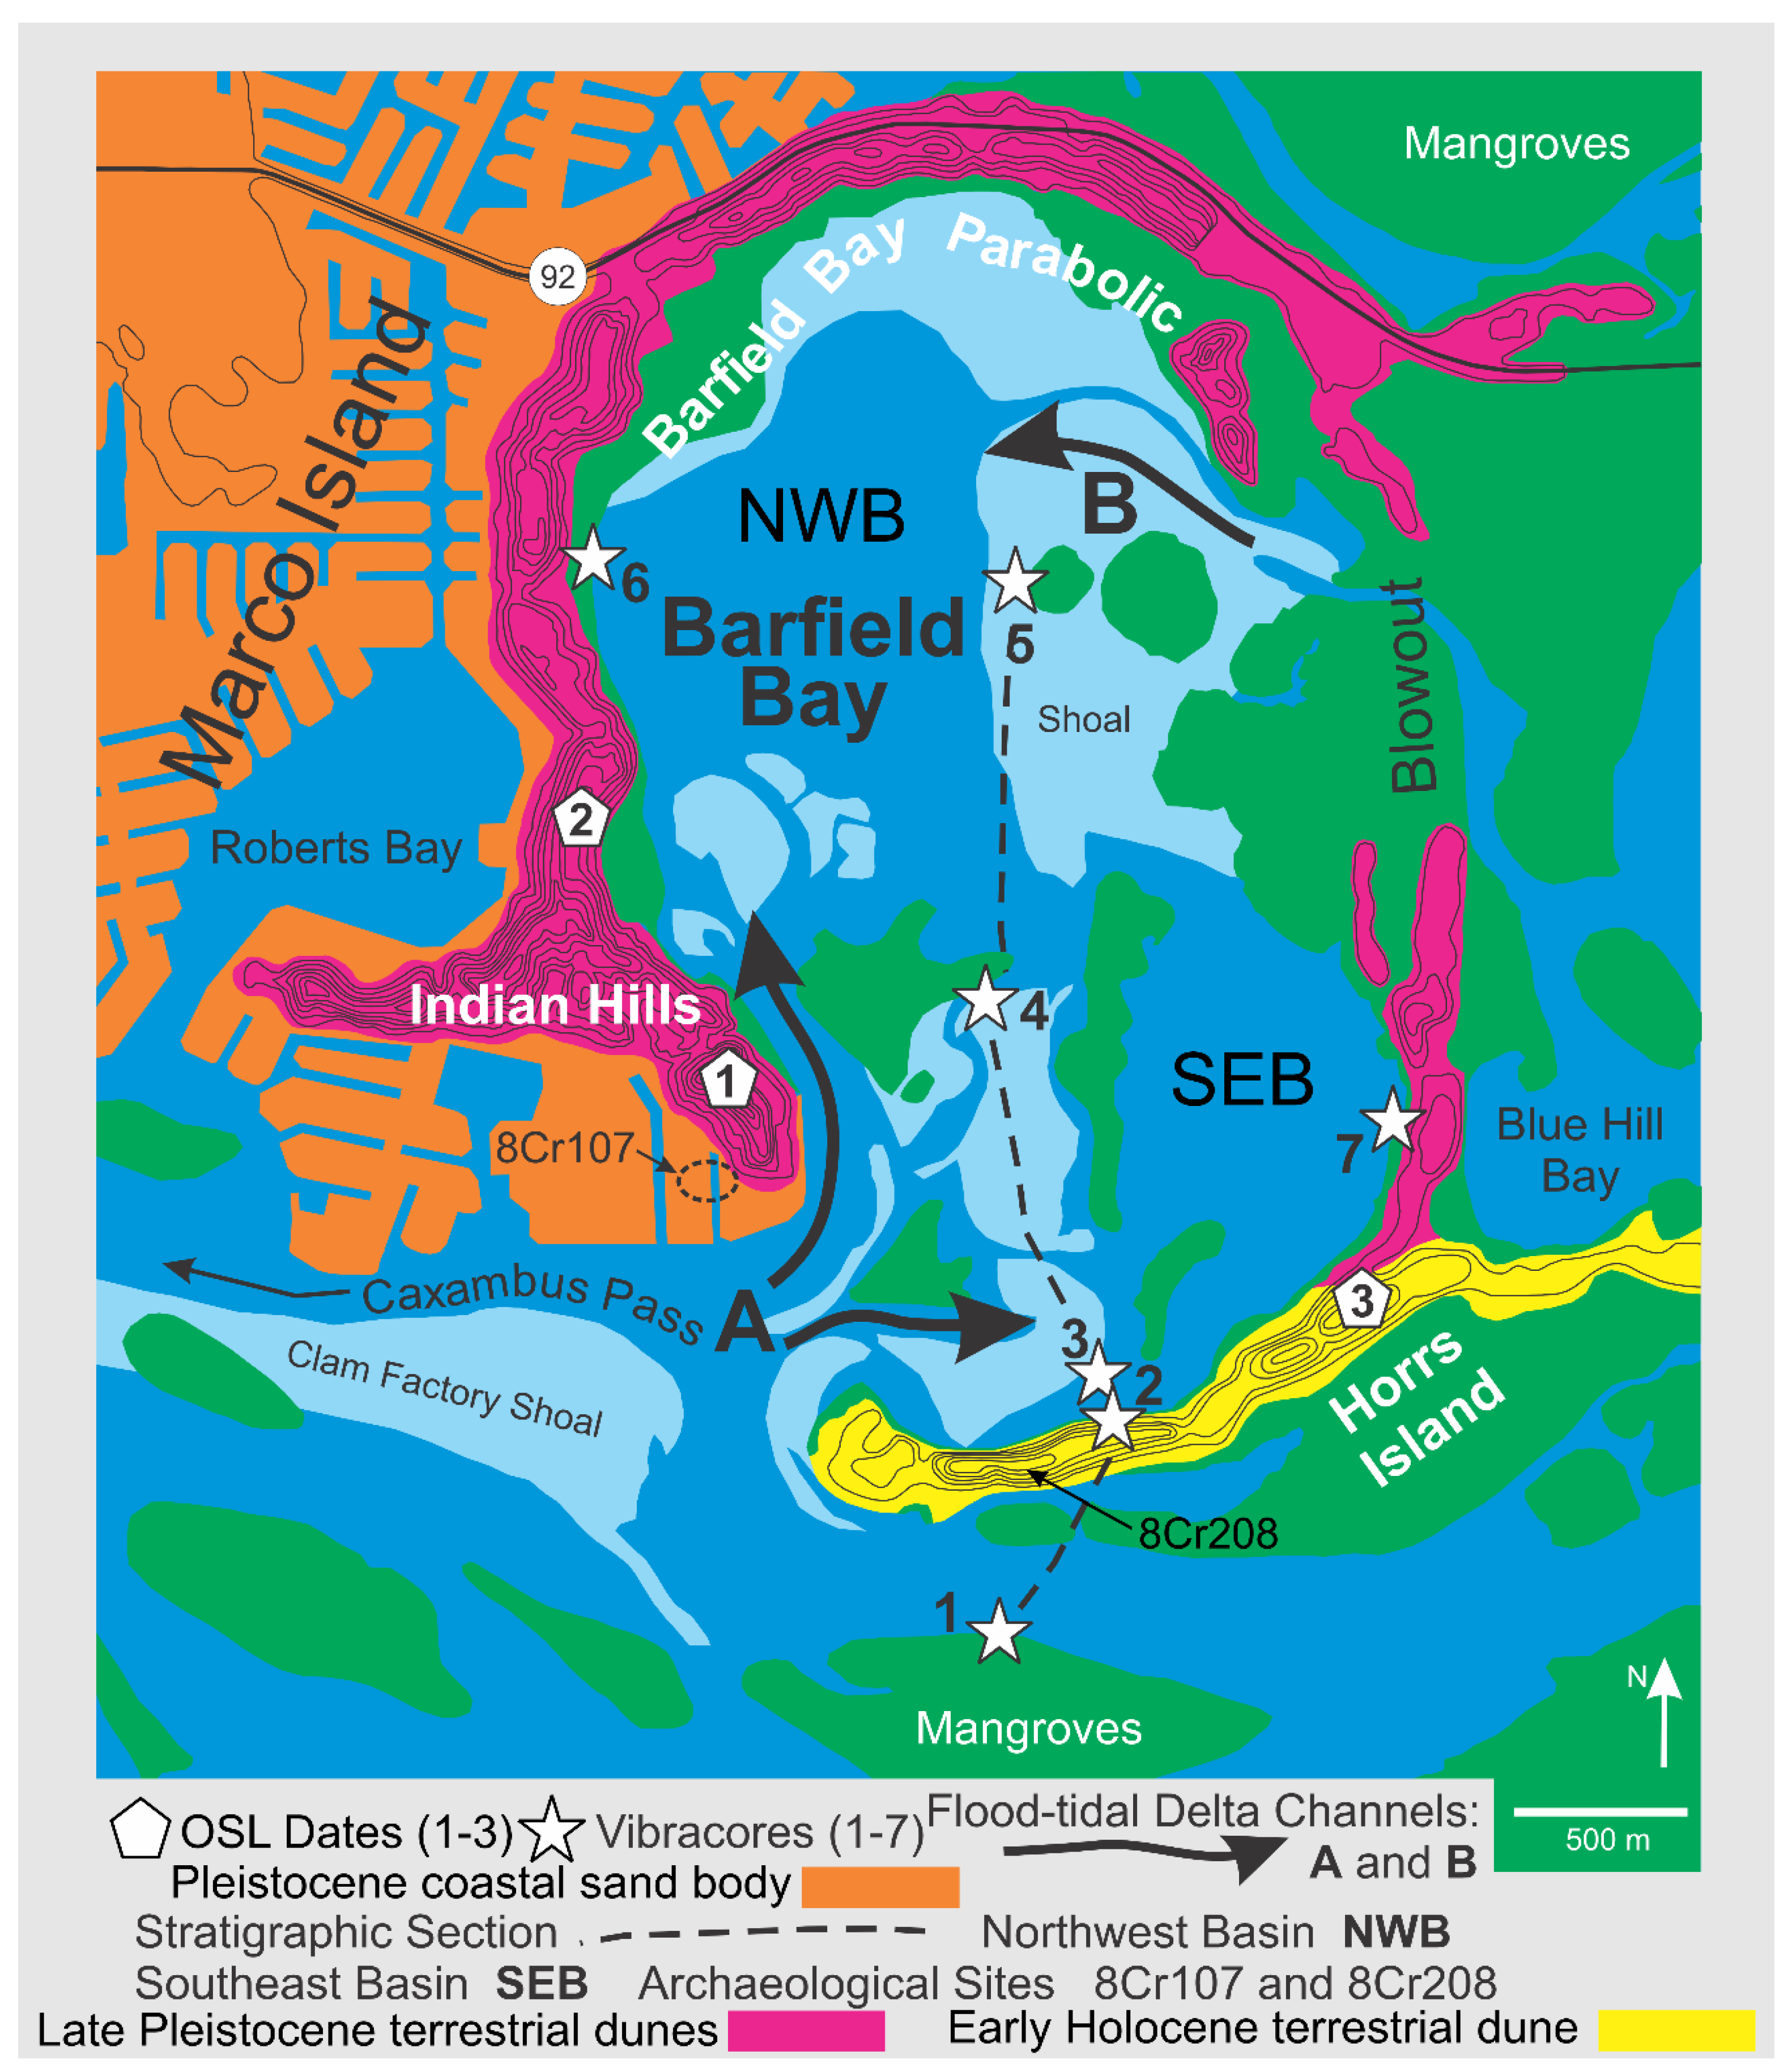
Figure 3.
Panels showing (1) the subsurface data points, (2) a structure contour map of the top of the Tamiami Limestone, (3) an isopach map of the Pleistocene coastal deposits, and (4) an isopach map of the Holocene coastal deposits.
Figure 3.
Panels showing (1) the subsurface data points, (2) a structure contour map of the top of the Tamiami Limestone, (3) an isopach map of the Pleistocene coastal deposits, and (4) an isopach map of the Holocene coastal deposits.
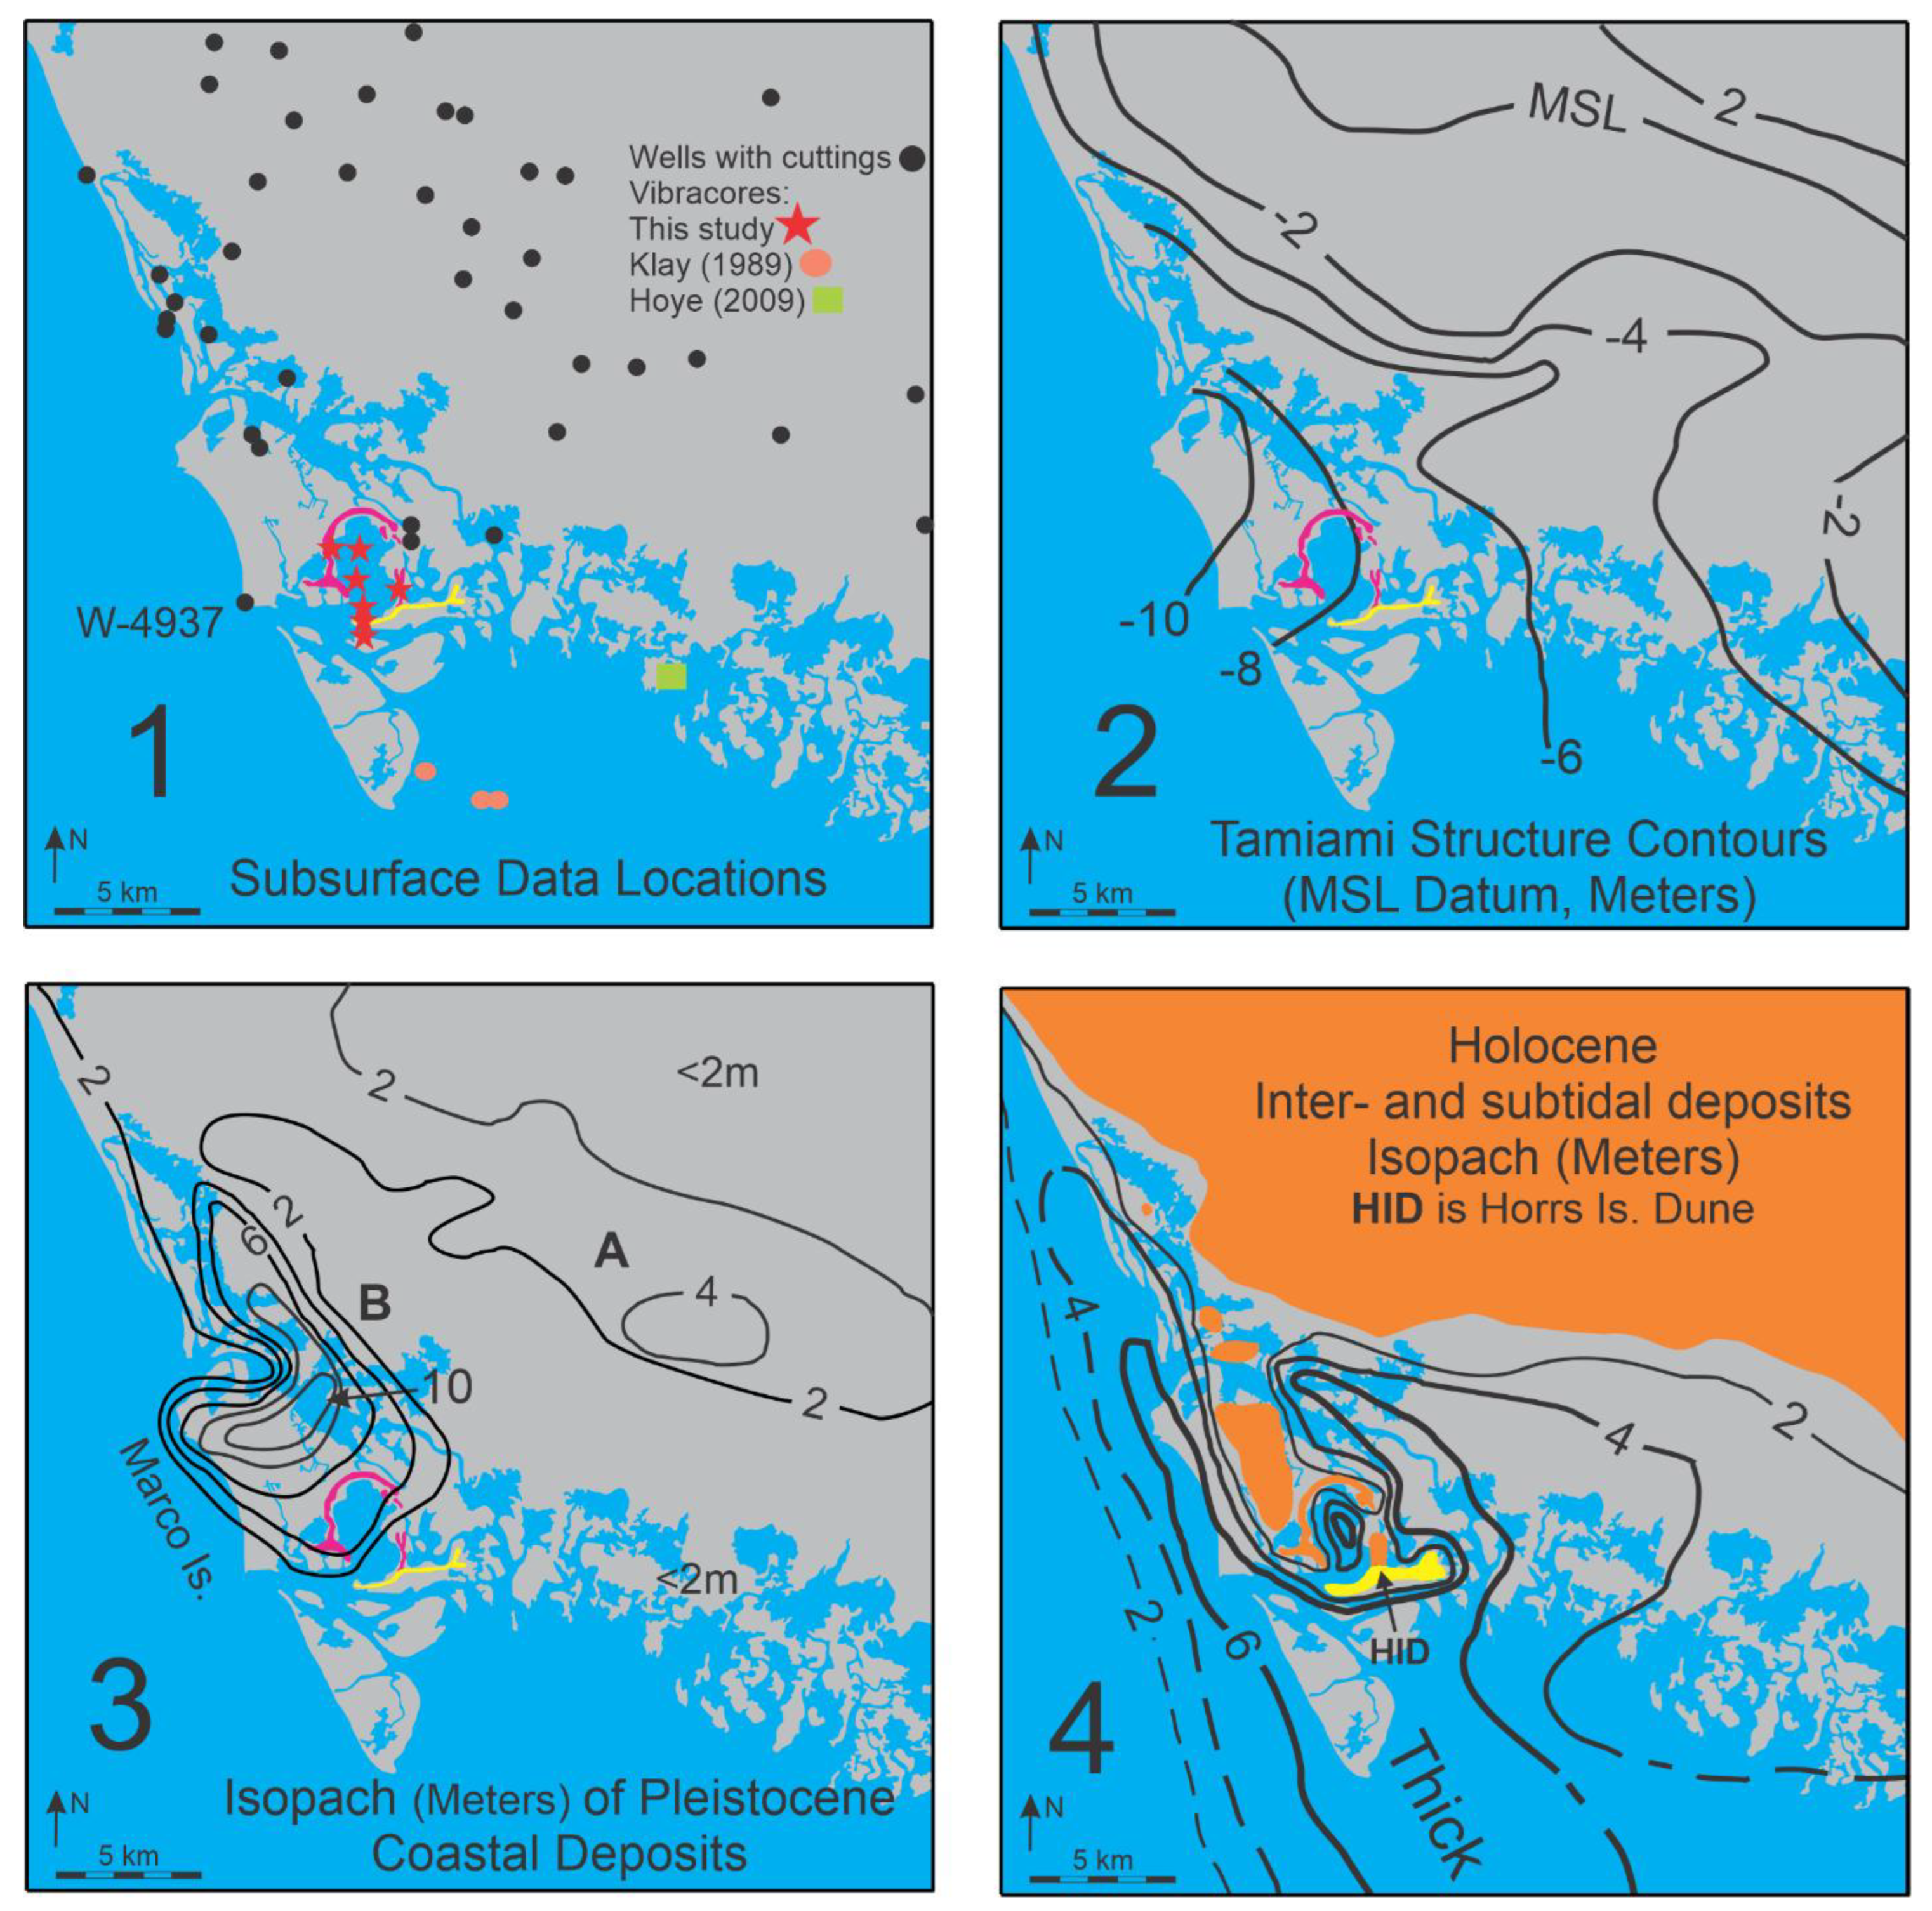
Figure 4.
A. The basic OSL data for the terrestrial aeolian dunes (Indian Hill Transverse, Barfield Bay Parabolic, and the Horrs Island Transverse) that surround Barfield Bay. In addition, the basic data are provided for the Sand Hill Transverse dune, Figure 1. These analyses were done at Illinois Geological Survey OSL laboratory. B. Chronological deposition of the three aeolian dunes that surround Barfield Bay, based on OSL dating of sand samples taken from the respective crests. Notice that thousands of years separate each interval of dune deposition. The open arrows show the sand transport directions for the three dunes. C. A stratigraphic cross section across Blue Hill Creek on the eastern side of Barfield Bay where the intermittent eastern limb of the parabolic dune is located. Note the lack of Pleistocene sand deposits on the southern half of the section. This suggests that the Pleistocene sand deposits in the Barfield Bay region may not completely cover either the silty clay regolith with limestone clasts or the Tamiami Limestone itself.
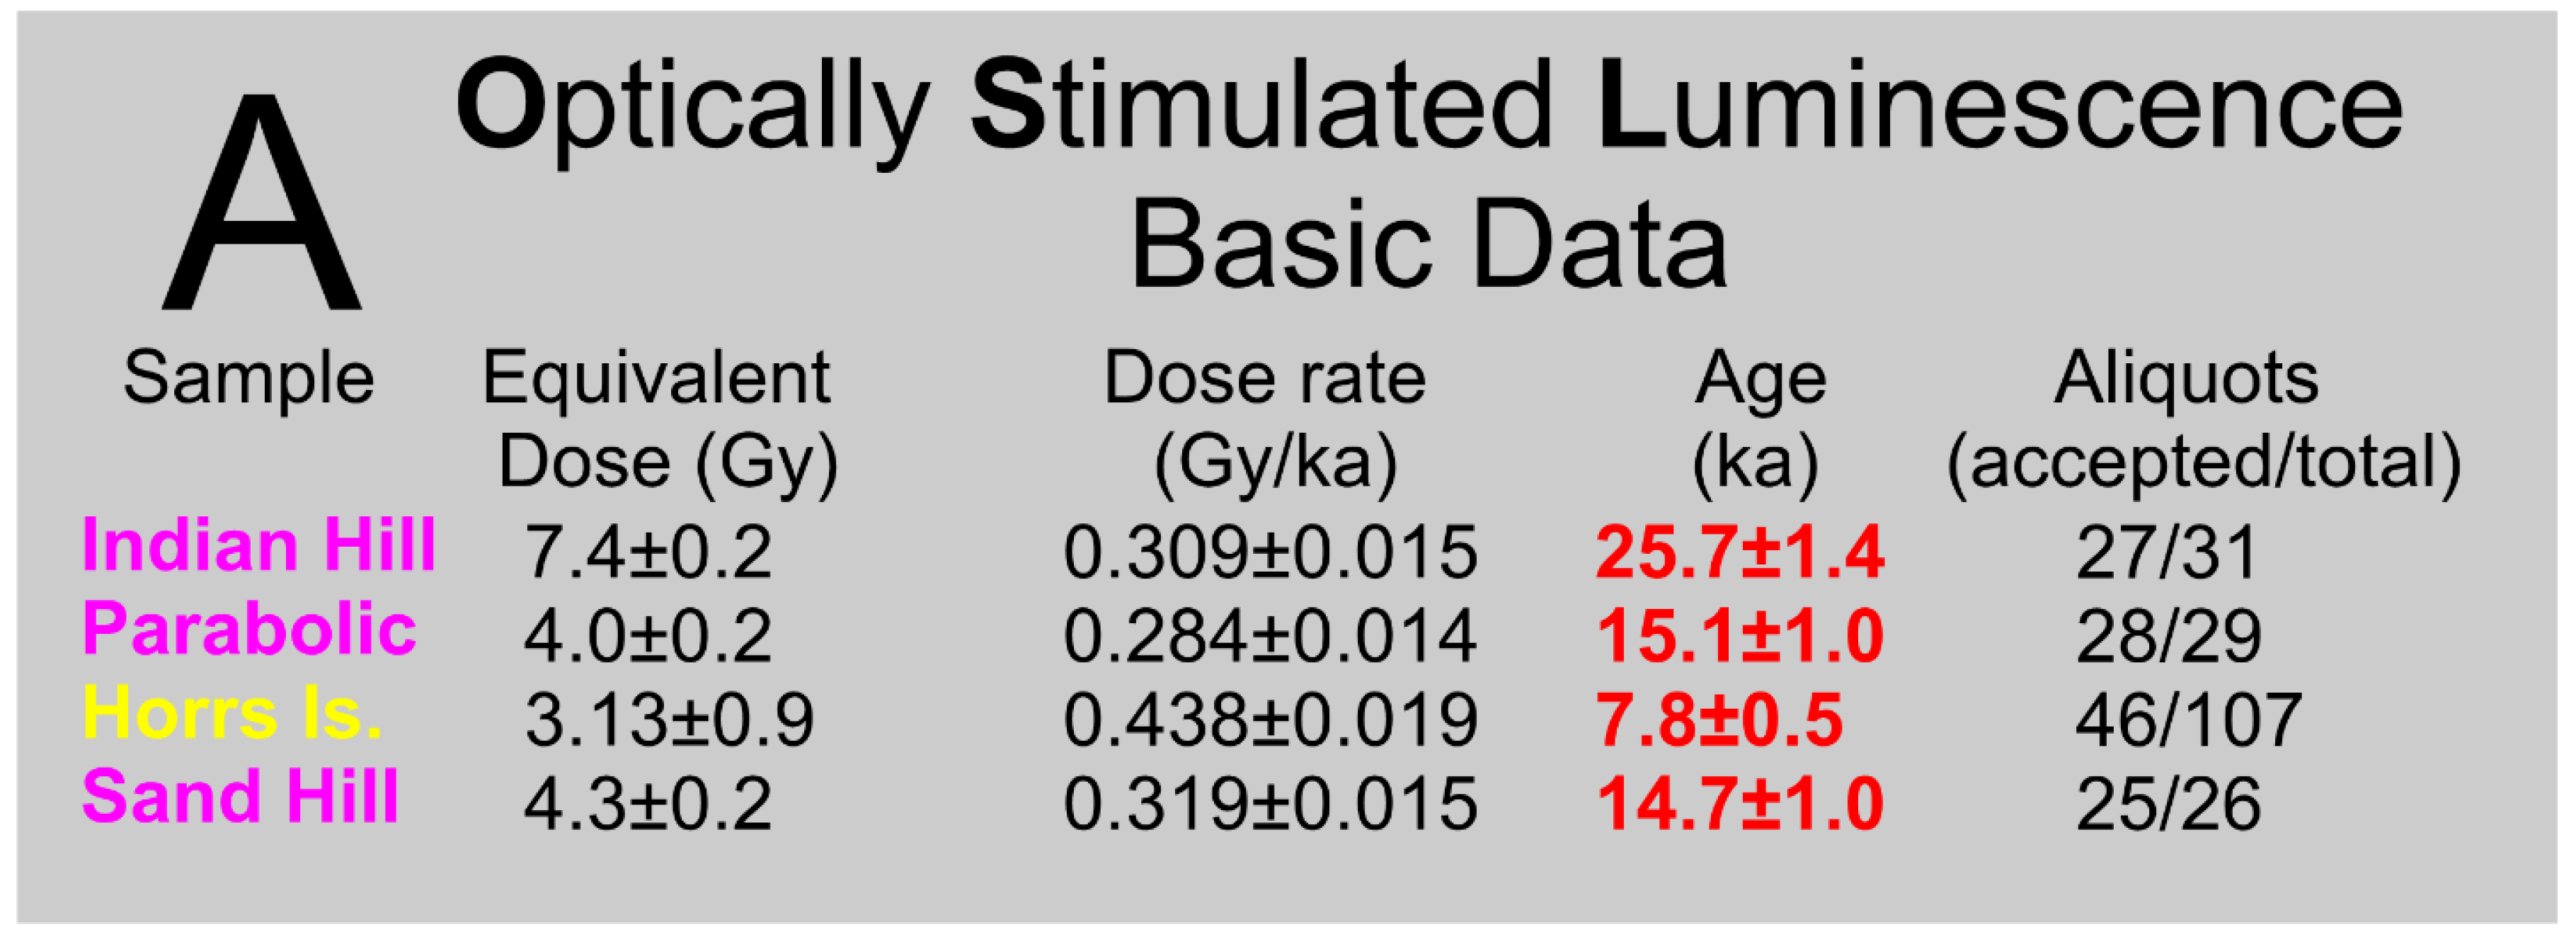
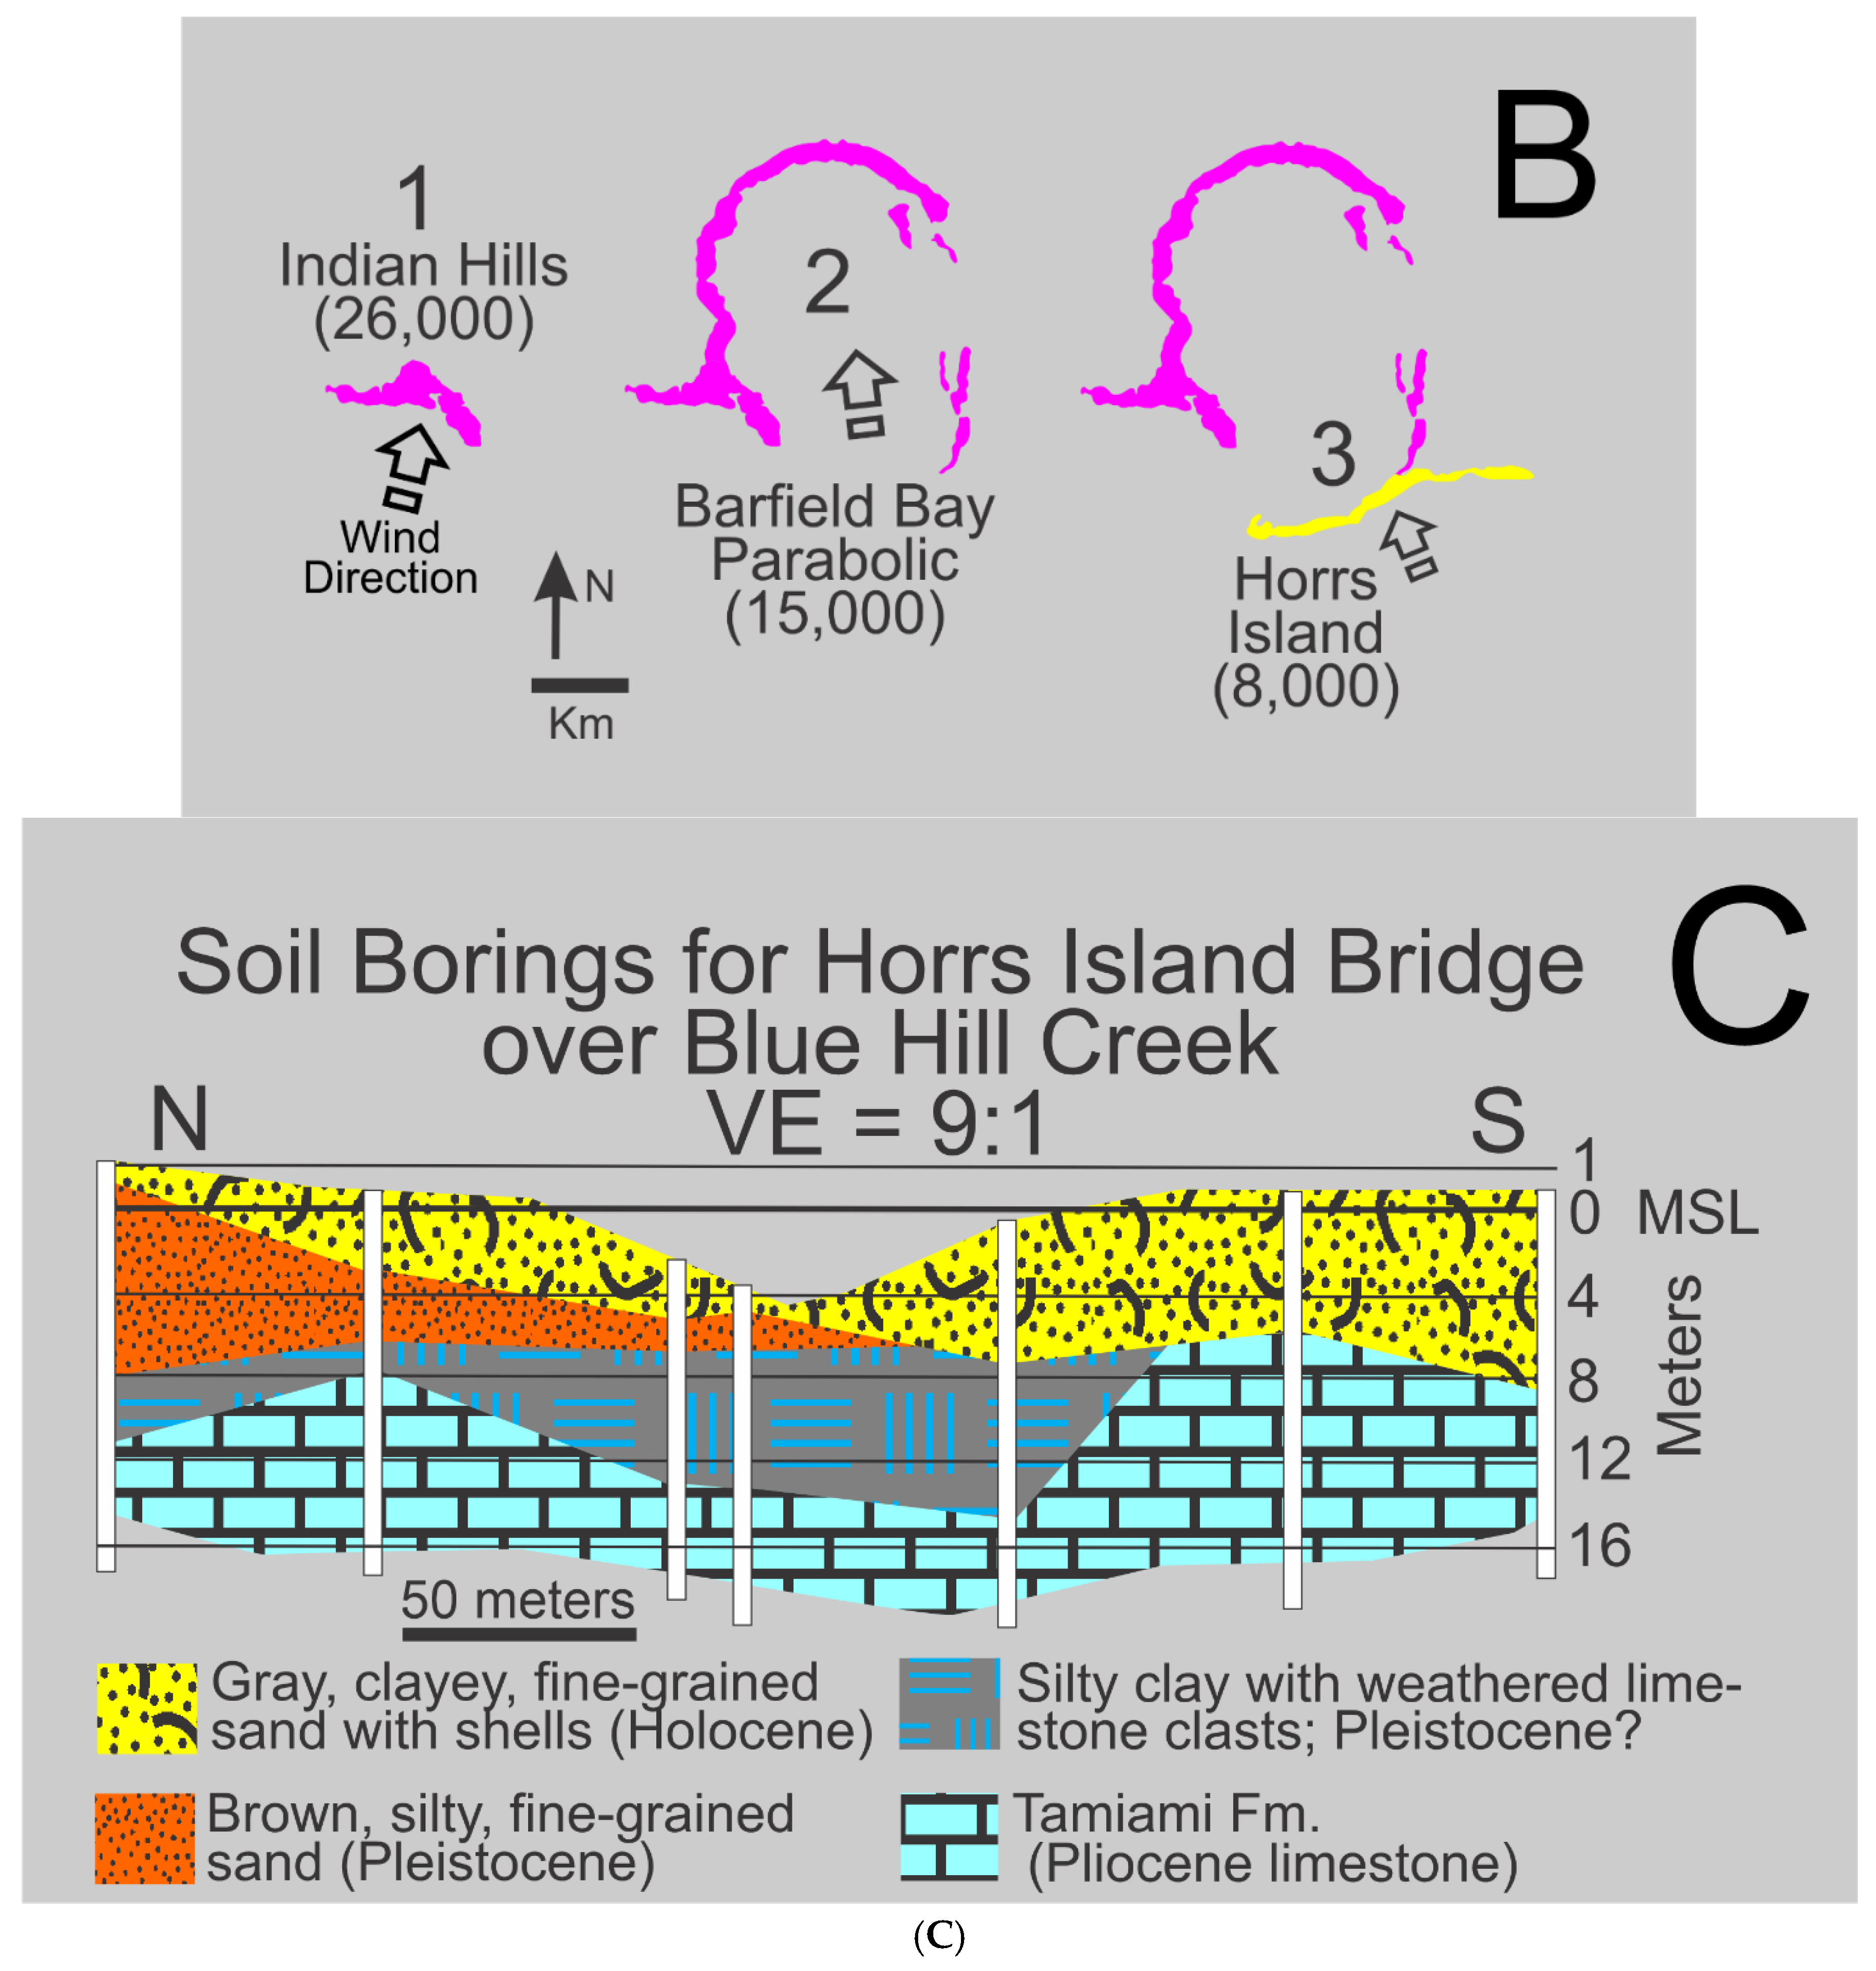
Figure 5.
Images of the silty quartz-sand sediment containing mollusk shells from the three Barfield Bay vibracores. These images are representative of the various silt amounts. Note the essentially random (?) arrangement of the mollusk shells; these images show the bioturbated texture that comprises the vast majority of the Holocene sediments that fill Barfield Bay. The white circles identify mollusk shells; the pink pelecypod in the upper left corner (white circle) of the Core 5 image is articulated. The homogeneous texture with no obvious stratification is interpreted to have resulted from intense bioturbation.
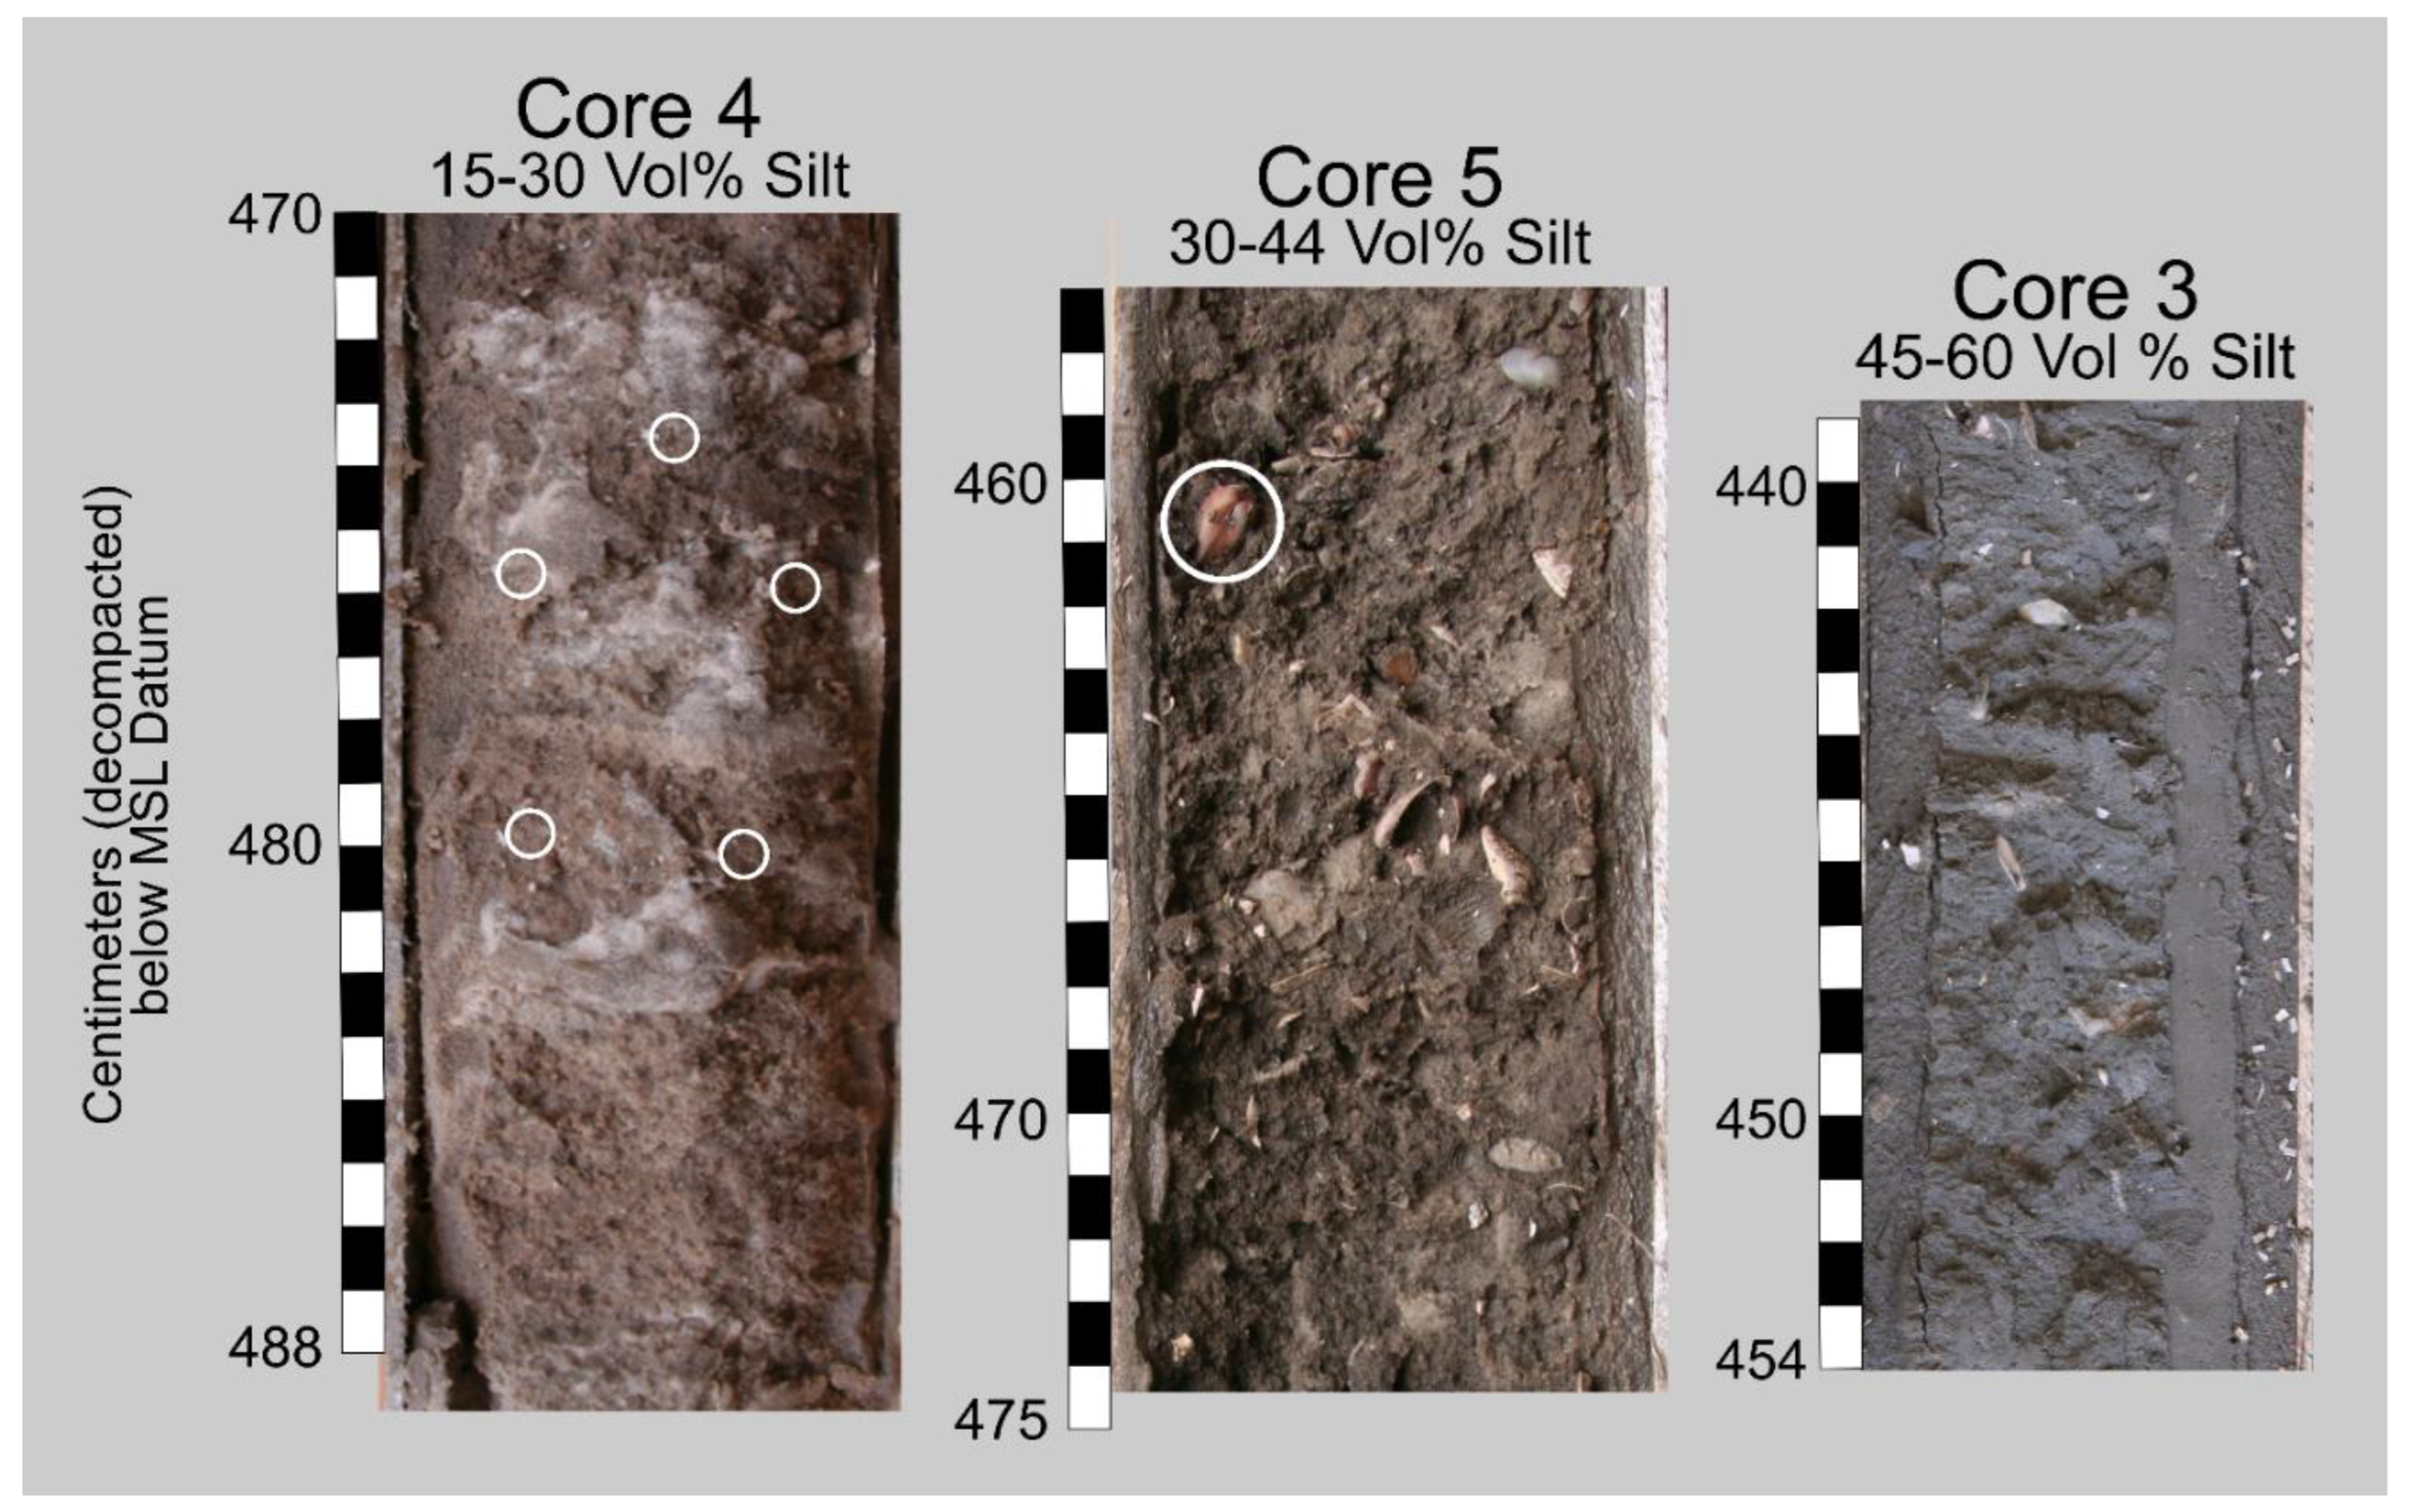
Figure 6.
A. The lithology and mollusk content of the three Barfield Bay vibracores that penetrated the Holocene sediment-fill. The silt-rich Cores 3 and 5 are located on the margins of the Southeast Basin (SEB, Figure 2) and the Northwest Basin (NWB, Figure 2), respectively. Core 4 is located in the main distributary channel region of the flood-tidal delta adjacent to the present-day Caxambas Pass, Figure 2. The blue arrows show the locations of the core photos in Figure 6. The largest concentration of Crassostrea virginica shells is found in the upper 1.5 meters of Core 5. The decompacted depths are in centimeters. B. Diagram showing the sediments in Cores 2, 6, and 7 which were taken in the mangrove fringe adjacent to the Barfield Bay Parabolic Dune and the Horrs Island Transverse Dune. Crassostrea virginica shells are prominent in the upper several decimeters of these cores and were deposited from clusters that are present on the prop roots of red mangrove trees (Rhizophora mangle). These Holocene sediments are a mixture of intertidal and shallow subtidal and can be best described as peritidal [24]. The root casts that occur within the aeolian sand are probably not from red mangroves but rather from trees that populated these dunes prior to the Holocene marine transgression that flooded Barfield Bay. The vast majority of the quartz sand deposited above the Flooding Surface Disconformities most probably came from erosion of the adjacent aeolian dune and was not transported very far into Barfield Bay. Flooding surface Fs2 in Core 2 may not be correlative with the floodings surfaces in Cores 6 and 7.
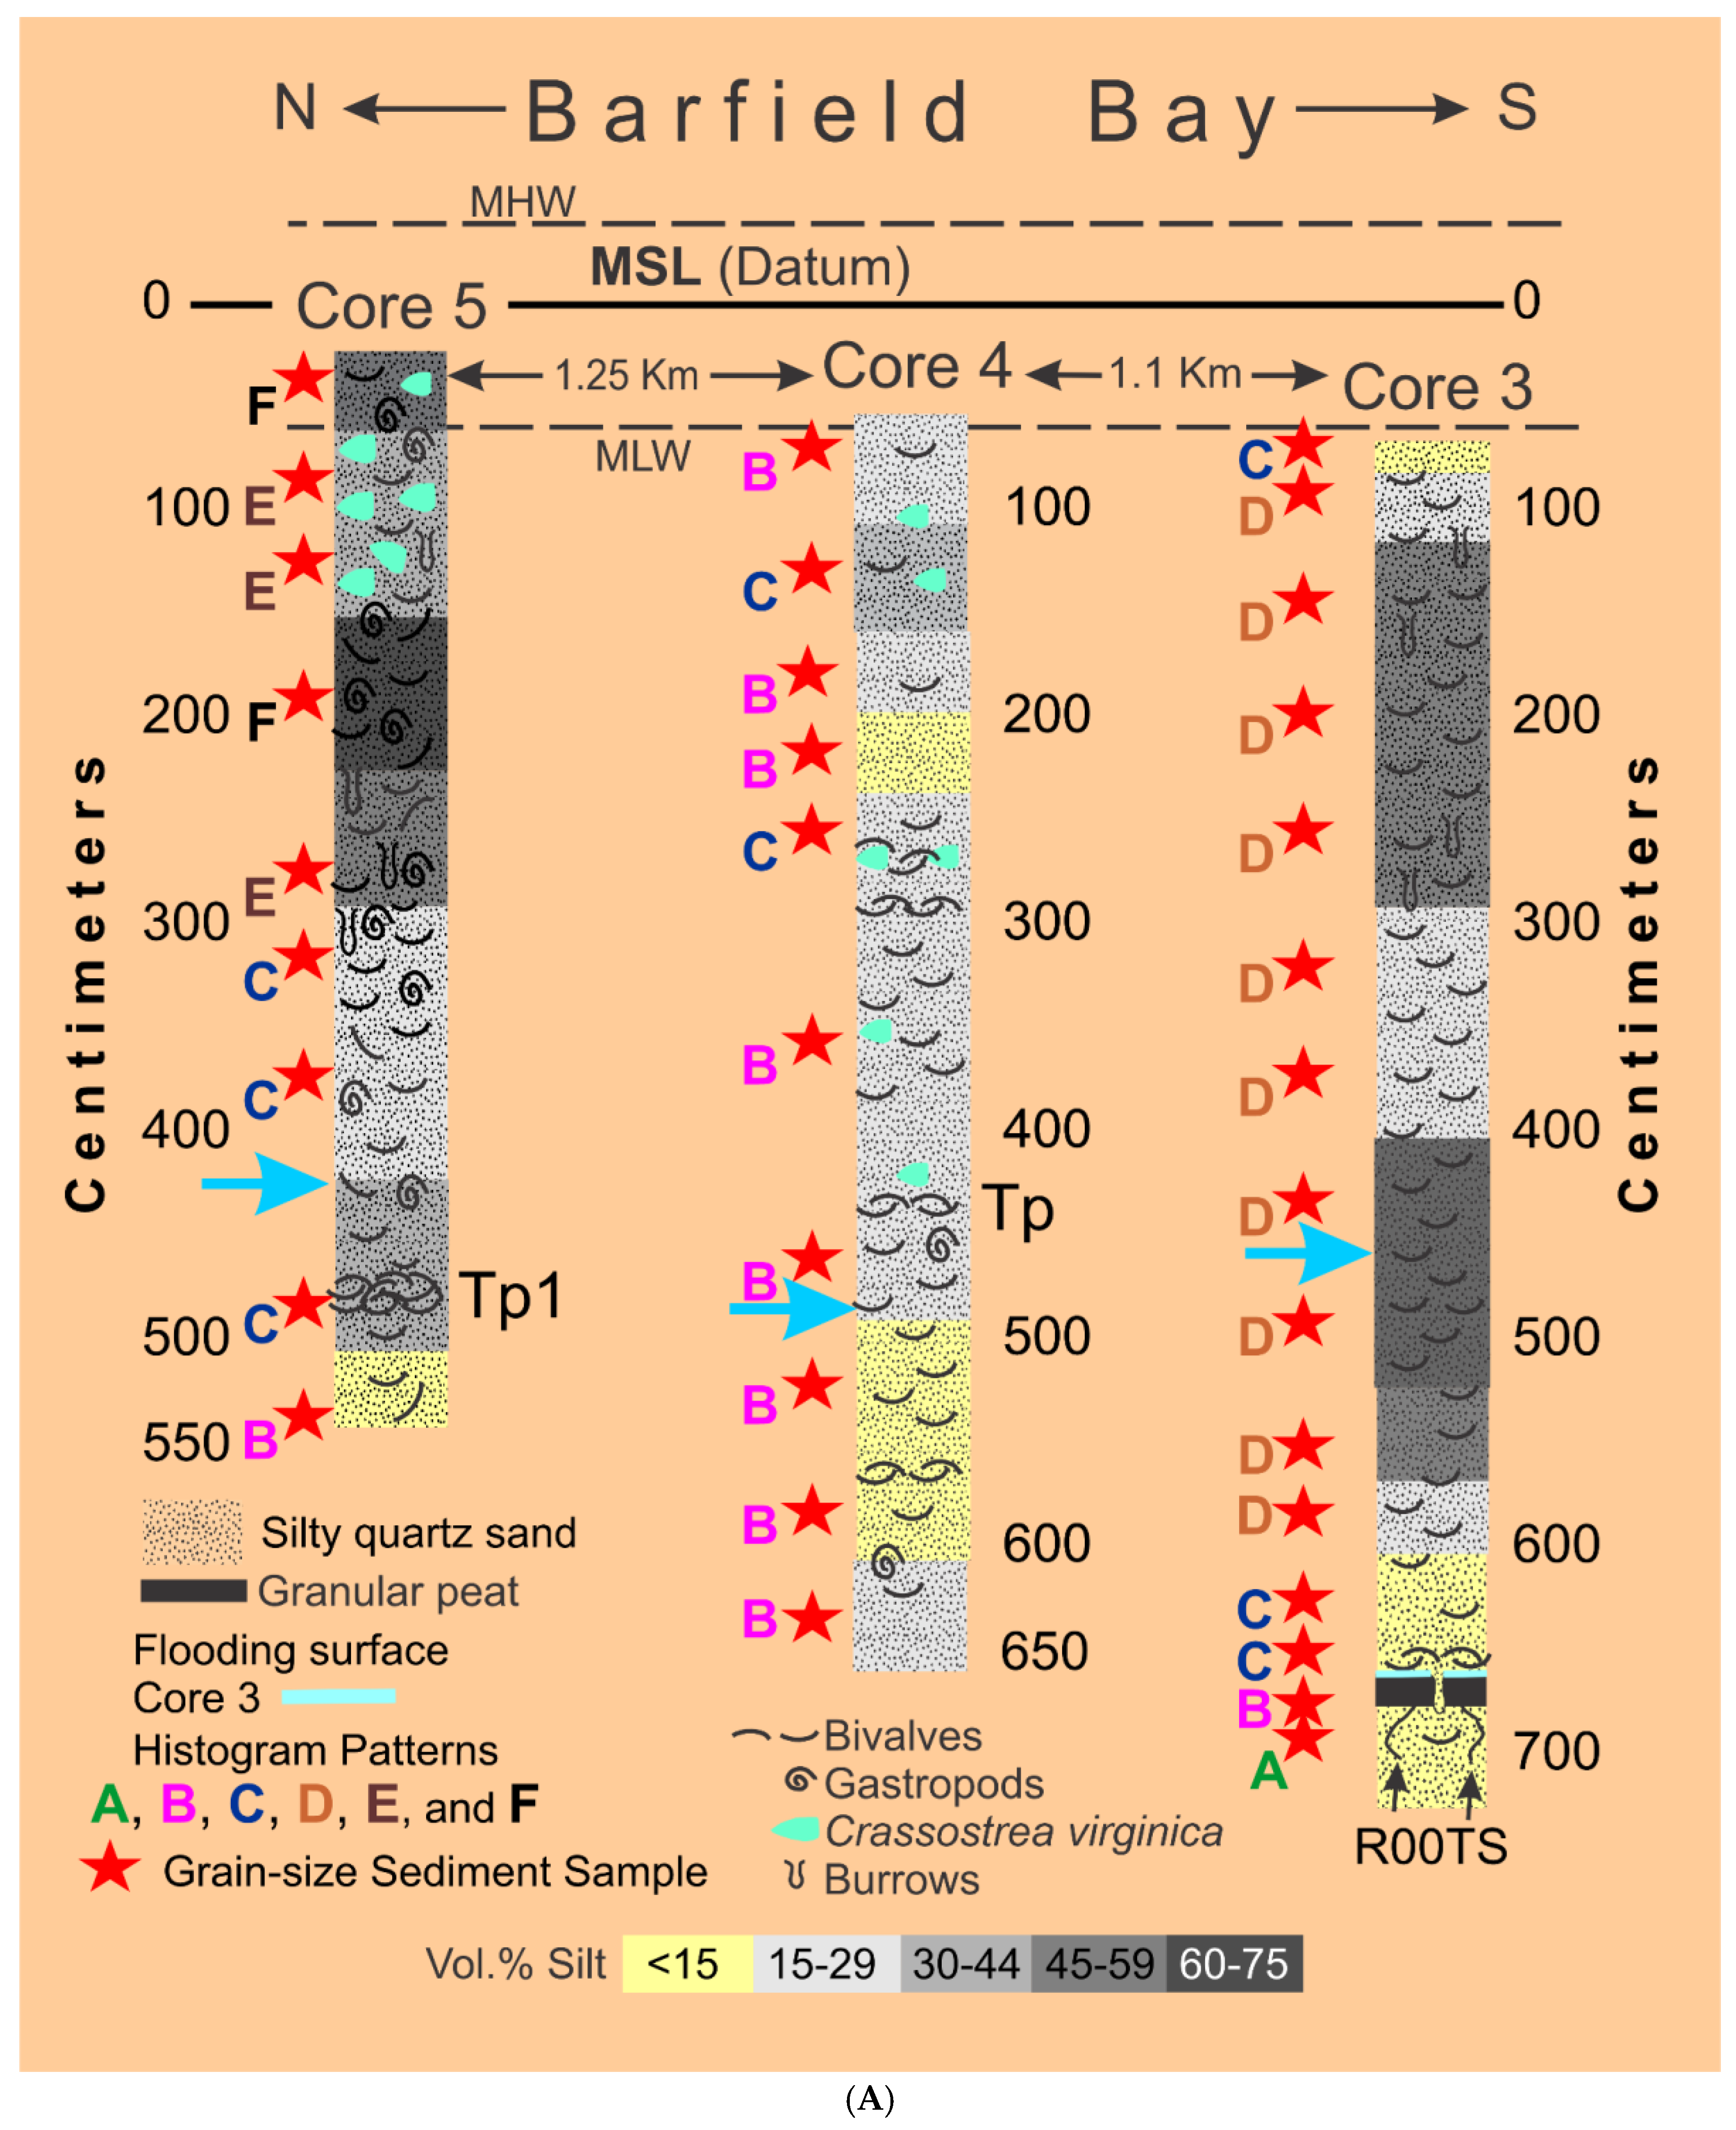
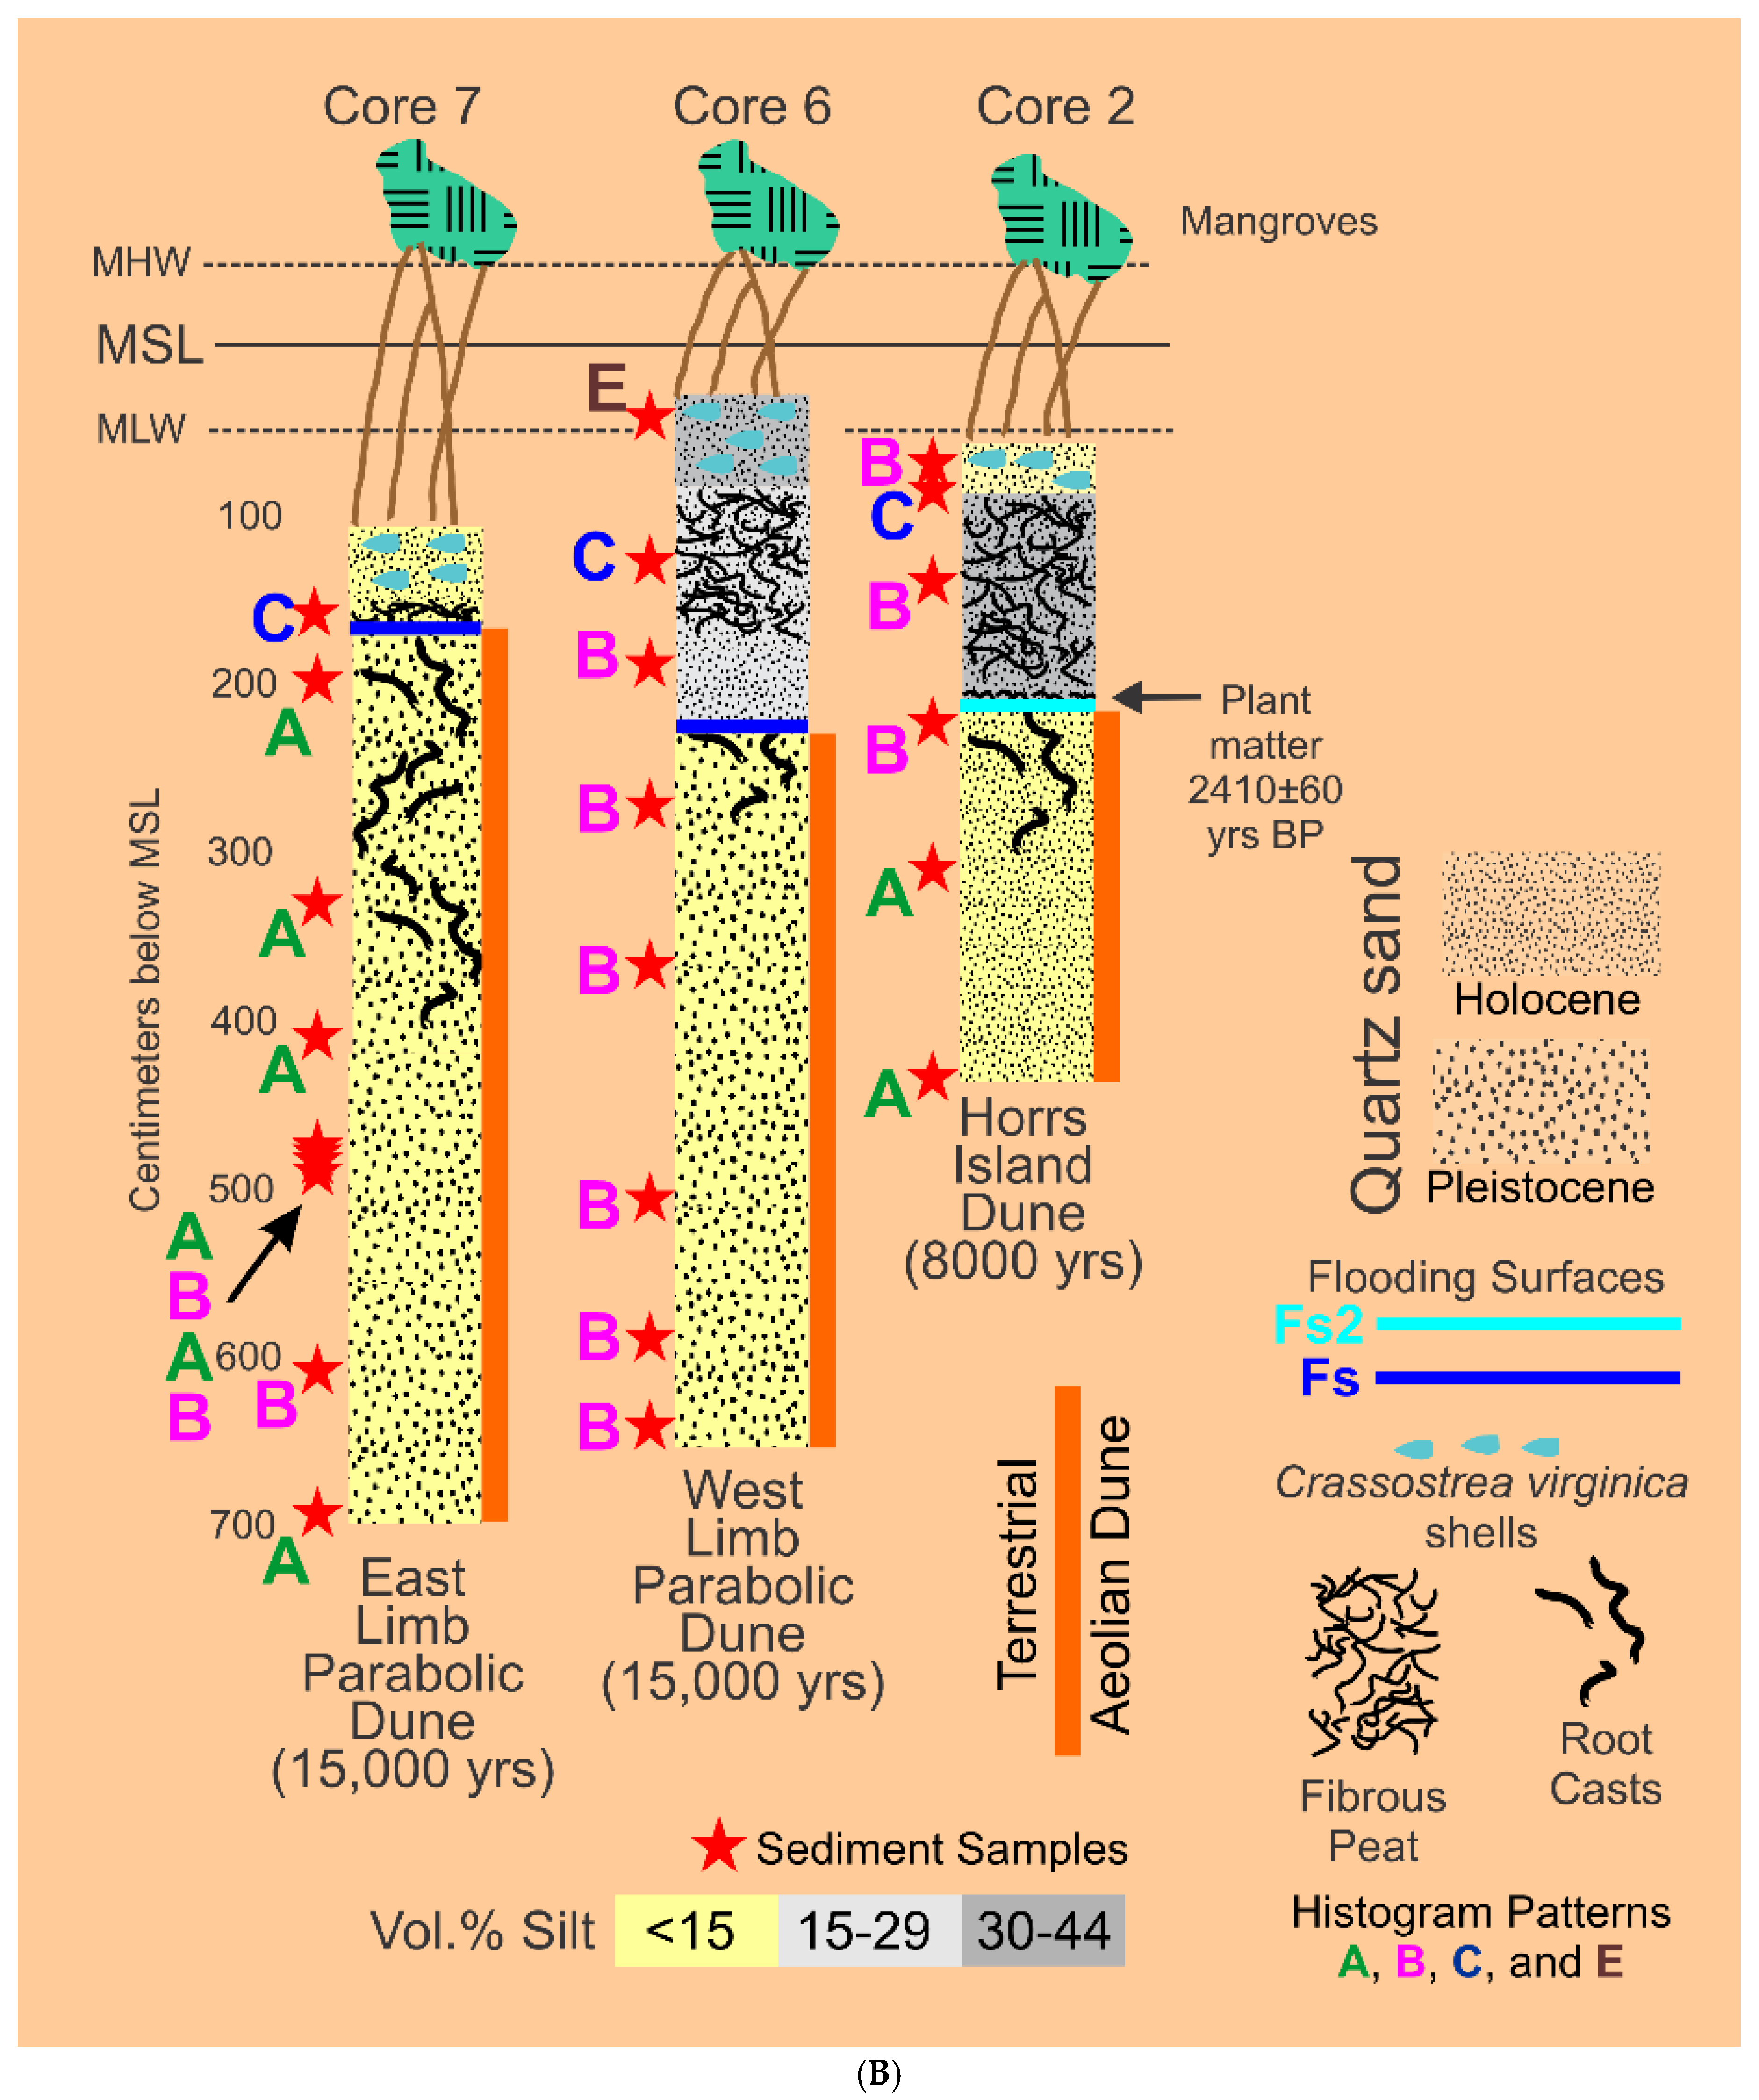
Figure 7.
Volume percentage histograms of the quarter-Phi grain-size classes of the fifty-seven (57) sediment samples from the three Barfield Bay and the three aeolian dune vibracores. Based on their overall geometric shape or pattern these histograms can be placed into the six distinctly different histogram pattern (HP) HP Groups, A through F. The HP HP Group D samples are found only in the silt-rich portion of Core 3. Three of the HP HP Group E and all of the HP HP Group F samples are found in the silt-rich portion of Core 5. HP HP Groups A, B, and C are found in all six of the vibracores.
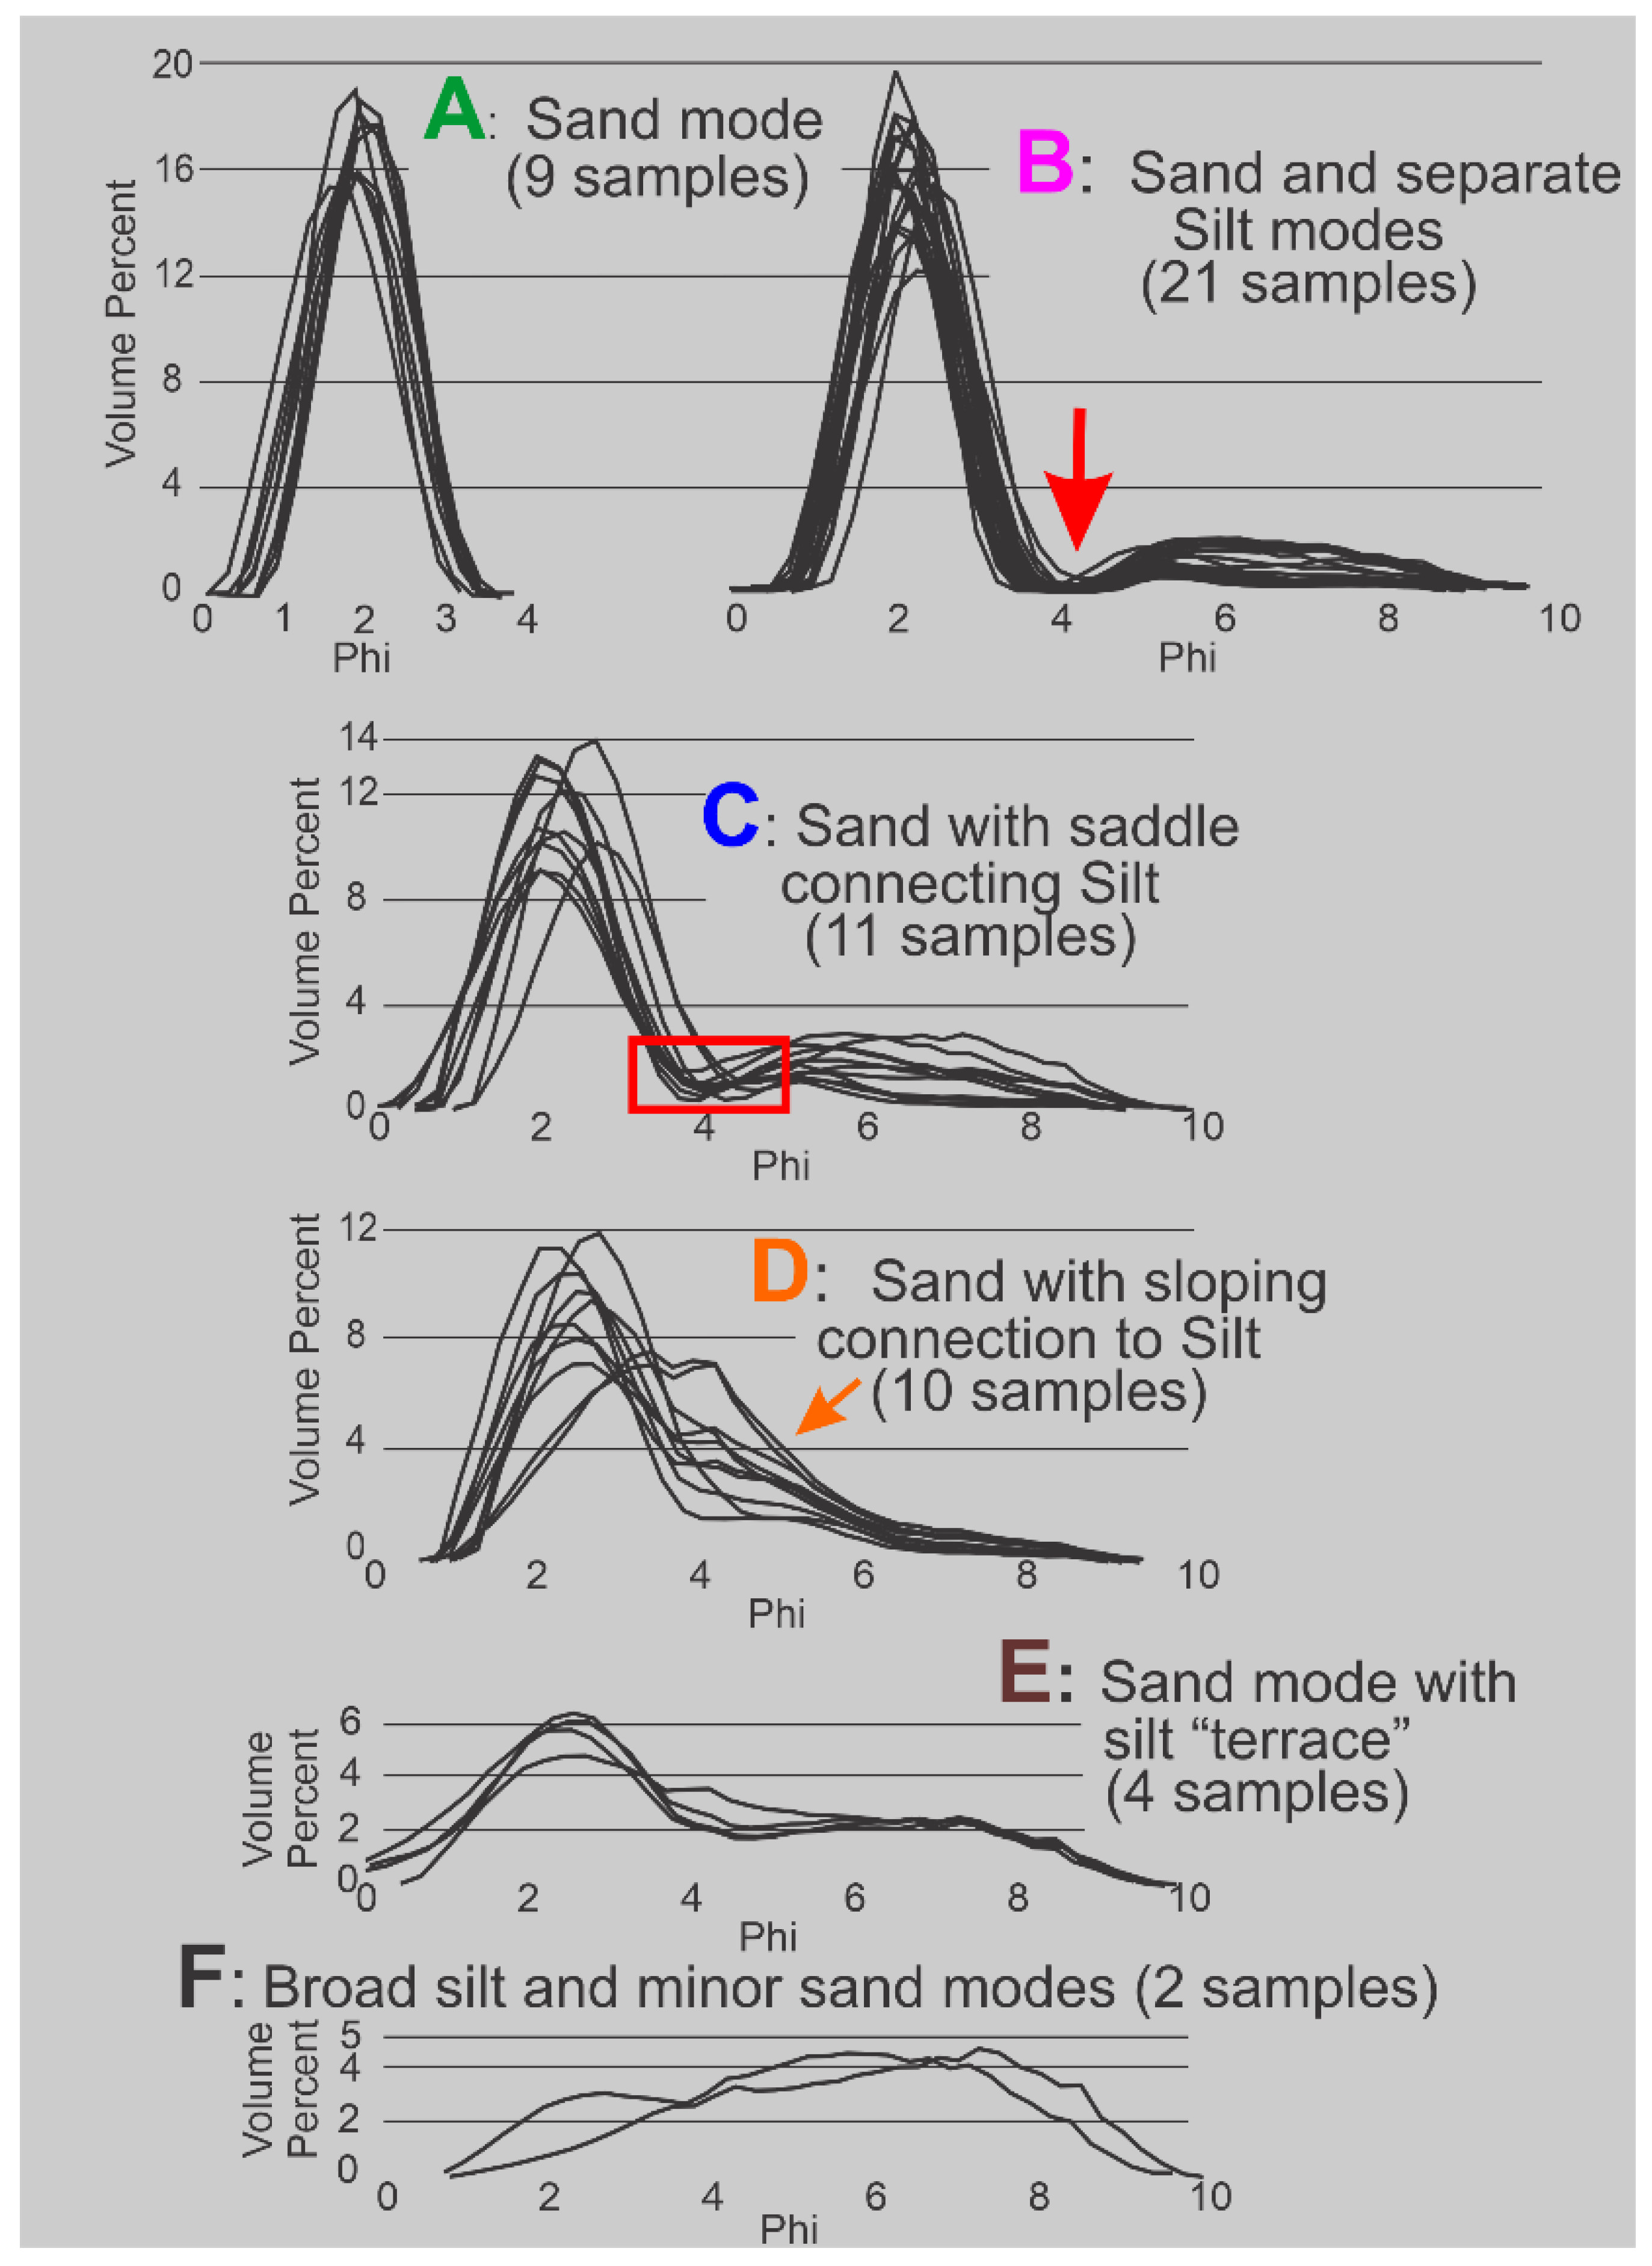
Figure 8.
A. HP Group-averaged, moment measures of the sand populations in HP Groups A, B, and C generated with GRANULO [1]: (9) is the number of samples in the HP Group, Mean is a Phi grain-size, SD is the standard deviation (sorting) in Phi units, SK is the skewness, K is the kurtosis, and Vol% is the percentage of sand in the total sample volume (sand and silt). The specific column values highlighted in grey have overlapping standard deviations and thus can be considered statistically indistinguishable. RMS is root mean square of deviations and X2 is a Chi Square value. DF is the degrees of freedom of the X2 value. The null hypothesis that a distribution resulting from the combination of the 2 ROKE-identified normal distributions is different from the original distribution in the HP HP Group C sand mode was rejected at the 90% confidence level using a X2 goodness-of-fit test. B. Panels A and B. Volume percentage histograms of the silt fractions of HP Groups B and C samples. Note the polymodal character of these distributions with coarser and finer modes. Note that the HP Group C silt distributions have been truncated at their coarser ends; this truncation took place at the low point of the “saddle” connecting the sand and silt populations. This truncation has not affected the recognition of the coarse silt mode. Panel C. HP HP Group-averaged, statistical moment measures of the two, ROKE-identified silt populations and HP Group-averaged RMS (root mean square) and X2 values. (21) and (11) are the number of samples analyzed. M=Phi Mean grain-size, SD=standard deviation (sorting) in Phi units, V*1=volume percentage of the silt component of total sediment sample, the numbers 1 and 2 refer to the respective component distributions. (2ND) indicates that the ROKE program searched for two normal distributions. The null hypothesis that a distribution resulting from the combination of the 2 ROKE-determined normal distributions is different from the original distribution in the HP HP Groups B and C silt components was rejected at the 90% confidence level using X2 goodness-of-fit tests. The gray background indicates those values that are statistically indistinguishable. C. A bivariate plot of Mean grain-size versus Standard Deviation for the GRANULO and ROKE described and identified, respectively, log-normal populations in HP Groups A, B, and C; these three HP Groups are silt-poor relative to HP Groups D, E, and F. Cluster 1 contains 41 members, Cluster 2 contains 11 members, Cluster 3 contains 41 members, and Cluster 4 contains 40 members.
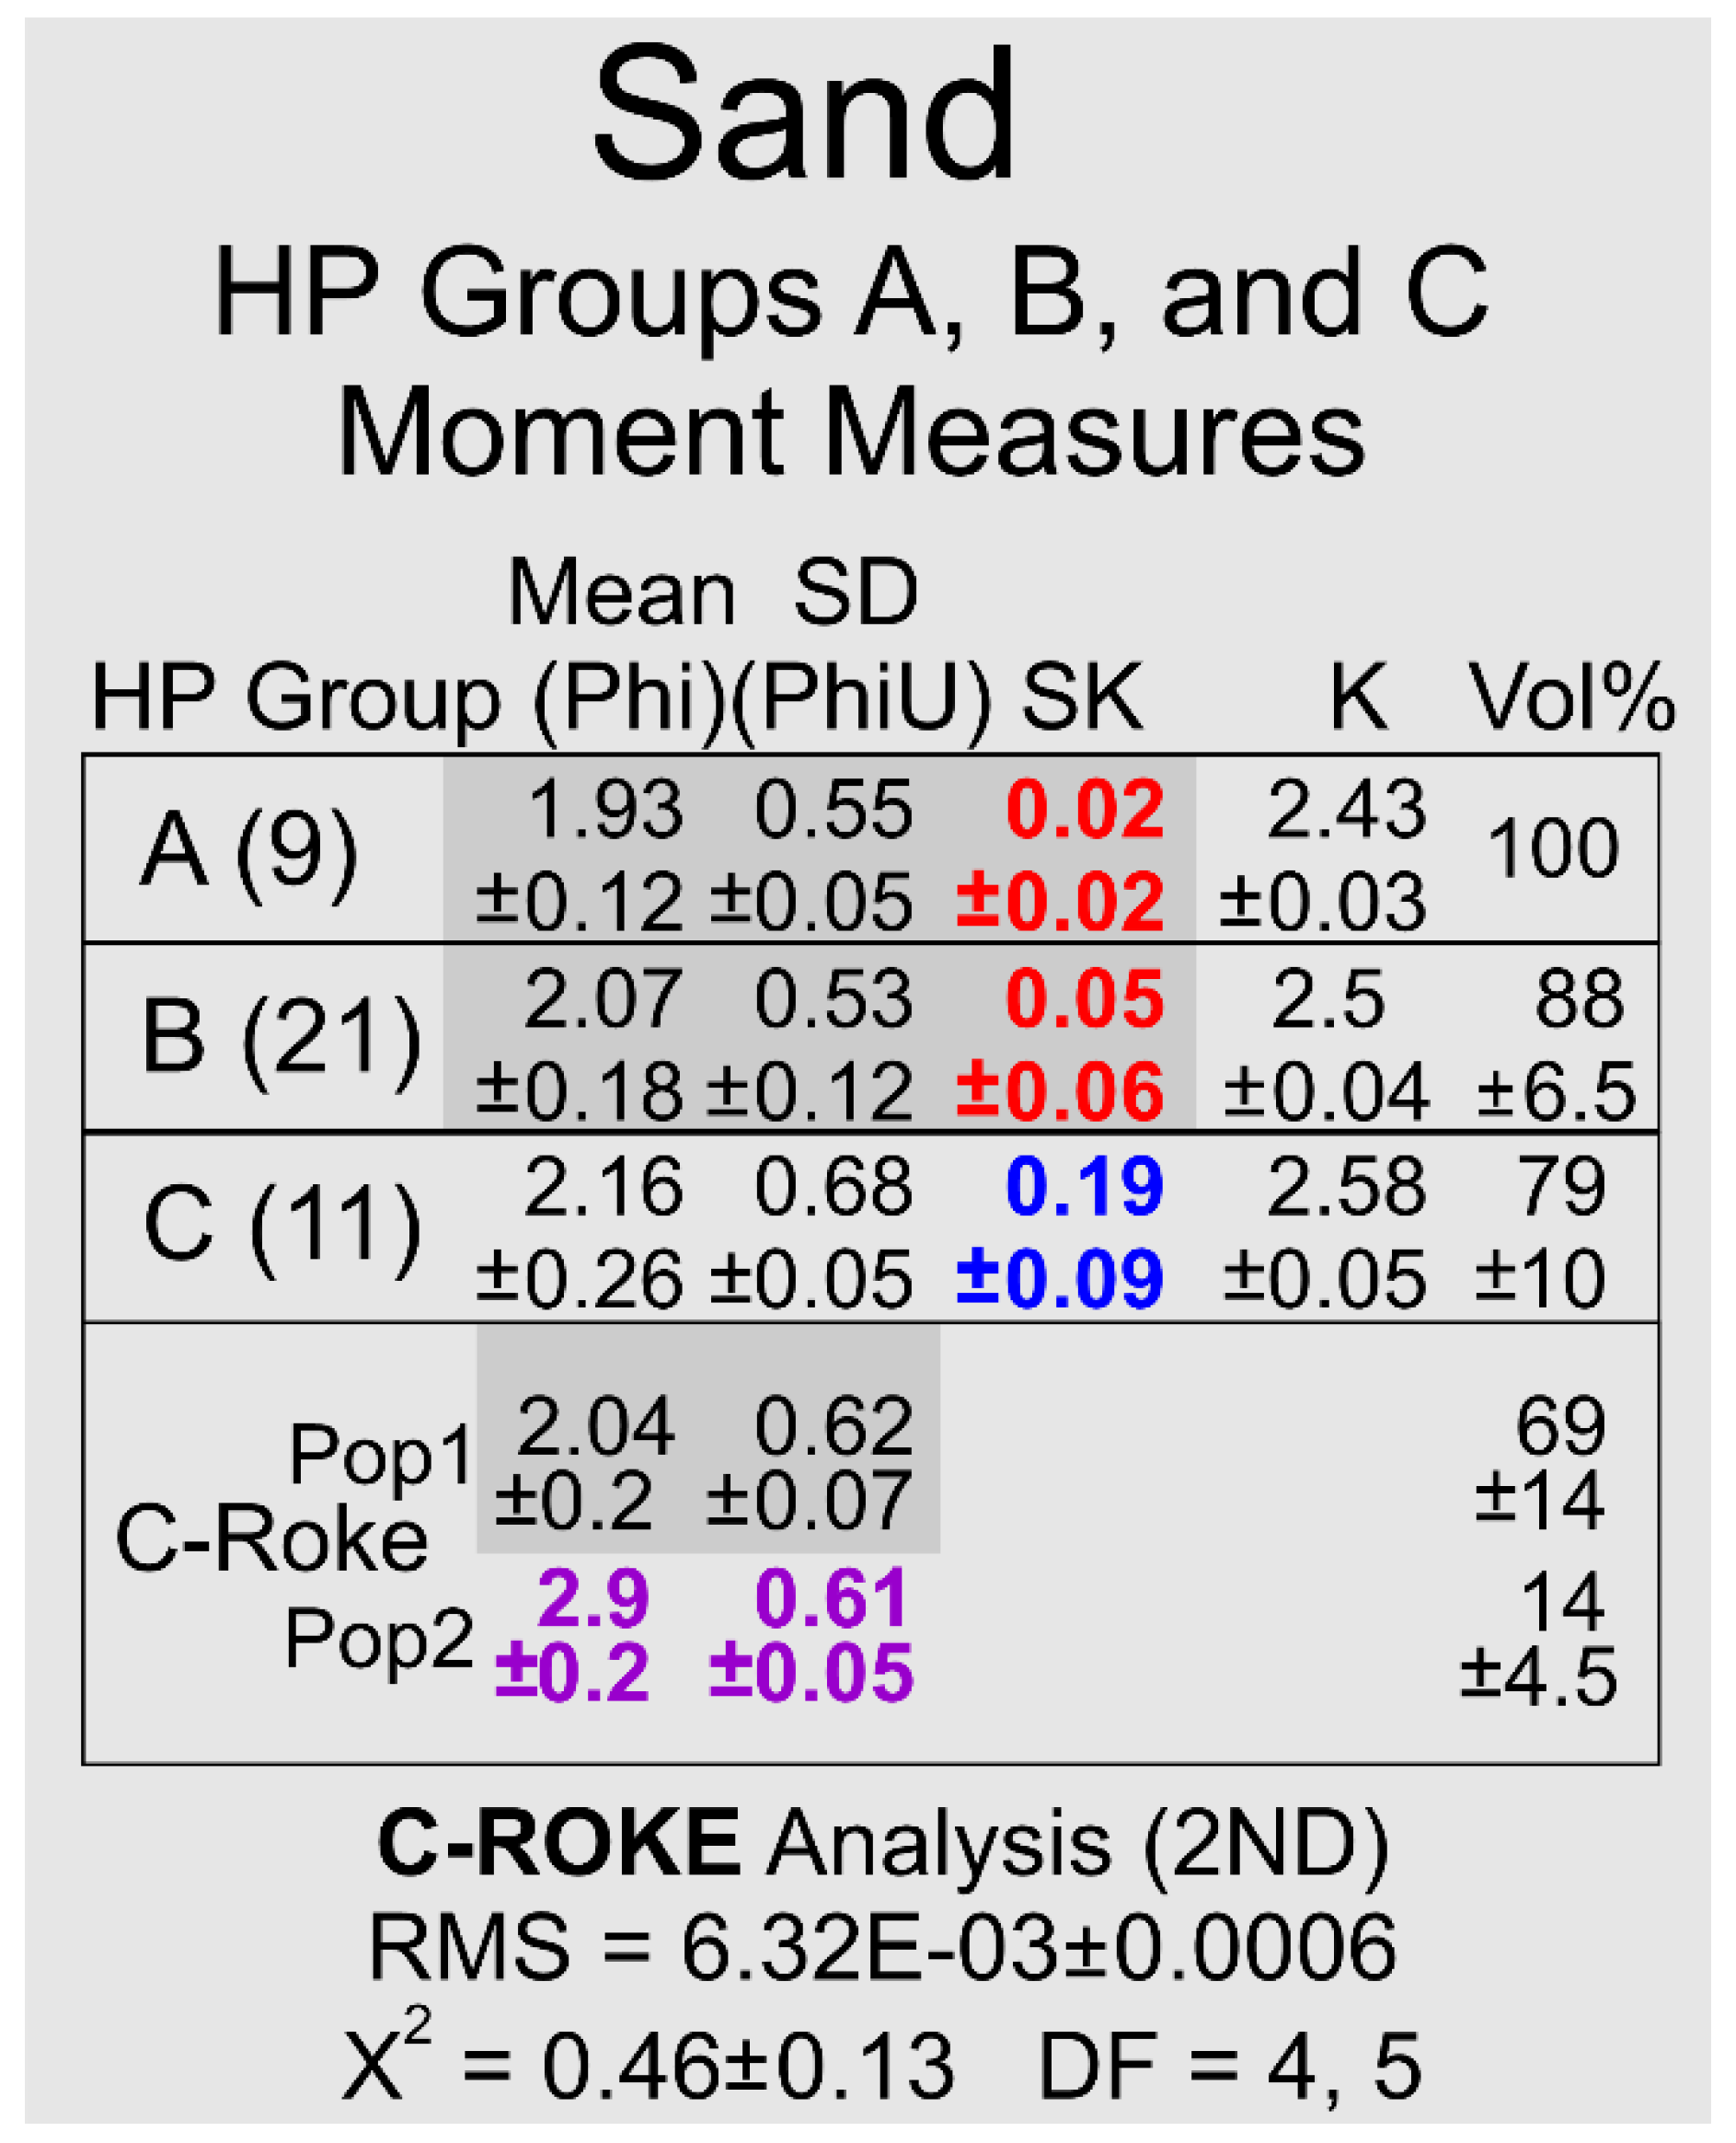
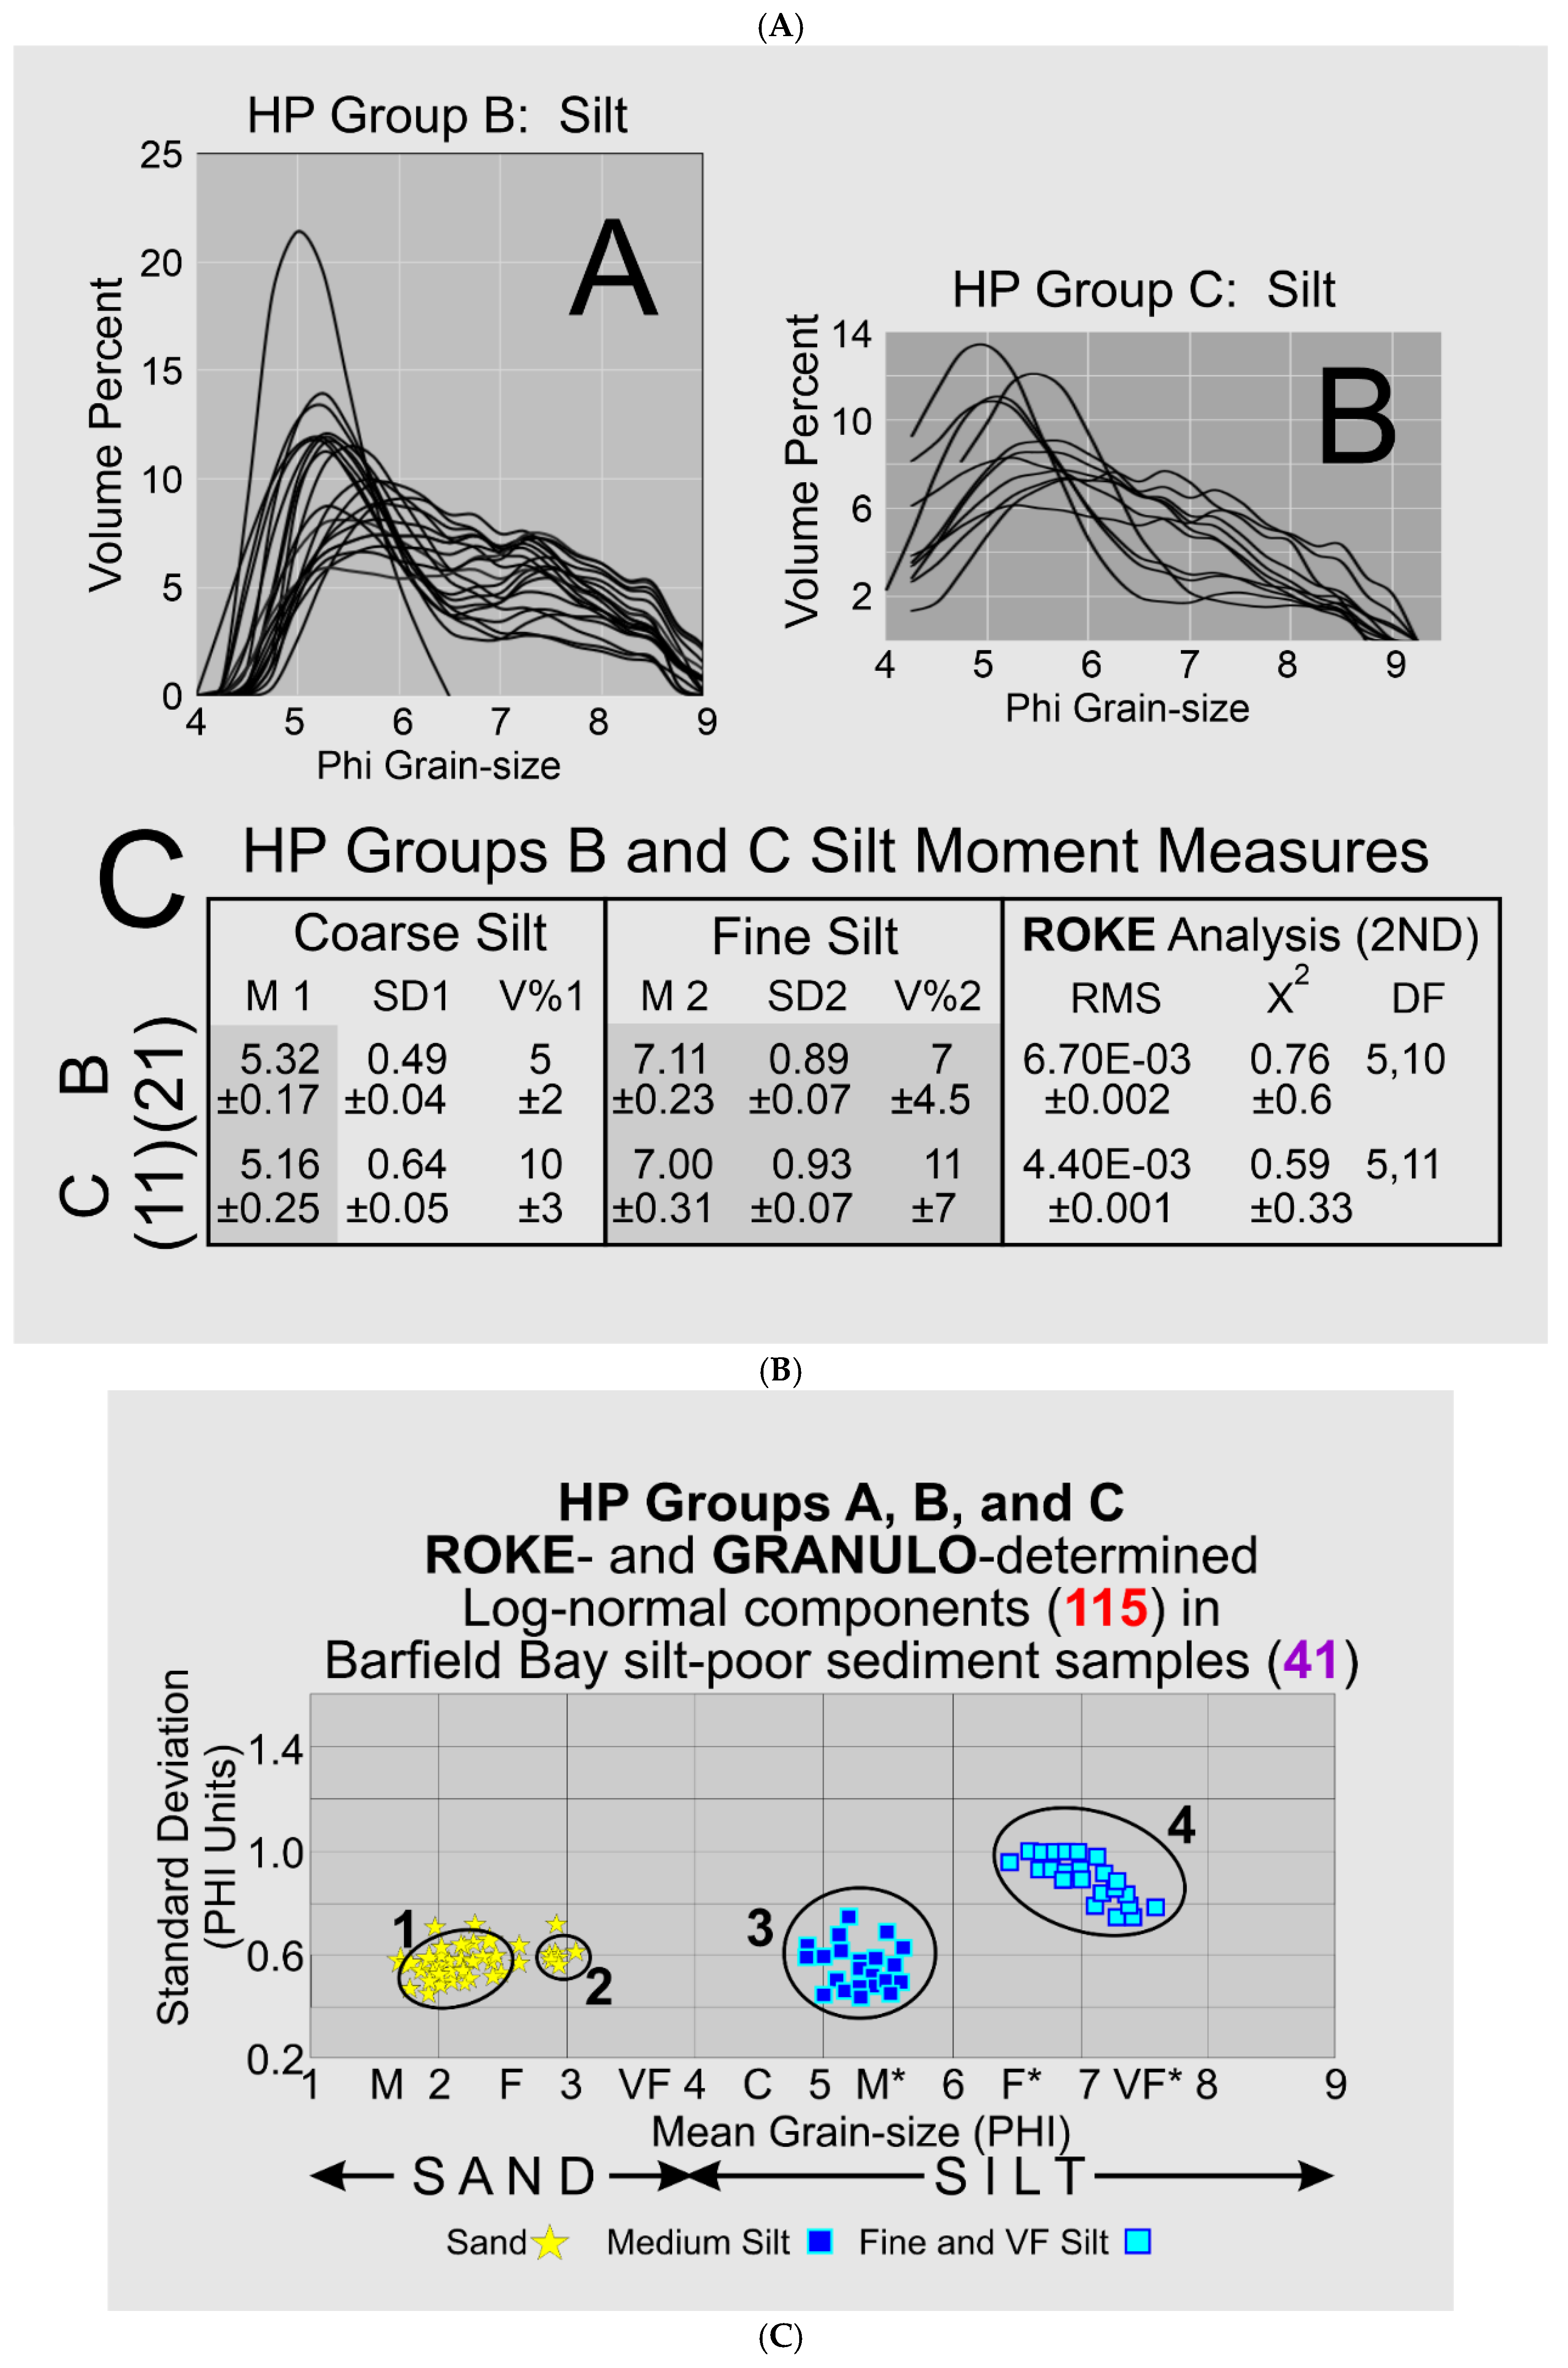
Figure 9.
The three ROKE-identified, normal distributions that can be combined to yield the histogram curves for the ten HP Group D samples. M=Phi Mean grain-size, SD=standard deviation in Phi units, V=volume percentage, RMS is root mean square, X2 is Chi square, DF is degrees of freedom. The numbers 1,2,3 arrange the constituent log-normal distributions in order of decreasing mean grain-size. ROKE only searches for normal distributions and thus there are no skewness or kurtosis values. The Depth numbers are in centimeters within the decompacted core below the Mean Sea level datum. (3 ND) indicates that the ROKE program searched for three normal distributions. The null hypothesis that respective combinations of the three ROKE-identified normal distributions are different from the original HP Group D distributions was rejected at the 90% level using a X2 goodness-of-fit test. The red outline boxes identify the populations that contain both very fine sand and coarse silt.
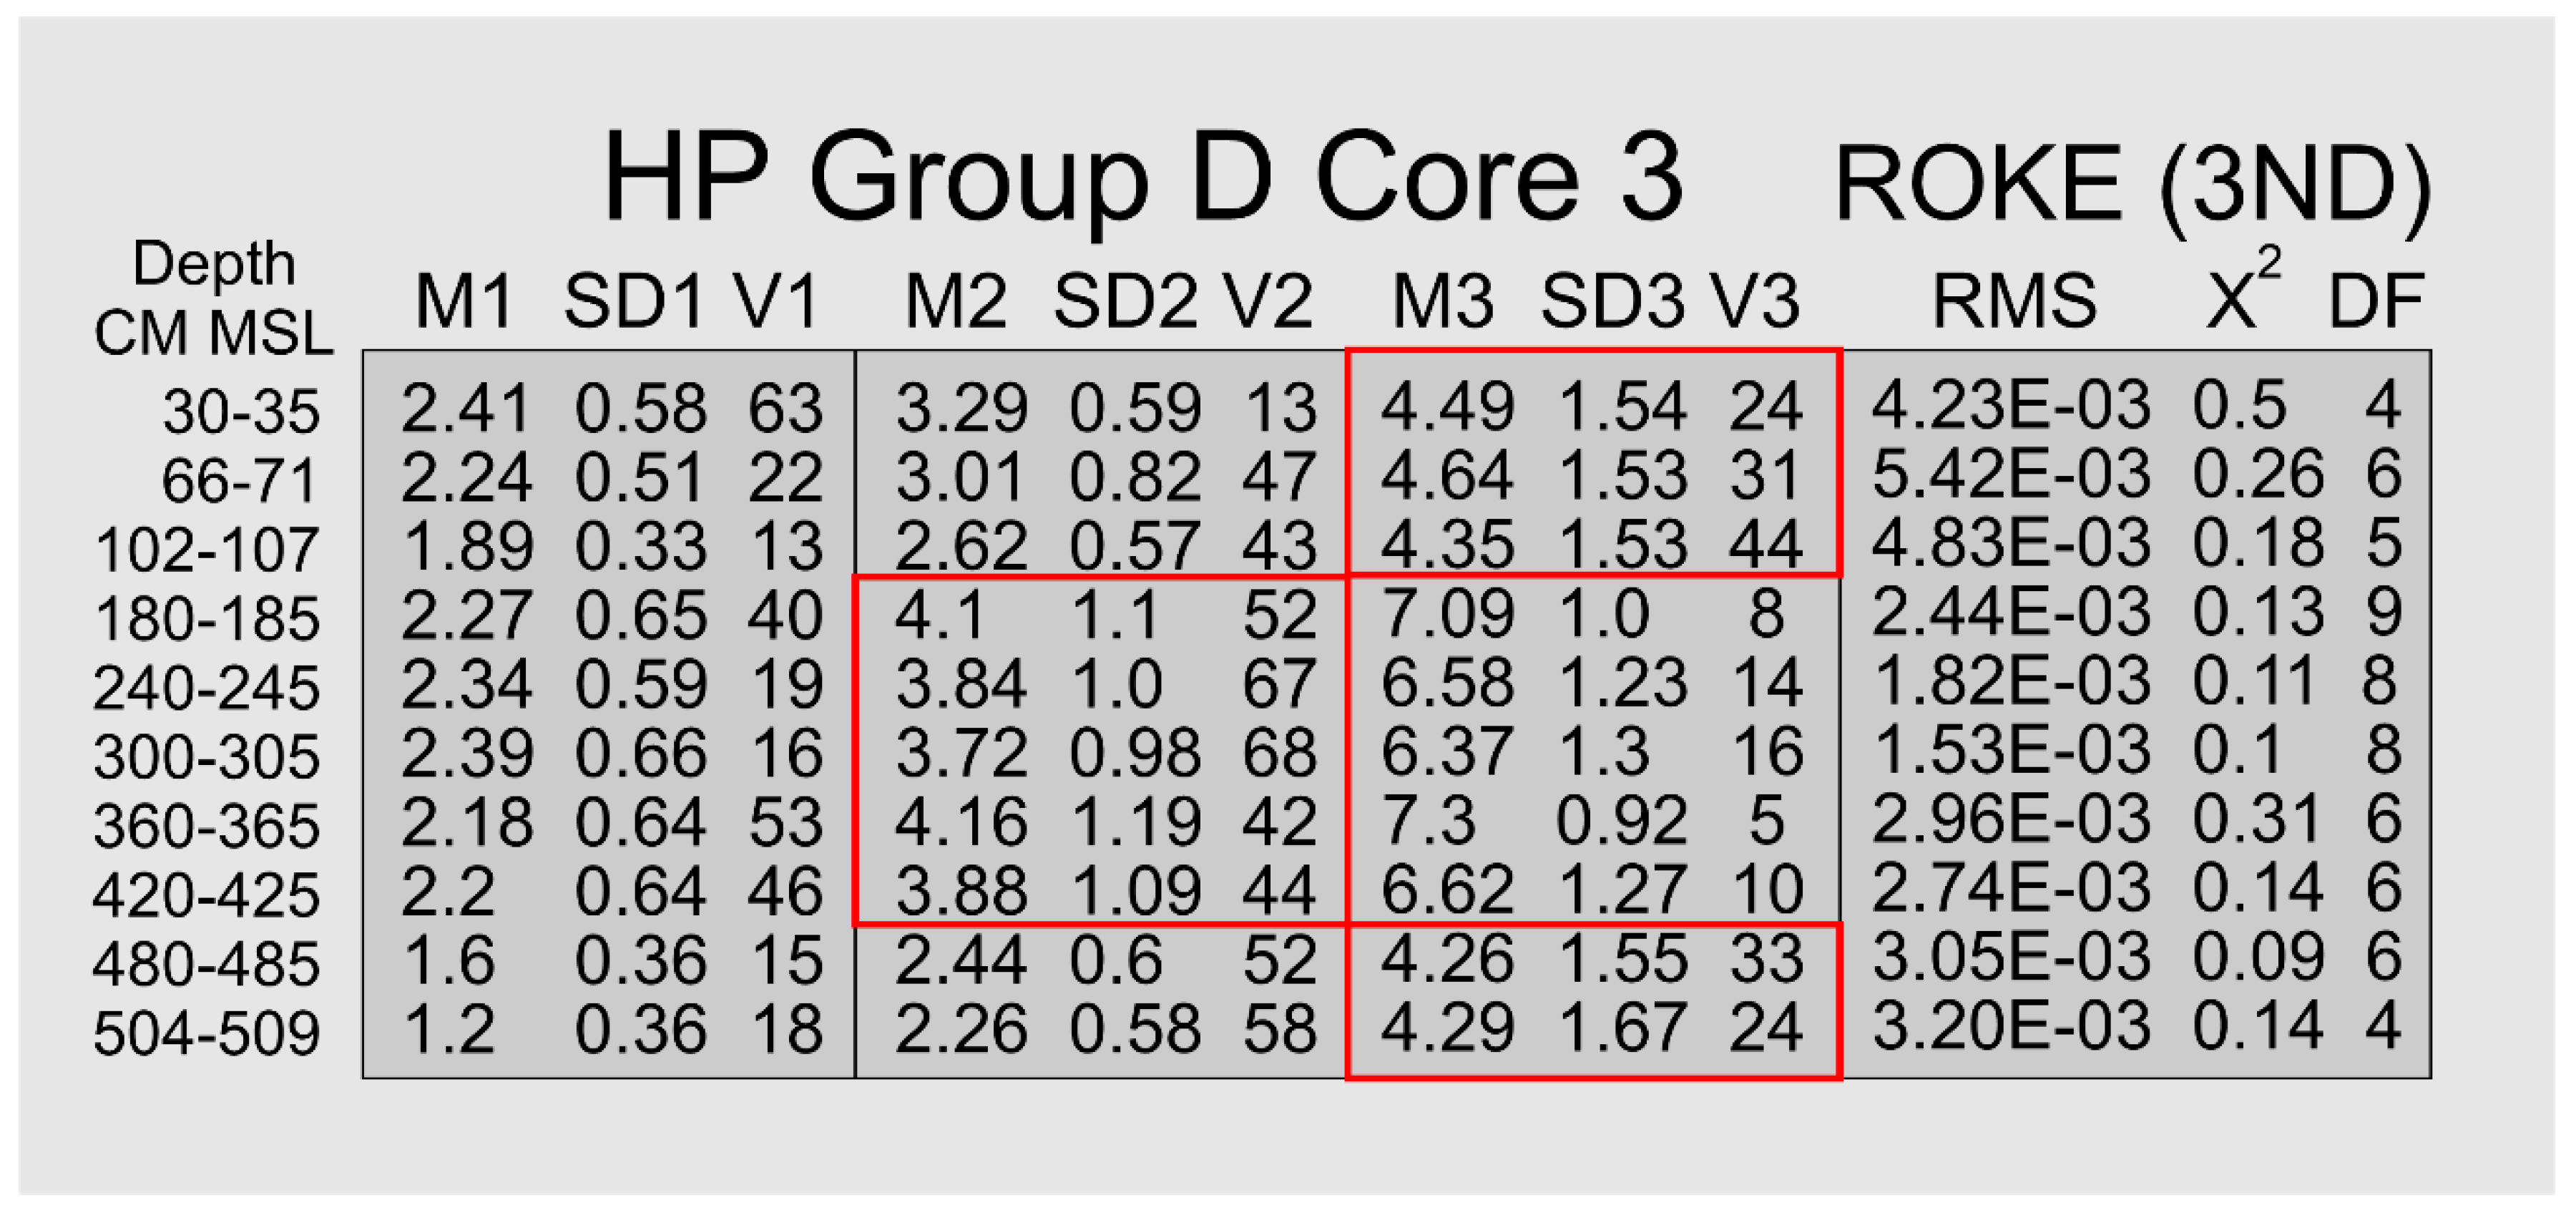
Figure 10.
The three ROKE-identified normal distributions that can be combined to yield the histogram curves for the four HP Group E and the two HP Group F samples. M= Phi Mean grain-size, SD=standard deviation in Phi units, V=volume percentage, RMS is root mean square, X2 is Chi square, and DF is degrees of freedom. ROKE only searches for normal distributions and thus there are no skewness or kurtosis values. The value in bold is the volumetrically largest component of a single sample. (3 ND) indicates that the ROKE program searched for three normal distributions. The null hypothesis that respective combinations of the three ROKE-identified normal distributions are different from the original HP Group E and F distributions was rejected at the 90% level using a X2 goodness-of-fit test.
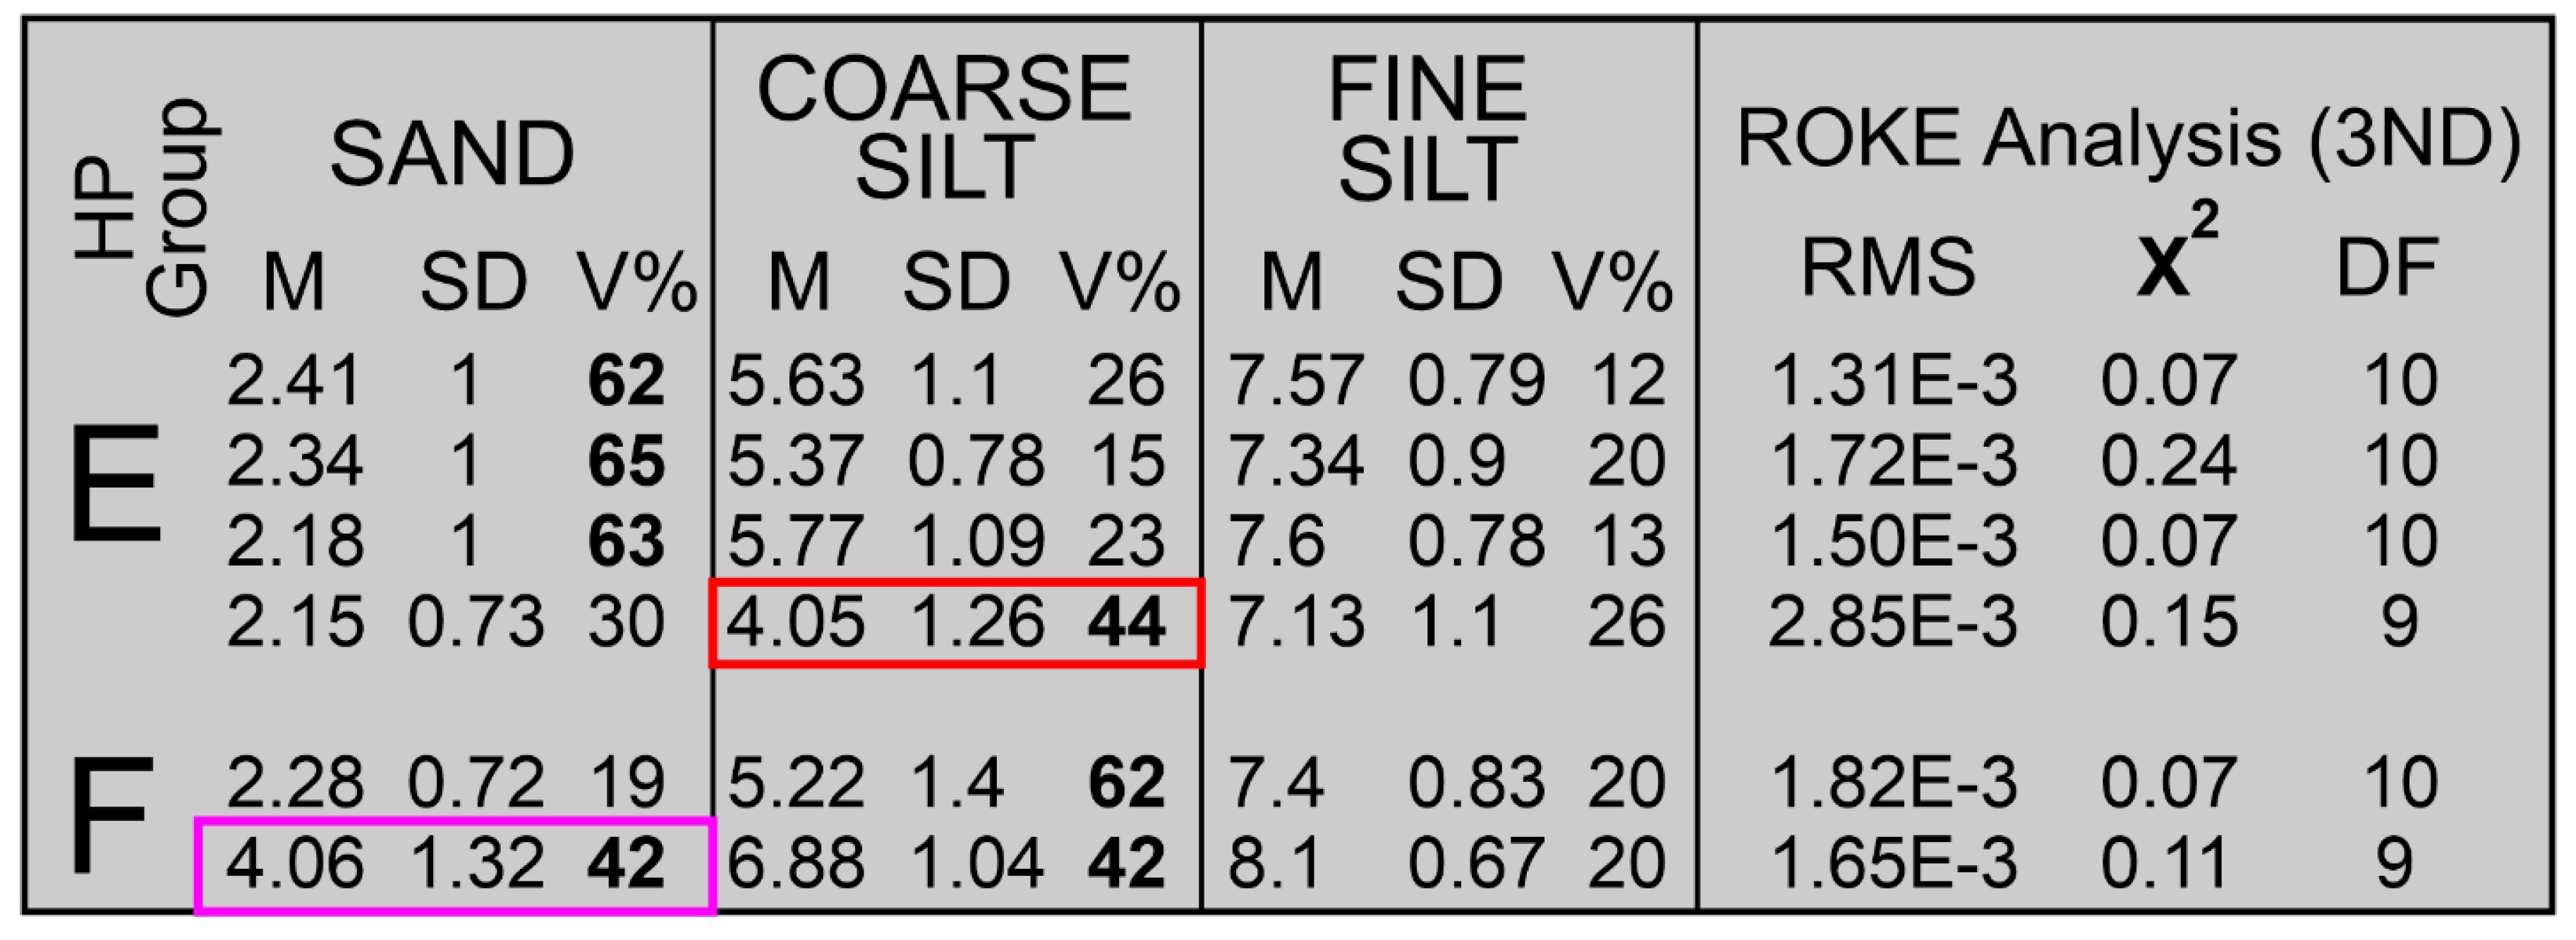
Figure 11.
A bivariate plot of Mean grain-size versus Standard Deviation for the ROKE described and identified, log-normal populations in HP Groups D, E, and F; these three HP Groups are silt-rich relative to HP HP Groups A, B, and C. Cluster 1 contains 11 members, Cluster 2 contains 7 members, Cluster 3 contains 5 members, and Cluster 4 contains 11 members.
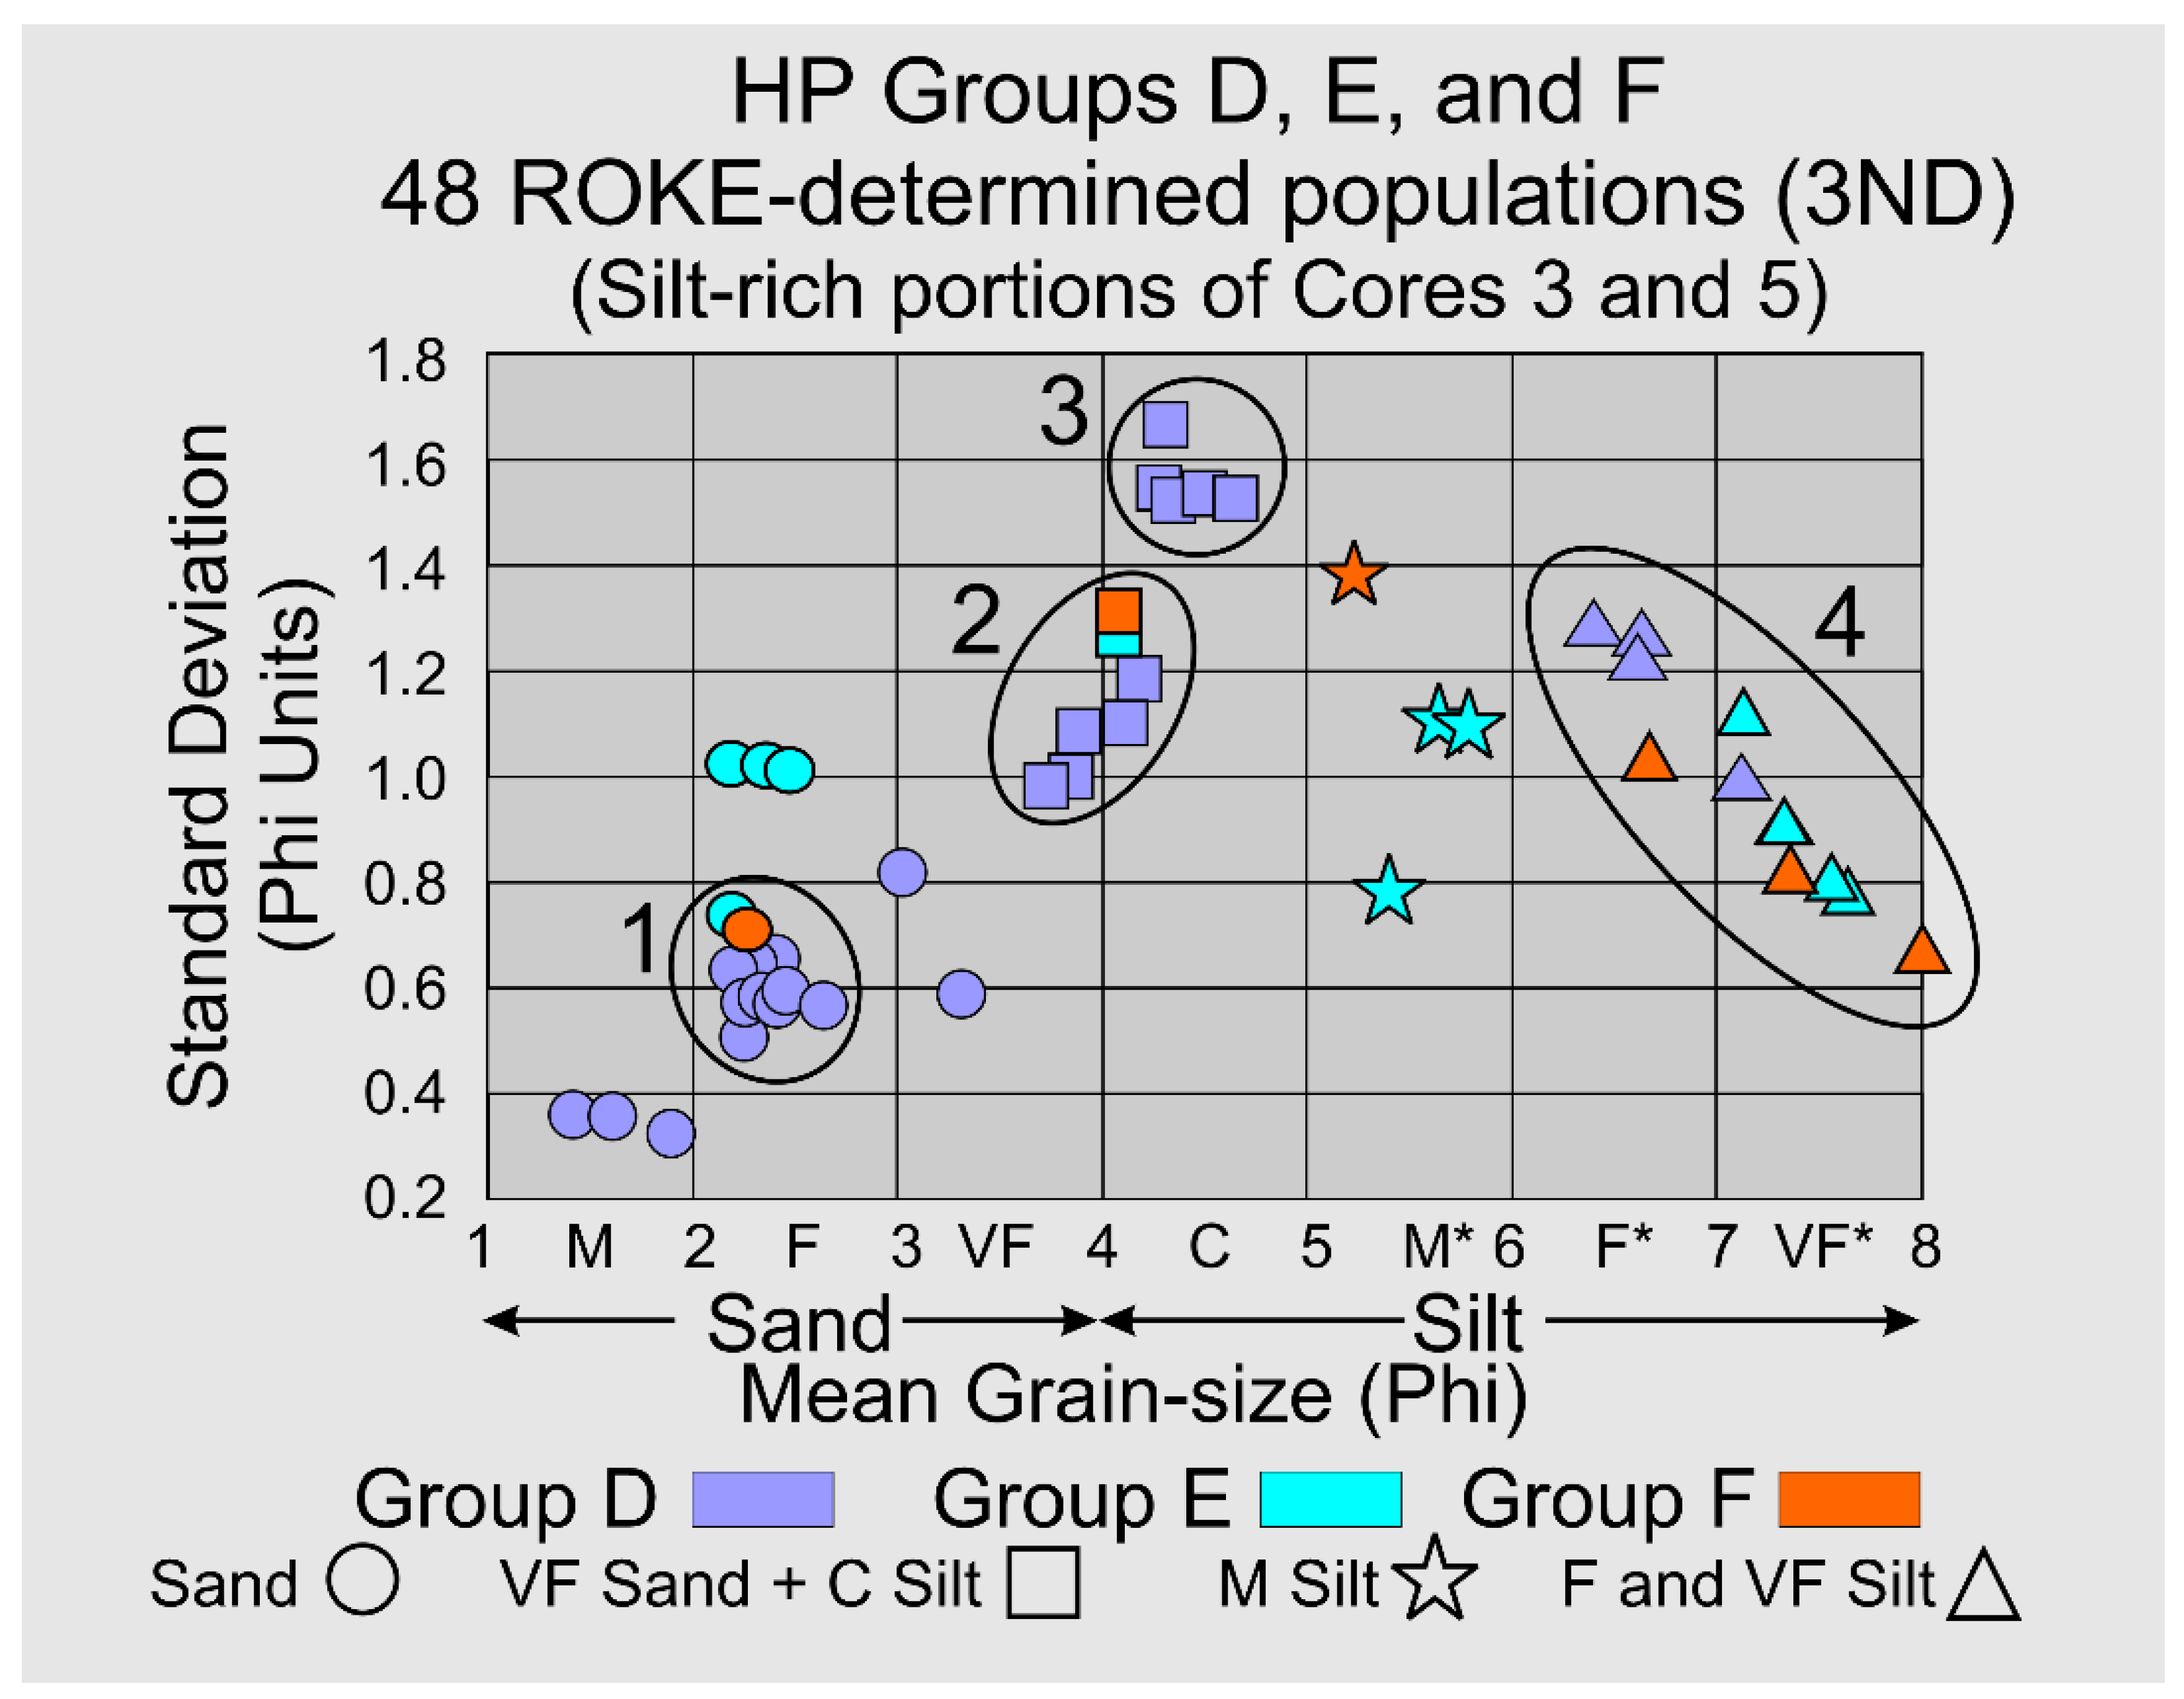
Figure 12.
A. A bivariate plot of mean grain-size (Phi) versus standard deviation (Phi units) for the 163 log-normal populations identified by the GRANULO and ROKE programs in sediment samples from the Barfield Bay sediment-fill and the surrounding terrestrial aeolian dunes. Clusters 1, 3, 5, and 6 are from the “silt poor” HP Groups A, B, and C; Clusters 2, 4A, and 4B are from the silt-rich HP Groups D, E, and F. Note that the two fine sand clusters 1 and 2 that contain the vast majority of fine-sand populations barely overlap. B. Cluster-averaged mean grain-sizes and standard deviations for the seven clusters shown in Figure 12A. Quartz (Q) is the primary mineralogy of the sand grains. Carbonate (M) is the (?) significant mineralogy of the silt grains [13,14] with siliciclastic material [15] being present as well.
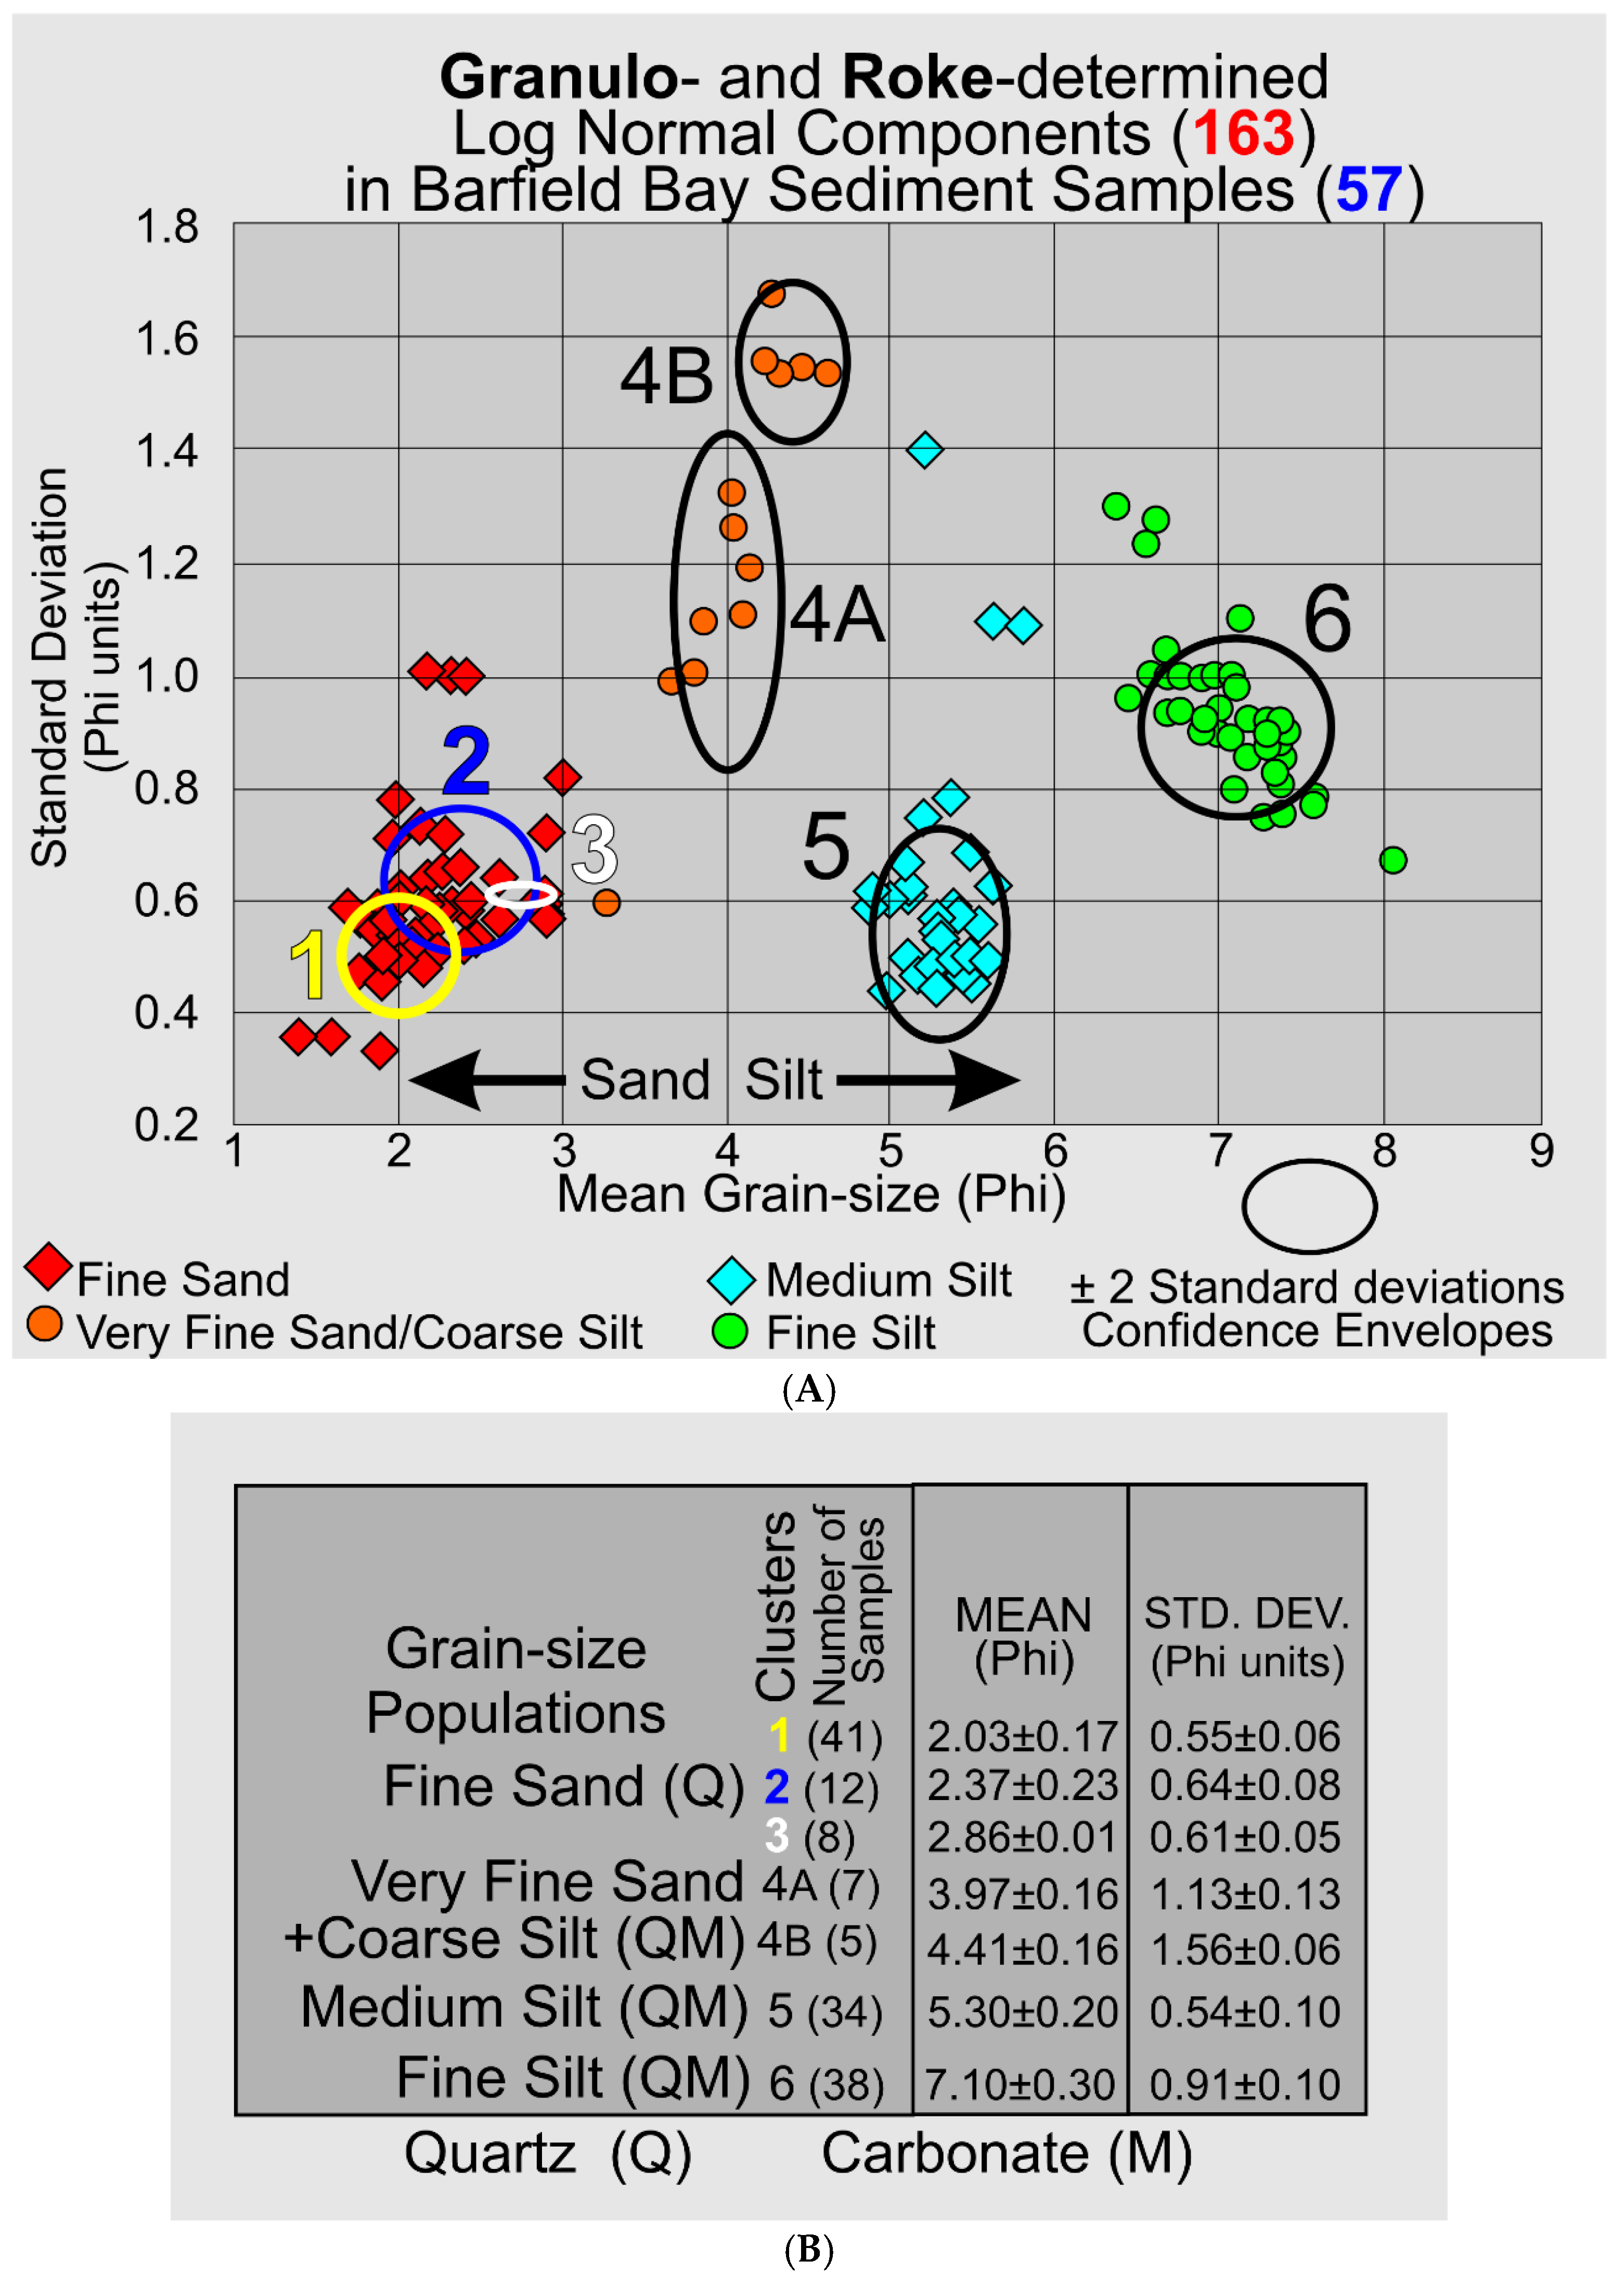
Figure 13.
A North/South stratigraphic cross-section through Barfield Bay, across the Horrs Island dune, and out into Caxambas Pass showing Cores 5, 4, 3, 2, and 1. The red-filled circles mark the locations of the 21 mollusk samples of the bioturbated Barfield Bay sediment-fill and the locations of the 14 mollusk samples in Core 1. The green stars mark the locations of the 46 foraminifera samples. The distributions of the benthic foraminiferans Ammonia sp., Elphidium spp., and the miliolids are shown by the shaded vertical bands. The core depths are decompacted and have a MSL datum. The mollusk symbol occurrences reflect descriptions of the actual core and not the specific mollusk samples; there are more Crassostrea virginica than would be expected given the sample identifications. At present there are no data that allow for the placement of Core 2 and Core 3 flooding surfaces into adjacent cores.
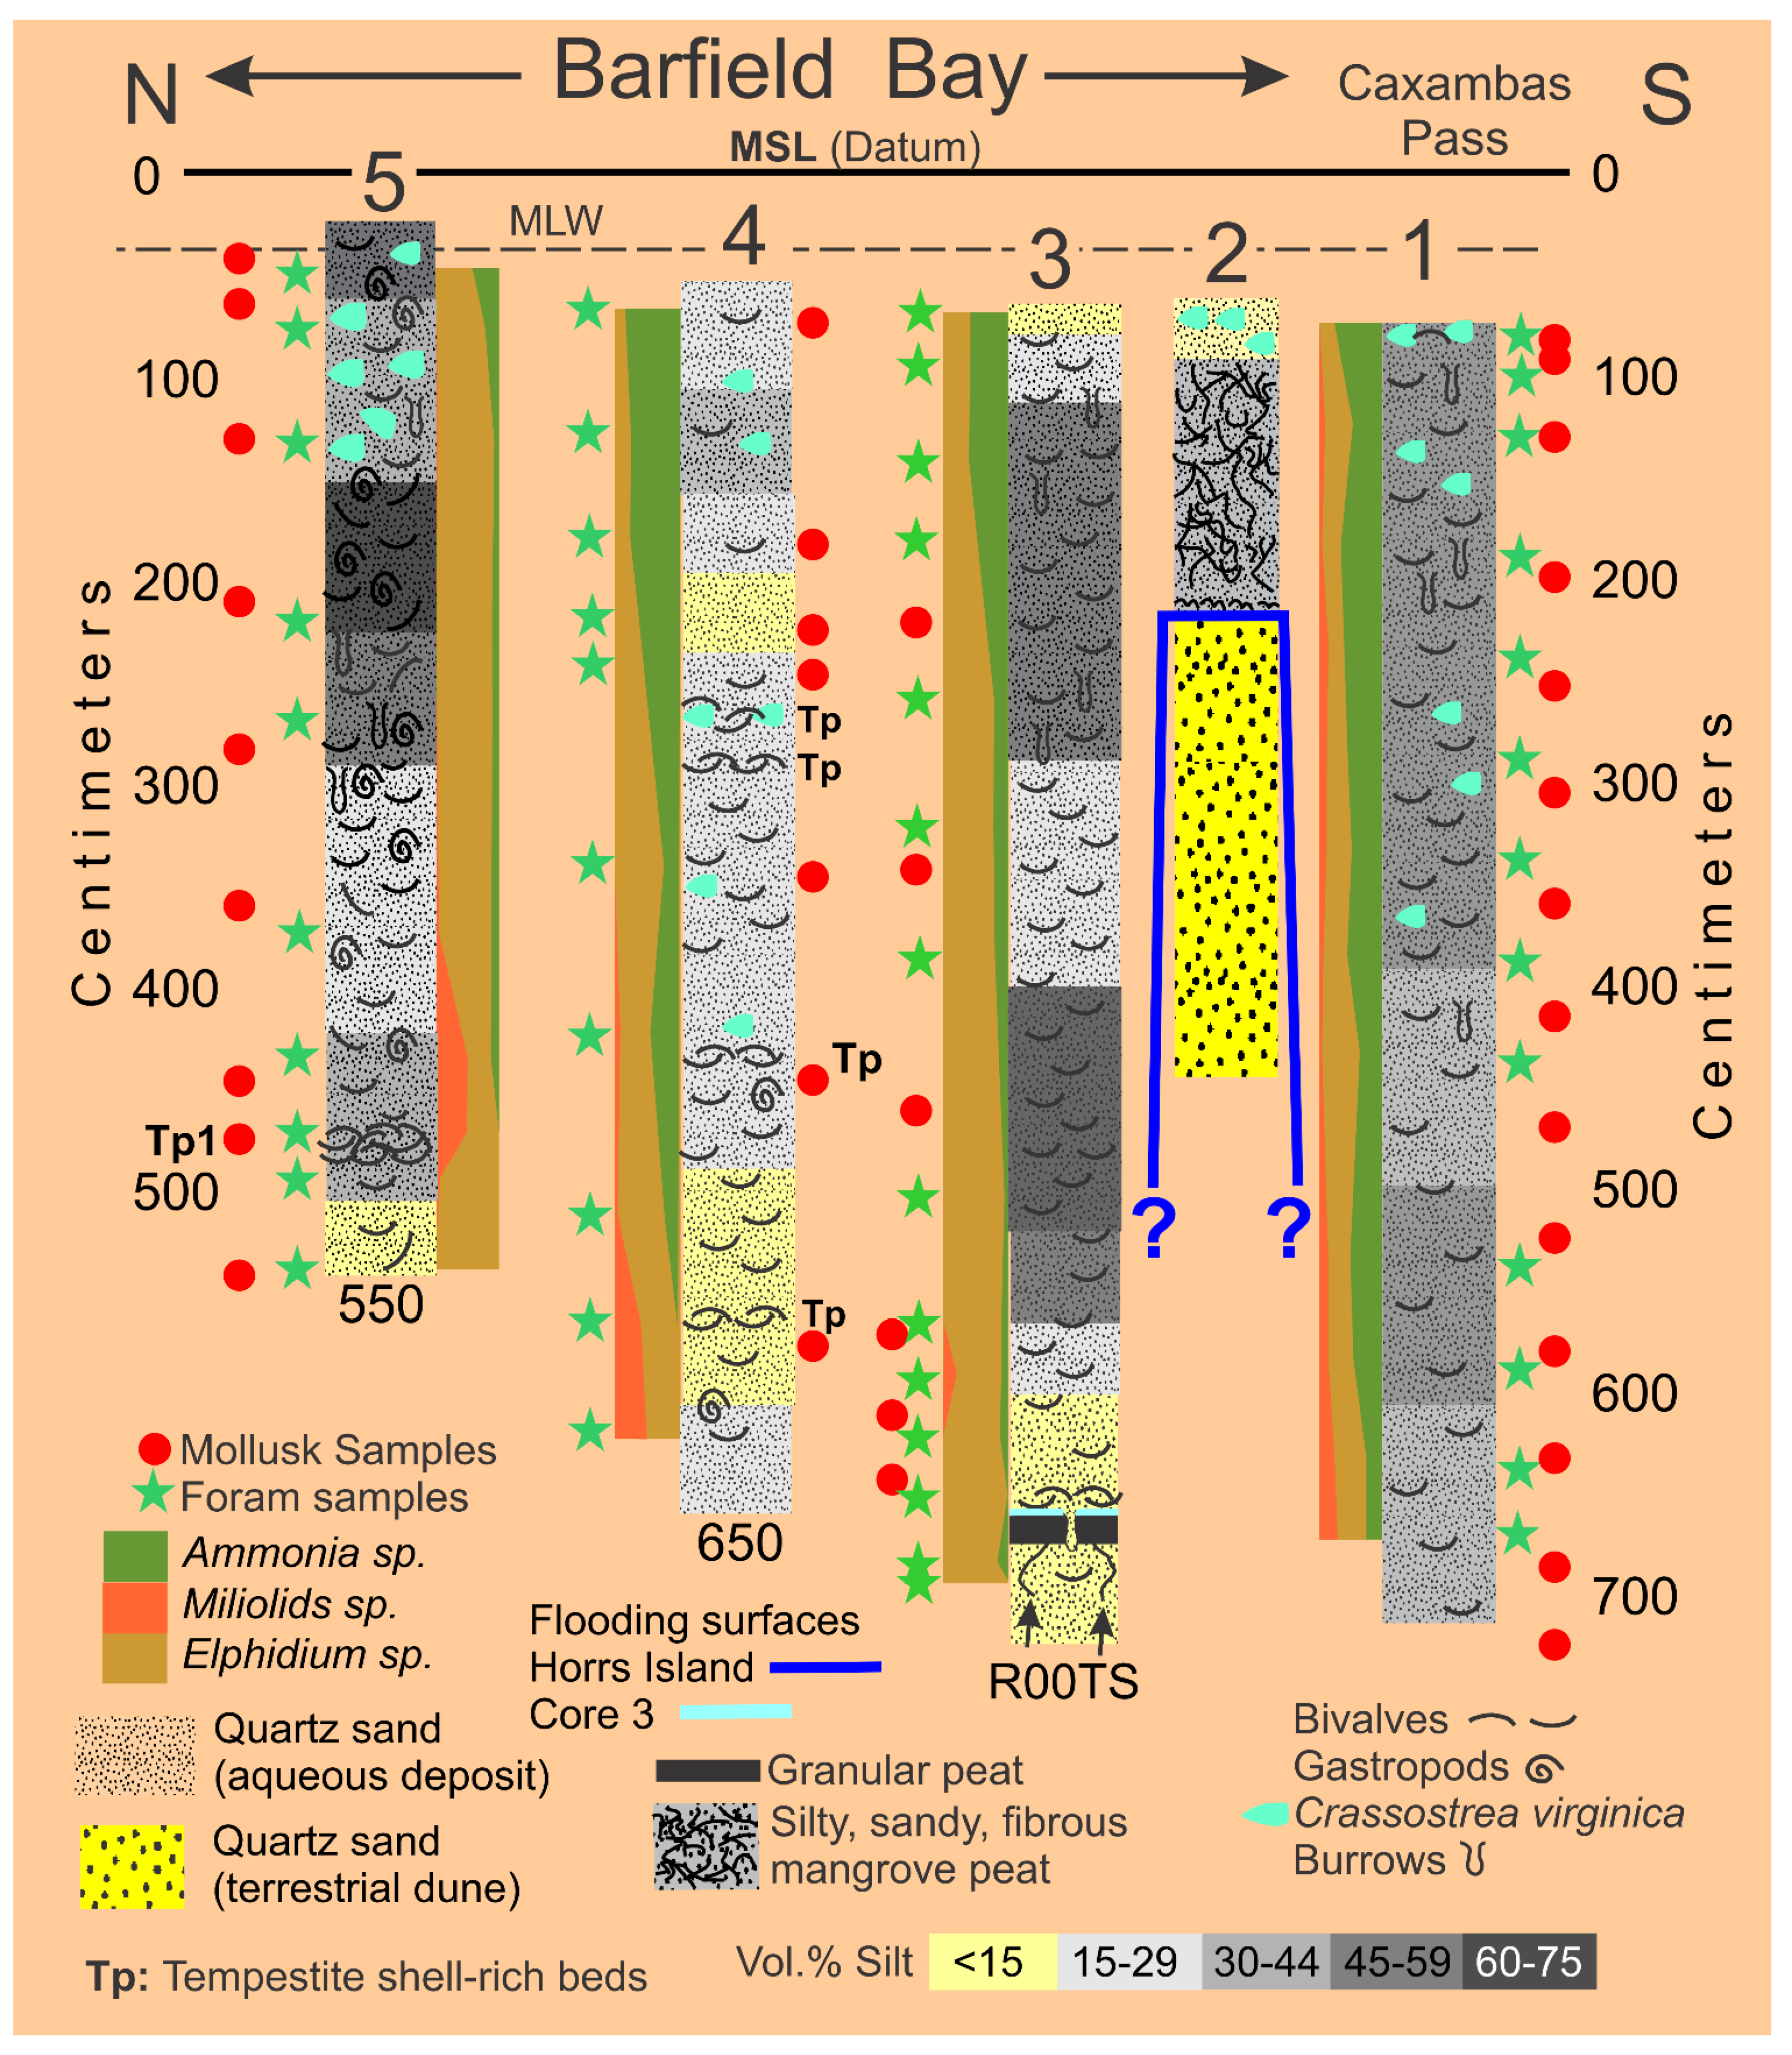
Figure 14.
A. Diagrams showing the relative abundances, diversity, and evenness of the mollusk population identified in the 21 samples (from Cores 3, 4, and 5) of the Barfield Bay bioturbated sediment-fill. The following indices have been calculated for the distributions shown in Panels A (entire 686 individuals) and B (species with ≥3 individuals): D=Simpson Concentration Index (0-1 with 0 being maximum diversity), Dmax=value that represents maximum diversity, SEQ=Simpson Equitability Index A (0-1 with 1 being perfect evenness).H=Shannon Diversity Index, Hmax=maximum diversity for Shannon Diversity Index, J=Pielou Evenness [29] (0-1 with 1 being maximum evenness). The vertical, red-dashed lines in Panels A and B indicate the percentage abundance for perfect evenness for the given distribution. Panel C identifies the 7 Critical Mollusks which do occur in all three Barfield Bay cores and are sufficiently abundant that they could occur in all 21 Barfield Bay mollusk samples. It is readily apparent that the abundance of the bivalve Parastarte triquetra, shown as a purple line marked with Pt, may be in some way anomalous. B. Images of the seven Critical Mollusks identified in the Barfield Bay mollusk population. GASTROPODS: (A) Houbricka incisa UF 506186, USA, Florida, Lee County; (B) Acteocina canaliculata UF 250394, USA, Florida Palm Beach County. BIVALVES: (C) Anomia simplex UF 15402, USA, Florida, Lee County; (D) Chione elevata UF 536755, USA, Florida Levy County; (E) Cardites floridanus UF 510768, USA, Florida, Pinellas County; (F) Transennella conradina UF 370120, USA, Florida, Miami-Dade County; (G) Parastarte triquetra UF 528945, USA, Florida, Gulf County. Images provided by Dr. Roger Portell, Florida State Museum, Univ. of Florida.
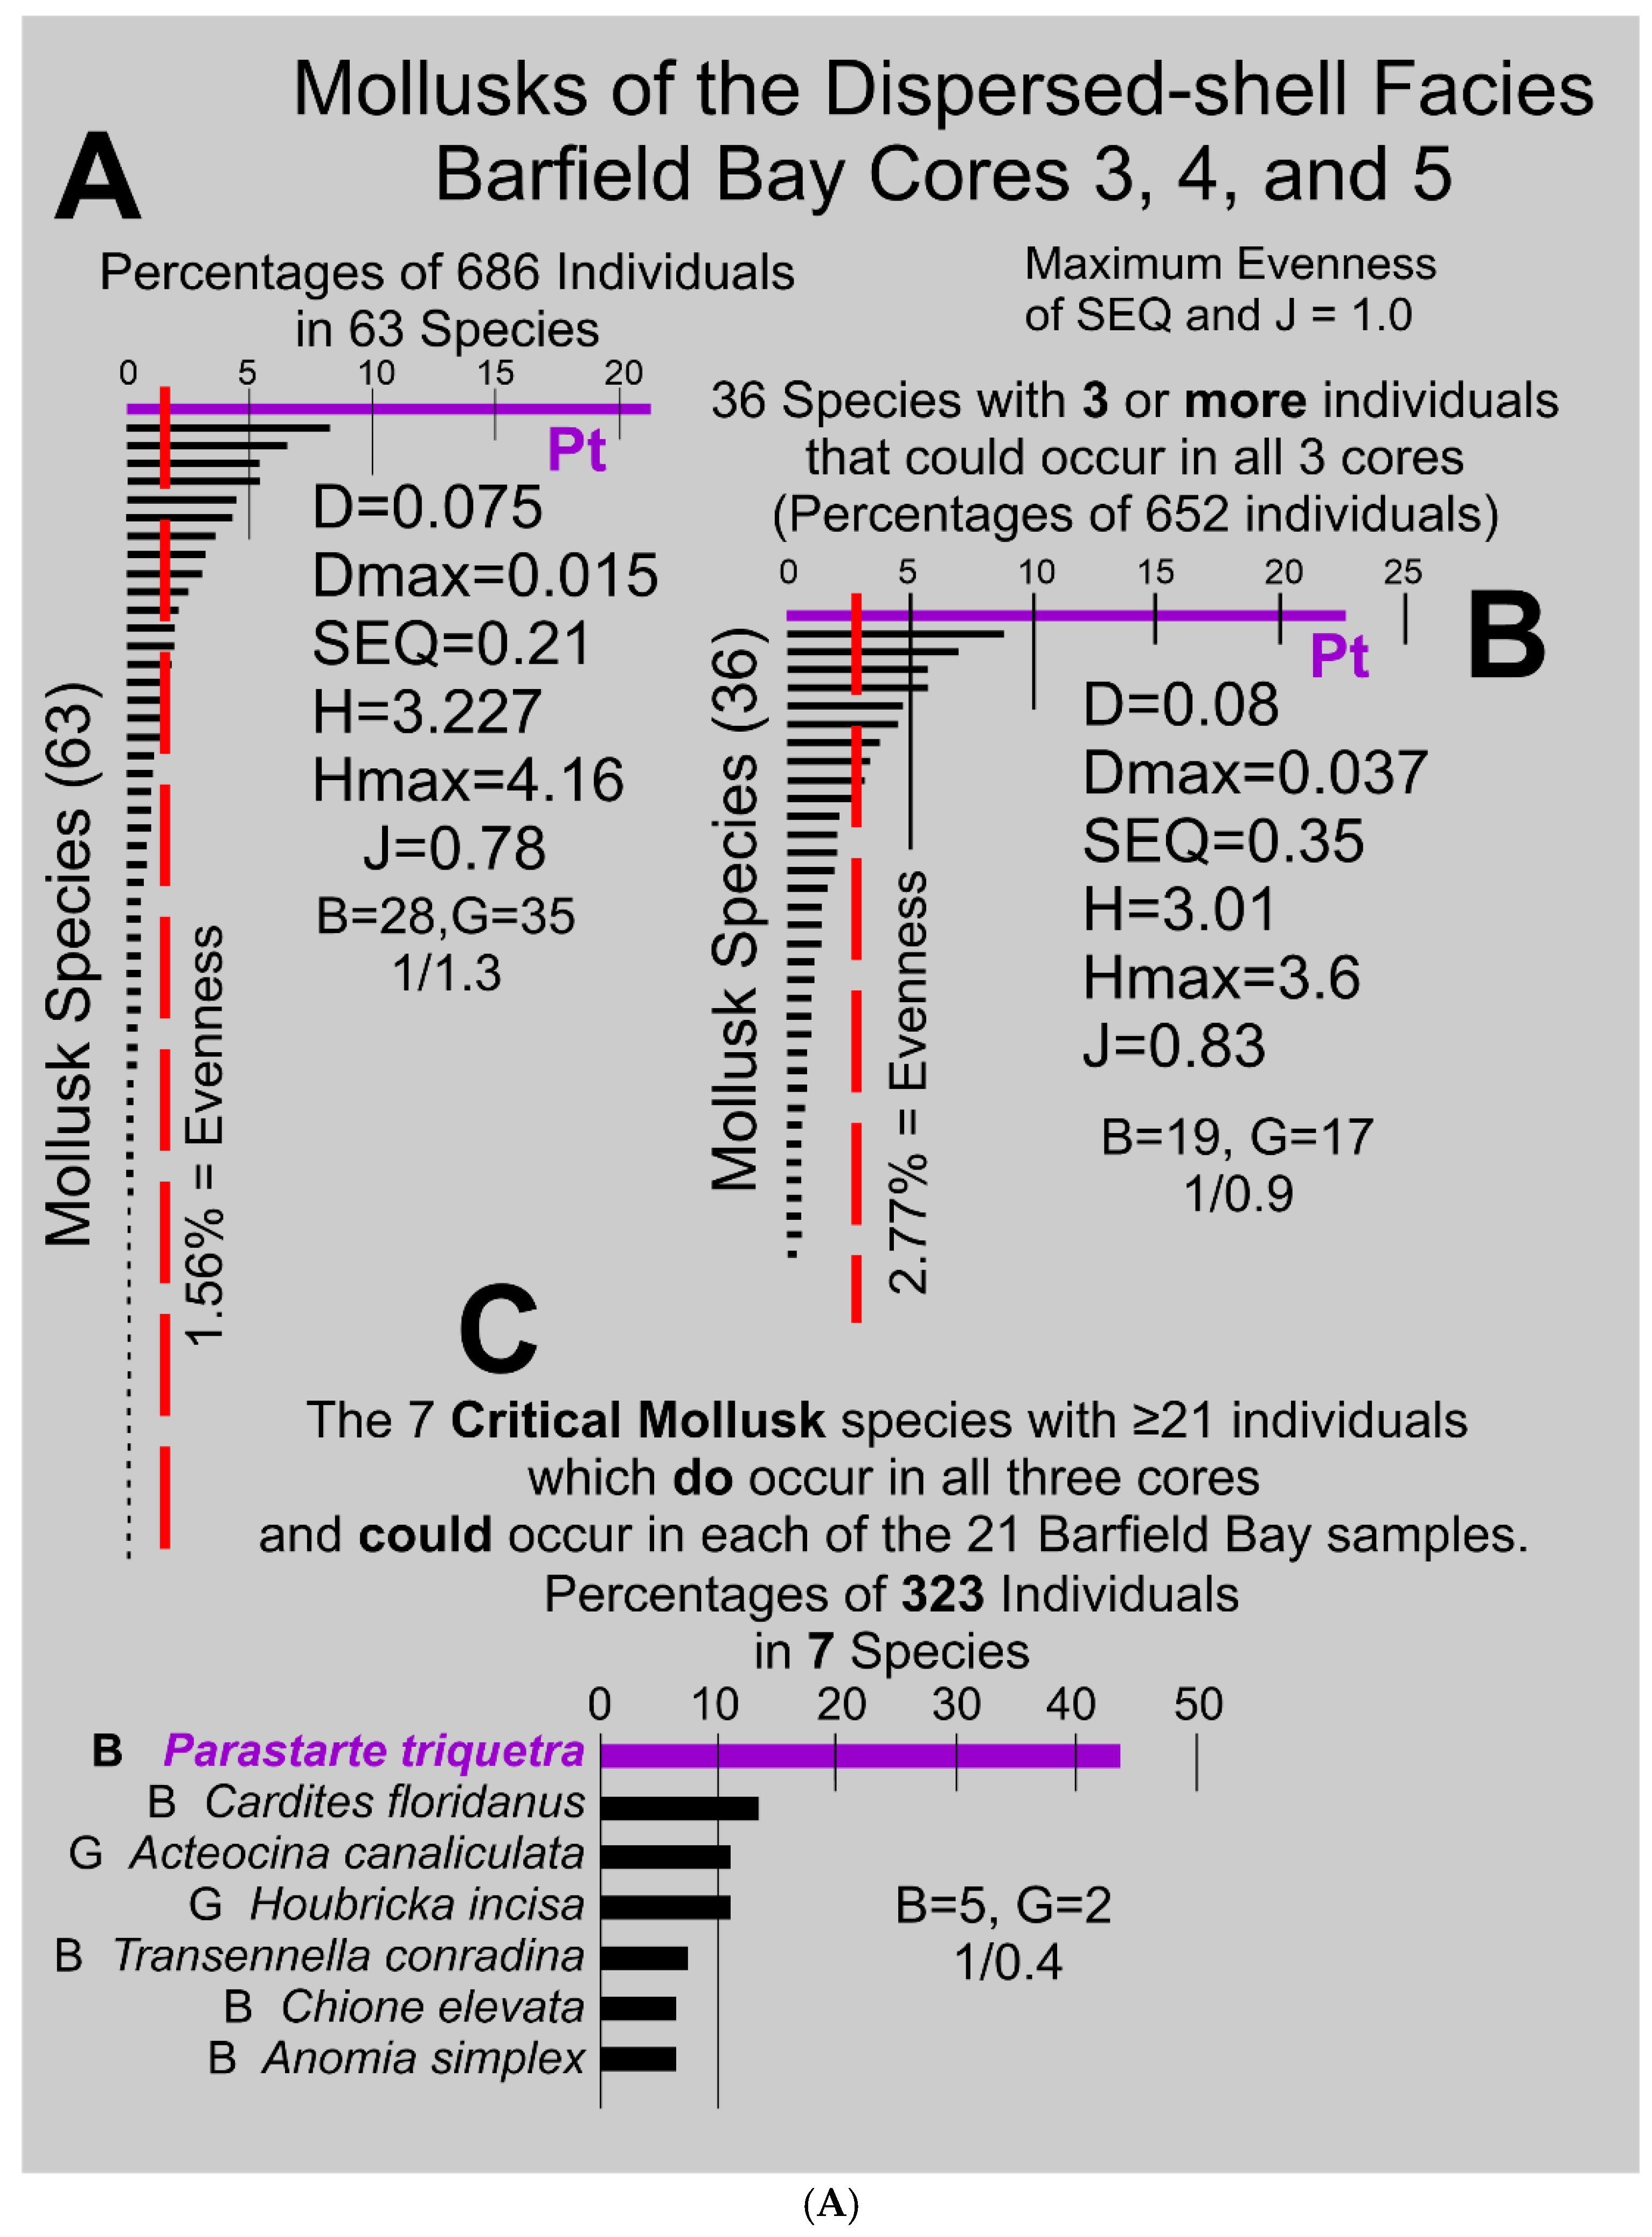
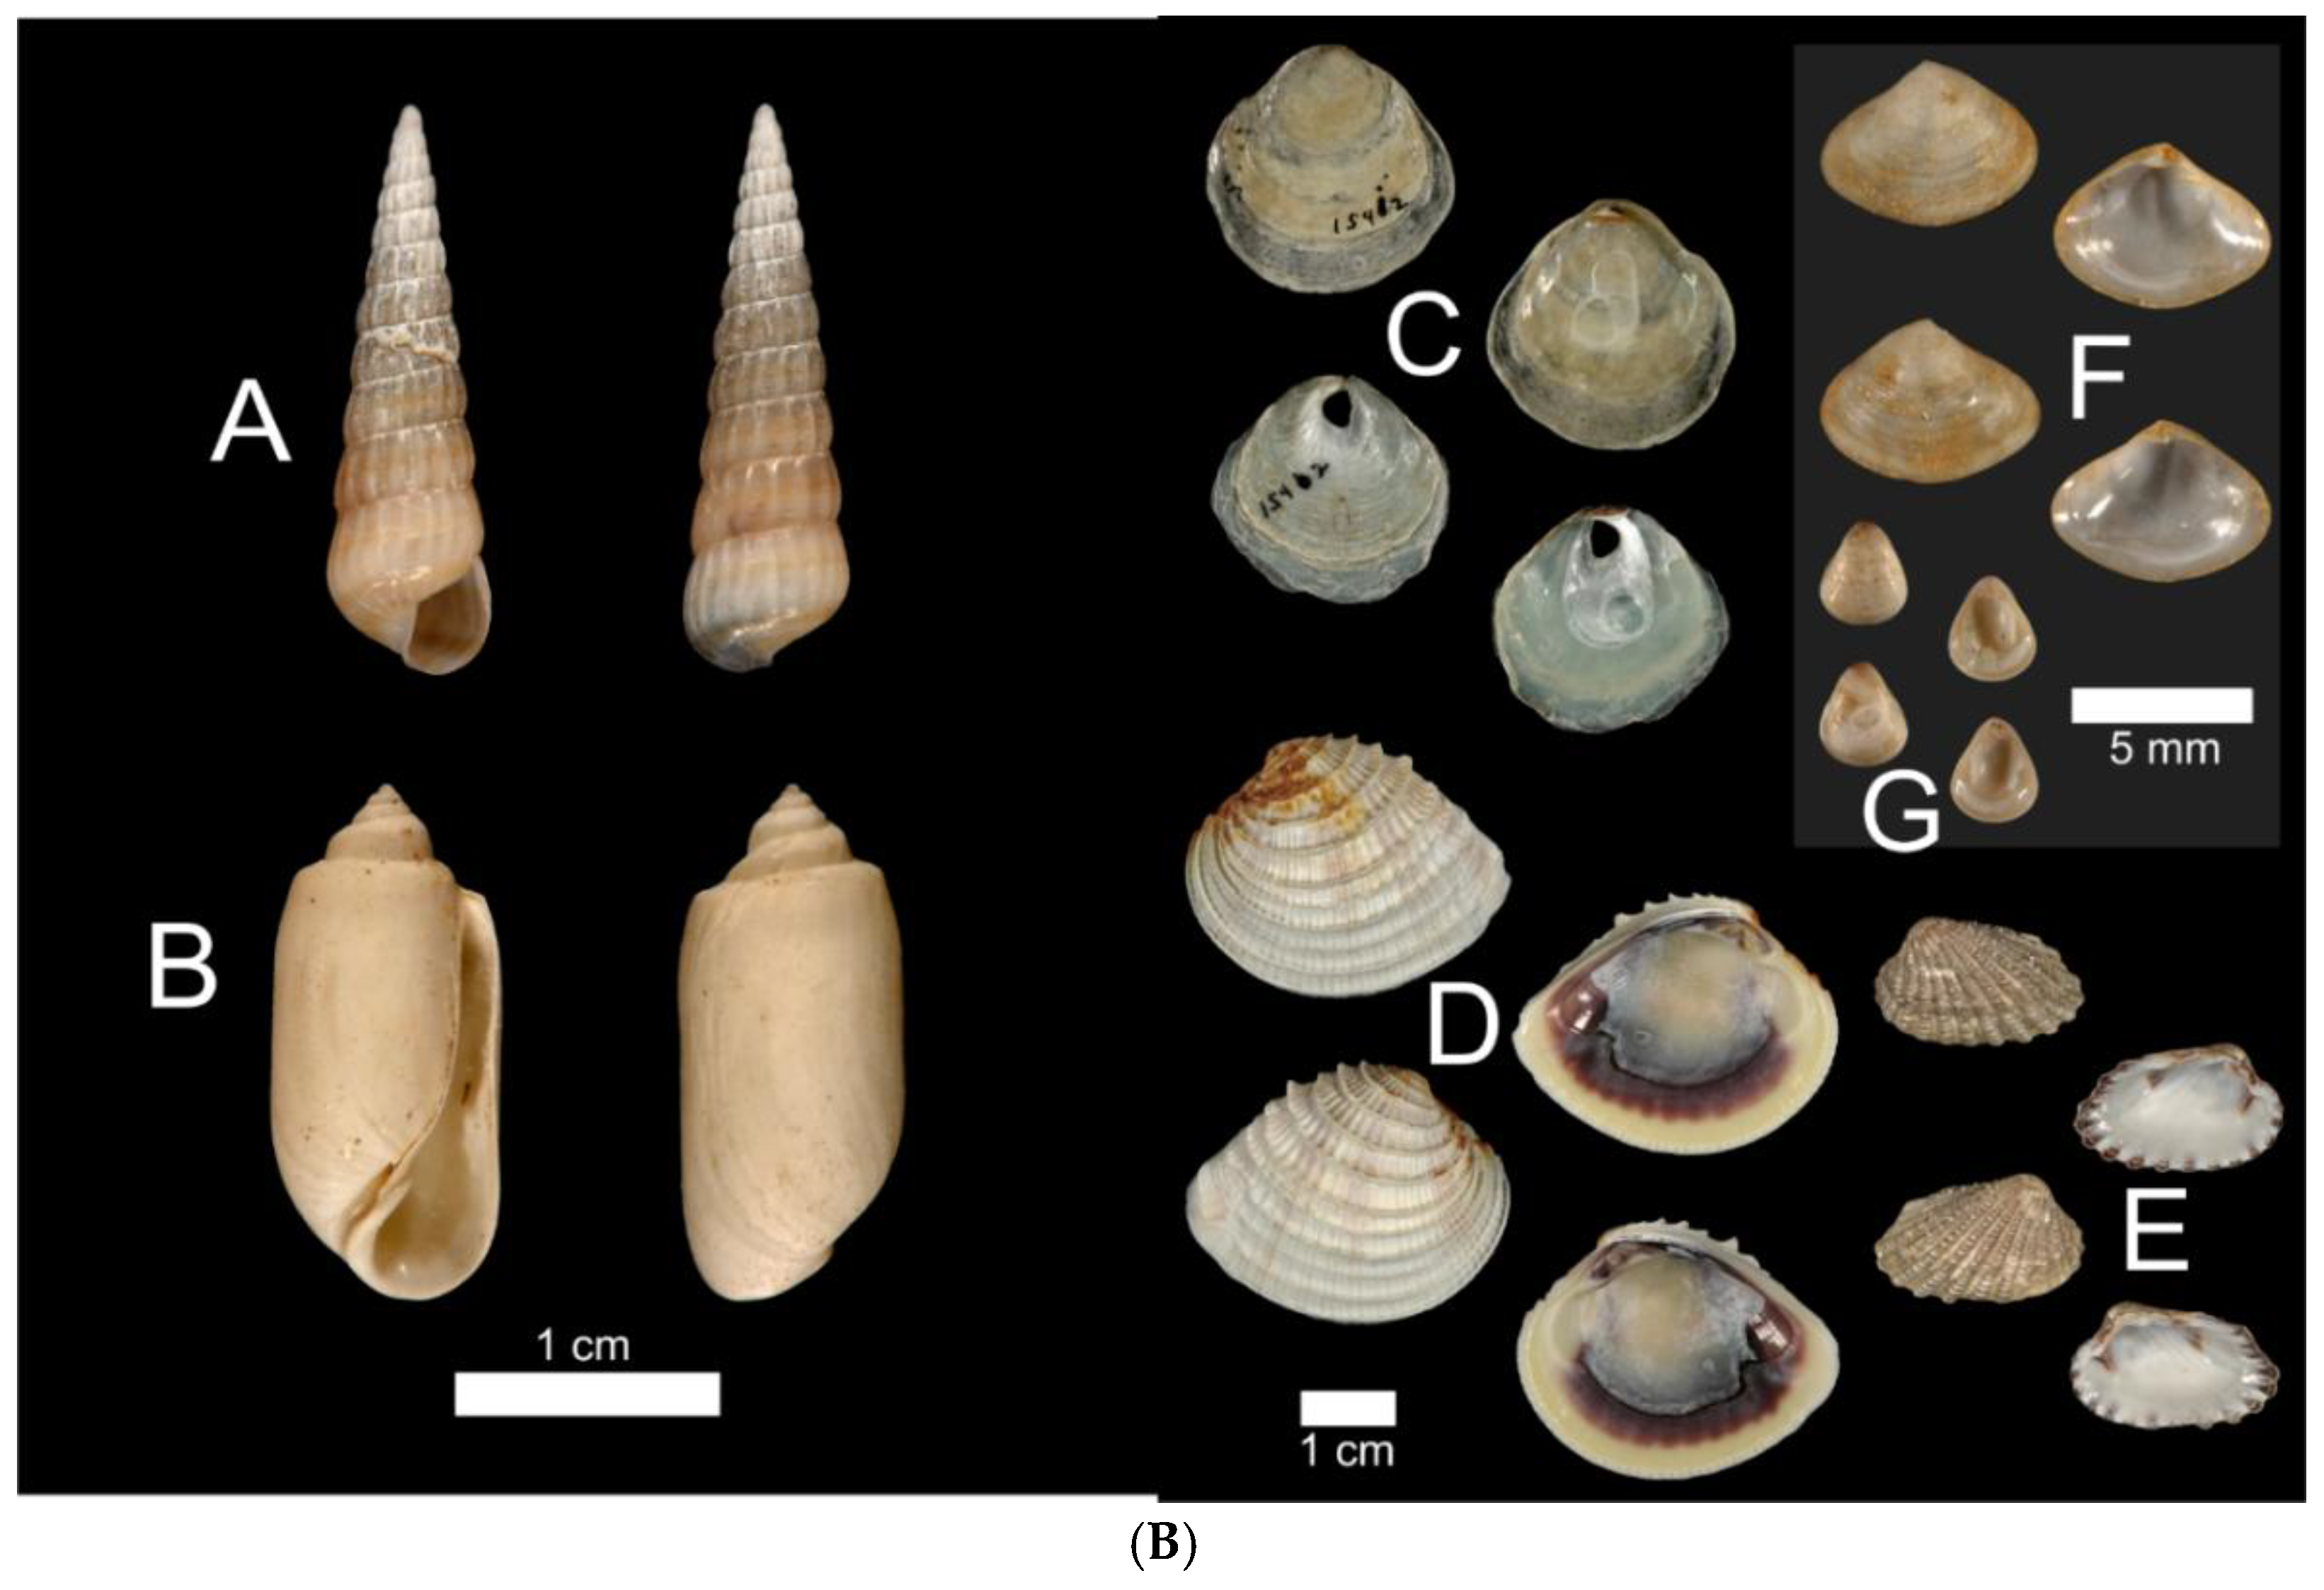
Figure 15.
The stratigraphic distribution of the seven Critical Mollusks throughout the twenty-one (21) samples of the bioturbated sediment-fill in Cores 3, 4, and 5. The letters (B) and (G) indicate a bivalve and gastropod, respectively. The white circles indicate a missing Critical Mollusk in a given sample. The samples with the orange background contain six out of a possible seven Critical Mollusk species. The species in bold blue type are the twelve Salinity Mollusk species used to estimate the long-term salinity conditions in Barfield Bay. Notice the widespread stratigraphic range of the stenohaline Houbricka incisa and the widespread, but core specific, stratigraphic ranges of the stenohaline Phrontis vibex and Abra aequalis.
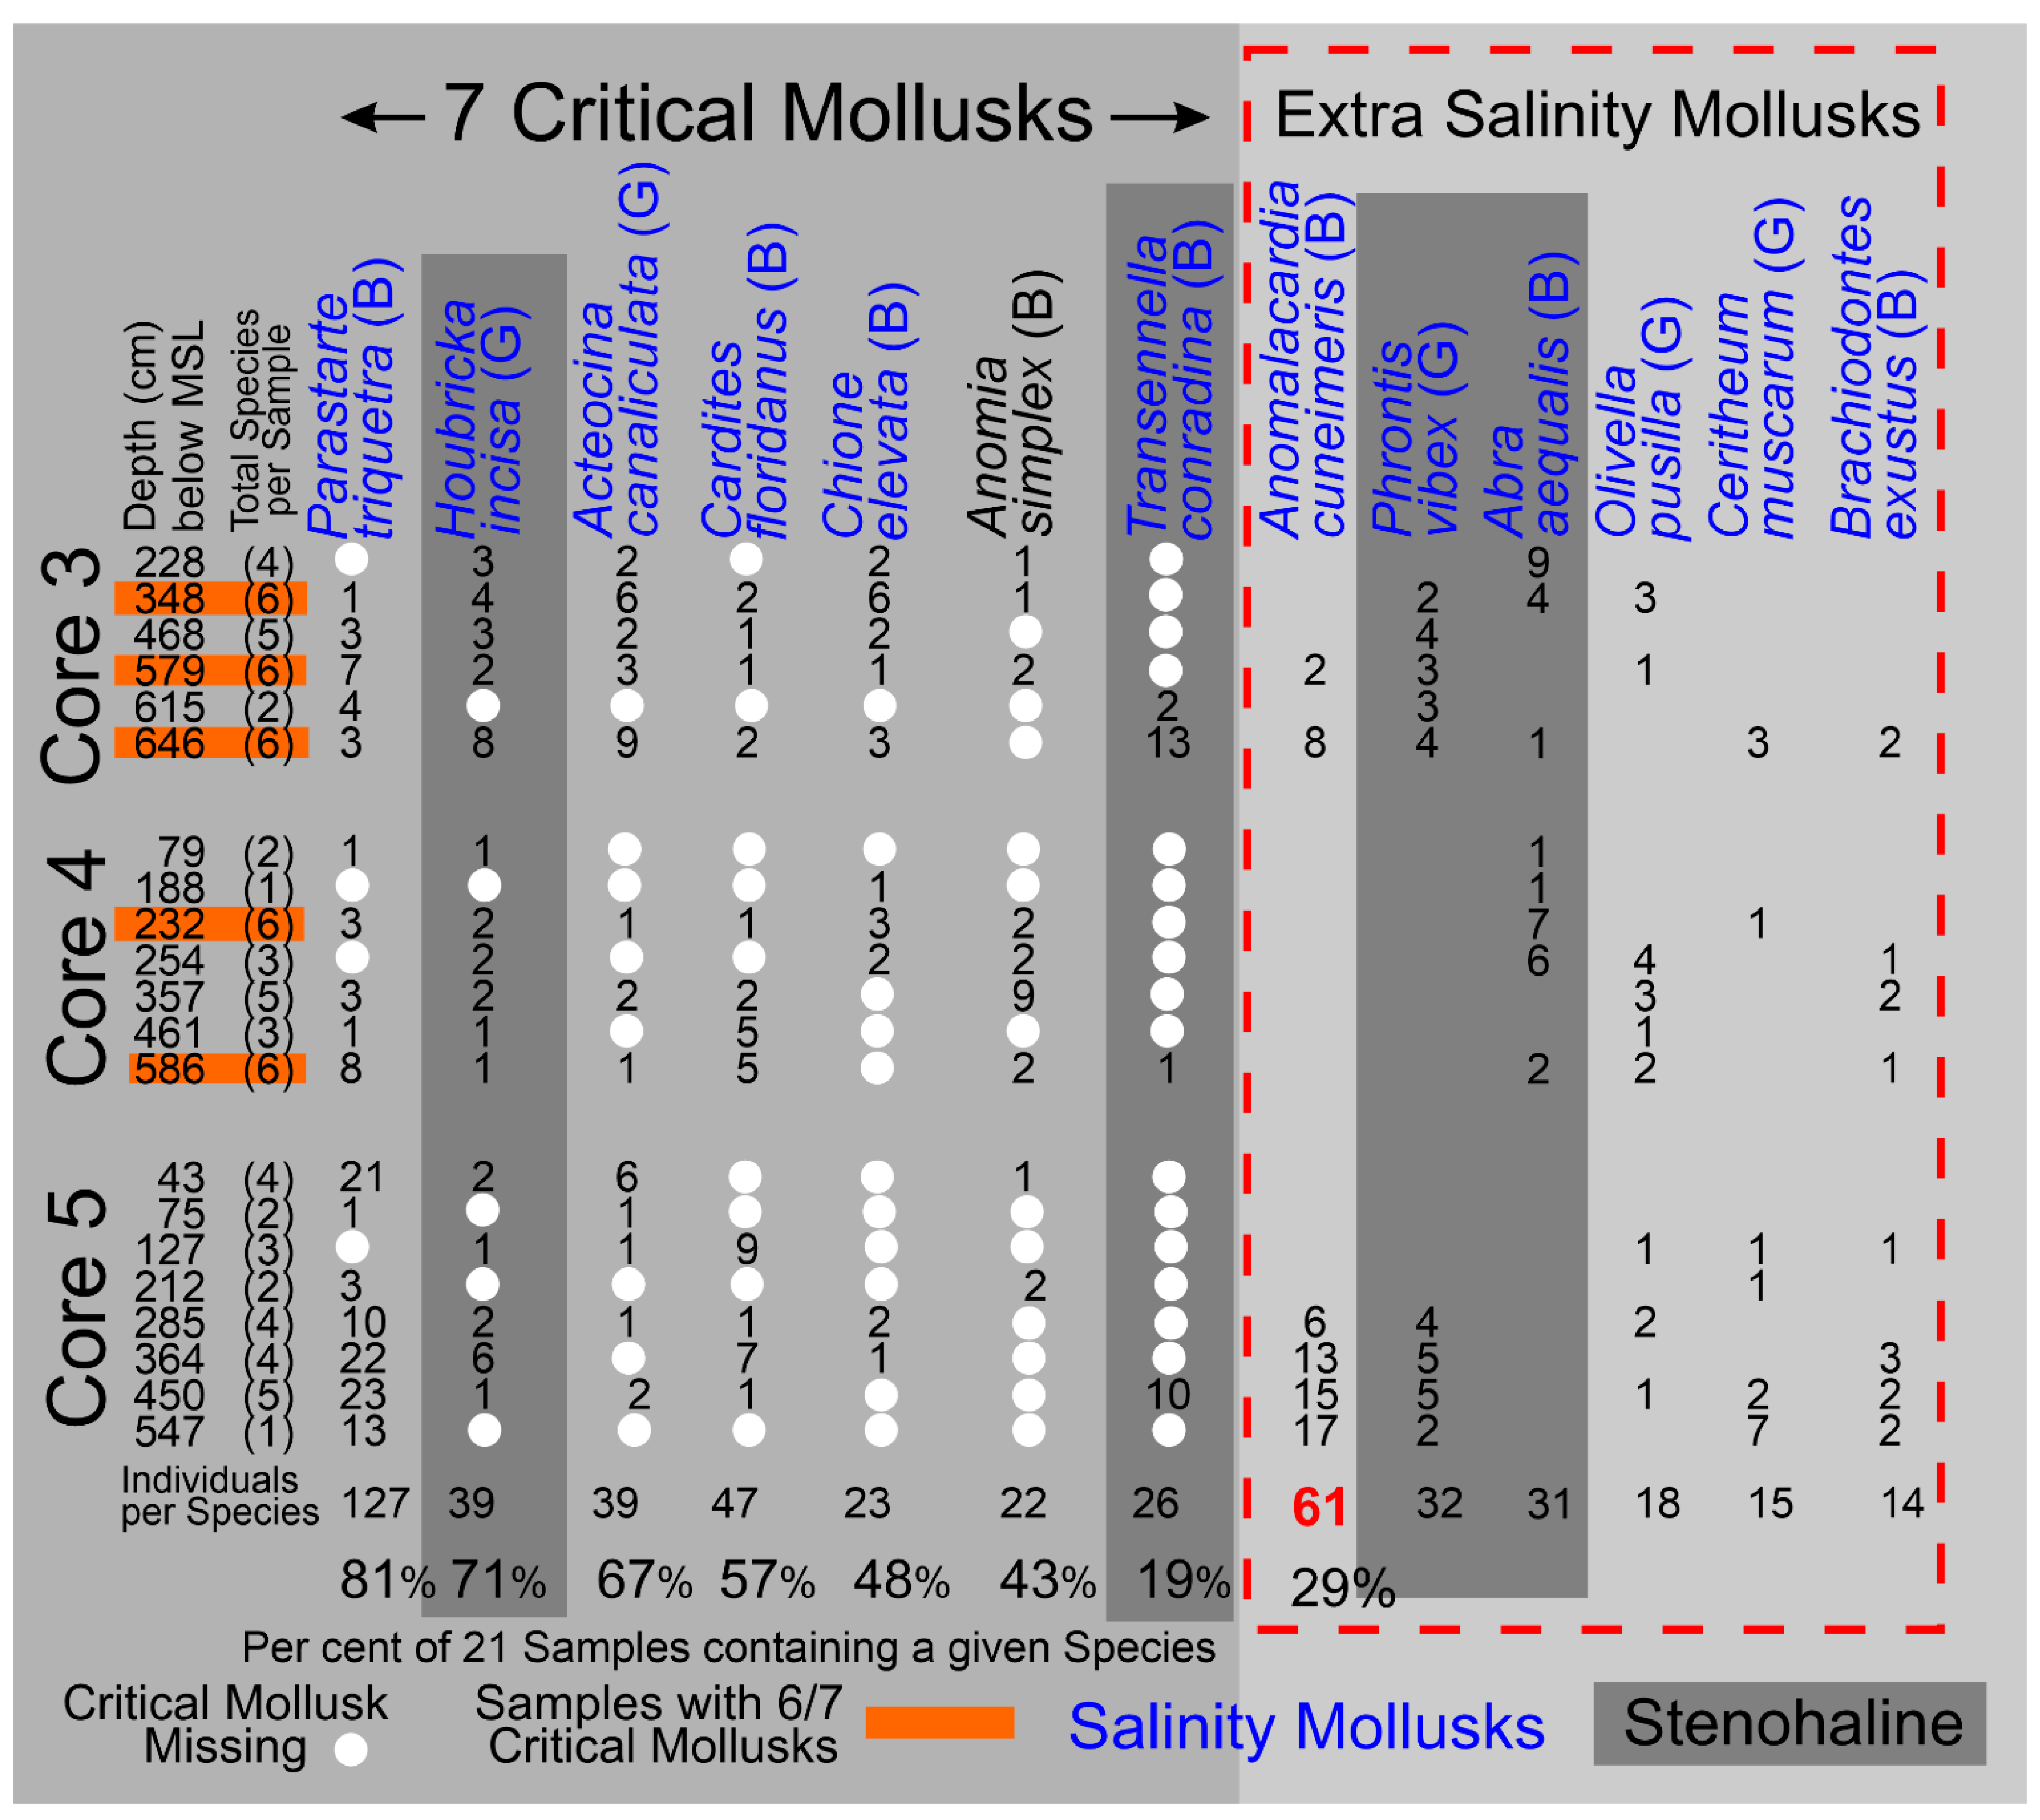
Figure 16.
Tempestite Tp1 in Core 5. Panel A contains a core photo of Tp1 in which the mollusk shells clearly touch each as well are arranged in a jumbled pattern. Both contacts are relatively sharp. Panel B presents a list of sixteen (16) mollusk species identified in this unit; (NFDSF) indicates a species not identified in the bioturbated sediment-fill. Panel C shows the distribution of the percentages of the individual 16 species. This population has a diversity D [27] of 0.32 (Dmax=0.0625) and an evenness SEQ [27] of 0.22 (perfect evenness=1) and can be considered to be of low diversity.
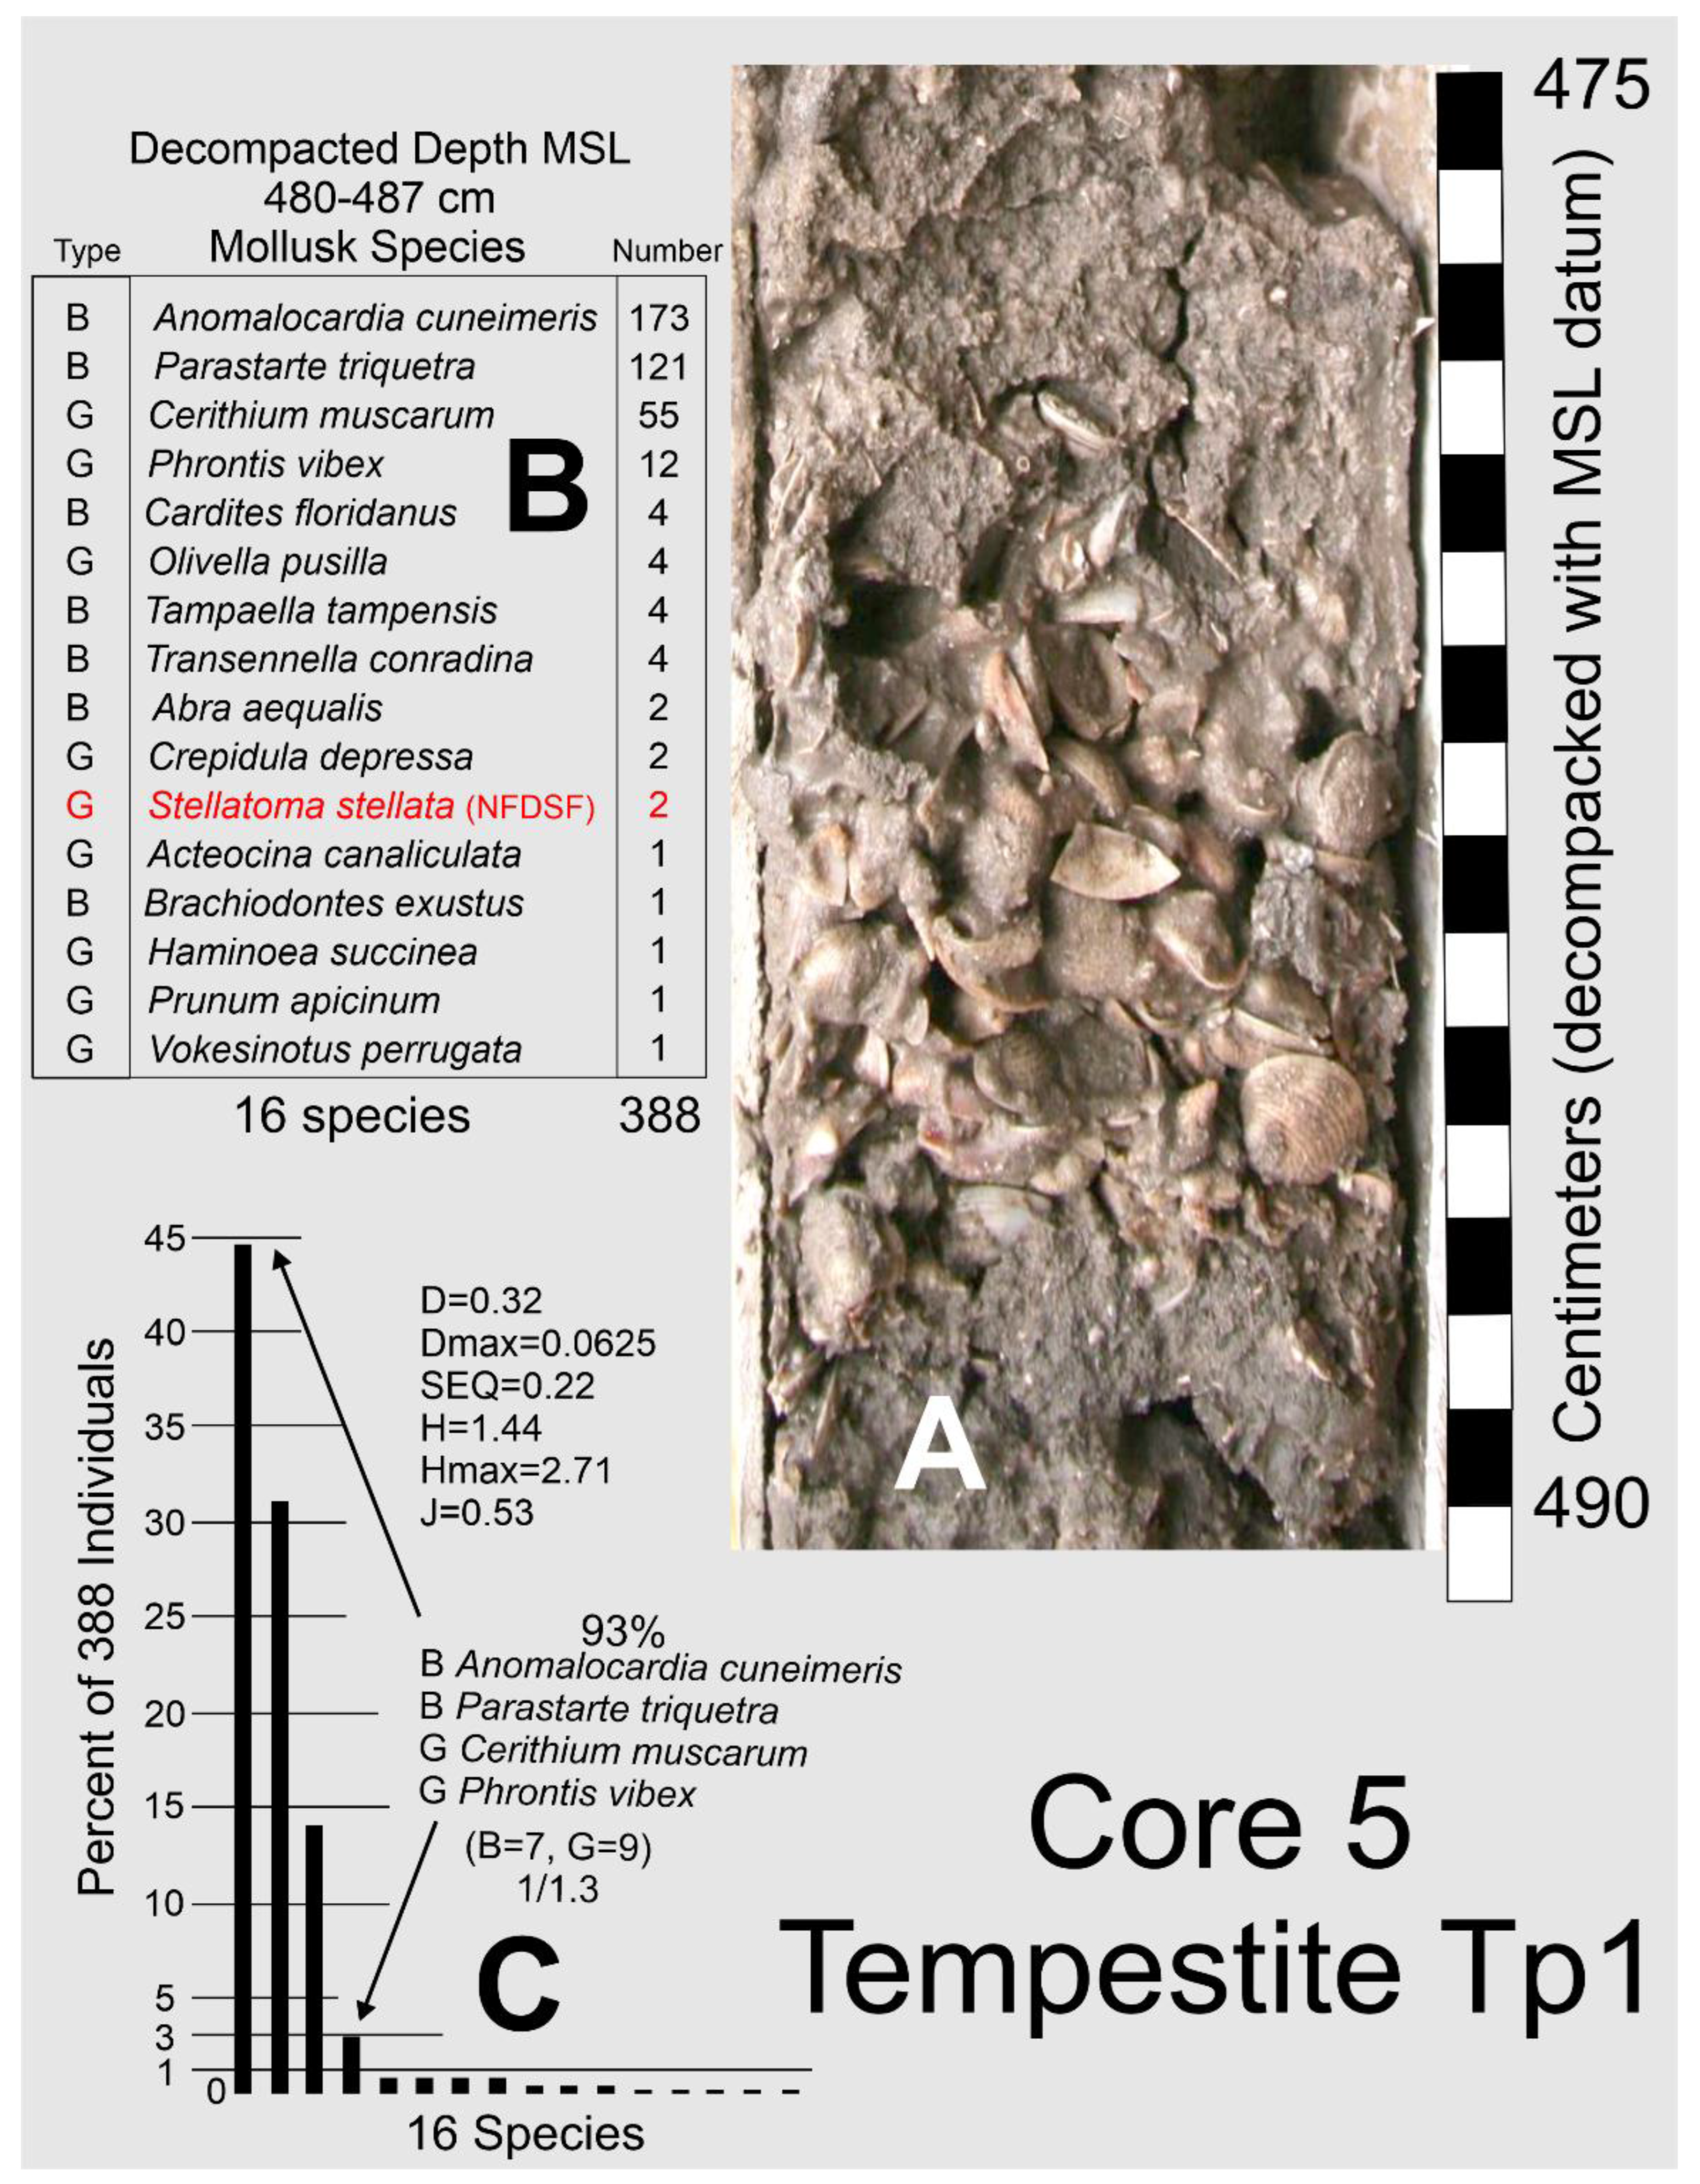
Figure 17.
Panel A shows the distribution of the 144 individuals over the 38 species identified in the 14 samples from Core 1 which is located on the Caxambas Pass flood-tidal delta. The red dashed line indicates the percentage abundance for perfect evenness for this distribution. The 13 most-abundant species, listed in order of abundance, account for 76% of the 144 individuals identified in the 14 samples. The three most abundant mollusks are, in order of abundance, the bivalves Nucula proxima and Chione elevata, followed by the gastropod Acteocina canaliculata. The species in blue type in Panel A are used to estimate long-term salinity.
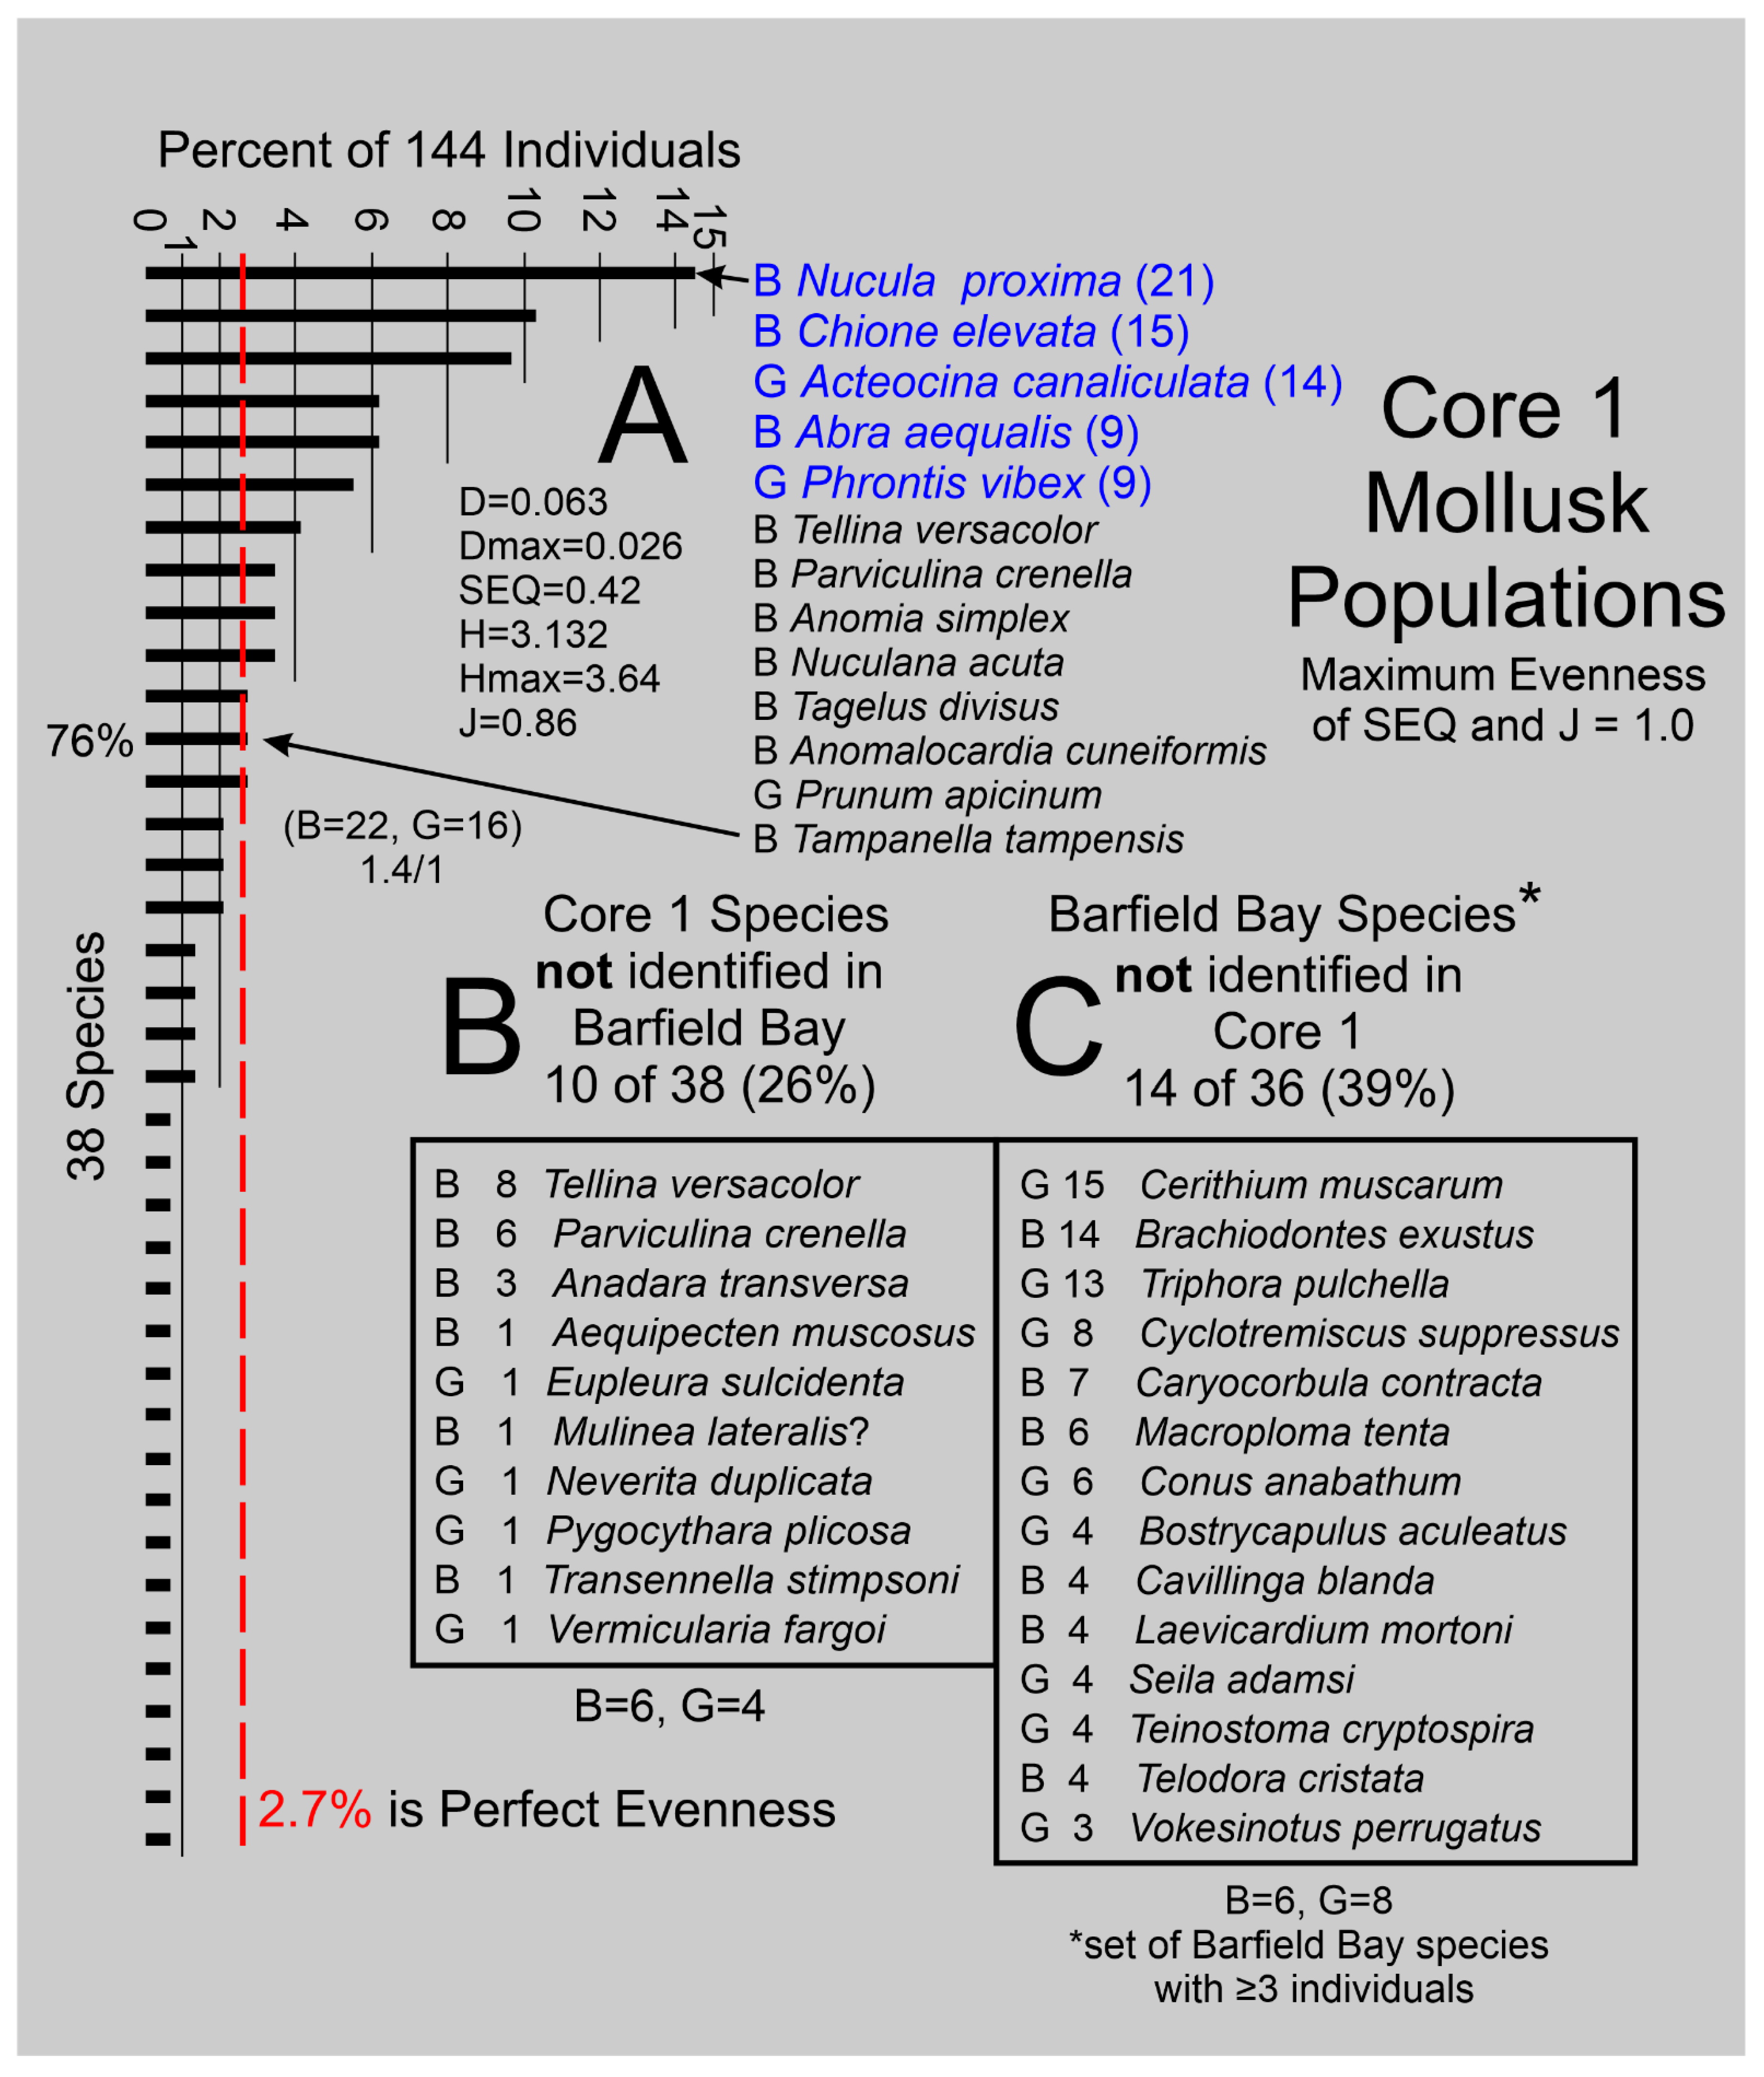
Figure 18.
A. Salinity estimates for Barfield Bay and Caxambas Pass based on mollusk populations. The salinity data [30,31] for each species are based on present-day conditions in southwest Florida. Stenohaline mollusks, their salinity means (rectangle) and 1 standard deviation ranges (double headed arrows), are shown in red. More euryhaline mollusks, their salinity means (rectangle) and 1 standard deviation ranges (double headed arrows), are shown in black. The essentially euhaline Cardites floridanus is shown in purple. These twelve (12) mollusks in Panel A account for 471 individuals out of a total of 686 (69%) identified in the bioturbated sediment-fill present in Barfield Bay. Panel B shows the salinity ranges for the more abundant mollusks from the Caxambas Pass Core 1. These five (5) mollusks account for 68 individuals out of a total of 144 (47%) identified in the silt-rich, quartz-sand facies present in Core 1. These salinity ranges have a common overlap of 25-32 psu, shown by the turquoise-colored bar and dashed-line outline, which is basically the range of the four stenohaline species. B. The stratigraphic distribution of the five salinity-critical mollusks in the Caxambas Pass Core 1 from Panel B in Figure 15A. The two stenohaline mollusks Abra aequalis and Phrontis vibex are present in 50% and 36% of all 14 samples, respectively. Furthermore, Abra aequalis is present throughout the thickness of Core 1, and Phrontis vibex is concentrated near the base of Core 1.
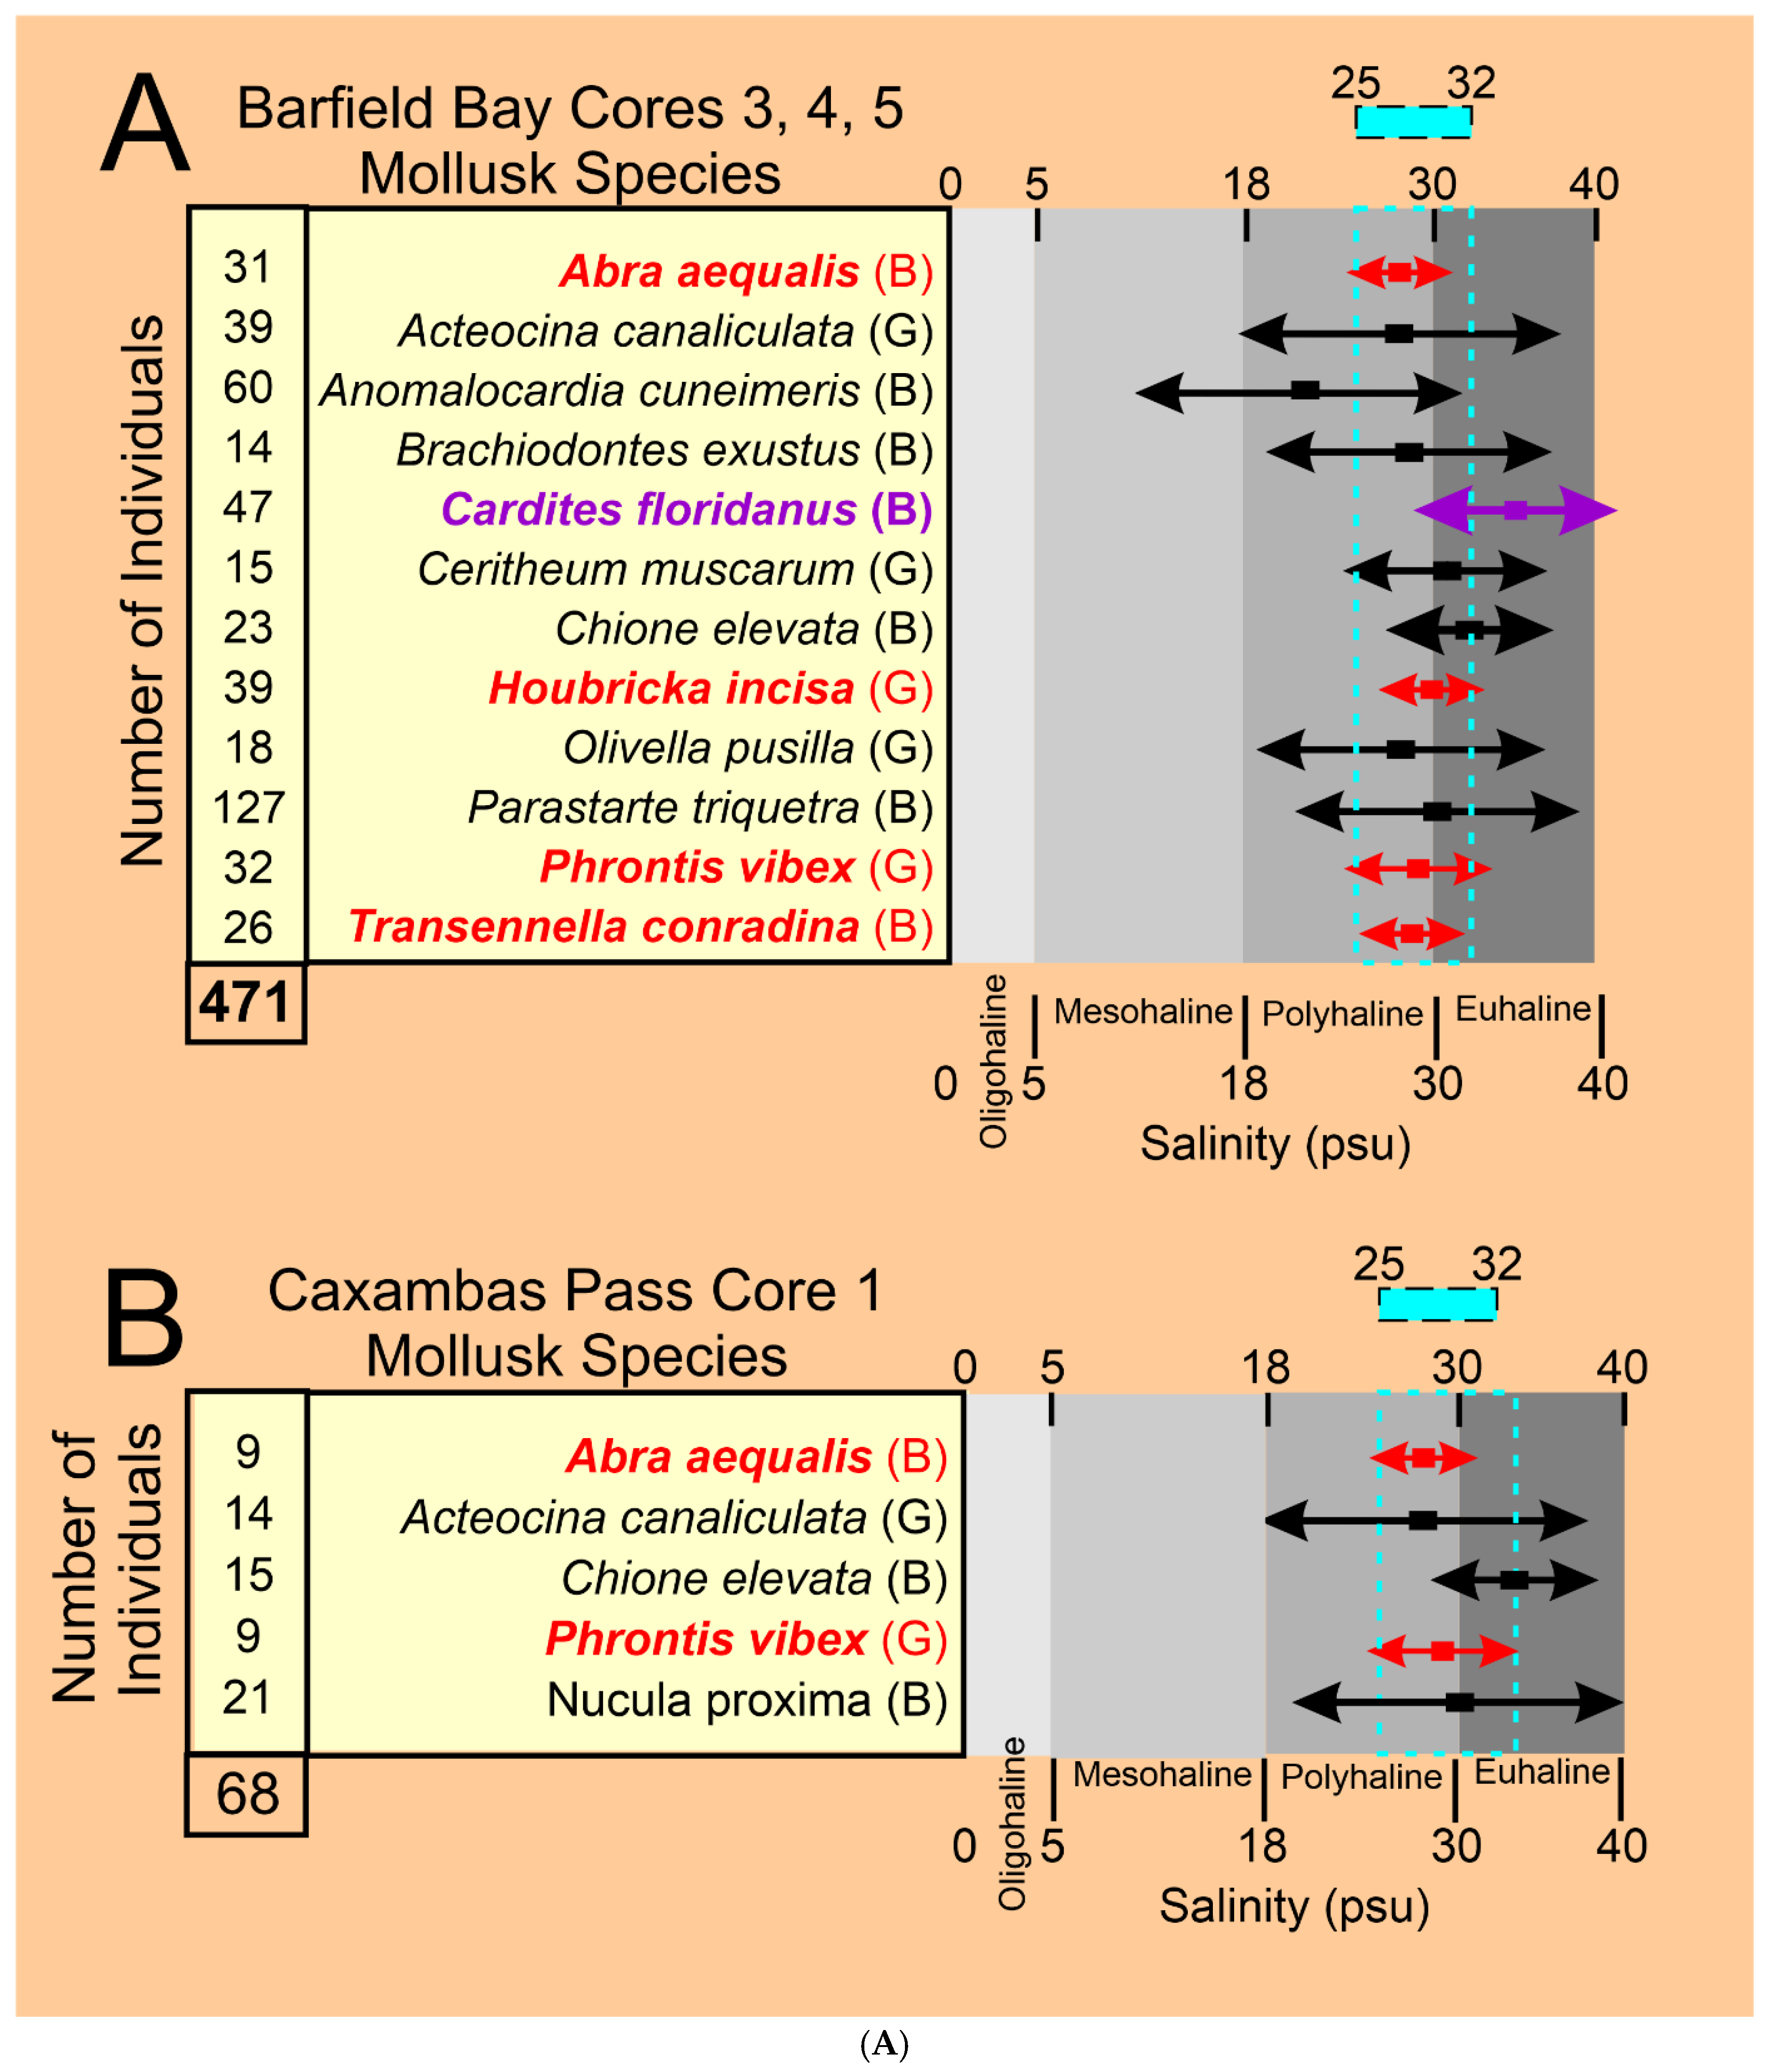
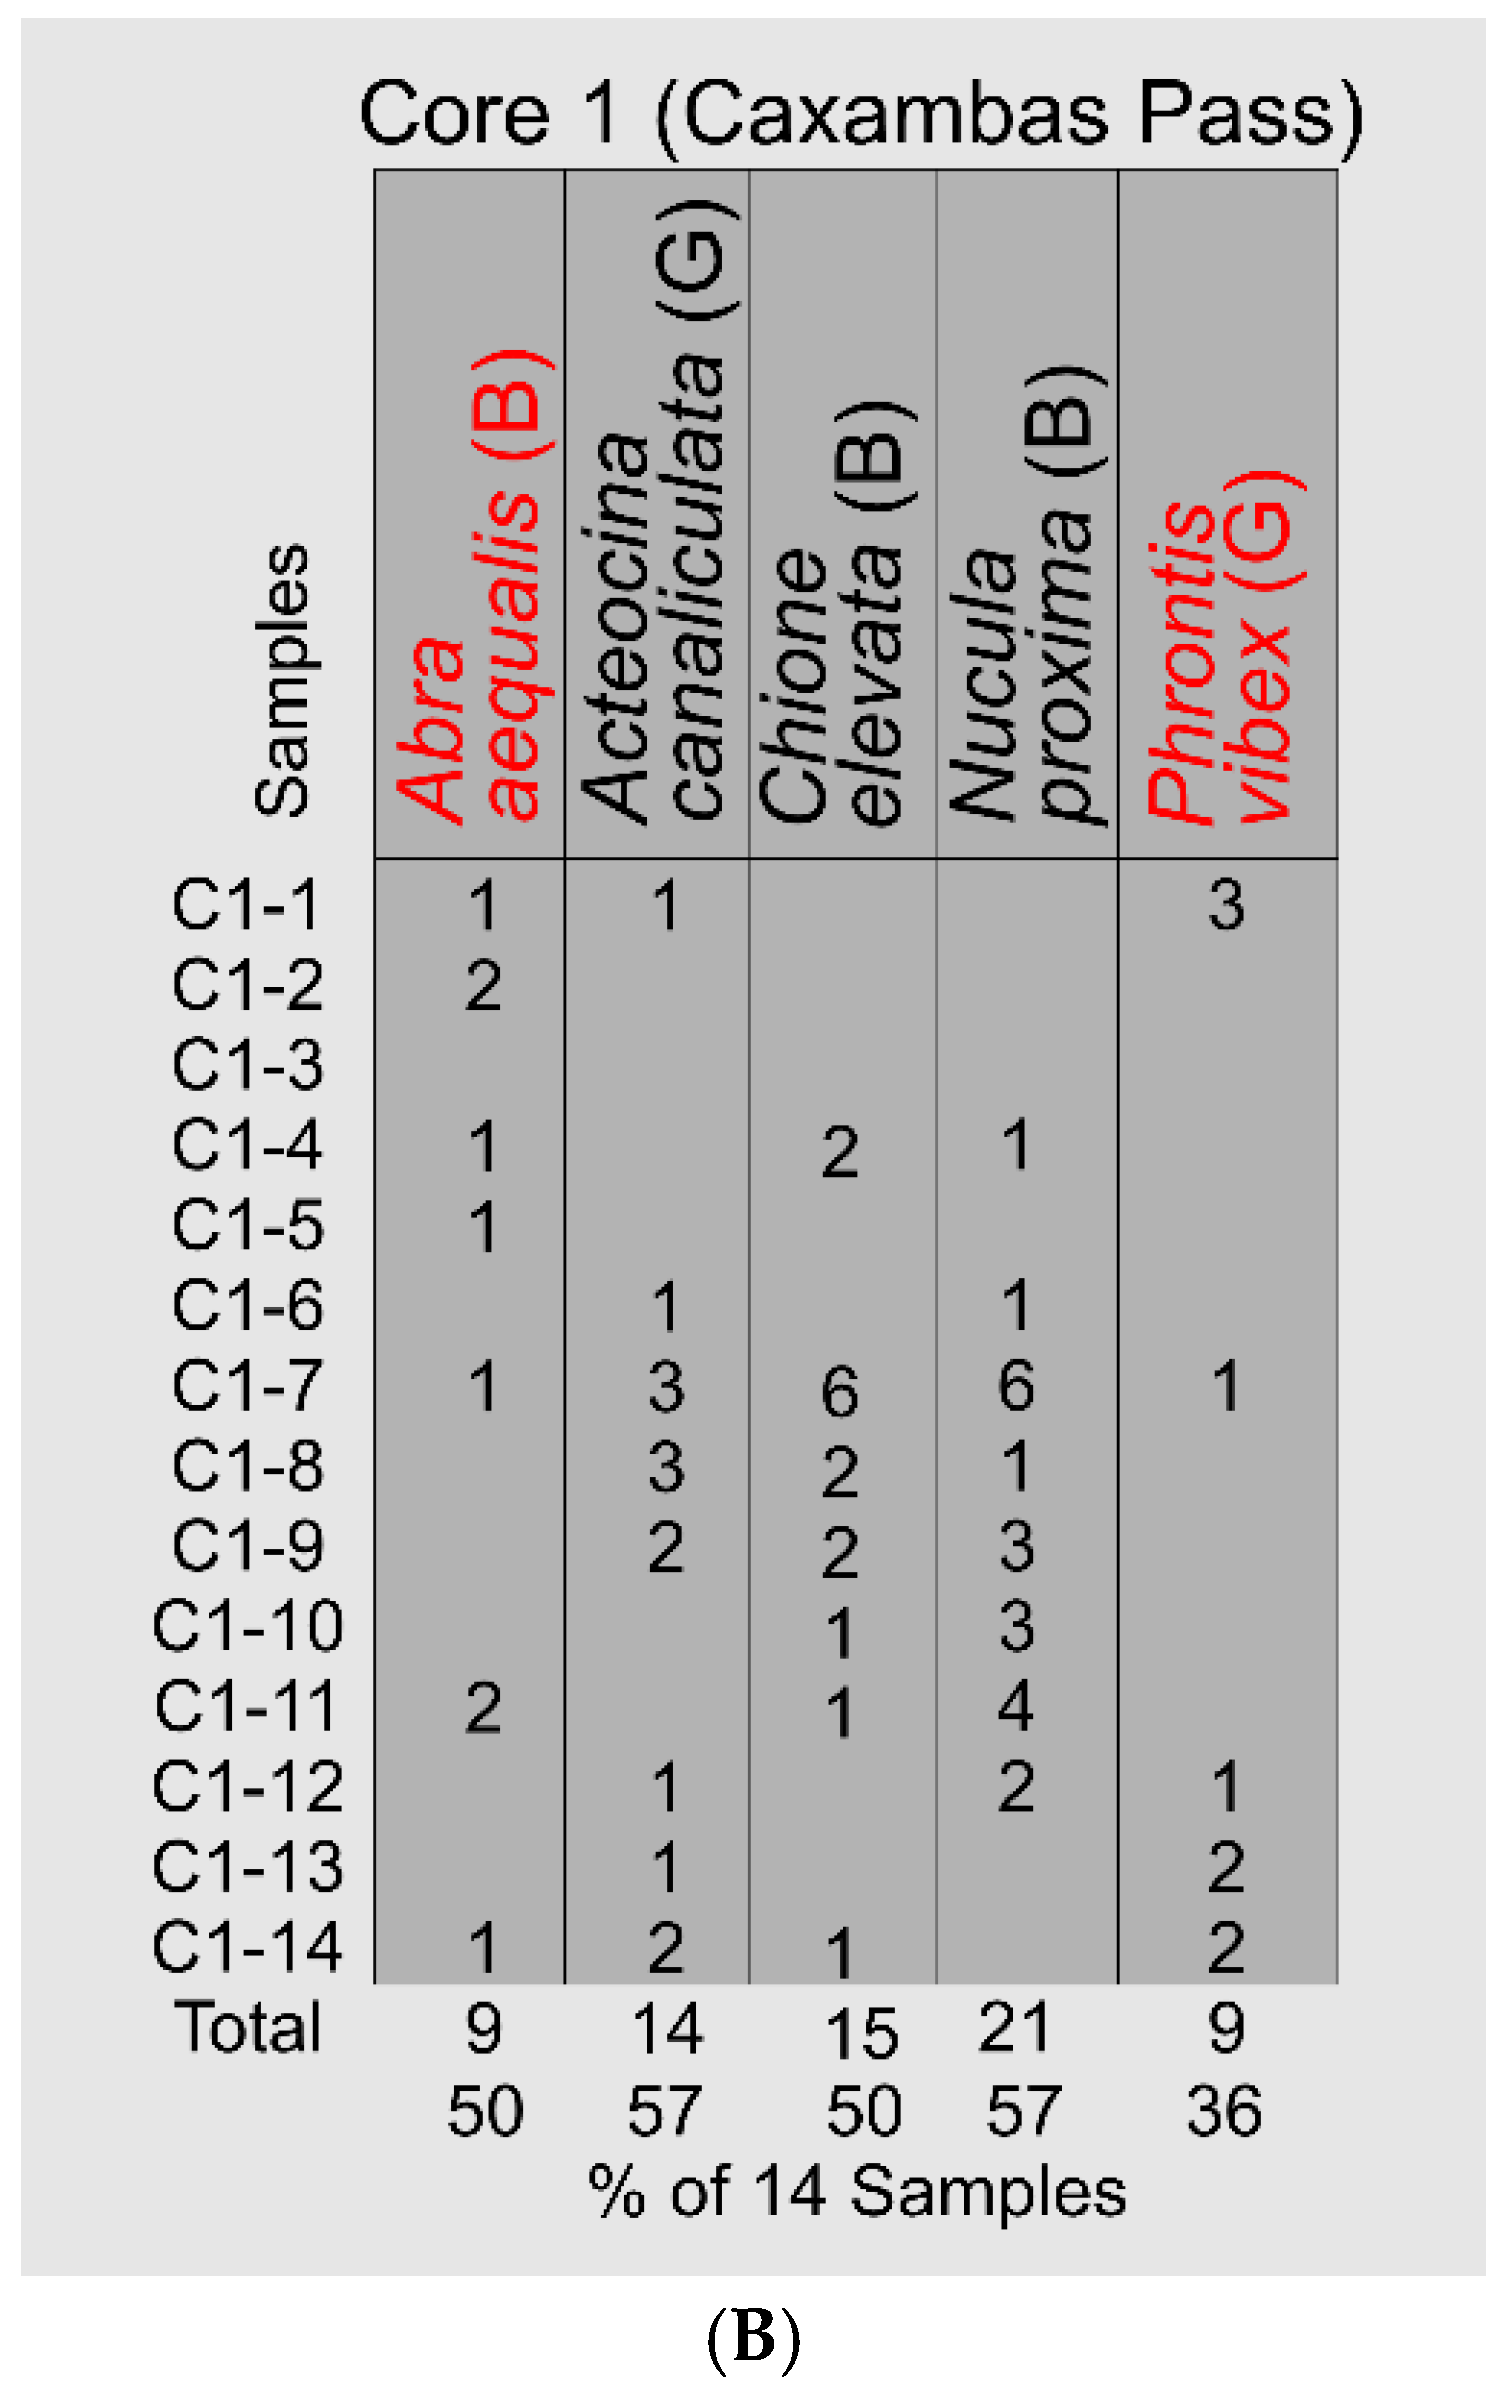
Figure 19.
Panel A contains the distribution data for the seven Critical Mollusks among the five (5) volume percent silt classes. The Samples column contains the number of times a particular volume percent class occurs within the 21 mollusk samples from the three Barfield Bay cores. There are 327 individual mollusks used in this analysis. Panel B shows the percentage preference of individual species for a specific volume percent silt class. The blue numbers indicate the most preferred silt classes and the green numbers the second-most preferred silt classes for the respective mollusk species.
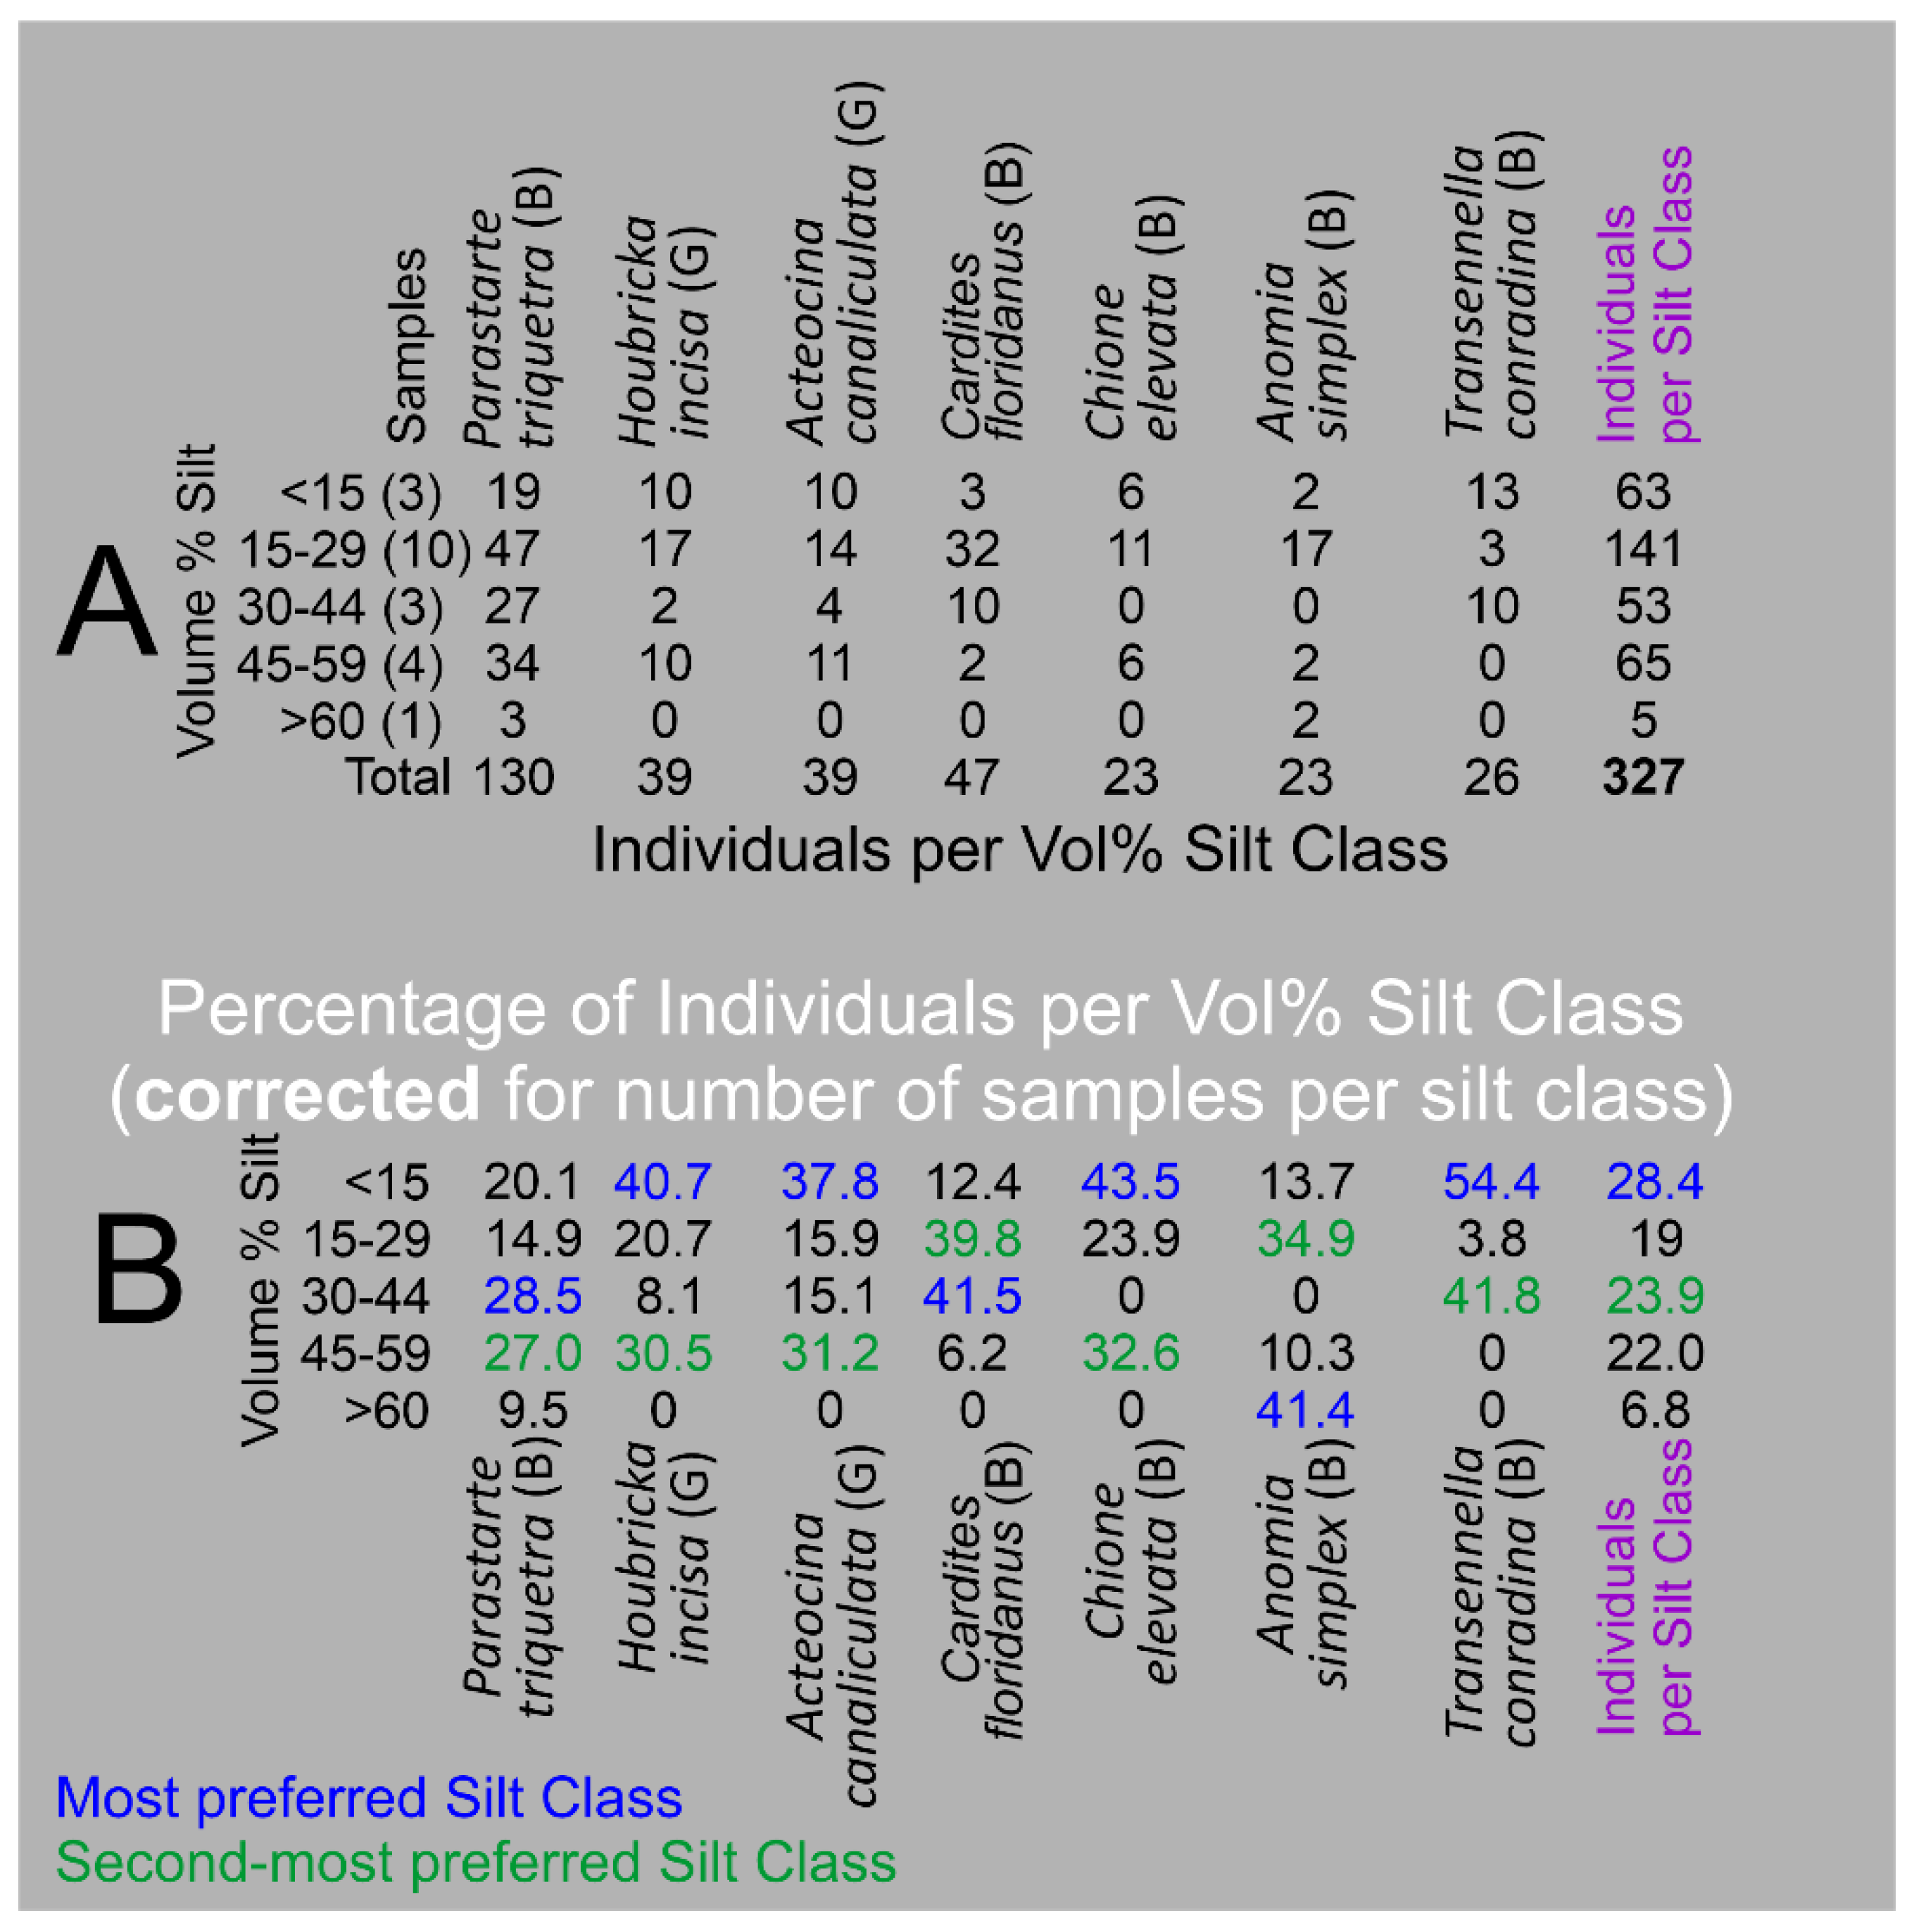
Figure 20.
The Benda and Puri [36] distribution of the three, dominant, benthic foraminifera genera (Ammonia spp., Elphidium spp., and Miliolids) in the Gullivan Bay-Ten Thousand Islands region of southwest Florida. 1 labels Barfield Bay and 2 Marco Island. The mangrove-covered islands and barriers immediately south of Barfield Bay (shown in gray and labeled 3) probably were not in existence during, at least, the initial 3000 years of Holocene deposition in Barfield Bay. The orange mass is the Pleistocene portion of Marco Island and the pink mass is the Holocene portion. The black star in Panel C is the location of the Core 0706-19 [34] at the mouth of Fakahatchee Bay. The contour lines indicate the generic percentages of the benthic foraminiferans.
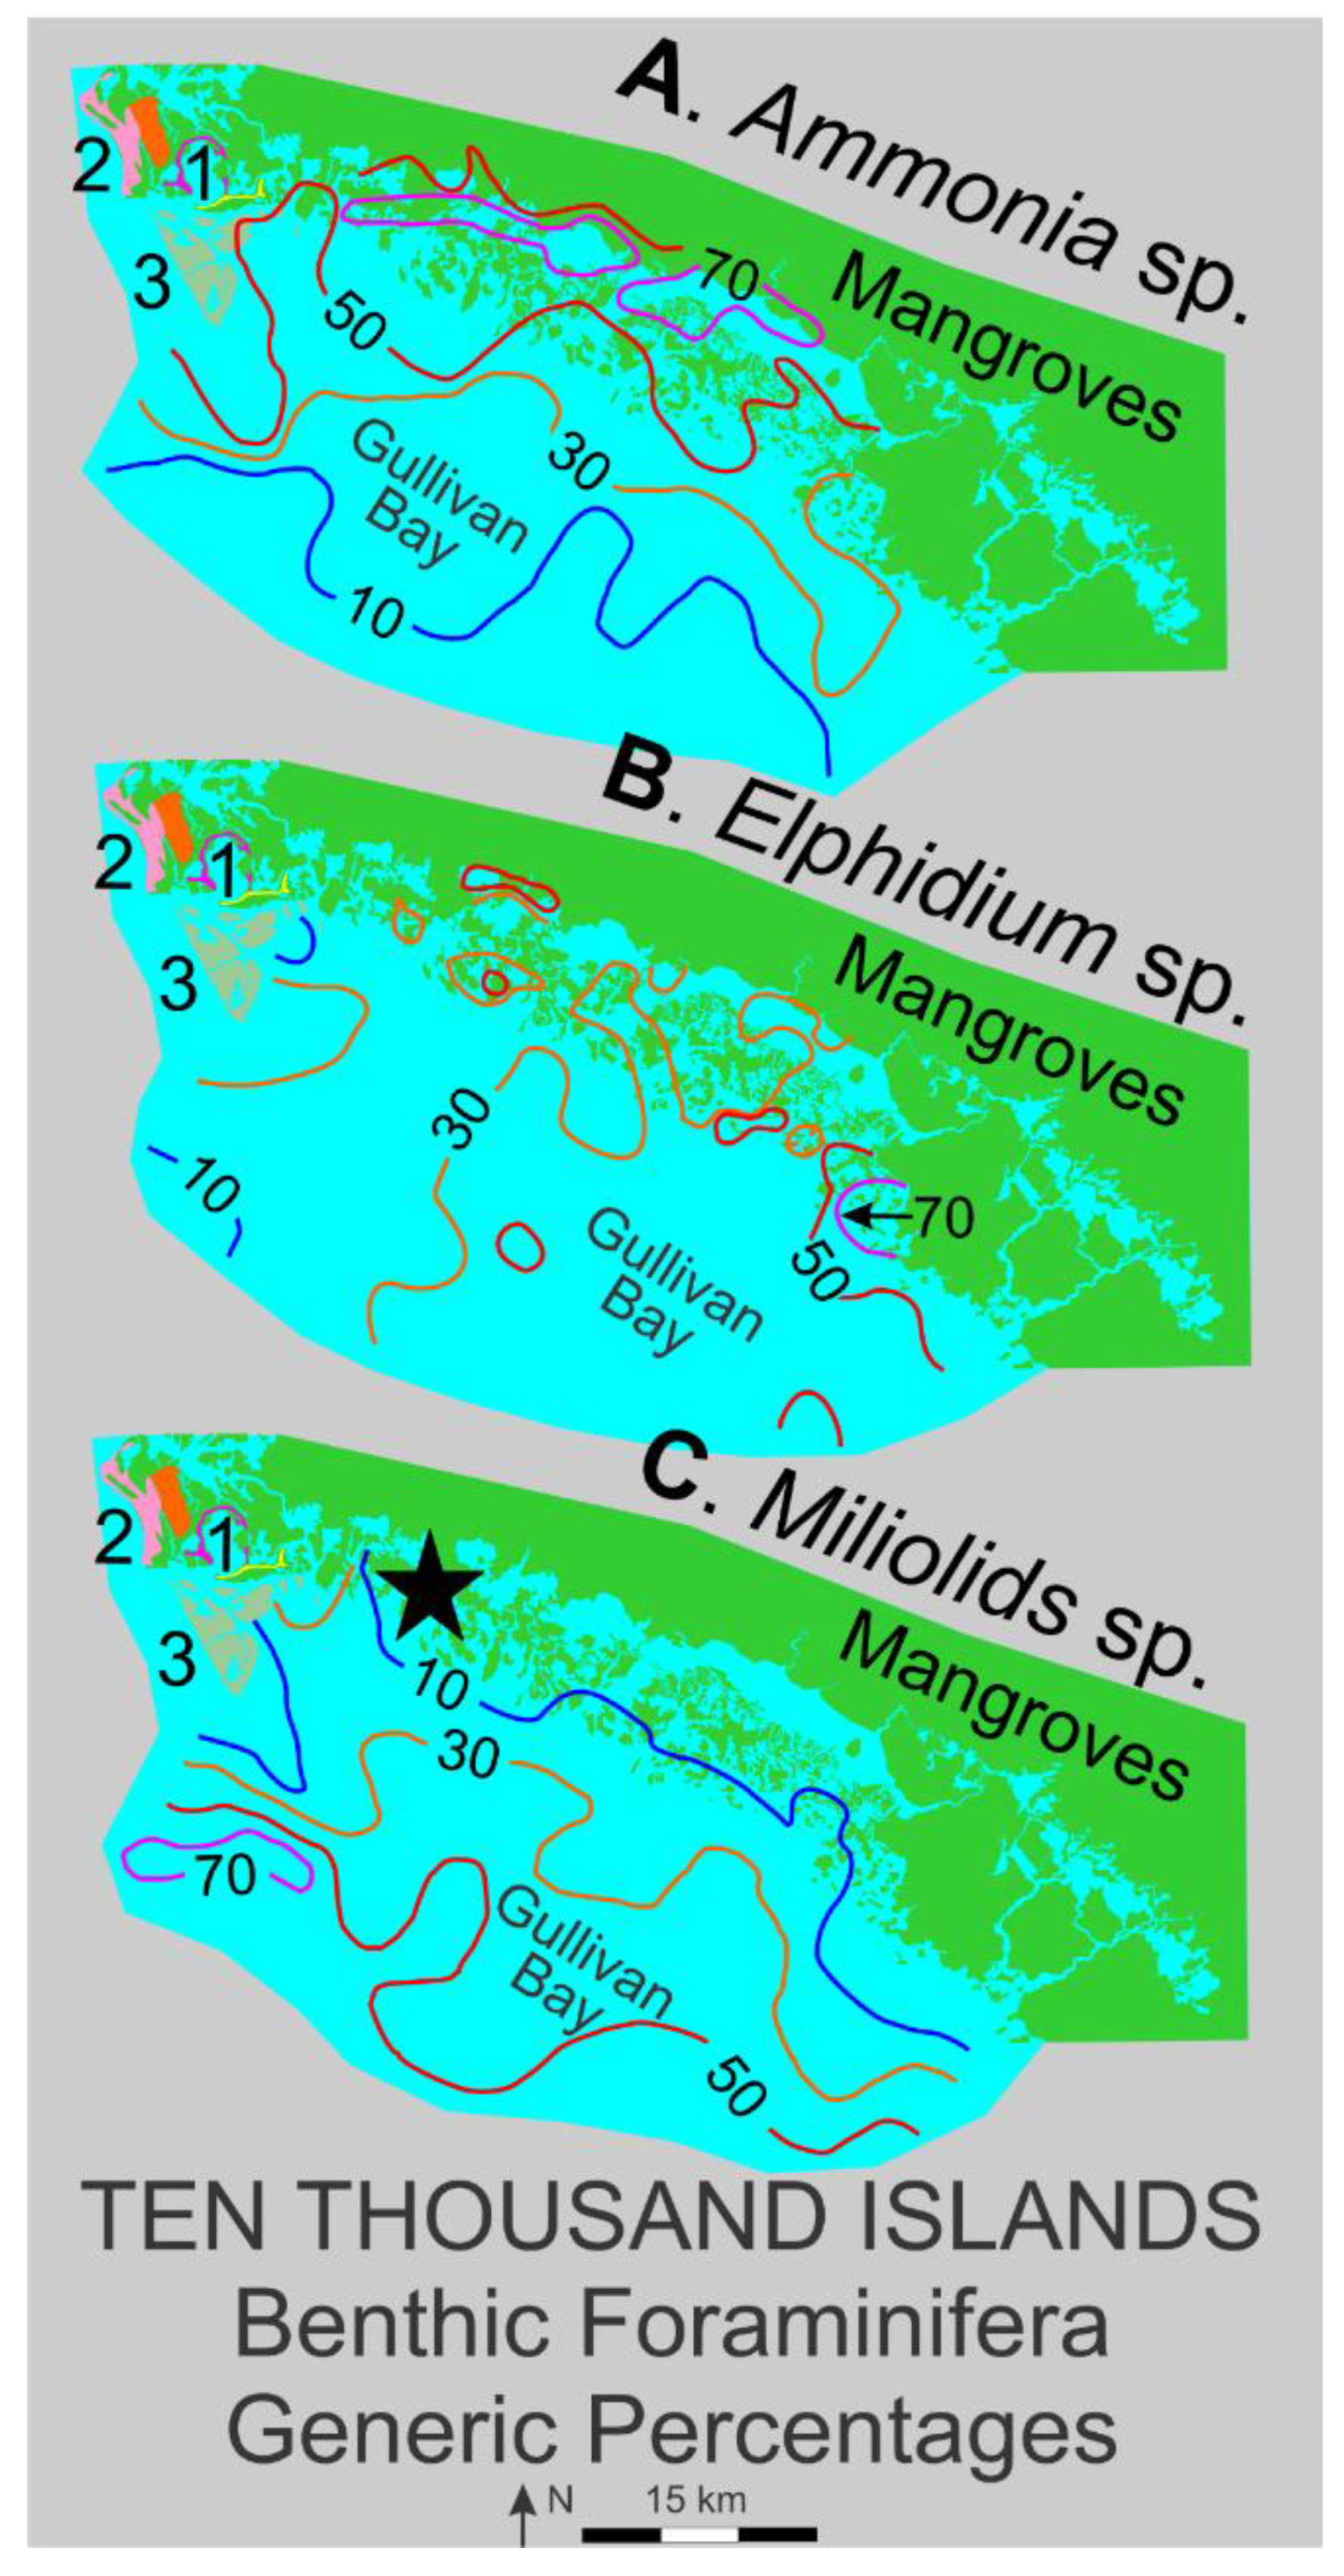
Figure 21.
Stratigraphic cross section through Barfield Bay showing the lithology, fossil content, and radiocarbon dates in Cores 1-5. The core depths are decompacted values with a mean sea level datum (MSL). The details of the dashed-line box (labeled A) at the base of Core 3 are shown in Figure 23. The plant-based and shell radiocarbon dates have been calibrated with the IntCal20 curve [37] and the Marine 20 curves, respectively. However, no local Marine Reservoir Correction has been applied to the shell dates. All shells, except the Crassostrea virginica, are from subtidal organisms. The tempestite shell beds (Tp) contain <10% silt by volume and the vast majority of shells are touching each other, Figure 16. The 7800-year-old date for the Horrs Island Dune is based on an Optically Stimulated Luminescence (OSL) age on sand collected from a depth of 1-meter below a crest location. The two flooding surfaces are identified as follows: Fs1 where subtidal-shell-bearing quartz sand overlies granular, allogenic peat (terrestrial or lacustrine) and Fs2 where silty quartz-sand containing plant debris overlies the early Holocene Horrs Island terrestrial aeolian dune. The Horrs Island onlap/disconformity (blue dash-dot line) indicates that Horrs Island has been incrementally submerged during the Holocene transgression, the details of which are presently unknown.
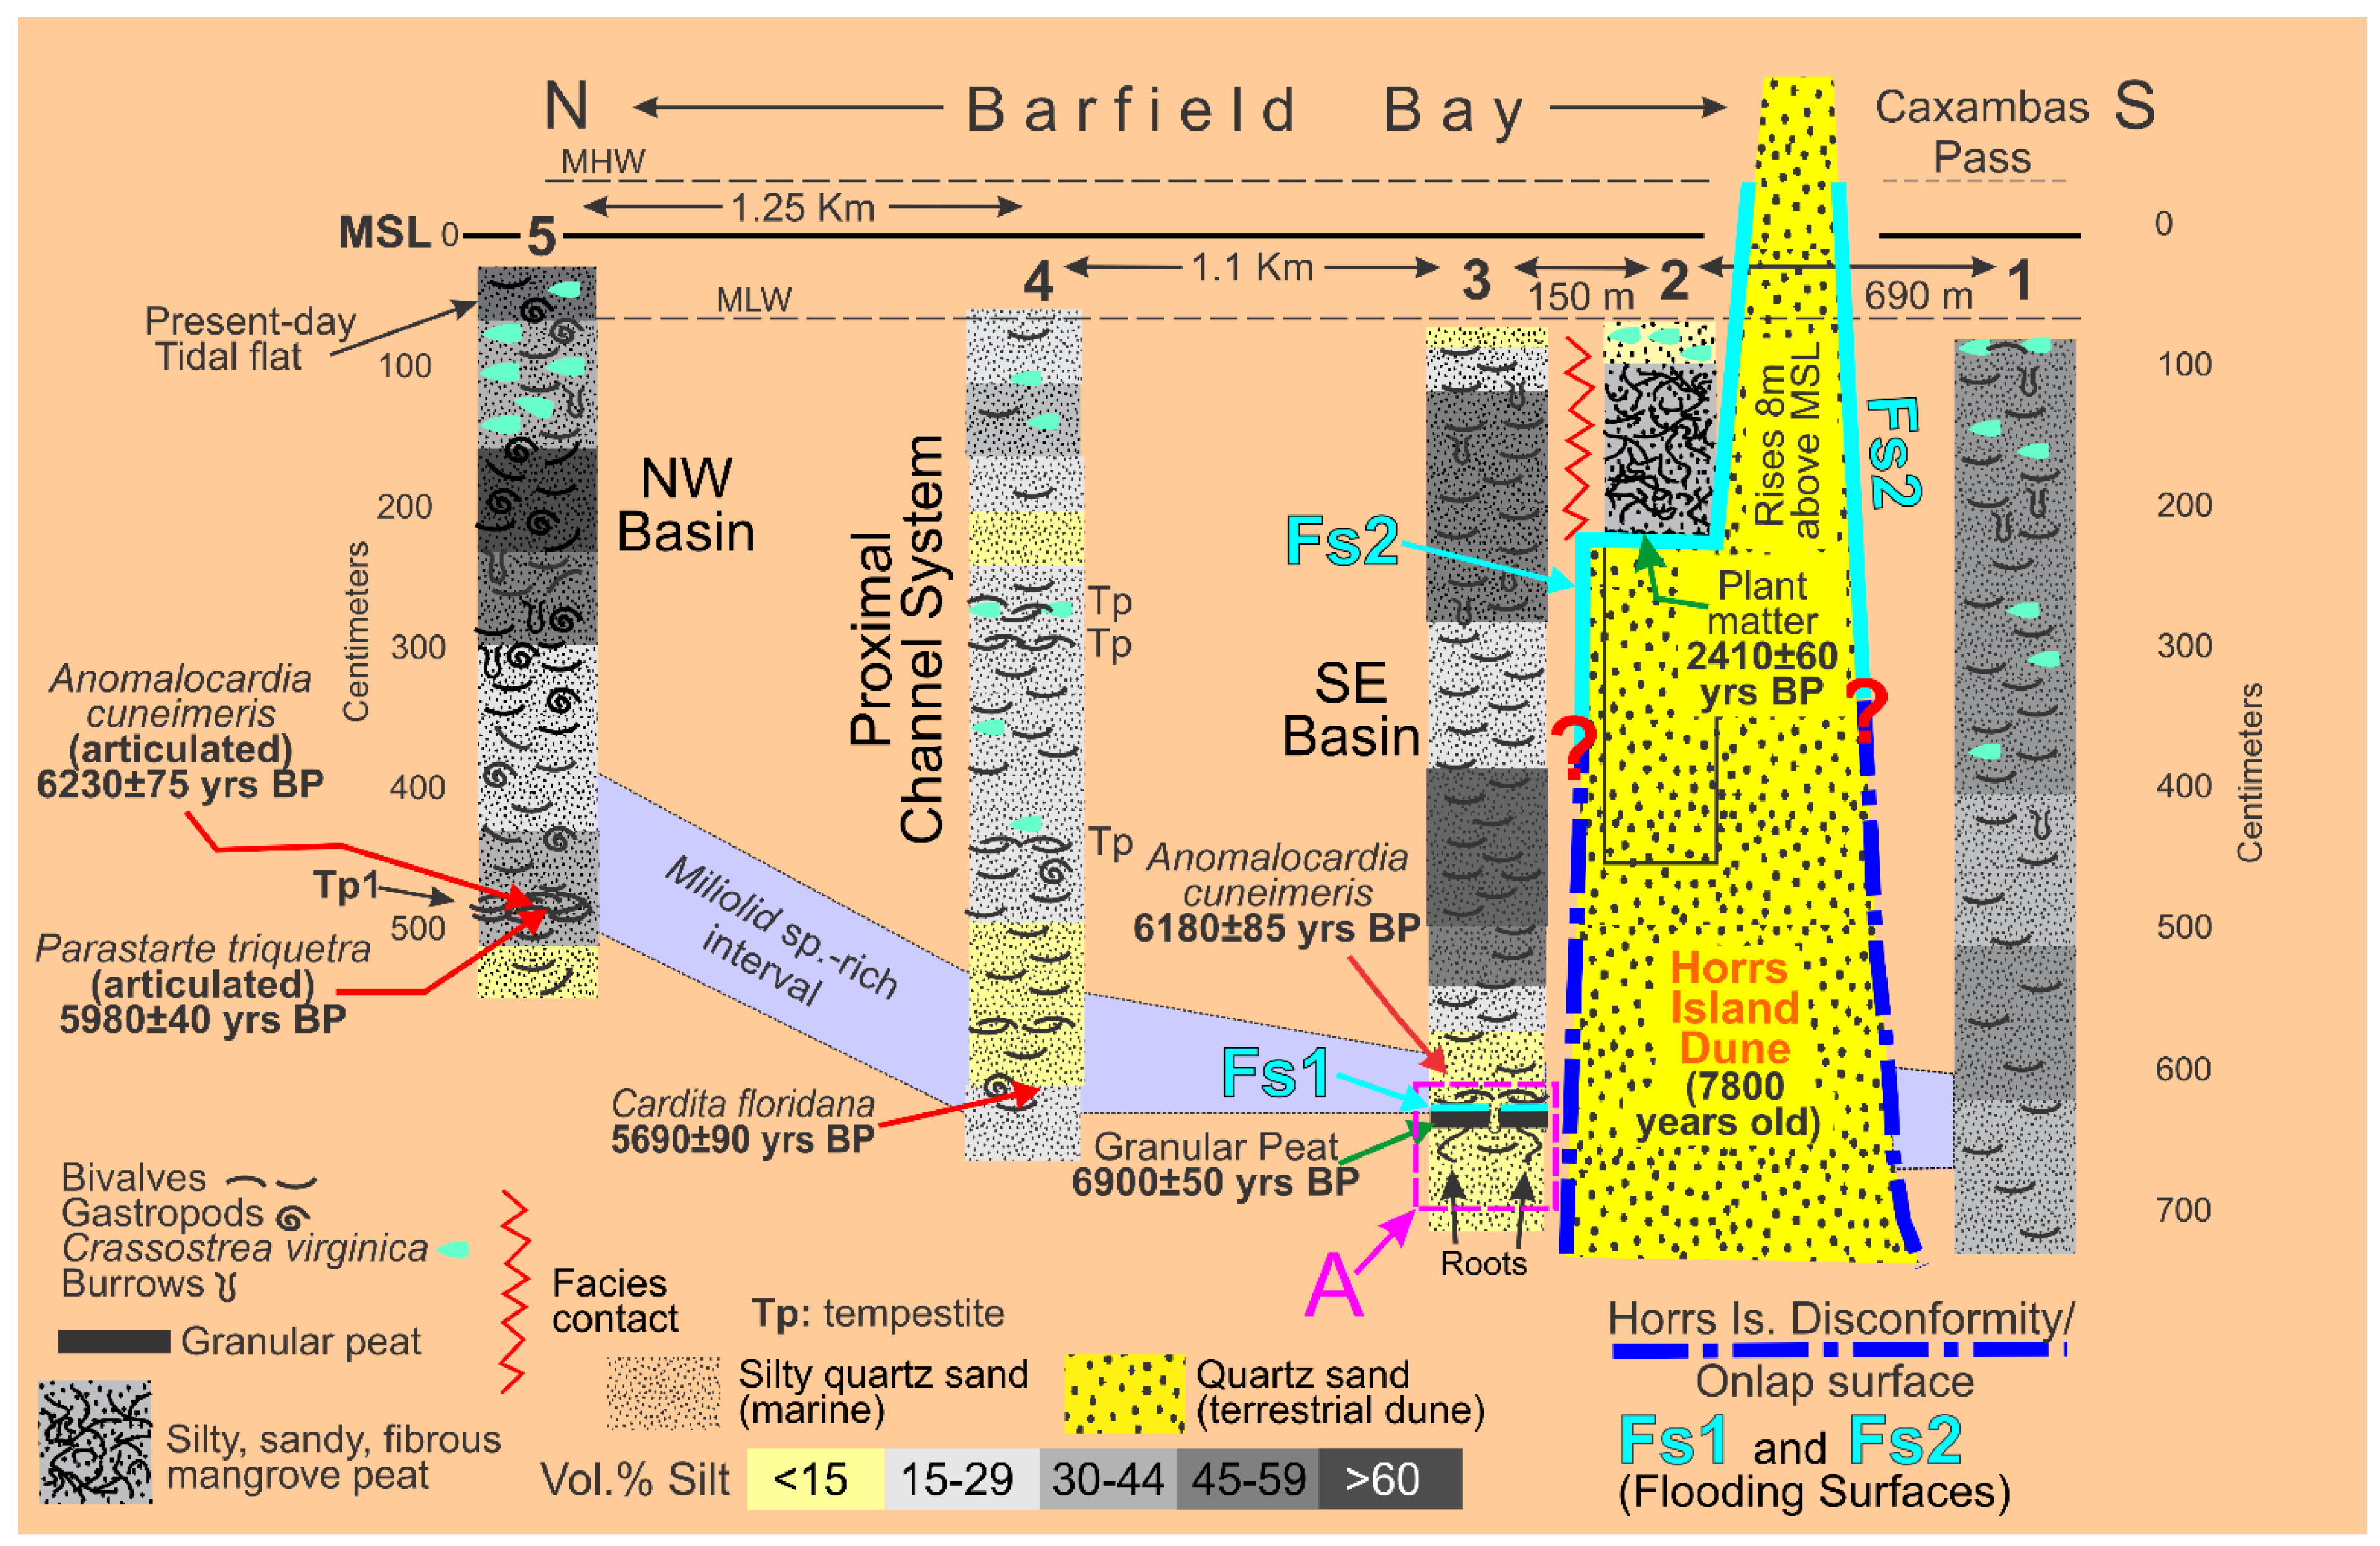
Figure 22.
Aerial photograph of Barfield Bay, US Geological Survey 1995. A is a flood tidal-delta at the north end of the main tidal channel from Caxambas Pass. Bh is the Blue Hill Creek flood tidal-delta. Dashed lines are tidal channels the thicknesses of which indicate relative importance. The white letters Tg indicate the presence of subtidal Turtle Grass (Thalassia testudinum).
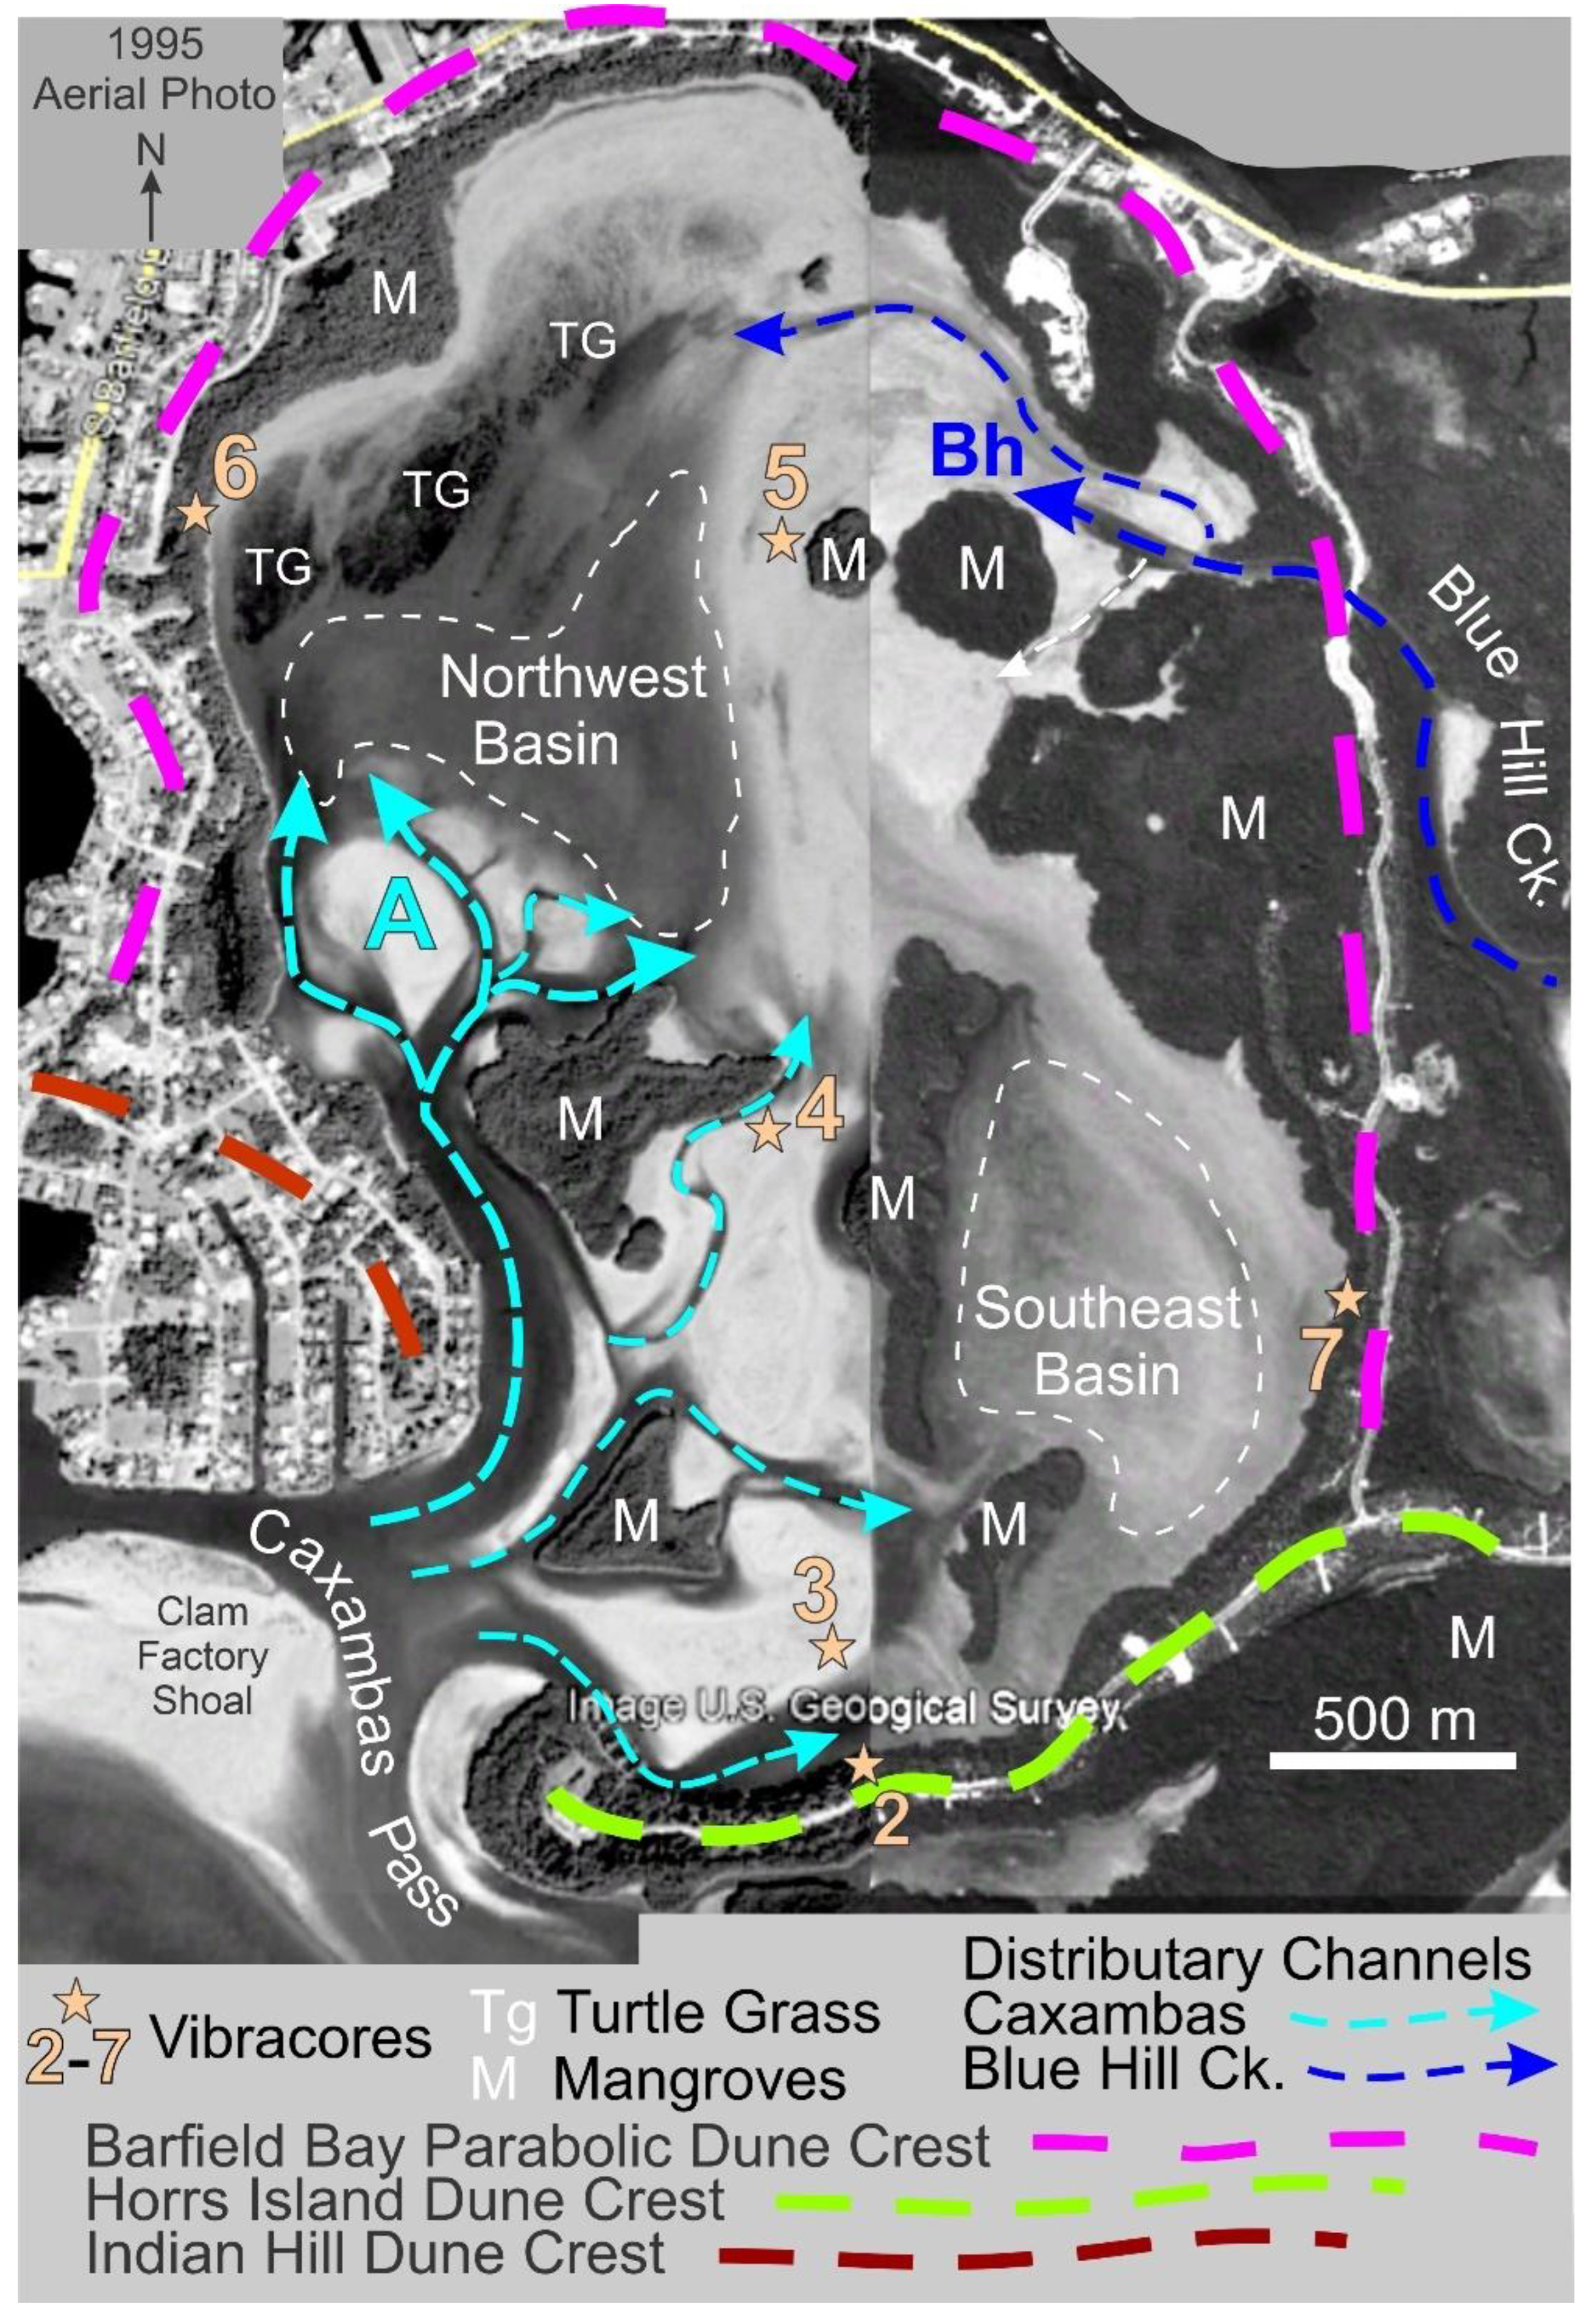
Figure 23.
Annotated photograph of the basal 23-cm of Core 3 showing the various stratigraphic units. Basal Unit A contains both rare nearshore-marine mollusks (Anomalocardia?) and a sparse assemblage of calcareous, benthic foraminifera. There is a disconformity between Units A and B. The C-14 date of 6900±50 yrs BP on the allogenic peat clasts of Unit B may be only a maximum estimate. The 6180±85 yrs BP date on an Anomalocardia cuneimeris shell from the overlying Unit C is only a maximum estimate for the age of deposition. The contact between Units B and C is marine flooding surface Fs1 (Figure 21), the oldest such surface identified in the Barfield Bay sediment-fill.
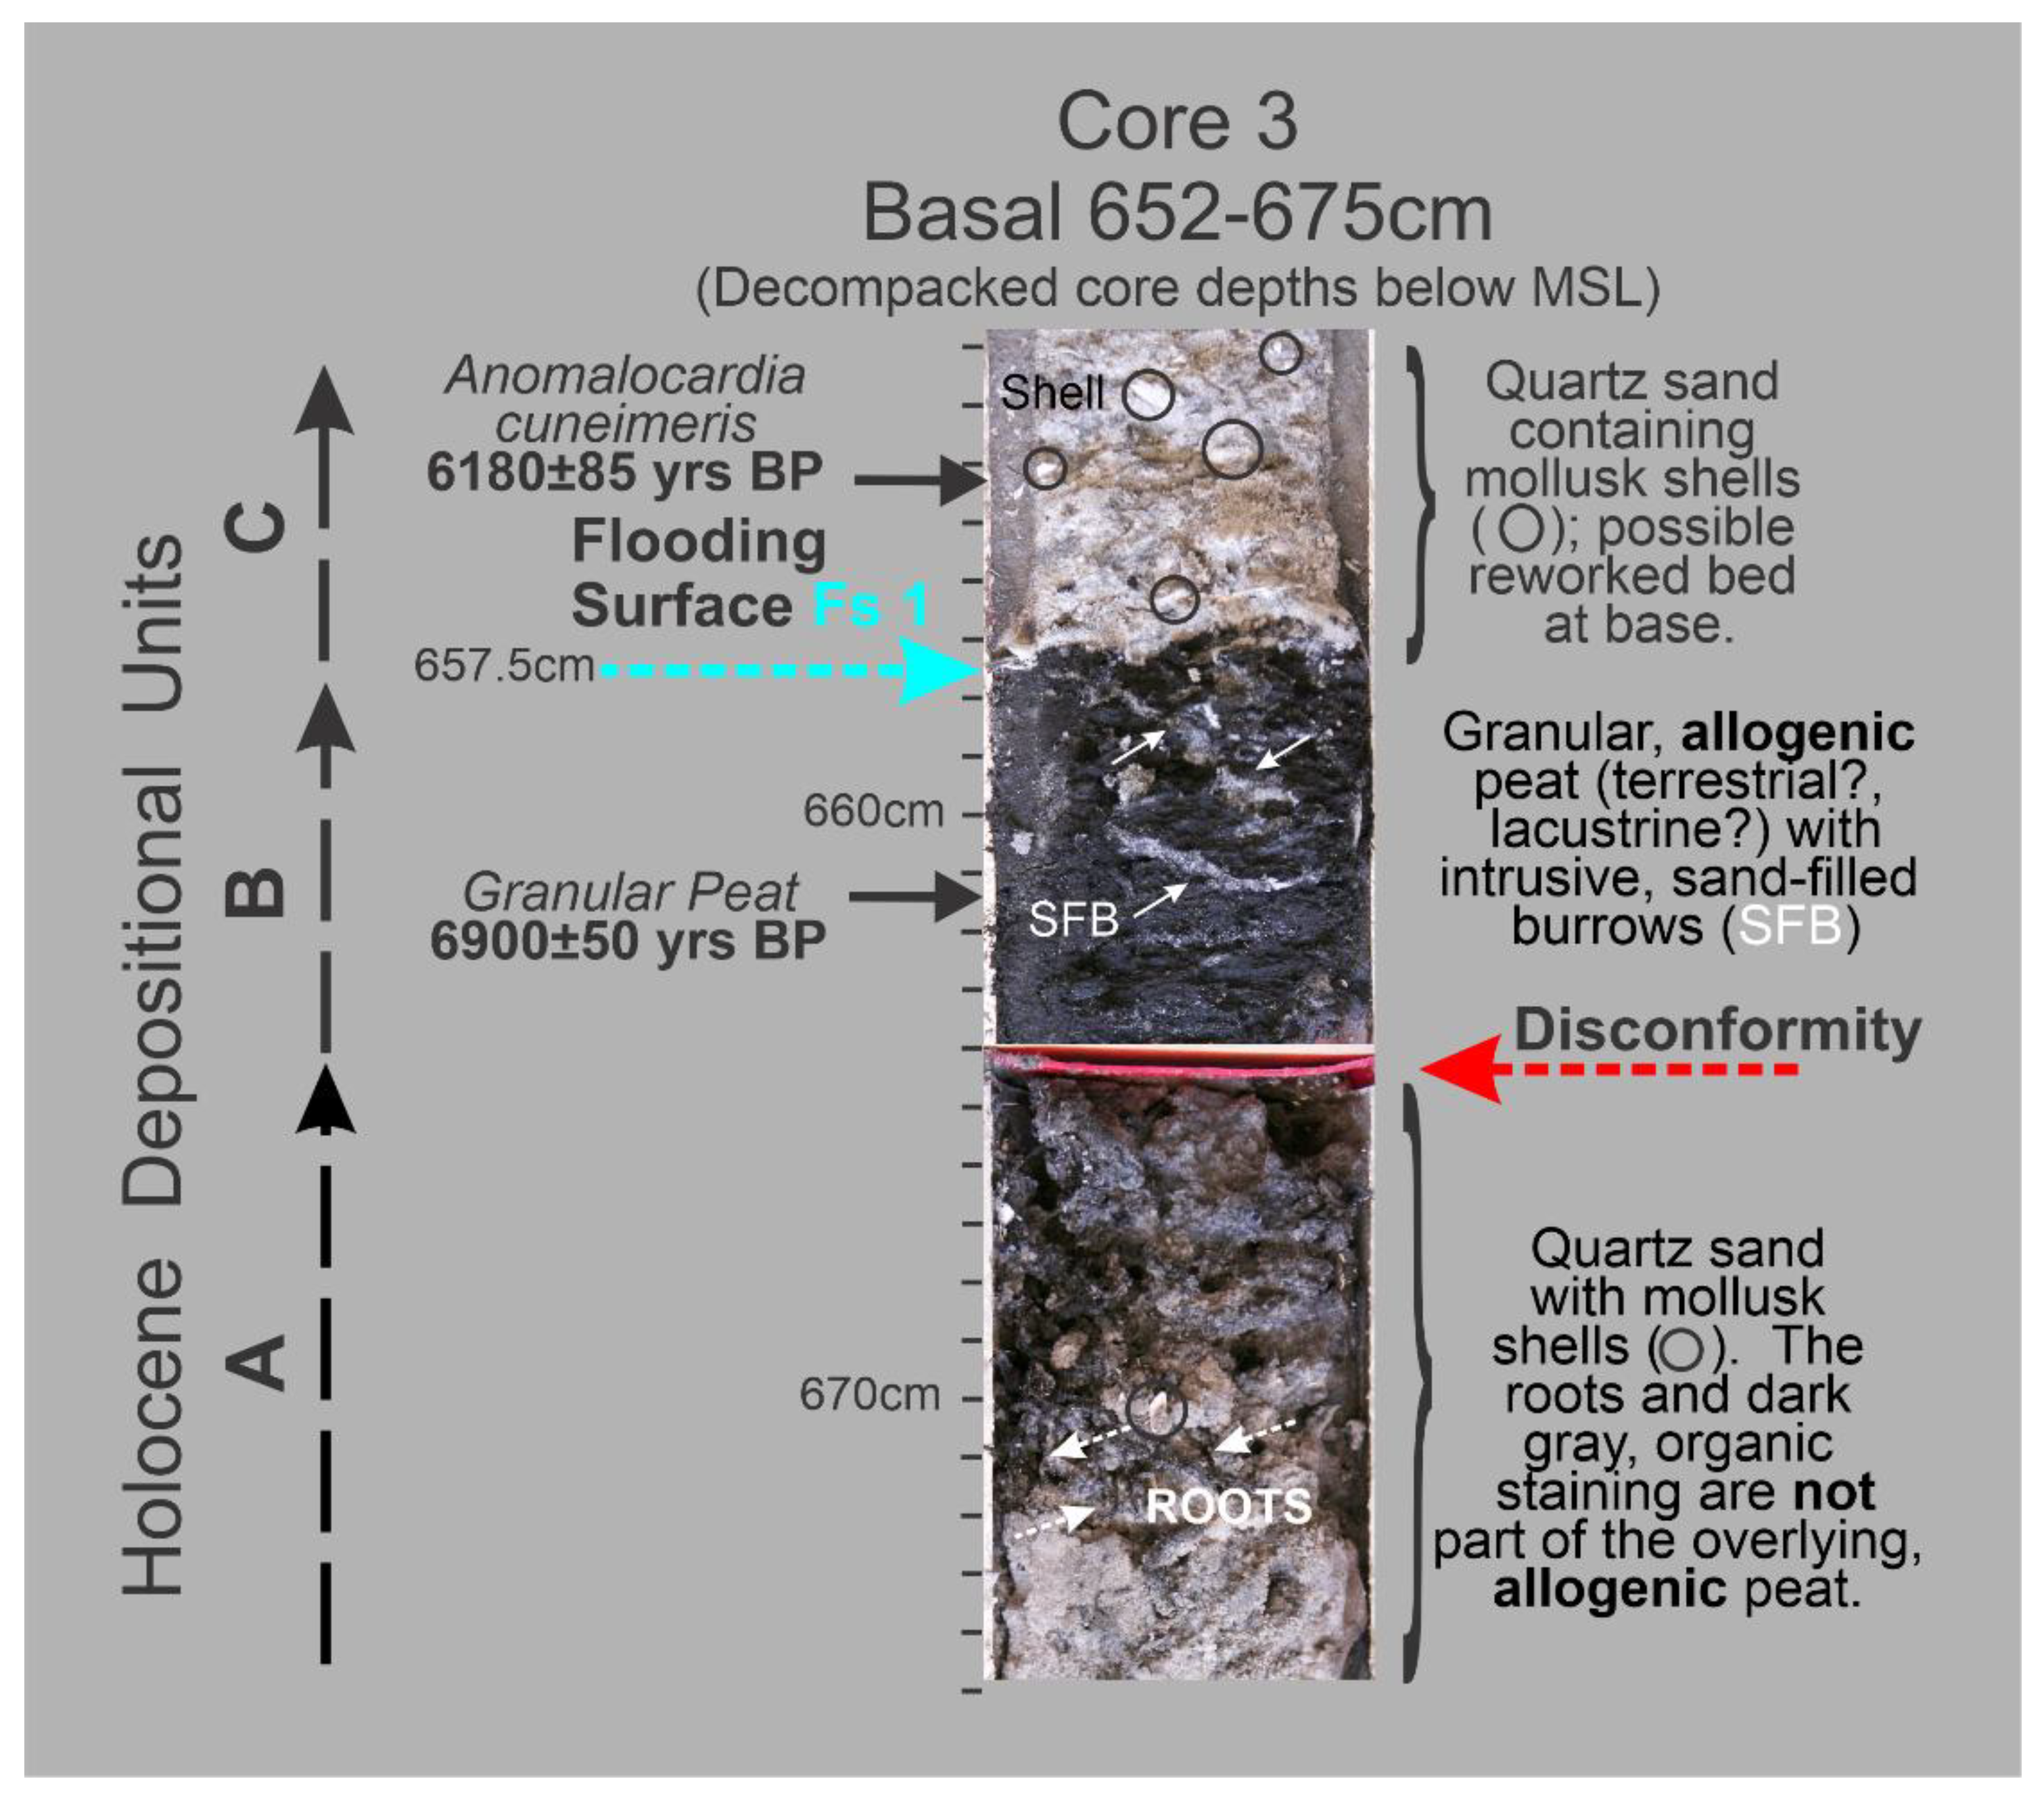
Figure 24.
Radiocarbon dates on mollusk shells and vegetative material collected in the Barfield Bay vibracores. The calibration curves Marine20 and IntCal20 are from Heaton [38]. These samples are located in Figure 20. The two articulated mollusk samples are from tempestite Tp1.
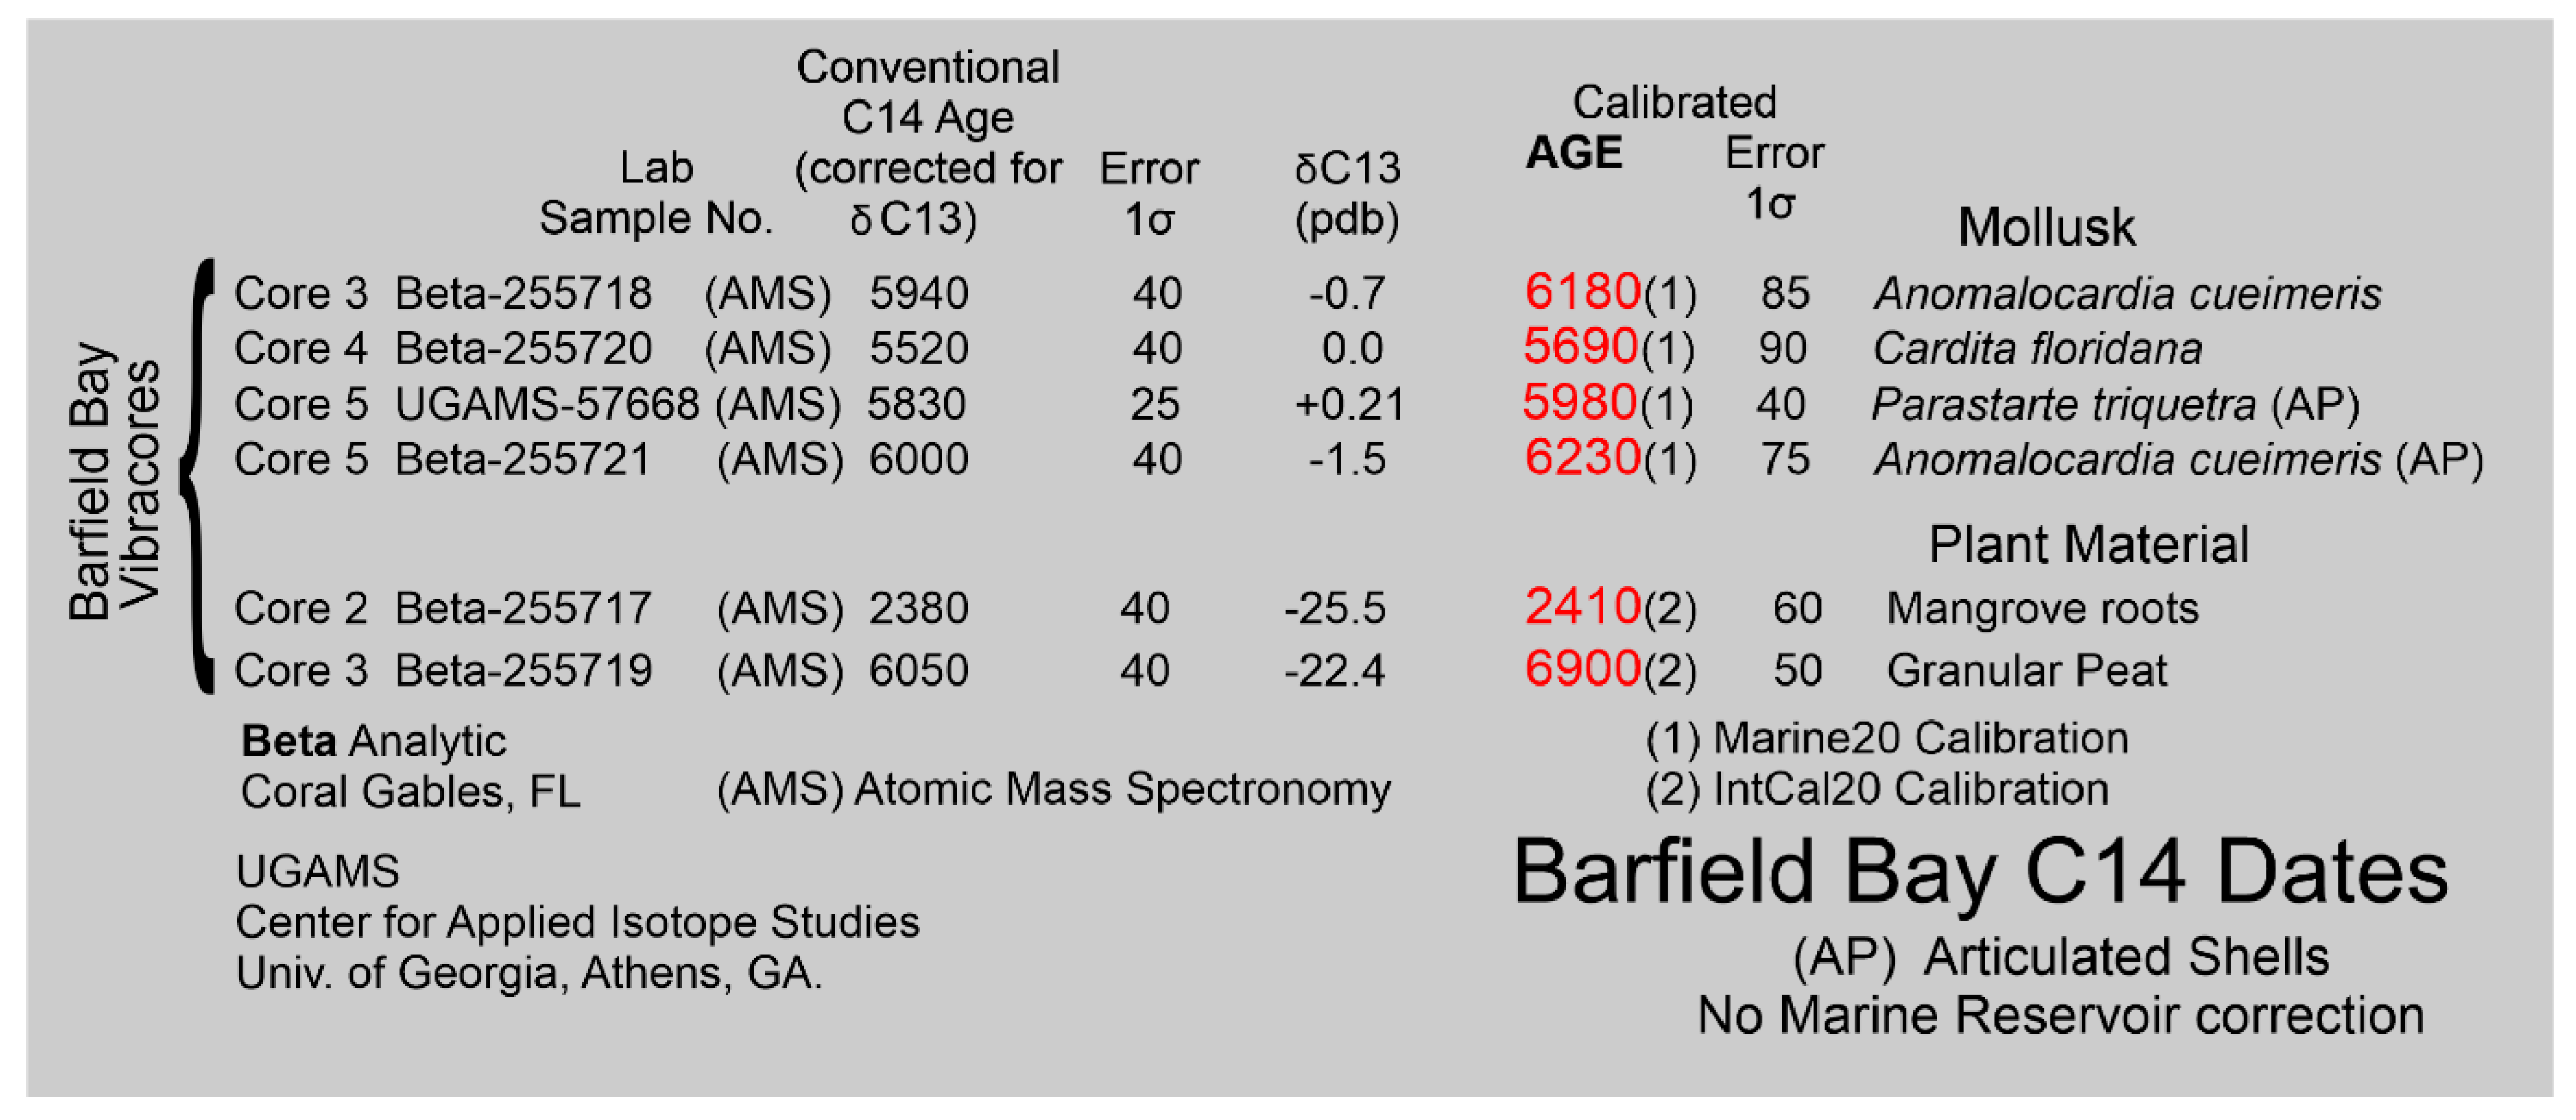
Figure 25.
A diagram showing the relative sea level (RSL) curves based on mangrove-peat data from Snipe and Swan Keys in south Florida [3]. The solid and dashed lines represent the 1σ ranges and the shaded bands the 2σ ranges, respectively. The mangrove-debris date from the base of the Holocene peritidal sand in Core 2 (BBC2 dark gray box) plots on both of these two curves. However, the arguably coeval deposition of the oldest beach-ridge on the Gulfward side of Marco Island (MIBR) does not and, rather, plots up at the present-day position of sea level.
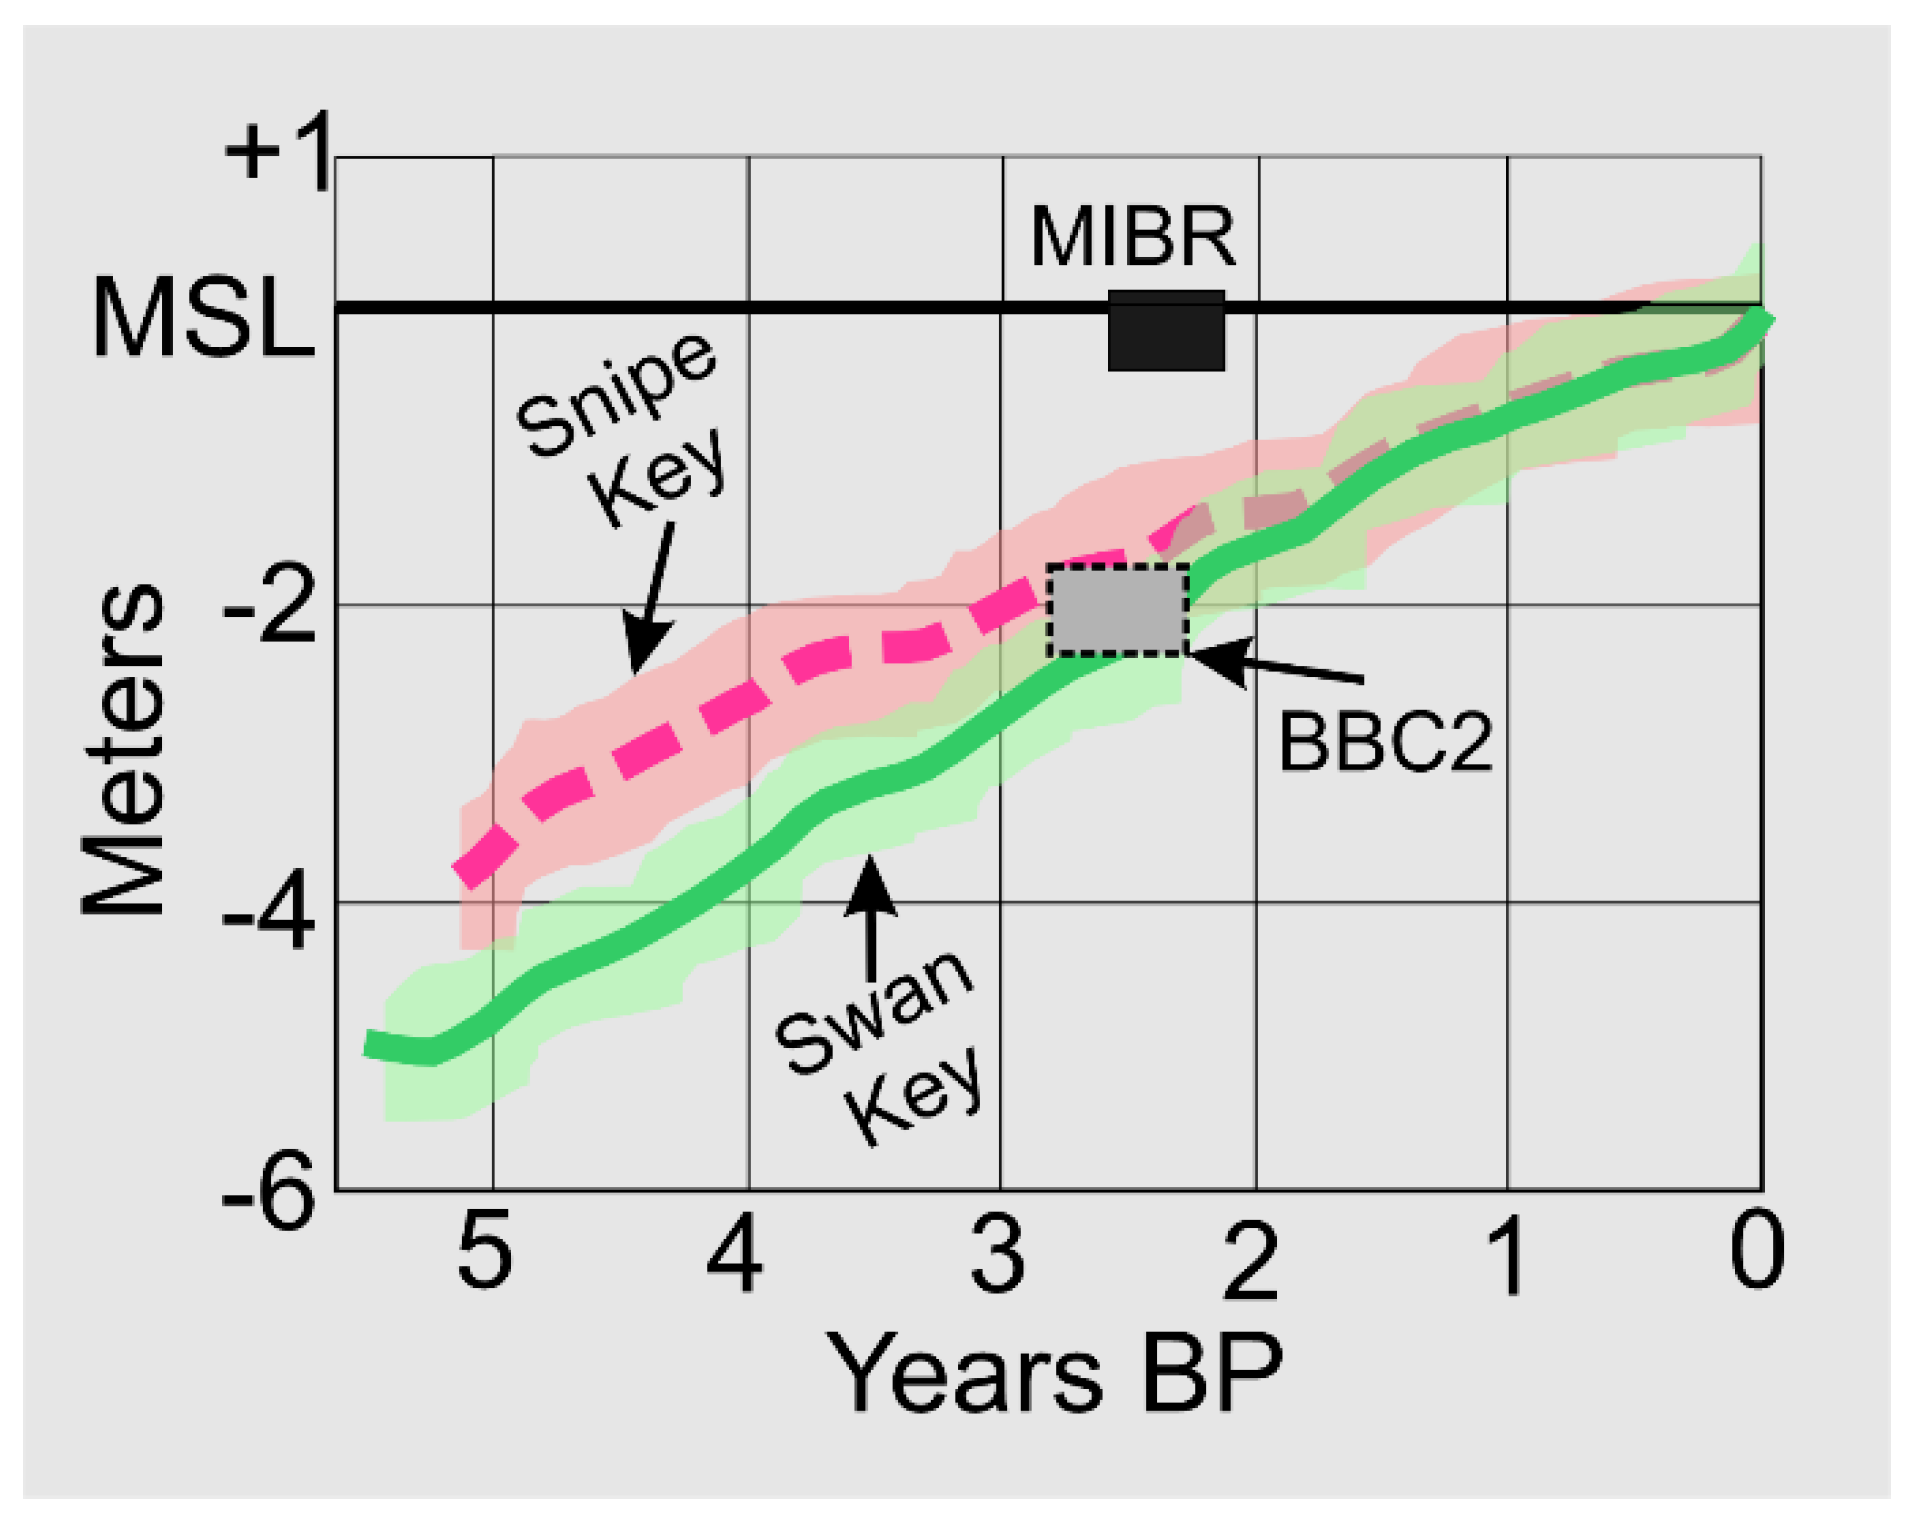
Disclaimer/Publisher’s Note: The statements, opinions and data contained in all publications are solely those of the individual author(s) and contributor(s) and not of MDPI and/or the editor(s). MDPI and/or the editor(s) disclaim responsibility for any injury to people or property resulting from any ideas, methods, instructions or products referred to in the content. |
© 2025 by the authors. Licensee MDPI, Basel, Switzerland. This article is an open access article distributed under the terms and conditions of the Creative Commons Attribution (CC BY) license (http://creativecommons.org/licenses/by/4.0/).
Copyright: This open access article is published under a Creative Commons CC BY 4.0 license, which permit the free download, distribution, and reuse, provided that the author and preprint are cited in any reuse.


