
Submitted:
18 August 2025
Posted:
19 August 2025
You are already at the latest version
Abstract
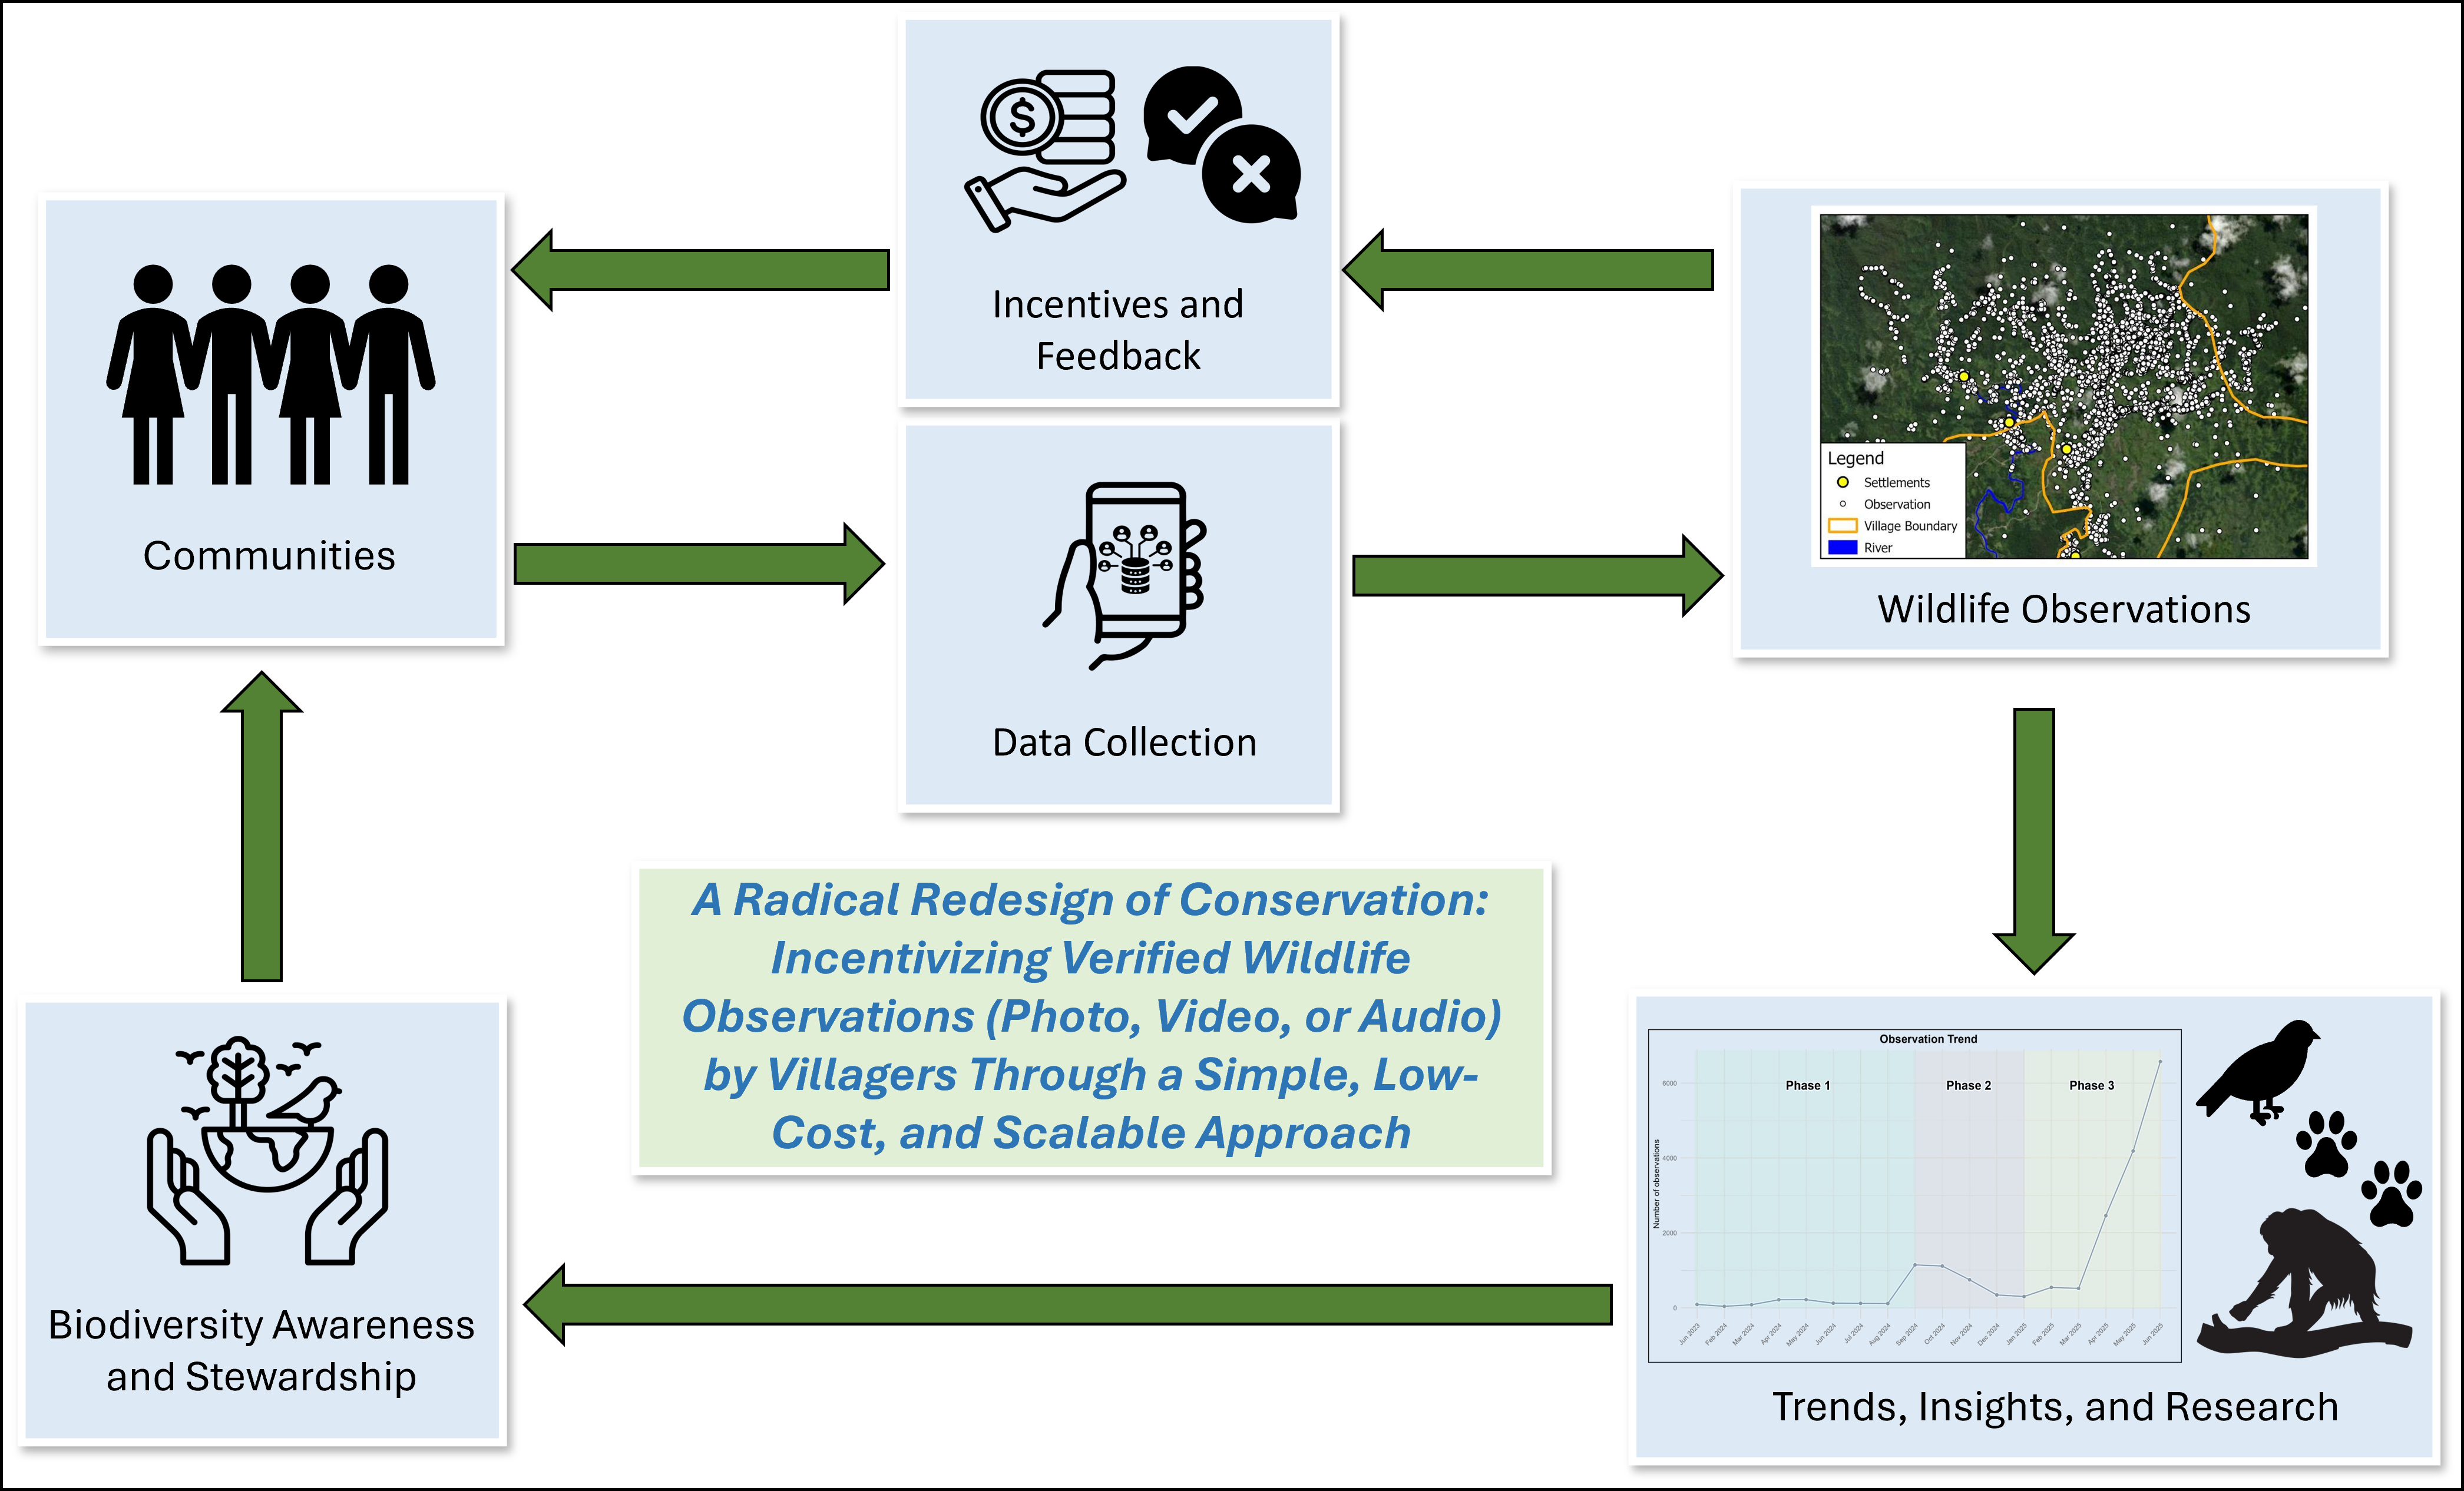
This study explores the effectiveness of a citizen science approach in engaging local communities in rural Kalimantan to collect wildlife observations within their village forests. By leveraging the power of community participation, the project aims to build on local knowledge, promote sustainable management practices, and collect valuable ecological data on species distribution and habitat quality. Through a combination of training workshops, field surveys, and mobile app-based data collection from 2023 to 2025, the initiative successfully mobilized community members, particularly those with limited technological experience, to actively participate in biodiversity monitoring. We recently introduced a payment for wildlife observations system that significantly boosted observations. The results highlight the potential for citizen science to generate valuable species trend data, raise awareness about local biodiversity, and foster a sense of ownership and stewardship among community members. The lessons learned from this project can inform future citizen science initiatives and contribute to the development of effective community-based conservation strategies in the region.
Keywords:
citizen science
; community-based conservation
; biodiversity monitoring
; indigenous knowledge
1. Introduction
Global biodiversity loss is a pressing issue, and effective and inclusive monitoring is crucial to assess environmental changes, evaluate the impact of policies and management practices, and understand the benefits that biodiversity provides to people. Citizen science (CS), which involves the public in data collection, often as part of scientific research, offers a promising approach to address this challenge, particularly in the environmental sciences [1]. By engaging local communities with unique ecological knowledge but limited scientific training, CS can expand the reach and frequency of biodiversity monitoring, especially in biodiversity-rich but remote regions.
CS initiatives have been applied across a wide range of disciplines, including biodiversity monitoring, climate change studies, and conservation biology. These projects typically rely on the participation of volunteers to gather data that would otherwise be difficult or impossible to collect due to resource constraints. In many cases, CS initiatives have successfully produced data that are comparable in volume and quality to that collected by professional scientists, given that appropriate training and oversight are in place [2].
The concept of "Extreme Citizen Science" or ECS has emerged, emphasizing the deep involvement of participants in all stages of the research process, from problem identification to data analysis [3]. A more participatory model, ECS engages local participants at the forefront of human-wildlife interactions, drawing on their unique understanding of the landscape, species, and ecological processes specific to the area [4]. Moreover, local participation can lead to greater community ownership and sustained engagement in the project, as residents are more likely to remain engaged when they see the direct benefits of their contributions to the conservation and management of their natural resources.
As communities are directly affected by environmental changes, their involvement in conservation is not just beneficial but essential. Integrating their knowledge and experiences through CS offers a socially inclusive, context-specific approach to biodiversity monitoring and protection. By empowering local communities to take ownership of the research process, ECS can bridge the gap between scientific inquiry and traditional ecological knowledge, fostering a deeper understanding of local ecosystems and promoting management practices that maintain wildlife populations.
In this study, we explore the implementation of a CS initiative in Kalimantan, a region renowned for its rich biodiversity [5]. By leveraging the power of indigenous community participation, we aim to demonstrate the effectiveness of CS in promoting biodiversity conservation and empowering local communities to be an integral part of the solution.
Despite the growing adoption of CS in rural and remote areas, there are substantial gaps in our understanding of its effectiveness in these contexts. Concerns persist regarding the accuracy and reliability of data collected by community members, particularly in cases where participants may have limited formal education or scientific training. Furthermore, because CS surveys are often unstructured, resulting in opportunistic wildlife encounters, standard statistical models do not apply [6]. Additionally, there is a lack of research examining the factors that motivate participation and sustain engagement over time, especially if communities do not recognize the direct benefits. The long-term sustainability and opportunity for impact of CS initiatives within these unique socio-cultural and environmental landscapes are not well understood. Addressing these gaps is essential to ensuring that our CS initiative not only generates robust data but also contributes meaningfully to local conservation efforts and community empowerment.
This study aims to:
- Evaluate the quality and reliability of data generated through CS initiatives in select rural communities in Indonesian Borneo, with an emphasis on identifying the variables that influence data accuracy and exploring methods to enhance data integrity within these contexts;
- Examine the motivations for participation, levels of engagement, and demographic diversity of CS participants in these communities, with a particular focus on the roles of different demographic groups, including women, youth, and elders, and the integration of traditional knowledge into the data collection process;
- Analyze the long-term impacts of CS involvement on both the participants and the scientific outcomes, including how participation influences local attitudes toward environmental conservation and the propensity for continued engagement in scientific and conservation activities;
- Develop evidence-based recommendations for the design and implementation of CS projects in rural communities, ensuring that initiatives are culturally sensitive, sustainable, and capable of producing high-quality scientific data while promoting local community engagement and empowerment.
2. Materials and Methods
2.1. Study Area
This study was conducted across four forest villages in Kalimantan, Indonesia (referred to here as Village A, Village B, Village C, and Village D). These communities are situated in a tropical rainforest landscape in Southeast Asia, characterized by rich biodiversity and varying degrees of human disturbance. The exact locations remain anonymous to respect the confidentiality of these villages whilst the project is in place. The participating villages are located near forested areas and have strong socio-ecological ties to the landscape.
Participants in the monitoring program are generally from the Iban Dayak and Malay ethnic groups. Their daily livelihoods are often shaped by customary gender roles. Iban and Malay men typically engage in fishing, farming, hunting, and the harvesting of forest products, often spending extended periods in forested or riverine areas. Iban women commonly participate in agriculture and the collection of forest resources, while Malay women are often involved in fishing, fish processing, gardening, and gathering non-timber forest products. These gendered livelihood practices and daily movements contributed to broad spatial and temporal coverage in biodiversity observations.
2.2. Local Engagement and Contextual Knowledge
The monitoring program engaged over 300 unique local observers, who contributed wildlife observations on both a voluntary and an incentivized basis. Participation was open to all community members. Before participation, all observers were introduced to the project’s goals and methods through a First, Prior, and Informed Consent (FPIC) process.
To gain a clearer understanding of the communities involved in this program and to complement the collected observation data, we gathered anecdotal information from all participating villages. This process aimed to capture local perceptions, priorities, logistical challenges, and the community’s understanding and experience of the program. Such information was essential for interpreting ecological data within its social context and for ensuring that the monitoring approach remained grounded in and responsive to local realities.
Anecdotal data was primarily collected through our local facilitator, who lives near the participating villages and maintains regular informal contact with community members, both in person and through WhatsApp. Through open-ended conversations, the facilitator collected insights on wildlife conditions, village priorities, forest use, and views on the program. Discussions also addressed practical aspects, including access to banking services, mobile phones, and digital payment systems. WhatsApp groups created for each village, initially intended for coordination, became valuable platforms for ongoing communication. Observers used them to share wildlife photos, discuss species identification, raise questions, and report issues. Program staff also used these channels to respond directly, offer clarifications, and gather feedback. After each village visit, the facilitator documented key observations and community feedback in short internal reports, capturing both positive and critical views to support program refinement.
Further anecdotal information was obtained through field visits by a core team member, who observed how monitoring tools were used and engaged in informal discussions with villagers. These visits provided insight into participation patterns, barriers to technology use, and broader community engagement. When presented with satellite imagery on project tablets, villagers demonstrated detailed spatial knowledge of their environment, quickly identifying landmarks, orangutan nest sites, and habitat features. Targeted inquiries, such as a participatory orangutan (Pongo pygmaeus) population survey using the Pooled Local Expert Opinion (PLEO) method [7], enriched our understanding of wildlife perceptions across different age groups. Through a combination of local facilitation, digital communication, field-based observation, and focused qualitative approaches, community perspectives were consistently incorporated into the monitoring process. This integration informed not only the program’s outcomes but also its structure, communication methods, and adaptive management strategies.
2.3. Wildlife Data Collection and Verification
Data collection has been ongoing since May 2023 and was designed to emphasize local participation, ownership, and practicality over conventional scientific rigor. A combination of qualitative and digital tools was used, including ESRI’s Survey123 [8], Field Maps, and traditional methods such as participatory mapping. Participatory mapping was conducted monthly through interviews with local residents, as well as through Focus Group Discussions (FGDs) held in each village. Since March 2024, community members have been using mobile applications, including Survey123 and Field Maps, on smartphones and tablets to record biodiversity observations. These observations include direct sightings, vocalizations, and indirect signs such as nests, footprints, claw marks, and feeding traces. Each submission typically includes the observer’s names, date and time, species name, location name with GPS coordinates, a description or notes about the observation, and supporting evidence in the form of a photo/audio, and/or video.
All observations submitted by community members are reviewed by a trained verification team composed of researchers and experts. This team applies rule-based criteria and uses field guide references to assess the validity of each submission. Verification involves cross-checking species identification, evaluating the quality of photographic or audio evidence, and assessing spatial and temporal consistency.
2.4. Ethical Considerations
The FPIC process ensured that all participants understood and agreed to the goals, risks, and benefits of their involvement. FPIC is regularly re-checked if any changes to the approach are necessary. Data privacy was maintained by anonymizing observer identities and generalizing sensitive location data in reports and publications.
2.5. Data Collection Methods
The community-based observation program was implemented in three distinct phases since project commencement: voluntary, target-based incentive, and payment rewards for observations.
2.5.1. Phase 1: Voluntary Data Collection (May 2023 – August 2024)
During the initial voluntary phase, data were gathered through participatory mapping involving sketch maps and structured interviews, including Pooled Local Expert Opinion surveys to determine perceived orangutan trends (Text S1, Supplementary Materials). Designated village-based collectors conducted ground-level data collection by traveling across hamlets (dusun) to engage with local residents. Observations were initially marked with physical stickers on printed maps and subsequently digitized in ArcGIS for spatial analysis and storage.
2.5.2. Phase 2: Incentive-Based Tablet Mapping (September – December 2024)
To enhance participation, an incentive-based approach was introduced in September 2024. Each participating village received a digital tablet equipped with the ArcGIS Field Maps application, alongside a goal of submitting 600 observations per village within four months. Successful completion of this target entitled the community to retain the tablet permanently.
2.5.3. Phase 3: Payment for Observations (January 2025 – Ongoing)
In late January 2025, a pilot monetary incentive system was introduced in one village. Verified orangutan sightings were compensated at USD 3 and orangutan nest observations at USD 0.90. This pilot yielded a notable increase in reporting rates, averaging 300–400 submissions per month. Given the success, the scheme was expanded to all four participating villages starting on 1st May 2025, along with an expanded list of reward-eligible species. This list primarily includes fauna of cultural significance to the community, as well as species of national and global conservation concern.
3. Results
3.1. Participant Engagement and Data Quality
3.1.1. Participant Engagement
Participants have achieved measurable gains in knowledge related to biodiversity and species identification, which is an encouraging outcome. Most participants already hold positive attitudes toward wildlife, and some noted that it feels more rewarding to record bird calls than to sell birds in the market. Nonetheless, certain individuals still view specific species such as pigs and song birds as targets for hunting. The community is generally aware of endangered species protected by the government and understands that hunting or killing these animals is a serious offence. However, traditional practices and subsistence needs occasionally lead to the continued hunting of certain species, such as pigs.
From May to July 2024, a total of 92 respondents across four villages participated in the PLEO interviews regarding orangutan population trends. Respondents ranged in age from their 20s to over 80, with the majority aged 41–60. The pooled orangutan population estimates were 2,135 orangutans in 2000, 1,067 in 2019 and 870 in 2024, indicating a perceived decrease of 59.3% across 24 years (Table S1 and Figure S1, Supplementary Materials).
Participants have also demonstrated a high level of engagement and enthusiasm, with many reporting frequent observations of wildlife around their homes and farmland. Common sightings include orangutan nests, a variety of bird species, squirrels, and macaques. This underscores the accessibility of biodiversity data collection in these rural settings, where wildlife encounters are a regular part of daily life.
3.1.2. Observation Data
Since program initiation, over 300 community observers from diverse demographic backgrounds have actively contributed to data collection efforts. As of June 2025, they have collectively recorded a total of 19,069 observations of 165 species using multiple data collection methods since the program began in May 2023. Of these, 15,891 observations (83%) were recorded using Survey123, while 2,645 observations (14%) were gathered through Field Maps. The remaining 533 observations (3%) were obtained through participatory mapping using stickers and focus group discussions (FGD), incorporating traditional knowledge and community-driven spatial documentation. Among these observers, 49 observers have recorded more than 100 observations, and the top 10 contributors have individually recorded between 1023 and 463 observations, underscoring the dedication of key individuals in biodiversity monitoring (Figure 1).
Observation submission varied significantly across the three phases, reflecting the changes in community motivation driven by incentive structures introduced in the different phases (Figure 2). During phase 1, participation remained relatively low and steady, averaging 17 observations per village per month. Observations were collected voluntarily through participatory mapping without any direct incentive, resulting in a low submission rate that served as a baseline for subsequent phases.
A sharp increase in observations occurred during phase 2. With the introduction of digital tablets and a community-level reward (permanent tablet ownership upon reaching 600 observations), engagement surged. This approach resulted in high engagement, with participants collectively submitting 2,645 observations, exceeding the initial target. This phase demonstrated the motivating power of collective, tangible incentives. Phase 3 further amplified the participation rate, initially piloted in one village in late January and expanded to all four villages by May 2025. This phase offered direct financial compensation: USD 3 for verified orangutan sightings and USD 0.90 for orangutan nest observations. As shown in Figure 2, this approach resulted in a sustained increase in observation activity. Initial reporting averaged 300–400 observations per month, but the number of observations surged in the subsequent months to 2,000, 4,000, and eventually over 6,000 observations per month. By June 2025, the cumulative total had reached 14,085 observations in phase 3. This increase was partly attributed to the expansion of the list of reward-eligible species to include taxa of cultural, national, and global conservation significance.
These trends highlight a clear positive correlation between the strength of incentives and community engagement. The progression from voluntary to monetary rewards resulted in measurable increases in participation, showing the effectiveness of phased, adaptive motivation strategies in CS within rural communities.
3.1.3. Data Quality
Among the recorded biodiversity observations, several species have been documented over 100 times. The most frequently reported are orangutan nests (9,766 observations), white-rumped shamas (Copsychus malabaricus, 1,814 observations), sun bears (Helarctos malayanus, 467 observations), stingless bees (Trigona spp., 370 observations), Bornean orangutans (Pongo pygmaeus, 316 observations), long-tailed macaques (Macaca fascicularis, 305 observations), and Oriental magpie-robin (Copsychus saularis, 247 observations). These records include both direct and indirect observations, such as photographs or videos of orangutans, audio recordings of gibbon and bird calls, as well as traces such as footprints and claw marks from sun bears.
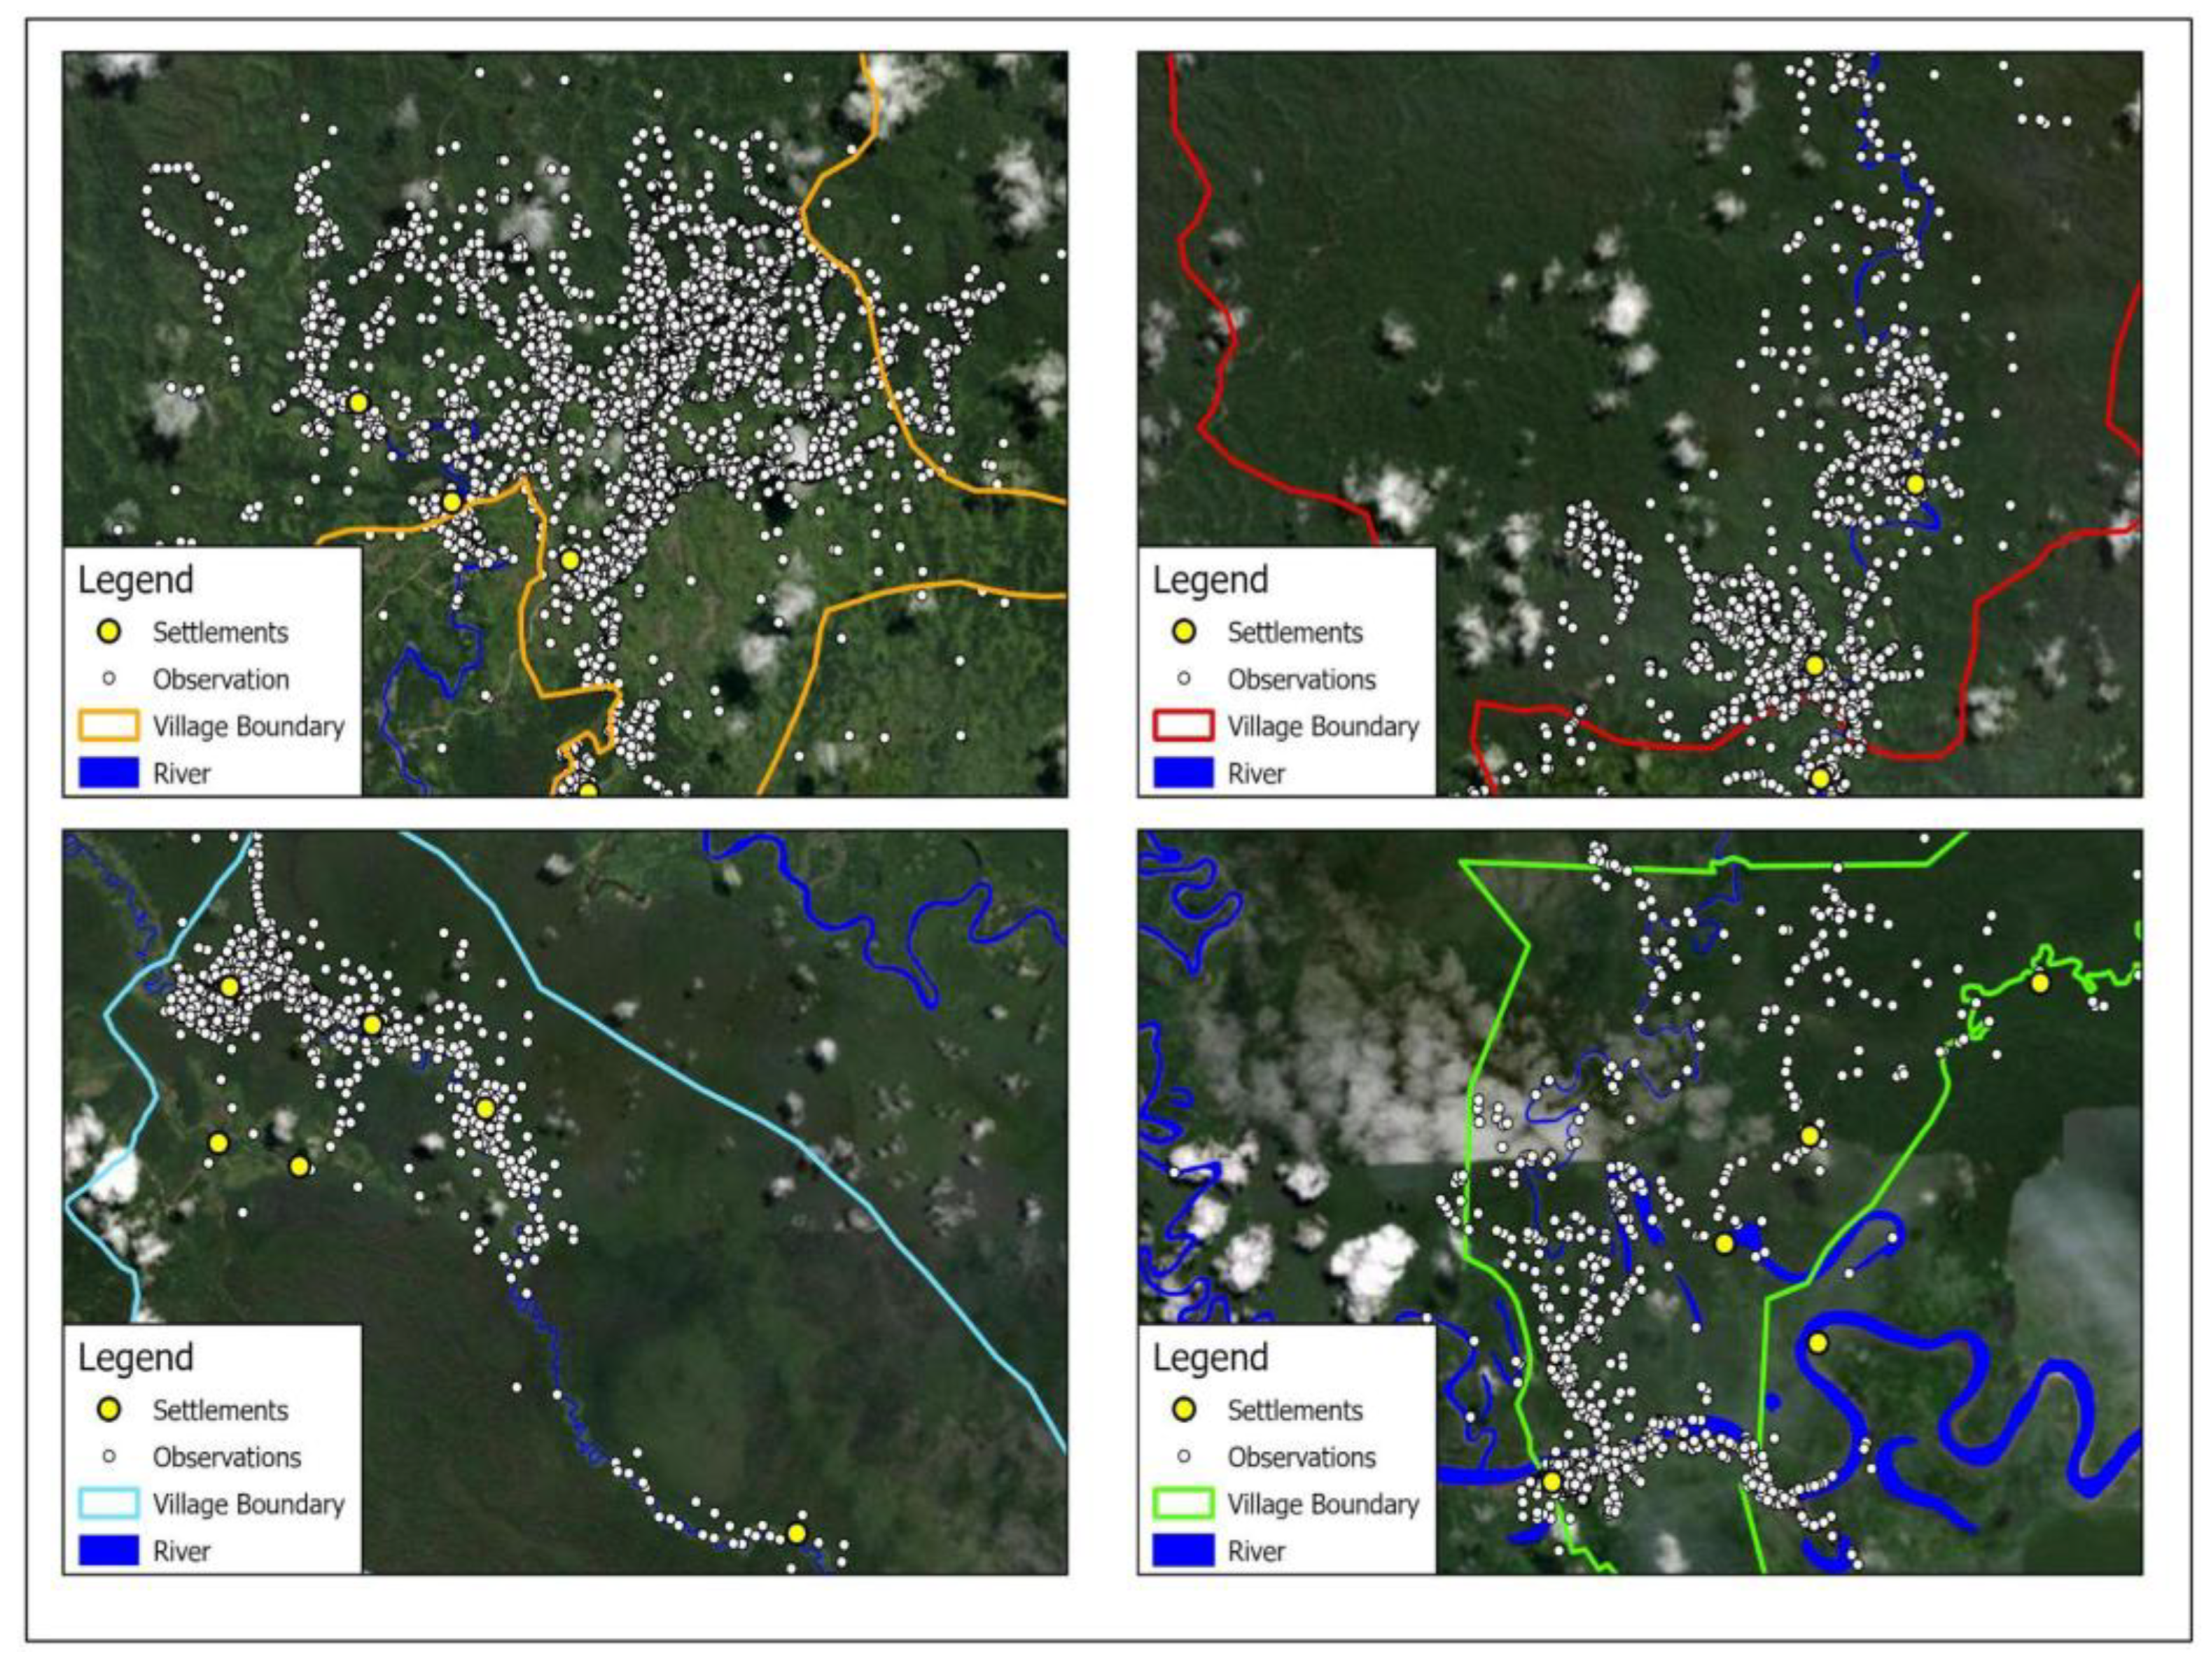
Figure 3.
shows the distribution of community observations across four villages in rural Kalimantan.
Figure 3.
shows the distribution of community observations across four villages in rural Kalimantan.
3.2. Motivation
The introduction of incentives led to a noticeable increase in submitted observations (Figure 2). For most participants, the idea of being rewarded for daily wildlife monitoring was new and novel. Previously, compensation was limited to short-term contracts assisting NGOs with camera traps or survey work. A total of 88 community observers received financial rewards through the wildlife monitoring incentive scheme. The average monthly payments to each participating village are summarised in Table 1. Village A began participating earlier than others, as the reward system was first trialled there with payments focused on orangutan and orangutan nest observations. The program was subsequently expanded to village B, followed by full implementation in the remaining two villages, C and D.
Across all observers, the mean total payment per individual was approximately USD 80, with a 95% confidence interval ranging from USD 57 to USD 106. Variation in the total amount received per observer was considerable, reflecting differences in observation frequency, consistency, and individual participation levels. Around 30% of observers received payments above the average, while approximately 20% received relatively low amounts. This model of rewarding routine monitoring is both novel and empowering. Some participants even noted that recording wildlife was more rewarding than a day of manual labor, which typically pays around USD 9.
3.2.1. Observation Trends and Cost Comparison
The impact of introducing incentives is reflected in the volume of observations submitted over time. There were 1,014 observations collected during the voluntary phase, using a combination of informal interviews and participatory mapping using stickers on paper maps. Observations were regularly recorded opportunistically during daily activities like fishing, farming, and going into the forest.
The target-based incentive introduced from September to December 2024 (Figure 2) resulted in 2,645 observations in the four months. With the rollout of payment rewards for valid wildlife observations in 2025, expanding participation using Survey123, yielding 14,085 observations by June 2025.
The shift not only reflects increased volume but also a shift in behavior. Many observations are now made intentionally, with participants going into the forest specifically to document wildlife. To ensure data accuracy, it is required that each observation includes photos and audio recordings as supporting evidence. This has improved data quality and verification, making the dataset more robust. The incentive model also includes an incentive value based on species prioritized by the community, with higher rewards for species considered important in terms of conservation and cultural significance.
Cost analysis of this approach resulted in an average cost of USD 0.85 per observation, and aside from travel expenses incurred by the local facilitator in distributing payments across the four villages, this approach has proven to be cost-effective. In comparison, traditional biodiversity surveys conducted by trained researchers typically involve substantially higher costs. Scientific field teams conducting transects typically incur costs estimated at approximately USD 95 per transect [9], which is 107 times higher than our CS-based model. Similarly, camera trap monitoring requires a substantial upfront investment of around USD 401 per unit, covering hardware, memory cards, and batteries [10]. Deployment and maintenance costs equate to hundreds of thousands of Rupiah per recorded observation, in addition to field labor and data processing costs. A similarly run CS-based initiative in oil palm plantations with company staff, contractors, and external visitors, equates biodiversity monitoring to approximately USD 0.14 per hectare [11].
3.2.2. Trust and Credibility
During the program, there were incidents of data falsification in which observers submitted orangutan records later identified as sourced from the internet. The verification team detected inconsistencies between the submitted media and the reported GPS location, prompting further investigation. Swift coordination between the local program coordinator and the village head led to direct clarification with the individual involved, who admitted to the falsification. Consequently, the observer was removed from the program. The community regarded this breach as a serious matter that threatened their integrity and the trust established between the community and program staff, and they supported the decision to impose sanctions.
Overall, participants tend to track their submissions and estimate their expected payments. When discrepancies arise, such as rejected entries, they are generally accepting decisions by the verification team, especially when rejections are accompanied by clear explanations (e.g. due to unclear photos, audio, or descriptions, or duplications). Trust in the program depends heavily on the consistency and transparency of the verification and payment system. While occasional setbacks like system downtime can temporarily reduce confidence in the program, timely payments and effective communication, alongside responsive technical support, have been critical in restoring and maintaining long-term credibility.
3.2.3. Technology Adaptation
Most community members own smartphones but had limited prior experience with using mobile apps for recording observations; however, participants quickly adapted to using Survey123 and Field Maps, particularly when the benefits were tangible. In addition to individual adaptation, many participants have demonstrated strong peer-to-peer support. Those without smartphones have been supported by others willing to lend their devices. Some have even suggested entering the forest together to observe orangutan nests and other species, then sharing the benefits equally.
4. Discussion
4.1. Lessons Learned
Local communities have proven to be invaluable contributors to biodiversity monitoring. Their deep understanding of the environment and sharp observational skills have significantly improved both the quality and quantity of data collected. By integrating traditional ecological knowledge with modern tools such as ESRI’s Survey123 and Field Maps, the project has been able to monitor species distribution. While data analysis is still in its early stages, preliminary occupancy modelling has been conducted, providing initial insights into species distribution and habitat use.
As community members engaged in wildlife observation, some began reporting rare and endangered species more frequently, enriching biodiversity data and contributing to the identification of conservation priorities. Although the program is still in its early stages, initial trends suggest that continued engagement may foster greater interest in biodiversity and increased attentiveness to ecological patterns. The initiative has also provided valuable insights into the dynamics of community engagement, including motivating factors, the influence of incentives, and participants’ adaptability to new technologies.
4.2. Challenges and Limitations
While this project has shown promising results, engaging communities in wildlife observation across rural Kalimantan presents several challenges. Sustaining motivation requires continuous engagement, clear incentives, and meaningful feedback to ensure that participants feel their contributions are valued. Technical difficulties, such as system downtime and limited internet access, can disrupt data collection efforts. Language barriers, including the use of different local names for species across villages, further complicate efforts to standardize and validate observations.
The initial reliance on self-reported data and varying quality in observers’ quality of observations introduces potential biases and inaccuracies [12]. Risks such as double reporting and exploitation of the payment system can affect data quality if not actively managed. Additionally, limited access to appropriate tools for recording observations restricts broader participation, often leaving only a few individuals actively contributing. However, it is worth noting that participants often demonstrate a strong spirit of cooperation, with many willing to help others by sharing devices or recording observations on their behalf. Overcoming these challenges is essential for building a reliable, inclusive, and sustainable community-driven monitoring program. Implementing quality control measures, such as regular data validation and feedback sessions, will be key to ensuring long-term success and credibility.
4.3. Future Directions
To maximize the impact of this CS initiative, future efforts should prioritize expanding its geographic reach to involve more communities and increase the spatial coverage of biodiversity monitoring. Advanced data analysis techniques can be employed to extract valuable insights from the collected data, such as identifying key biodiversity hotspots, assessing the impact of environmental factors over time, and occupancy modelling. Equally important is the need to give back to the communities that contribute this data. While financial incentives play a role in motivating participation, long-term sustainability depends on building a deeper sense of ownership and relevance. This includes regularly sharing the results of their observations, such as visual maps of species sightings, trends in biodiversity, and early warning signs of ecological change, so that communities can see the real-world value of their efforts. By translating raw data into accessible, meaningful information, we not only validate local contributions but also empower communities to make informed decisions about their natural resources. Empowering local communities to lead the initiative ensures long-term viability while fostering trust and reinforcing the value of their traditional knowledge. Collaboration with researchers, conservation organizations, and policymakers can further amplify the project's impact and facilitate broader knowledge exchange. A feedback-rich, participatory approach can contribute to more inclusive and effective biodiversity conservation strategies.
5. Conclusions
The CS initiative demonstrates the value of leveraging indigenous knowledge and redefining the power balance in community-based conservation from the data collection phase to changing local perspectives on human-wildlife interactions. By empowering communities to monitor and manage ‘their own’ biodiversity, this project has fostered a deeper understanding of the value of nature beyond immediate economic or agricultural concerns. Previously, species like the orangutan were often viewed as a threat to livelihoods in certain circumstances. However, with incentives such as rewards for recording or photographing wildlife, community members are beginning to see these species as assets rather than adversaries. Instead of instinctively driving orangutans away to protect their harvests, they now recognize an alternative value, where documenting these animals provides an economic return that may even exceed their crop losses. This transformation in mindset is a crucial step toward sustainable coexistence, ensuring that conservation efforts are not just about preserving biodiversity but also about reshaping how communities perceive and interact with their natural environment. Future initiatives should continue to build on these lessons, exploring innovative ways to engage local people in conservation while providing tangible benefits that align with their livelihoods.
Supplementary Materials
The following supporting information can be downloaded at the website of this paper posted on Preprints.org. Text S1: Interview guide and control questions for the orangutan population baseline; Table S1: Orangutan population estimates generated with the PLEO method for each of the four villages in the years 2000, 2019, and 2024; Figure S1: Orangutan population trends in the four villages.
Author Contributions
Conceptualization, E.M. and R.D.; Methodology, E.M., R.D., and A.E.; Software, S.Z.; Validation, M.S.O., S.S., S.Z., M.M., E.M., and R.D.; Formal Analysis, M.S.O., S.Z., and S.S.; Investigation, M.S.O. and A.E.; Data Curation, M.S.O., S.Z., and S.S.; Writing—Original Draft Preparation, M.S.O.; Writing—Review and Editing, R.D., E.M., and E.M.; Visualization, M.S.O., M.M., and S.F.; Supervision, E.M. and R.D.; Project Administration, M.S.O., E.M., and R.D.; Funding Acquisition, E.M. and R.D. All authors have read and agreed to the published version of the manuscript.
Funding
This work was supported by the Binnacle Fund and Wildlife Futures.
Institutional Review Board Statement
Ethical review and approval were waived for this study due to the nature of the research. The study was conducted following community-level Free, Prior and Informed Consent (FPIC) processes, and individual informed consent was obtained from all participants before collecting any data.
Informed Consent Statement
Written informed consent has been obtained from the communities to publish this paper.
Data Availability Statement
The data presented in this study are available on request from the corresponding author. The data are not publicly available due to privacy and confidentiality agreements with local community participants.
Acknowledgments
The authors acknowledge the financial support from the Binnacle Fund and Wildlife Futures, and thank them for their trust in supporting this novel project. Deep appreciation is extended to the village leaders and community participants for their enthusiasm and dedication in adopting this new approach and contributing valuable observations. The authors also thank the coordinators and collectors whose commitment ensured smooth project implementation, as well as all individuals involved in training sessions, focus group discussions, and logistical support. Their contributions were instrumental to the success of this phase of the work. During the preparation of this manuscript, the authors used ChatGPT (OpenAI, GPT-4, July 2025 version) for linguistic refinement. The authors have thoroughly reviewed and edited the output, and take full responsibility for the content of this publication.
Conflicts of Interest
The authors declare no conflicts of interest.
Abbreviations
The following abbreviations are used in this manuscript:
| CS | Citizen Science |
| ECS | Extreme Citizen Science |
| FPIC | First, Prior, and Informed Consent |
References
- Gooding, L.; Pateman, R.M.; West, S.E. Citizen science and its potential for aiding low carbon energy transitions. Energy Res. Soc. Sci. 2024, 117, 103702. [CrossRef]
- Albert, A.; Balázs, B.; Butkevičienė, E.; Mayer, K.; Perelló, J. Citizen Social Science: New and Established Approaches to Participation in Social Research. In The Science of Citizen Science; Vohland, K., Land-Zandstra, A., Ceccaroni, L., Lemmens, R., Perelló, J., Ponti, M., Samson, R., Wagenknecht, K., Eds.; Springer: Cham, Switzerland, 2021. [CrossRef]
- Chiaravalloti, R.M.; Skarlatidou, A.; Hoyte, S.; Badia, M.M.; Haklay, M.; Lewis, J. Extreme citizen science: Lessons learned from initiatives around the globe. Conserv. Sci. Pract. 2022, 4(2), e577. [CrossRef]
- Bélisle, A.C.; Asselin, H.; Leblanc, P.; Gauthier, S. Local knowledge in ecological modeling. Ecol. Soc. 2018, 23(2), 14. [CrossRef]
- MacKinnon, K.; Hatta, G.; Halim, H.; Mangalik, A. The Ecology of Kalimantan, Indonesian Borneo; Periplus Editions: Singapore, 1996.
- van Strien, A.J.; van Swaay, C.A.M.; Termaat, T. Opportunistic citizen science data of animal species produce reliable estimates of distribution trends if analysed with occupancy models. J. Appl. Ecol. 2013, 50, 1450–1458.
- van der Hoeven, C.A.; de Boer, W.F.; Prins, H.H.T. Pooling local expert opinions for estimating mammal densities in tropical rainforests. J. Nat. Conserv. 2004, 12(4), 193–204. [CrossRef]
- Esri. Survey123 for ArcGIS (Version 3.23.36) [Mobile application software]. Environmental Systems Research Institute: Redlands, CA, USA, 2024. Available online: https://survey123.arcgis.com (accessed on 29 July 2025).
- Franco, A.; Palmeirim, J.; Sutherland, W. A method for comparing effectiveness of research techniques in conservation and applied ecology. Biol. Conserv. 2006, 134(1), 96–105. [CrossRef]
- Haysom, J.K.; Deere, N.J.; Wearn, O.R.; Mahyudin, A.; Jami, J.B.; Reynolds, G.; Struebig, M.J. Life in the canopy: Using camera-traps to inventory arboreal rainforest mammals in Borneo. Front. For. Glob. Change 2021, 4, 673071. [CrossRef]
- Maharani, N.; Nardiyono, N.; Swayanuar, P.; Munthe, C.R.; Ni’Matullah, S.; Sueif, S.; Zaini, S.; Supriatna, J.; Kusrini, M.; Dennis, R.; Van Balen, B.; Van Strien, A.; Meijaard, E. A novel citizen science-based wildlife monitoring and management tool for oil palm plantations. bioRxiv 2025, preprint. [CrossRef]
- Dickinson, J.L.; Zuckerberg, B.; Bonter, D.N. Citizen science as an ecological research tool: Challenges and benefits. Annu. Rev. Ecol. Evol. Syst. 2010, 41, 149–172. [CrossRef]
Figure 1.
List of the top 20 observers with more than 100 recorded observations.
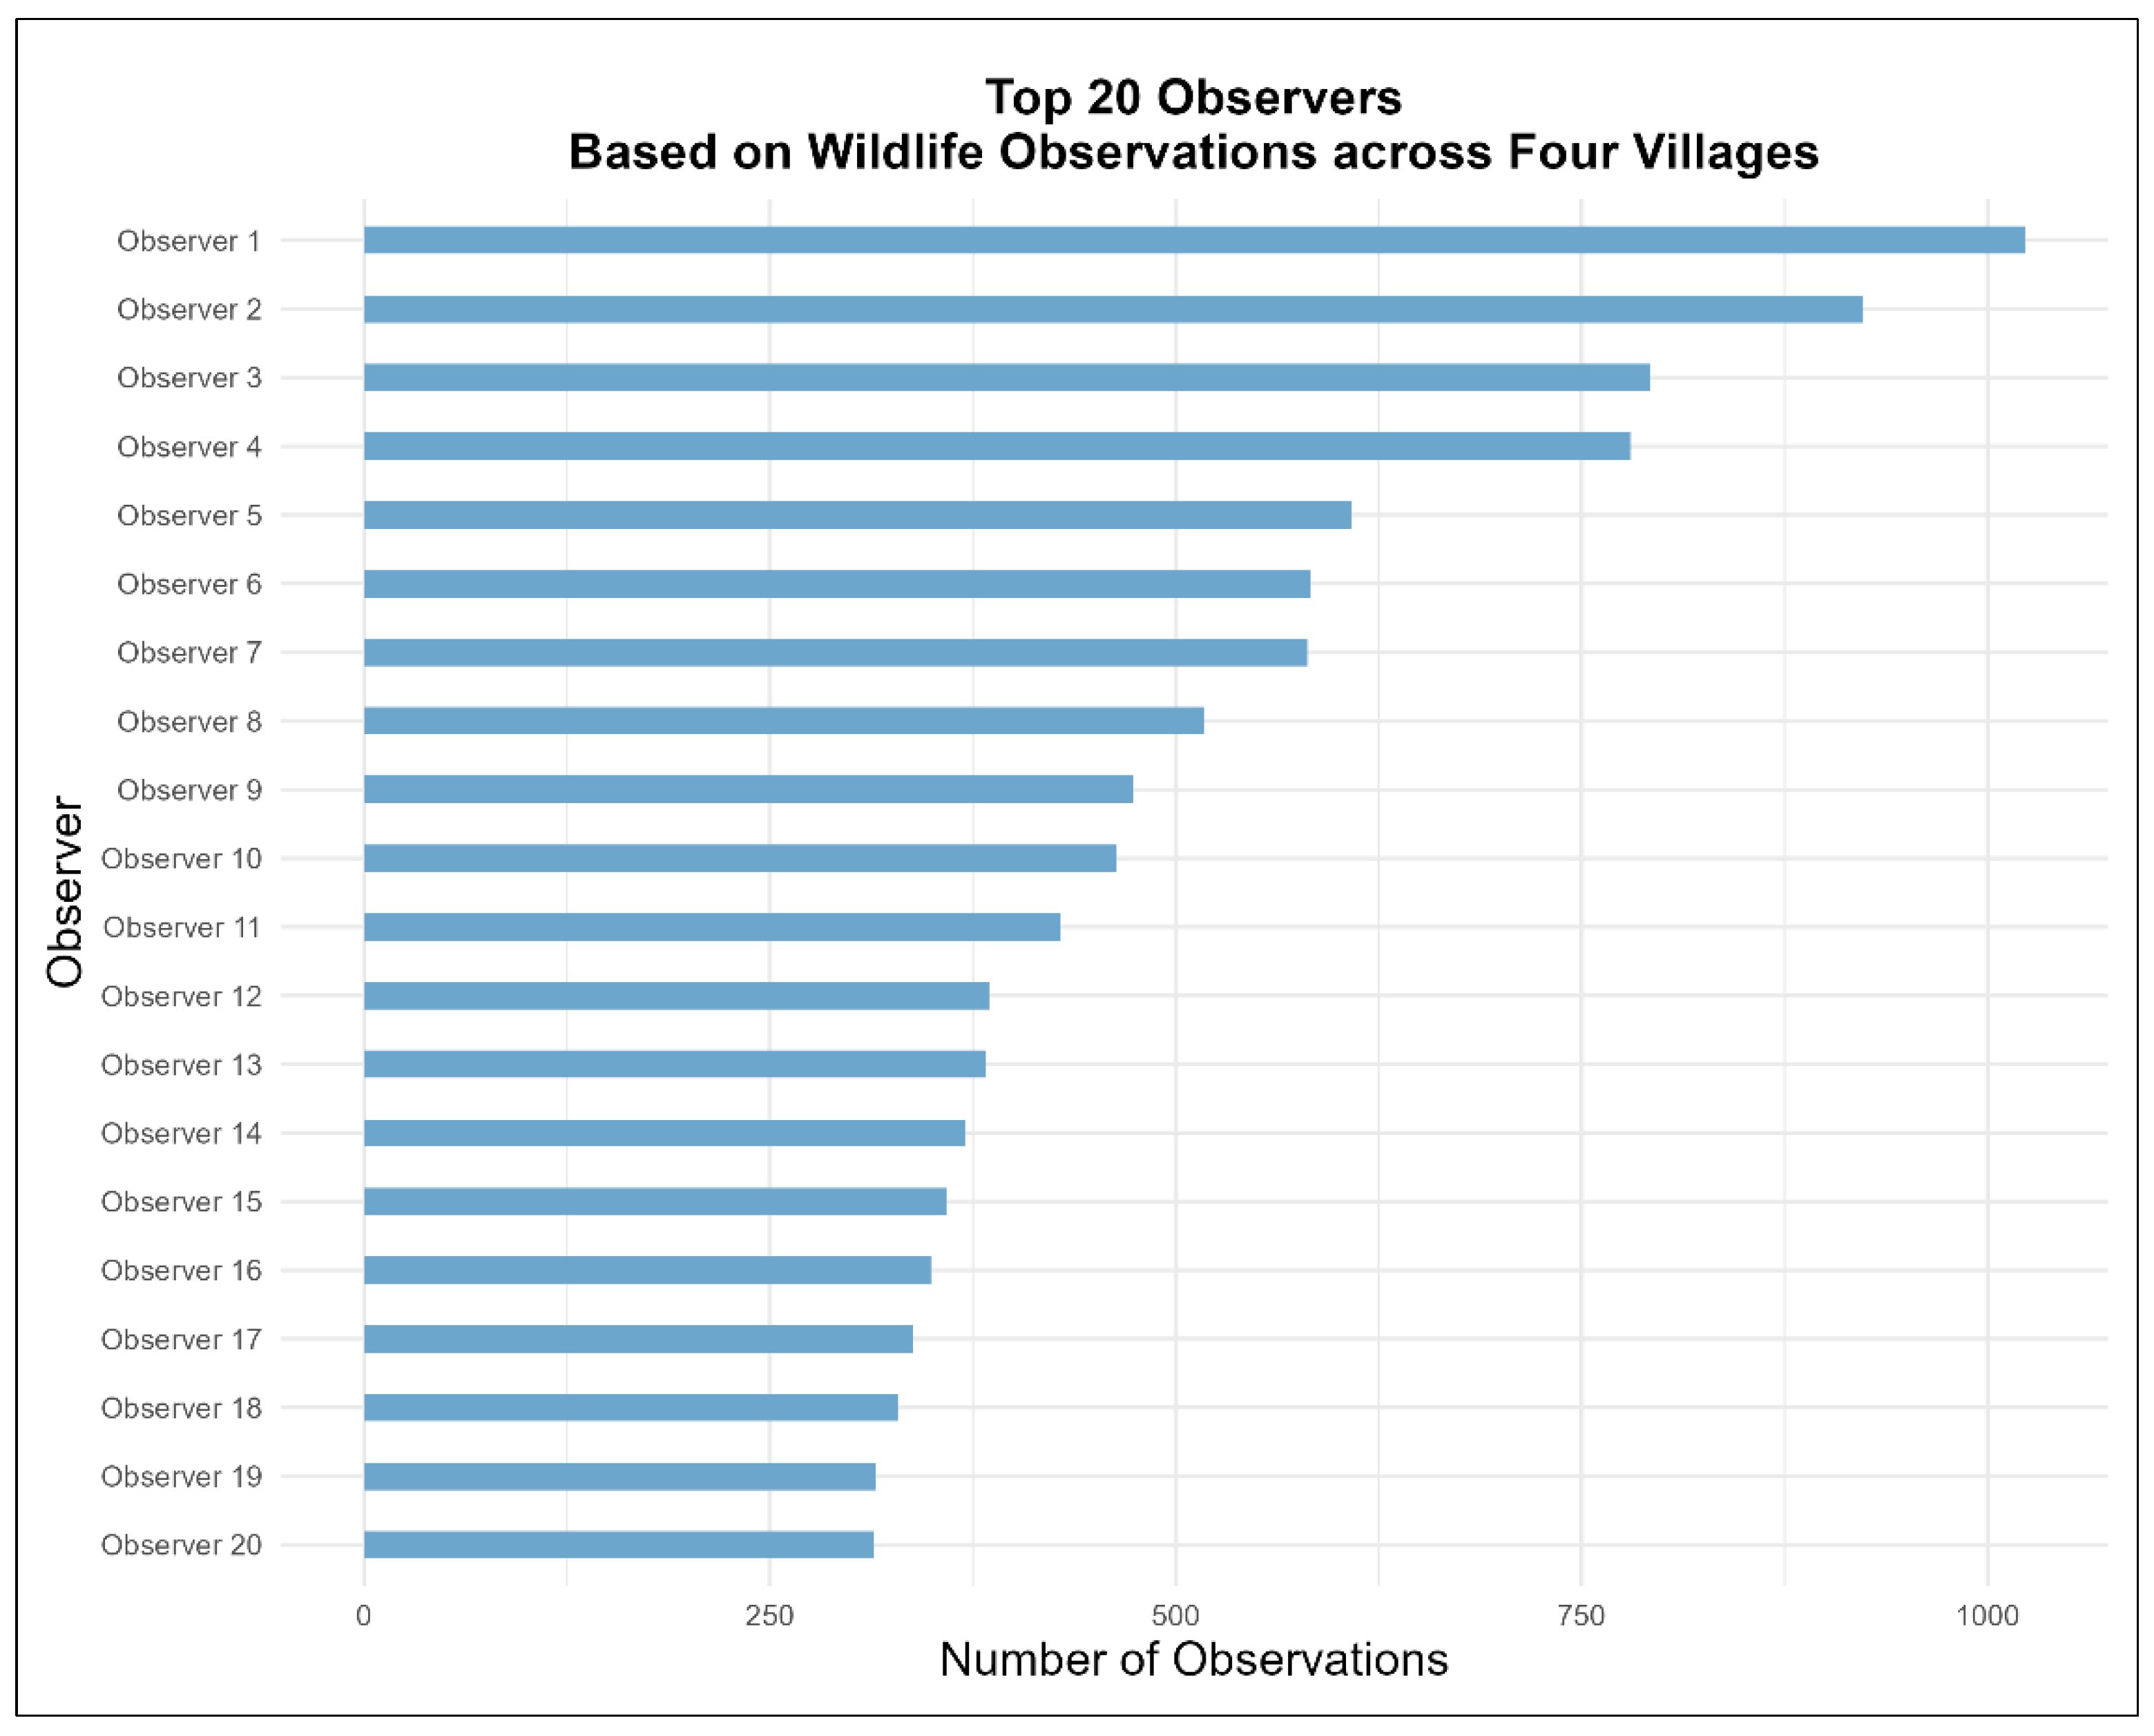
Figure 2.
Observation trend since the initiation of the program in May 2023.
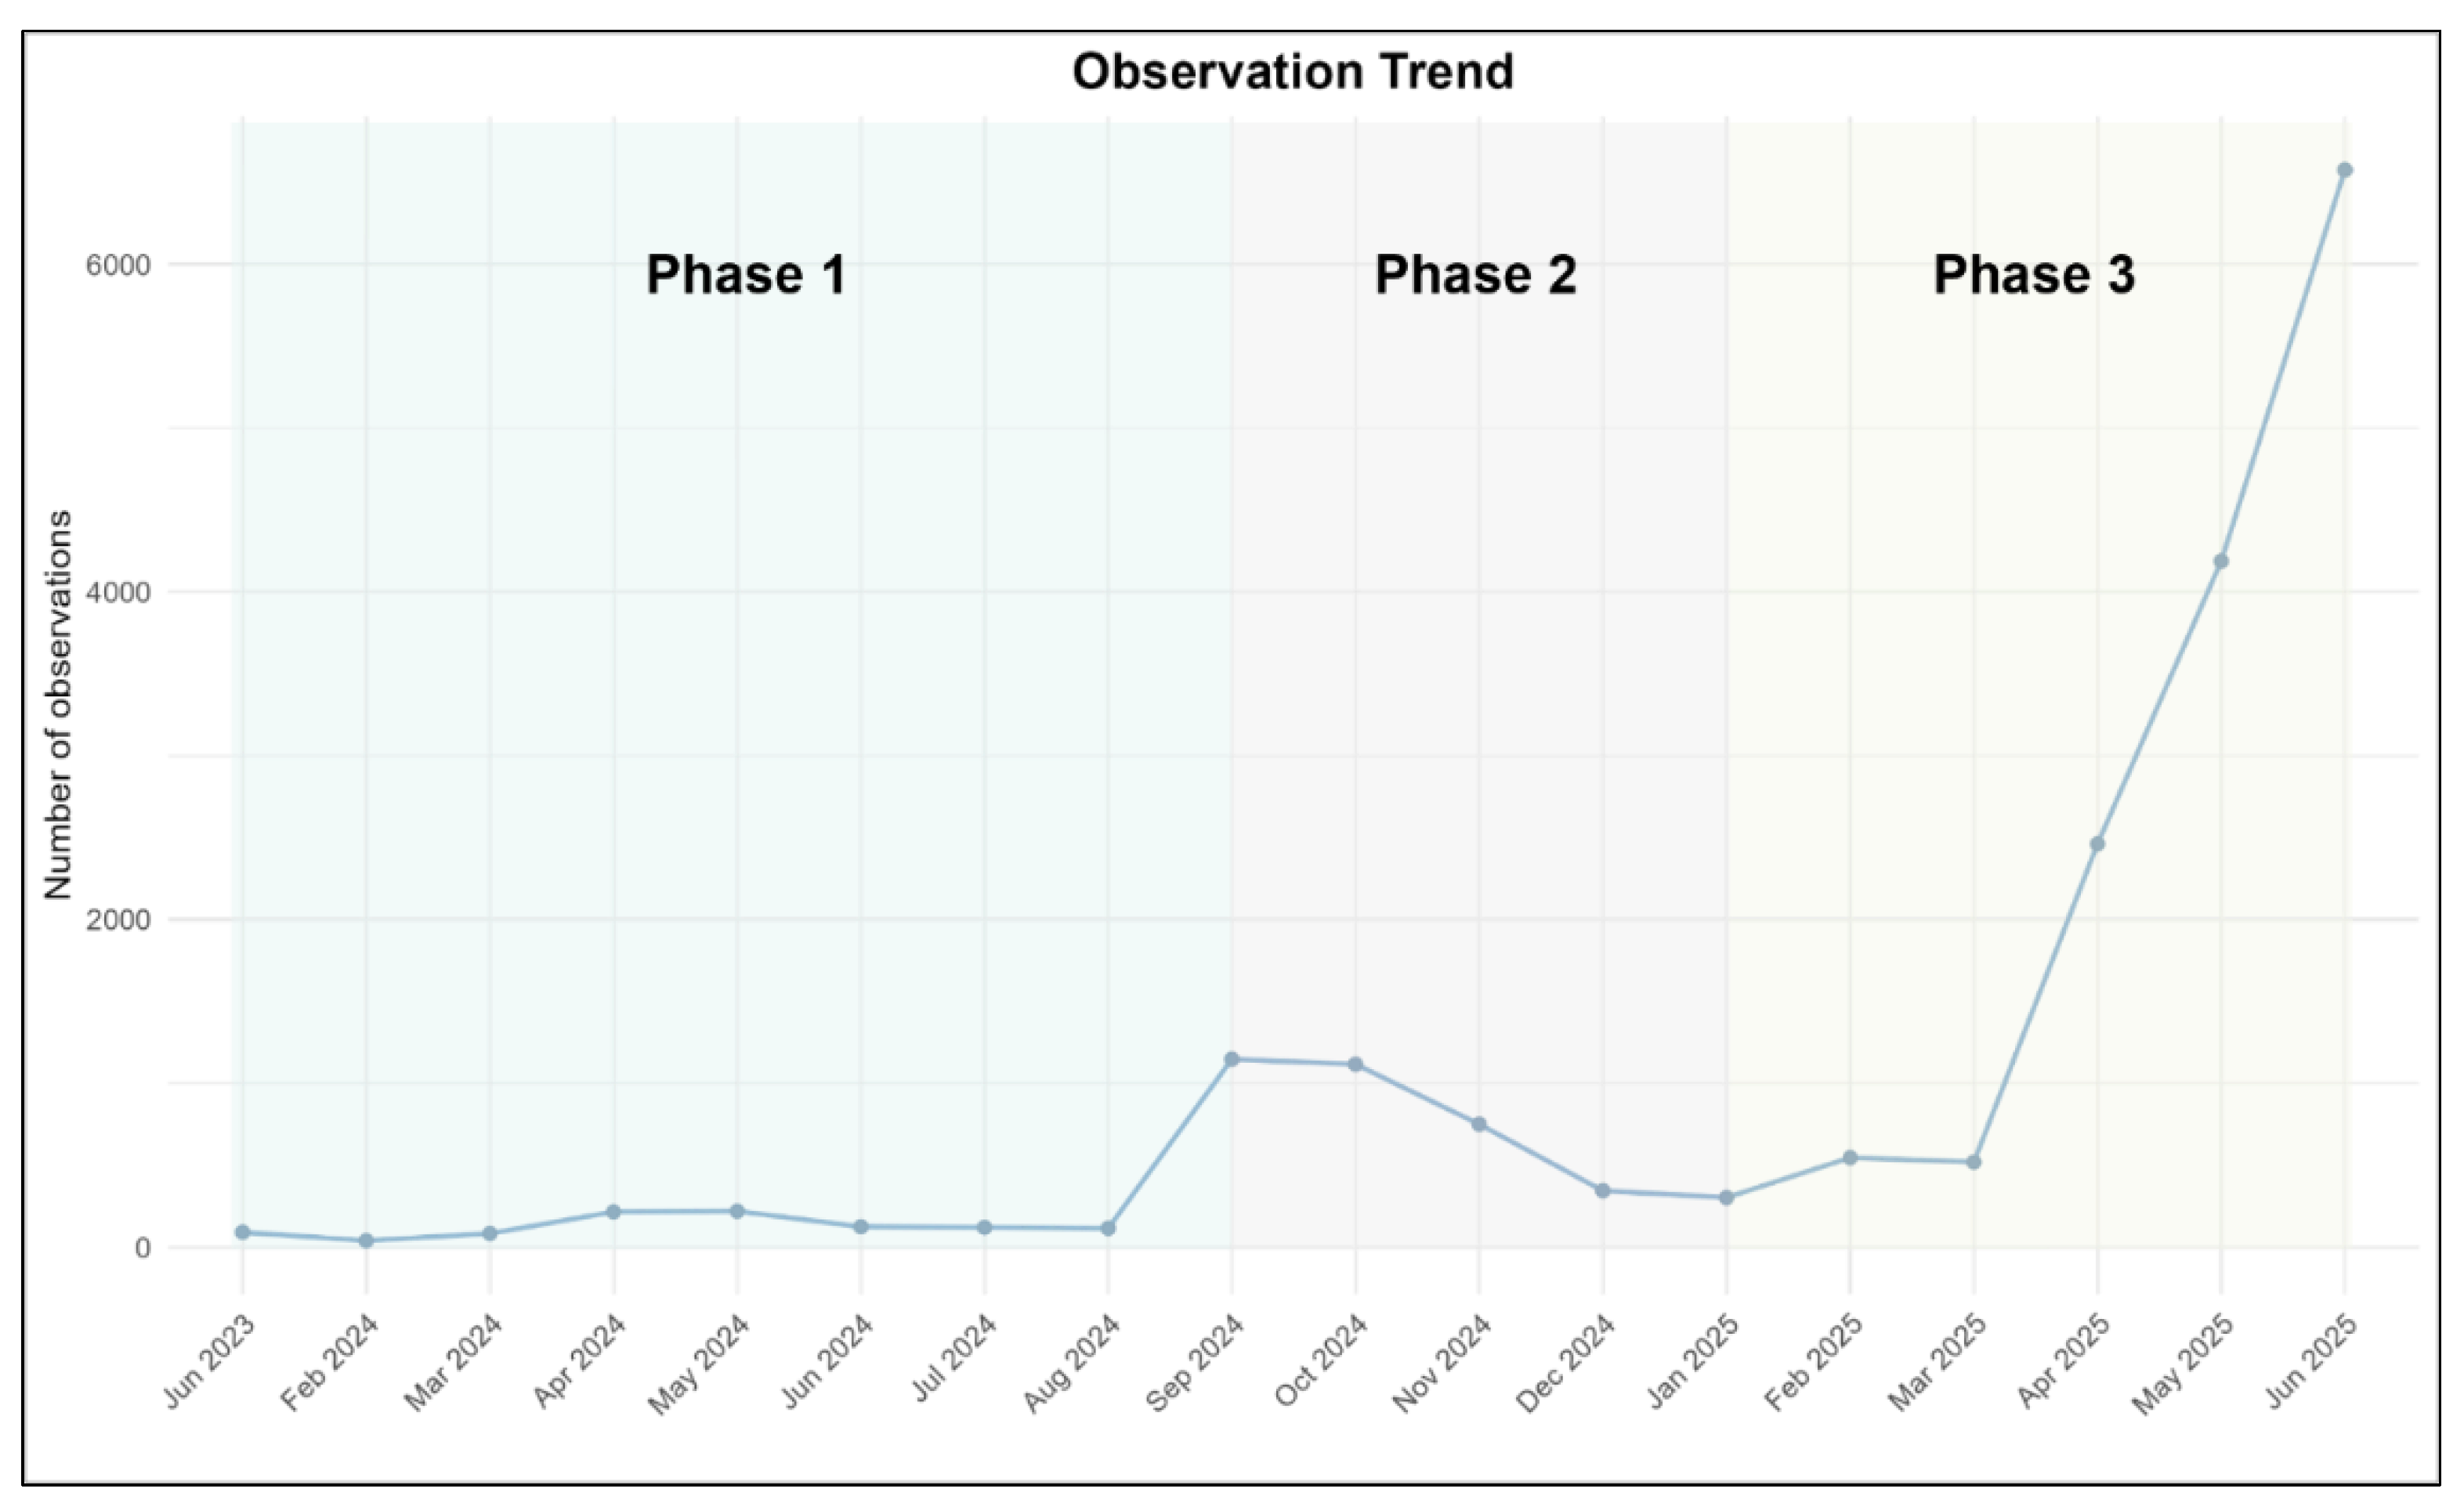

Table 1.
The average monthly payments distributed across the four participating villages.
| Village | Average Monthly Payment (USD) |
|---|---|
| A | 986 |
| B | 613 |
| C | 61 |
| D | 162 |
Disclaimer/Publisher’s Note: The statements, opinions and data contained in all publications are solely those of the individual author(s) and contributor(s) and not of MDPI and/or the editor(s). MDPI and/or the editor(s) disclaim responsibility for any injury to people or property resulting from any ideas, methods, instructions or products referred to in the content. |
© 2025 by the authors. Licensee MDPI, Basel, Switzerland. This article is an open access article distributed under the terms and conditions of the Creative Commons Attribution (CC BY) license (http://creativecommons.org/licenses/by/4.0/).
Copyright: This open access article is published under a Creative Commons CC BY 4.0 license, which permit the free download, distribution, and reuse, provided that the author and preprint are cited in any reuse.


