Submitted:
19 August 2025
Posted:
20 August 2025
Read the latest preprint version here
Abstract
Meta-analysis is central to evidence-based medicine, yet much of the biomedical literature continues to rely on software with outdated statistical defaults. Legacy programs such as RevMan 5.4 and MetaDiSc 1.4 persist in practice despite their reliance on the DerSimonian–Laird estimator and the obsolete Moses–Littenberg model for diagnostic test accuracy. Their modern successors—RevMan 7 and MetaDiSc 2.0—have incorporated robust methods including Restricted Maximum Likelihood estimation, Hartung–Knapp–Sidik–Jonkman intervals, prediction intervals, and hierarchical bivariate models. However, their dissemination has been limited, and both remain constrained in handling more advanced approaches such as Bayesian modelling or network meta-analysis. Comprehensive Meta-Analysis, although widely used, raises further concerns about transparency and reproducibility due to undisclosed algorithms and unclear defaults. Reliance on fragile defaults embeds preventable bias and exaggerated precision into the evidence base. By contrasting legacy practices with current methodological standards, this critique provides practical recommendations for researchers, reviewers, and editors to promote transparent, reproducible, and methodologically sound meta-analytic practice.
Keywords:
RevMan 5.4
; Meta-DiSc1.4
; comprehensive meta-analysis
; REML
; HSROC
; bivariate
; Moses-Littenberg
; Wald-type intervals
; Hartung–Knapp–Sidik–Jonkman adjustment
Introduction
Meta-analysis is now regarded as the highest tier of evidence, shaping guidelines, clinical decisions, and health policies worldwide. However, a paradox has emerged: while statistical methodology for evidence synthesis has advanced substantially [1,2]—progressing from simple DerSimonian–Laird (DL) estimators [3] to more robust random-effects approaches such as restricted maximum likelihood (REML) [4,5] or Paule-Mandel (PM) [6,7], from traditional Wald-type (WT) confidence intervals [3] to more conservative Hartung–Knapp–Sidik–Jonkman (HKSJ) adjustments [8,9,10,11,12,13,14], and from outdated diagnostic models like Moses–Littenberg [15] to the hierarchical bivariate model (Reitsma et al.) [16] and the hierarchical summary ROC (HSROC) model (Rutter and Gatsonis) [17,18]—the software actually used to generate most published meta-analyses has stagnated.
The persistence of outdated software in meta-analysis reflects not methodological superiority, but accessibility and habit. Early programs gained widespread adoption because they were free, user-friendly, or officially endorsed, while commercial alternatives were comparatively affordable and easy to use [19]. In contrast, modern solutions often require greater statistical literacy or costly licenses, creating barriers to adoption despite their clear methodological advantages. This mismatch has created a worrying disconnect. On the one hand, Cochrane and leading methodologists explicitly caution against outdated estimators and promote advanced, reproducible tools. On the other hand, much of the biomedical community continues to rely on legacy software that neither implements modern estimators nor ensures transparency.
The deeper problem, however, goes beyond software versions. Meta-analysis is not a routine calculation but a sophisticated modeling exercise that requires methodological expertise, clinical judgment, and interpretive caution. Simplified interfaces may lower the technical threshold, but they also foster the illusion that valid meta-analysis is merely a matter of loading data and reading outputs. By distributing free and accessible programs to a global research community, the field has unintentionally encouraged widespread use by individuals without the necessary training to evaluate models, assumptions, or limitations critically. The result is a proliferation of analyses that are statistically convenient but methodologically fragile. This phenomenon is further exacerbated by the ‘point-and-click’ paradigm itself: interfaces designed to minimize friction can paradoxically discourage critical engagement with underlying assumptions, fostering a culture of uncritical acceptance of defaults. While accessibility is important, over-reliance on automated menus and opaque outputs can transform meta-analysis from a modeling exercise requiring judgment into a mechanical task of clicking buttons and reporting results. Such convenience, when coupled with hidden defaults, creates a dangerous dependence that undermines methodological rigor. This inertia, however, cannot be reduced to individual habit alone. It reflects a broader ecosystem failure: medical and public health curricula often normalize outdated tools, institutional IT and licensing barriers discourage transitions, and peer review rarely enforces methodological standards. The persistence of legacy software is thus not merely a matter of users clicking the wrong buttons, but the outcome of structural forces in education, institutional policy, and academic publishing that sustain these fragile defaults
This has generated a silent epidemic of methodological fragility: thousands of meta-analyses published annually are built on outdated statistical engines, embedding preventable biases and a false sense of precision into the evidence base at its highest level. At the heart of this epidemic lie hidden defaults—automatic estimators, continuity corrections, and study exclusions applied without user awareness—that silently distort results. The purpose of this article is to critically examine the limitations of legacy meta-analysis software, trace the historical and practical reasons for their persistence, and outline feasible solutions for a transition toward robust and transparent tools
From Legacy Defaults to Modern Standards: The Evolution of User-Friendly Meta-Analysis Software
Review Manager (RevMan): A Tale of Two Versions
RevMan, the flagship software of Cochrane, exemplifies the challenge of methodological transition. For decades, its desktop version, RevMan 5.4, was the most widely used tool for systematic reviews, largely due to its accessibility and official endorsement. However, its statistical engine is now profoundly outdated.
- For intervention reviews, RevMan 5.4 [20] defaults to the DL estimator for random-effects models—a paradigmatic hidden default. The dominance of the DL estimator did not arise arbitrarily: its computational simplicity and early endorsement facilitated widespread adoption. In scenarios with a large number of studies and low heterogeneity, its performance is often comparable to more advanced estimators. The main limitation, as consistently shown in simulation studies, is its poor performance in meta-analyses with few studies and/or substantial heterogeneity, where τ2 is systematically underestimated and confidence intervals become misleadingly narrow. More robust alternatives such as REML or PM are absent in RevMan 5.4, as are HKSJ adjustments that correct the well-documented deficiencies of Wald-type intervals. Prediction intervals—now considered essential for interpreting clinical heterogeneity—are also not provided. Even the graphical outputs are problematic: forest plots often apply a confusing label, “M-H, Random,” which is inherently contradictory. The Mantel-Haenszel (MH) method is a fixed-effect approach by definition, yet the software applies the DL random-effects estimator, creating a significant source of confusion for users.
- In diagnostic test accuracy (DTA) reviews, the limitations are even more severe. RevMan allows manual entry of bivariate HSROC parameters but does not estimate them directly from the data. Sensitivity and specificity are modeled separately rather than within a proper hierarchical bivariate framework, undermining the joint estimation of test accuracy. In practice, the software continues to generate Moses–Littenberg summary ROC curves—a model abandoned more than a decade ago—without providing hierarchical estimates that reflect between-study variability. This approach, by forcing a symmetric SROC and treating the regression slope as a threshold effect, systematically overstates accuracy compared with hierarchical models [18].
Beyond these domain-specific flaws, RevMan lacks the flexibility to fit meta-regression models with modern estimators, to conduct advanced sensitivity analyses, or to generate outputs compatible with transparent reproducibility. More sophisticated approaches, such as Bayesian modeling, network meta-analysis, or hierarchical frameworks for complex data structures, are entirely unavailable.
Perhaps most concerning is the symbolic dissonance: while Cochrane methodologists increasingly recommend moving beyond DL and toward hierarchical, robust, and reproducible frameworks, many Cochrane reviews themselves continue to be published using RevMan 5.4. This gap between official methodological guidance and actual practice not only perpetuates outdated analyses but also legitimizes their use by researchers outside Cochrane, reinforcing a cycle of inertia in evidence synthesis.
In a major and timely update, Cochrane has overhauled the statistical framework in its current platform, RevMan Web (version 7), effectively resolving most of the critical limitations of its predecessor [21].
- Robust Default Estimator: The default estimator for τ2 is now REML, with DL remaining as a user-selectable option.
- HKSJ Confidence Intervals: The HKSJ adjustment is now available for calculating CIs for the summary effect, providing better coverage properties than traditional Wald-type intervals.
- Prediction Intervals: The software now calculates and displays prediction intervals on forest plots, enhancing the interpretation of heterogeneity by showing the expected range of effects in future studies.
This overhaul represents an important course correction. The problem, however, is no longer the availability of modern methods within the Cochrane ecosystem, but the institutional and user inertia that sustains the use of RevMan 5.4. The resulting gap between Cochrane’s methodological standards and the practices of many researchers continues to generate preventable bias. At the same time, RevMan Web—despite these substantial improvements—remains less versatile than script-based platforms such as R or Stata, as it does not support user-defined meta-regression, network meta-analysis, or Bayesian extensions, thereby limiting its value for advanced evidence synthesis. Lastly, regarding DTA models, RevMan 7 does not internally fit hierarchical models (bivariate or HSROC). However, it allows importing externally estimated parameters (e.g., from R or Stata) to generate SROC plots and display confidence and prediction regions. This partial functionality underscores the limited versatility of RevMan 7 compared with script-based platforms.
MetaDiSc: From Obsolete Modelling to a Limited Yet Solid Modern Standard
MetaDiSc 1.4 was a pioneering free tool for DTA meta-analysis [22], which explains its historical persistence. However, its methodology is now considered obsolete. The software pools sensitivity and specificity as separate, uncorrelated metrics and uses the Moses-Littenberg model to generate a summary ROC curve.
In 2022, a web-based successor, MetaDiSc 2.0 [23], was released, representing a complete departure from the flawed methods of its predecessor. The new version correctly implements the current gold standard for DTA synthesis:
- Bivariate Hierarchical Model: MetaDiSc 2.0 uses a hierarchical random-effects model as its core engine, modelling sensitivity and specificity as a correlated pair, correctly acknowledging that a test’s performance characteristics are not independent and vary across different study populations and settings.
- Confidence and Prediction Regions: The software generates both a 95% confidence region for the summary point (quantifying uncertainty in the mean estimate) and a 95% prediction region (illustrating the expected range of true accuracy in a future study).
This update makes MetaDiSc 2.0 a methodologically sound tool for standard DTA meta-analyses. While it may lack the advanced meta-regression capabilities and flexibility of script-based platforms like R (mada) or Stata (metadta), its adoption of the correct hierarchical model marks a crucial step forward, rendering the continued use of version 1.4 indefensible.
Although version 2 is available, the reality is that most researchers still use MetaDiSc 1.4, largely because it is the version historically cited in methodological literature and more easily accessible online. This persistence is problematic because MetaDiSc 1.4 is built on outdated models that no longer align with current methodological standards. It analyzes sensitivity and specificity separately, ignoring their correlation, and relies on the obsolete Moses–Littenberg approach for summary ROC curves. Consequently, the software cannot produce true hierarchical bivariate or HSROC summaries, nor does it provide confidence regions or prediction intervals that appropriately capture between-study variability.
Comprehensive Meta-Analysis 3 & 4: The Enduring Black Box
Comprehensive Meta-Analysis (CMA) is a widely used commercial program known for its user-friendly graphical interface. While popular, it exemplifies the tension between ease of use and the scientific principles of transparency and reproducibility. Version 3 became the most widely used release [24,25], supported by extensive manuals, tutorials, and applied literature. Its relatively affordable license, intuitive interface, and broad marketing made it appealing to clinical researchers with limited statistical training, filling an important niche when open-source solutions were still immature. However, the program is fundamentally a closed, proprietary “black-box”: algorithms are undisclosed, no source code or variance formulas are available, and it remains unclear how certain models are internally defined. Methodologically, CMA3 remains anchored in outdated defaults: it appears to rely on DL estimators for random effects (as some meta-epidemiological studies have shown) [26], lacks REML or PM options, does not implement HKSJ adjustments, omits prediction intervals, and provides only limited and suboptimal facilities for meta-regression. Importantly, this attribution is based on findings from independent methodological reviews rather than official CMA documentation, since the program does not disclose its internal algorithms. Although CMA version 4 was released in 2023 [27], the official website and manuals still predominantly reference version 3, creating uncertainty about what has truly been updated. Publicly available documentation provides little detail beyond interface refinements and report generation features, leaving it unclear whether core methodological limitations have been addressed. This lack of transparency perpetuates the same concerns: without open access to its algorithms or a clear account of new functionalities, CMA remains poorly aligned with modern standards of reproducibility and methodological rigor. Notably, the promotional materials for CMA version 4 remain silent on any fundamental methodological updates, further reinforcing concerns that its underlying statistical engine may remain obsolete.
A comparative overview of the main software platforms, their accessibility, requirements, and current limitations is provided in Table 1. Figure 1 presents a chronological overview of software developments for meta-analysis, tracing the shift from early, limited programs to more recent platforms. The timeline highlights how successive releases have progressively expanded methodological options and transparency.
Current Methodological Standards for Meta-Analytic Modelling (Intervention Reviews)
Modeling (Estimator)
Random-effects models should be fitted using robust estimators of between-study variance, most commonly REML or PM [1]. These approaches provide more stable and less biased estimates of τ2 than traditional methods of moments based on inverse-variance weighting, such as DL. Between the two, REML is generally preferred because PM, while robust in many scenarios, may produce positively biased estimates of τ2 when study sample sizes vary greatly [6,7]. This nuance reinforces REML as the default recommendation in most applications, with PM serving as a reasonable alternative under more homogeneous conditions
Confidence Intervals
For confidence intervals, two complementary approaches are recommended. WT intervals are widely used but tend to be anti-conservative, often producing confidence limits that are too narrow. In contrast, the HKSJ adjustment accounts for the uncertainty of τ2 and generally provides better coverage, but may be overly conservative (i.e., produce excessively wide confidence intervals) when the number of studies is very small (e.g., k < 5) and heterogeneity is low. The modified Hartung–Knapp adjustment (mHK) was specifically designed to address one of the main criticisms of the original HKSJ: that when τ2 is close to zero, the confidence interval can become excessively wide and overly conservative. Also, methodological studies have shown that HKSJ may result in false positive findings when the heterogeneity is absent [28]. By stabilizing the interval in such cases, mHK ensures more balanced coverage while preserving the methodological advantages of HKSJ.
For meta-analyses with more than two studies and τ2 > 0, HKSJ-adjusted intervals are generally preferred [1]. However, when only a few studies are available, it can be informative to present both REML WT and REML HKSJ-adjusted intervals, thereby offering complementary perspectives on precision [1]. In all cases, prediction intervals should also be reported to quantify the expected range of effects in new or future studies, enhancing clinical interpretability.
Heterogeneity
Assessment of heterogeneity should extend beyond I2, which is sensitive to the number of studies and does not quantify absolute variability. Reporting τ2 alongside its confidence interval, examining forest plots, and presenting prediction intervals are essential for contextualizing results [1]. Sensitivity analyses exploring the influence of individual studies or methodological features should also be incorporated, and where possible, sources of heterogeneity should be explored through meta-regression using robust estimators [1].
Current Methodological Standards for Meta-Analytic Modelling (Diagnostic Test Accuracy Reviews)
Modeling (Estimator)
Diagnostic test accuracy meta-analyses should be based on hierarchical models that jointly model sensitivity and specificity rather than analyzing them separately [29,30,31,32]. The bivariate random-effects model and the HSROC model are the recommended frameworks [2]. Both approaches account for within- and between-study variability and incorporate the correlation between sensitivity and specificity, a feature essential for realistic summaries. These models also allow explicit parameterization of threshold effects, making it possible to account for differences in test positivity criteria across studies—an issue that cannot be addressed by obsolete methods such as Moses–Littenberg [2,15].
Intervals
In DTA synthesis, uncertainty should be expressed not only through point estimates but also via confidence regions around the summary point and prediction regions that reflect expected variability across future or external populations. Reporting both enhances interpretability: confidence regions quantify the precision of the pooled estimate, while prediction regions indicate how test performance is likely to vary in practice. Together, these outputs provide a fuller and more clinically meaningful representation of diagnostic accuracy [2].
Heterogeneity
Exploring heterogeneity is critical in DTA synthesis, as variability often arises from differences in patient spectrum, thresholds, study design, and test interpretation. Hierarchical models address this by allowing random effects at both the sensitivity and specificity levels, and by explicitly incorporating threshold effects [2]. Despite this, it remains common for authors to report univariate heterogeneity metrics such as I2 or Cochran’s Q separately for sensitivity and specificity. This practice is inadequate, as it ignores the inherent correlation between the two measures and can produce misleading or inflated impressions of variability. The appropriate metrics are the estimated between-study variances of sensitivity and specificity, together with the covariance or threshold effect (e.g., the Zhou bivariate measure) [33]. Beyond model-based variance components, heterogeneity should also be examined through subgroup analyses, covariate-adjusted meta-regression, and visual inspection of summary ROC plots. Whenever possible, prediction regions should be presented to illustrate the extent to which diagnostic performance is expected to vary in real-world settings.
Figure 2 depicts the key milestones in the development of statistical methods for meta-analysis, from the earliest estimators of heterogeneity to the introduction of more robust hierarchical models. This timeline illustrates how methodological innovations progressively addressed previous limitations and consolidated more rigorous standards for quantitative synthesis.
Consequences for Evidence Synthesis
The widespread reliance on outdated meta-analysis software is not a benign artifact of history, but a methodological liability with direct consequences for the biomedical literature. When programs default to suboptimal estimators such as DL, fail to implement robust confidence intervals, and omit prediction intervals, they systematically underestimate uncertainty.
These distortions are not merely statistical. Inflated certainty translates into misleading conclusions, which may subsequently shape clinical guidelines, inform regulatory decisions, and influence patient care. In diagnostic accuracy reviews, reliance on obsolete models such as Moses–Littenberg leads to summary curves that ignore between-study variability and correlation between sensitivity and specificity, ultimately overstating the performance of diagnostic tests. The credibility of the evidence base is thus compromised at its foundation. Even robust random-effects models estimate a statistical average across heterogeneous studies, which may not reflect effects in real-world populations. As emphasized in the causal inference literature [34], pooling across disparate populations risks limited transportability. Thus, pooled estimates—even with REML or HKSJ—should be interpreted cautiously in terms of their applicability.
Equally concerning is the impact on reproducibility and transparency. Closed or rigid software environments foster a culture where meta-analyses are treated as mechanical outputs rather than modeling exercises requiring critical judgment. Without access to underlying code, results cannot be independently audited, replicated, or extended. This disconnect undermines confidence in published reviews and perpetuates the illusion that adherence to legacy tools is equivalent to methodological rigor, when in fact it represents the opposite.
Specific methodological pitfalls attributable to legacy software, and the recommended alternatives, are outlined in Table 2.
The Danger of Defaults: Undeclared Corrections and Automatic Exclusions
An important concern lies in the hidden default operations implemented by legacy software without disclosure to the user. Continuity corrections, automatic exclusions, and simplified variance structures are frequently applied with no indication in the output. In RevMan 5.4, for example, the default workflow applies a fixed zero-cell adjustment—essentially a modified Haldane–Anscombe (mHA) correction of 0.5—and excludes studies with zero events in both arms when ratio measures are used [35]. This correction is not merely a technical choice; it is a questionable practice that, at the very least, requires explicit declaration, as it can introduce bias in rare-event settings. Its persistence for years in an ‘official’ Cochrane-endorsed program illustrates how a flawed practice can become institutionalized and silently propagated across countless published reviews. The continuity correction therefore serves as a paradigmatic case study of the article’s central thesis: that hidden defaults in trusted “black-box” software can entrench bias in the evidence base through institutional inertia and uncritical reliance.
These silent operations materially influence effect estimates in sparse-data contexts and may mislead readers who remain unaware of the modifications. Alternative approaches allow retention of zero–zero studies—for example, the Carter correction, which adds one event and two participants per arm—thus preserving estimability without automatic exclusion [36]. Although rare-event meta-analysis remains inherently challenging, transparency is the essential safeguard. Undeclared defaults—whether continuity corrections, exclusions, or simplified variance structures—compromise reproducibility and erode confidence in published results. Ultimately, the problem is not the specific correction applied, but the hidden and undeclared manner in which it is imposed.
Call to Action
The continued use of outdated meta-analysis software is no longer defensible. RevMan 5.4, MetaDiSc 1.4, and CMA played a historical role in the dissemination of quantitative synthesis, but their limitations are now well documented and directly compromise the validity and reproducibility of results. Authors should transition to modern frameworks—whether RevMan 7 [21,37], MetaDiSc 2, or preferably open and script-based platforms such as R and Stata—that implement robust estimators, hierarchical models, and transparent outputs.
For journal editors: Authors should be required to specify, in the Methods section, which estimator of τ2 was used (e.g., DL, REML, PM) and to justify their choice, particularly when non-robust methods are applied. This explicit reporting standard would close a major gap in transparency and prevent the silent perpetuation of obsolete defaults.
For peer reviewers: Any meta-analysis that relies on the DerSimonian–Laird estimator—especially with a small number of studies—should be systematically questioned. Reviewers should request sensitivity analyses using robust alternatives such as REML or PM, and ensure that prediction intervals and HKSJ adjustments are considered where appropriate.
For training programs and institutions: Curricula must be updated to reflect contemporary methodological standards. Training in meta-analysis should prioritize modern, script-based platforms (R, Stata) that enable reproducibility and transparency, while actively discouraging reliance on legacy or closed software environments for new research.
Evidence synthesis underpins guidelines, policy, and patient care: tolerating preventable biases introduced by outdated software undermines the very foundation of evidence-based medicine. A cultural shift is urgently required, moving from convenience-driven analysis to rigorous, reproducible, and methodologically sound meta-analysis.
Ultimately, reform must address both levels: replacing fragile defaults with robust models, and acknowledging that the very target of meta-analysis must evolve from an abstract pooled effect to contextually valid estimates for defined populations
Conclusions
Meta-analysis is a sophisticated modelling exercise that demands expertise, transparency, and judgment. Yet much of the literature still relies on legacy software with fragile defaults and obsolete estimators. This is not a benign artifact but an active threat to evidence integrity, embedding bias and eroding reproducibility in findings that shape guidelines and policy. Transition to robust estimators, hierarchical models, and transparent reporting is essential, with shared responsibility across analysts, journals, reviewers, and guideline developers. Updating software is not technical housekeeping but a prerequisite for trustworthy evidence-based medicine.

Table 3.
Practical recommendations for moving beyond legacy software.
| Do not use RevMan 5.4, MetaDiSc 1.4, or CMA for performing meta-analyses. |
| For intervention reviews: adopt REML or PM estimators with HKSJ-adjusted CIs when indicated. Consider mHK as refinement of HKSJ when τ² is close to zero. |
| For DTA reviews: use hierarchical bivariate (Reitsma) or HSROC (Rutter & Gatsonis) models. Never model Se & Sp separately. |
| Always report PIs in random-effects models. |
| Favor transparent and reproducible solutions (R: metafor, meta, mada; Stata: meta, metadta, midas). |
| Report heterogeneity using the appropriate metrics (intervention: Q, I², τ²; DTA: τ²Se, τ²Sp, ρ), avoid univariate I² in DTA. |
| Explore heterogeneity properly through meta-regression and subgroup analyses. |
| When using methods that require continuity corrections for zero-cell studies (e.g., inverse-variance with ratio measures), always declare which correction was applied (e.g., mHA, Carter). Prefer statistical models that directly handle zero cells, such as those based on the binomial likelihood (e.g., bivariate/HSROC models in DTA) |
CMA: Comprehensive Meta-Analysis; CI: Confidence Interval; HSROC: Hierarchical Summary Receiver Operating Characteristic; HKSJ: Hartung–Knapp–Sidik–Jonkman; mHK: modified Hartung–Knapp adjustment; mHA: modified Haldane–Anscombe (0.5 continuity correction); DTA: Diagnostic Test Accuracy; PI: Prediction Interval; PM: Paule–Mandel; REML: Restricted Maximum Likelihood; Se: Sensitivity; Sp: Specificity.
Author Contributions
Javier Arredondo Montero (JAM): Conceptualization; Methodology; Validation; Investigation; Writing – Original Draft; Writing – Review & Editing; Visualization; Supervision; Project administration.
Institutional Review Board Statement
This study did not involve human subjects or animals. As only simulated data were used, no ethical approval or informed consent was required.
Data Availability Statement
No new datasets were generated or analyzed for the purposes of this work.
Original Work
The manuscript’s author declares that it is an original contribution, not previously published.
AI Use Disclosure
Artificial intelligence (ChatGPT-4, OpenAI) was used to improve the clarity and style of the language.
Conflicts Of Interest
There is no conflict of interest or external funding to declare. The author does not have anything to disclose.
References
- Higgins JPT, Thomas J, Chandler J, Cumpston M, Li T, Page MJ, Welch VA (editors). Cochrane Handbook for Systematic Reviews of Interventions version 6.5 (updated 24). Cochrane, 2024. Available from www.cochrane.org/handbook. 20 August.
- Deeks JJ, Bossuyt PM, Leeflang MM, Takwoingi Y (editors). Cochrane Handbook for Systematic Reviews of Diagnostic Test Accuracy. Version 2.0 (updated 23). Cochrane, 2023. Available from https://training.cochrane.org/handbook-diagnostic-test-accuracy/current. 20 July.
- DerSimonian R, Laird N. Meta-analysis in clinical trials. Control Clin Trials 1986, 7, 177–188. [Google Scholar] [CrossRef] [PubMed]
- Viechtbauer, W. Bias and Efficiency of Meta-Analytic Variance Estimators in the Random-Effects Model. Journal of Educational and Behavioral Statistics 2005, 30, 261–293. [Google Scholar] [CrossRef]
- Veroniki AA, Jackson D, Viechtbauer W, Bender R, Bowden J, Knapp G, et al. Methods to estimate the between-study variance and its uncertainty in meta-analysis. Res Synth Methods 2016, 7, 55–79. [Google Scholar] [CrossRef] [PubMed]
- Paule RC, Mandel J. Consensus values and weighting factors. J Res Nat Bur Stand. 1982, 87, 377–385. [Google Scholar] [CrossRef] [PubMed]
- van Aert RCM, Jackson D. Multistep estimators of the between-study variance: The relationship with the Paule-Mandel estimator. Stat Med. 2018, 37, 2616–2629. [Google Scholar] [CrossRef] [PubMed] [PubMed Central]
- Hartung, J. An alternative method for meta-analysis. Biom J. 1999, 41, 901–916. [Google Scholar] [CrossRef]
- Hartung J, Knapp G. On tests of the overall treatment effect in meta-analysis with normally distributed responses. Stat Med. 2001, 20, 1771–1782. [Google Scholar] [CrossRef]
- Hartung J, Knapp G. A refined method for the meta-analysis of controlled clinical trials with binary outcome. Stat Med. 2001, 20, 3875–3889. [Google Scholar] [CrossRef]
- Sidik K, Jonkman JN. A simple confidence interval for meta-analysis. Stat Med. 2002, 21, 3153–3159. [Google Scholar] [CrossRef]
- IntHout, J. , Ioannidis, J.P. & Borm, G.F. The Hartung-Knapp-Sidik-Jonkman method for random effects meta-analysis is straightforward and considerably outperforms the standard DerSimonian-Laird method. BMC Med Res Methodol 2014, 14, 25. [Google Scholar] [CrossRef]
- Röver, C. , Knapp, G. & Friede, T. Hartung-Knapp-Sidik-Jonkman approach and its modification for random-effects meta-analysis with few studies. BMC Med Res Methodol 2015, 15, 99. [Google Scholar] [CrossRef]
- Langan D, Higgins JPT, Jackson D, Bowden J, Veroniki AA, Kontopantelis E, Viechtbauer W, Simmonds M. A comparison of heterogeneity variance estimators in simulated random-effects meta-analyses. Res Synth Methods 2019, 10, 83–98. [Google Scholar] [CrossRef] [PubMed]
- Moses LE, Shapiro D, Littenberg B. Combining independent studies of a diagnostic test into a summary ROC curve: data-analytic approaches and some additional considerations. Stat Med 1993, 12, 1293–1316. [Google Scholar] [CrossRef] [PubMed]
- Reitsma JB, Glas AS, Rutjes AWS, Scholten RJPM, Bossuyt PM, Zwinderman AH. Bivariate analysis of sensitivity and specificity produces informative summary measures in diagnostic reviews. J Clin Epidemiol 2005, 58, 982. [Google Scholar] [CrossRef]
- Rutter CM, Gatsonis CA. A hierarchical regression approach to meta-analysis of diagnostic test accuracy evaluations. Stat Med. 2001, 20, 2865–2884. [Google Scholar] [CrossRef] [PubMed]
- The Moses-Littenberg meta-analytical method generates systematic differences in test accuracy compared to hierarchical meta-analytical models. J Clin Epidemiol. 2016, 80, 77–87. [CrossRef] [PubMed] [PubMed Central]
- Wang J, Leeflang M. Recommended software/packages for meta-analysis of diagnostic accuracy. J Lab Precis Med 2019, 4, 22. [Google Scholar] [CrossRef]
- Review Manager 5 (RevMan 5) [Computer program]. Version 5.4. Copenhagen: The Cochrane Collaboration, 2020.
- Review Manager (RevMan) [Computer program]. Version 7.2.0. The Cochrane Collaboration, 2024. Available at revman.cochrane.org.
- Zamora J, Abraira V, Muriel A, Khan K, Coomarasamy A. Meta-DiSc: a software for meta-analysis of test accuracy data. BMC Med Res Methodol. 2006, 6, 31. [Google Scholar] [CrossRef] [PubMed] [PubMed Central]
- Plana, M.N. , Arevalo-Rodriguez, I., Fernández-García, S. et al. Meta-DiSc 2.0: a web application for meta-analysis of diagnostic test accuracy data. BMC Med Res Methodol 2022, 22, 306. [Google Scholar] [CrossRef]
- Brüggemann, P. , Rajguru, K. Comprehensive Meta-Analysis (CMA) 3.0: a software review. J Market Anal 2022, 10, 425–429. [Google Scholar] [CrossRef]
- Borenstein, M. Chapter 27. Comprehensive meta-analysis software. In Systematic Reviews in Health Research: Meta-analysis in Context; Egger, M., Higgins, J.P.T., Davey Smith, G., Eds.; Wiley: Hoboken, NJ, USA, 2022; pp. 535–548. [Google Scholar]
- Mheissen S, Khan H, Normando D, Vaiid N, Flores-Mir C. Do statistical heterogeneity methods impact the results of meta- analyses? A meta epidemiological study. PLoS ONE 2024, 19, e0298526. [Google Scholar] [CrossRef]
- Comprehensive Meta-Analysis Version 4. Borenstein M, Hedges L, Higgins J, Rothstein H. Biostat, Inc.
- Mheissen S, Khan H, Normando D, Vaiid N, Flores-Mir C. Do statistical heterogeneity methods impact the results of meta- analyses? A meta epidemiological study. PLoS One 2024, 19, e0298526. [Google Scholar] [CrossRef] [PubMed] [PubMed Central]
- Nyaga, V.N. , Arbyn, M. Metadta: a Stata command for meta-analysis and meta-regression of diagnostic test accuracy data – a tutorial. Arch Public Health 2022, 80, 95. [Google Scholar] [CrossRef] [PubMed]
- Roger, M. Harbord & Penny Whiting. metandi: Meta-analysis of diagnostic accuracy using hierarchical logistic regression. Stata J. StataCorp LP 2009, 9, 211–229. [Google Scholar]
- Dwamena, BA. MIDAS: Stata module for meta-analytical integration of diagnostic test accuracy studies. Statistical Software Components S456880, Boston College Department of Economics, revised 13 Dec 2009.
- Doebler P, Holling H. Meta-analysis of diagnostic accuracy with mada. Available online: https://cran.r-project.org/web/packages/mada/vignettes/mada.
- Zhou Y, Dendukuri N. Statistics for quantifying heterogeneity in univariate and bivariate meta-analyses of binary data: the case of meta-analyses of diagnostic accuracy. Stat Med. 2014, 33, 2701–2717. [Google Scholar] [CrossRef] [PubMed]
- Hernán MA, Robins JM. Causal Inference: What If. Boca Raton: Chapman & Hall/CRC; 2020.
- Weber F, Knapp G, Ickstadt K, Kundt G, Glass Ä. Zero-cell corrections in random-effects meta-analyses. Res Synth Methods 2020, 11, 913–919. [Google Scholar] [CrossRef] [PubMed]
- Wei, JJ. , Lin, EX., Shi, JD. et al. Meta-analysis with zero-event studies: a comparative study with application to COVID-19 data. Military Med Res 2021, 8, 41. [Google Scholar] [CrossRef]
- Veroniki AA, McKenzie JE. Introduction to new random-effects methods in RevMan. Cochrane Methods Group; 2024. Available at: https://training.cochrane.
Figure 1.
Chronological overview of key software advances for conducting meta-analyses, illustrating the transition from early limited programs to modern platforms with expanded functionality and transparency.
Figure 1.
Chronological overview of key software advances for conducting meta-analyses, illustrating the transition from early limited programs to modern platforms with expanded functionality and transparency.
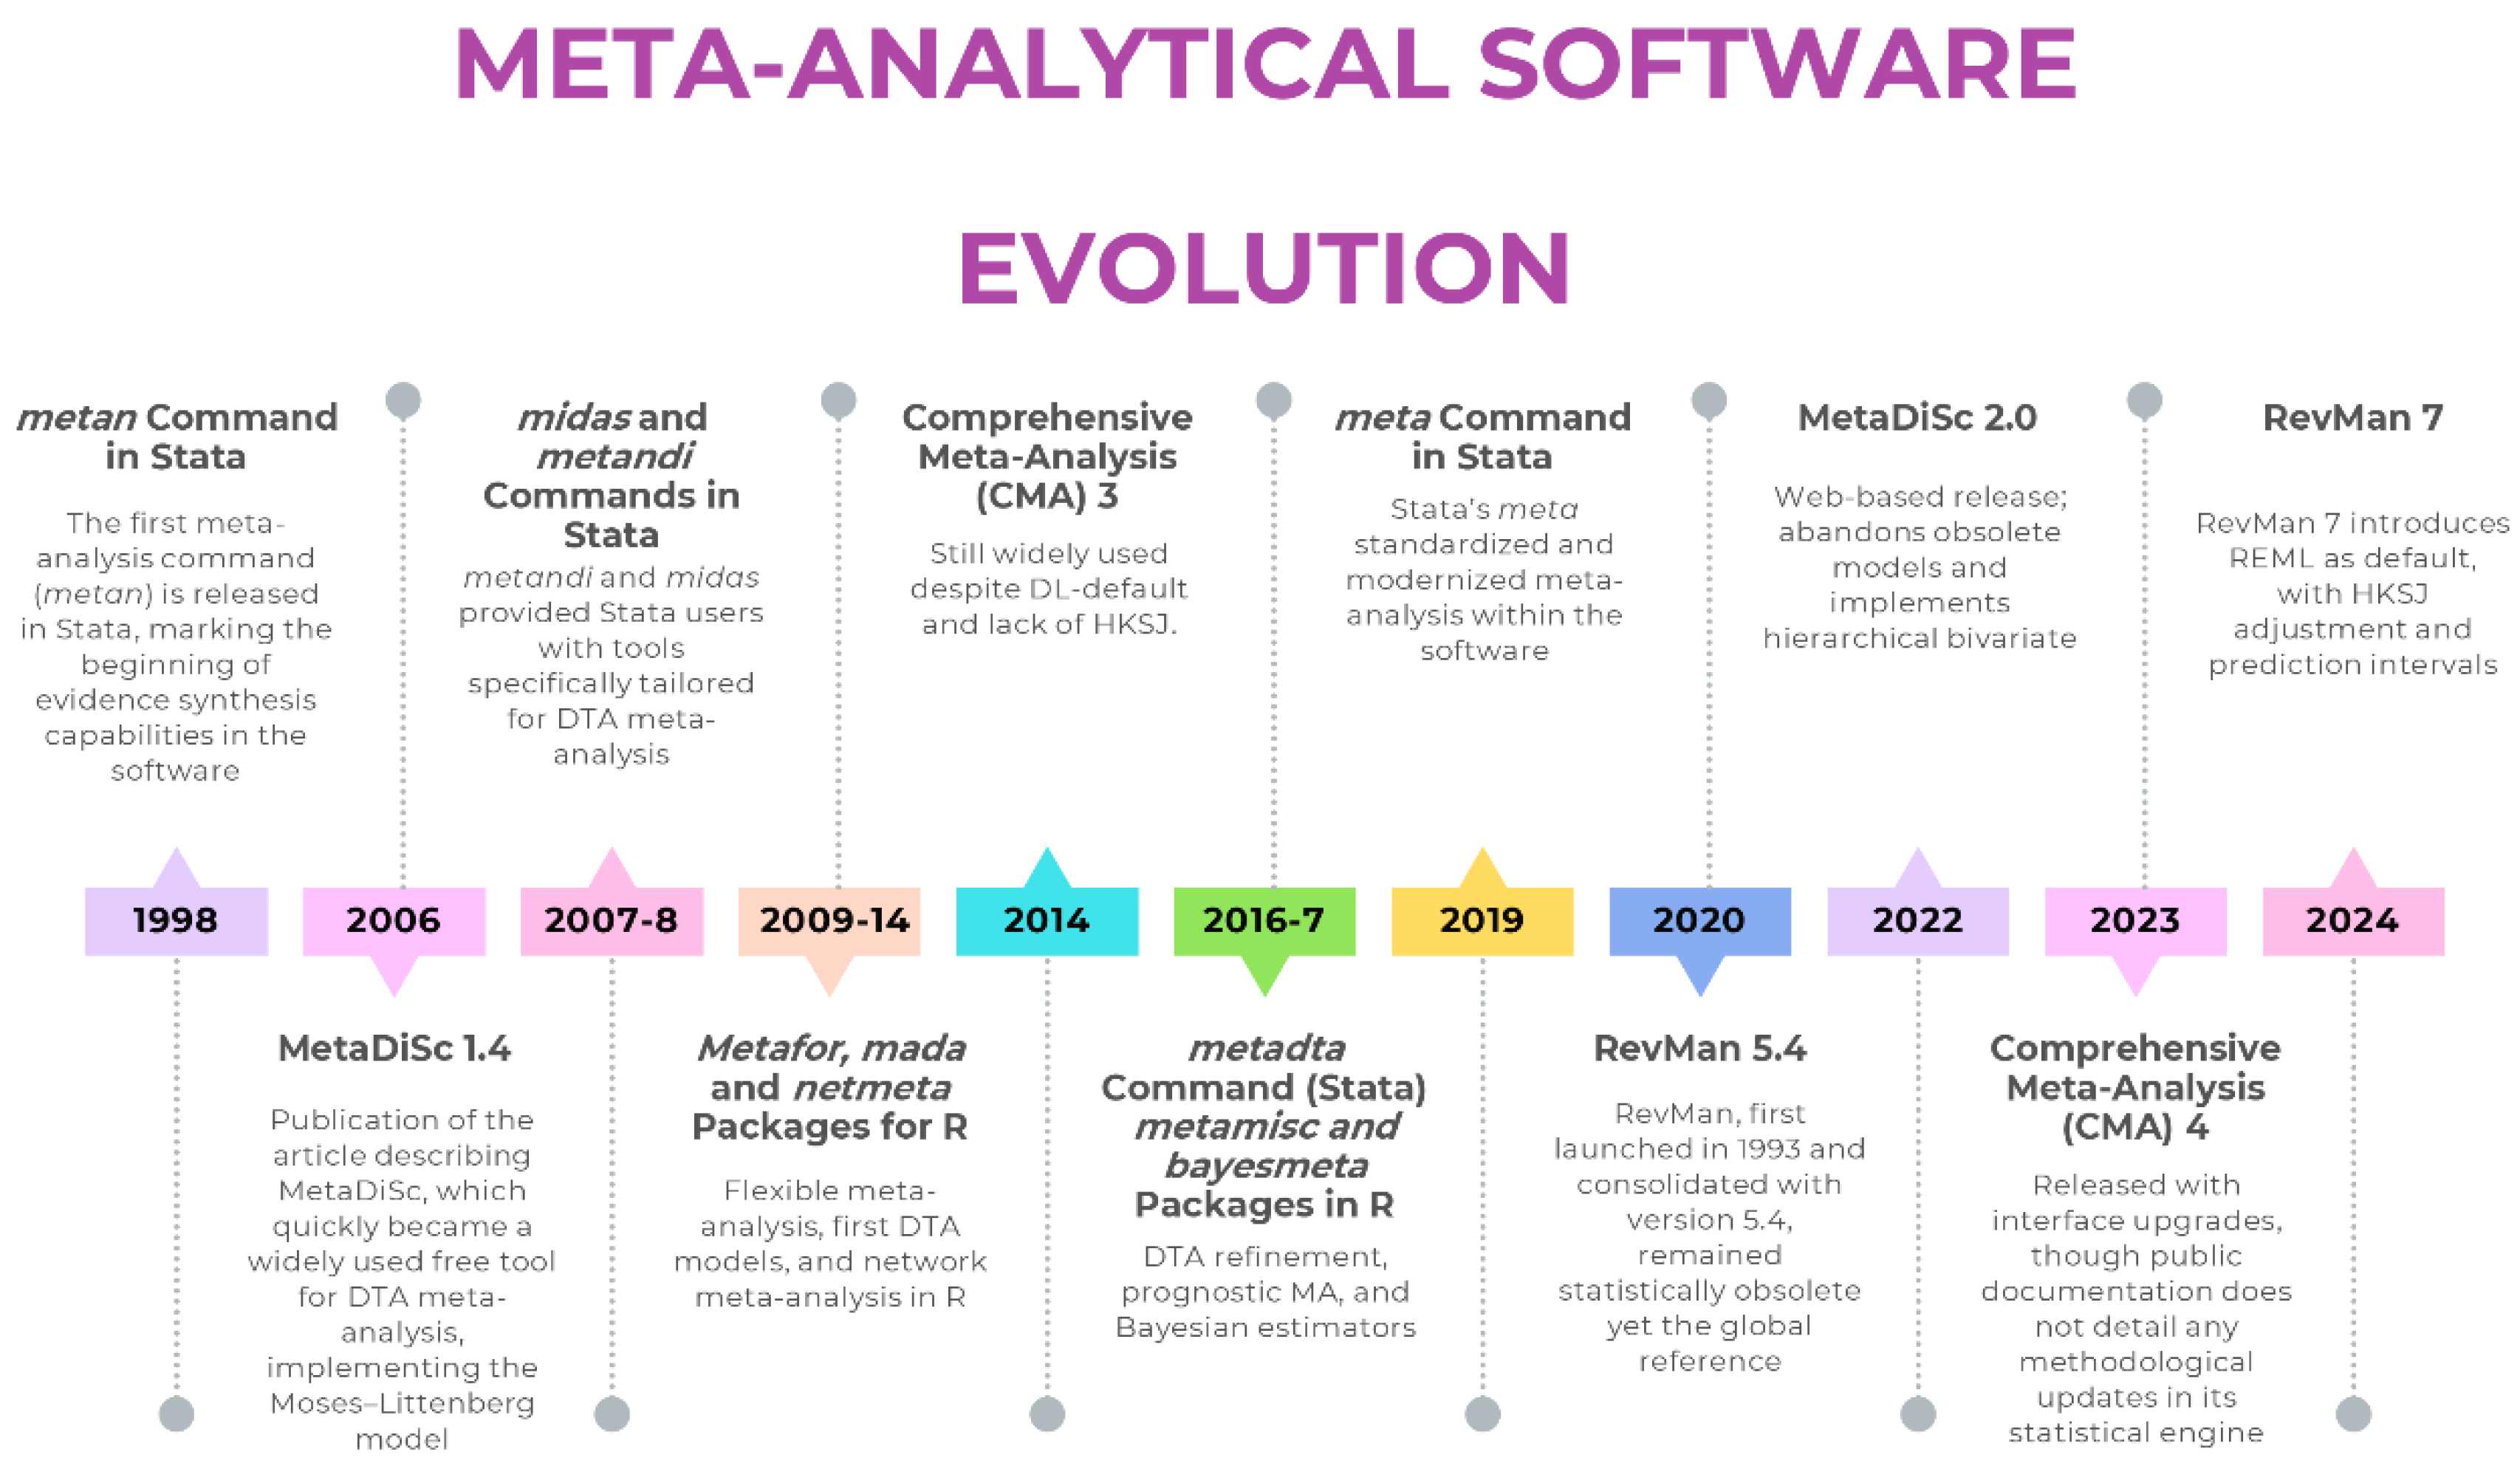
Figure 2.
Timeline of major methodological milestones in the statistical development of meta-analysis, from early estimators of heterogeneity to advanced hierarchical models.
Figure 2.
Timeline of major methodological milestones in the statistical development of meta-analysis, from early estimators of heterogeneity to advanced hierarchical models.
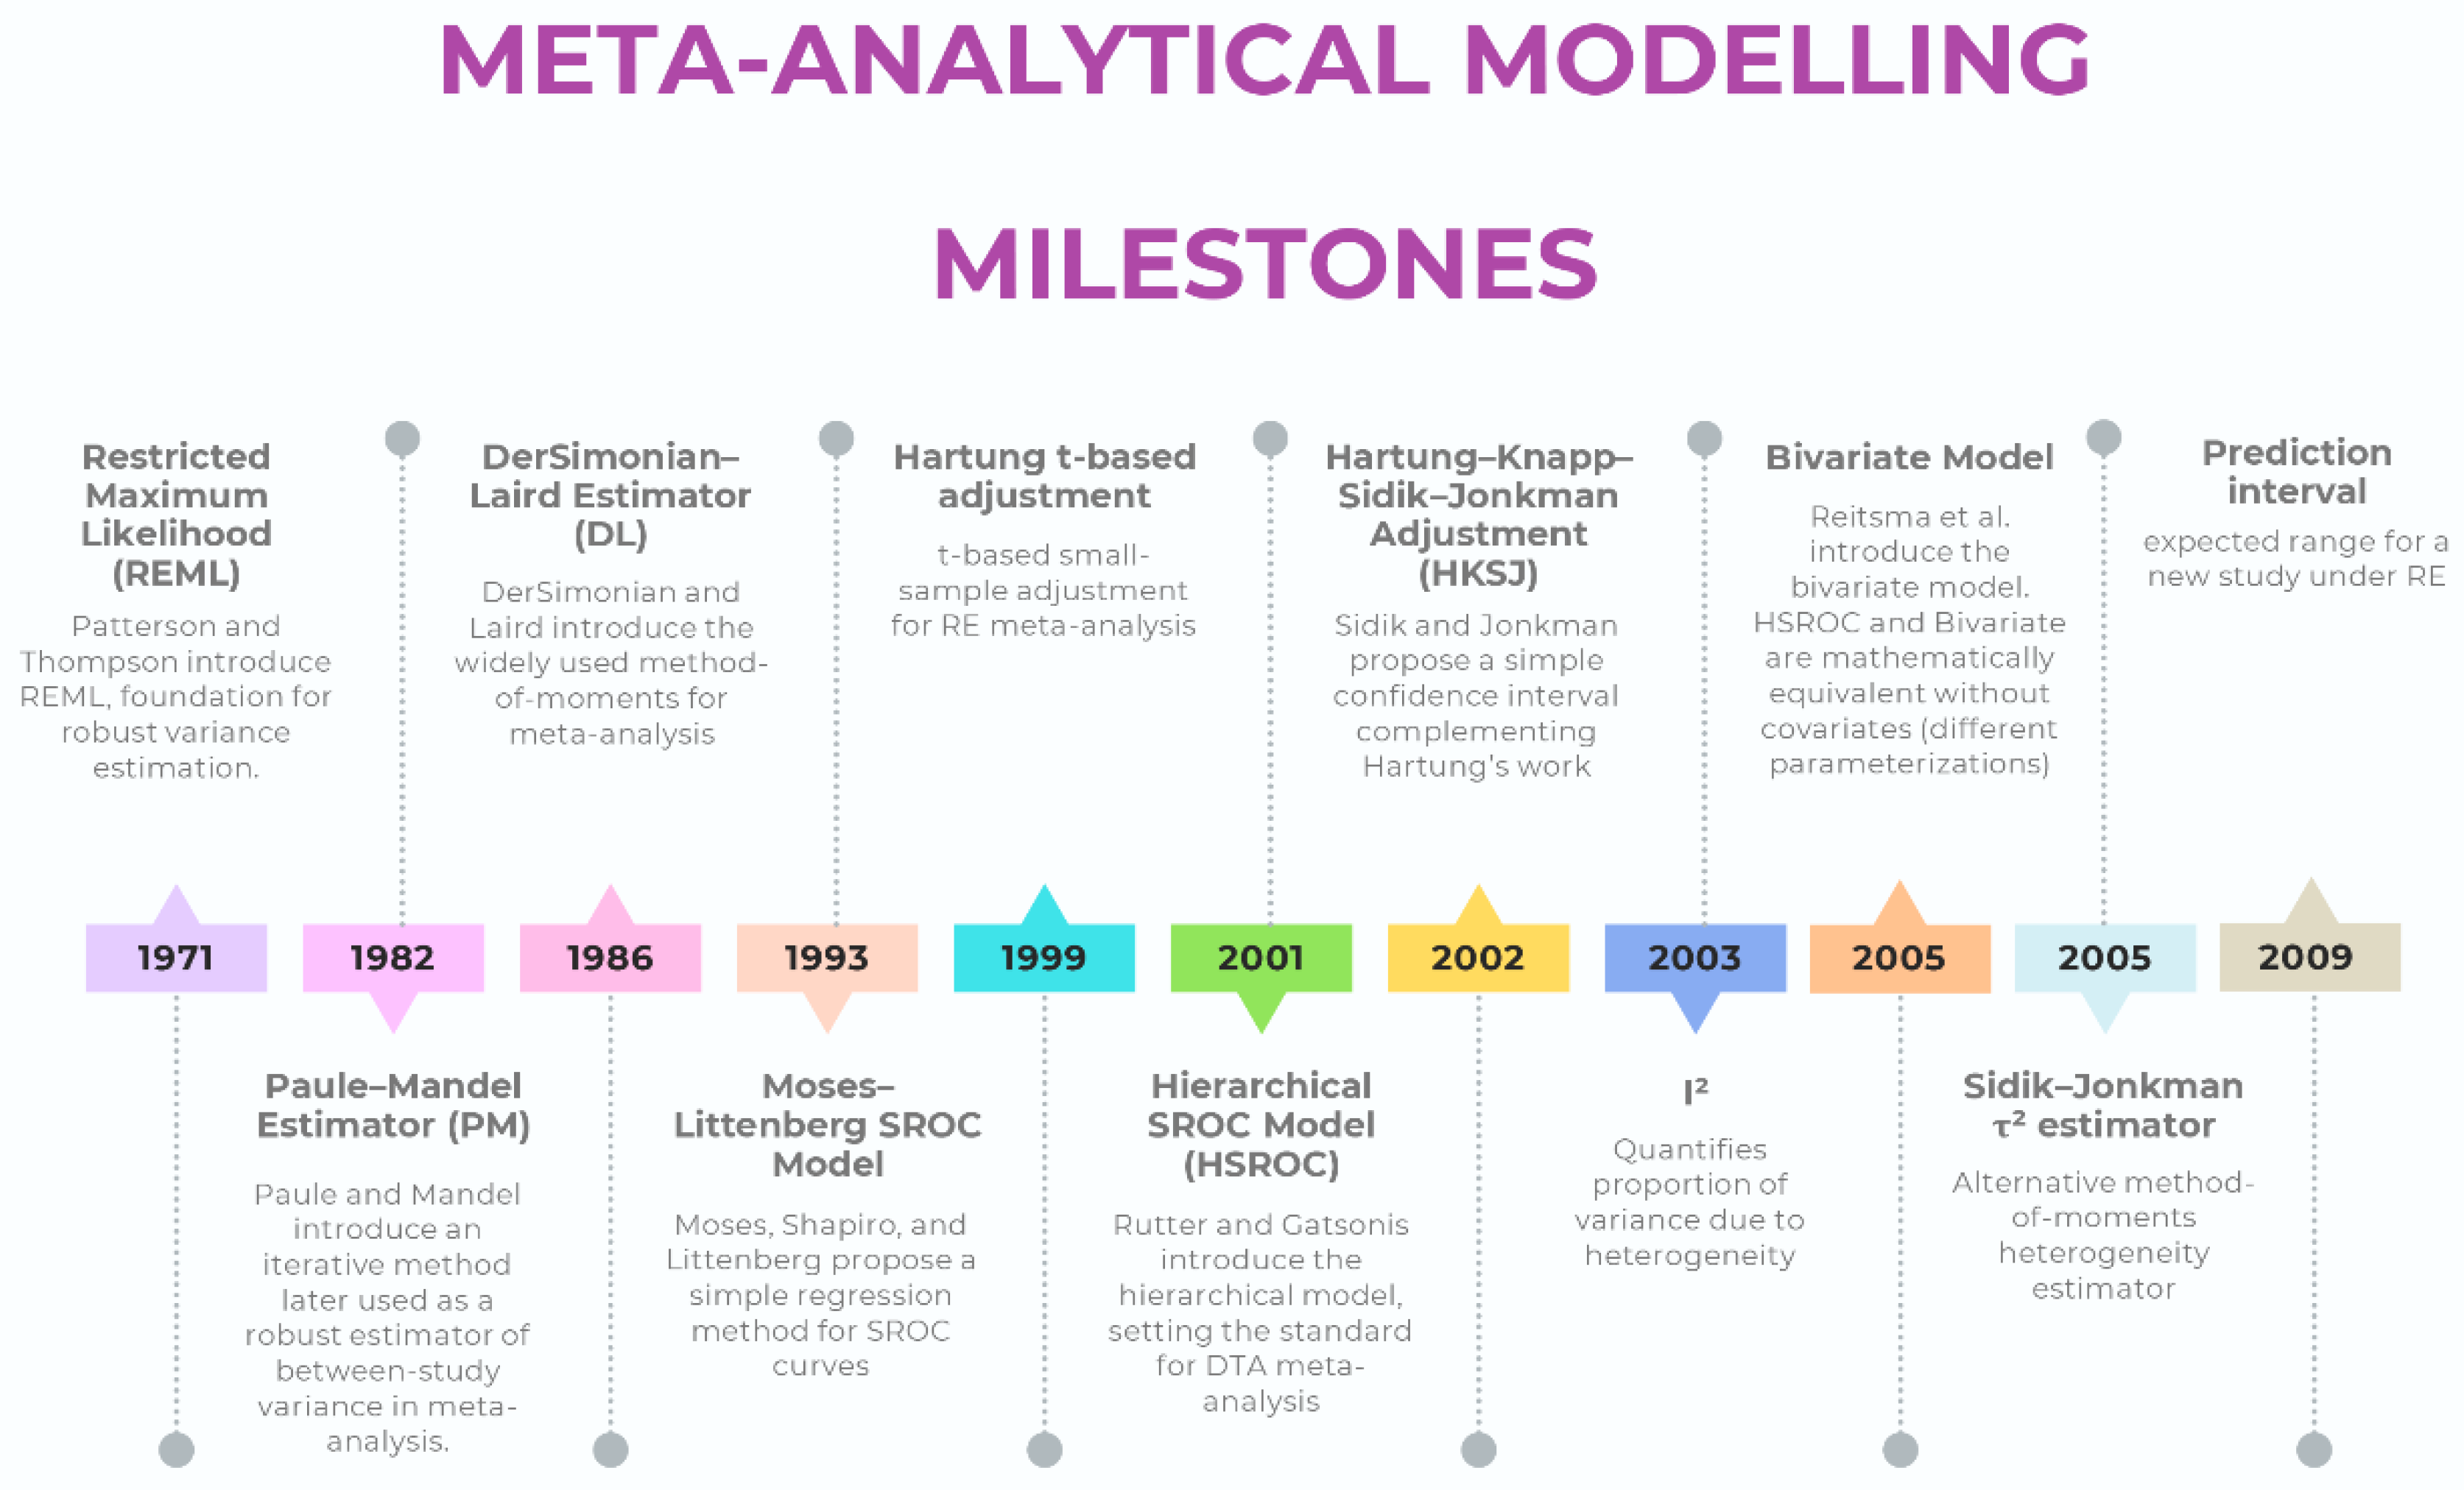
Table 1.
Characteristics, strengths, and limitations of major meta-analysis software.
| Software | Domain focus | Main strengths (historical) | Major limitations | Status / maintenance | Adequacy |
|---|---|---|---|---|---|
| RevMan 5.4 | Interventions, DTA | Free, official Cochrane tool, intuitive interface | DL only, WT CIs, no PIs, obsolete DTA models, no advanced regression or Bayesian/network options | Obsolete, replaced by RevMan 7 | 🔴 |
| RevMan 7 (Web) | Interventions, DTA | Successor to RevMan 5.4, updated interface, integration with Cochrane systems | No full hierarchical DTA implementation#break# Still limited compared to R/Stata in advanced modeling (e.g. lack of user-adjustable meta-regression or network meta-analysis) |
Actively maintained, solves many problems of 5.4 | 🟡 |
| MetaDiSc 1.4 | DTA | First free tool for diagnostic meta-analysis, simple interface | Separate Se/Sp, Moses–Littenberg only, no hierarchical modeling, no CIs/PIs | Still widely used despite release of v2 | 🔴 |
| MetaDiSc 2 | DTA | Modernized interface, implementation of hierarchical models | Lacks the advanced flexibility of script-based platforms (e.g., handling multiple covariates, non-linear models, or advanced influence diagnostics). Limited reproducibility compared to code-based solutions. | Released but limited adoption; partially solves 1.4 problems | 🟡 |
| CMA 3 | Interventions | Affordable, easy GUI, widely adopted in early 2000s | Closed code, black-box outputs, default DL, no HKSJ, limited estimators, no transparency or reproducibility | Commercial; not updated to current methods | 🔴 |
| CMA 4 | Interventions | Affordable, easy GUI, implementation of PIs | Core model settings (e.g. estimator, CI method) remain undisclosed and presumably unchanged; problems of transparency and reproducibility persist | Commercial; not clarified if updated to current methods | 🔴 |
| R (metafor, meta, mada) | Interventions, DTA, advanced | Full implementation of robust estimators, transparency, reproducibility, continuous updates | Requires statistical literacy and coding skills | Actively maintained, methodological gold standard | 🟢 |
| Stata (meta, metadta, midas, metandi) | Interventions, DTA | Robust, validated commands, widely used in applied research | Commercial license required, statistical literacy needed | Actively maintained, highly reliable | 🟢 |
Legend: 🟢 Robust and up to date (implements current recommended models and estimators); 🟡 Restricted capabilities despite modern modelling (offers partial or limited implementation of current methods); 🔴 Outdated/problematic (relies on obsolete estimators or defaults). DTA: Diagnostic Test Accuracy; GUI: Graphical User Interface; CMA: Comprehensive Meta-Analysis; HKSJ: Hartung–Knapp–Sidik–Jonkman; CI: Confidence Intervals; PI: Prediction Intervals; WT: Wald-Type; DL: DerSimonian–Laird; Se: Sensitivity; Sp: Specificity.
Table 2.
Main modeling problems attributable to outdated or inadequate meta-analysis software, their methodological implications, and recommended solutions.
Table 2.
Main modeling problems attributable to outdated or inadequate meta-analysis software, their methodological implications, and recommended solutions.
| Suboptimal modeling practice | Software | Why it is problematic | Solution / Recommended alternative |
|---|---|---|---|
| Random-effects with DL | RevMan 5.4, CMA | Underestimates between-study variance (τ²), produces overly narrow CIs | Use REML or PM estimators |
| WT CIs with k > 2 and τ² > 0 | RevMan 5.4, CMA | Coverage too low, especially with few studies or high heterogeneity | Apply HKSJ adjustment or present both CIs (WT and HKSJ). |
| No PI | RevMan 5.4, CMA | Fails to quantify expected range of effects in new settings | Implement prediction intervals in R or Stata |
| Separate modeling of Se & Sp | MetaDiSc 1.4 | Ignores correlation between Se & Sp → biased and incomplete inference | Use hierarchical bivariate model (Reitsma) |
| Moses–Littenberg SROC | MetaDiSc 1.4 | Obsolete, produces biased summary curve, no proper CI or PI | Use HSROC (Rutter & Gatsonis) or bivariate model |
| No meta-regression with robust estimators, no multivariable meta-regression | RevMan 5.4, MetaDiSc 1.4, CMA | Limits exploration of heterogeneity | Use meta-regression in R or Stata |
| Black-box closed code | CMA | Opaque algorithms, no transparency, limited reproducibility | Use script-based software (R or Stata) |
| Lack of advanced models (Bayesian, network, hierarchical) | All three | Cannot handle complexity of modern evidence synthesis | Use R (netmeta, bayesmeta) or Bayesian frameworks (JAGS, Stan) |
| Undeclared continuity correction (mHA) | RevMan 5.4, CMA (NS) | Artificially inflates effect estimates, especially in small or zero-cell studies | Use models handling zero cells directly (e.g. beta-binomial or Peto for rare events; in DTA, use bivariate/HSROC); alternatively, declare correction explicitly. |
CMA: Comprehensive Meta-Analysis; CI: Confidence Interval; DL: DerSimonian–Laird; HSROC: Hierarchical Summary Receiver Operating Characteristic; HKSJ: Hartung–Knapp–Sidik–Jonkman; mHA: modified Haldane–Anscombe (0.5 continuity correction); NS: Not Specified; PI: Prediction Interval; PM: Paule–Mandel; REML: Restricted Maximum Likelihood; Se: Sensitivity; Sp: Specificity; SROC: Summary Receiver Operating Characteristic; WT: Wald-Type.
Disclaimer/Publisher’s Note: The statements, opinions and data contained in all publications are solely those of the individual author(s) and contributor(s) and not of MDPI and/or the editor(s). MDPI and/or the editor(s) disclaim responsibility for any injury to people or property resulting from any ideas, methods, instructions or products referred to in the content. |
© 2025 by the authors. Licensee MDPI, Basel, Switzerland. This article is an open access article distributed under the terms and conditions of the Creative Commons Attribution (CC BY) license (http://creativecommons.org/licenses/by/4.0/).
Copyright: This open access article is published under a Creative Commons CC BY 4.0 license, which permit the free download, distribution, and reuse, provided that the author and preprint are cited in any reuse.


