Submitted:
18 August 2025
Posted:
18 August 2025
You are already at the latest version
Abstract
Objectives
To evaluate the relationship between hyperreflective dots (HRDs) observed on spectral-domain optical coherence tomography (SD-OCT) and the outcomes following treatment with intravitreal ranibizumab or dexamethasone injections in patients with diabetic macular edema (DME).
Methods
This retrospective study focused on individuals suffering from diabetic macular edema (DME) who underwent a sequence of three intravitreal ranibizumab injections. Based on treatment response, the eyes were categorized into two groups: responders and non-responders. The non-responder group subsequently received intravitreal dexamethasone (IVO) implants. Treatment results were evaluated by changes in BCVA, HRDs number, and central macular thickness (CMT).
Results
This research involved 112 eyes from 78 participants who had been diagnosed with DME. Seventy-three eyes (65%) were identified as ranibizumab responders and 39 eyes (35%) as ranibizumab no-responders. Of the 39 individuals who did not show well response to ranibizumab and subsequently received treatment with an intravitreal dexamethasone implant, 26 eyes (66.67%) exhibited a favorable response, while 13 eyes (33.33%) showed an insufficient response. IVR responders demonstrated significantly greater improvements in BCVA (0.54±0.73 to 0.35± 0.40 logMAR vs 0.52±0.61 to 0.47± 0.38 logMAR) and CMT (456.53±109.73μm to 235.47± 49.13μm vs 468.99±127.10μm to 427.45± 52.91μm) reduction. Baseline analysis revealed IVR non-responders had higher counts of both inner and outer retinal HRDs compared to responders (9.09±3.38 vs 7.07±2.32 and 5.46±2.03 vs 4.27±1.87, p< 0.05 respectively). Eyes with initially higher numbers of inner retinal HRDs, outer retinal HRDs, and subretinal HRDs demonstrated a significantly enhanced response to dexamethasone therapy (9.03±3.18 vs 7.55±2.72, 6.55±2.46 vs 4.79±1.88 and 0.27±0.54 vs 0.21±0.47, p< 0.05 respectively).
Conclusions
HRDs could potentially be used as a predictive biomarker to assess the effectiveness of anti-VEGF therapy in treating DME. Patients exhibiting greater number of retinal HRDs tend to have less favorable reactions to anti-VEGF treatments but experience improved results with dexamethasone.
Keywords:
hyperreflective dots
; spectral-domain optical coherence tomography
; diabetic macular edema
; ranibizumab
; dexamethasone
1. Introduction
Diabetic macular edema (DME) stands as a severe microvascular complication arising from diabetic retinopathy, and it is widely recognized as the primary cause of vision impairment associated with diabetes mellitus[1]. The incidence of DME exhibits notable variability across different patient populations: among individuals with type 1 diabetes, the rate ranges significantly from 4.2% to 14.3%, while in those with type 2 diabetes, the incidence is distinctly lower, falling within the range of 1.4% to 5.57%[2]. This discrepancy in incidence rates underscores the need for tailored approaches to understanding and managing DME across different diabetes subtypes.
A defining feature of diabetic macular edema (DME) is retinal thickening, which arises from the abnormal accumulation of fluid in the macular region due to impaired retinal vasculature. The underlying pathophysiology begins with long-term exposure to hyperglycemia, which exerts detrimental effects on retinal endothelial cells and the basement membrane. This damage leads to a cascade of events, including increased vascular hyperpermeability, the release of proinflammatory cytokines, and the development of retinal ischemia. In response to this ischemic microenvironment, there is a pathological overexpression of vascular endothelial growth factor (VEGF) and other pro-angiogenic factors[3]. This molecular cascade forms the basis for the use of intravitreal anti-VEGF therapies, which target VEGF to mitigate vascular leakage, reduce edema, and ultimately improve visual function. However, given the heterogeneity of DME pathology among individual patients, alternative treatment strategies, such as intravitreal steroid therapy, are also employed in clinical practice to address cases where anti-VEGF agents may be less effective[4,5].
Retinal hyperreflective dots (HRDs) manifest as unique, dot-like lesions measuring from 20 to 40 micrometers in diameter, showing reflectivity that equal to or surpasses the retinal pigment epithelium (RPE) band seen on spectral-domain optical coherence tomography (SD-OCT). Although their precise origin is not well-defined, HRDs are associated with lipoprotein extravasation or inflammatory processes in the retinal[6]. Recent research suggests that HRDs are linked to the visual clarity outcomes following anti-VEGF therapy for macular edema[7]. Consequently, we performed a retrospective analysis on patients with diabetic macular edema who underwent three protocol-defined intravitreal ranibizumab injections (IVR). The study aimed to explore the association between HRDs on SD-OCT and treatment outcomes including the reduction of central macular thickness (CMT) and enhancement of best corrected visual acuity (BCVA), among both those who responded to anti-VEGF and those who did not, then switched to dexamethasone implants.
2. Methods
2.1. Patients
This retrospective cohort study evaluated patients with diabetic macular edema (DME) treated at Peking University People's Hospital (November 2023-April 2025) who received intravitreal injections of ranibizumab ((ranibizumab, Lucentis; Novartis, Pharma AG, Switzerland) as well as who switched to ozurdex (Ozurdex; Allergan, Inc., Irvine, CA, USA) implants yielding suboptimal response after three IVR injections. We conducted a quantitative comparison of hyperreflective dot (HRD) counts on spectral-domain OCT between treatment responders and non-responders. This retrospective study adhered to the principles outlined in the Declaration of Helsinki and was granted ethical approval by the Institutional Review Board of Peking University People's Hospital (2023PHD005-001).
The inclusion criteria were as follows:1) adults 18 years or older diagnosed with type II diabetes; 2) The thickness of the central macula is 300 micrometers or more; 3) treatment-naïve DME initially managed with IVR. The exclusion criteria were as follows:1) individuals with high myopia (>8 diopters) resulting in low-quality SD-OCT scan quality); 2) Opaque refractive media (cataract, corneal disease, vitreous hemorrhage and so on); 3) eyes affected by any ocular disease that could obstruct visual enhancement other than DME, such as optic nerve diseases or macular hole.
2.2. Examination
All subjects underwent completed a comprehensive initial eye examination, which included best-corrected visual acuity (BCVA), intraocular pressure (IOP), slit-lamp biomicroscopy, indirect ophthalmoscopy, color fundus photography, spectral-domain optical coherence tomography (SD-OCT) (CIRRUS HD-OCT Model 5000, Carl Zeiss Meditec, Germany) as well as ultra-wide field (UWF) fundus fluorescein angiography (FFA) using Optos 200Tx (Optos plc, Dunfermline, United Kingdom). Subsequent visits included BCVA, IOP, evaluations of the anterior and posterior segments, and SD-OCT. For statistical evaluation, BCVA was transformed into the log MAR scale, which represents the logarithmic value of the minimal angle of resolution. A vision of counting fingers was measured as 2.0 logMAR, while hand movement was recorded as 3.0 logMAR. The measurement of central macular thickness (CMT) utilized the device's follow-up tracking capability, maintaining consistent scan positioning at identical macular locations during every visit through horizontal and vertical B-scan alignment.
2.3. Treatment
All the patients enrolled in the study received a standardized treatment regimen involving monthly intravitreal injections of 0.05ml ranibizumab, administered consistently over a three-month period. Following the completion of this three-injection course, the eyes were categorized based on their therapeutic response to intravitreal ranibizumab (IVR) treatment. Specifically, patients were classified as ranibizumab responders if they demonstrated a positive treatment response, which was defined by meeting one of two criteria: either achieving a central macular thickness (CMT) of less than 300 µm, or experiencing a reduction in CMT of more than 50 µm after the three consecutive IVR injections.
For those patients whose condition did not show an adequate response to IVR—meaning they failed to meet the aforementioned response criteria—dexamethasone implants were administered as a subsequent therapeutic intervention. Then, one month after the dexamethasone implant was delivered, the patients who had initially been non-responsive to ranibizumab underwent a follow-up assessment to evaluate their response to the dexamethasone therapy.
2.4. HFs Counting Methods
HRDs (hyperreflective dots) were characterized in this study as distinct, well-defined particulate structures with a diameter ranging specifically between 20 and 40 micrometers. A key identifying feature of these dots is their reflectivity on spectral-domain optical coherence tomography (SD-OCT) scans, which is either comparable to, or exceeds, the reflectivity of the retinal pigment epithelium (RPE) band-a consistent reference point in retinal imaging. For each patient involved in the study, a horizontal B-scan using SD-OCT was acquired across the foveal region at two critical time points: during the initial baseline visit and at subsequent follow-up consultations. These scans were then analyzed by an experienced grader (QJF) who remained masked to patient outcomes, ensuring objective assessment. The grader quantified the number of hyperreflective dots within the central 1500um area of the fovea. Hyperreflective foci (HRDs) were categorized into three distinct groups based on their precise anatomical location within the retinal layers: 1) Inner retinal layers, extending from the internal limiting membrane (ILM) to the outer nuclear layer (ONL); 2) Outer retinal layers, located between the external limiting membrane (ELM) and the photoreceptors; 3) Subretinal region, situated from the neuro-retinal layer to the retinal pigment epithelium (RPE).
2.5. Statistical Analysis
Initial patient details were gathered and examined with SPSS Statistics version 19.0 software (IBM SPSS Inc., Chicago, USA). For datasets that deviate from a normal distribution, the continuous variables are depicted using median values and interquartile ranges. For analyzing normally distributed datasets, the Student's t-test was applied, whereas the Wilcoxon signed-rank test was used for evaluating nonparametric datasets. Categorical variables were evaluated using Pearson's chi-squared test or Fisher's exact test, with statistical significance defined as P<0.05.
3. Results
3.1. Baseline Demographics
In this study, 112 eyes from 78 patients diagnosed with diabetic macular edema (DME) were included for analysis. Among these, 73 eyes (65%) demonstrated a positive response to ranibizumab treatment, as determined by predefined clinical criteria such as improved best-corrected visual acuity (BCVA) and reduced central retinal thickness (CRT)(Figure 1). In contrast, 39 eyes (35%) did not show a well-defined response, failing to meet these key improvement benchmarks. The 39 eyes that responded poorly to ranibizumab were subsequently treated with an intravitreal dexamethasone implant. Following this intervention, 26 eyes (66.67%) achieved a favorable outcome (Figure 2), while 13 eyes (33.33%) continued to exhibit a poor response to the treatment (Figure 3).
Table 1 and Table 2 present detailed baseline characteristics and demographic data for both responders and non-responders to ranibizumab (IVR) and dexamethasone implant (IVO) treatments. A comprehensive statistical analysis was conducted, comparing various parameters across the groups. No significant differences were detected between IVR responders and non-responders, nor between IVO responders and non-responders, in terms of demographic characteristics (age, sex, BMI), general health status (HbA1c level, diabetes duration, presence of hypertension), ocular history (lens status, prior laser photocoagulation), or baseline ocular features (DRILs, EZ/ELM disruption, BCVA, IOP, CRT).
3.2. Outcomes
The IVR responder group exhibited a significant improvement in both BCVA (best-corrected visual acuity) and CMT (central macular thickness), as detailed in Table 3 and Table 4. Specifically, responders showed a more pronounced enhancement in BCVA compared to non-responders: their measurements shifted from 0.54±0.73 to 0.35±0.40 logMAR, whereas non-responders only improved from 0.52±0.61 to 0.47±0.38 logMAR, with this difference reaching statistical significance (p<0.05). Similarly, the reduction in CMT was far more substantial among responders, dropping from 456.53±109.73μm to 235.47±49.13μm, in contrast to non-responders whose CMT decreased to a much lesser extent (from 468.99±127.10μm to 427.45±52.91μm), and this disparity was also statistically significant (p<0.05).
However, the changes in HRDs (hyperreflective dots) followed a different pattern. At the initial assessment, patients who did not respond to ranibizumab had significantly higher counts of both inner and outer retinal HRDs than those who responded well: inner retinal HRDs were 9.09±3.38 versus 7.07±2.32, and outer retinal HRDs were 5.46±2.03 versus 4.27±1.87, with both differences significant at p<0.05. In contrast, there was no notable variance in subretinal HRDs between the two groups at baseline. After IVR (intravitreal ranibizumab) injection, responders experienced a marked decrease in inner retinal HRDs, falling from 7.07±2.32 to 3.51±1.78, while non-responders showed no such decline (remaining from 9.09±3.38 to 8.21±2.21), a difference that was statistically significant (p<0.05). Meanwhile, both groups saw a significant reduction in subretinal HRDs, though the decrease in outer retinal HRDs did not reach statistical significance in either cohort.
A positive correlation was identified between the reduction in total HRDs and improvements in BCVA (r=0.69, p<0.001), meaning a more substantial decrease in total HRDs was associated with greater gains in visual acuity. Similarly, a positive relationship was observed between HRD decline and CMT reduction (r=0.63, p<0.001), indicating that a larger decrease in HRDs corresponded with more pronounced central macular thinning.
In contrast to the response pattern seen with ranibizumab, eyes with higher initial counts of inner, outer, and subretinal HRDs demonstrated a significantly better response to dexamethasone therapy: inner retinal HRDs were 9.03±3.18 versus 7.55±2.72, outer retinal HRDs were 6.55±2.46 versus 4.79±1.88, and subretinal HRDs were 0.27±0.54 versus 0.21±0.47, with all p-values <0.05, as shown in Table 5 and Table 6. Additionally, ozurdex responders had significantly greater reductions in HRDs across inner, outer, and subretinal layers compared to non-responders: inner retinal HRDs dropped from 9.03±3.18 to 4.31±2.72 versus 7.55±2.72 to 5.75±2.99, outer retinal HRDs from 6.55±2.46 to 3.49±1.84 versus 4.79±1.88 to 3.67±1.88, and subretinal HRDs from 0.27±0.54 to 0.13±0.39 versus 0.21±0.47 to 0.18±0.27, with all differences significant at p<0.05.
4. Discussion
This study comprehensively evaluated the relationship between hyperreflective dots (HRDs) detected by spectral - domain optical coherence tomography (SD-OCT) and the efficacy of intravitreal ranibizumab (IVR) or dexamethasone implants in the treatment of diabetic macular edema (DME). The results demonstrated that cases with poor responses to ranibizumab often had a higher number of baseline HRDs, while better therapeutic outcomes were achieved with dexamethasone treatment. Moreover, the degree of HRD resolution was positively correlated with improvements in best - corrected visual acuity (BCVA) and reductions in central macular thickness (CMT), highlighting the potential of HRDs as a predictive biomarker in DME management.
Discrete and localized lesions, known as hyperreflective foci (HFs), have been observed in several retinal conditions such as age-related macular degeneration (AMD), retinal vein occlusion (RVO), central serous chorioretinopathy, Stargardt disease, retinitis pigmentosa, and diabetic retinopathy[8,9,10,11]. Despite their frequent observation, the pathophysiological basis of HRDs remains incompletely understood. To date, several competing theories have emerged to explain the formation of hyperreflective dots (HRDs), with proposed mechanisms ranging from lipoprotein extravasation and inflammatory processes to microglial activation. Bolz and Chen et al. identified HRDs as morphological correlates of lipid extravasation in DME[12,13]. Their research highlighted that these well-defined hyperreflective structures tend to localize within the walls of retinal microaneurysms and distribute across multiple retinal layers. Supported by histological analyses, the authors suggested that these foci likely represent subclinical lipoprotein leakage, a consequence of breakdown in the inner blood-retinal barrier (BRB)—a critical structure that regulates the passage of substances between retinal blood vessels and the neurosensory retina. Building on this, Bolz and colleagues proposed that HRDs may serve as early markers of BRB compromise in DME, reflecting the initial extravasation of lipoproteins and proteins before more overt signs of edema or vascular dysfunction become apparent. Similarly, Esther et al. believe that the distribution of HRDs is related to the intraretinal fluid (IRF), representing the accumulation of fluid within the retina caused by the disruption of the blood-retinal barrier [14]. Their histopathological investigations further indicated that these localized hyperreflective changes are likely subclinical manifestations of lipoprotein leakage driven by inner BRB disruption. From this correlation, the authors inferred that HRDs signify the escape of lipoproteins and/or plasma proteins into the retinal parenchyma, positioning them as preclinical markers of barrier dysfunction in the early stages of diabetic macular edema. Together, these studies underscore the potential of HRDs to serve as sensitive indicators of underlying vascular compromise, offering insights into the early pathophysiology of DME and other retinal disorders.
Conversely, various alternative studies have suggested a connection between HRDs and inflammatory responses in the retina [15,16]. Inflammation in the retina activates microglia, causing cell swelling and migration through the retinal layers, which eventually results in the formation of hyperreflective foci (HFs) in age-related macular degeneration (AMD). Progressive retinal inflammation activates microglial cells, triggering their proliferation, migration across retinal layers, and morphological changes leading to aggregation. Vujosevic et al. observed that HRDs initially localize to the microglia-rich inner retina in early DR, later extending to outer layers as retinopathy progresses[17]. These findings linked outer retinal HRDs to photoreceptor layer damage and visual acuity impairment in DME, suggesting that HRDs may reflect microglial activation, with the aggregated, activated cells appearing as hyperreflective foci on SD-OCT. Previous studies have documented the movement of HRDs from the inner to outer retina over the course of DR progression[18]. This may reflect a dynamic interplay between BRB disruption and inflammatory activation, with their distribution and quantity varying based on disease stage and underlying pathology[19].
In the complex pathophysiology of DME, elevated vascular endothelial growth factor (VEGF) levels, which are induced by factors such as chronic hyperglycemia and retinal hypoxia, play a pivotal role[20]. VEGF is considered the primary agent responsible for the progression of diabetic macular edema (DME). VEGF promotes increased vascular permeability in the retinal microvasculature. This occurs through multiple mechanisms, including the activation of endothelial cell signaling pathways that lead to the loosening of tight junctions between endothelial cells in the blood - retinal barrier. As a result, plasma components, including proteins and fluid, leak into the extracellular space of the retina, ultimately causing the characteristic macular edema. Anti-VEGF therapies have emerged as a cornerstone in the treatment of DME[21]. Among these, ranibizumab is a well- studied agent. Ranibizumab is a humanized monoclonal antibody fragment that binds with high affinity to all active isoforms of VEGF- A. By blocking VEGF-A, it inhibits the VEGF-mediated signaling cascade in endothelial cells, targeting this pathway to reduce leakage and improve retinal vascular integrity[22,23]. Recent evidence indicates that such treatment not only reduces vessel leakage but also decreases the number of hyperreflective foci (HFs) in DME patients[24,25]. Consistent with prior research, our study observed a significant reduction in HRDs after the initial anti-VEGF treatment in patients with DME. This highlights the importance of vascular leakage and subsequent lipoprotein extravasation in the development of HRD in the progression of DME. The leakage of lipoproteins and other plasma components, which is driven by elevated VEGF-induced vascular permeability, likely contributes to the formation of HRDs. As anti-VEGF therapy effectively targets the root cause of this leakage[21], it leads to a subsequent decrease in HRDs. This not only has implications for understanding the pathophysiology of DME but also for predicting treatment response and visual outcomes in these patients.
Beyond VEGF - mediated mechanisms, inflammation plays a critical role in DME pathogenesis[26]. In addition to the increased expression of vascular endothelial growth factor (VEGF), inflammatory processes play a crucial role in the development of diabetic macular edema (DME)[27,28]. Considering this dual aspect of the disease, treatments therapies targeting inflammatory mediators such as intravitreal corticosteroids, particularly sustained-release dexamethasone implants, have proven to be an effective therapy for DME[29]. In our study, the application of dexamethasone in cases with poor anti-VEGF response can achieve a very good response, which supports the theory that HRDs may be linked to the inflammatory process. Previous research indicated that hyperreflective foci are associated with poorer visual results in macular edema caused by retinal vascular diseases[30,31]. This result is consistent with ours. Our research identified a direct relationship between the extent of HRD decrease and the level of enhancement in BCVA. Differing from the results reported by Liu et al., which focused on hyperreflective foci and visual outcomes, our research also examined the relationship between HRD quantity and treatment response to ranibizumab or dexamethasone implants in DME. The observed variation in therapeutic efficacy may depend on HRD number, locations, potentially reflecting their distinct SD-OCT origins. Considering HRDs are linked to microglial clusters, a reduction in HRD quantity observed through SD-OCT probably indicates reduced inflammation within the retina. Our research revealed that eyes with DME that responded inadequately to ranibizumab had a higher quantity of HRDs in comparison to those eyes that were responsive to IVR. After switching to dexamethasone implant treatment, significant clinical improvement was observed in 67% of the IVR-refractory cases. Interestingly, those who responded well to dexamethasone showed elevated HRD counts compared to those who did not. Considering that HRDs are indicative of inflammatory activity, these results imply that inflammatory pathways might have a more prominent impact than mechanisms driven by VEGF in the development of these DME conditions.
This research had some limitations: Initially, it was based on a single-center retrospective evaluation, which might lead to selection bias. Second, the research was conducted with a relatively limited sample size and short follow-up duration. Hence, future studies might involve a greater number of cases and extend over a longer period across various centers to validate these findings.
5. Conclusions
HRDs could be utilized as a forecasting biomarker for assessing the efficacy of anti-VEGF therapy in DME. Patients who have a higher number of retinal HRDs generally respond less effectively to anti-VEGF medications but tend to experience improved outcomes when treated with dexamethasone. Thus, dexamethasone implants could potentially serve as a more efficient therapy option for DME cases with substantial HRDs accumulation.
Authorship
All named authors meet the International Committee of Medical Journal Editors (ICMJE) criteria for authorship for this article, take responsibility for the integrity of the work as a whole and have given their approval for this version to be published.
Competing Interests
The authors declare no competing interests.
Author Contributions
Concept and design: Siying Li; Methodology: Hongwei Zhang; Data collection: Muzi Li; Statistical analysis: Aimin Sun; Drafting the manuscript: Siying Li; Preparing figures: Siying Li; Supervision: Hongwei Zhang.
Funding
This study was funded by the Applied Basic Research Programs of Science and Technology Joint Plan of Liaoning Province (No. 2023JH2/101700090).
Institutional Review Board Statement
This study adhered to the tenets of the Declaration of Helsinki and was approved by the Ethics Committee Review Board of Peking University People’s Hospital (2023PHD005-001). Written informed consent was obtained from all individual participants included in the study.
References
- Daruich A, Matet A, Moulin A, Kowalczuk L, Nicolas M, Sellam A, Rothschild PR, Omri S, Gélizé E, Jonet L, Delaunay K, De Kozak Y, Berdugo M, Zhao M, Crisanti P, Behar-Cohen F. Mechanisms of macular edema: Beyond the surface. Progress in retinal and eye research 2018, 63, 20–68. [Google Scholar] [CrossRef]
- Thomas RL, Dunstan FD, Luzio SD, Chowdhury SR, North RV, Hale SL, Gibbins RL, Owens DR Prevalence of diabetic retinopathy within a national diabetic retinopathy screening service. The British journal of ophthalmology 2015, 99, 64–68. [CrossRef]
- Das A, McGuire PG, Rangasamy S Diabetic Macular Edema: Pathophysiology and Novel Therapeutic Targets. Ophthalmology 2015, 122, 1375–1394. [CrossRef]
- Elnahry AG, Noureldine AM, Abdel-Kader AA, Sorour OA, Ramsey DJ Optical Coherence Tomography Angiography Biomarkers Predict Anatomical Response to Bevacizumab in Diabetic Macular Edema. Diabetes, metabolic syndrome and obesity: targets and therapy 2022, 15, 395–405. [CrossRef]
- Tatsumi T Current Treatments for Diabetic Macular Edema. International journal of molecular sciences 2023, 24. [CrossRef]
- Huang H, Jansonius NM, Chen H, Los LI Hyperreflective Dots on OCT as a Predictor of Treatment Outcome in Diabetic Macular Edema: A Systematic Review. Ophthalmology Retina 2022, 6, 814–827. [CrossRef]
- Okuwobi IP, Ji Z, Fan W, Yuan S, Bekalo L, Chen Q Automated Quantification of Hyperreflective Foci in SD-OCT With Diabetic Retinopathy. IEEE journal of biomedical and health informatics 2020, 24, 1125–1136. [CrossRef]
- De Benedetto U, Sacconi R, Pierro L, Lattanzio R, Bandello F Optical coherence tomographic hyperreflective foci in early stages of diabetic retinopathy. Retina (Philadelphia, Pa) 2015, 35, 449–453. [CrossRef]
- Waldstein SM, Vogl WD, Bogunovic H, Sadeghipour A, Riedl S, Schmidt-Erfurth U Characterization of Drusen and Hyperreflective Foci as Biomarkers for Disease Progression in Age-Related Macular Degeneration Using Artificial Intelligence in Optical Coherence Tomography. JAMA ophthalmology 2020, 138, 740–747. [CrossRef]
- Duic C, Pfau K, Keenan TDL, Wiley H, Thavikulwat A, Chew EY, Cukras C Hyperreflective Foci in Age-Related Macular Degeneration are Associated with Disease Severity and Functional Impairment. Ophthalmology Retina 2023, 7, 307–317. [CrossRef]
- Lee SY, Yoon CK, Park UC, Park KH, Lee EK. Choroidal hyperreflective foci as biomarkers of severity in stargardt disease. Retina (Philadelphia, Pa) 2025, 45, 774–784. [Google Scholar] [CrossRef]
- Bolz M, Schmidt-Erfurth U, Deak G, Mylonas G, Kriechbaum K, Scholda C Optical coherence tomographic hyperreflective foci: a morphologic sign of lipid extravasation in diabetic macular edema. Ophthalmology 2009, 116, 914–920. [CrossRef]
- Chen NN, Chen WD, Lai CH, Kuo CN, Chen CL, Huang JC, Wu PC, Wu PL, Chen CY Optical Coherence Tomographic Patterns as Predictors of Structural Outcome After Intravitreal Ranibizumab in Diabetic Macula Edema. Clinical ophthalmology 2020, 14, 4023–4030. [CrossRef]
- von Schulthess EL, Maunz A, Chakravarthy U, Holekamp N, Pauleikhoff D, Patel K, Bachmeier I, Yu S, Cohen Y, Scherb MP, Jones IL, Gibson K, Willis JR, Glittenberg C, Singh RP, Fauser S. Intraretinal Hyper-Reflective Foci Are Almost Universally Present and Co-Localize With Intraretinal Fluid in Diabetic Macular Edema. Investigative ophthalmology & visual science 2024, 65, 26. [Google Scholar] [CrossRef]
- Wu J, Zhang C, Yang Q, Xie H, Zhang J, Qiu Q, Liu K, Luo D, Liu F, Zhang J Imaging Hyperreflective Foci as an Inflammatory Biomarker after Anti-VEGF Treatment in Neovascular Age-Related Macular Degeneration Patients with Optical Coherence Tomography Angiography. BioMed research international 2021, 2021, 6648191. [CrossRef]
- Frizziero L, Midena G, Danieli L, Torresin T, Perfetto A, Parrozzani R, Pilotto E, Midena E Hyperreflective Retinal Foci (HRF): Definition and Role of an Invaluable OCT Sign. Journal of clinical medicine 2025, 14. [CrossRef]
- Vujosevic S, Bini S, Midena G, Berton M, Pilotto E, Midena E Hyperreflective intraretinal spots in diabetics without and with nonproliferative diabetic retinopathy: an in vivo study using spectral domain OCT. Journal of diabetes research 2013, 2013, 491835. [CrossRef]
- Uji A, Murakami T, Nishijima K, Akagi T, Horii T, Arakawa N, Muraoka Y, Ellabban AA, Yoshimura N Association between hyperreflective foci in the outer retina, status of photoreceptor layer, and visual acuity in diabetic macular edema. American journal of ophthalmology 2012, 153, 710–717. [CrossRef]
- Chung YR, Lee SY, Kim YH, Byeon HE, Kim JH, Lee K Hyperreflective foci in diabetic macular edema with serous retinal detachment: association with dyslipidemia. Acta diabetologica 2020, 57, 861–866. [CrossRef]
- Hatamnejad A, Orr S, Dadak R, Khanani A, Singh R, Choudhry N Anti-VEGF and steroid combination therapy relative to anti-VEGF mono therapy for the treatment of refractory DME: A systematic review of efficacy and meta-analysis of safety. Acta ophthalmologica 2024, 102, e204–e214. [CrossRef]
- Sharma D, Zachary I, Jia H Mechanisms of Acquired Resistance to Anti-VEGF Therapy for Neovascular Eye Diseases. Investigative ophthalmology & visual science 2023, 64, 28. [CrossRef]
- Agostini H, Abreu F, Baumal CR, Chang DS, K GC, Demetriades AM, Kodjikian L, Lim JI, Margaron P, Monés JM, Peto T, Ricci F, Rüth M, Singh RP, Stoilov I, Swaminathan B, Willis JR, Westenskow PD Faricimab for neovascular age-related macular degeneration and diabetic macular edema: from preclinical studies to phase 3 outcomes. Graefe's archive for clinical and experimental ophthalmology = Albrecht von Graefes Archiv fur klinische und experimentelle Ophthalmologie 2024, 262, 3437–3451. [CrossRef]
- Chatziralli I Ranibizumab for the treatment of diabetic retinopathy. Expert opinion on biological therapy 2021, 21, 991–997. [CrossRef]
- Tang L, Luo D, Qiu Q, Xu GT, Zhang J Hyperreflective Foci in Diabetic Macular Edema with Subretinal Fluid: Association with Visual Outcomes after Anti-VEGF Treatment. Ophthalmic research 2023, 66, 39–47. [CrossRef]
- Al-Latayfeh M, Abdel Rahman M, Shatnawi R Outcome of Single Dexamethasone Implant Injection in the Treatment of Persistent Diabetic Macular Edema After Anti-VEGF Treatment: Real-Life Data from a Tertiary Hospital in Jordan. Clinical ophthalmology 2021, 15, 1285–1291. [CrossRef]
- Vujosevic S, Lupidi M, Donati S, Astarita C, Gallinaro V, Pilotto E Role of inflammation in diabetic macular edema and neovascular age-related macular degeneration. Survey of ophthalmology 2024, 69, 870–881. [CrossRef]
- Yao X, Zhao Z, Zhang W, Liu R, Ni T, Cui B, Lei Y, Du J, Ai D, Jiang H, Lv H, Li X Specialized Retinal Endothelial Cells Modulate Blood-Retina Barrier in Diabetic Retinopathy. Diabetes 2024, 73, 225–236. [CrossRef]
- Utsumi T, Noma H, Yasuda K, Goto H, Shimura M Effects of ranibizumab on growth factors and mediators of inflammation in the aqueous humor of patients with diabetic macular edema. Graefe's archive for clinical and experimental ophthalmology = Albrecht von Graefes Archiv fur klinische und experimentelle Ophthalmologie 2021, 259, 2597–2603. [CrossRef]
- Taloni A, Coco G, Rastelli D, Buffon G, Scorcia V, Giannaccare G Safety and Efficacy of Dexamethasone Intravitreal Implant Given Either First-Line or Second-Line in Diabetic Macular Edema. Patient preference and adherence 2023, 17, 3307–3329. [CrossRef]
- Liu S, Wang D, Chen F, Zhang X Hyperreflective foci in OCT image as a biomarker of poor prognosis in diabetic macular edema patients treating with Conbercept in China. BMC ophthalmology 2019, 19, 157. [CrossRef]
- Chatziralli IP, Sergentanis TN, Sivaprasad S. Hyperreflective foci as an independent visual outcome predictor in macular edema due to retinal vascular diseases treated with intravitreal dexamethasone or ranibizumab. Retina (Philadelphia, Pa) 2016, 36, 2319–2328. [Google Scholar] [CrossRef] [PubMed]
Figure 1.
Example case of DME successfully treated with ranibizumab. The initial observation (A1) reveals a small number of hyperreflective dots (HRDs) alongside increased thickness of the central macular region (CMT).Post-injection evaluations (A2-A4) demonstrate a continuing decrease in CMT..
Figure 1.
Example case of DME successfully treated with ranibizumab. The initial observation (A1) reveals a small number of hyperreflective dots (HRDs) alongside increased thickness of the central macular region (CMT).Post-injection evaluations (A2-A4) demonstrate a continuing decrease in CMT..
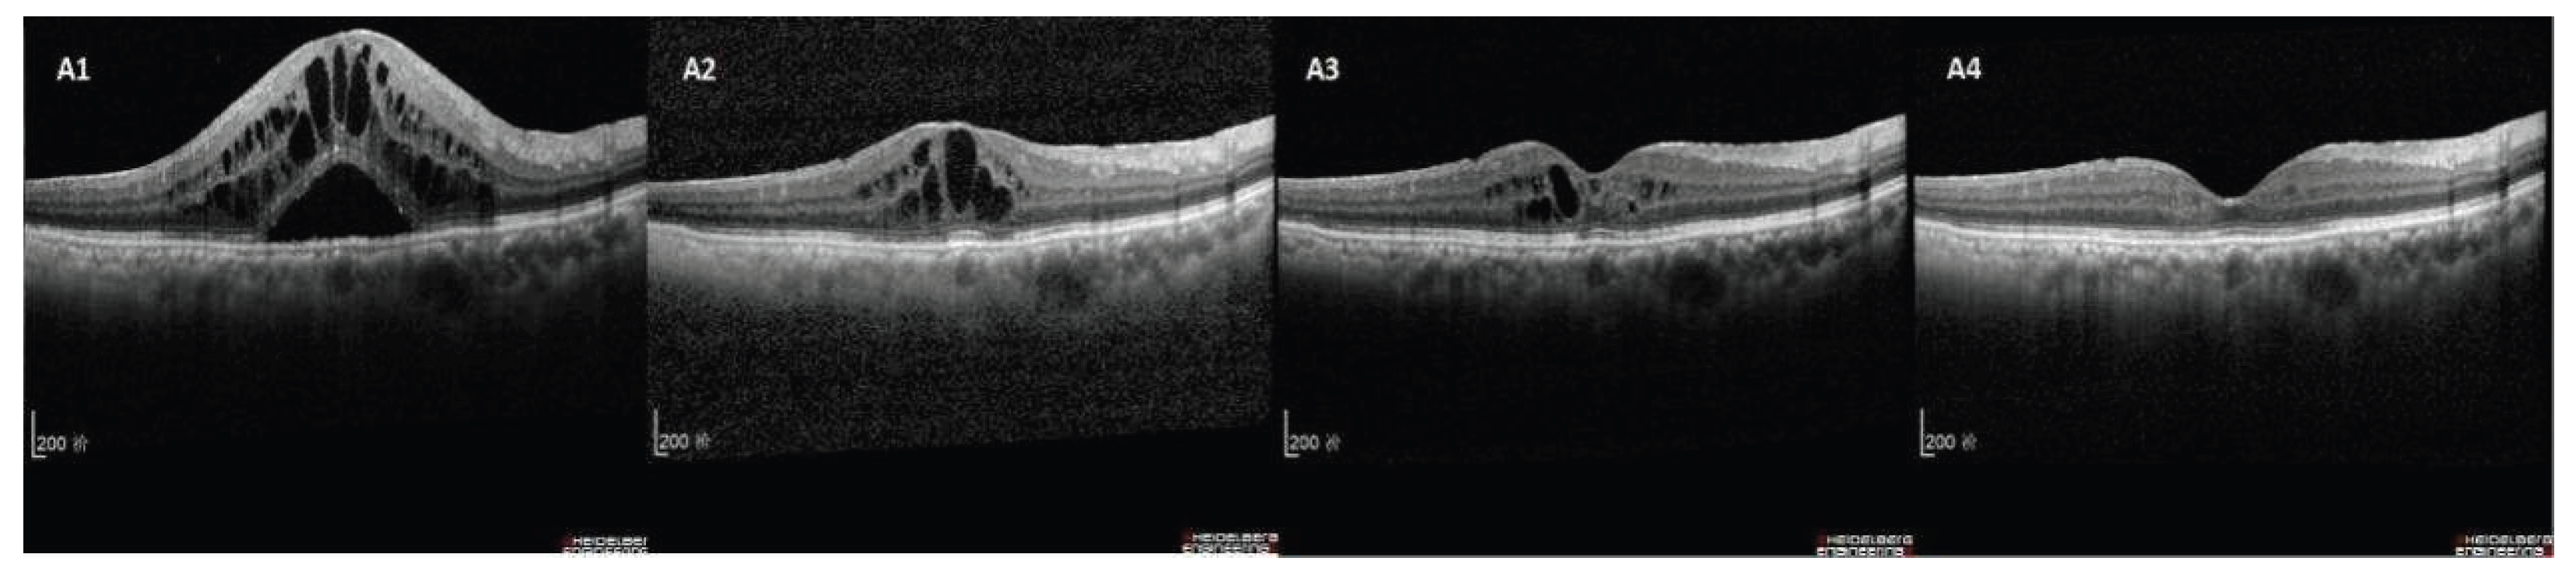
Figure 2.
This case exemplifies DME with a positive response to dexamethasone and a lack of response to IVR treatment. Baseline (B1) and post-IVR (B2-B4) reveal several HRDs with only slight CMT decline, indicating an IVR non-responder. One month administering dexamethasone (B5), CMT decreases notably with significant reduction in HRDs.
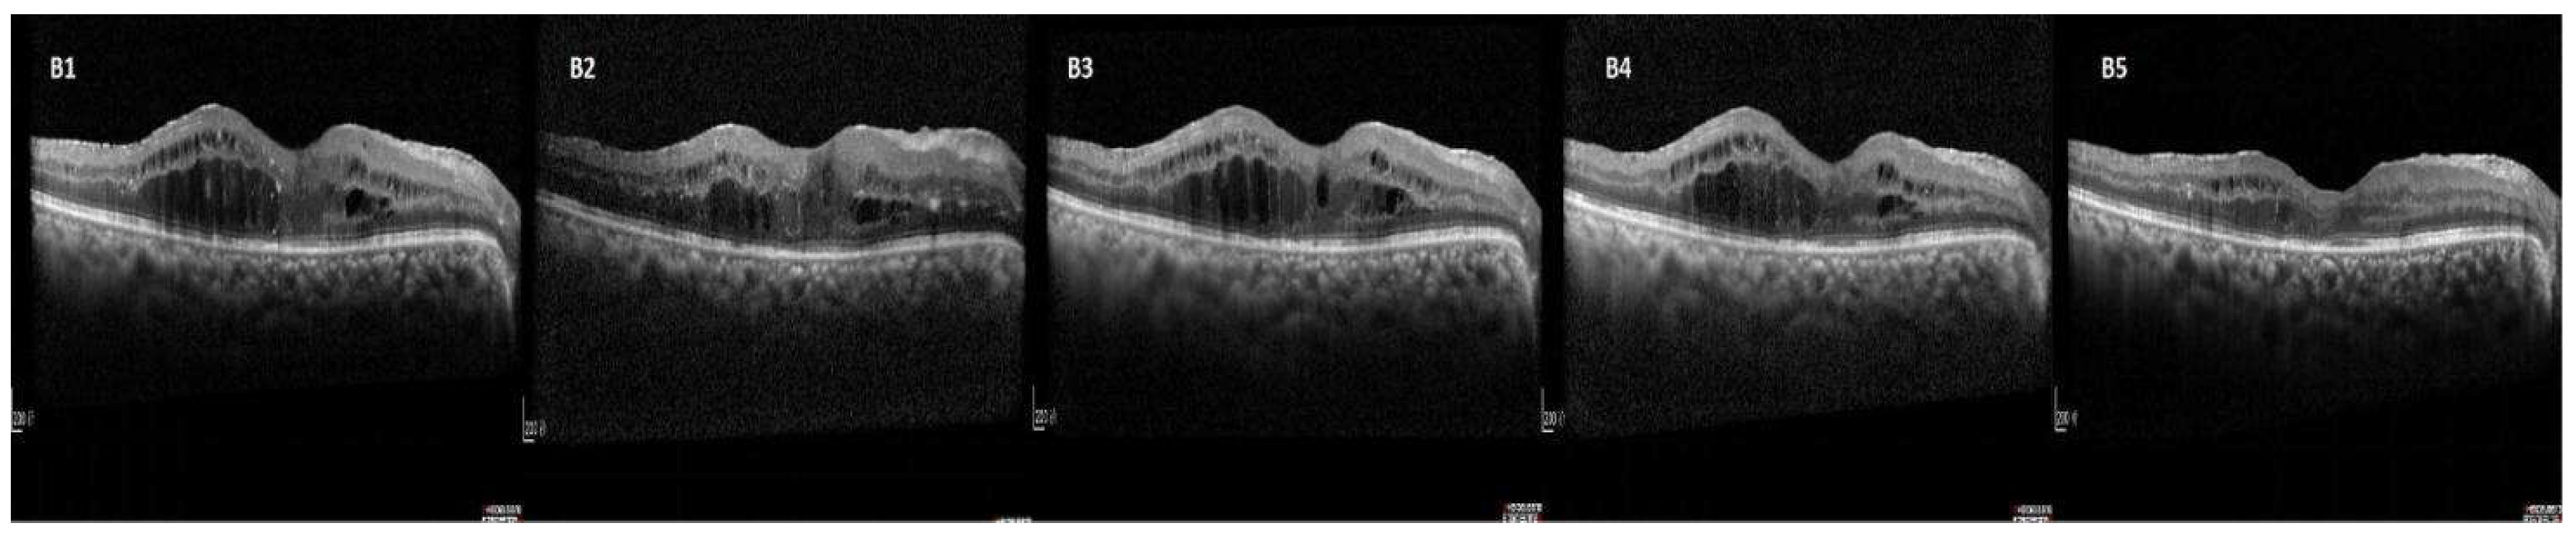
Figure 3.
Example case of DME where dexamethasone treatment was ineffective. Baseline (C1) and post-IVR (C2-C4) showing abundant HRDs with persistent CMT elevation (IVR non-responder). After receiving dexamethasone (C5), there is no noticeable decrease in CMT, although the quantity of HRD has diminished.
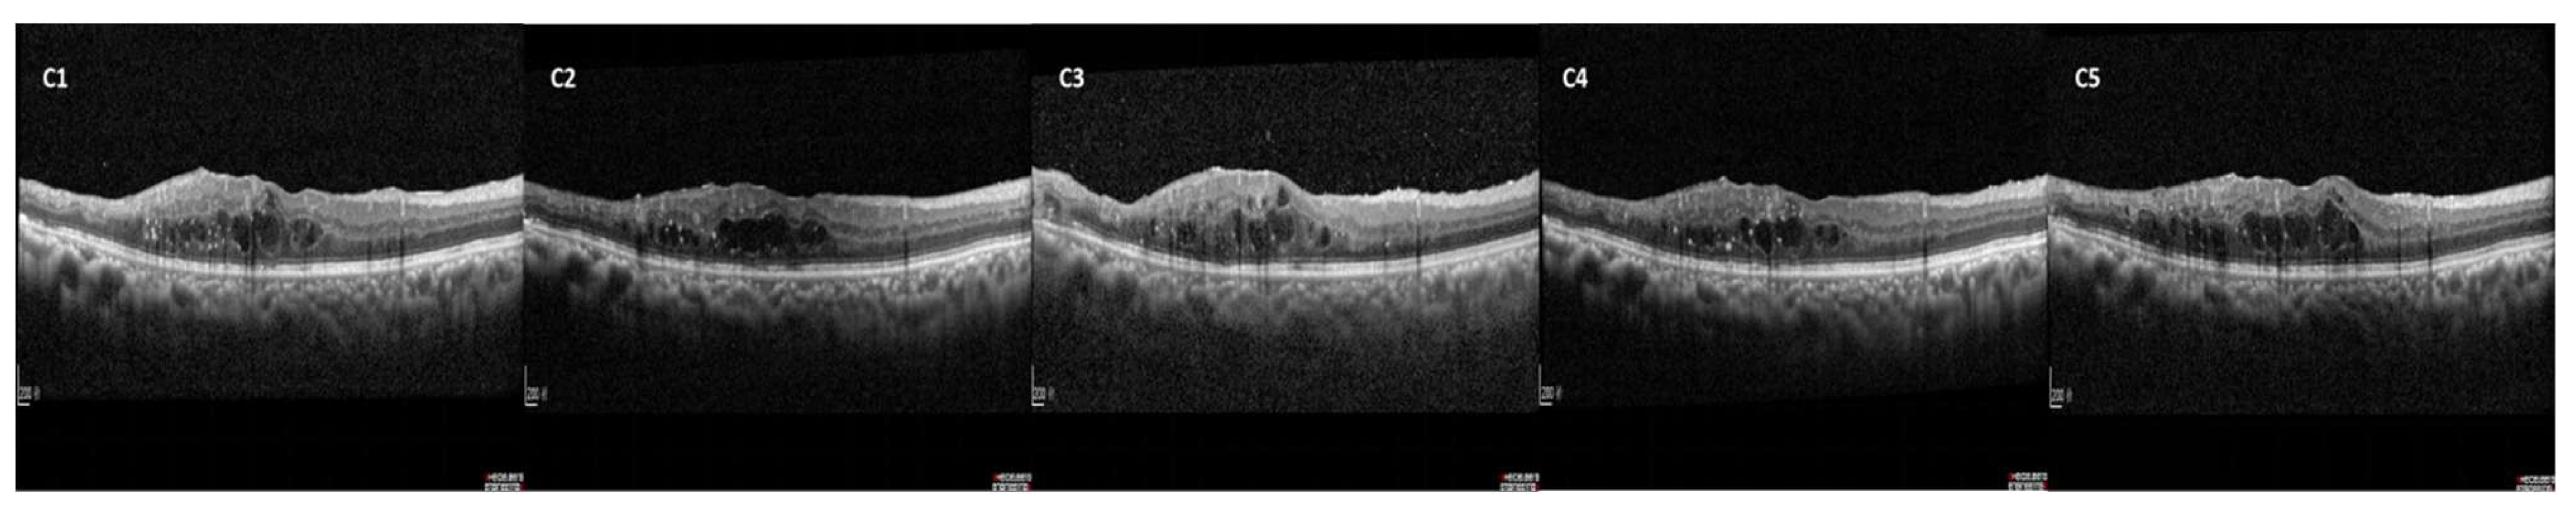

Table 1.
Comparison of initial characteristics between IVR responder and no-responder groups.
| Characteristics | responder group (n=73) |
no-responder group (n=39) | P value |
| Eyes/patients | 73/52 | 39/26 | - |
| Age (year), mean± SD | 59.27±7.16 | 55.63±7.73 | 0.776 |
| Male/female | 28/24 | 15/11 | 0.747 |
| BMI (kg/m2), mean± SD | 24.88±1.97 | 25.01±1.73 | 0.706 |
| Systemic profile: | |||
| HbA1c (%), mean± SD | 6.66±1.98 | 7.13±1.87 | 0.273 |
| Duration of DM (y), median (IQR) | 8.35(4.00,11.50) | 7.50(4.50,10.00) | 0.234 |
| Hypertension, n (%) | 20(38.5) | 11(42.3) | 0.744 |
| Ocular profile, n (%) | |||
| History of laser | 12 (16.4) | 7 (17.9) | 0.839 |
| pseudophakic | 9 (12.3) | 6 (15.4) | 0.651 |
| DRIL, n (%) | 2 (2.7) | 2 (5.1) | 0.516 |
| ELM/EZ disruption, n (%) | 3(4.1) | 2 (5.1) | 0.804 |
| LogMAR BCVA, mean± SD | 0.54±0.73 | 0.52±0.61 | 0.827 |
| IOP (mmHg), mean± SD | 15.30±3.47 | 14.83±3.55 | 0.709 |
| CMT (mm), mean± SD | 456.53±109.73 | 468.99±127.10 | 0.614 |
SD, standard deviation; BMI, Body Mass Index; IQR, interquartile range; DRIL, disorganization of retinal inner layers; ELM, external limiting membrane; EZ, ellipsoid zone; logMAR, logarithm of minimum angle of resolution; BCVA, best-corrected visual acuity; IOP, intraocular pressure; CMT, central macular thickness.
Table 2.
Comparison of initial characteristics between IVO responder and no-responder groups.
| Characteristics | responder group (n=26) | no-responder group (n=13) | P value |
| Eyes/patients | 26/17 | 13/9 | - |
| Age (year), mean± SD | 57.25±7.36 | 54.58±9.93 | 0.598 |
| Male/female | 10/7 | 5/4 | 0.873 |
| BMI (kg/m2), mean± SD | 24.99±2.73 | 25.11±1.63 | 0.698 |
| Systemic profile: | |||
| HbA1c (%), mean± SD | 7.08±1.17 | 7.19±1.56 | 0.673 |
| Duration of DM (y), median (IQR) | 7.35(4.25,10.50) | 7.80(4.35,11.00) | 0.304 |
| Hypertension, n (%) | 7(41.2) | 4(44.4) | 0.873 |
| Ocular profile, n (%) | |||
| History of laser | 5 (19.2) | 2 (15.4) | 0.768 |
| pseudophakic | 4 (15.4) | 2 (15.4) | 1.000 |
| DRIL, n (%) | 1 (3.8) | 1 (7.7) | 0.608 |
| ELM/EZ disruption, n (%) | 1 (3.8) | 1 (7.7) | 0.608 |
| LogMAR BCVA, mean± SD | 0.53±0.39 | 0.51±0.67 | 0.772 |
| IOP (mmHg), mean± SD | 14.60±4.71 | 15.03±2.59 | 0.609 |
| CMT (mm), mean± SD | 472.53±112.03 | 464.57±137.83 | 0.511 |
SD, standard deviation; BMI, Body Mass Index; IQR, interquartile range; DRIL, disorganization of retinal inner layers; ELM, external limiting membrane; EZ, ellipsoid zone; logMAR, logarithm of minimum angle of resolution; BCVA, best-corrected visual acuity; IOP, intraocular pressure; CMT, central macular thickness.
Table 3.
Comparison of BCVA at each visit between IVR responder and no-responder groups.
| BCVA (log MAR), mean ± SD | responder group (n=73) | no-responder group (n=39) | P value |
| Baseline | 0.54±0.73 | 0.52±0.61 | 0.827 |
| 1st injection | 0.44± 0.42 | 0.50± 0.50 | 0.044* |
| 2nd injection | 0.39± 0.37 | 0.49± 0.48 | 0.031* |
| 3rd injection | 0.35± 0.40 | 0.47± 0.38 | 0.027* |
SD, standard deviation; log MAR, logarithm of minimum angle of resolution; BCVA, best-corrected visual acuity.
Table 4.
Comparison of CMT at each visit between IVR responder and no-responder groups.
| CMT (μm), mean ± SD | responder group (n=73) | no-responder group (n=39) | P value |
| Baseline | 456.53±109.73 | 468.99±127.10 | 0.614 |
| 1st injection | 337.77± 93.18 | 440.95± 99.01 | 0.027* |
| 2nd injection | 290.69± 66.38 | 433.18± 78.66 | 0.016* |
| 3rd injection | 235.47± 49.13 | 427.45± 52.91 | 0.008* |
SD, standard deviation; CMT, central macular thickness.
Table 5.
Comparison of BCVA between IVO responder and no-responder groups.
| BCVA (log MAR), mean ± SD | responder group (n=73) |
no-responder group (n=39) | P value |
| Baseline | 0.53±0.39 | 0.51±0.67 | 0.772 |
| 1 month | 0.37± 0.41 | 0.43± 0.88 | 0.039* |
SD, standard deviation; log MAR, logarithm of minimum angle of resolution; BCVA, best-corrected visual acuity.
Table 6.
Comparison of CMT between IVO responder and no-responder groups.
| CMT (μm), mean ± SD | responder group (n=73) | no-responder group (n=39) | P value |
| Baseline | 472.53±112.03 | 464.57±137.83 | 0.747 |
| 1 month | 255.99± 69.83 | 397.48± 82.77 | 0.014* |
SD, standard deviation; CMT, central macular thickness.
Disclaimer/Publisher’s Note: The statements, opinions and data contained in all publications are solely those of the individual author(s) and contributor(s) and not of MDPI and/or the editor(s). MDPI and/or the editor(s) disclaim responsibility for any injury to people or property resulting from any ideas, methods, instructions or products referred to in the content. |
© 2025 by the authors. Licensee MDPI, Basel, Switzerland. This article is an open access article distributed under the terms and conditions of the Creative Commons Attribution (CC BY) license (http://creativecommons.org/licenses/by/4.0/).
Copyright: This open access article is published under a Creative Commons CC BY 4.0 license, which permit the free download, distribution, and reuse, provided that the author and preprint are cited in any reuse.


