
Submitted:
18 August 2025
Posted:
19 August 2025
You are already at the latest version
Abstract
The paper presents experimental results for a modified pulsed plasma thruster (PPT) with solid propellant, using a coaxial anode-cathode design. Graphite from pencil leads served as propellant, and a tungsten trigger electrode was tested to reduce carbonization effects. Experiments were performed in a vacuum chamber at 0.001 Pa, employing diagnostics such as discharge current/voltage recording, power measurement, ballistic pendulum, time-of-flight (TOF) method, and a Faraday cup. Current and voltage waveforms matched an oscillatory RLC circuit with variable plasma channel resistance. Key discharge parameters were measured, including current pulse duration/amplitude and plasma channel formation/decay dynamics. Impulse bit values, obtained with a ballistic pendulum, reached up to 8.5 μN·s. Increasing trigger capacitor capacitance reduced thrust due to unstable “pre-plasma” formation and partial pre-discharge energy loss. Using TOF and Faraday cup diagnostics, plasma front velocity, ion current amplitude, current density, and ion concentration were determined. Tungsten electrodes produced lower charged particle concentrations than graphite but offered better adhesion resistance, minimal carbonization, and stable long-term performance. The findings support optimizing trigger electrode materials and PPT operating modes to extend lifetime and stabilize thrust output.
Keywords:
pulsed plasma thruster
; graphite electrode
; tungsten electrode
; Faraday cup
; ballistic pendulum
1. Introduction
Pulsed plasma thrusters (PPTs) are considered as promising electric propulsion systems for small spacecraft due to their simple design and ability to operate with solid propellant [1,2,3,4,5]. However, key issues remain in their operation, including low efficiency, electrode erosion, and carbon deposition, which result in reduced electrical strength and system longevity [6,7,8].
To date, a significant number of studies have been conducted to improve the structural and operational characteristics of pulsed plasma thrusters (PPTs). For example, the review in [9] provides a detailed analysis of PPT plasma characteristics and proposes methods to improve efficiency by optimizing the current pulse shape. The results of the study in [10] showed that changes in electrode configuration (angles, length, interelectrode distance) have a significant impact on the efficiency of energy transfer into the plasma channel. For instance, a segmented or asymmetric anode significantly improves the performance of PPTs, increasing ion density in the plasma channel, impulse bit by 28% and efficiency by 49%.[11].
In [12], the dynamics of arc discharge in coaxial PPTs were studied, and it was found that instabilities in the channel lead to fluctuations in thrust performance.
One of the most significant limitations for miniaturization of traditional polytetrafluoroethylene (PTFE) is carbon deposition in the electrodes at low discharge energy levels. This considerably shortens the operation lifetime and leads to premature thruster failure. A review of various types of propellants and their characteristics, along with one of the proposed solutions to these issues, is presented in [13], and non-volatile liquid PFPE and sulfur are recommended as alternative propellants. These substances demonstrated the ability to operate without carbon deposition, thereby eliminating this failure mode during thruster miniaturization. As noted in [14], a new model was proposed for calculating the ablated mass bit in ablation-type pulsed plasma thrusters, based on a statistical description of PTFE degradation. The model takes into account the energy parameters of ablation and can be used for lifetime prediction and PPT design.
The thruster design proposed in this study features a coaxial arrangement of the anode and cathode. It separated at one end by a dielectric insulator and includes a dedicated graphite igniter electrode that serves both as the propellant source and discharge initiator. The igniter electrode is powered by a separate low-capacitance capacitor (~1 µF) and is actuated by a miniature electromagnetic drive, providing a brief electrical contact with the grounded cathode and enabling reproducible triggering of the initial spark. This discharge configuration allows independent optimization of the ignition and main pulse energies, while the coaxial geometry promotes more uniform current distribution and the formation of a directed plasma flow.
The lack of relevant research on the selection of igniter electrode materials that combine high electrical conductivity with low adhesion to copper highlights the relevance of this study. In the present work, a comparison is made between graphite and tungsten igniter electrodes in terms of ion emission, resistance to degradation, and their impact on the operational longevity of the PPT.
2. Materials and Methods
2.1. Solid-Propellant Pulsed Plasma Thruster
Experiments were conducted using a pulsed plasma thruster. The design of the current model includes structural modifications aimed at simplifying the mechanisms of an earlier thruster developed by the authors [15]. Photographs and a schematic diagram of the electrodes of the modified solid-propellant pulsed plasma thruster are shown in Figure 1.
The anode and cathode are arranged coaxially and separated at one end by a dielectric insulator. The anode has a diameter of 12.7 mm, while the cathode diameter is 5 mm. The cathode is grounded, and a high-voltage potential of up to 1400 V is applied to the anode (between the “ground” and “B” points) from a pre-charged 4.5 μF capacitor.
A graphite igniter electrode, which also serves as the solid propellant, is aligned coaxially with the cathode and connected to a capacitor Cᵢ=1 μF with a voltage of 100 V. The graphite electrode is capable of reciprocating motion driven by an electromagnet, enabling brief contact with the cathode. At the moment of electrical contact, a triggering spark is generated, initiating breakdown and the formation of a conductive plasma channel between the coaxial electrodes.
When the graphite rod comes into contact with the copper cathode, the resistance at the contact point drops sharply, nearly to zero. The charged capacitor begins to discharge through this contact point. Due to the quite small capacitance but relatively high voltage , the instantaneous current at the contact point can reach significant values within a microsecond timescale:
Due to the extremely small actual contact area (on the order of micrometers), the current density becomes extremely high: . As a result, instantaneous Joule heating occurs in the microscopic contact region. Within nanoseconds, the temperature at the point of contact can reach the melting point of copper and the sublimation (vaporization) temperature of graphite . This leads to a micro-explosion of the contact spot - a localized ejection of copper and carbon vapor into the discharge gap of the coaxial electrodes.
As the contact area heats locally and subsequently ruptures microscopically (due to material evaporation), a strong electric field develops across the gap [16]. Copper and graphite have relatively low work functions , which facilitates thermionic and field (auto-electronic) emission under these conditions. Electrons emitted from the heated surface are accelerated by the electric field between the main coaxial electrodes, forming a plasma current channel.
The resulting channel primarily contains copper ions (Cu+), carbon ions (C+), as well as electrons and neutral atoms. The forming current channel is accelerated by its own electromagnetic forces toward the open end of the anode-cathode system, generating a thrust impulse. The discharge efficiency depends on the parameters of the storage capacitors and the timing characteristics of the ignition pulse.
The physical interpretation of the spectrum (Figure 2) indicates that the main plasma component is carbon, present in both neutral (CI) and ionized (CII) forms, which is associated with the use of a graphite trigger electrode simultaneously serving as a solid propellant. Molecular carbon C₂ also makes a significant contribution to the emission, with its Swan band at 515.55 nm being formed in the plasma recombination zone or during incomplete ionization of the ablation products. The CuI lines (521.82 nm) indicate erosion of the copper electrodes under the action of the pulsed discharge, while the presence of the OI line (777.54 nm) points to impurities of neutral oxygen originating from the residual atmosphere of the vacuum chamber or desorbed from surfaces. The intensity ratio of the CI and CII lines shows that a substantial portion of the carbon remains in the neutral form, which is typical for pulsed ablative plasma thrusters with a moderate plasma temperature.
Vacuum conditions simulating the near-space environment are created using a vacuum chamber equipped with a pumping system capable of maintaining a throughput of Pa·m³/s at a pressure of 0.001 Pa.
Experiments were conducted with two design variants of the pulsed plasma thruster: initially with a graphite electrode, and subsequently with a tungsten igniter electrode. There were no differences in all other parameters, including energy and structural characteristics, as well as utilized diagnostic methods.
This work presents the development and testing of a compact solid-state pulsed plasma thruster, based on systematic experimental research utilizing a custom-designed pulsed plasma accelerator [17,18,19,20]. The results of these studies results in accumulation of substantial data on discharge physics and plasma acceleration, which is essential for the development of next level efficient pulsed plasma thrusters.Кoнец фoрмы
2.2. Experiments with the Graphite Electrode. Measurements of Pulsed Current and Voltage
To measure current and voltage, a Rogowski coil and a high-voltage voltage probe manufactured by Pintek were used. The discharge voltage and current were measured simultaneously to correlative study the oscillatory behavior of the thruster circuit with plasma observations. Typical example of the voltage and current oscillogram is shown in Figure 3.
The initial voltage level (t ≈ 0 μs) corresponds to the charge on the capacitor (1200 V) prior to the discharge. The presence of small high-frequency oscillations at the initial moment indicates the initiation of a trigger breakdown-an electric spark discharge between the trigger electrode and the cathode. In other words, the appearance of a steep current and voltage front excites high-frequency oscillations in the parasitic LC circuit of the setup (including the inductance of the conductors and the capacitance between the electrodes).
Then a sharp voltage drop to nearly zero, and in some cases even to negative values, is observed in the interval from 0 to 4 μs. This indicates the formation of an ionized conductive plasma channel between the coaxial electrodes. At this moment, the plasma channel becomes electrically conductive, and most of the energy stored in the capacitor is transferred into the discharge. The sharp voltage drop is caused by a rapid decrease in the resistance of the forming channel in the gaseous medium.
The oscillatory decay of the voltage is explained by the reactive properties of the circuit such as inductance and capacitance-as well as the dynamics of the plasma state. The secondary peak observed around 7 μs may be due to the wave reflections in the circuit, instabilities in the discharge plasma, or parasitic resonances.
The gradual attenuation of the voltage to values close to zero indicates the end of the discharge process, the collapse of the plasma channel, and the dissipation of the residual energy in the circuit elements.
Shorting the trigger electrode to the cathode generates an initial spark (t ≈ 0-0.5 μs), accompanied by a sharp current increase. This peak indicates the formation of instantaneous conductive channel between the coaxial electrodes. The pulsed discharge current increases rapidly as a result of gas ionization. The current then reverses direction and reaches a positive maximum of approximately 860 A, which is a characteristic feature of a damped oscillatory process in a circuit containing capacitance, inductance, and the variable resistance of the plasma channel. This maximum reflects the process of charge redistribution and current reversal through the inductive element.
Subsequently, damped oscillations with decreasing amplitude are observed, caused by transient processes in the plasma arc. These reflect both the resonant properties of the circuit and dynamic instabilities in the plasma, which begins to dissipate. At t > 15 μs, the current gradually decays and the oscillations vanish, indicating the collapse of the plasma channel and the end of the discharge process. The residual currents have low amplitude and do not significantly affect the overall energy balance of the system.
Thus, the current waveform corresponds to the behavior of an RLC circuit with variable resistance, where the plasma channel acts as a nonlinear resistive-inductive element. The high current amplitudes are explained by the low resistance of the ionized channel and the significant initial energy stored in the charged capacitor. The rapid damping is due to the increase in plasma resistance as it cools and subsequently decays.
High-frequency oscillations are absent in the current oscillogram, which can be attributed to the following reasons: physically, the current is smoothed by the plasma channel and the inductance of the circuit; from a measurement standpoint, the Rogowski coil poorly detects fast oscillations; the voltage (especially at the input) remains sensitive to high-frequency interference and transients.
The power oscillogram shown in Figure 4 was obtained by point by point multiplication of current and voltage data over time from the previous oscillograms.
In the time interval of t ≈ 0-0.5 μs, a sharp instantaneous negative power value (up to 1.7 MW) is observed, indicating a rapid release of energy in the form of electrical power caused by the trigger breakdown. At this moment, an ionized conductive channel is formed, accompanied by a sharp rise in current under high voltage.
A numerical calculation of the area under the instantaneous power curve was performed in the range from 0 to 4 μs (indicated by the arrowed line on the graph). As a result of the integration, the energy transferred to the load in the form of a current pulse through the plasma channel was determined to be . At the same time, the initial energy stored in the capacitor is:
Energy transfer efficiency:
This is a relatively low value, which may be attributed to:
- significant losses due to resistance, inductance, and parasitic elements in the circuit;
- non-ideal channel formation (partial shunting);
- transient processes and damped oscillations that absorb part of the energy.
2.3. Ballistic Pendulum. Thrust Characteristics of the Plasma Thruster
The thrust characteristics of the pulsed plasma thruster were determined using a ballistic pendulum. One example of the experimental procedure and the calculation algorithm is provided below. Figure 5 shows four consecutive frames demonstrating the deflection of the pendulum caused by a plasma thrust impulse.
The presented images were extracted from a video recorded using a smartphone at a frame rate of 25 frames per second.
The impulse bit is determined based on the ballistic pendulum data using the following formula [21]:
where is the mass of the pendulum, is the length of the suspension, is the gravitational acceleration, and is the amplitude of the pendulum deflection, taken from the representative image in Figure 4. Thus, the calculated impulse bit of 7.7 μN·s indicates the amount of momentum transferred from the plasma microthruster to the pendulum as a result of a single discharge.
A series of experiments was carried out to determine the dependence of the impulse bit on the capacitance of the energy storage capacitor connected to the igniter electrode. The voltage on the main capacitor was kept constant at a maximum of 1400 V throughout all experiments. The measurement results are presented in Table 1.
The capacitance of the igniter capacitor determines the amount of energy delivered to the spark igniter discharge, thereby influencing the characteristics of the formation and initial development of the plasma channel. An increase in leads to higher energy in the trigger discharge, which can alter the structure of the "pre-plasma" and affect the efficiency of acceleration in the main discharge current channel.
The analysis shows that increasing the results in a decrease in the impulse bit, indicating a degradation in the thrust performance of the PPT. A higher capacitance of the igniter capacitor leads to a reduction in thrust, which is associated with excessive energy in the trigger spark discharge. The energy released in the spark gap increases at higher values,, forming a wide and unstable "pre-plasma" before the main breakdown between the coaxial electrodes. This "pre-plasma" partially shields the electric field of the main channel, thereby reducing the efficiency of the acceleration process.
In addition, the premature formation of an ionized channel leads to a leakage of part of the current before the main discharge occurs. As a result, the primary energy of the storage capacitor is spent not on formation and acceleration of plasma jet, but on heating and expanding the already existing ionized gas. This does not contribute to useful reactive thrust.
With a high-energy igniter pulse, the likelihood of parasitic current paths increases. This phenomenon pronounced when the interelectrode gap is small, which further reduces the current load on the main acceleration channel. Thus, excessive energy in the igniter discharge negatively affects the efficiency of thrust generation. At the same time, reducing the capacitance of the igniter capacitor promotes a more energy-efficient operating mode of the PPT.
2.4. Measurement of Plasma Particle Velocity Using the Time-of-Flight Method
The Time-of-Flight (TOF) method is utilized to measure the velocity of the plasma flow. For that, two double probes (paired metal contacts) placed along the exhaust axis [22]. The first probe (Probe 1) was installed at a distance of 36 mm from the edge of the thruster’s outer electrode, and the second probe (Probe 2) at a distance of 80 mm from the same edge. Thus, the distance between the probes was 44 mm.
Each probe is a double probe consisting of two tungsten tips, 2 mm in length, placed 1.5 mm apart. The tips are connected in series with a 50 Ω resistor and a 3.7 V battery. When plasma charges pass between the tips, a current flow driven by the voltage from battery, and pass through the resistor. The voltage drop across the resistor is recorded using an oscilloscope. The design and operating principle of the second probe are identical to the first. As a result, the oscilloscope captures two signals from the two probes. One of the recorded signals is shown in Figure 6.
The movement of the plasma beam front along the axis can be clearly identified from the graph in Figure 5. The time delay between the signal peaks is 1.65 μs, which makes it reliable to determine the velocity of the plasma front.
In the 0 - 1.4 μs range, initial fluctuations are observed. High-frequency noise is present, caused by the ignition discharge and the formation of the initial plasma phase. This is an unstable transient process. At this stage, the probe does not yet detect a stable flow of charged particles.
Following the noise, both signals show no significant deviation from zero. This corresponds to the delay between the moment of plasma formation and its arrival in the probe region - meaning that the plasma has not yet reached the probes. The first deviation appears on the red trace (the probe located closer to the source). This indicates that the plasma flow front has reached the first probe. A current arises due to the plasma charge, and recorded as an increase in negative voltage.
The red curve (first probe) reaches its minimum value at about ~5.7 μs. The blue curve (second probe) reaches its minimum 1.65 μs later, i.e., at about 7.35 μs. This delay Δt = 1.65 μs indicates the time of flight of the plasma front between two probes. From this, the velocity can be calculated:
Later, both curves gradually decrease, which corresponds to a decline in the flux density. The plasma front has already passed the probe zones, and the residual tail may be associated with scattered or slow ions/electrons. A comparison of amplitudes shows that the beam density decreases with distance, as expected due to charge scattering and particle recombination.
After conducting multiple experiments at the maximum energy parameters, the average plasma flow velocity was found to be . This velocity range is typical for small, pulsed plasma thrusters operating on solid propellant and corresponds to characteristic values that ensure efficient conversion of discharge energy into the kinetic energy of the exhaust.
2.5. Faraday Cylinder
To analyze the ion beams, a Faraday cylinder (FC) device was used. The FC was installed along the axis of plasma acceleration flow at a distance of 40 mm from the edge of the microthruster electrodes. The Figure 7 shows the classical schematic diagram of a Faraday cylinder with a retarding system (screen). The collector (inner electrode) serves to collect ions that have passed through the screen aperture.
The diameter of the aperture in the grid is 180 μm, corresponding to an effective entrance area of .
A resistor R with a resistance of 50 Ω is used for signal acquisition and the voltage drop across it is proportional to the ion current:
The low resistance ensures good matching with the oscilloscope input (50 Ω).
A capacitor C=200 nF is used as a coupling (DC-blocking) element, which is particularly important when an external bias is applied. It passes the AC component of the signal while blocks the DC component, a negative bias ε is applied to the collector through a resistor Rb of 1 MΩ to decelerate low-energy ions. This forms an energy filter.
This makes it possible to study the ion energy distribution. An example of oscilloscope traces from the Faraday cup is shown in Figure 8.
As can be seen from the graph, the high-frequency noise is observed at the initial time spot, immediately after ignition (emission). , This is associated with electromagnetic interference from the discharge, as well as with leakage currents and parasitic capacitances. In addition, there may be an influence from induced currents in the shields, connecting wires, and the installation housing.
After the noise phase ends, in the time interval of approximately 0.5-1.3 µs, a small positive signal is recorded on all three curves. It is presumably associated with the motion of high-energy ions or accelerated gas fragments generated at the moment of ignition. This signal is unstable in shape and small in amplitude; however, it is reproducible, which indicates the stable nature of the phenomenon. The main ion front is recorded starting at about ~1.36 µs. The sudden rise in the signal indicates the arrival of positive ions at the collector of the Faraday cup. Using these data, the ion front velocity was determined by the time-of-flight (TOF) method:
After reaching its peak, the signal gradually decreases, which is typical for an ion beam with an energy distribution. The broad shape of the peak indicates that ions do not arrive simultaneously but with different time-of-flight values, which is characteristic of microthrusters operating in a pulsed mode.
As the magnitude of the negative bias voltage increases, the signal amplitude, current, current density, and ion beam density also increase. This is due to more efficient extraction of positive ions as a result of the enhanced electric field in the collector region.
Furthermore, the calculation results for various bias voltages make it possible to determine the key parameters of the plasma flow, including the ion current amplitude and its dependence on the applied field, see Table 2.
As is well known, the problem of charring (carbonization) [23] in ablative PPTs is one of the critical technological challenges that significantly affect thruster efficiency, lifetime, and stability of thrust characteristics. Similar to most ablative PPTs, the design under consideration also uses graphite as a propellant-. Unlike conventional ablative PPTs, in our case the propellant is formed during the electrical contact of the graphite electrode with the grounded electrode. Furthermore, at the initial stage of electrical contact, a spark discharge occurs with the emission of seed electrons, which facilitates the development of an electron avalanche and the subsequent formation of the discharge -plasma channel.
During electrical discharge, the pulse energy causes local heating and evaporation of the propellant surface material. The resulting plasma is accelerated by electromagnetic forces and thermal expansion of the heated gas, generating thrust. However, during prolonged operation, incomplete thermal decomposition of the propellant occurs. Instead of complete evaporation and ionization, carbon particles, resins, and other organic residues accumulate on the propellant surface, a phenomenon known as charring.
Figure 9 shows a photograph of the graphite electrode after prolonged thruster operation. Pronounced erosion of the working surface of the electrode is clearly visible.
As a result of charring, the electrical resistance in the contact ignition area increases, leading to unstable conduction of the main discharge. This, in turn, reduces the specific impulse and thrust, since the amount of ionized propellant decreases and the impulse of the plasma jet drops, which manifests itself as a degradation of the thrust performance.
In this regard, it becomes necessary to search for alternative materials. The igniter electrode must meet two main requirements: high electrical conductivity and resistance to adhesion to the copper electrode during electrical contact.
To meet these requirements, tungsten was selected as the igniter electrode in the present study. This material is characterized by a high melting point, stable electrophysical properties, and a low likelihood of forming strong interfacial bonds with copper, which significantly reduces the risk of contact welding.
Table 3 presents a comparative description of the material pairs used in the electrical contact area during the operation of a pulsed plasma thruster.
2.6. Experiments with the Tungsten Electrode
This section employs the same diagnostic methods for investigating the parameters of the pulsed plasma thruster as described above; therefore, only certain distinctive aspects will be considered in detail.
Typical example of the current and voltage oscillogram is shown in Figure 9.
As can be seen from Figure 10, at approximately ~0.2-0.5 µs an electrical breakdown of the interelectrode gap occurs, accompanied by a sharp drop in voltage and a rapid rise in current. The decrease in the resistance of the plasma channel initiates an intensive capacitor discharge. Due to the low inductance and capacitance of the discharge circuit, as well as the low resistance of the channel, the current rises within microseconds.
The oscillogram shape shows characteristic features of an oscillatory discharge with low damping at the initial stage, determined by the parameters of the discharge circuit and the dynamics of the plasma channel. This allows the timing features of the voltage and current curves to be correlated with the sequence of physical processes in the pulsed plasma thruster.
In the final stage (> 8 µs), both voltage and current tend toward zero. At this time spot, the plasma channel enters the recombination and cooling phase. During this time period particle acceleration virtually ceases, and the residual voltage on the electrodes is associated with the remaining charge on the capacitor and inductive effects in the circuit [24,25].
2.7. Thrust Characteristics of the Plasma Thruster with a Tungsten Electrode
The experimental determination of the thrust characteristics of the plasma microthruster equipped with a tungsten electrode was carried out using a ballistic pendulum.
Figure 11 presents one of the typical results from the series of experiments conducted.
Comparison of the obtained data with the results of previous tests performed using a graphite electrode shows no significant differences in the magnitude or nature of the thrust characteristics.
2.8. Plasma Flow Velocity
The plasma flow velocity generated by the pulsed discharge thruster with a tungsten igniter electrode was determined using the time-of-flight (TOF) method. One of the resulting oscillograms is shown in Figure 12. The data were averaged based on the results of a series of repeated experiments.
From the graphs, it can be seen that at the initial moment both probes register noise caused by the short circuit of the trigger electrode to the grounded anode. Nevertheless, the signal shape clearly captures the passage of the plasma plume front along the axis[26]. The time interval between the signal peaks is 2.1 µs, which corresponds to a plasma front propagation velocity of .
Compared to the results obtained using a graphite trigger electrode, the signal amplitude from both probes turned out to be 7-8 times lower. This may be due to two main reasons: (1) an initially lower concentration of charged particles in the plasma flow; (2) enhanced scattering and recombination of charges during acceleration.
The signals recorded by the Faraday cup from the plasma plume of the pulsed thruster with a tungsten trigger electrode differ significantly from those obtained with a graphite electrode.
Numerous experiments were conducted, and one of the averaged results is shown in Figure 13.
The time evolution of the signal can be interpreted as follows:
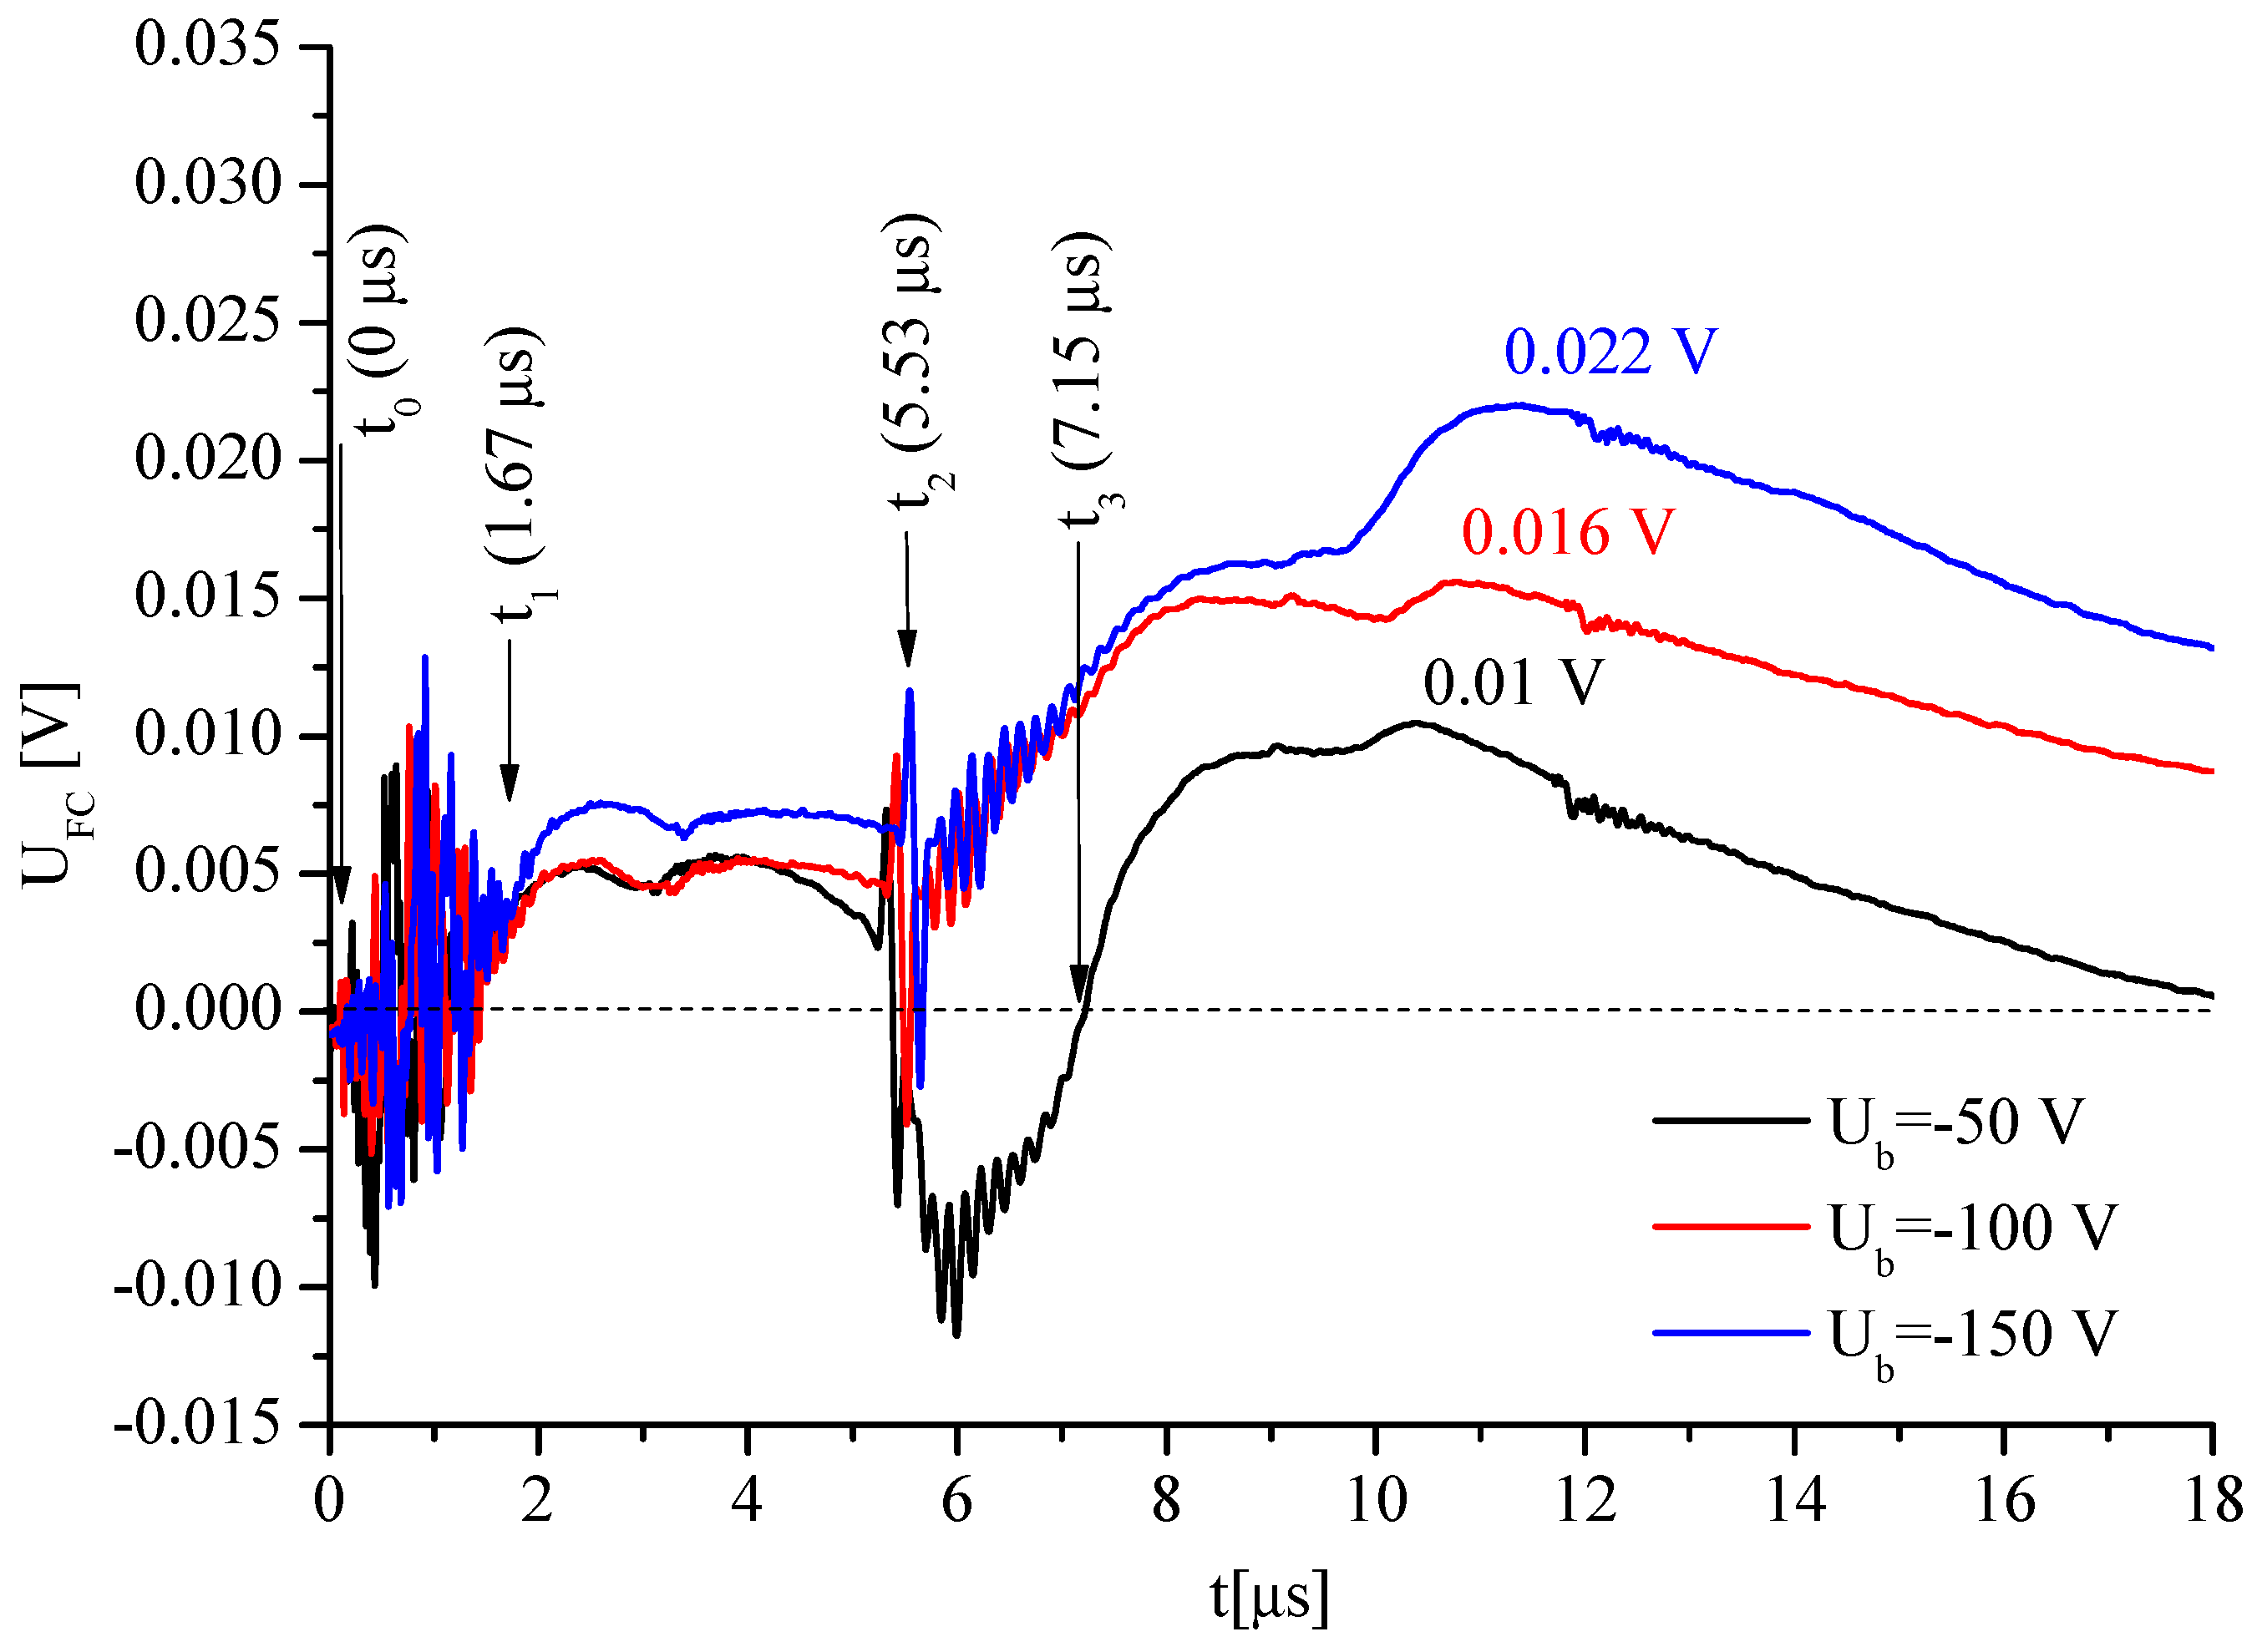
At the initial moment, a prolonged high-frequency noise is observed (t₁−t₀=1.67 μs).It corresponds to the onset of the seed discharge and caused by the operation of the trigger electrode,
After the high-frequency noise from the trigger electrode ends (t1), the signal becomes “positive” and maintains this value until the arrival of the main plasma front (t2). The positive polarity indicates that during this period, «positively charged particles» are reaching the Faraday cylinder collector. This is likely associated with an early ion front formation: the plasma cloud formed immediately after triggering, part of the positive ions is accelerated toward the collector by local electric fields. These ions travel faster than the main plasma cloud, for example, due to pre-acceleration within the discharge. This is essentially a «precursor» of the main flow, indicating that the plasma channel has already begun to form and that the first ions have reached the collector.
In [27], it was established that an unbiased Faraday probe registers an initial negative signal when the plasma bridge appears, caused by electron collection., This followed by a sharp rise in the positive signal upon ion arrival. It is assumed that their acceleration has an ambipolar nature. The ion front arrival time is used to determine their velocity by the time-of-flight method.
In our case, during the screened Faraday cylinder detection, fast ions are detected from the time spot where the plasma channel forms, while electrons are shielded and do not reach the collector.
At t2, plasma particles begin to reach the Faraday cylinder collector, causing fluctuations and the onset of signal growth. Its amplitude depends on the type of charged particles. For example, at a low screening voltage (), fast electrons-despite the presence of the screening field-still reach the collector, which is reflected in the black curve. At −100 V and −150 V, the field is strong enough to suppress this electron flux, so the signal remains positive (ion-dominated).
In the time interval t₂ − t₁ = 3.86 μs, an interelectrode plasma channel forms, which -covers the 65 mm distance from the trigger electrode to the Faraday cylinder collector during the acceleration. This corresponds to an average plasma front velocity of .
The calculation results for different bias voltages are shown in Table 4.
3. Results
The conducted studies have shown that the type of the trigger electrode material has a significant impact on the performance characteristics of a pulsed plasma thruster (PPT), both in terms of plasma formation and operational reliability. A comparison of two design options, with graphite and tungsten trigger electrodes, demonstrated that graphite provides higher ion current values and a greater concentration of charged particles. But note that it is accompanied by intense carbonization of structural components.
For graphite electrodes Faraday cup measurements established that the maximum ion current is at .This corresponds to an ion current density of and an ion concentration of at an ion velocity of . For the tungsten electrode, these values are much lower: maximum ion current ≈0.44 mA, current density , ion concentration at an ion velocity of .
Ballistic measurements showed that the impulse bit is practically the same for both graphite and tungsten electrodes. However, long-term operation revealed that the tungsten electrode is almost completely resistant to sticking to the copper anode and retains the geometry of its working surface. While for the same conditions graphite promotes the formation of carbon deposits on insulators, which degrades electrical conductivity and launch stability.
It should be noted that the consumption of graphite electrode practically absent, i.e., it does not undergo noticeable erosion. In this case, the cathodic copper electrode acts as the propellant, which leads to a reduction in the charged particle density in the plasma flow compared to the graphite electrode.
Thus, graphite is advisable for applications requiring maximum thrust at a relatively short thruster lifetime, for example, in short-term missions. Tungsten is preferable for long-term applications where stability of characteristics and service life are critical, even at the cost of some reduction in energy efficiency. Furthermore, the investigation of the thruster’s characteristics with a tungsten trigger electrode revealed the following: since tungsten is almost not consumed during thruster operation, this opens the possibility of developing a new thruster design with a fundamentally different cathode geometry, which would simultaneously serve as a solid propellant. However, these studies are planned for the subsequent stages of the current research project.
Overall, the use of graphite as a propellant provides a high sublimation temperature and resistance to erosion; however, it is accompanied by the formation of carbon deposits in the vicinity of the electrical contact, which may reduce dielectric strength over time. In addition, the presence of moving components and mechanical contact complicates the design and introduces a risk of failures during long-term operation. Nevertheless, the proposed configuration ensures higher pulse repeatability, potentially improved collimation of the plasma jet, and the possibility of fine-tuning discharge parameters, making it a promising direction for the development of a new type of pulsed plasma thruster.
Author Contributions
Conceptualization and writing original draft preparation: M.D. and Zh.I.; methodology: Zh.I. and A.S.; supervision: M.D.; data curation: M.D., Zh.I. and Y.U.; writing—review and editing supported by M.D., Zh.I. T.A., A.S. and Y.U.; funding acquisition: M.D. and T.R. All authors have read and agreed to the published version of the manuscript.
Funding
This research was funded by the Committee of Science of the Ministry of Science and Higher Education of the Republic of Kazakhstan (Grant No. AP19576858).
Institutional Review Board Statement
Not applicable.
Informed Consent Statement
Not applicable.
Data Availability Statement
The original contributions presented in the study are included in the article; further inquiries can be directed to the corresponding author.
Conflicts of Interest
The authors declare no conflicts of interest.
References
- Yueh-Heng Li, Jun-You Pan, Georg Herdrich. Design and demonstration of micro-scale vacuum cathode arc thruster with inductive energy storage circuit // Acta Astronautica Volume 172, July 2020, Pages 33-46. [CrossRef]
- Maciej Jakubczak, Arsenii Riazantsev et al. Design and performance of a 1 J ablative pulsed plasma thruster fed with non-volatile liquid propellant. Acta Astronautica. Vol. 228, 2025, Pp. 813-827. [CrossRef]
- Zhiwen WU., Tiankun HUANG., Xiangyang LIU., William Yeong Liang LING., Ningfei WANG and Lucheng JI. Application and development of the pulsed plasma thruster. Plasma Sci. Technol. 22 (2020) 094014 (14pp). [CrossRef]
- Tianyi Hu, Zhiwen Wu et al. Study on the influence of ignitor position on a coaxial pulsed plasma thruster. Vacuum 218(1), 2023, P. 112644. [CrossRef]
- Zhe Zhang, Felix Schäfer et al. Investigation on operational stability of a pulsed plasma thruster with a pressure probe. Acta Astronautica. Vol. 197, 2022, Pp. 60-68. [CrossRef]
- Tianyi Hu, Zhiwen Wu et al. Propellant Surface Evolution of a Coaxial Pulsed Plasma Thruster. Journal of Propulsion and Power. Vol. 39(9). Pp. 1-7. 2022. [CrossRef]
- Hao Fu, Zhiwen Wu, Tiankun Huang, Tianyi Hu, Song Zhang. Influences of initial voltage and electrode size on propellant surface evolution in a coaxial pulsed plasma thruster. Acta Astronautica. Vol. 222, 2024, Pp. 573-585. [CrossRef]
- M. M. Abo El-Hadeed, M. E. Abdelkader, F. B. Diab, M. A. Abd Al-Halim. Investigation of a coaxial pulsed plasma thruster by electrothermal discharge in Teflon propellant. CEAS Space J (2025). [CrossRef]
- Zhe Zhang, William Yeong Liang Ling, Haibin Tang, Jinbin Cao, Xiangyang Liu, Ningfei Wang,A review of the characterization and optimization of ablative pulsed plasma thrusters. Reviews of Modern Plasma Physics. Vol. 3(1), 2019. [CrossRef]
- Rui Zhang, Zhiqiang Tian, Wenxiong Xi and Dongjing He. Discharge Characteristics and System Performance of the Ablative Pulsed Plasma Thruster with Different Structural Parameters. Energies 2022, 15, 9389. [CrossRef]
- Zhang Zhe, Junxue Ren et al. Inter-electrode discharge of an ablative pulsed plasma thruster with asymmetric electrodes. Plasma Sources Science and Technology. Vol. 27(12). [CrossRef]
- Tiankun Huang, Zhiwen Wu, Guorui Sun, Xiangyang Liu, William Yeong Liang Ling. Study and modeling of propellant ablation in coaxial ablative pulsed plasma thrusters. Acta Astronautica. Vol. 173, 2020, Pp. 69-75. [CrossRef]
- William Y.L., Song Z., et al. A brief review of alternative propellants and requirements for pulsed plasma thrusters in micropropulsion applications. Chinese Journal of Aeronautics, (2020), 33(12): 2999–3010. [CrossRef]
- Linghan Zeng, Zhiwen Wu, Guorui Sun, Tiankun Huang, Kan Xie, Ningfei Wang. A new ablation model for ablative pulsed plasma thrusters. Acta Astronautica Vol. 160, 2019, Pp. 317-322. [CrossRef]
- M.K. Dosbolayev, Zh.B. Igibayev, A.B. Tazhen, and T.S. Ramazanov. Preliminary Study of the Solid-State Pulsed Plasma Thruster Model with Graphite as а Propellant // Plasma Physics Reports, 2022, Vol. 48, No. 3, pp. 263–270. [CrossRef]
- Hiroyuki Koizumi, Ryosuke Noji, Kimiya Komurasaki, Yoshihiro Arakawa; Plasma acceleration processes in an ablative pulsed plasma thruster. Phys. Plasmas 1 March 2007; 14 (3): 033506. [CrossRef]
- Dosbolayev M.K., Utegenov A.U., Tazhen A.B., Ramazanov T.S. Investigation of dust formation in fusion reactors by pulsed plasma accelerator // Laser and Particle Beams. – 2017. – Vol. 35. – No. 4. – P. 741-749. [CrossRef]
- Tazhen A.B., Rayimkhanov Zh.R., Dosbolayev M.K., T.S. Ramazanov. Generation and Diagnostics of Pulse Plasma Flows // Plasma Physics Reports. – 2020. – Vol. 46. – No. 4. – P. 465-471. [CrossRef]
- Tazhen A.B., Dosbolayev M.K., Ramazanov T.S. Investigation of self-generated magnetic field and dynamics of a pulsed plasma flow // Plasma Sci. Technol. – 2022. – Vol. 24. – P. 055403 (8pp). [CrossRef]
- Dosbolayev M.K., Tazhen A.B., Kholmirzayev A.N., Ussenov Y.A., Ramazanov T.S. Studies of the formation and distribution of cracks and various defects on the heated tungsten plate surface during pulsed plasma flux impact // Nuclear Materials and Energy (SJR 1.184), 2023. – Vol. 37. – P. 101540 (9 pp). [CrossRef]
- K. Aheieva, K. Toyoda, and M. Cho. Vacuum Arc Thruster development and testing for micro- and nanosatellites // Trans. JSASS Aerospace Tech. Japan, 2016, Vol. 14, No. 30, pp. Pb91-Pb97. [CrossRef]
- N. Talukdar, A. Ahmed, S. Borthakur, N.K. Neog, T.K. Borthakur, and J. Ghosh. Measurement of plasma stream velocity in a pulsed plasma accelerator. Phys. Plasmas. Vol. 26, 062711-1-7. 2019. [CrossRef]
- Keidar, M.; Boyd, I.D.; Antonsen, E.L.; Gulczinski, F.S.; Spanjers, G.G. Propellant Charring in Pulsed Plasma Thrusters. J. Propuls. Power 2004, 20, 978–984. [CrossRef]
- Glascock, M.S.; Rovey, J.L.; Polzin, K.A. Electric Solid Propellant Ablation in an Arc Discharge. J. Propuls. Power 2019, 35(5), 984–993. [CrossRef]
- Keidar, M.; Zhuang, T.; Shashurin, A.; Teel, G.; Chiu, D.; Lukas, J.; Haque, S.; Brieda, L. Electric Propulsion for Small Satellites. Plasma Phys. Control. Fusion 2015, 57 (1), 014005. [CrossRef]
- Patel, A.R.; Zhang, Y.; Shashurin, A. Liquid-Fed Pulsed Plasma Thruster with Low-Energy Surface Flashover Igniter for Propelling Nanosatellites. J. Propuls. Power 2020, 36(5), 715-720. [CrossRef]
- William Yeong Liang Ling, Zhe Zhang, Haibin Tang, Xiangyang Liu and Ningfei Wang. In-plume acceleration of leading-edge ions from a pulsed plasma thruster. Plasma Sources Sci. Technol. Vol. 27. 2018. P. 104002 (6pp) . [CrossRef]
Figure 1.
(a) Photo and (b) schematic diagram of the pulsed plasma thruster. 1-Anode; 2-Graphite electrode; 3-Electromagnet; 4-Capacitor; 5-High voltage source; 6-Rogowski coil. The height of the figure is 90 mm.
Figure 1.
(a) Photo and (b) schematic diagram of the pulsed plasma thruster. 1-Anode; 2-Graphite electrode; 3-Electromagnet; 4-Capacitor; 5-High voltage source; 6-Rogowski coil. The height of the figure is 90 mm.
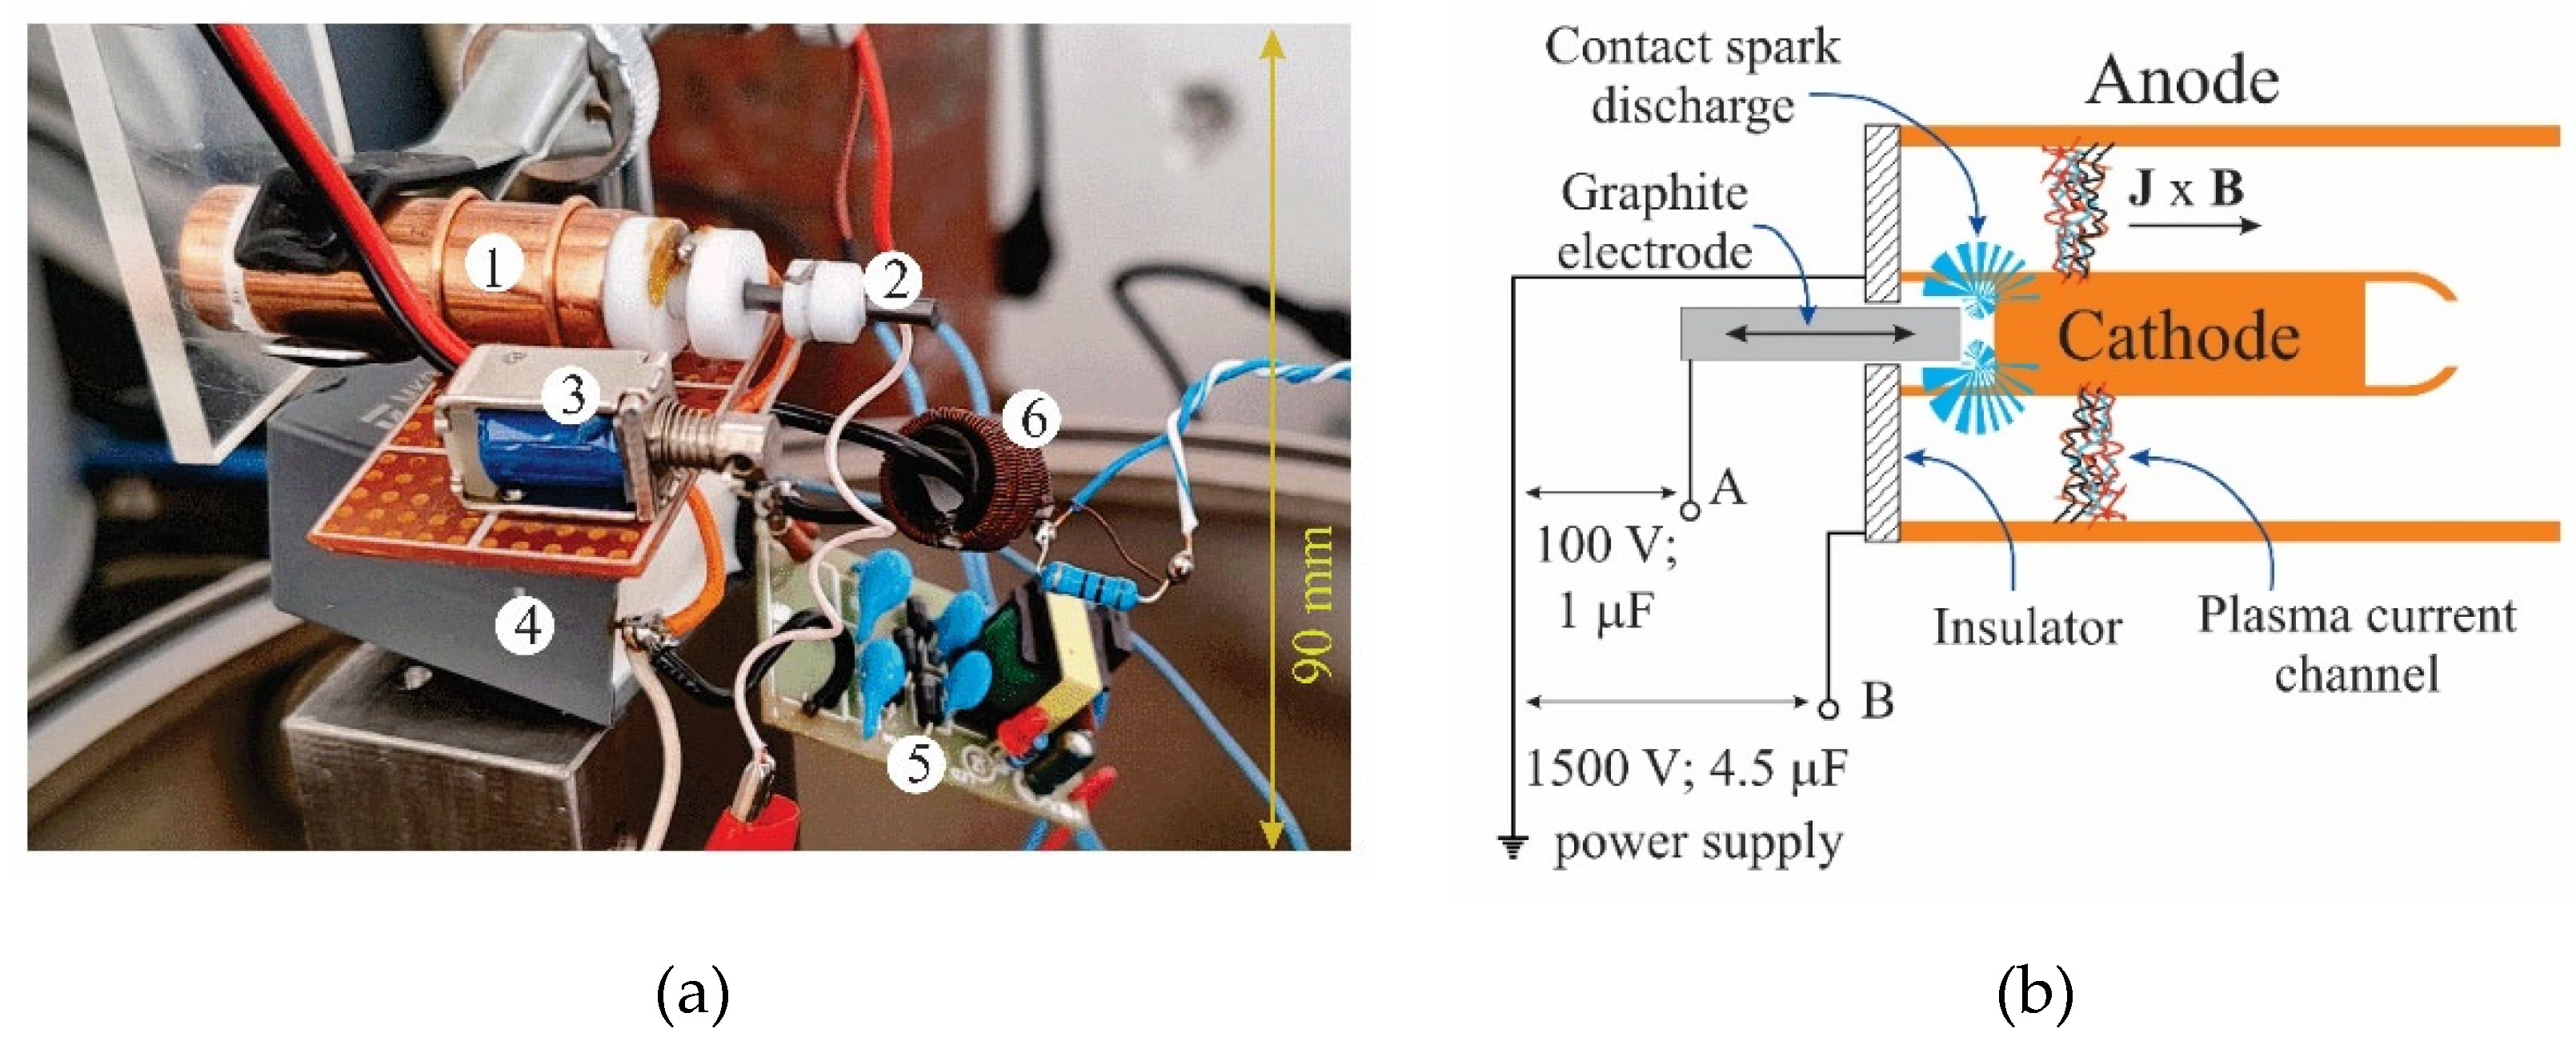
Figure 2.
Optical emission spectrum of the plasma plume at U = 1.4 kV and p = 4 × 10⁻⁴ Pa.
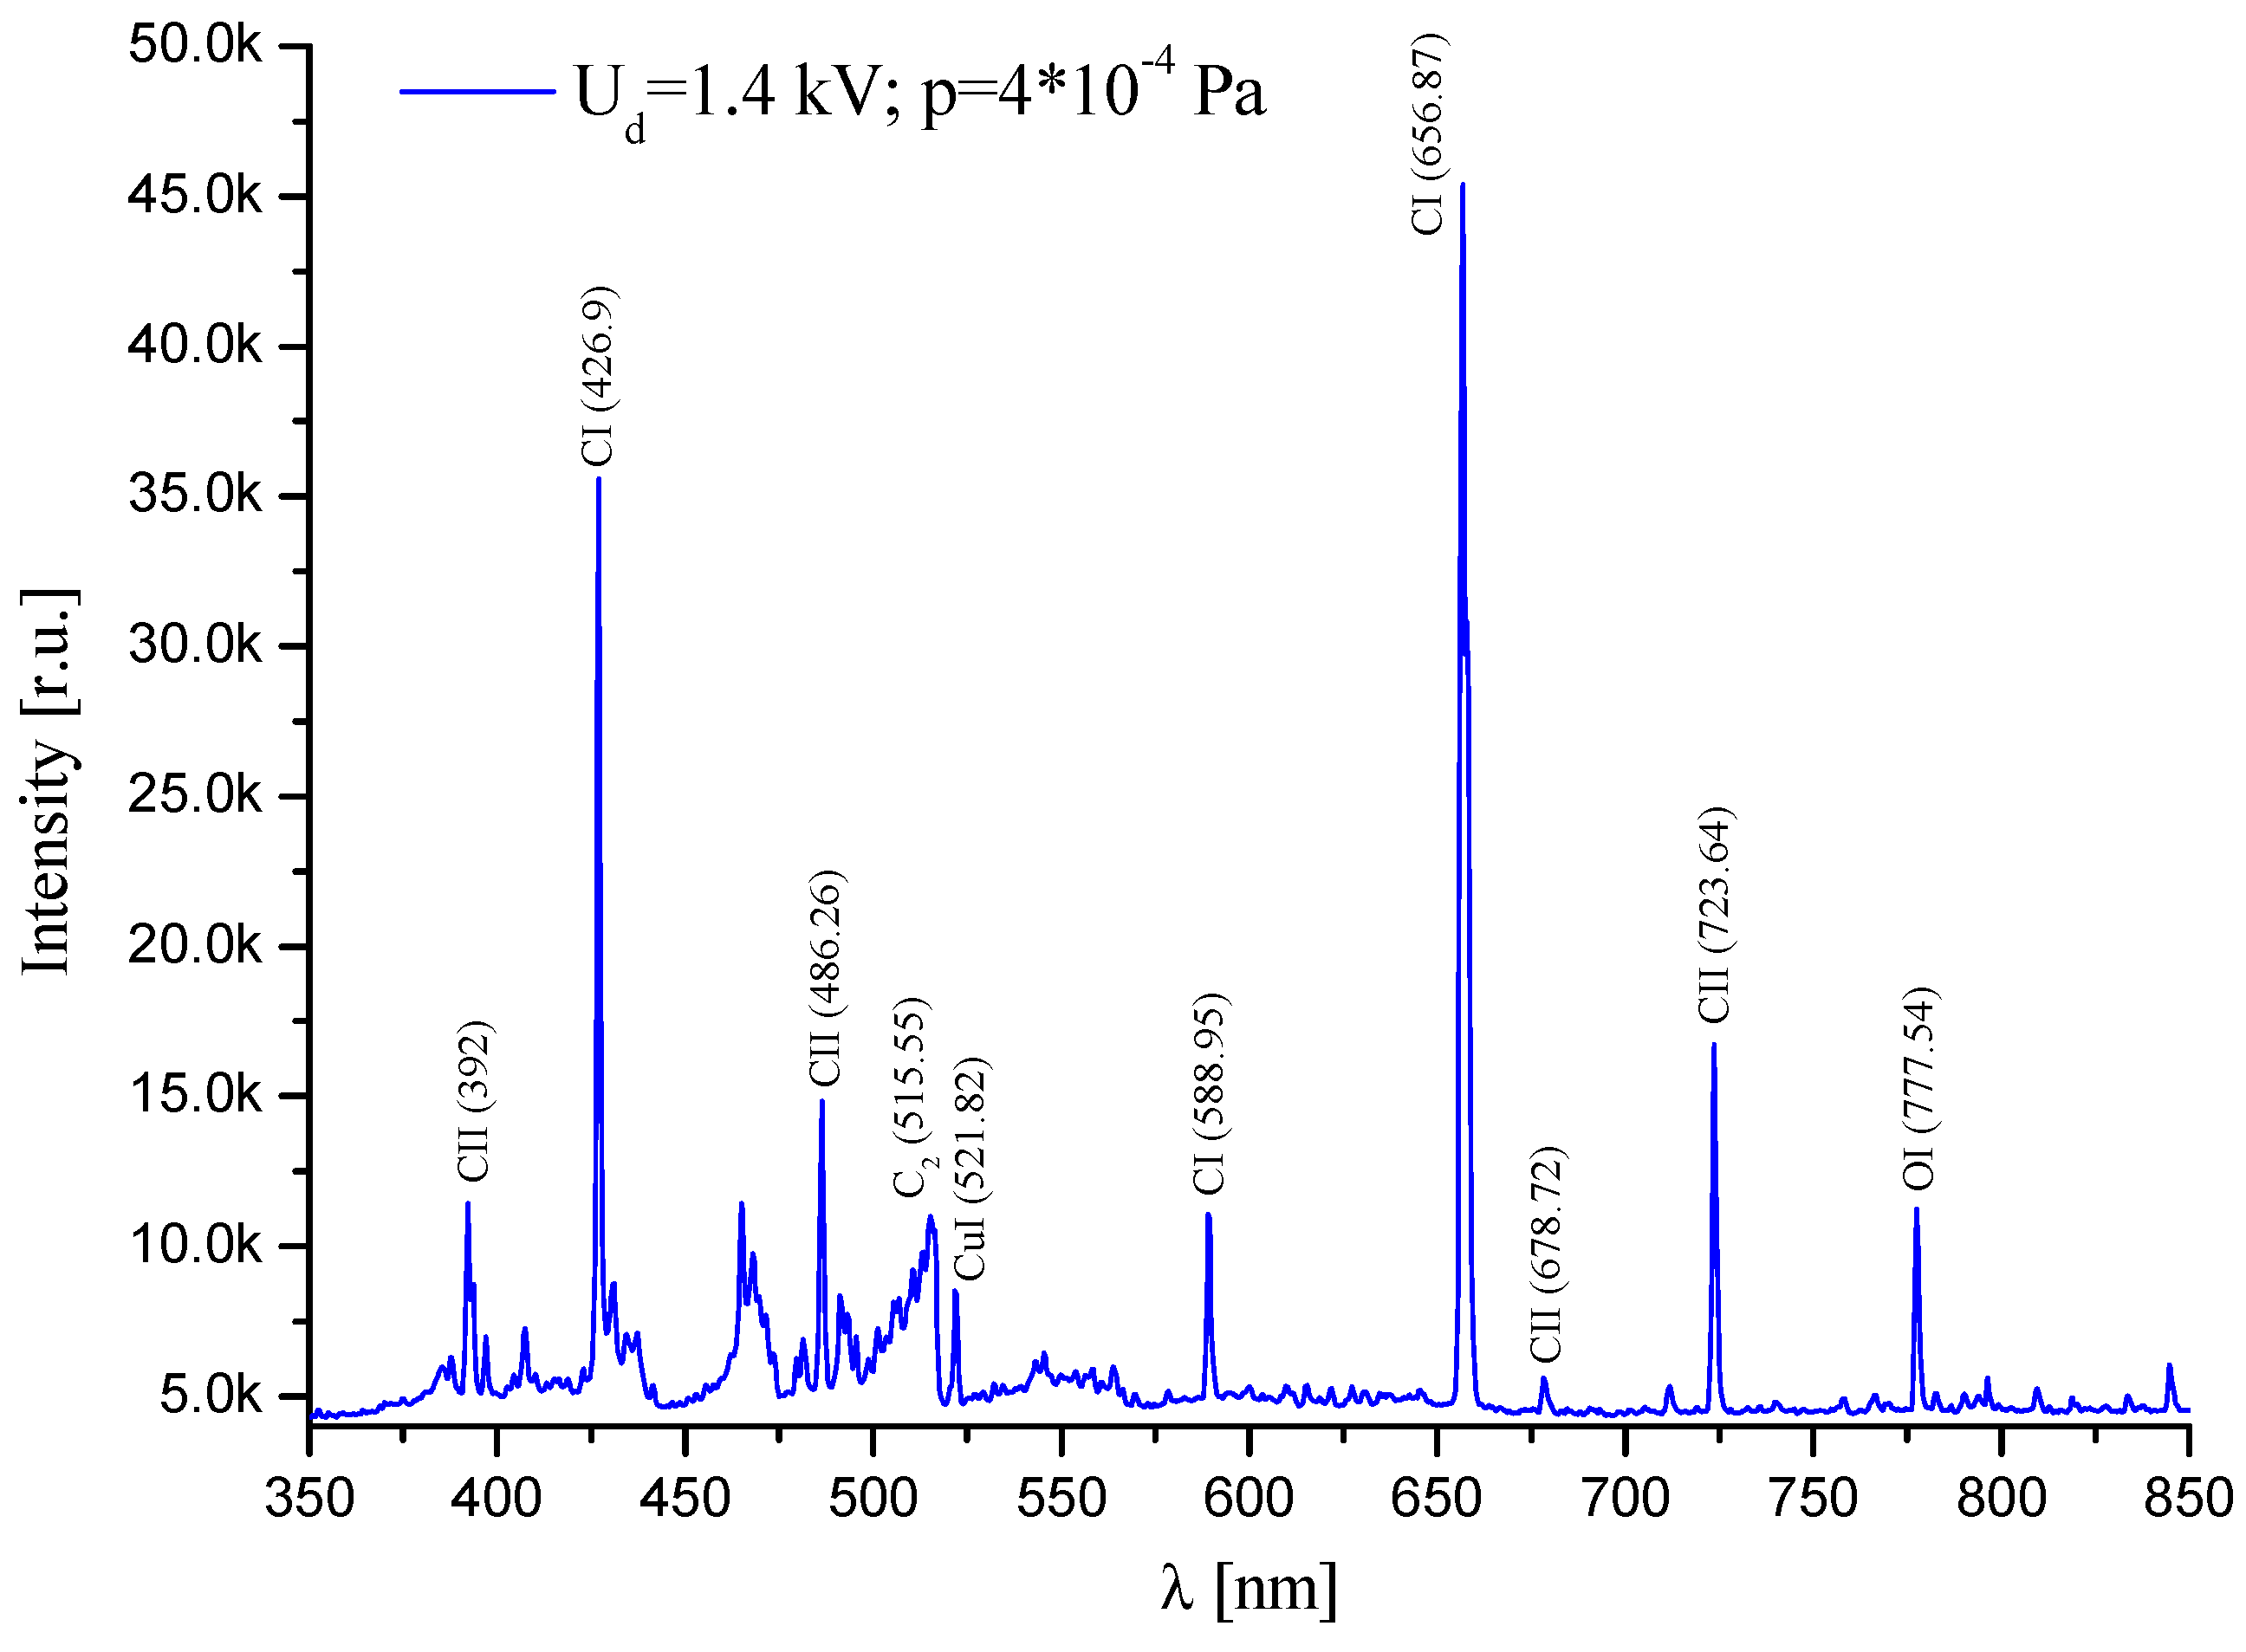
Figure 3.
Oscillograms of the discharge pulse current and voltage at an initial accelerating voltage of 1200 V.
Figure 3.
Oscillograms of the discharge pulse current and voltage at an initial accelerating voltage of 1200 V.
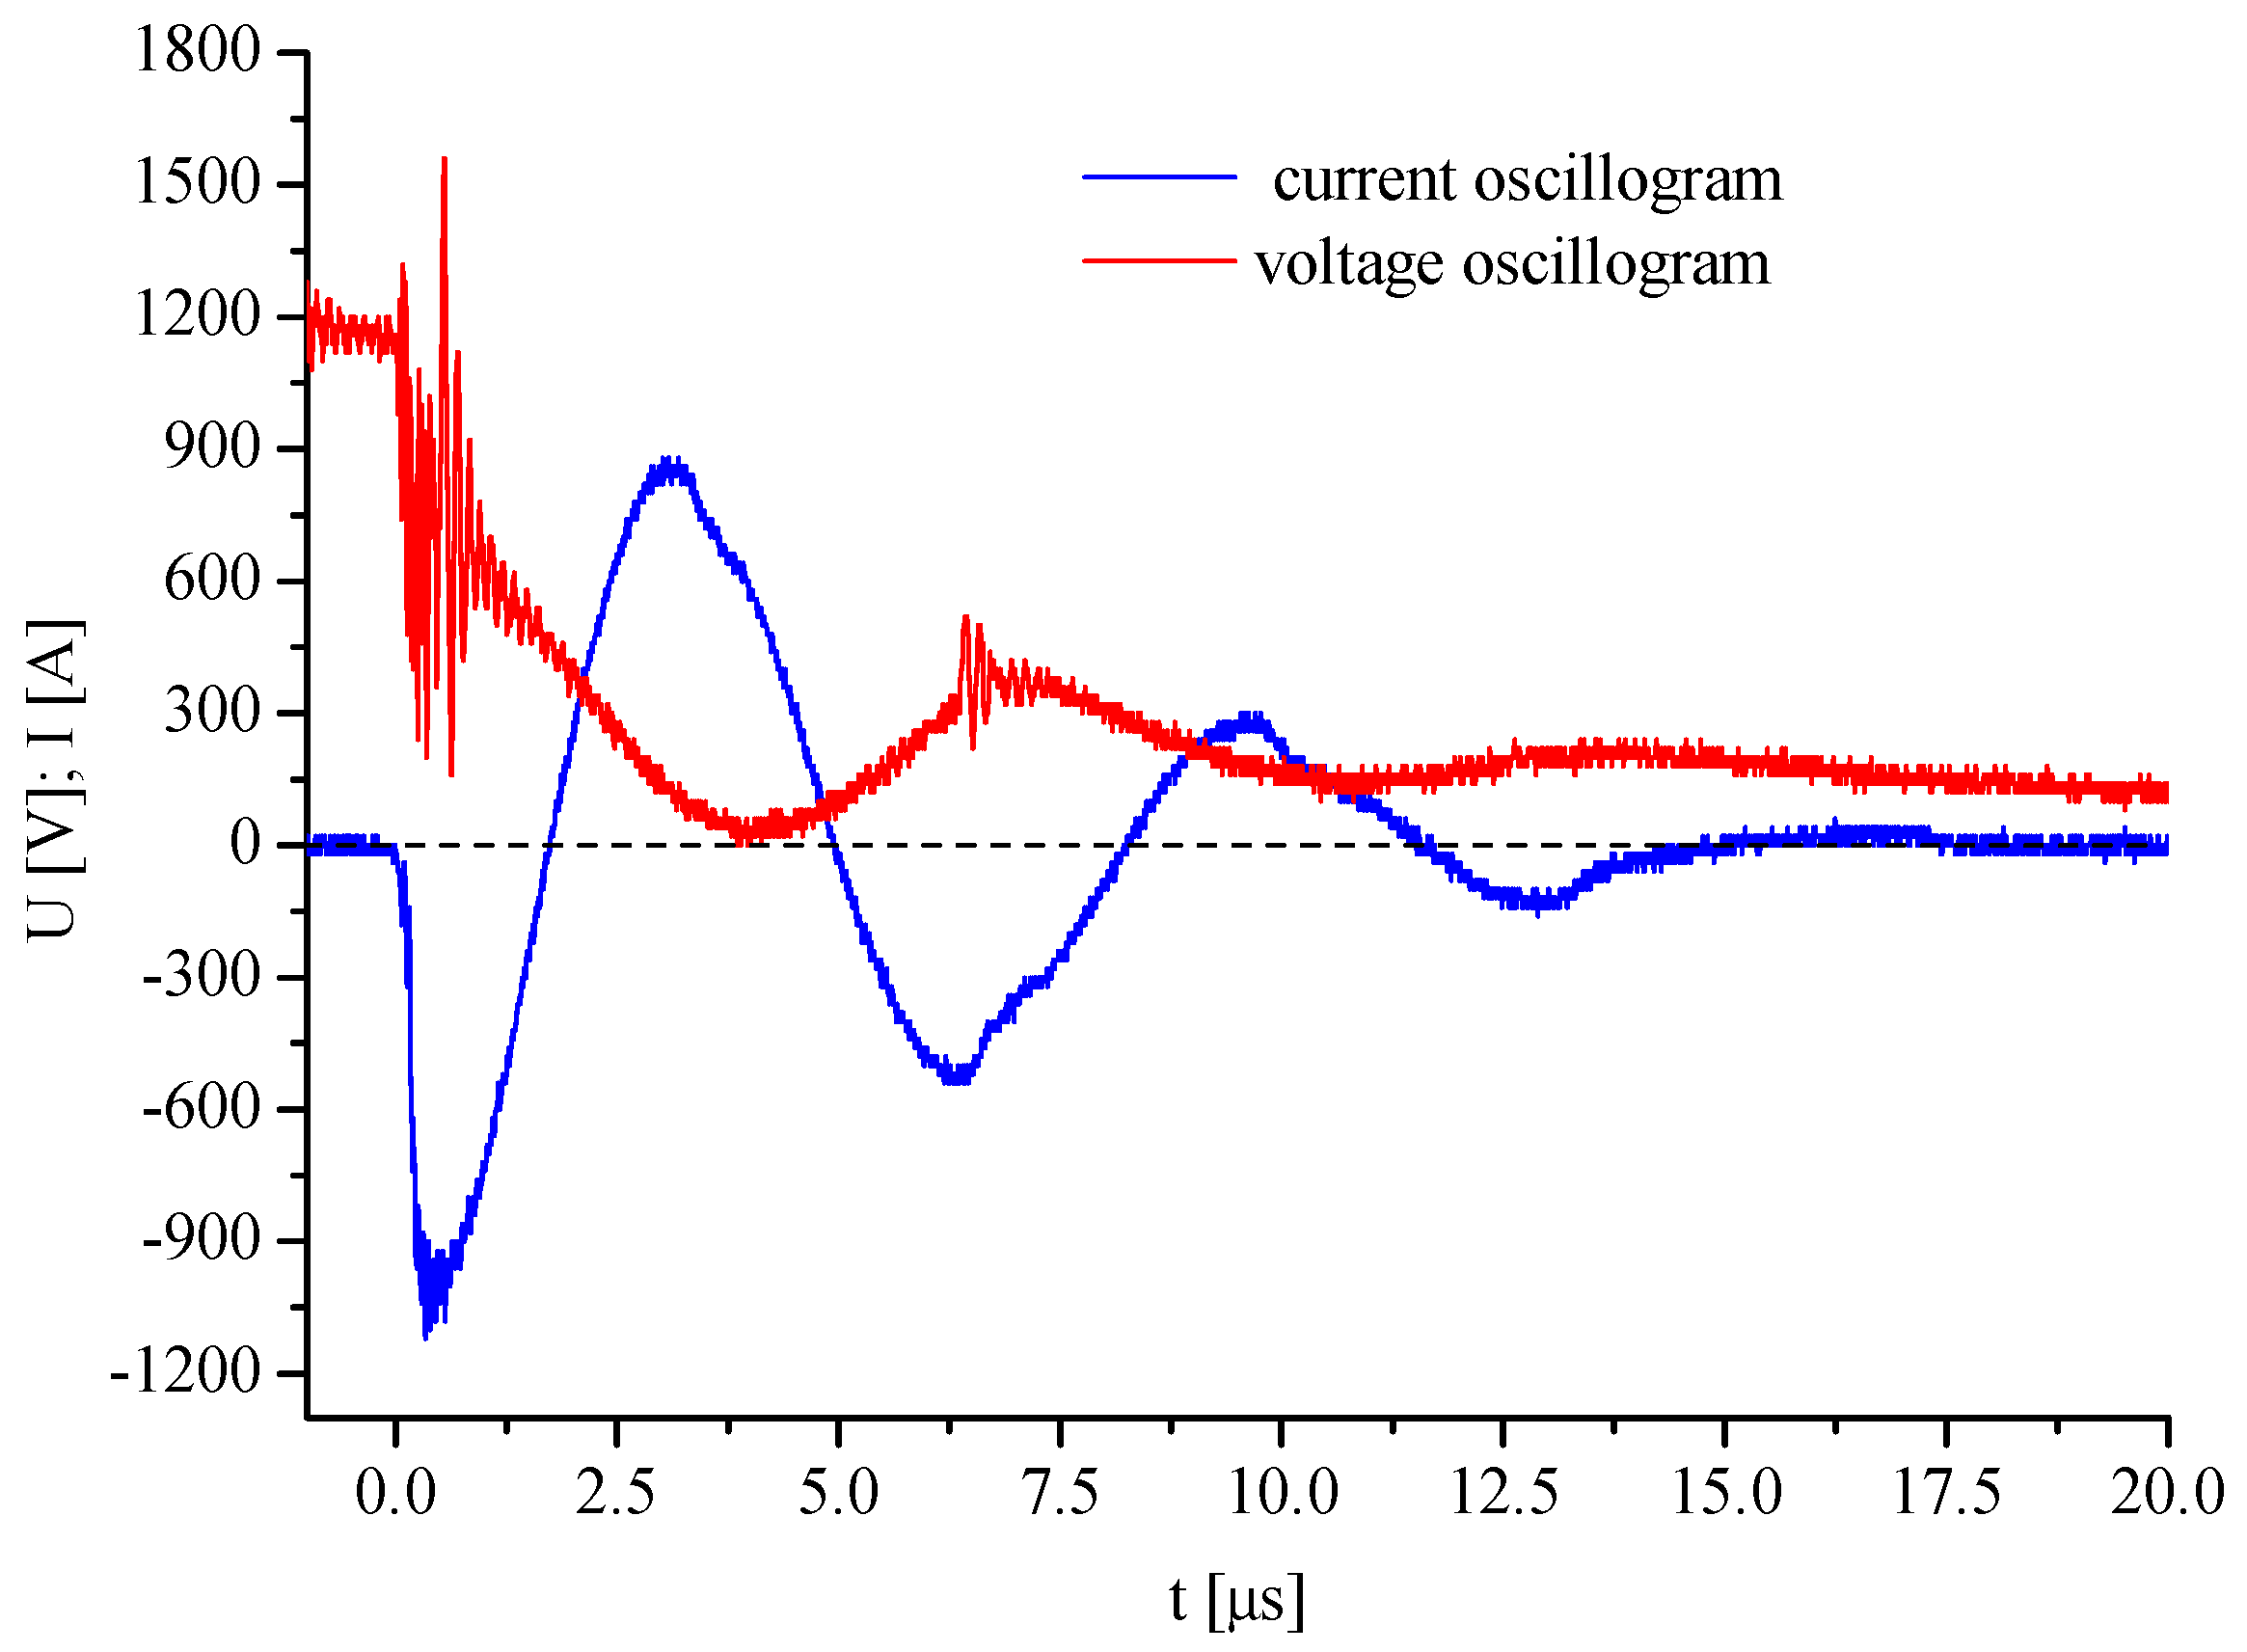
Figure 4.
Oscillogram of the discharge power.
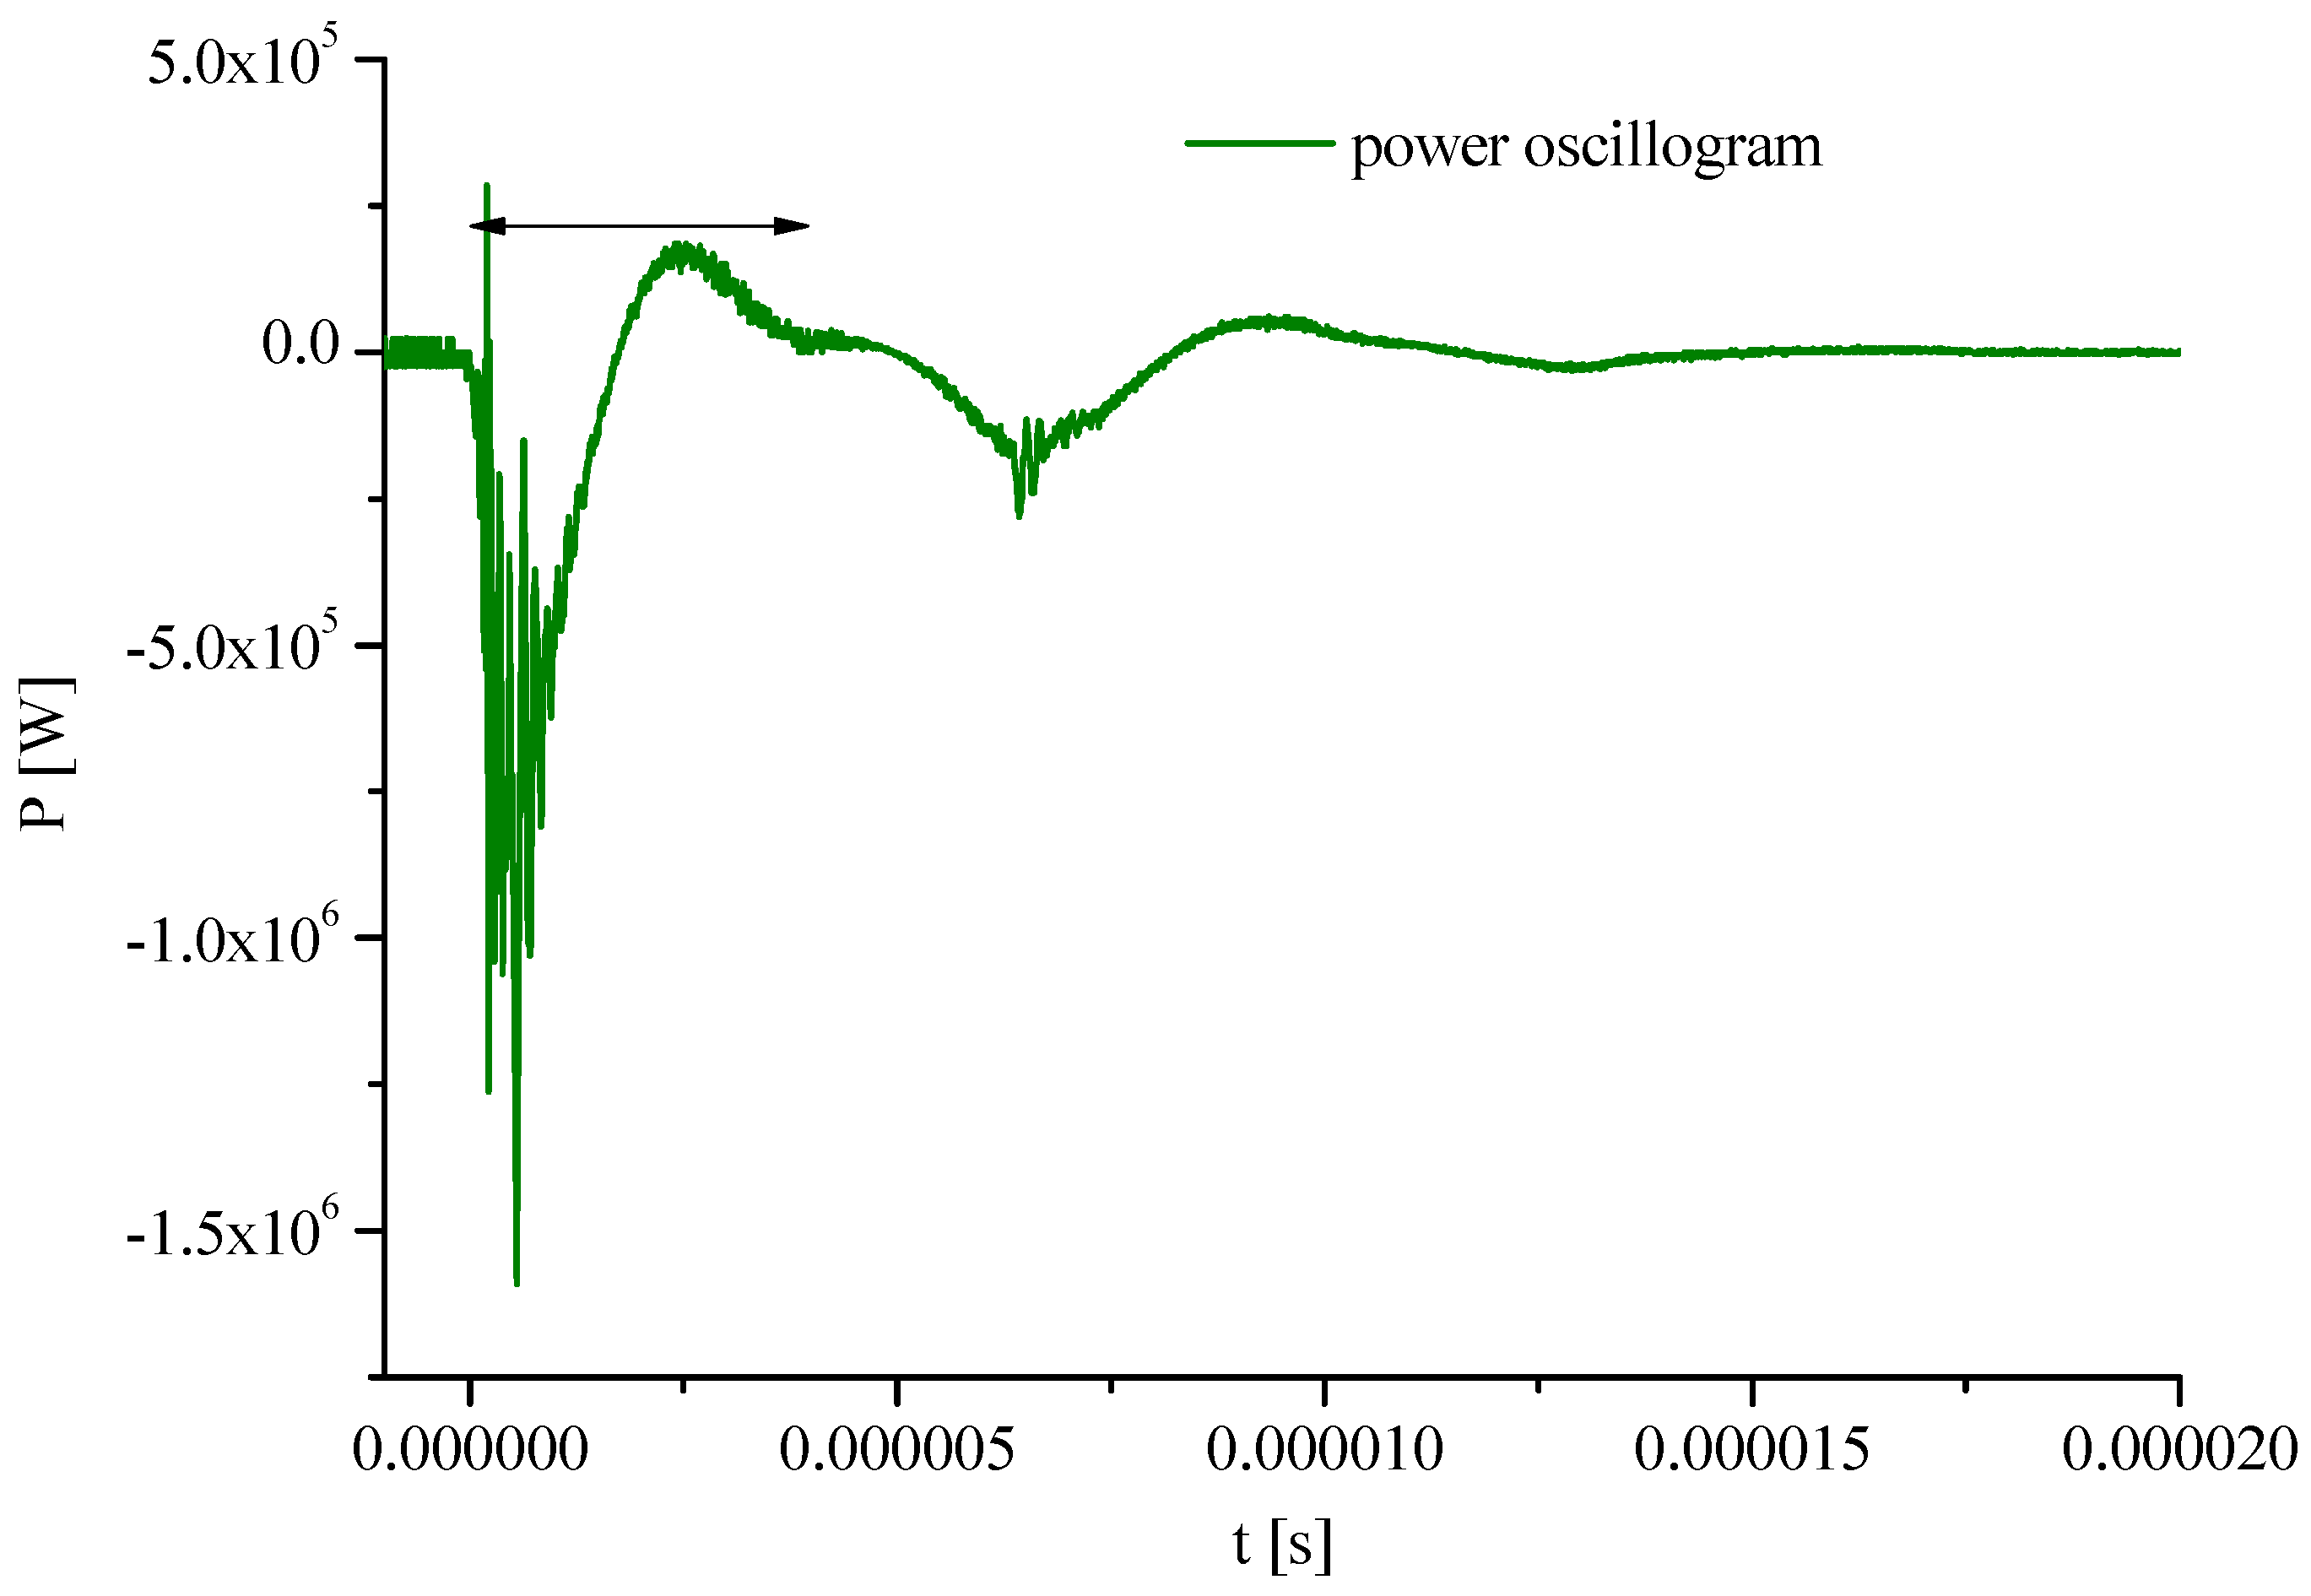
Figure 5.
Four consecutive frames showing the deflection of the ballistic pendulum under the action of plasma pulse. The outer diameter of the anode is 12.7 mm.
Figure 5.
Four consecutive frames showing the deflection of the ballistic pendulum under the action of plasma pulse. The outer diameter of the anode is 12.7 mm.
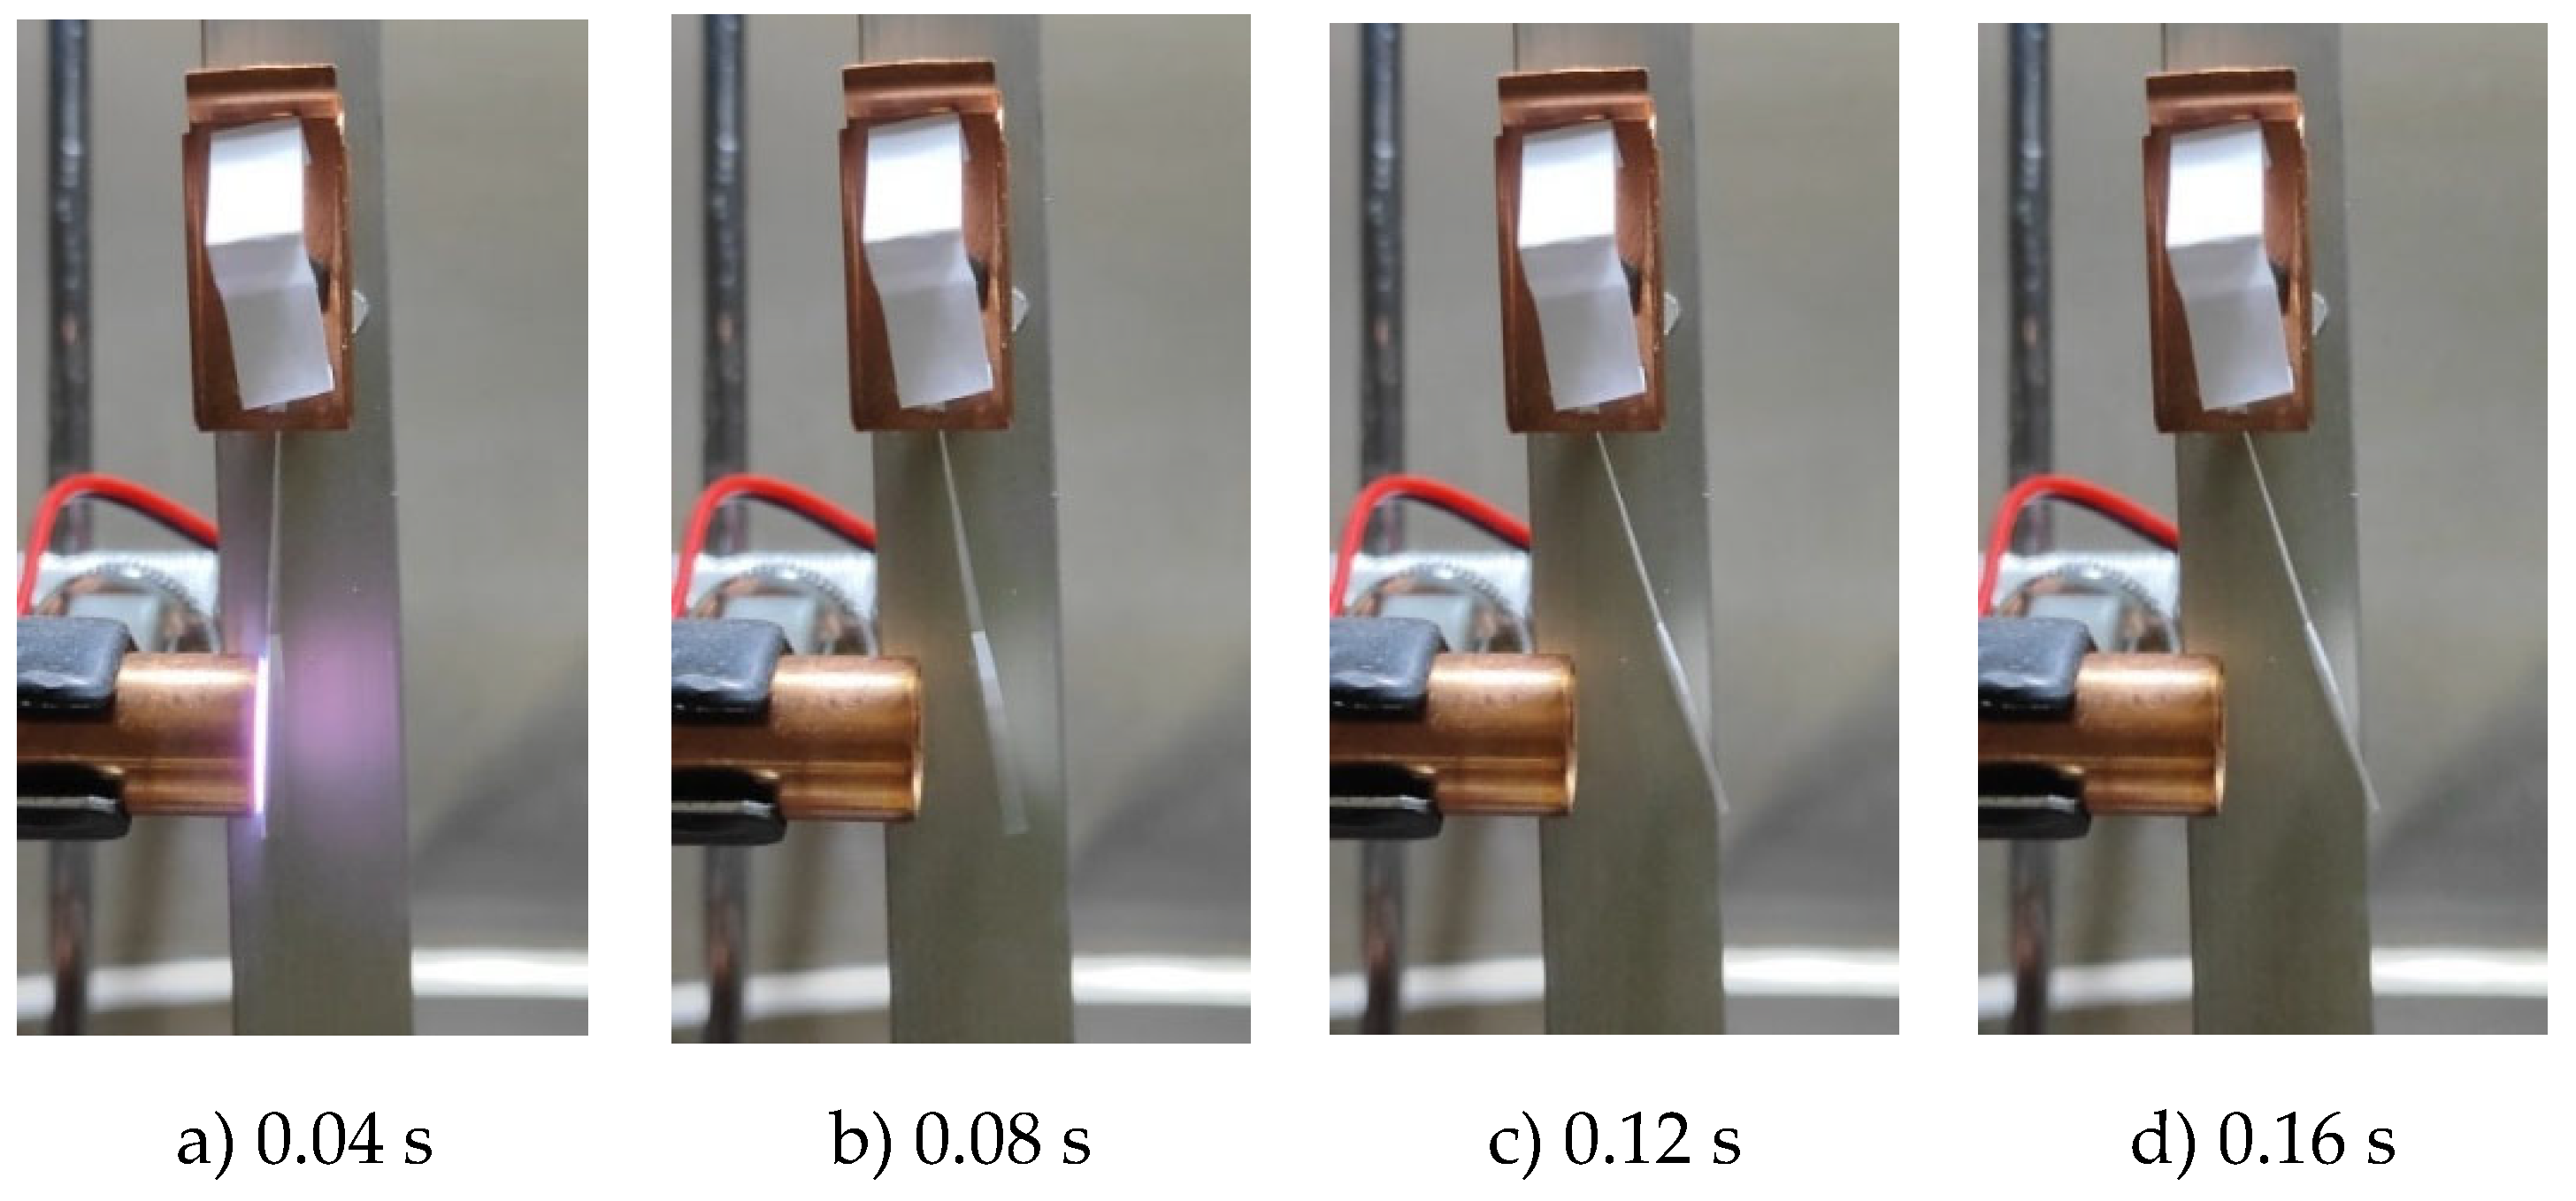
Figure 6.
Oscillograms from two probes located at different distances from the edge of the pulsed plasma thruster electrode.
Figure 6.
Oscillograms from two probes located at different distances from the edge of the pulsed plasma thruster electrode.
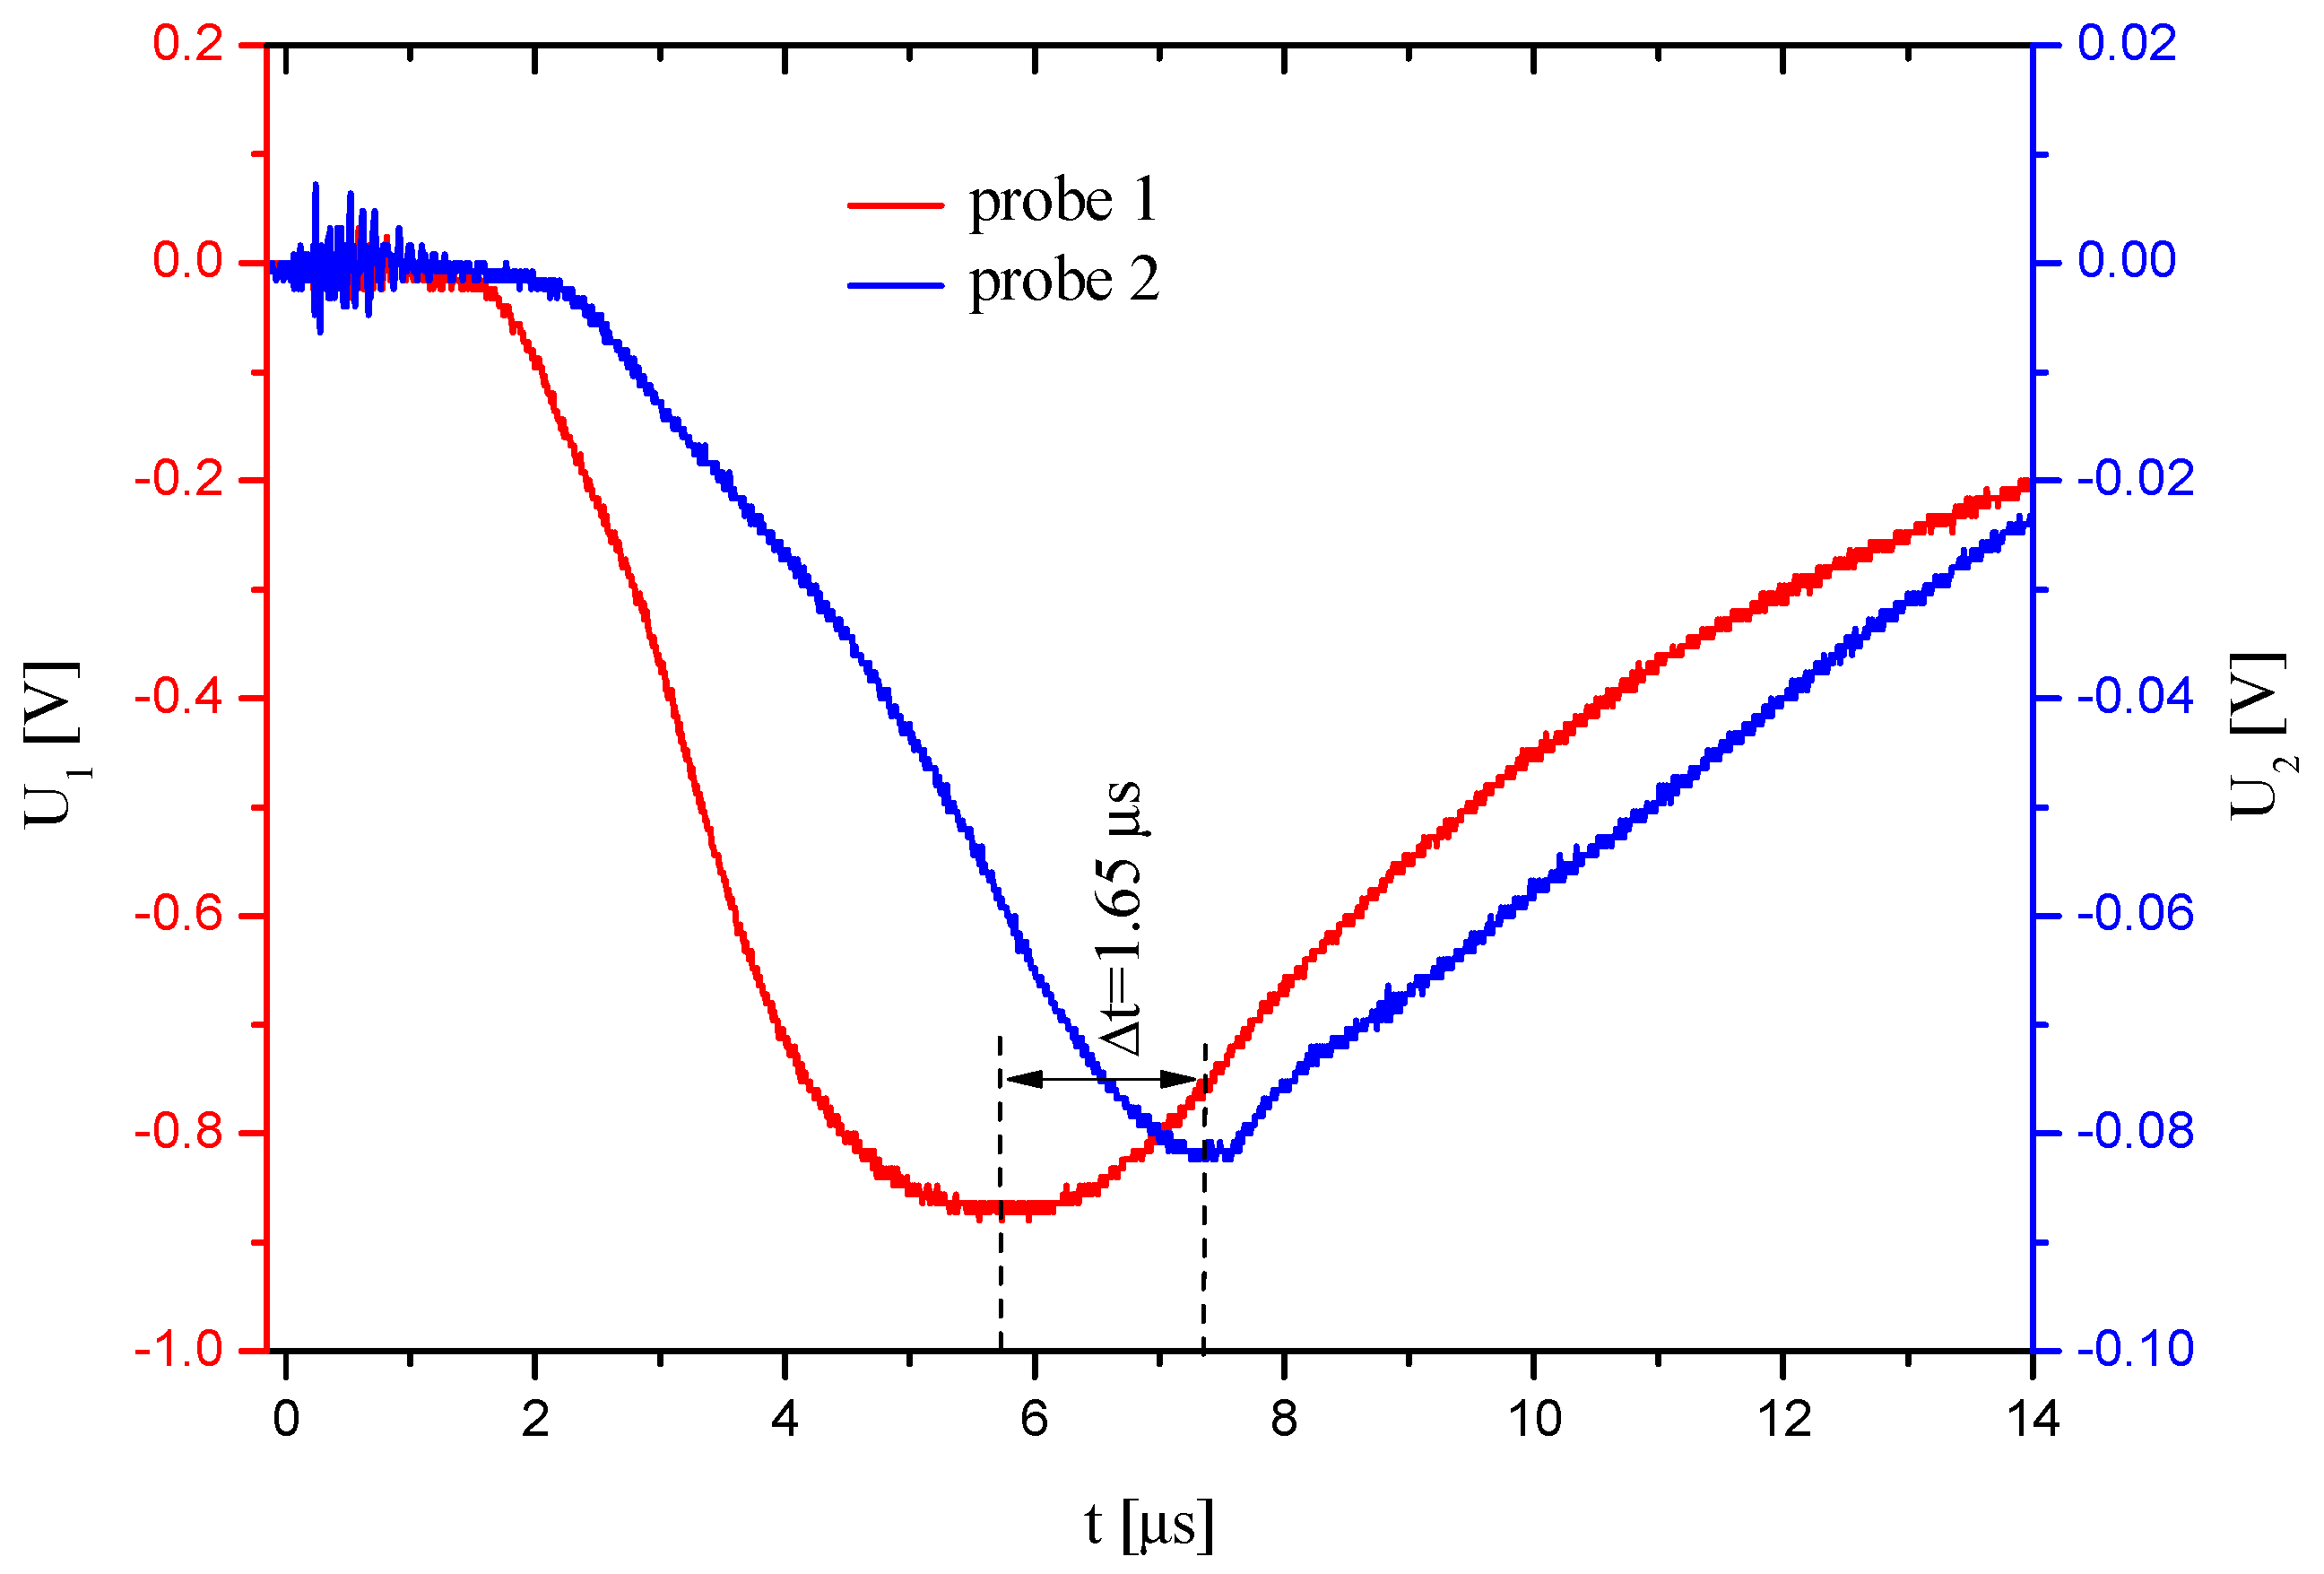
Figure 7.
The Faraday cylinder measurement circuit schematic diagram.
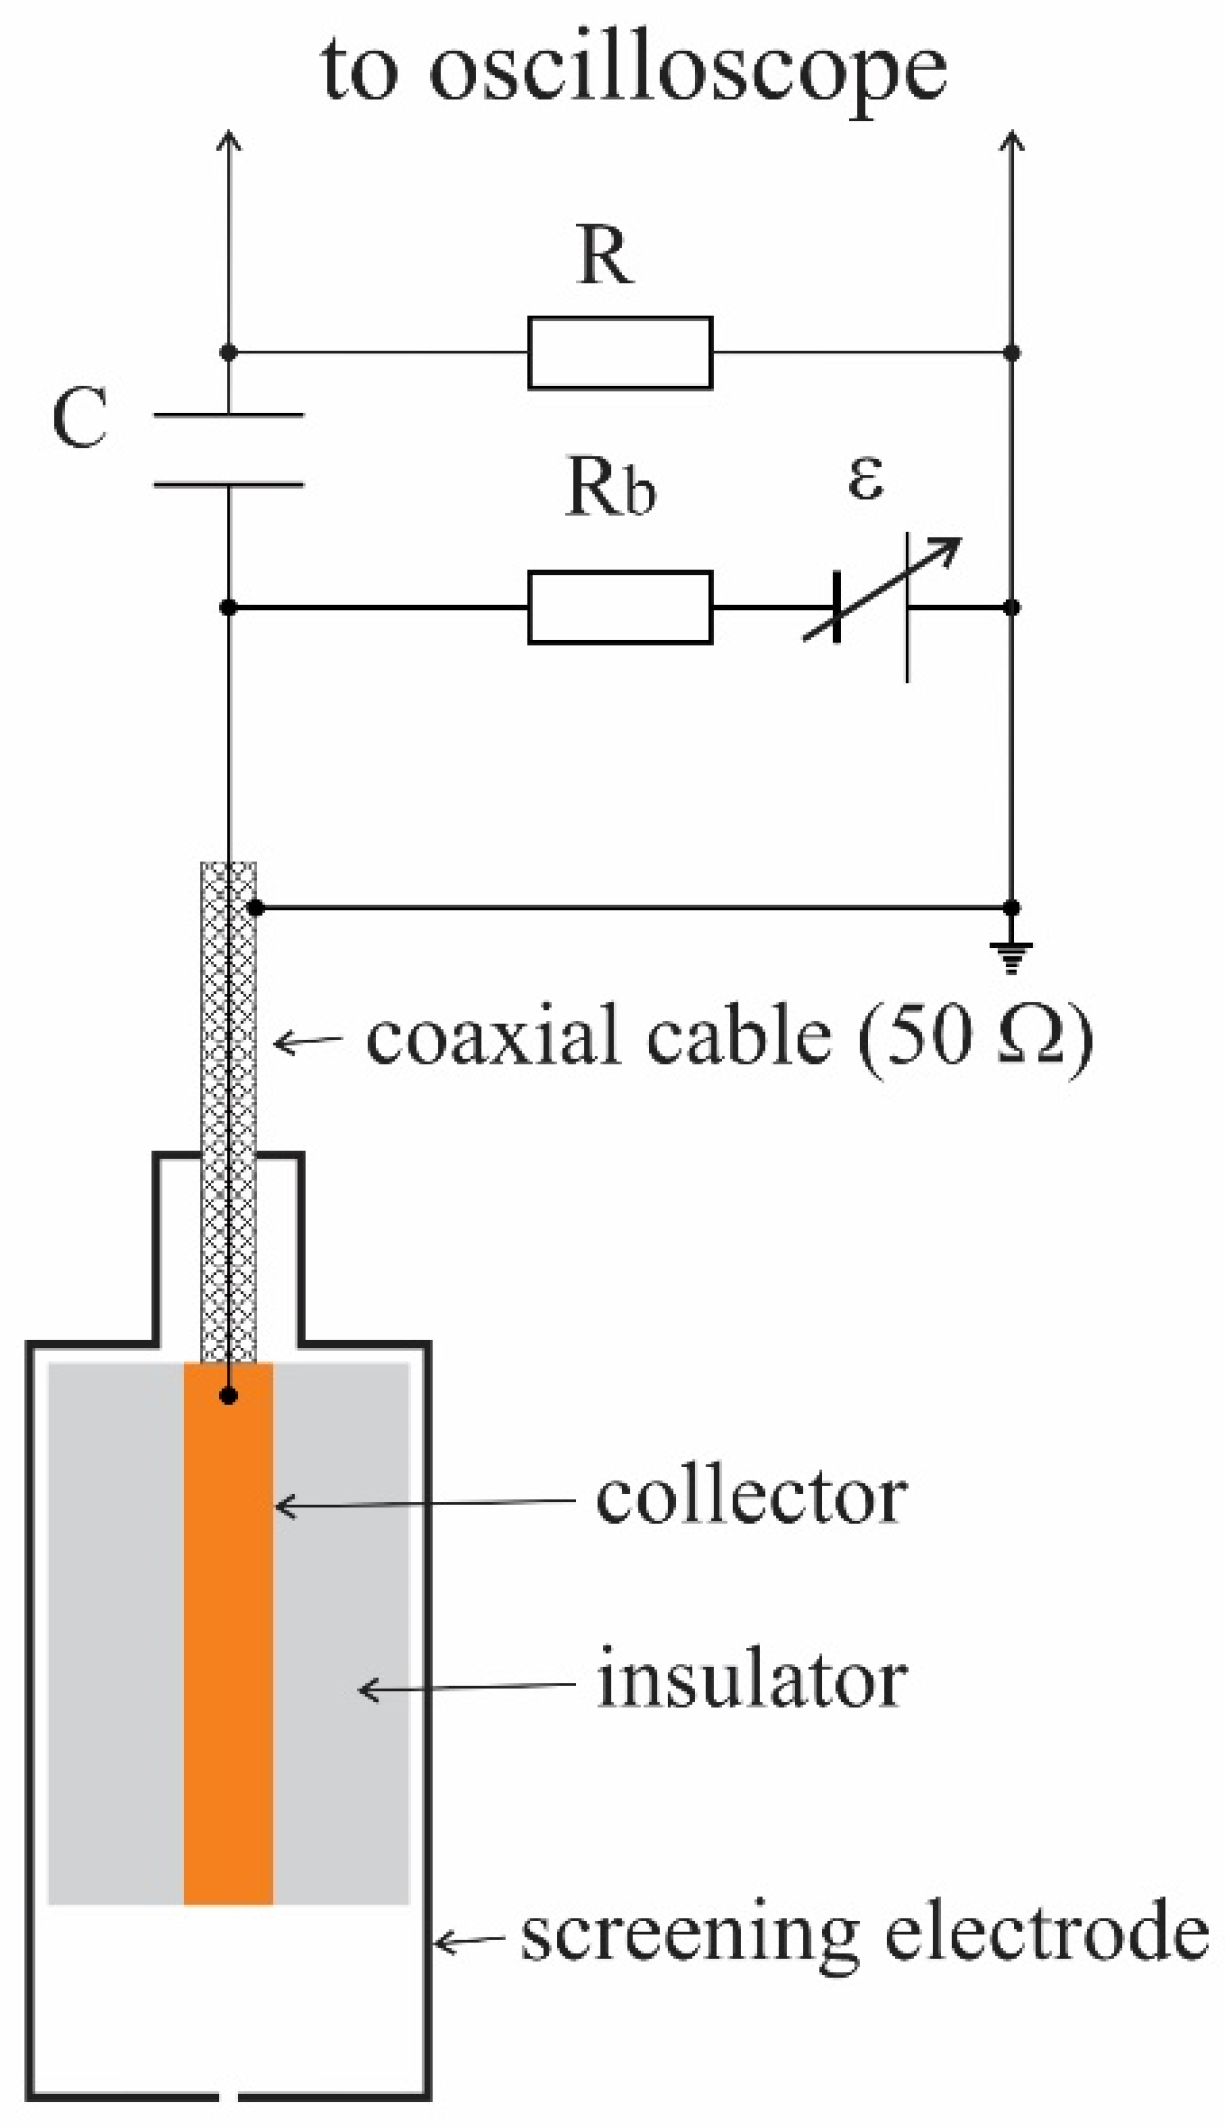
Figure 8.
Oscillograms of the ion current at various values of the bias voltage (Ub) applied to the outer electrode.
Figure 8.
Oscillograms of the ion current at various values of the bias voltage (Ub) applied to the outer electrode.
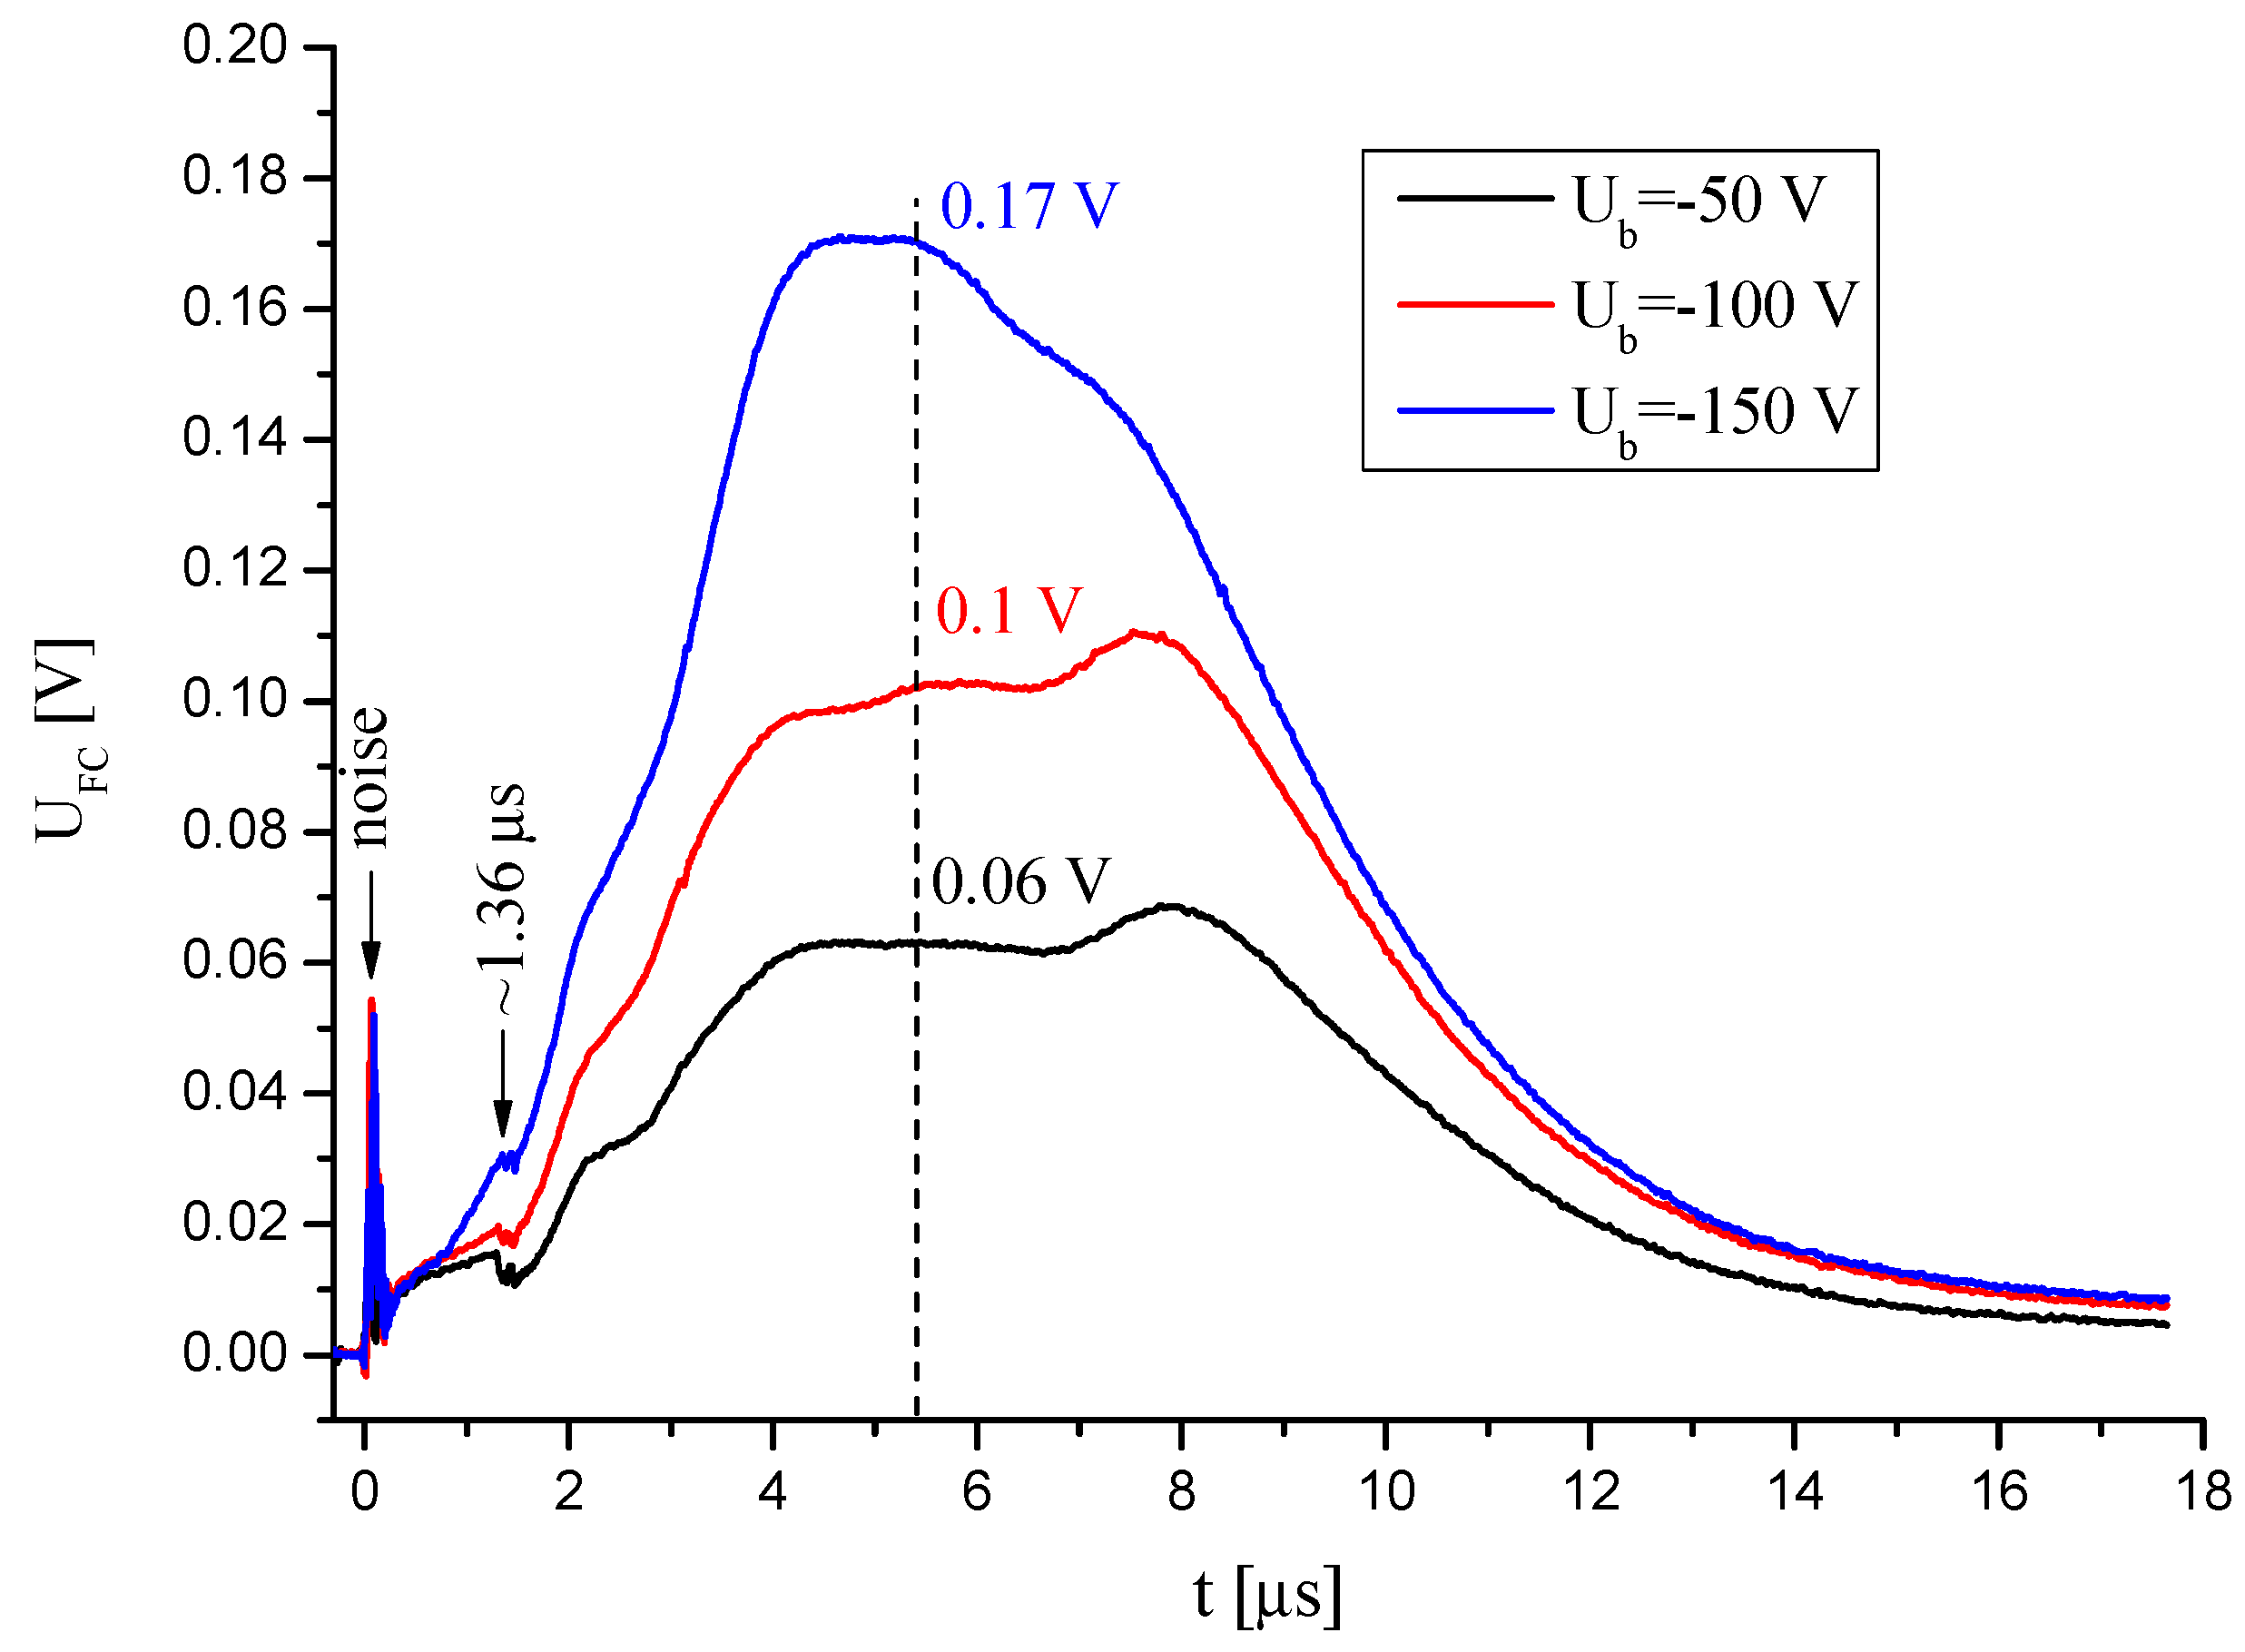
Figure 9.
Image of the graphite electrode after multiple operation of the thruster.
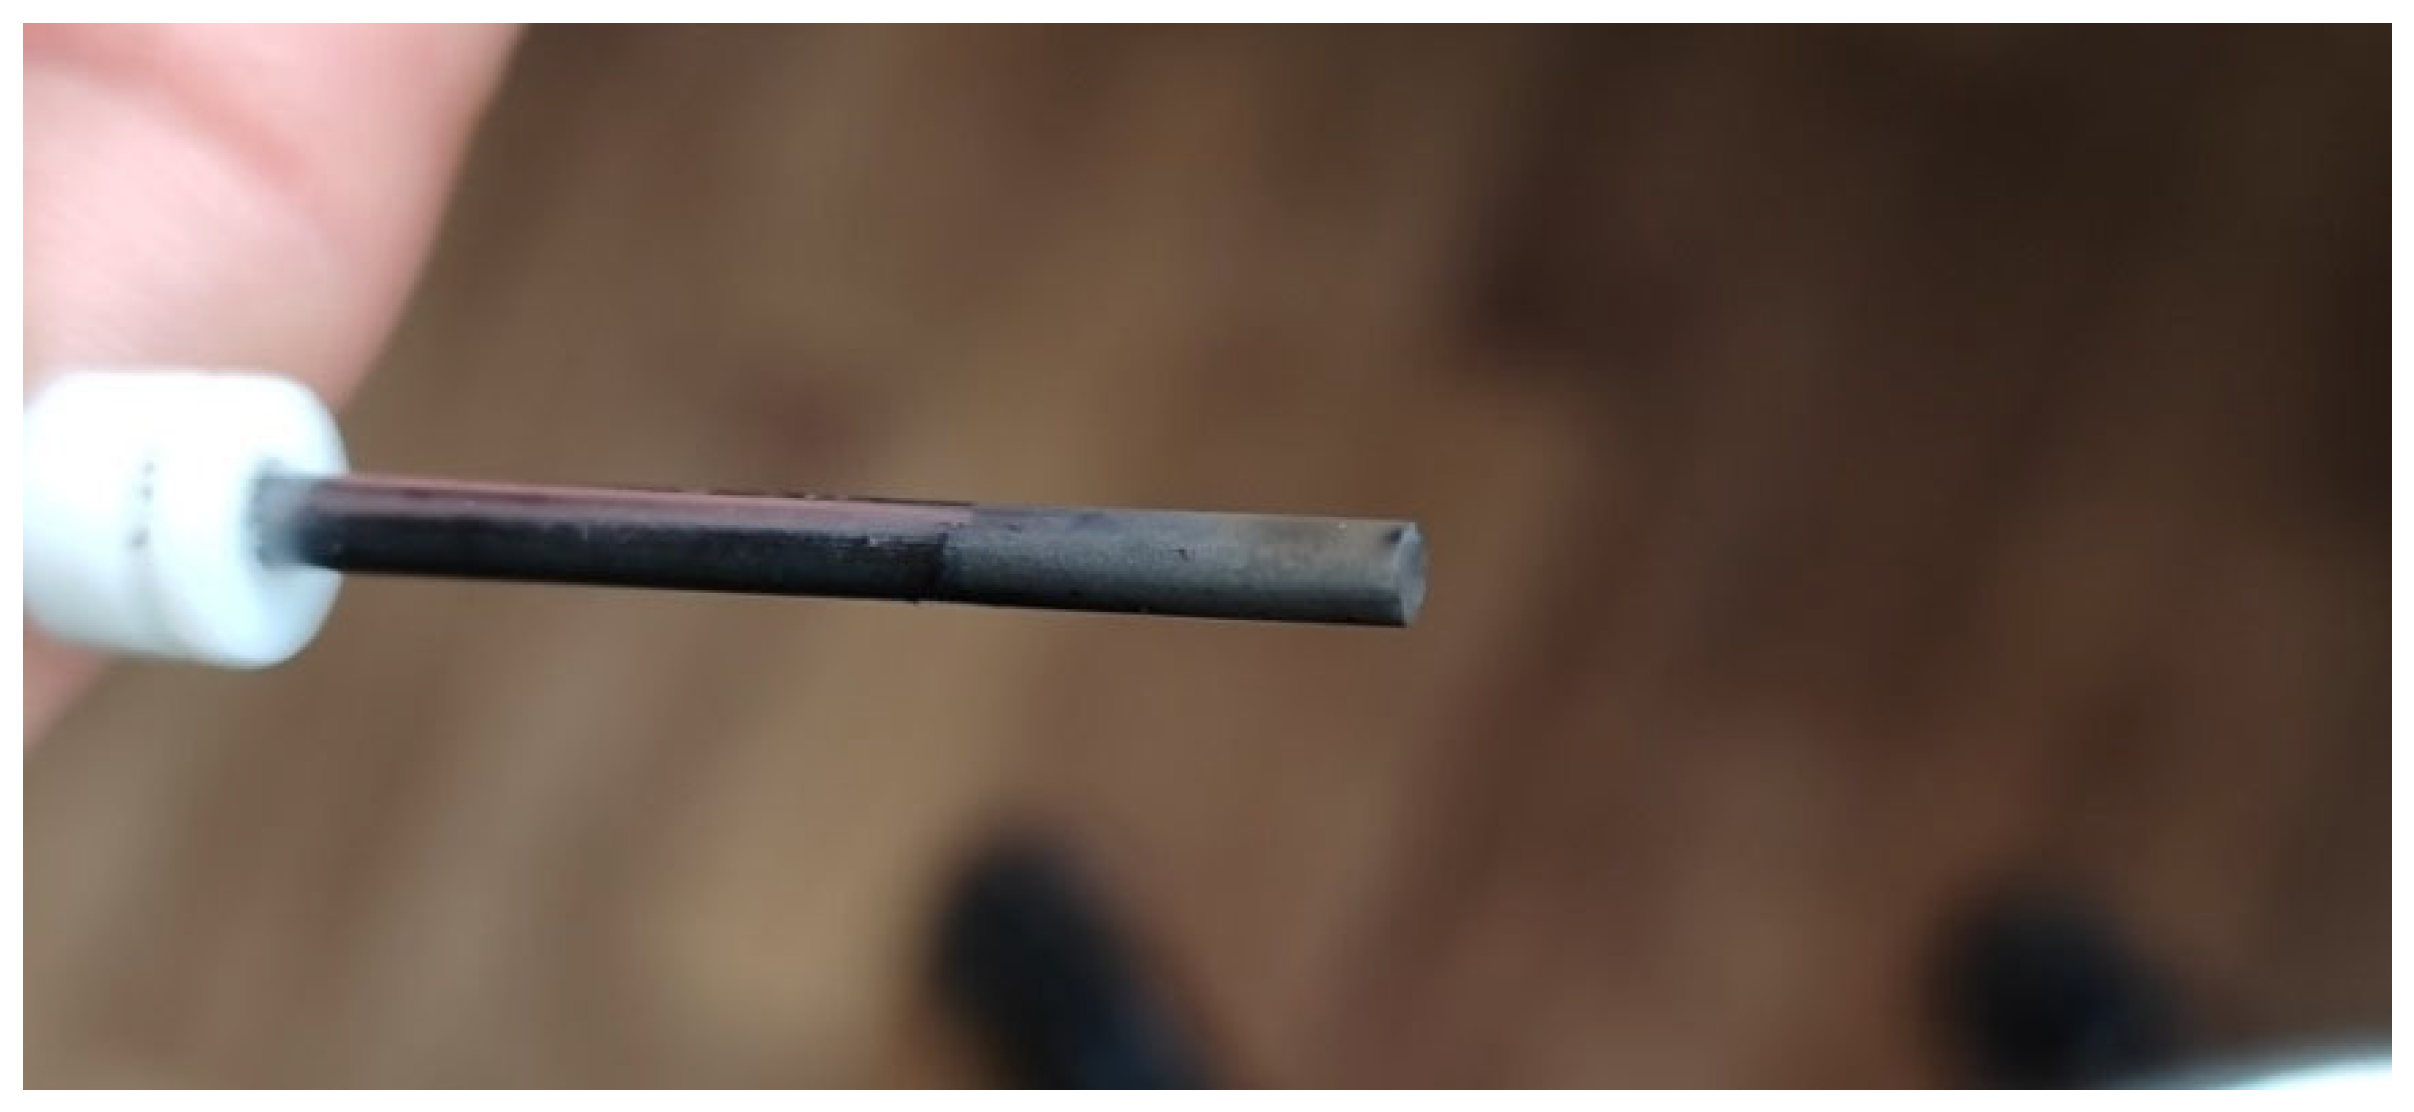
Figure 10.
Oscillogram of the current and voltage of the pulsed thruster discharge with a tungsten trigger electrode.
Figure 10.
Oscillogram of the current and voltage of the pulsed thruster discharge with a tungsten trigger electrode.
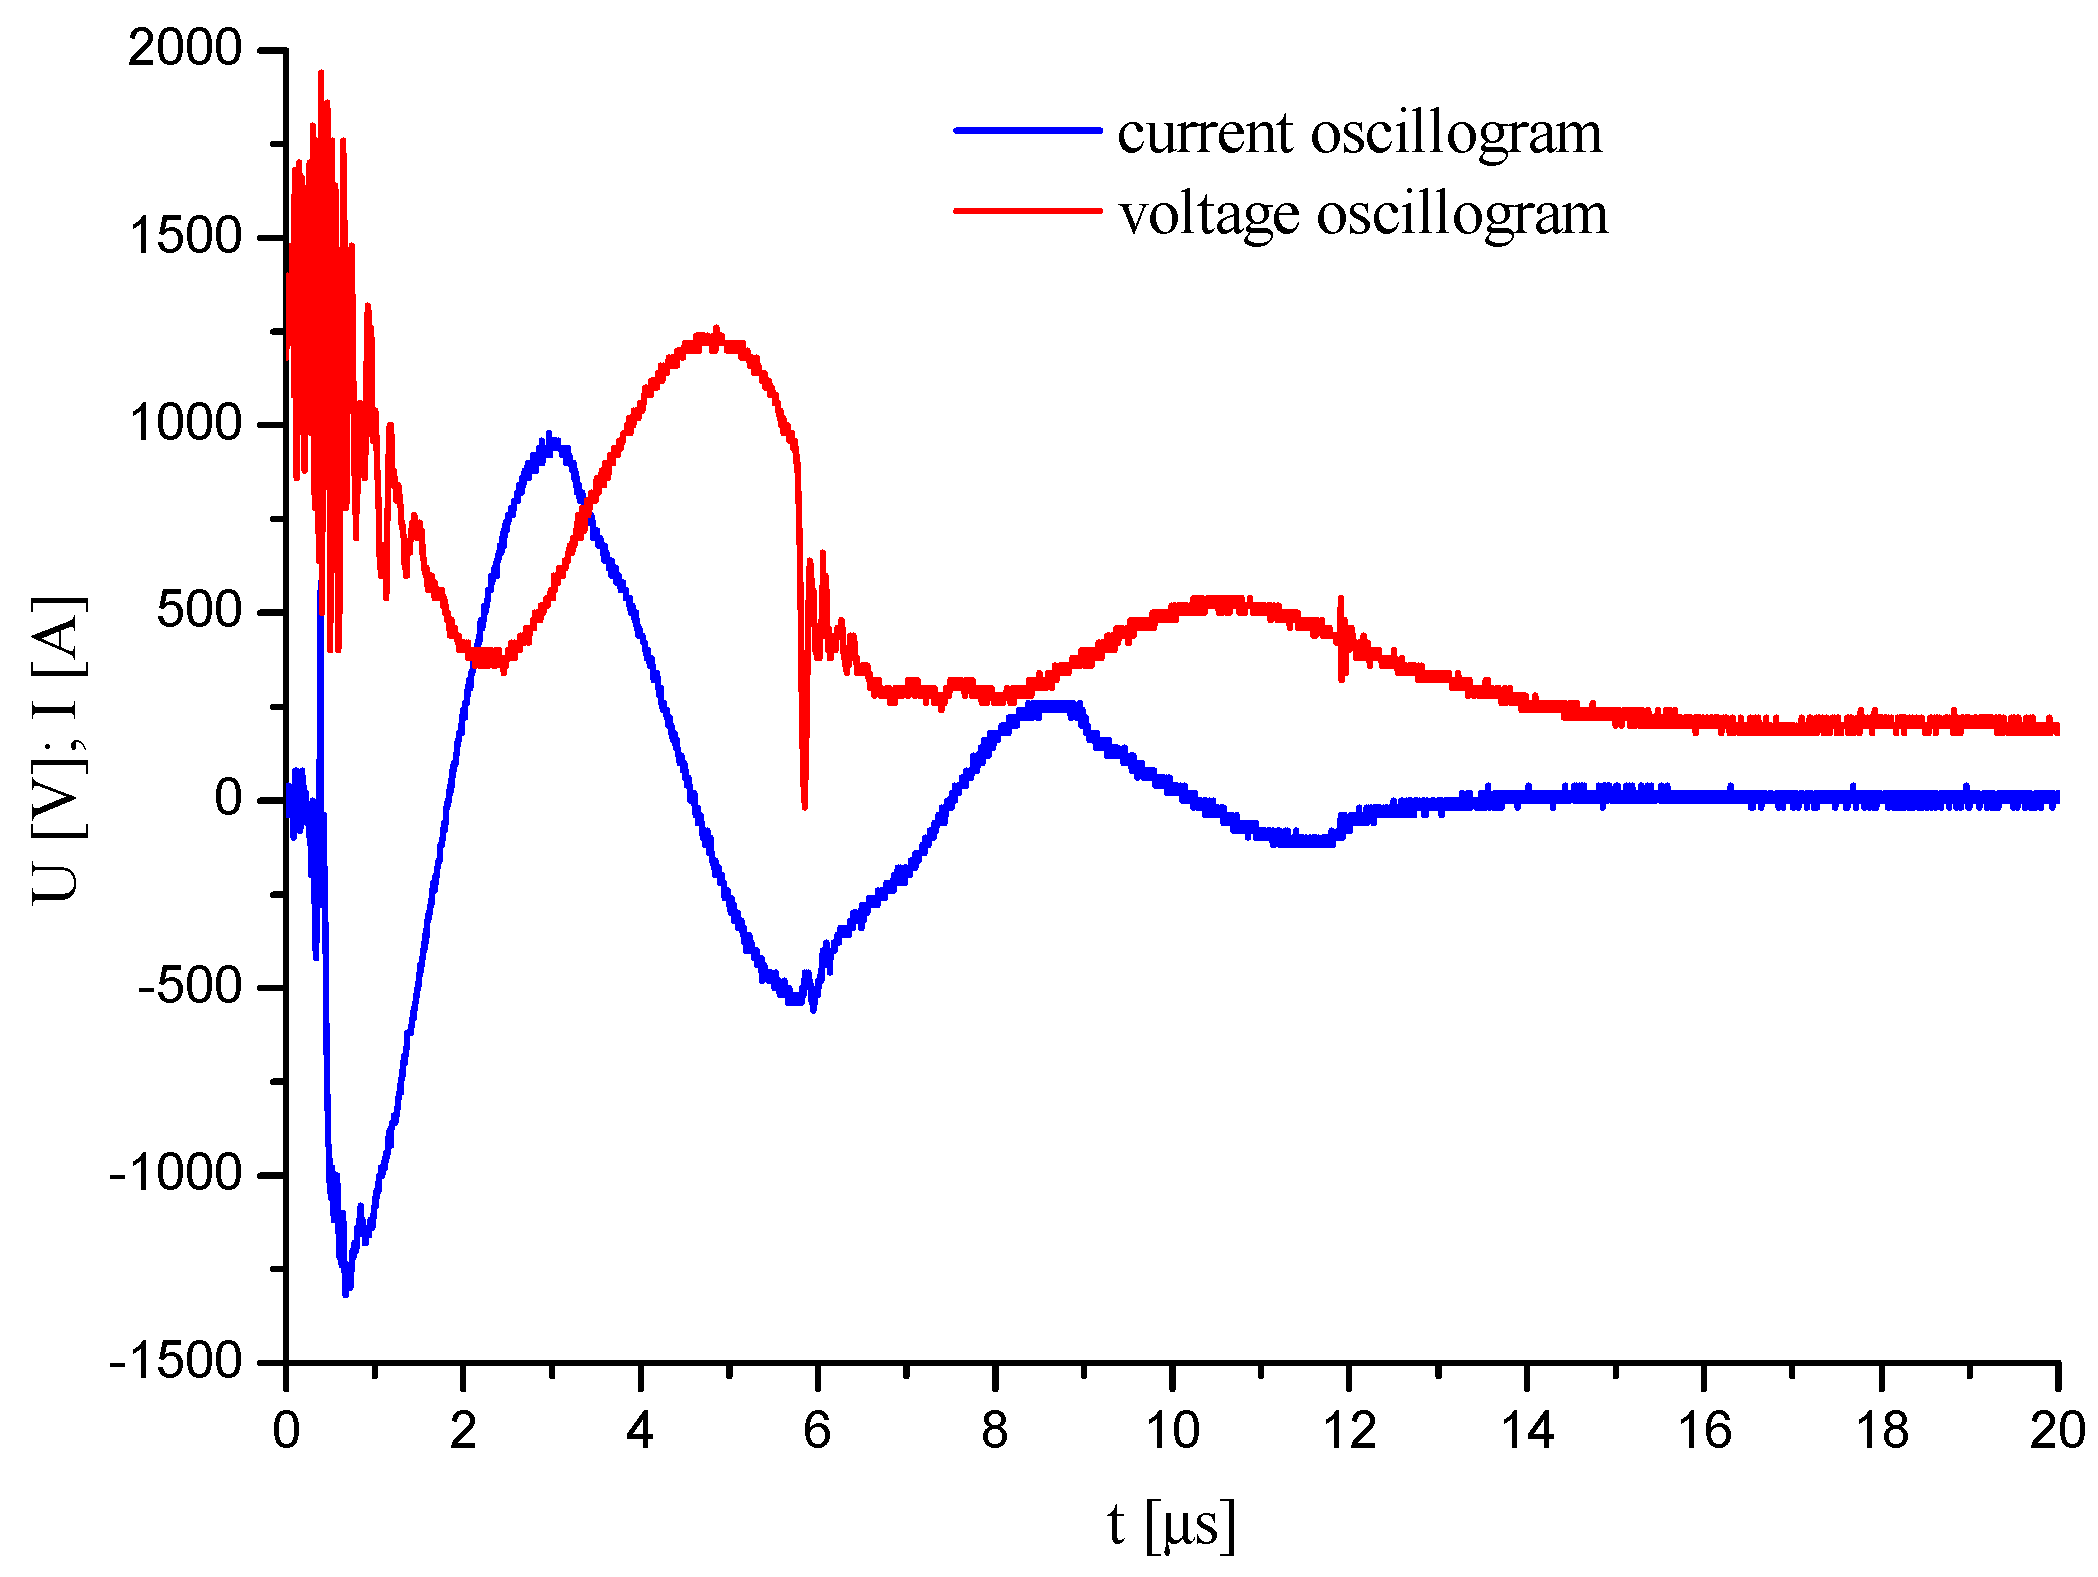
Figure 11.
Four consecutive frames showing the ballistic pendulum deflecting under the action of a plasma pulse. The outer diameter of the anode is 12.7 mm.
Figure 11.
Four consecutive frames showing the ballistic pendulum deflecting under the action of a plasma pulse. The outer diameter of the anode is 12.7 mm.
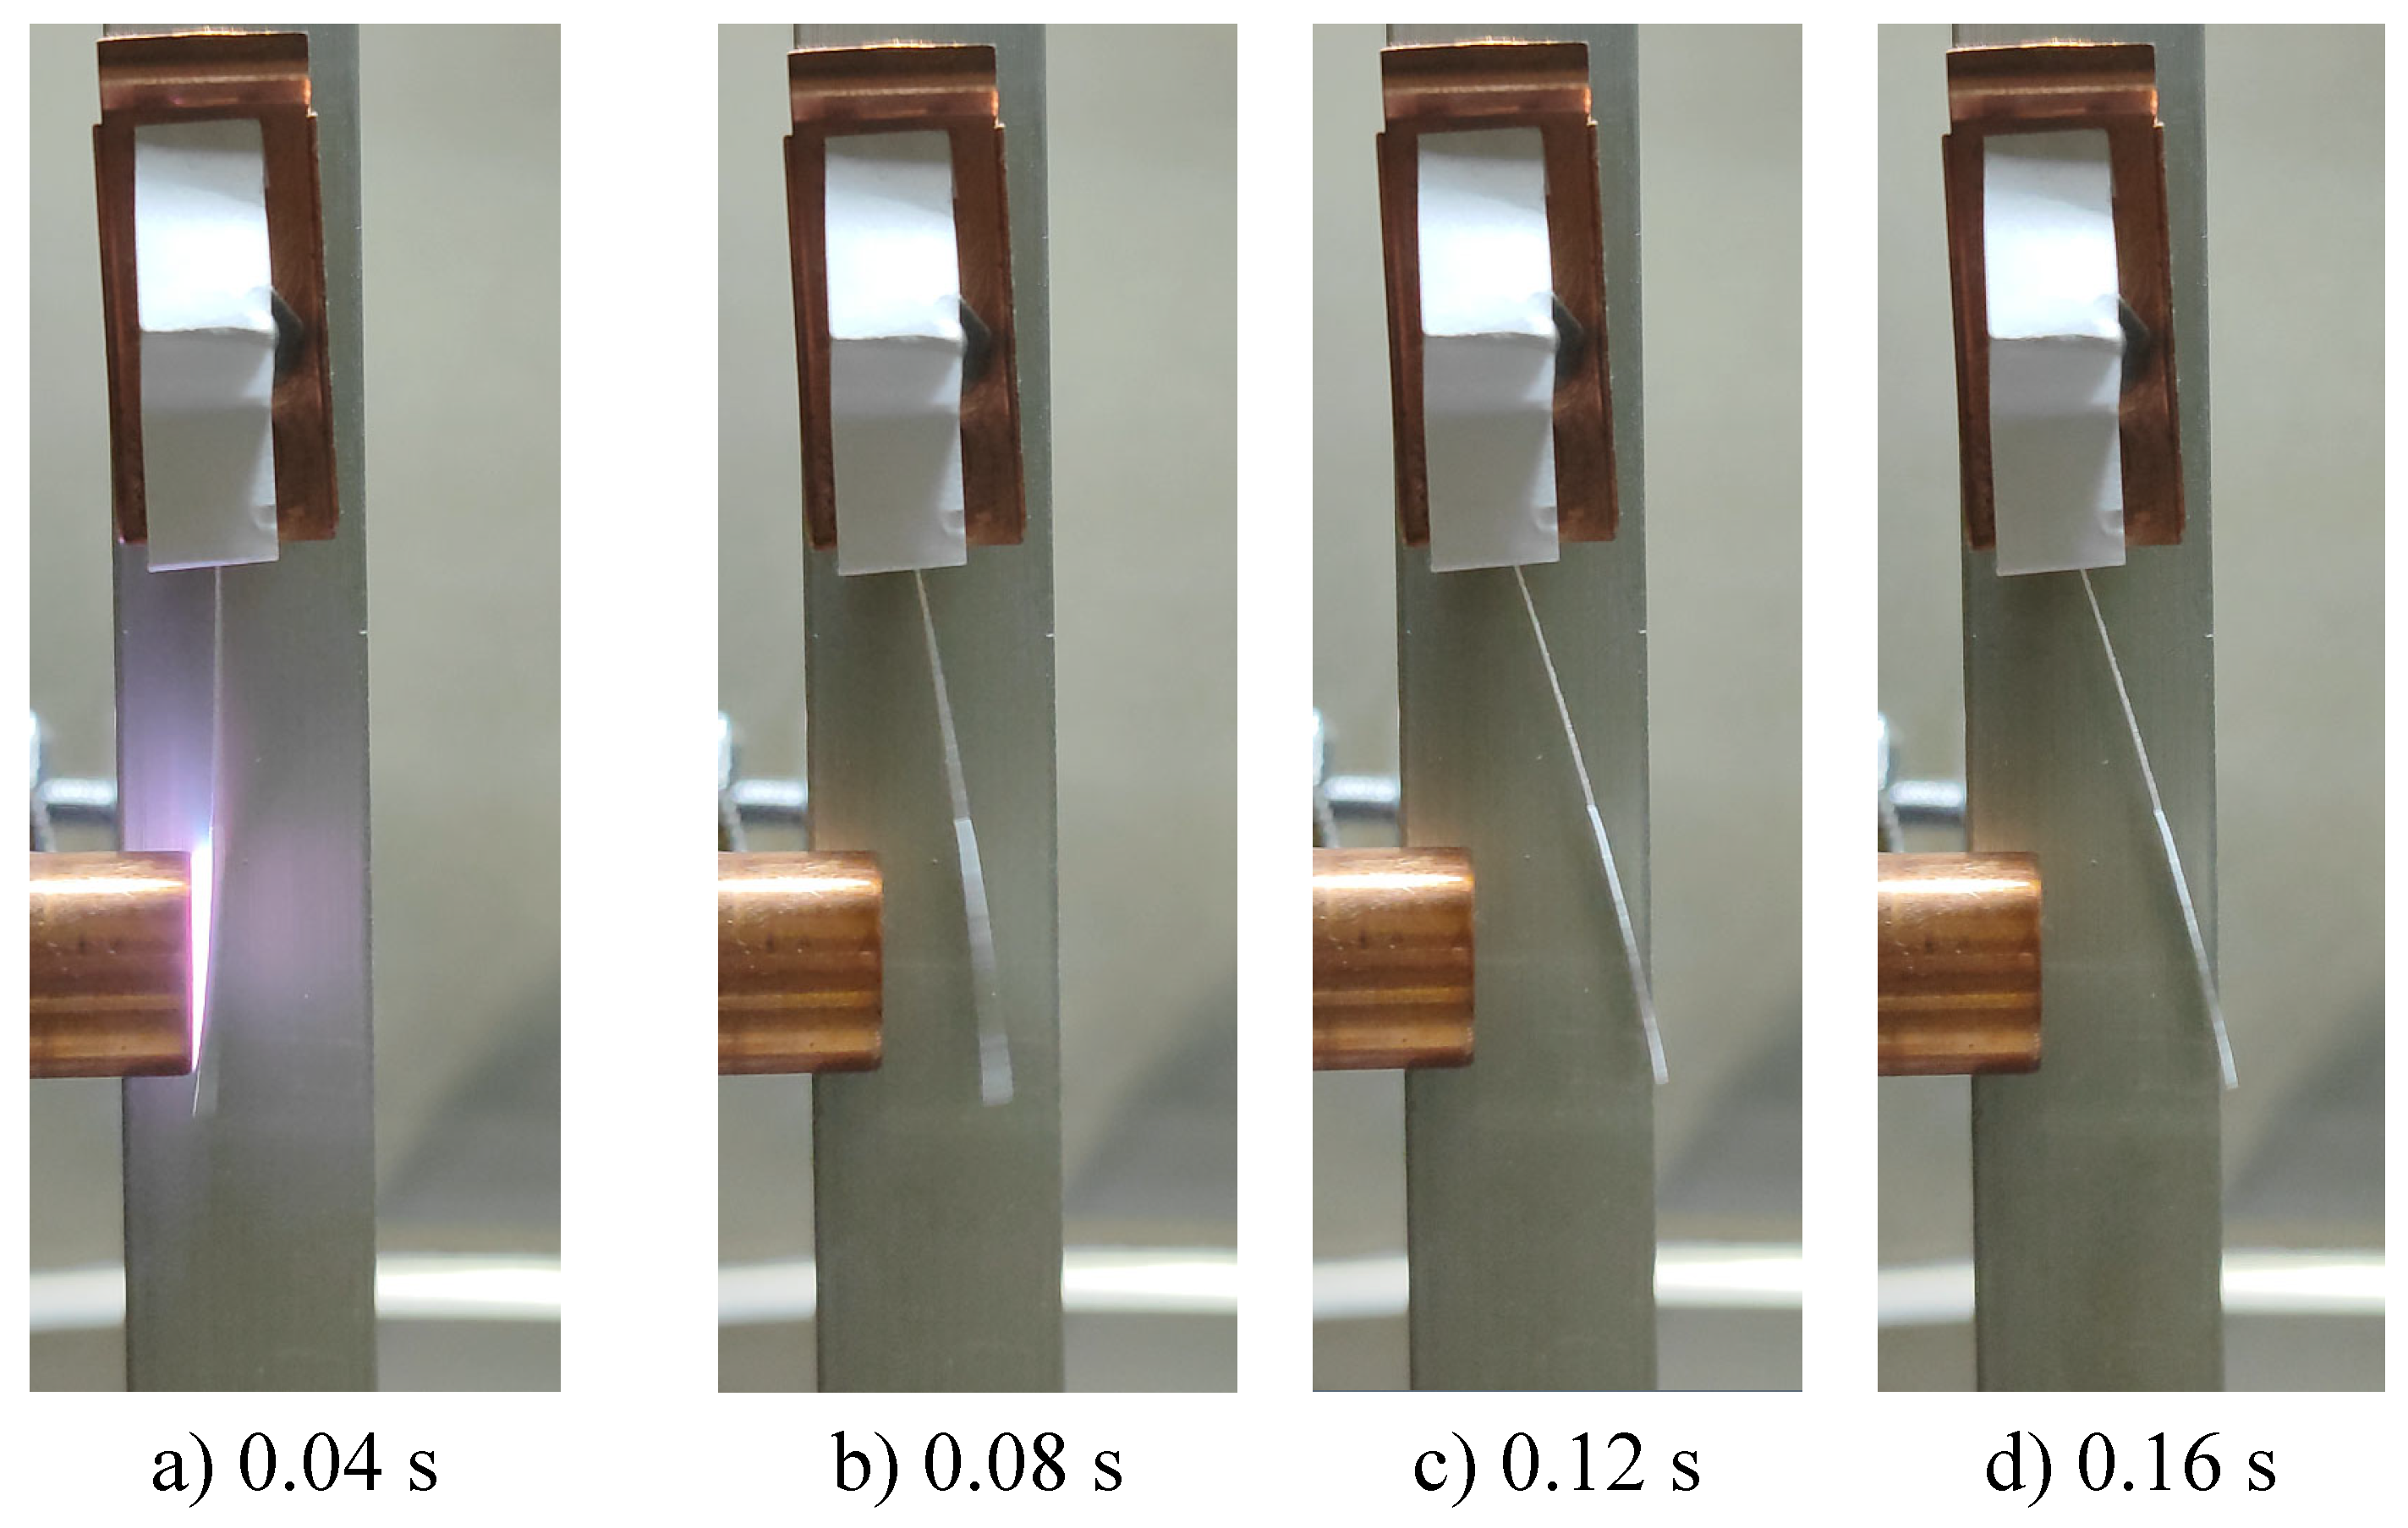
Figure 12.
Oscillograms from two probes located at different distances from the end of the pulsed plasma thruster electrode.
Figure 12.
Oscillograms from two probes located at different distances from the end of the pulsed plasma thruster electrode.
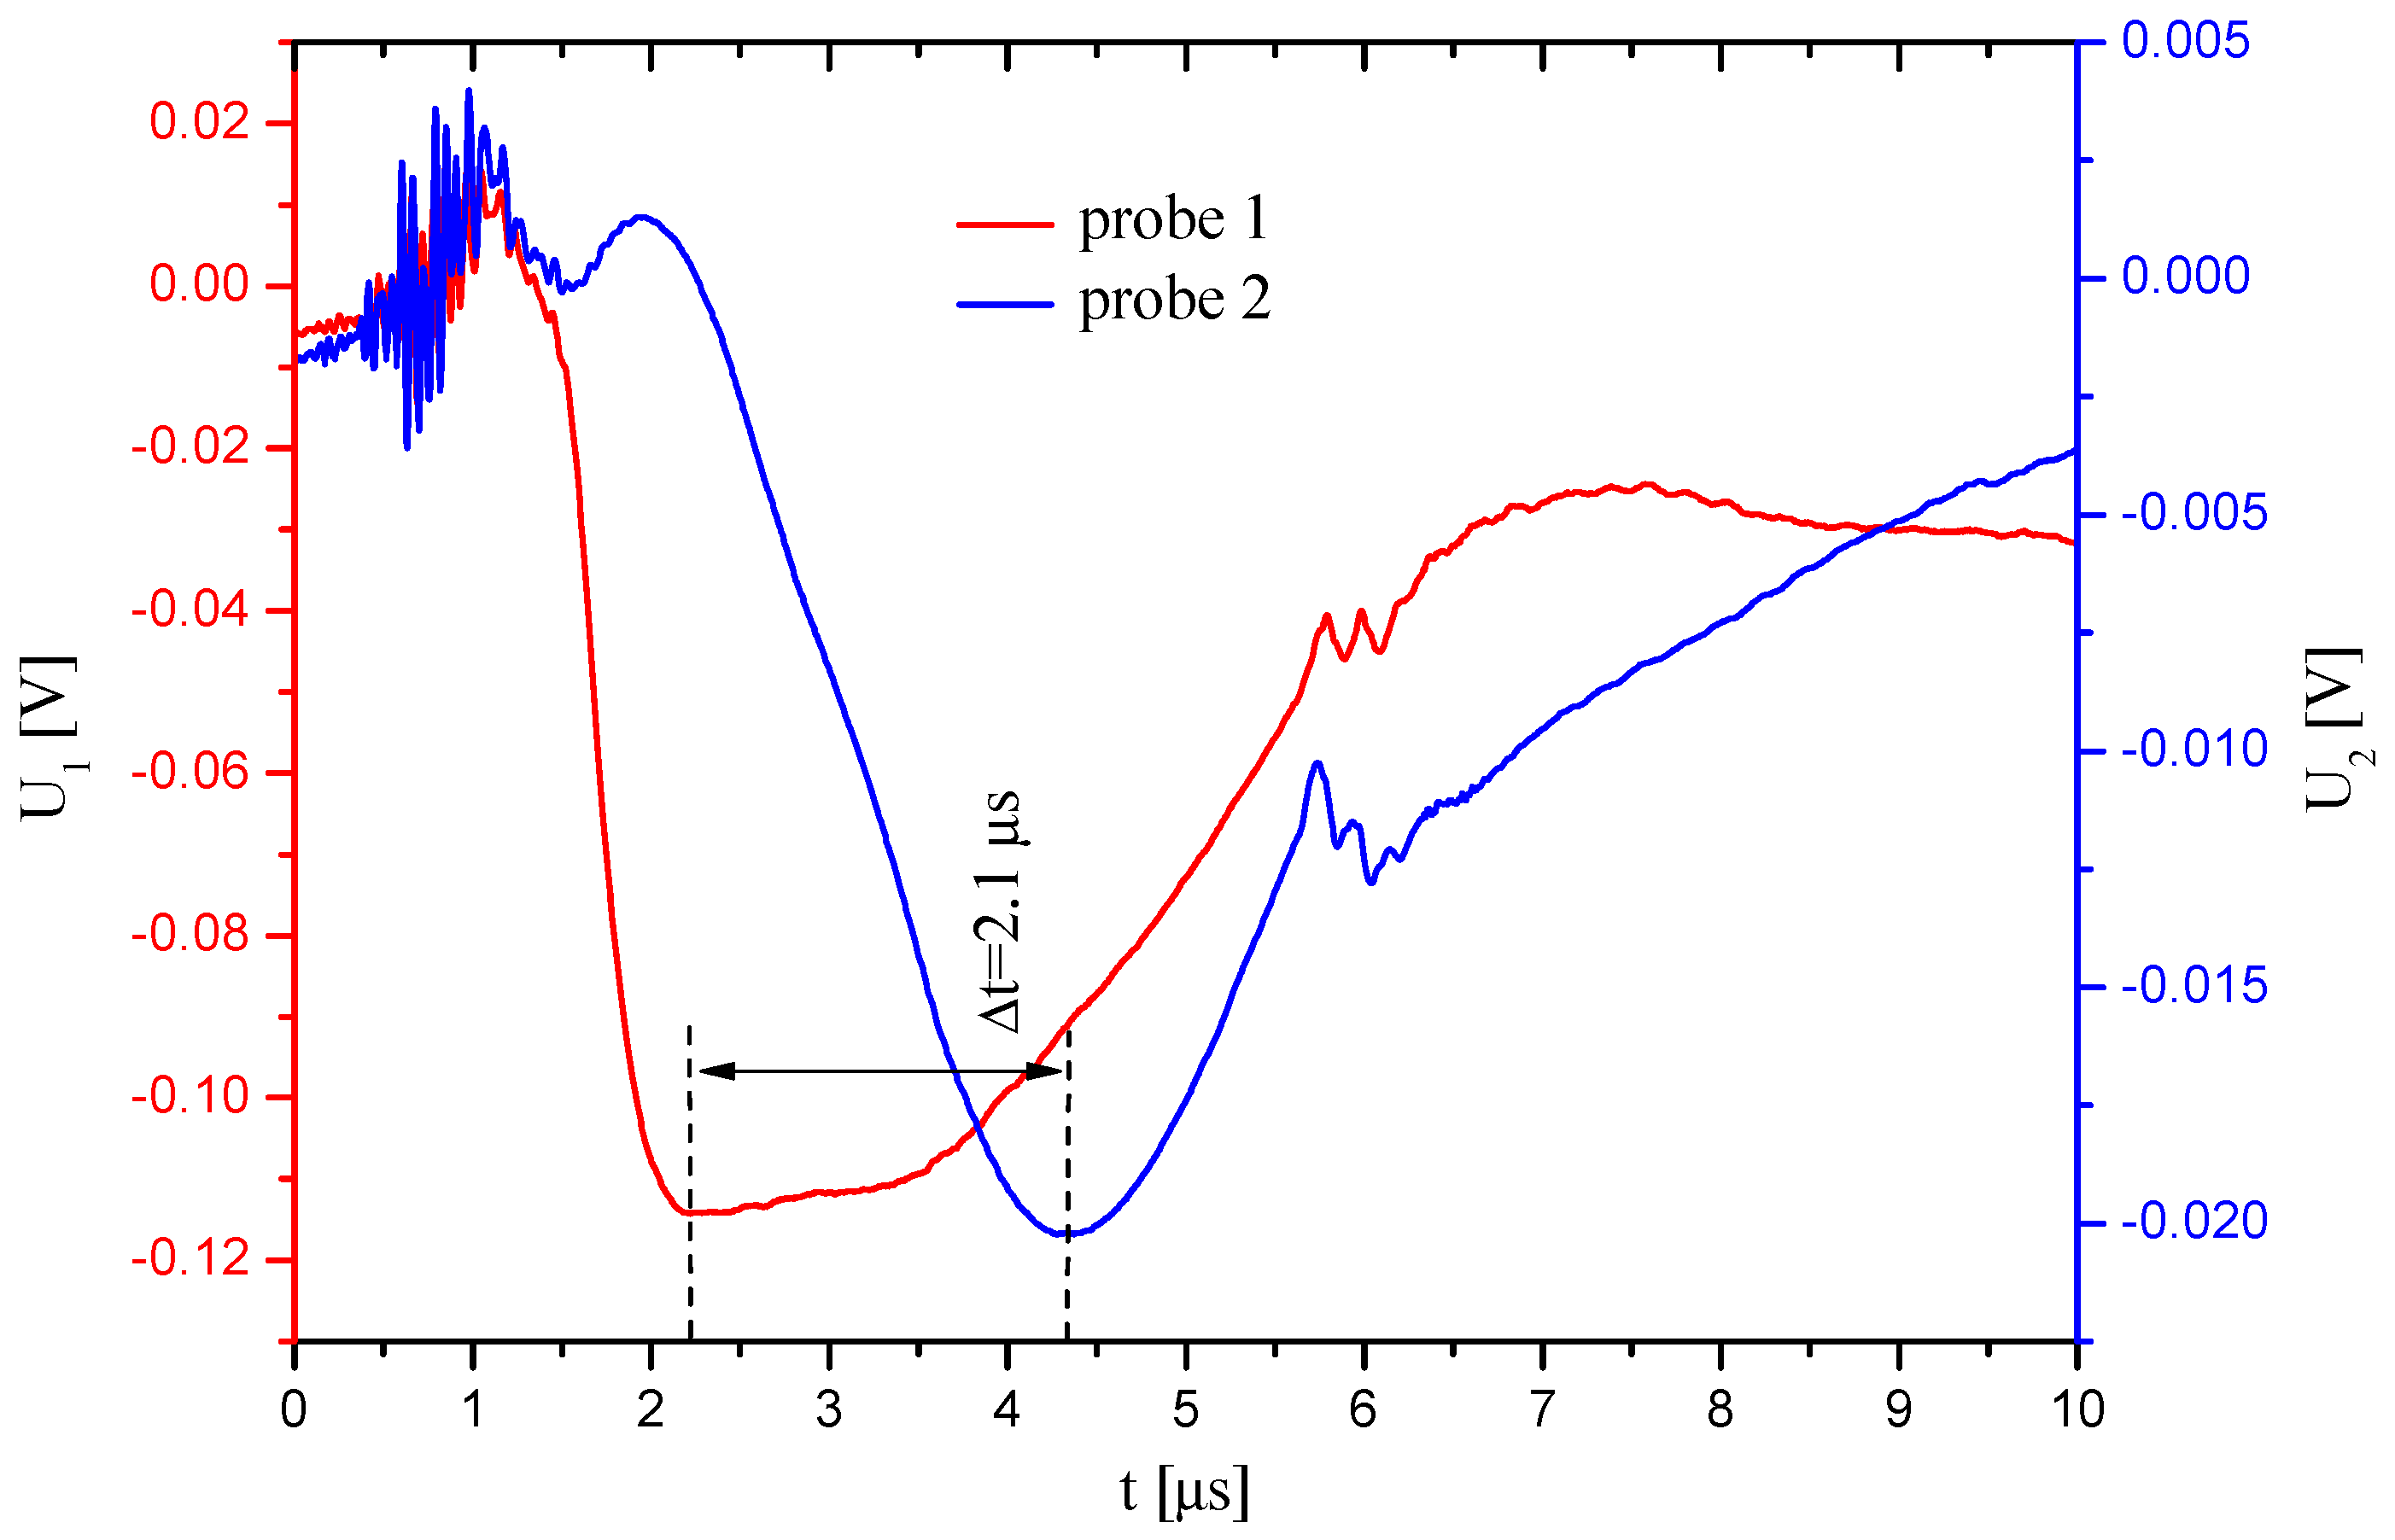
Figure 13.
Oscillograms of the ion current at various bias voltages (Ub) applied to the screen electrode..
Figure 13.
Oscillograms of the ion current at various bias voltages (Ub) applied to the screen electrode..

| 1 | 2.3 | 4.7 | |
| 5.8 | 13.4 | 27.4 | |
| 8.5 | 6.5 | 4.5 |
| 50 | 0.06 | 1.2 | 4.72 x 10⁴ | 1019 |
| -100 | 0.1 | 2 | 7.86 x 10⁴ | 1.67 x 10¹⁹ |
| -150 | 0.17 | 3.4 | 1.34 x 10⁵ | 2.84 x 10¹⁹ |
| -50 | 0.01 | 0.2 | 7.86 x 10³ | 2.92 x 10¹⁸ |
| -100 | 0.016 | 0.32 | 1.26 x 10⁴ | 4.67 x 10¹⁸ |
| -150 | 0.012 | 0.44 | 1.73 x 10⁴ | 6.42 x 10¹⁸ |
Table 3.
Comparative table of material pairs.
| Material Pair | Type of Chemical Bond | Mutual Solubility | Contact Plasticity | Adhesion Possibility | Interaction Features |
| C (graphite) - Cu | Covalent (C) / Metallic (Cu) | None | Graphite - brittle, copper - ductile | Very low | Lack of wettability, weak interatomic interaction, graphite has a layered structure and acts as a dry lubricant |
| W - Cu | Metallic (both metals) | Very low | Cu - ductile, W - hard and brittle | Low | Copper deforms, but tungsten remains hard; adhesion occurs only at high temperatures or under copper melting conditions |
Disclaimer/Publisher’s Note: The statements, opinions and data contained in all publications are solely those of the individual author(s) and contributor(s) and not of MDPI and/or the editor(s). MDPI and/or the editor(s) disclaim responsibility for any in-jury to people or property resulting from any ideas, methods, instructions or products referred to in the content. |
© 2025 by the authors. Licensee MDPI, Basel, Switzerland. This article is an open access article distributed under the terms and conditions of the Creative Commons Attribution (CC BY) license (http://creativecommons.org/licenses/by/4.0/).
Copyright: This open access article is published under a Creative Commons CC BY 4.0 license, which permit the free download, distribution, and reuse, provided that the author and preprint are cited in any reuse.


