
Submitted:
15 August 2025
Posted:
18 August 2025
You are already at the latest version
Abstract
Objective: To investigate the relationship between nutritional status and quality of life (QoL) among hospitalized patients with nasopharyngeal carcinoma (NPC), analyze the influencing factors of malnutrition, and develop a predictive nomogram model for severe malnutrition to inform clinical nutritional support strategies. Methods: This retrospective study included NPC patients admitted to the Department of Head and Neck Oncology from January 1, 2014 to December 31, 2019. Nutritional risk was assessed using the Nutritional Risk Screening 2002 (NRS 2002), while nutritional status was evaluated via the Patient-Generated Subjective Global Assessment (PG-SGA). The European Organization for Research and Treatment of Cancer Quality of Life Questionnaire-Core 30 (EORTC QLQ-C30 v3.0) was used to assess QoL. Logistic regression was employed to identify independent risk factors for severe malnutrition (PG-SGA ≥ 9), and a clinical nomogram model was constructed and validated. Results: A total of 216 NPC patients were included (77.78% male; mean age 50.5 ± 10.58 years). Nutritional screening showed 26.85% had nutritional risk (NRS 2002 ≥ 3), and nutritional assessment revealed that 23.15% had severe malnutrition. Physical measurements, biochemical indicators (including BMI, TSF, MAC, handgrip strength, prealbumin, urea nitrogen), and QoL scores significantly differed among groups with varying nutritional status (p < 0.05), with worsening nutrition associated with poorer outcomes. PG-SGA scores were negatively correlated with QoL function and global health scores, but positively with symptom burden (p < 0.05).Univariate analysis identified age ≥ 65 years, nutritional risk (NRS 2002 ≥ 3), and pain as risk factors for severe malnutrition, while higher KPS score, BMI, and prealbumin were protective. Multivariate analysis confirmed NRS 2002 (OR = 17.14, p < 0.001), KPS (OR = 0.91, p = 0.004), and pain (OR = 2.79, p = 0.002) as independent predictors. A nomogram incorporating these variables demonstrated excellent predictive performance (AUC = 0.903 in training set; 0.825 in validation set), with good calibration and clinical utility per decision curve analysis (DCA). Conclusion: Malnutrition is prevalent in hospitalized NPC patients and is associated with poorer QoL. The predictive nomogram based on NRS 2002, KPS score, and pain score provides a reliable tool for early identification of patients at risk for severe malnutrition, supporting timely and personalized nutritional intervention.
Keywords:
nasopharyngeal carcinoma
; malnutrition
; quality of life
; NRS 2002
; PG-SGA
; multi-factor logistic regression
; predictive model
Background
Nasopharyngeal carcinoma (NPC) is an epithelial malignancy with distinct epidemiological and pathological features. Endemic to Southeast Asia and southern China, NPC is highly associated with Epstein–Barr virus (EBV) infection and typically presents as non-keratinizing carcinoma. Due to its deep-seated anatomical location and radiosensitivity, radiotherapy remains the cornerstone of treatment, often combined with chemotherapy in locally advanced stages to improve outcomes. The disease’s high prevalence in endemic regions and unique clinical behavior make it a significant public health concern in Asia [1]. Radiotherapy remains the cornerstone of treatment for NPC, often combined with chemotherapy for patients with locally advanced disease [2]. However, both the tumor’s metabolic demands and the adverse effects of radio-chemotherapy significantly impair the patient’s physiological functions, particularly affecting the digestive system and oral mucosa, leading to symptoms such as xerostomia, nausea, vomiting, mucositis, and esophagitis [3]. These complications severely compromise appetite and food intake, thereby increasing the risk of malnutrition [4].
Malnutrition is highly prevalent among patients with NPC, with incidence rates ranging from 40% to 80% [5]. As one of the head and neck malignancies most susceptible to nutritional impairment, NPC is associated with the highest risk of significant weight loss in this tumor group. According to the Global Leadership Initiative on Malnutrition (GLIM) criteria, the prevalence of malnutrition in NPC patients increases from 16.8% before radiotherapy to as high as 91.2% post-treatment [6]. Another study reported that 56% of patients experienced more than 5% weight loss within three months prior to therapy [7]. Known risk factors for malnutrition include frequent radiation exposure, low body mass index (BMI), and hypoalbuminemia [8]. Malnutrition has been linked to numerous negative outcomes, including reduced sensitivity to cancer treatment, prolonged hospital stays, increased medical costs, decreased quality of life (QoL), and poor therapeutic efficacy [9, 10]. Moreover, malnutrition is significantly associated with worse progression-free survival (PFS) and overall survival (OS) in NPC patients [11, 12].
In recent years, increasing attention has been paid to the nutritional status of NPC patients and its impact on clinical outcomes. For instance, a meta-analysis indicated that a low prognostic nutritional index (PNI) is correlated with poorer OS, PFS, and distant metastasis-free survival (DMFS) in NPC patients [13]. Another study showed that full-course nutritional support significantly improved nutritional outcomes and treatment tolerance in patients with advanced NPC [14].
Clinically, nutritional evaluation tools such as the Patient-Generated Subjective Global Assessment (PG-SGA) have been widely adopted to assess nutritional status in cancer patients, including those with NPC [15, 16]. Nutritional interventions guided by tools like the Nutritional Risk Screening 2002 (NRS 2002) have been proven effective in improving nutritional status and QoL in this population [4]. Additionally, the European Organization for Research and Treatment of Cancer Quality of Life Questionnaire-Core 30 (EORTC QLQ-C30, version 3.0) provides a validated, multi-dimensional assessment of QoL, facilitating comprehensive evaluation of cancer-related outcomes [17].
Despite the availability of various assessment tools—such as BMI and body weight change—most do not incorporate multi-dimensional clinical factors like inflammatory status, treatment modality, or psychological burden. As such, current tools may fail to provide accurate early prediction of severe malnutrition. Furthermore, with the shift in NPC management from survival prolongation to quality of survival, strategies such as radiation field reduction to limit toxicity are being pursued. However, malnutrition remains a potential barrier to treatment tolerance. Hence, an effective predictive model is urgently needed to enable early identification and timely nutritional intervention. Therefore, the present study aimed to assess the nutritional status of hospitalized NPC patients, identify the associated risk factors, and explore the relationship between nutritional status and QoL. Moreover, we sought to develop a predictive nomogram for severe malnutrition in NPC patients to support individualized nutritional management and improve treatment outcomes and overall QoL.
Materials and Methods
Study Design and Participants
This retrospective study enrolled 216 patients diagnosed with nasopharyngeal carcinoma (NPC), admitted to the Department of Head and Neck Oncology at the Affiliated Hospital of Zunyi Medical University from January1, 2014 to December 31, 2019
Inclusion and Exclusion Criteria
Patients were included if they met the following criteria: (1) age ≥18 years; (2) pathologically confirmed NPC; (3) conscious and able to communicate effectively and cooperate with assessments; (4) only the first hospitalization was considered for patients with multiple admissions; and (5) complete medical records and follow-up data were available.
Exclusion criteria included: (1) pregnancy; (2) end-stage disease; (3) diagnosis of acquired immunodeficiency syndrome (AIDS); (4) need for intensive care; and (5) history of organ transplantation.
Data Collection
Demographic and clinical data were collected through the hospital information system. Collected variables included:
- Sociodemographic data: age, sex, ethnicity, marital status, education level, smoking, alcohol and tea consumption, place of residence, and type of medical insurance.
- Clinical characteristics: disease stage, comorbidities, treatment modality, length of hospital stay, and family history of cancer.
- Physical examination parameters: body weight, body mass index (BMI), triceps skinfold thickness (TSF), mid-arm circumference (MAC), mid-arm muscle circumference (MAMC), non-dominant hand grip strength (NDHGS), and maximum calf circumference (CC).
- Biochemical indicators: total protein (TP), albumin (ALB), globulin (GLOB), prealbumin (PAB), hemoglobin (Hb), white blood cell count (WBC), neutrophil count (NEUT), red blood cell count (RBC), platelet count (PLT), serum creatinine (Cr), and blood urea nitrogen (BUN), as well as derived ratios including neutrophil-to-lymphocyte ratio (NLR), total-to-direct bilirubin ratio (TDR), and prealbumin-to-albumin ratio (PAR).
Nutritional Risk and Status Assessment
Nutritional risk was screened within 24 hours of admission using the Nutritional Risk Screening 2002 (NRS-2002) tool recommended by the European Society for Clinical Nutrition and Metabolism (ESPEN) [18]. A total score ≥3 indicated nutritional risk and the need for intervention [19].
Nutritional status was further evaluated within 48 hours of admission using the Patient-Generated Subjective Global Assessment (PG-SGA) [20], which includes both patient-reported and clinician-evaluated components. Patients were categorized as well-nourished (score 0–1), suspected malnutrition (2–3), moderate malnutrition (4–8), and severe malnutrition (≥9). Intervention was recommended for patients with a score ≥4.
Quality of Life Assessment
Quality of life was assessed using the European Organisation for Research and Treatment of Cancer Quality of Life Questionnaire Core 30 Version 3.0 (EORTC QLQ-C30 V3.0) [21]. The scale consists of 30 items covering five functional domains, nine symptom domains, and a global health status domain. Scores were linearly transformed to a 0–100 scale; higher scores indicate better function or quality of life, except in the symptom domains, where higher scores reflect more severe symptoms.
Functional Status Evaluation
The Karnofsky Performance Status (KPS) scale was used to evaluate patients’ functional status and ability to carry out daily activities [22]. Scores were categorized as: ≥80 (fully independent), 50–70 (partially dependent), and ≤40 (fully dependent).
Nutritional Support Modalities
Nutritional interventions during hospitalization were recorded. Enteral nutrition (EN) was defined as oral or tube feeding providing ≥15 kcal/kg/day for ≥3 consecutive days. Parenteral nutrition (PN) was defined as intravenous administration of glucose, amino acids, and/or lipid emulsions providing non-protein energy ≥15 kcal/kg/day for ≥3 days [23].
Anthropometric Measurements
All physical measurements followed standardized protocols:
- Body weight and BMI [24] were measured using calibrated hospital equipment.
- MAC and MAMC [27] were used to estimate muscle mass, with MAMC calculated as:MAMC = MAC (cm) – 0.314 × TSF (mm).
- NDHGS [28] was measured using a handgrip dynamometer, and the highest value from three attempts was recorded.
- CC was measured at the maximum circumference of the relaxed calf muscle.
Laboratory Measurements
Blood samples were collected within 24 hours of admission for analysis of nutritional and inflammatory markers, including TP, ALB, PAB, Hb, WBC, NEUT, RBC, Cr, and BUN. Ratios such as NLR, PAR, and TDR were calculated to support nutritional risk evaluation [29-31].
Statistical Analysis
All data were analyzed using SPSS version 29.0 and R software version 4.2.3. Categorical variables were expressed as frequencies and percentages, and continuous variables were presented as mean ± standard deviation or median with interquartile range, depending on data distribution. Differences between groups were tested using ANOVA or Kruskal–Wallis test for continuous variables, and chi-square test for categorical variables. Pearson correlation analysis was used for normally distributed continuous variables. Logistic regression was applied to identify risk factors for severe malnutrition. Model performance was evaluated using ROC curves (via pROC package) and calibration curves (rms package). A p-value <0.05 was considered statistically significant.
Flowchart of Study Design and Data Analysis
Results
Demographics and Sociocultural Characteristics
A total of 216 patients with nasopharyngeal carcinoma (NPC) were included in this study. The majority were male (77.78%) and under 65 years of age (87.96%). Most participants were married (95.37%) and of Han ethnicity (87.96%). Over half of the patients (52.31%) had only primary education or no formal schooling, and 54.63% resided in rural areas. Regarding lifestyle factors, 54.17% had a history of smoking, 20.37% reported alcohol consumption, and 32.41% regularly drank tea. Comorbidities were present in 22.69% of the cohort, and 7.87% reported a family history of cancer. The majority of patients were diagnosed at advanced stages, with 35.65% at stage III and 56.48% at stage IV. The most common treatment modality was chemotherapy alone (48.15%), followed by chemoradiotherapy (22.68%). Notably, 18.52% of patients had not received any antitumor treatment during hospitalization. Based on NRS 2002 screening, 26.85% of patients were at nutritional risk (score ≥3), yet only 5.10% received any form of nutritional support. Most patients (94.90%) did not receive nutritional intervention. The median length of hospital stay was evenly distributed, with 49.07% hospitalized for <12 days and 50.93% for ≥12 days.(Table 1)
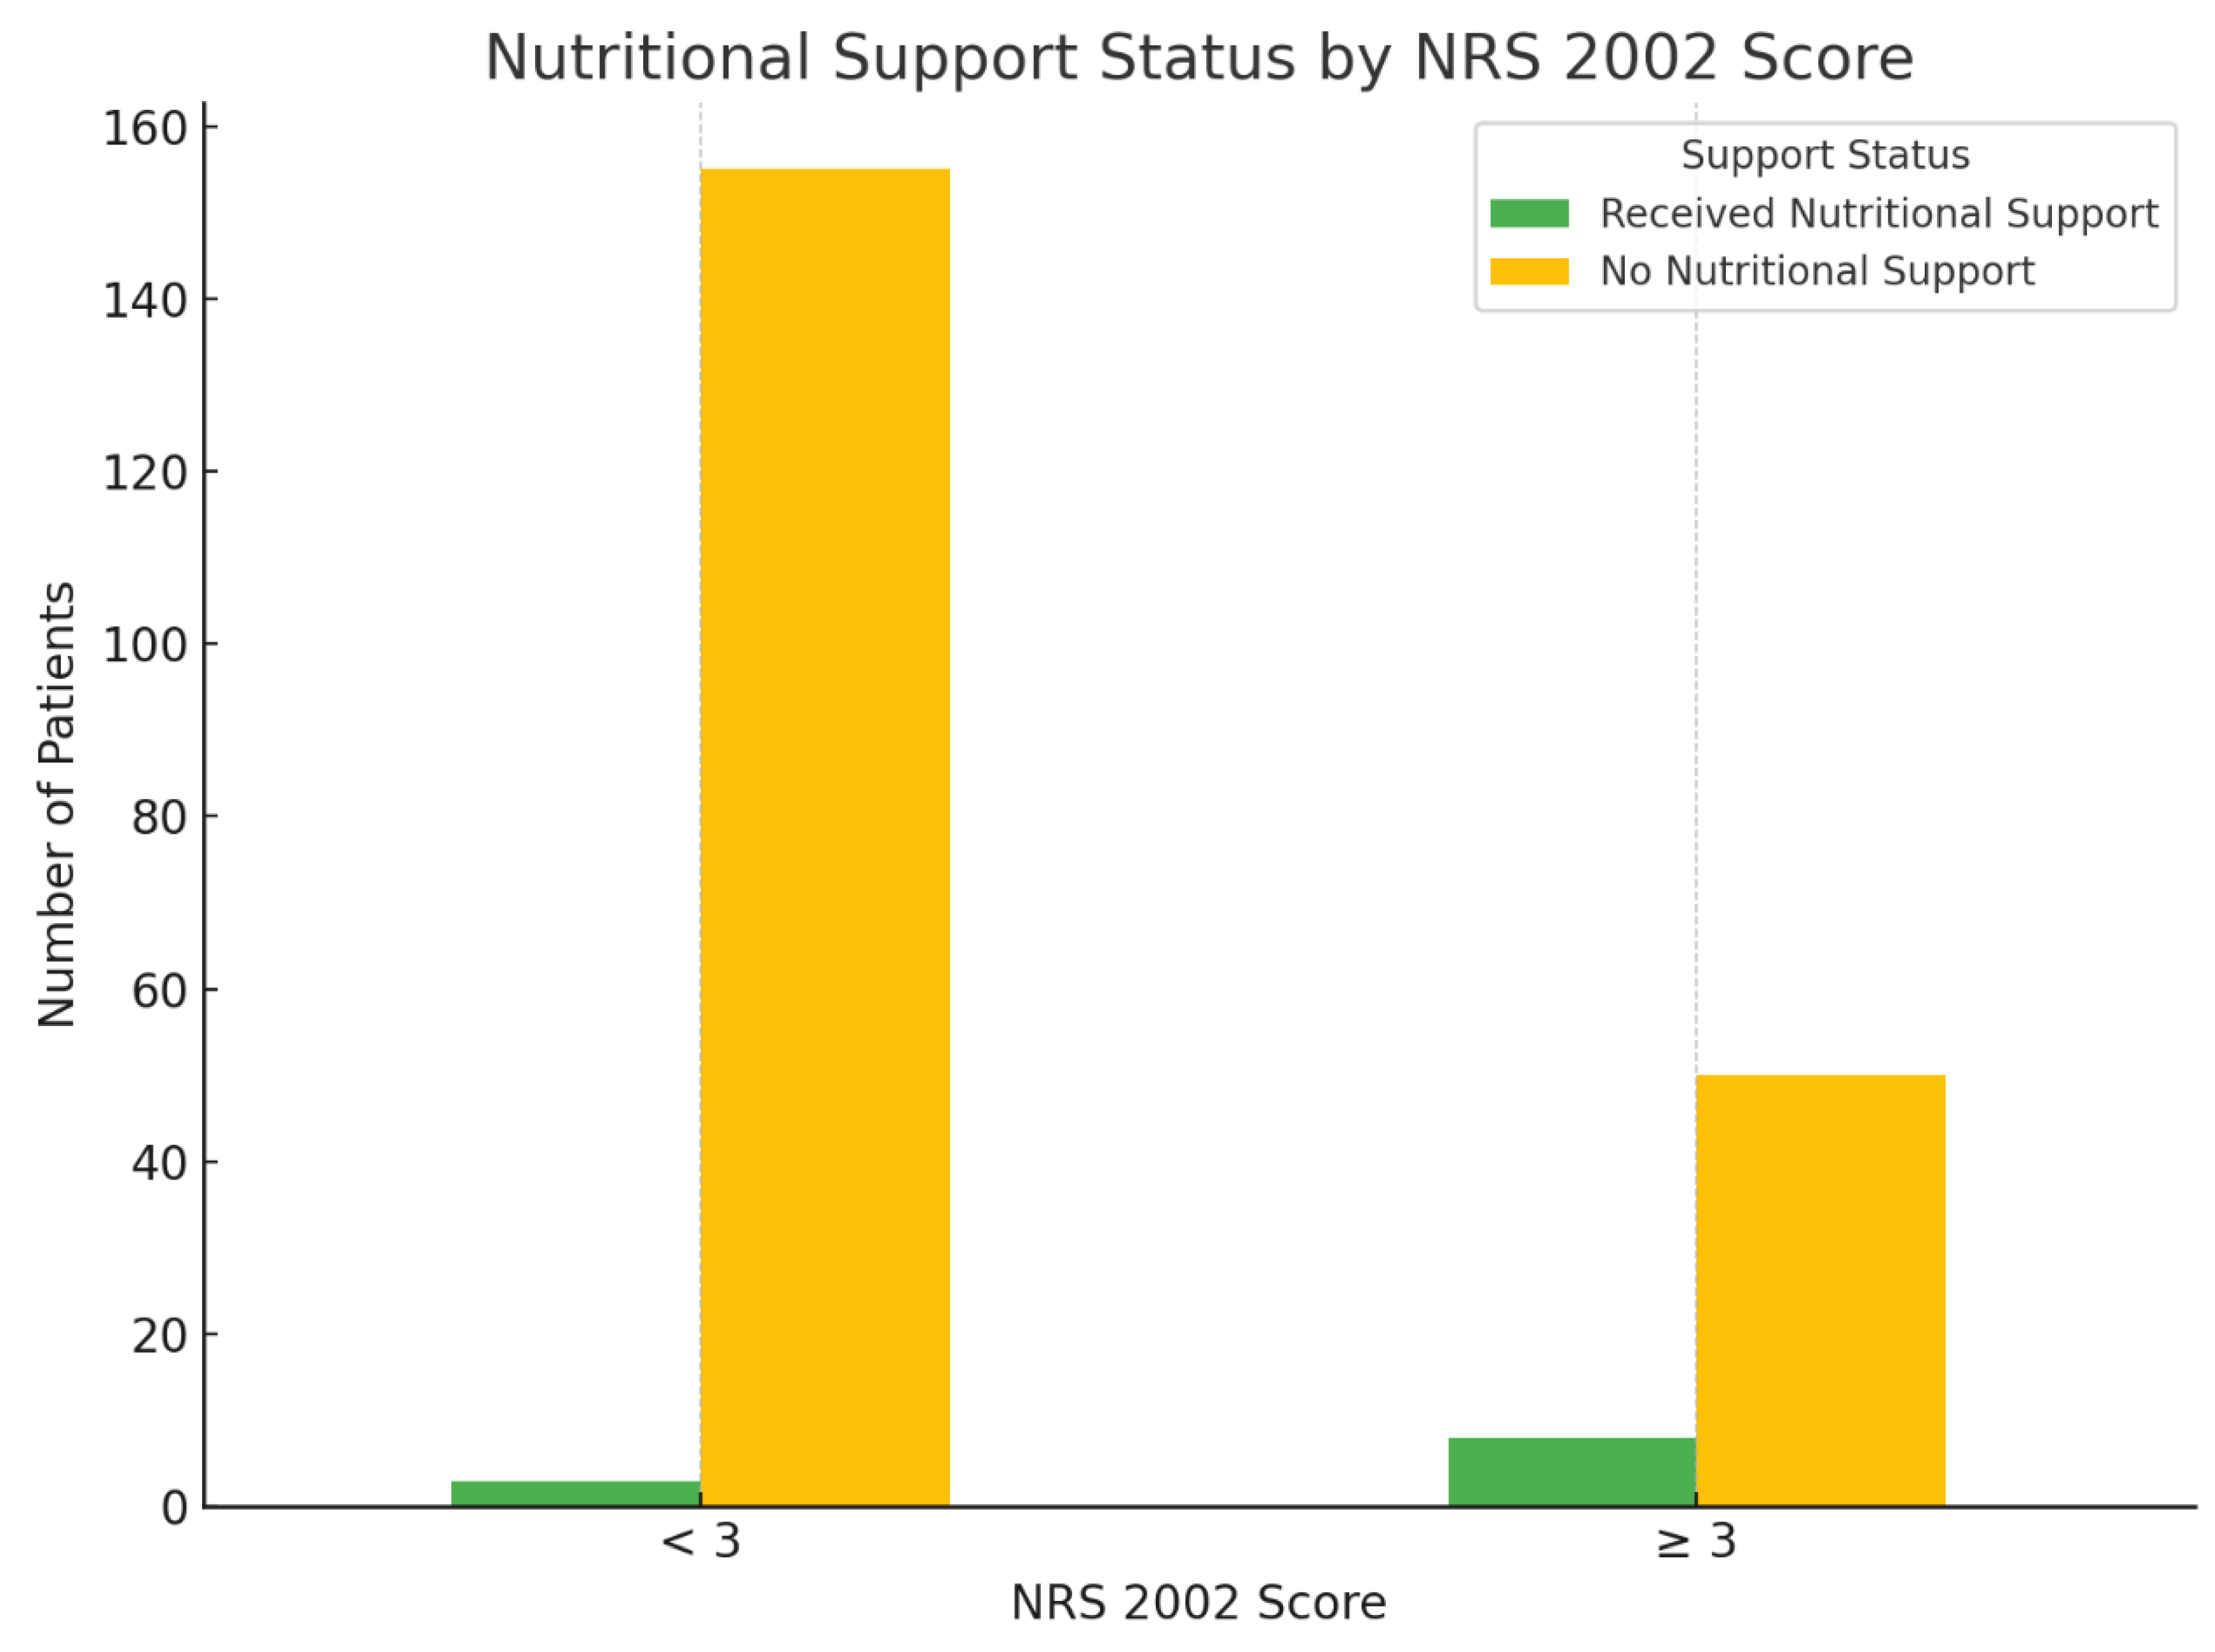
Nutritional Risk Stratification and Support Status
Among the 216 hospitalized patients, 158 (73.15%) were classified as having no nutritional risk (NRS 2002 score <3), and 58 (26.85%) were identified as being at nutritional risk (NRS 2002 score ≥3). Despite the recommendation for nutritional intervention in patients with scores ≥3, only 8 patients (13.79%) in the at-risk group received nutritional support. Conversely, 50 patients (86.21%) with nutritional risk received no intervention. In the non-risk group, nutritional support was provided to just 3 individuals (1.90%). A chi-square test revealed a statistically significant association between NRS 2002 risk classification and the implementation of nutritional support (χ² = 10.08, p = 0.001), suggesting that patients with higher nutritional risk were more likely to receive support. However, the overall rate of intervention among at-risk patients remained low, indicating a gap between nutritional risk identification and clinical action (Figure 2).
Figure 1.
Technical roadmap of the study.
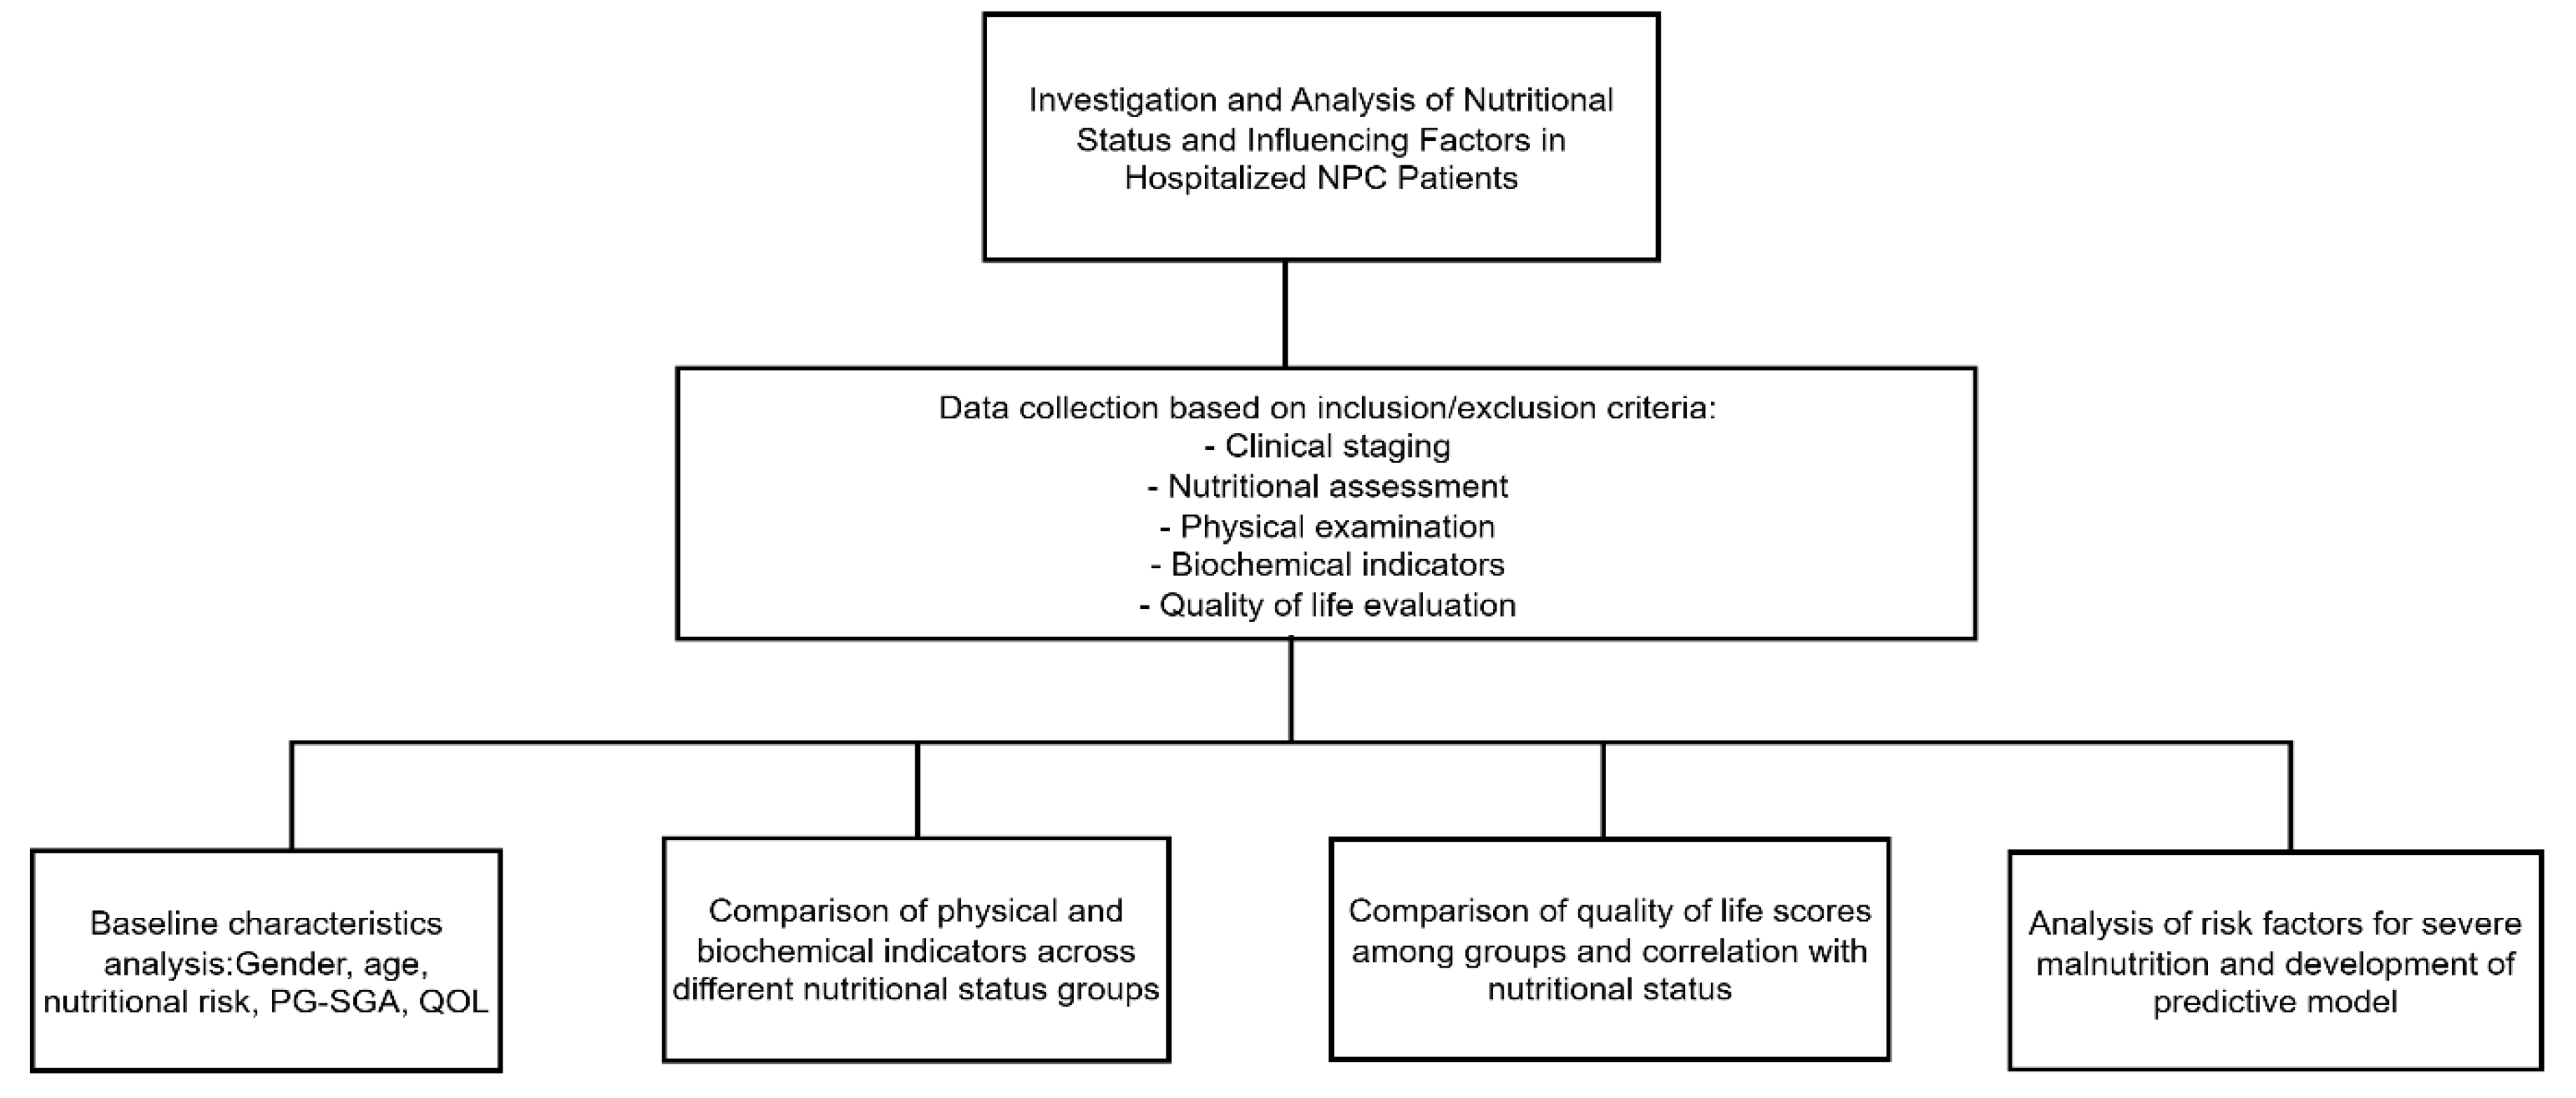
Figure 2.
Physical Measurements Across Nutritional Status Categories.
Comparison of Physical Measurements Among Patients with Different PG-SGA Scores
Patients were stratified into three groups based on PG-SGA scores: well-nourished/suspected malnutrition (0–3 points, n = 104), moderate malnutrition (4–8 points, n = 62), and severe malnutrition (≥9 points, n = 50). The comparison of physical indicators among these groups is shown in Table 2. There were statistically significant differences in most anthropometric parameters across the three nutritional status categories. As PG-SGA scores increased, reflecting worsening nutritional status, weight, BMI, mid-arm circumference (MAC), triceps skinfold thickness (TSF), and non-dominant hand grip strength (ND-HGS) decreased significantly (all p < 0.05). Specifically, mean body weight decreased from 61.23 ± 10.52 kg in the well-nourished group to 55.94 ± 9.40 kg in the severely malnourished group (p = 0.006), while BMI declined from 23.06 ± 3.19 kg/m² to 21.33 ± 3.20 kg/m² (p = 0.006). Additionally, the maximum calf circumference showed a progressive reduction with worsening nutritional status. Both right and left calf circumferences were significantly lower in patients with higher PG-SGA scores (right: F = 8.061, p < 0.001; left: F = 11.251, p < 0.001). However, no statistically significant difference was found in mid-arm muscle circumference (MAMC) among the three groups (p = 0.692). (Table 2)
Biochemical Indicators and Nutritional Status
As shown in Table 4, patients with higher PG-SGA scores, indicating worse nutritional status, exhibited a significant decline in several key biochemical markers. Prealbumin levels decreased progressively from 234.46 ± 63.38 mg/L in the well-nourished group (PG-SGA 0–3) to 195.98 ± 58.50 mg/L in the severely malnourished group (PG-SGA ≥9), with statistically significant differences among the groups (F = 5.840, p = 0.003). Similarly, the neutrophil count increased significantly with worsening nutritional status (F = 5.024, p = 0.007).Blood urea nitrogen (BUN) levels were also significantly elevated in patients with higher PG-SGA scores (F = 4.277, p = 0.015), suggesting possible protein catabolism or metabolic stress in severely malnourished individuals. Regarding nutritional indices, the neutrophil-to-WBC ratio (NLR) increased with worsening nutrition (F = 3.500, p = 0.032), while the prealbumin-to-albumin ratio (PAR) decreased significantly (F = 5.168, p = 0.006), supporting the trend of declining nutritional reserves. In contrast, total protein, albumin, hemoglobin, white blood cell count, creatinine, and total-to-direct bilirubin ratio (TDR) showed no statistically significant differences among groups (all p > 0.05). Red blood cell count appeared inconsistent and may be subject to measurement error. (Table 3)

Table 3.
Comparison of Biochemical Indicators Among Patients with Different PG-SGA Scores.
| Variable | PG-SGA | F | p-value | ||
| 0–3(n = 104) | 4–8(n = 62) | ≥9(n = 50) | |||
| Albumin (g/L) | 39.63 ± 4.13 | 38.91 ± 4.60 | 38.33 ± 4.88 | 1.555 | 0.214 |
| Prealbumin (mg/L) | 234.46 ± 63.38 | 219.48 ± 74.16 | 195.98 ± 58.50 | 5.84 | 0.003 |
| Hemoglobin (g/L) | 127.05 ± 18.72 | 125.11 ± 19.85 | 120.64 ± 18.46 | 1.925 | 0.148 |
| White Blood Cell Count (×10⁹/L) | 5.41 ± 2.02 | 5.37 ± 2.06 | 6.15 ± 3.38 | 1.856 | 0.159 |
| Neutrophil Count (×10⁹/L) | 3.19 ± 1.51 | 3.26 ± 1.65 | 4.25 ± 3.08 | 5.024 | 0.007 |
| Red Blood Cell Count (×10¹²/L) | 11.28 ± 71.56 | 4.09 ± 0.63 | 4.04 ± 0.64 | 0.568 | 0.568 |
| Creatinine (μmol/L) | 77.61 ± 23.22 | 77.95 ± 31.24 | 76.80 ± 17.80 | 0.031 | 0.969 |
| Blood Urea Nitrogen (mmol/L) | 5.64 ± 5.86 | 5.91 ± 3.75 | 20.75 ± 65.65 | 4.277 | 0.015 |
| Neutrophil-to-WBC Ratio (NLR) | 0.58 ± 0.12 | 0.60 ± 0.14 | 0.64 ± 0.14 | 3.5 | 0.032 |
| Total-to-Direct Bilirubin Ratio (TDR) | 4.11 ± 2.85 | 3.96 ± 1.14 | 4.64 ± 4.02 | 0.876 | 0.416 |
| Prealbumin-to-Albumin Ratio (PAR) | 5.88 ± 1.32 | 5.58 ± 1.68 | 5.08 ± 1.40 | 5.168 | 0.006 |
Table 4.
EORTC QLQ-C30 Functional and Symptom Domains by PG-SGA Categories.
| Domain | PG-SGA | ||||
| 0–3 (n = 104) | 4–8 (n = 62) | ≥9 (n = 50) | Z | p-value | |
| Functional Domains | |||||
| Physical Functioning | 93.33 (86.67, 100.00) | 90.00 (80.00, 100.00) | 73.33 (60.00, 86.67) | 44.491 | <0.001 |
| Role Functioning | 100.00 (66.67, 100.00) | 75.00 (66.67, 100.00) | 66.67 (50.00, 66.67) | 34.528 | <0.001 |
| Emotional Functioning | 91.67 (75.00, 100.00) | 83.33 (75.00, 100.00) | 75.00 (66.67, 91.67) | 14.897 | 0.001 |
| Cognitive Functioning | 83.33 (83.33, 100.00) | 83.33 (66.67, 100.00) | 66.67 (66.67, 87.50) | 10.711 | 0.005 |
| Social Functioning | 66.67 (66.67, 79.17) | 66.67 (66.67, 66.67) | 66.67 (33.33, 66.67) | 30.886 | <0.001 |
| Global Health Status/QoL | 66.67 (66.67, 83.33) | 66.67 (50.00, 66.67) | 50.00 (33.33, 50.00) | 51.936 | <0.001 |
| Symptom Domains | |||||
| Fatigue | 11.11 (11.11, 22.22) | 22.22 (11.11, 33.33) | 33.33 (22.22, 44.44) | 42.921 | <0.001 |
| Nausea and Vomiting | 0.00 (0.00, 0.00) | 0.00 (0.00, 16.67) | 16.67 (0.00, 33.33) | 17.43 | <0.001 |
| Pain | 0.00 (0.00, 16.67) | 16.67 (0.00, 33.33) | 33.33 (0.00, 33.33) | 18.258 | <0.001 |
| Dyspnea | 0.00 (0.00, 0.00) | 0.00 (0.00, 0.00) | 0.00 (0.00, 33.33) | 2.975 | 0.226 |
| Insomnia | 0.00 (0.00, 33.33) | 0.00 (0.00, 33.33) | 33.33 (0.00, 66.67) | 12.05 | 0.002 |
| Appetite Loss | 0.00 (0.00, 0.00) | 33.33 (0.00, 33.33) | 33.33 (0.00, 66.67) | 50.39 | <0.001 |
| Constipation | 0.00 (0.00, 0.00) | 0.00 (0.00, 33.33) | 33.33 (0.00, 33.33) | 20.04 | <0.001 |
| Diarrhea | 0.00 (0.00, 0.00) | 0.00 (0.00, 0.00) | 0.00 (0.00, 0.00) | 2.266 | 0.322 |
| Financial Difficulties | 33.33 (33.33, 66.67) | 33.33 (33.33, 66.67) | 33.33 (33.33, 66.67) | 2.83 | 0.243 |
Comparison of Quality of Life Among Patients with Different Nutritional Statuses
A comparison of EORTC QLQ-C30 scores across different PG-SGA nutritional status groups revealed that functional scores declined progressively with worsening nutritional status. Patients with PG-SGA scores ≥9 exhibited significantly lower scores in physical, role, emotional, cognitive, and social functioning (all p < 0.01). Notably, global health status was also substantially compromised in this group (Z = 51.936, p < 0.001). Simultaneously, symptom scores increased with higher PG-SGA levels. Fatigue, pain, nausea/vomiting, insomnia, appetite loss, and constipation were all significantly more prevalent among patients with moderate to severe malnutrition (PG-SGA ≥4) (p < 0.01 for all). No significant variation was observed across groups in dyspnea, diarrhea, or financial burden (p > 0.05).These findings confirm that nutritional deterioration in NPC patients is strongly associated with both impaired functioning and higher symptom burden, underscoring the clinical importance of early nutritional risk identification and intervention(Table 4, Figure 3).
Correlation Analysis Between Nutritional Status and Quality of Life
Correlation analysis showed that the PG-SGA score was negatively associated with all functional domains of the QLQ-C30, including physical (r = -0.480), role (r = -0.424), emotional (r = -0.339), cognitive (r = -0.313), and social functioning (r = -0.405), as well as overall quality of life (r = -0.528), all with p < 0.001. This indicates that worse nutritional status is strongly correlated with lower quality of life and functional capacity. Conversely, the PG-SGA score was positively correlated with symptom burden, particularly fatigue (r = 0.509), appetite loss (r = 0.511), and constipation (r = 0.389), among others. Significant associations were also observed for nausea and vomiting, pain, dyspnea, and insomnia (all p < 0.05). Diarrhea and financial difficulties showed weaker but still statistically significant correlations (r = 0.156, p = 0.021; r = 0.172, p = 0.011, respectively).(Figure 4)
Development of a Predictive Model for Severe Malnutrition
Flowchart of Model Construction
The flow diagram illustrates the methodological framework for constructing a predictive model. A total of 216 hospitalized nasopharyngeal carcinoma (NPC) patients were retrospectively collected and randomly divided into a training set (n = 152) and a validation set (n = 64) using the “caret” package at a 7:3 ratio. Univariate and multivariate logistic regression were performed on the training set to identify significant predictors. A nomogram was developed and internally validated using ROC curves, calibration plots, and decision curve analysis (DCA) in the validation set.(Figure 5)
Univariate Analysis of Factors Associated with Severe Malnutrition
Univariate logistic regression analysis was performed to identify factors associated with severe malnutrition among hospitalized nasopharyngeal carcinoma (NPC) patients. The results showed that a lower Karnofsky Performance Status (KPS) score (OR = 0.92, 95% CI: 0.87–0.98, p = 0.012), lower triceps skinfold thickness (TSF) (OR = 0.90, 95% CI: 0.83–0.98, p = 0.010), presence of pain (OR = 2.72, 95% CI: 1.50–4.93, p = 0.001), and NRS2002 score ≥3 (OR = 19.60, 95% CI: 7.25–52.94, p < 0.001) were significantly associated with increased odds of severe malnutrition. In contrast, patients with normal BMI (OR = 0.19, 95% CI: 0.06–0.61, p = 0.006) and those classified as overweight (OR = 0.19, 95% CI: 0.05–0.73, p = 0.015) were less likely to develop severe malnutrition. Other factors such as gender, age, comorbidities, and tumor stage did not show statistically significant associations(Table 5,Figure 6).
Multivariate Logistic Regression Analysis of Risk Factors for Severe Malnutrition
Multivariate logistic regression was conducted to identify independent risk factors for severe malnutrition among hospitalized nasopharyngeal carcinoma (NPC) patients. Variables with p < 0.05 in the univariate analysis—including KPS score, pain, TSF, BMI, and NRS-2002 score—were entered into the model. The results demonstrated that higher pain scores (OR = 2.81, 95% CI: 1.23–6.41, p = 0.014) and higher NRS-2002 scores (OR = 28.52, 95% CI: 8.09–100.56, p < 0.001) were significantly associated with an increased risk of severe malnutrition. Conversely, greater triceps skinfold thickness (TSF) was a protective factor (OR = 0.83, 95% CI: 0.72–0.94, p = 0.004).(Table 6, Figure 7)
Construction of the Clinical Nomogram
Based on the results of multivariate logistic regression analysis, a predictive model for severe malnutrition was developed incorporating three independent variables: pain score, triceps skinfold thickness (TSF), and NRS-2002 score. A nomogram was subsequently constructed to facilitate clinical application of the model, allowing for individualized risk prediction of severe malnutrition in hospitalized NPC patients.(Figure 8)
Evaluation of the Nomogram’s Clinical Performance
In the training cohort, the predictive model demonstrated excellent discriminative ability, with an area under the curve (AUC) of 0.903 (95% CI: 0.846–0.960) (Figure 9a). The calibration plot also showed good agreement between predicted and observed probabilities (Figure 9c). The Hosmer–Lemeshow goodness-of-fit test yielded a χ² value of 4.670 with a p-value of 0.862, indicating no significant deviation and supporting the model’s adequate calibration. Furthermore, decision curve analysis (DCA) revealed that when the threshold probability was above 0.03, the nomogram provided a greater net clinical benefit compared to the treat-all or treat-none strategies (Figure 8a). In the internal validation cohort, the model maintained good discriminatory power, with an AUC of 0.825 (95% CI: 0.705–0.945) (Figure 9b). Similarly, the calibration plot in the validation cohort confirmed good consistency between predicted and actual outcomes (Figure 9d). DCA in the validation set indicated that the nomogram yielded greater net benefits for patients when the threshold probability ranged from 0.15 to 0.70, compared to universal treatment or no treatment strategies (Figure 9b).
Discussion
Malnutrition is prevalent among patients with head and neck cancers, particularly nasopharyngeal carcinoma (NPC), second only to gastrointestinal malignancies in its impact on nutritional status [32]. Beyond the pathophysiological effects of the tumor itself, treatments such as radiotherapy and chemotherapy significantly impair sensory perception (taste and smell), mastication, swallowing, and salivary gland function. Notably, the incidence of malnutrition can reach 75.37% during mid-treatment and 85.05% at the end of treatment in NPC patients undergoing intensity-modulated radiotherapy combined with concurrent chemotherapy [4]. These nutritional impairments may adversely affect treatment tolerance and response, increase complications, and even reduce survival outcomes, highlighting the critical need for timely nutritional screening and intervention.
In alignment with the guidelines of the Chinese Anti-Cancer Association, our study used the Nutritional Risk Screening 2002 (NRS 2002) tool to assess risk. Among 216 hospitalized NPC patients, 26.85% (n = 58) were found to be at nutritional risk (NRS 2002 ≥ 3); however, only 8 of them received nutritional support. Further assessment using the Patient-Generated Subjective Global Assessment (PG-SGA) showed that 51.85% of patients had moderate-to-severe malnutrition (PG-SGA ≥ 4), consistent with findings reported by Li et al [33].During radiotherapy and chemotherapy, the rate of severe malnutrition has been reported as high as 80.7% [34].
It is important to distinguish between nutritional screening and assessment. Screening tools such as NRS 2002 identify patients at risk of malnutrition-related complications, while assessment tools like PG-SGA provide a more comprehensive evaluation by integrating body weight, dietary intake, anthropometric measurements, and biochemical indicators [35]. In our study, PG-SGA scores were negatively correlated with quality of life (QoL) metrics, with higher malnutrition severity associated with poorer QoL. This observation aligns with Polański et al., who also reported inverse relationships between nutritional status and functional QoL domains in cancer patients [36].
Recent studies emphasize the value of multidisciplinary nutrition management models in improving the nutritional status and QoL in NPC patients. Severe malnutrition in NPC is associated with poor survival, higher treatment-related complications, weight loss, and diminished functional capacity [37-40]. Previous studies have identified tumor characteristics, treatment regimens, and patient-related factors as contributors to nutritional decline [8, 13, 38]. In our cohort, concurrent chemoradiotherapy emerged as a major risk factor for severe malnutrition, likely due to its adverse effects on oral and pharyngeal mucosa, taste, salivary function, and gastrointestinal symptoms such as nausea and vomiting induced by platinum-based agents.
Our findings also identified TSF, pain, and NRS 2002 score as independent risk factors for severe malnutrition. These results underscore the importance of comprehensive nutritional assessment, especially in patients undergoing aggressive treatment. Given the strong link between nutrition and QoL, early and effective intervention is essential. To address the lack of efficient predictive tools, we developed a novel nomogram incorporating three easily obtainable clinical indicators—TSF, pain score, and NRS 2002 score. This model demonstrated excellent discrimination in both training (AUC = 0.903) and validation (AUC = 0.825) datasets. Its simplicity and accessibility make it suitable for routine clinical application, allowing for timely identification of high-risk patients and personalized nutritional intervention. Compared with the model proposed by Wang et al [41].—which included six variables (e.g., age, total radiation dose, albumin, and chloride levels)—our model offers greater clinical feasibility by relying solely on non-invasive, routinely collected data. Furthermore, while Wang’s model predicted general malnutrition (PG-SGA ≥ 2), our model specifically targeted severe malnutrition (PG-SGA ≥ 9), providing greater specificity.
Nevertheless, this study has limitations. Although the sample size was relatively large, it was derived from a single center, which may limit the generalizability of the findings. Additionally, the cross-sectional design prevents establishing causal relationships between the identified risk factors and severe malnutrition. Future research should focus on multicenter prospective studies with longer follow-up durations to validate and optimize the predictive model. Other potential contributors—such as inflammatory markers and genetic predispositions—were not included and should be explored to enhance the model’s predictive power.
In conclusion, malnutrition is highly prevalent in NPC patients and strongly associated with poor QoL. Routine nutritional screening and early intervention are crucial. The predictive nomogram developed in this study offers a practical tool for identifying patients at high risk of severe malnutrition, facilitating targeted nutritional support to improve treatment outcomes and QoL.
Author Contributions
Conceptualization, Hu Ma and Xiaoxia Gou; Data curation, Kai Zhou; Formal analysis, Jinzhi Wu; Funding acquisition, Shasha Shen, Hui Xu and Xiaoxia Gou; Investigation, Guoping He and Bi Feng; Methodology, Kai Zhou; Resources, Yan Lou and Xiaoxia Gou; Software, Hui Xu; Supervision, Hu Ma; Validation, Xin Tian; Writing – original draft, Shasha Shen and Kai Zhou; Writing – review & editing, Shasha Shen. All authors will be updated at each stage of manuscript processing, including submission, revision, and revision reminder, via emails from our system or the assigned Assistant Editor.
Funding
This work was supported by the following funding sources: Science and Technology Project of the Guizhou Anti-Cancer Association (No. 006 [2023]) Beijing Huakang Charity Foundation Project, EXZL-GX-028 Zunyi Science and Technology Bureau (Grant Nos. ZSKH-HZ-2025-124 and ZSKH-HZ-2025-147) Science and Technology Fund of the Guizhou Provincial Health Commission gzwkj2025-221 The funders had no role in study design, data collection, analysis, or manuscript preparation.
Informed Consent Statement
Not applicable due to the retrospective design and use of anonymized data.
Informed Consent Statement
Not applicable. Patient data were anonymized to protect privacy.
Data Availability Statement
The datasets generated and analyzed during this study are available from the corresponding authors upon reasonable request.
Acknowledgements
We thank the staff of the Department of Oncology at the Second Affiliated Hospital, Zunyi Medical University for their assistance in data collection and support.
Conflict of Interests
The authors declare no competing interests.
Ethical Approval:
This retrospective study used anonymized existing clinical data and did not involve any interventions or interactions with patients. According to the institutional policy of The Second Affiliated Hospital of Zunyi Medical University, ethical approval was not required for this study.
Declaration of Generative AI and AI-Assisted Technologies in the Writing Process
The authors declare that generative AI and AI-assisted technologies (ChatGPT) were used to assist in the translation of the manuscript from Chinese to English. All translated content was carefully reviewed, edited, and approved by the authors to ensure the accuracy, clarity, and integrity of the final manuscript.
References
- Chen, Y.P.; Chan, A.T.C.; Le, Q.T.; Blanchard, P.; Sun, Y.; Ma, J. Nasopharyngeal carcinoma. Lancet 2019, 394, 64–80. [Google Scholar] [CrossRef] [PubMed]
- Chang, W.P. Relationship between changes in nutritional status during treatment and overall survival of newly diagnosed nasopharyngeal carcinoma patients. Eur J Oncol Nurs 2024, 73, 102721. [Google Scholar] [CrossRef] [PubMed]
- Huang, J.F.; Sun, R.J.; Jiang, W.J.; Wu, P.; Zhang, L.; Xu, M.Q.; Zhou, L.Y.; Pang, Q.F.; Wu, Y.X.; Yang, B.; Zhang, F.Z. Systematic nutrition management for locally advanced nasopharyngeal carcinoma patients undergoing radiotherapy. Onco Targets Ther 2019, 12, 8379–8386. [Google Scholar] [CrossRef] [PubMed]
- Fan, X.; Cui, H.; Liu, S. Summary of the best evidence for nutritional support programs in nasopharyngeal carcinoma patients undergoing radiotherapy. Front Nutr 2024, 11, 1413117. [Google Scholar] [CrossRef]
- Anghel, R.; Bîlteanu, L.; Folea, A.R.; Marinescu Ș, A.; Pisoschi, A.M.; Alexandrescu, M.F.; Dumachi, A.I.; Galeș, L.N.; Trifănescu, O.G.; Zgură, A.F.; et al. Assessing the Impact of Nutritional Status on the Quality of Life in Head and Neck Cancer Patients-The Need for Comprehensive Digital Tools. Cancers (Basel) 2025, 17. [Google Scholar] [CrossRef]
- Wan, M.; Zhang, L.; Chen, C.; Zhao, D.; Zheng, B.; Xiao, S.; Liu, W.; Xu, X.; Wang, Y.; Zhuang, B.; et al. GLIM Criteria-Defined Malnutrition Informs on Survival of Nasopharyngeal Carcinoma Patients Undergoing Radiotherapy. Nutr Cancer 2022, 74, 2920–2929. [Google Scholar] [CrossRef]
- Qiu, C.; Yang, N.; Tian, G.; Liu, H. Weight loss during radiotherapy for nasopharyngeal carcinoma: a prospective study from northern China. Nutr Cancer 2011, 63, 873–879. [Google Scholar] [CrossRef]
- Wang, P.; Huang, X.; Xue, L.; Liao, J.; Liu, J.; Yu, J.; Li, T. Nutritional risk factors in patients with nasopharyngeal carcinoma: a cross-sectional study. Front Nutr 2024, 11, 1386361. [Google Scholar] [CrossRef]
- Zhang, B.; Najarali, Z.; Ruo, L.; Alhusaini, A.; Solis, N.; Valencia, M.; Sanchez, M.I.P.; Serrano, P.E. Effect of Perioperative Nutritional Supplementation on Postoperative Complications-Systematic Review and Meta-Analysis. J Gastrointest Surg 2019, 23, 1682–1693. [Google Scholar] [CrossRef]
- Reber, E.; Schönenberger, K.A.; Vasiloglou, M.F.; Stanga, Z. Nutritional Risk Screening in Cancer Patients: The First Step Toward Better Clinical Outcome. Front Nutr 2021, 8, 603936. [Google Scholar] [CrossRef]
- Cheng, G.; Yuan, S.; Wang, J.; Deng, S.; Wu, Y.; Wang, Y.; Shen, Y.; Li, L. A prognostic nomogram for patients with III-IV nasopharyngeal carcinoma based on dynamic changes in the inflammatory and nutrition index. Clin Transl Oncol 2025, 27, 2638–2650. [Google Scholar] [CrossRef]
- Tang, M.; Jia, Z.; Zhang, J. The prognostic role of prognostic nutritional index in nasopharyngeal carcinoma: A systematic review and meta-analysis. Int J Clin Oncol 2021, 26, 66–77. [Google Scholar] [CrossRef] [PubMed]
- Du, X.J.; Tang, L.L.; Mao, Y.P.; Guo, R.; Sun, Y.; Lin, A.H.; Ma, J. Value of the prognostic nutritional index and weight loss in predicting metastasis and long-term mortality in nasopharyngeal carcinoma. J Transl Med 2015, 13, 364. [Google Scholar] [CrossRef] [PubMed]
- Lin, F.; Ren, H.; Lin, F.; Pan, Z.; Wu, L.; Yang, N. Evaluation of the Effect of Nutritional Intervention on Patients with Nasopharyngeal Carcinoma. J Healthc Eng 2022, 2022, 2531671. [Google Scholar] [CrossRef] [PubMed]
- Pan, X.; Liu, H.; Feng, G.; Xiao, J.; Wang, M.; Liu, H.; Xie, X.; Rong, Z.; Wu, J.; Liu, M. Role of Muscle Mass and Nutritional Assessment Tools in Evaluating the Nutritional Status of Patients With Locally Advanced Nasopharyngeal Carcinoma. Front Nutr 2021, 8, 567085. [Google Scholar] [CrossRef]
- Azevedo, M.D.; de Pinho, N.B.; de Carvalho Padilha, P.; de Oliveira, L.C.; Peres, W.A.F. Clinical usefulness of the patient-generated subjective global assessment short form(©) for nutritional screening in patients with head and neck cancer: a multicentric study. Ecancermedicalscience 2024, 18, 1662. [Google Scholar]
- Ionescu Miron, A.I.; Anghel, A.V.; Antone-Iordache, I.L.; Atasiei, D.I.; Anghel, C.A.; Barnonschi, A.A.; Bobolocu, A.M.; Verga, C.; Șandru, F.; Lișcu, H.D. Assessing the Impact of Organ Failure and Metastases on Quality of Life in Breast Cancer Patients: A Prospective Study Based on Utilizing EORTC QLQ-C30 and EORTC QLQ-BR45 Questionnaires in Romania. J Pers Med 2024, 14. [Google Scholar] [CrossRef]
- Wang, P.; Tan, Y.; Soh, K.L.; Soh, K.G.; Ning, C.; Xue, L.; Lu, Y.; Yang, J. Nutrition Risk Screening 2002 for Adult Cancer Patients: A Systematic Review and Meta-Analysis. Nutr Cancer 2024, 76, 573–583. [Google Scholar] [CrossRef]
- Zhang, Z.; Wan, Z.; Zhu, Y.; Zhang, L.; Zhang, L.; Wan, H. :. Prevalence of malnutrition comparing NRS2002, MUST, and PG-SGA with the GLIM criteria in adults with cancer: A multi-center study. Nutrition 2021, 83, 111072. [Google Scholar] [CrossRef]
- Ottery, F.D. Rethinking nutritional support of the cancer patient: the new field of nutritional oncology. Semin Oncol 1994, 21, 770–778. [Google Scholar]
- Shuleta-Qehaja, S.; Sterjev, Z.; Shuturkova, L. Evaluation of reliability and validity of the European Organization for Research and Treatment of Cancer Quality of Life Questionnaire (EORTC QLQ-C30, Albanian version) among breast cancer patients from Kosovo. Patient Prefer Adherence 2015, 9, 459–465. [Google Scholar] [CrossRef]
- Siak, P.Y.; Heng, W.S.; Teoh, S.S.H.; Lwin, Y.Y.; Cheah, S.C. Precision medicine in nasopharyngeal carcinoma: comprehensive review of past, present, and future prospect. J Transl Med 2023, 21, 786. [Google Scholar] [CrossRef] [PubMed]
- Rugeles, S.; Villarraga-Angulo, L.G.; Ariza-Gutiérrez, A.; Chaverra-Kornerup, S.; Lasalvia, P.; Rosselli, D. High-protein hypocaloric vs normocaloric enteral nutrition in critically ill patients: A randomized clinical trial. J Crit Care 2016, 35, 110–114. [Google Scholar] [CrossRef] [PubMed]
- Wu, Y.; Li, D.; Vermund, S.H. Advantages and Limitations of the Body Mass Index (BMI) to Assess Adult Obesity. Int J Environ Res Public Health 2024, 21. [Google Scholar] [CrossRef] [PubMed]
- He, L.; Yang, N.; Wang, J.; Huang, J.; Li, W.; Xu, L.; Ping, F.; Li, Y.; Zhang, H. Mid-Arm Muscle and Subcutaneous Fat Associated with All-Cause Mortality Independent of BMI: A Prospective Cohort Study. Obesity (Silver Spring) 2021, 29, 1203–1214. [Google Scholar] [CrossRef]
- Campos, S.B.G.; de Azevedo, S.C.L.; Gomes, T.; Bueno, N.B.; Goulart, M.O.F.; Moura, F.A. Lack of Concordance among Nutritional Diagnostic Methods in Newly Diagnosed Colorectal Cancer Patients. Nutr Cancer 2022, 74, 2067–2074. [Google Scholar] [CrossRef]
- Gort-van Dijk, D.; Weerink, L.B.M.; Milovanovic, M.; Haveman, J.W.; Hemmer, P.H.J.; Dijkstra, G.; Lindeboom, R.; Campmans-Kuijpers, M.J.E. Bioelectrical Impedance Analysis and Mid-Upper Arm Muscle Circumference Can Be Used to Detect Low Muscle Mass in Clinical Practice. Nutrients 2021, 13. [Google Scholar] [CrossRef]
- Morlino, D.; Marra, M.; Cioffi, I.; Sammarco, R.; Speranza, E.; Di Vincenzo, O.; De Caprio, C.; De Filippo, E.; Pasanisi, F. A proposal for reference values of hand grip strength in women with different body mass indexes. Nutrition 2021, 87-88, 111199. [Google Scholar] [CrossRef]
- Keller, U. Nutritional Laboratory Markers in Malnutrition. J Clin Med 2019, 8. [Google Scholar] [CrossRef]
- Andreescu, J.; Ocanto, A.; Couñago, F. Prognostic significance of nutritional and inflammatory markers in colorectal cancer. World J Clin Oncol 2025, 16, 104958. [Google Scholar] [CrossRef]
- Kang, L.; Liu, X.; Ji, W.; Zheng, K.; Li, Y.; Song, Y.; He, H.; Wang, X.; Yang, T.; Guan, M.; et al. Association of Neutrophil-to-Lymphocyte Ratio with Nutrition in Patients with Various Types of Malignant Tumors: A Multicenter Cross-Sectional Study. J Inflamm Res 2023, 16, 1419–1429. [Google Scholar] [CrossRef]
- Pan, H.; Cai, S.; Ji, J.; Jiang, Z.; Liang, H.; Lin, F.; Liu, X. The impact of nutritional status, nutritional risk, and nutritional treatment on clinical outcome of 2248 hospitalized cancer patients: a multi-center, prospective cohort study in Chinese teaching hospitals. Nutr Cancer 2013, 65, 62–70. [Google Scholar] [CrossRef] [PubMed]
- Chen, X.; Liu, X.; Ji, W.; Zhao, Y.; He, Y.; Liu, Y.; Li, Q.; Shi, H.; Cui, J. The PG-SGA outperforms the NRS 2002 for nutritional risk screening in cancer patients: a retrospective study from China. Front Nutr 2023, 10, 1272420. [Google Scholar] [CrossRef] [PubMed]
- Bossi, P.; De Luca, R.; Ciani, O.; D'Angelo, E.; Caccialanza, R. Malnutrition management in oncology: An expert view on controversial issues and future perspectives. Front Oncol 2022, 12, 910770. [Google Scholar] [CrossRef] [PubMed]
- Serón-Arbeloa, C.; Labarta-Monzón, L.; Puzo-Foncillas, J.; Mallor-Bonet, T.; Lafita-López, A.; Bueno-Vidales, N.; Montoro-Huguet, M. Malnutrition Screening and Assessment. Nutrients 2022, 14. [Google Scholar] [CrossRef]
- Polański, J.; Jankowska-Polańska, B.; Mazur, G. Relationship Between Nutritional Status and Quality of Life in Patients with Lung Cancer. Cancer Manag Res 2021, 13, 1407–1416. [Google Scholar] [CrossRef]
- Ou, X.; Chen, H.; Qiu, T.; Yuan, Y.; Gong, X. The impact of multidisciplinary team nutrition management on nutritional and toxicity status in patients with nasopharyngeal carcinoma. Asia Pac J Oncol Nurs 2023, 10, 100237. [Google Scholar] [CrossRef]
- Fan, X.; Cui, H.; Peng, H.; Liu, S.; Jiang, L. The influence of evidence-based nutritional support plans on the nutritional status and adverse effects of radiotherapy in individuals with nasopharyngeal carcinoma. Front Nutr 2025, 12, 1503294. [Google Scholar] [CrossRef]
- Zeng, Q.; Shen, L.J.; Guo, X.; Guo, X.M.; Qian, C.N.; Wu, P.H. Critical weight loss predicts poor prognosis in nasopharyngeal carcinoma. BMC Cancer 2016, 16, 169. [Google Scholar] [CrossRef]
- Wang, X.; Yang, M.; Ge, Y.; Tang, M.; Rao, B.; Chen, Y.; Xu, H.; Cong, M.; Guo, Z.; Shi, H. Association of Systemic Inflammation and Malnutrition With Survival in Nasopharyngeal Carcinoma Undergoing Chemoradiotherapy: Results From a Multicenter Cohort Study. Front Oncol 2021, 11, 766398. [Google Scholar] [CrossRef]
- Wang, P.; Huang, X.; Liu, Y.; Xue, L.; Ning, C.; Jiang, L.; Liu, J. Risk factors and the nomogram model for malnutrition in patients with nasopharyngeal carcinoma. Support Care Cancer 2024, 32, 256. [Google Scholar] [CrossRef]
Figure 3.
Correlation radar chart between PG-SGA score and QLQ-C30 domains in NPC patients.
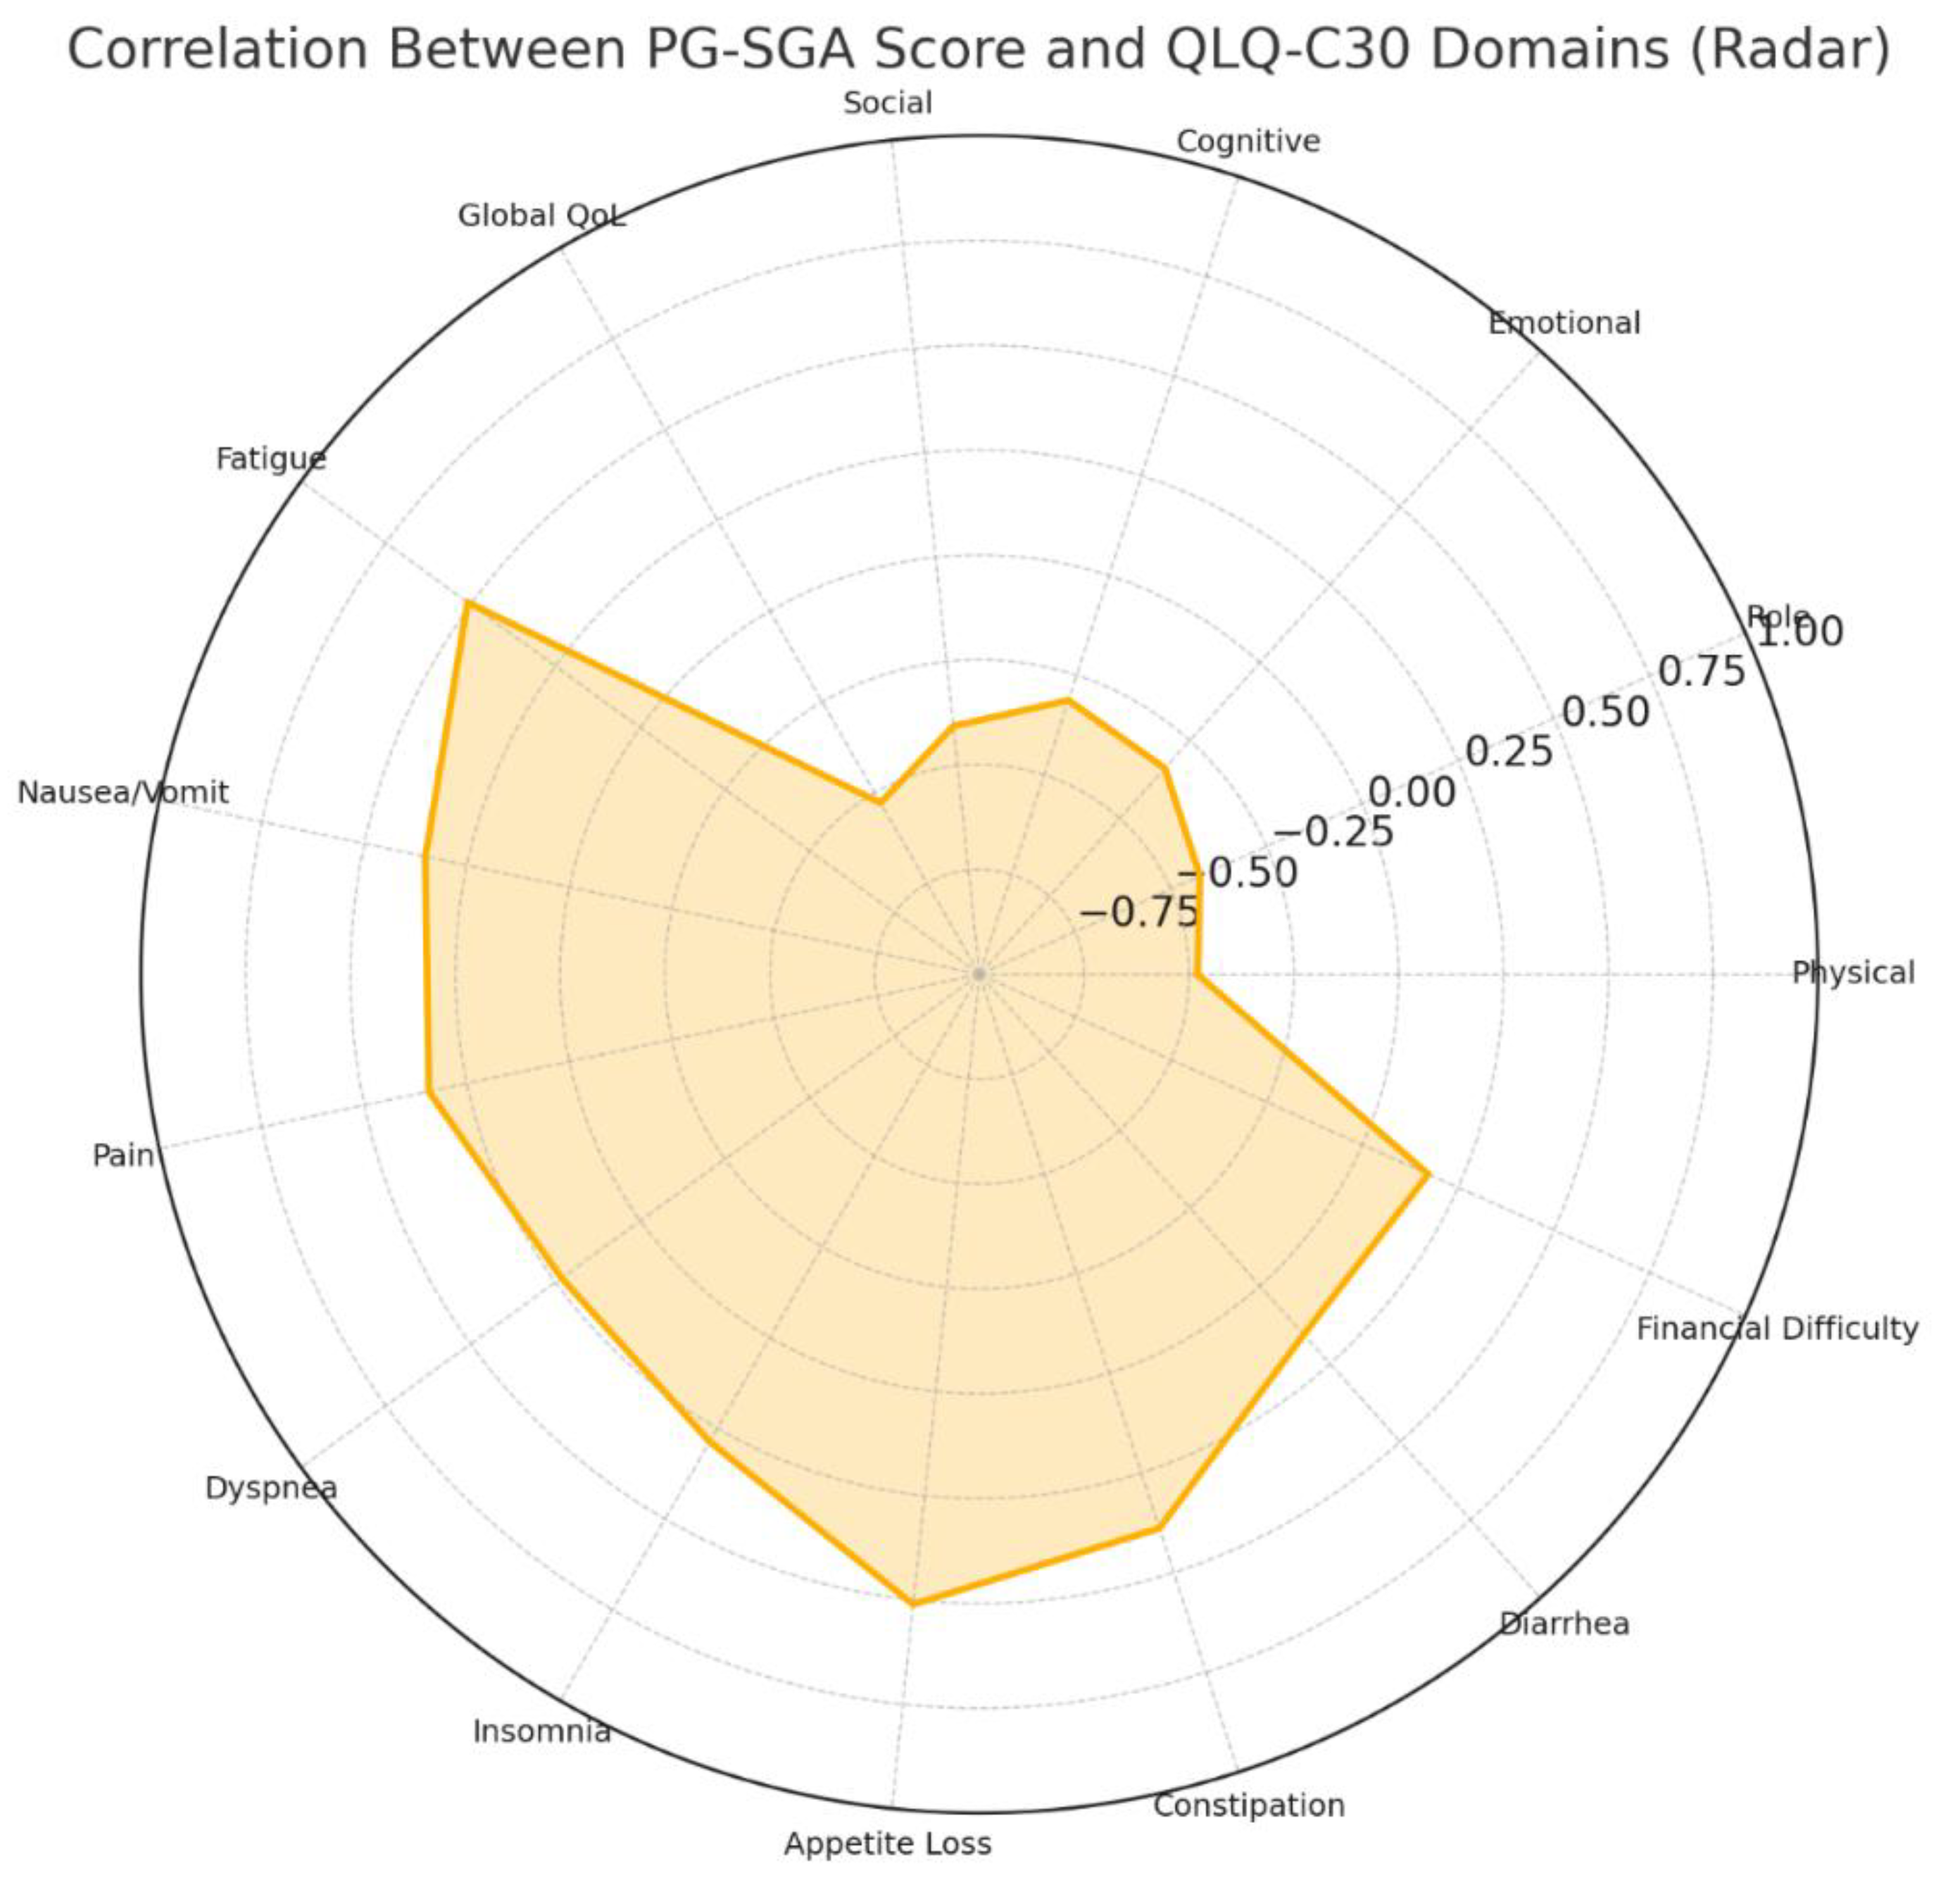
Figure 4.
Correlation Between PG-SGA Score and EORTC QLQ-C30 Domains.
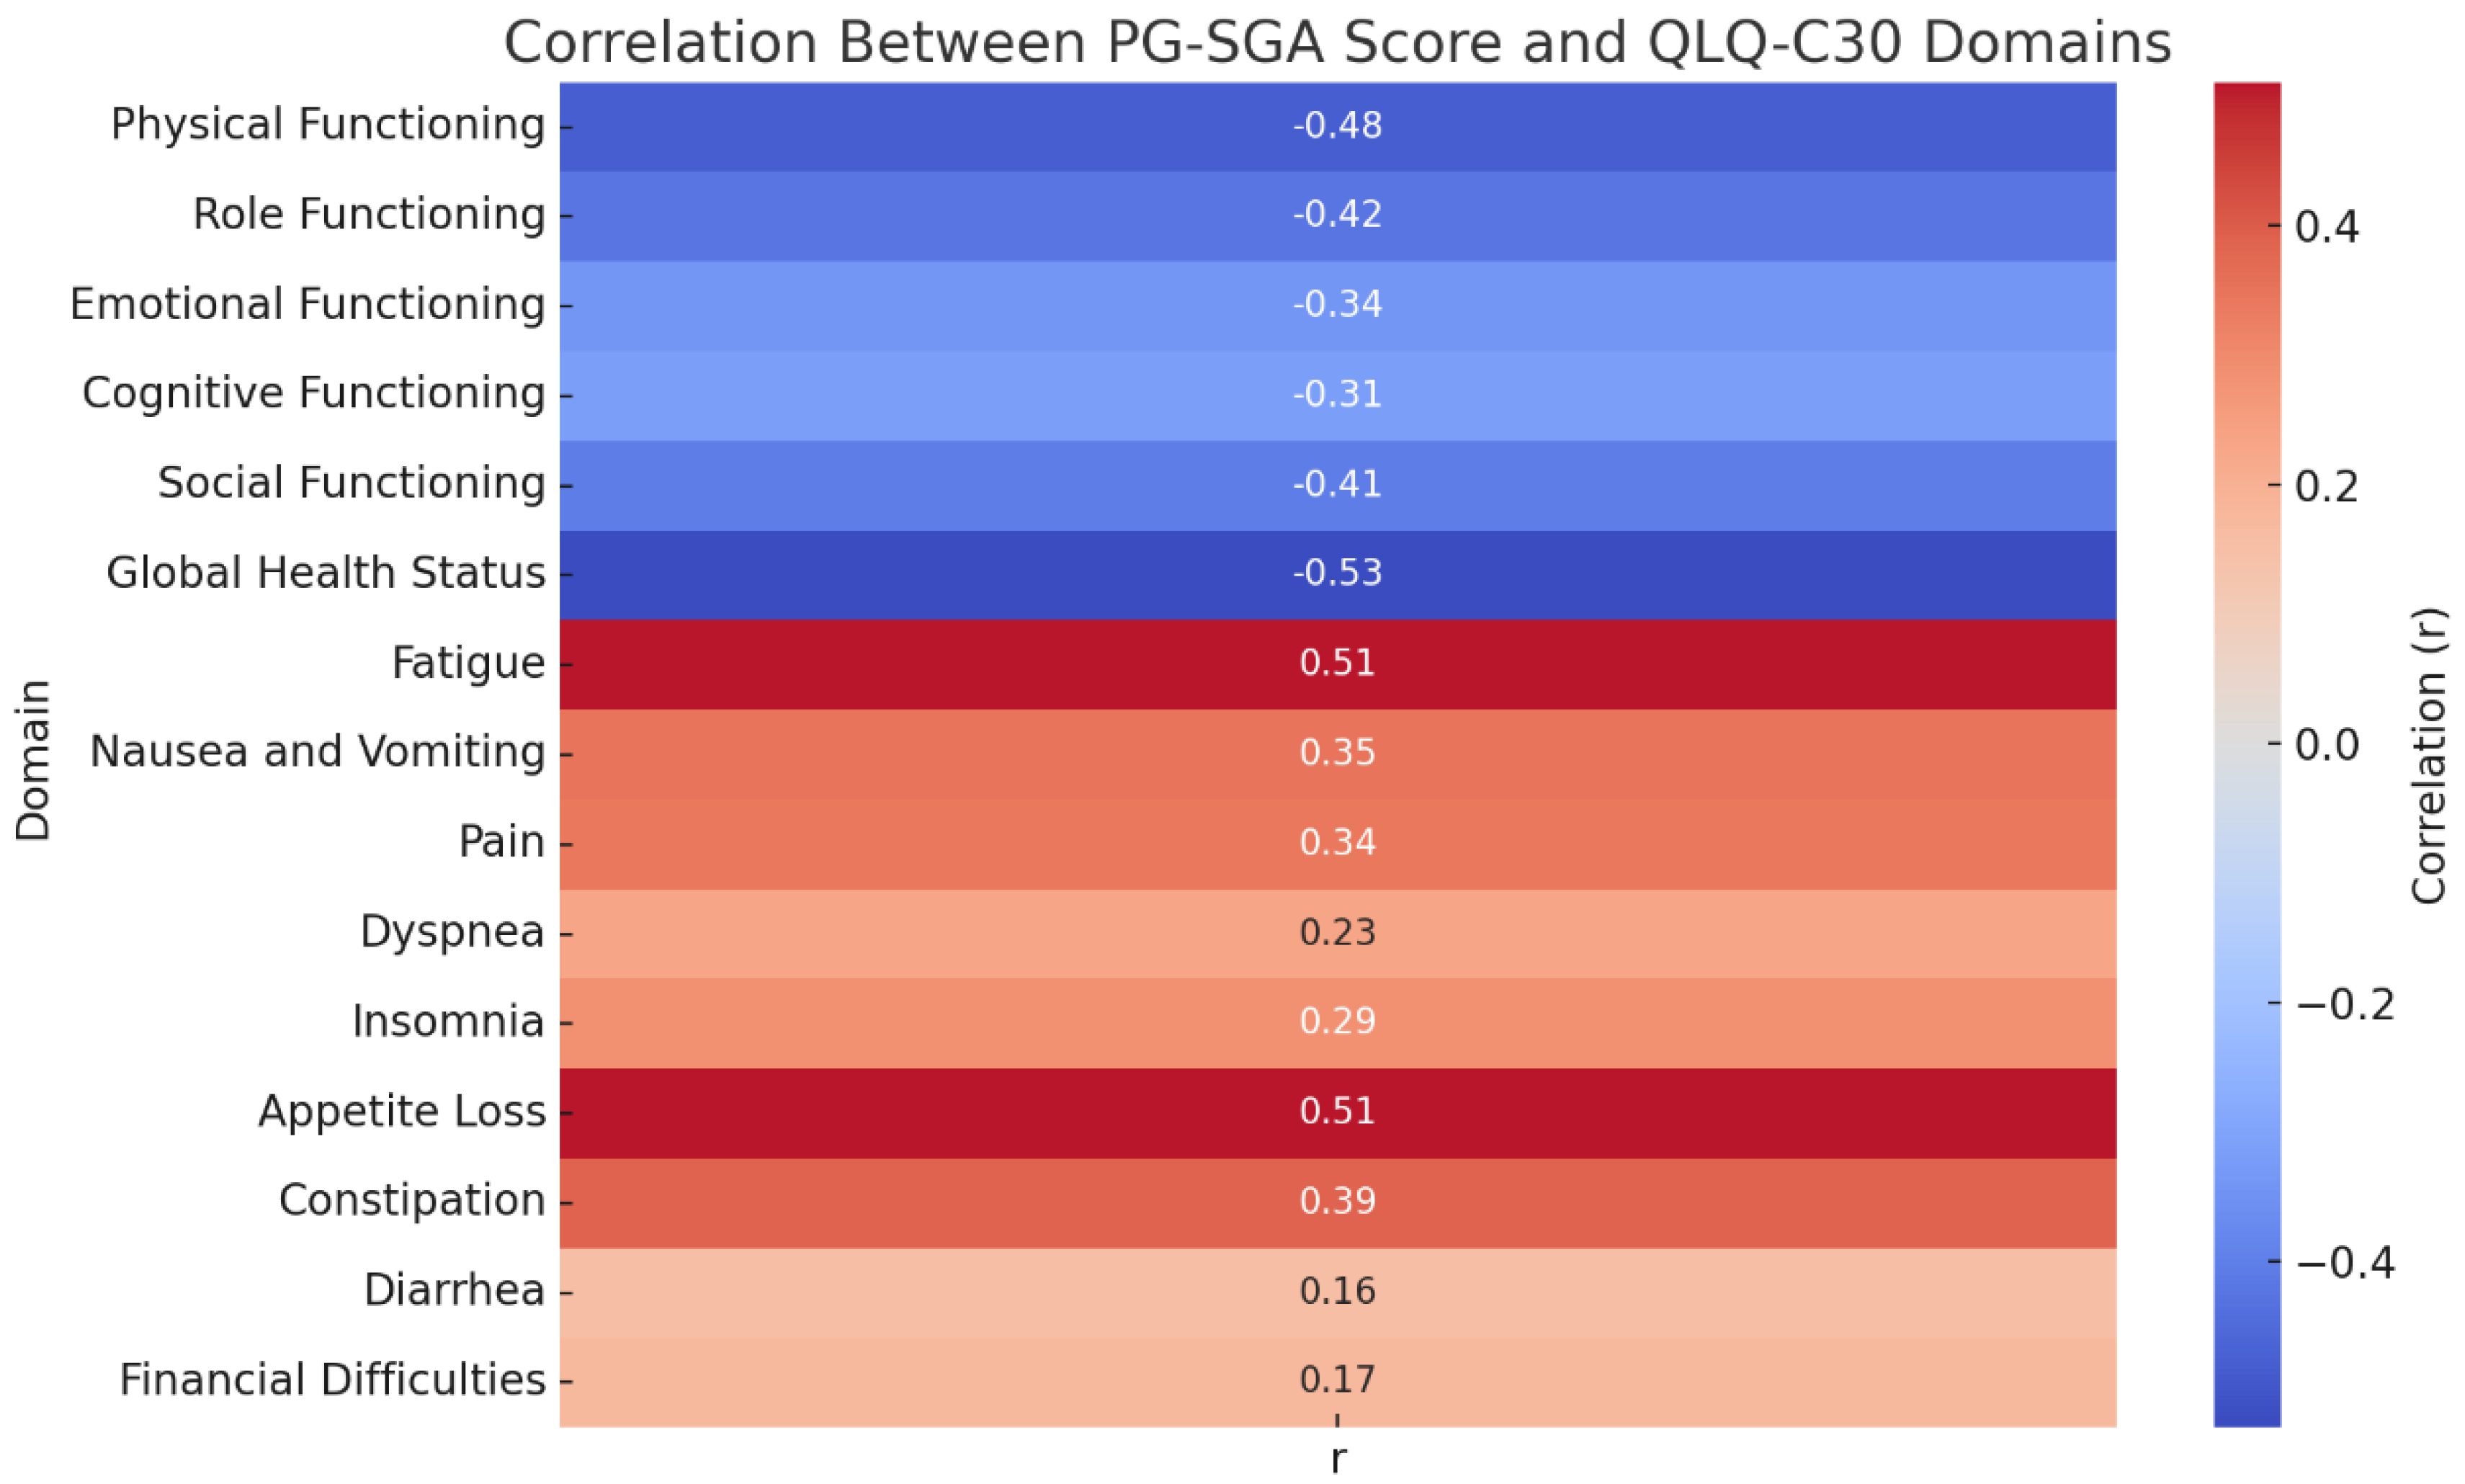
Figure 5.
Technical roadmap of Predictive Model for Severe Malnutrition.
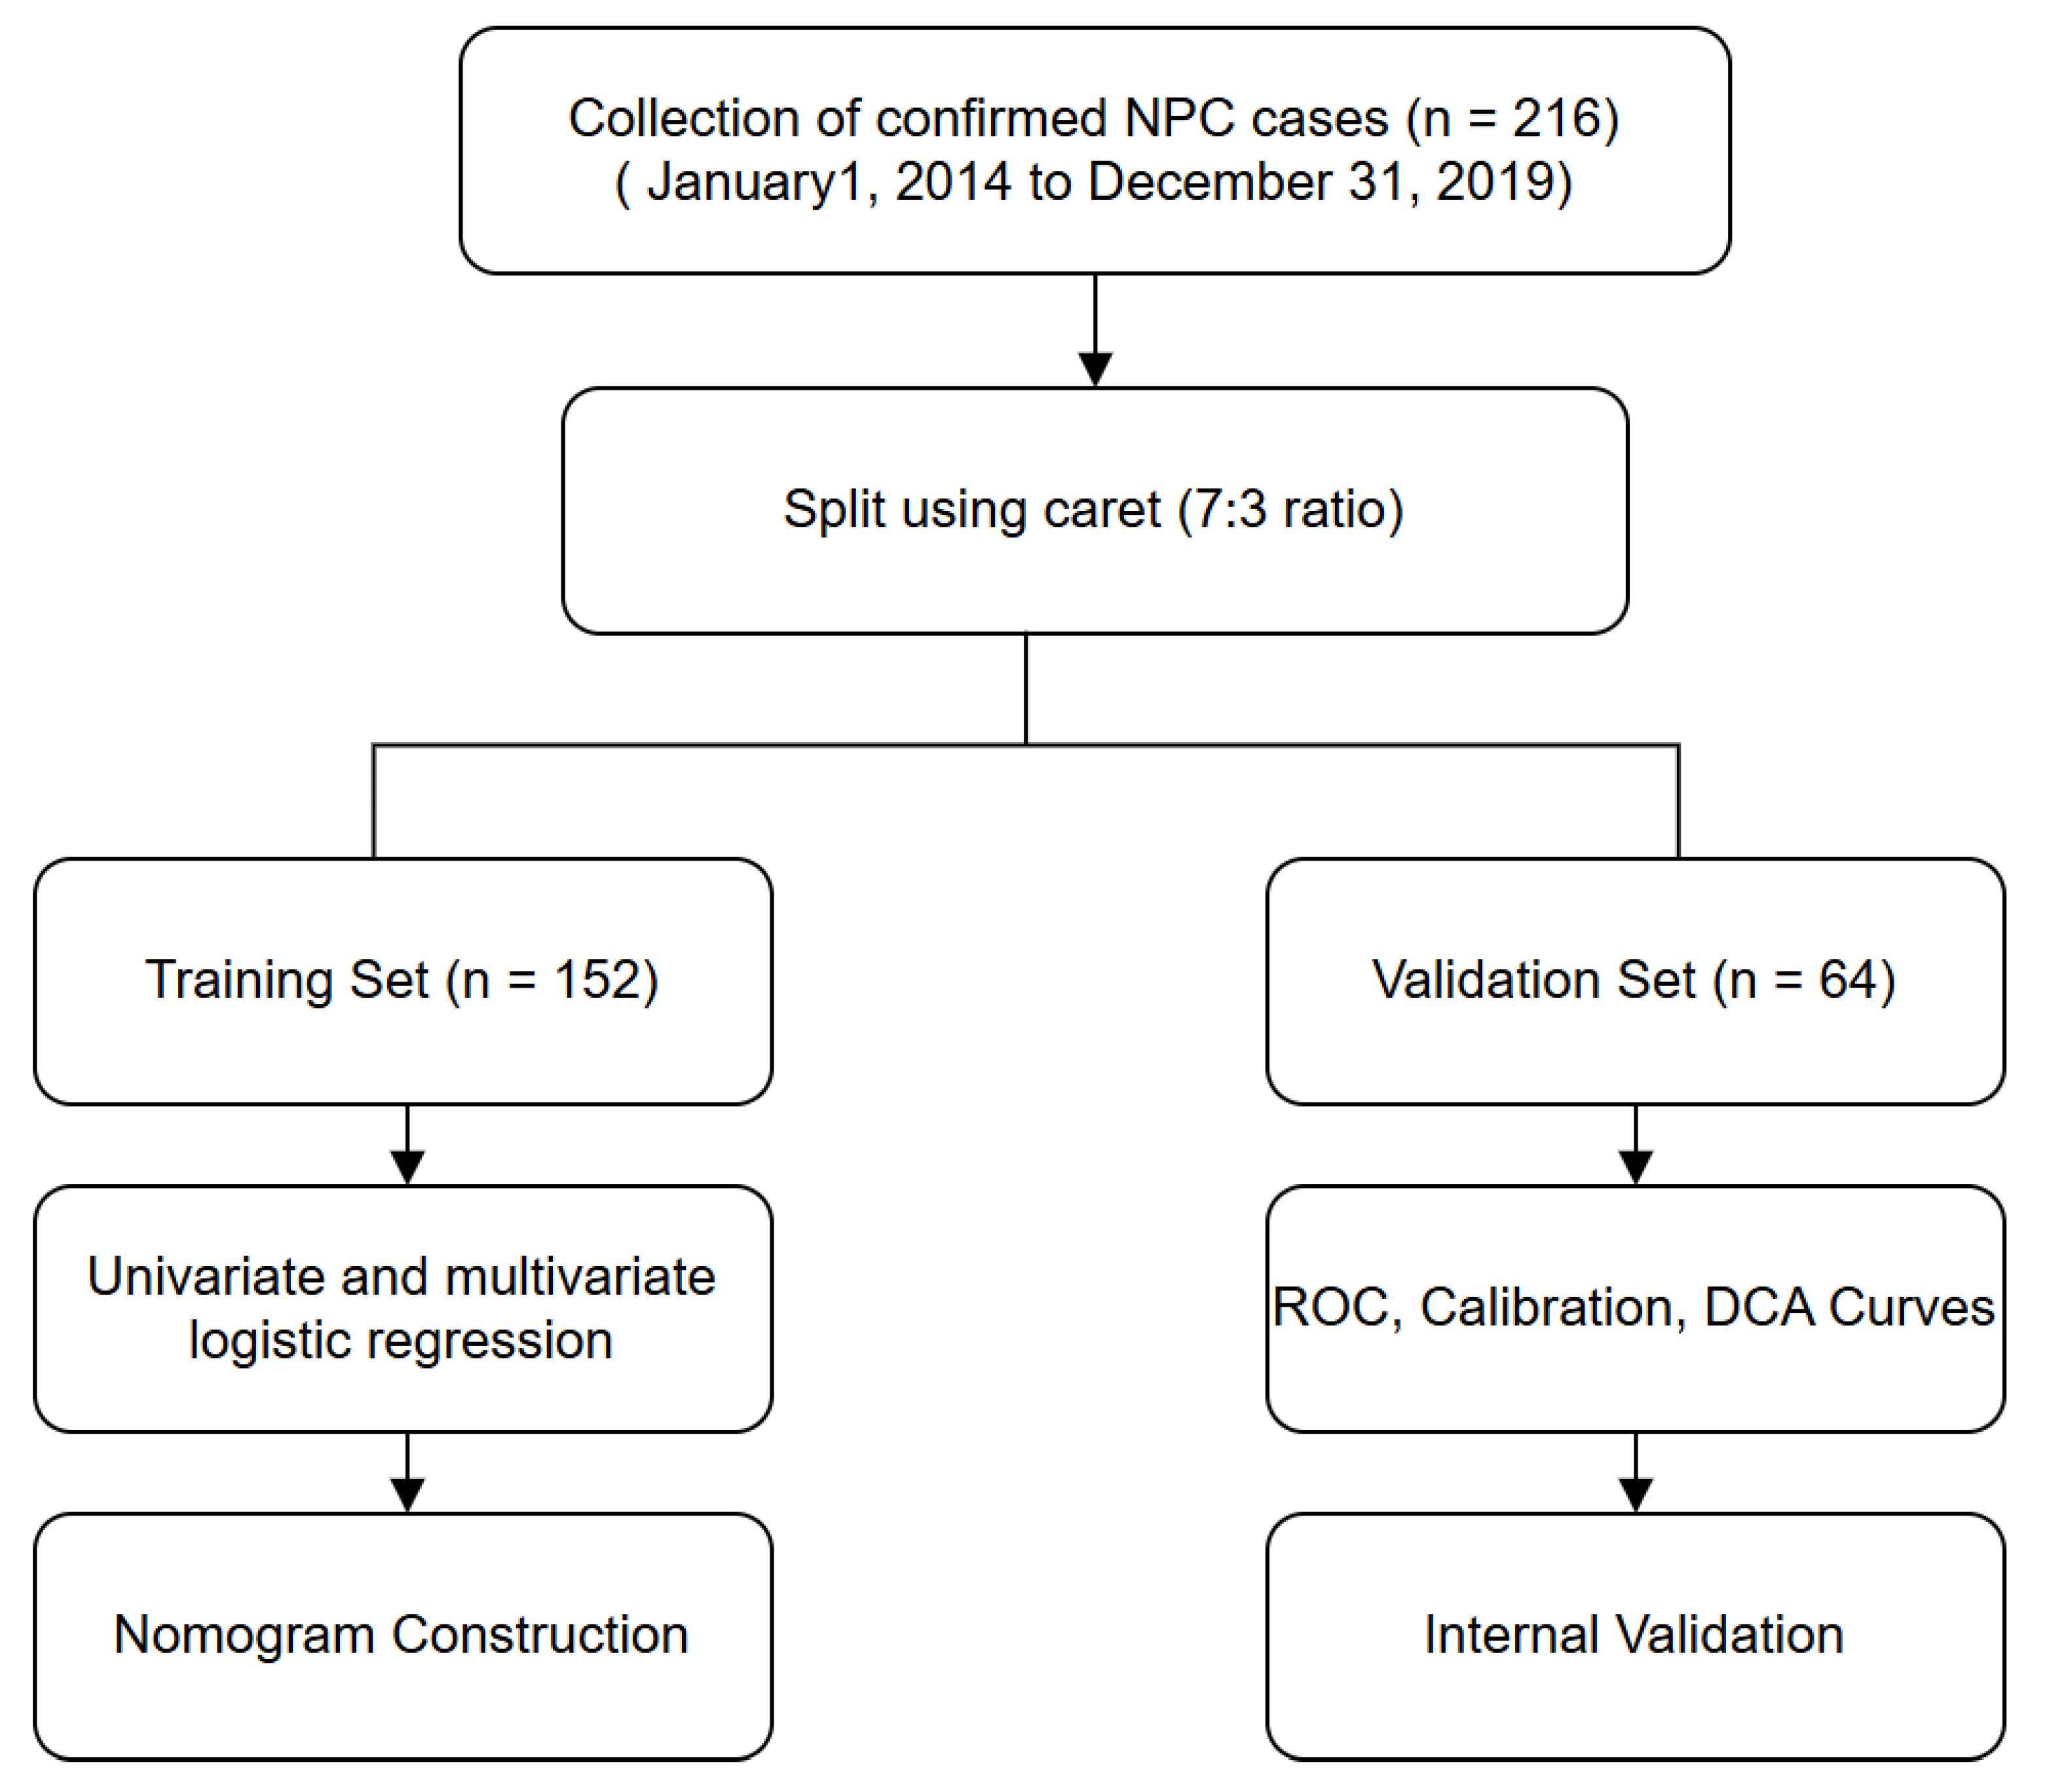
Figure 6.
Risk factors for severe malnutrition in NPC patients.
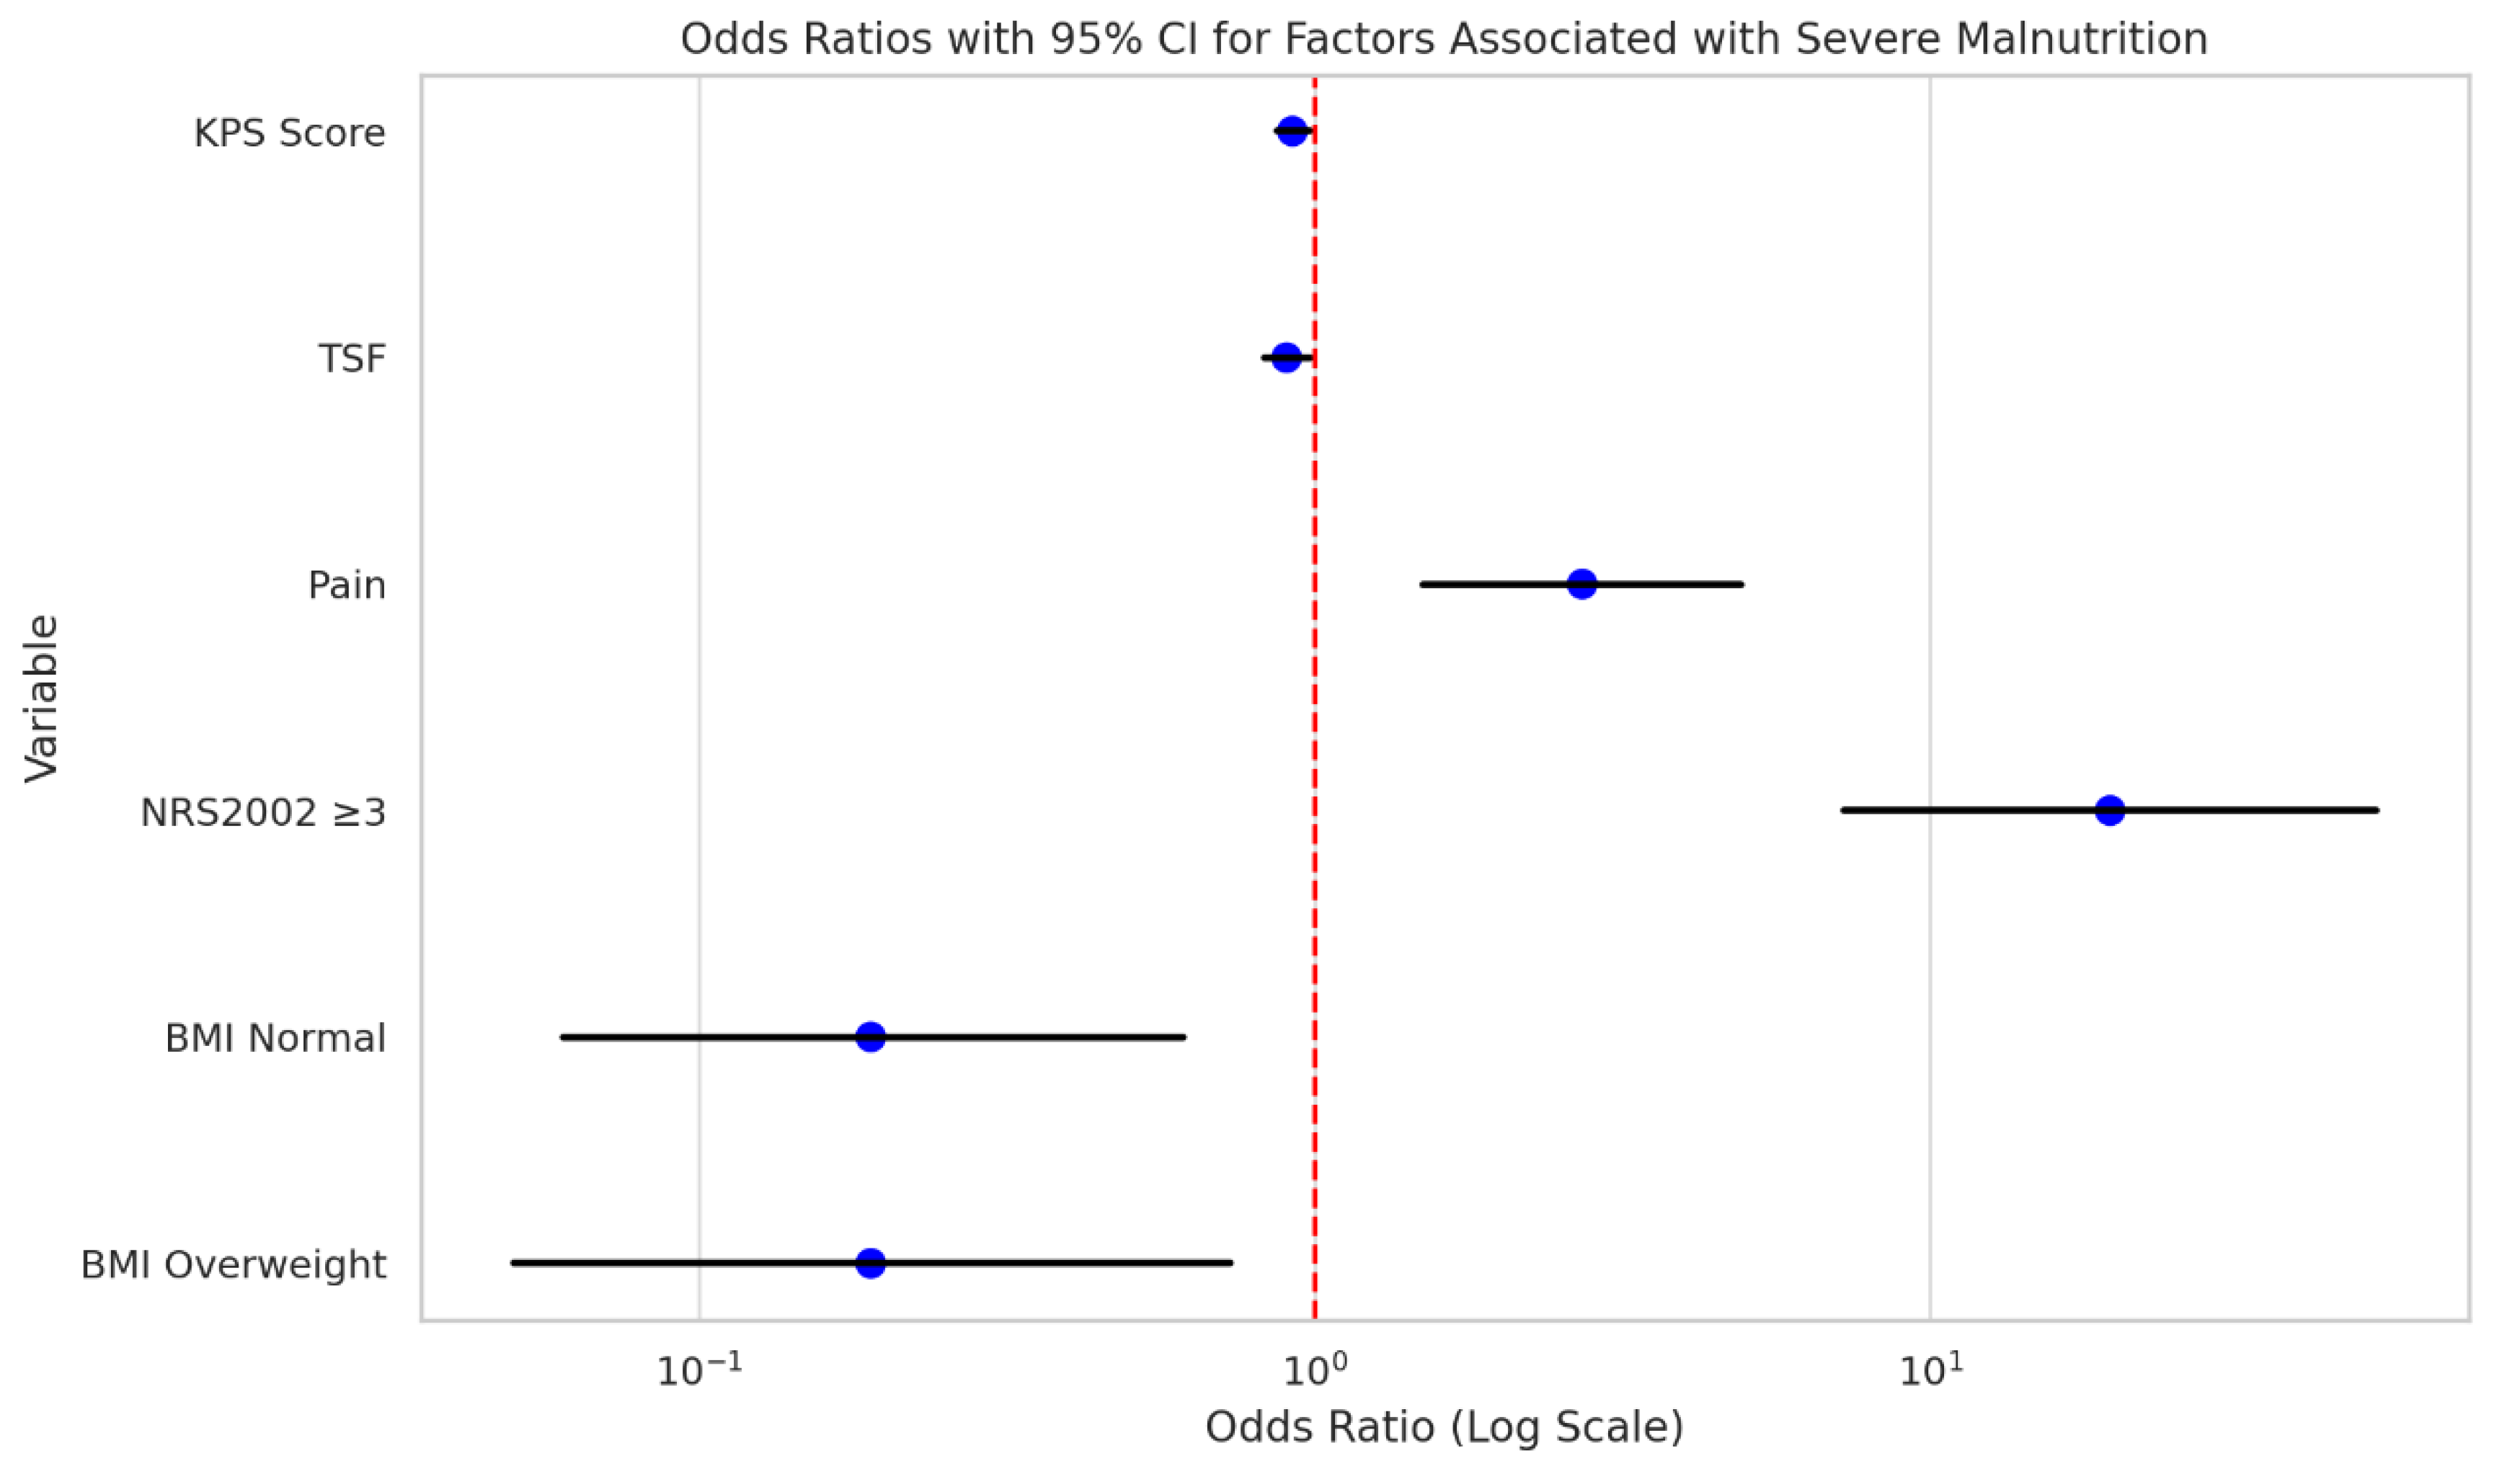
Figure 7.
Forest plot of independent risk factors for severe malnutrition.
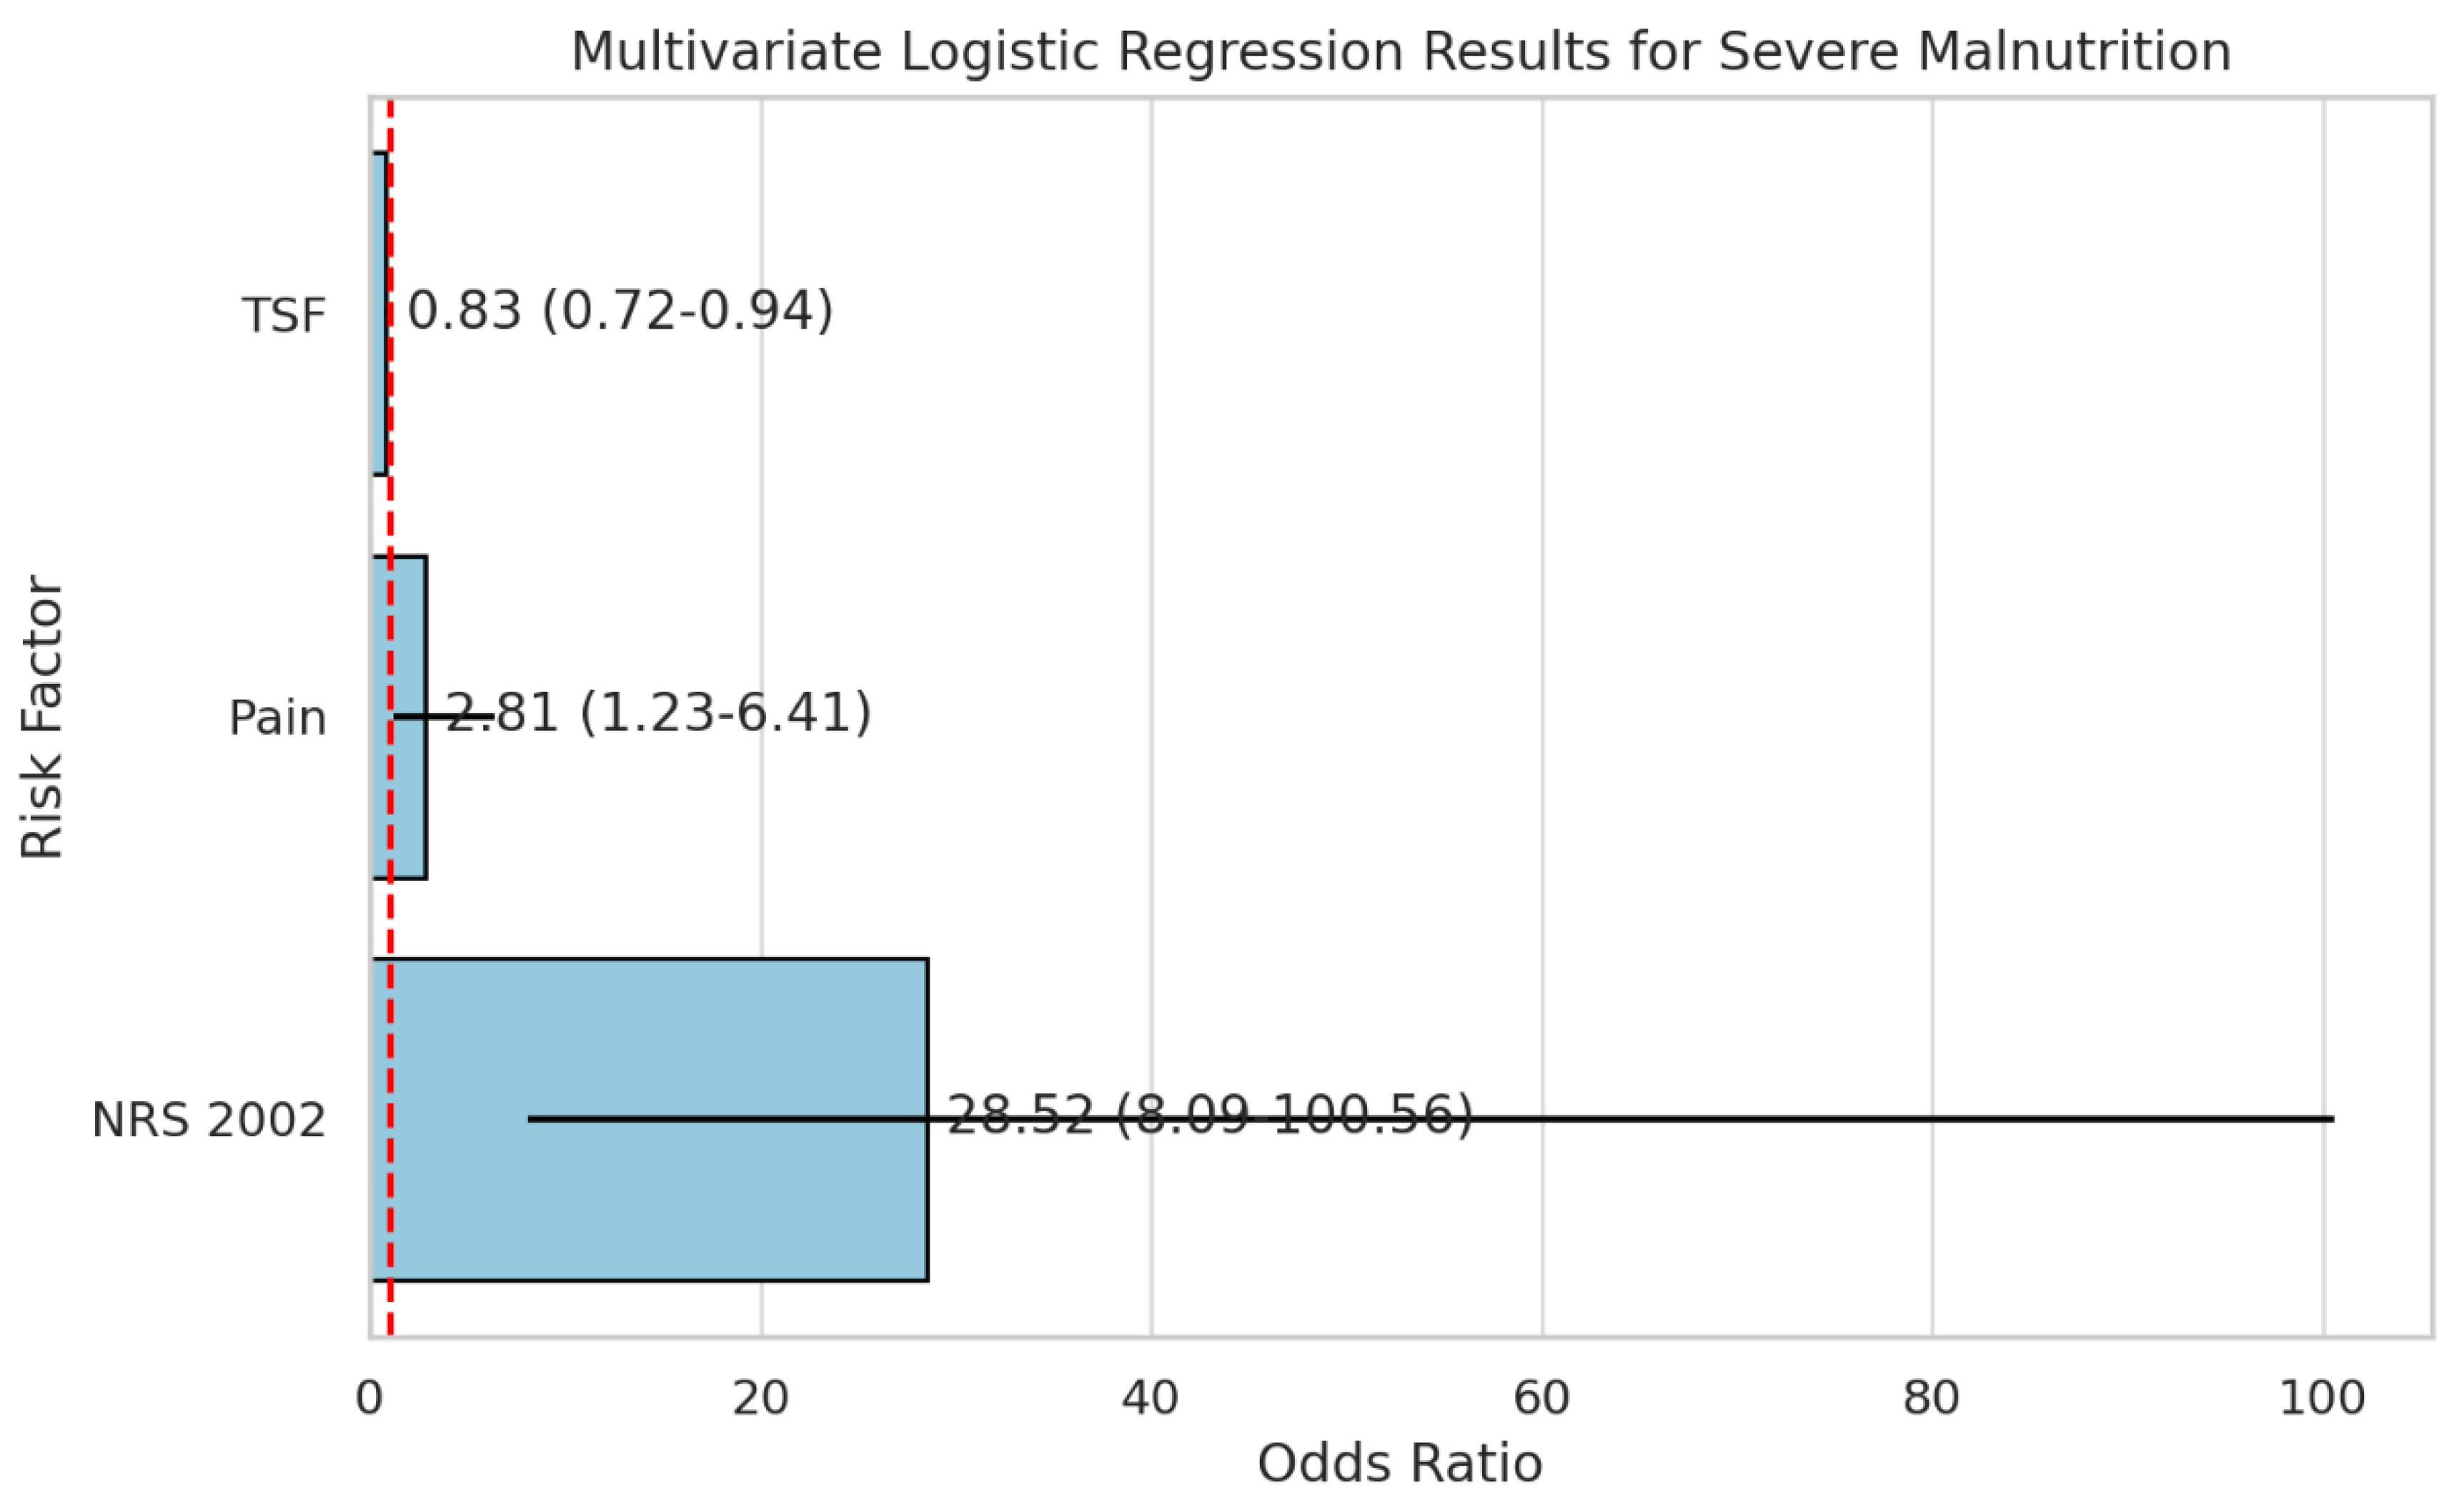
Figure 8.
Nomogram for Predicting Severe Malnutrition in Patients with Nasopharyngeal Carcinoma.
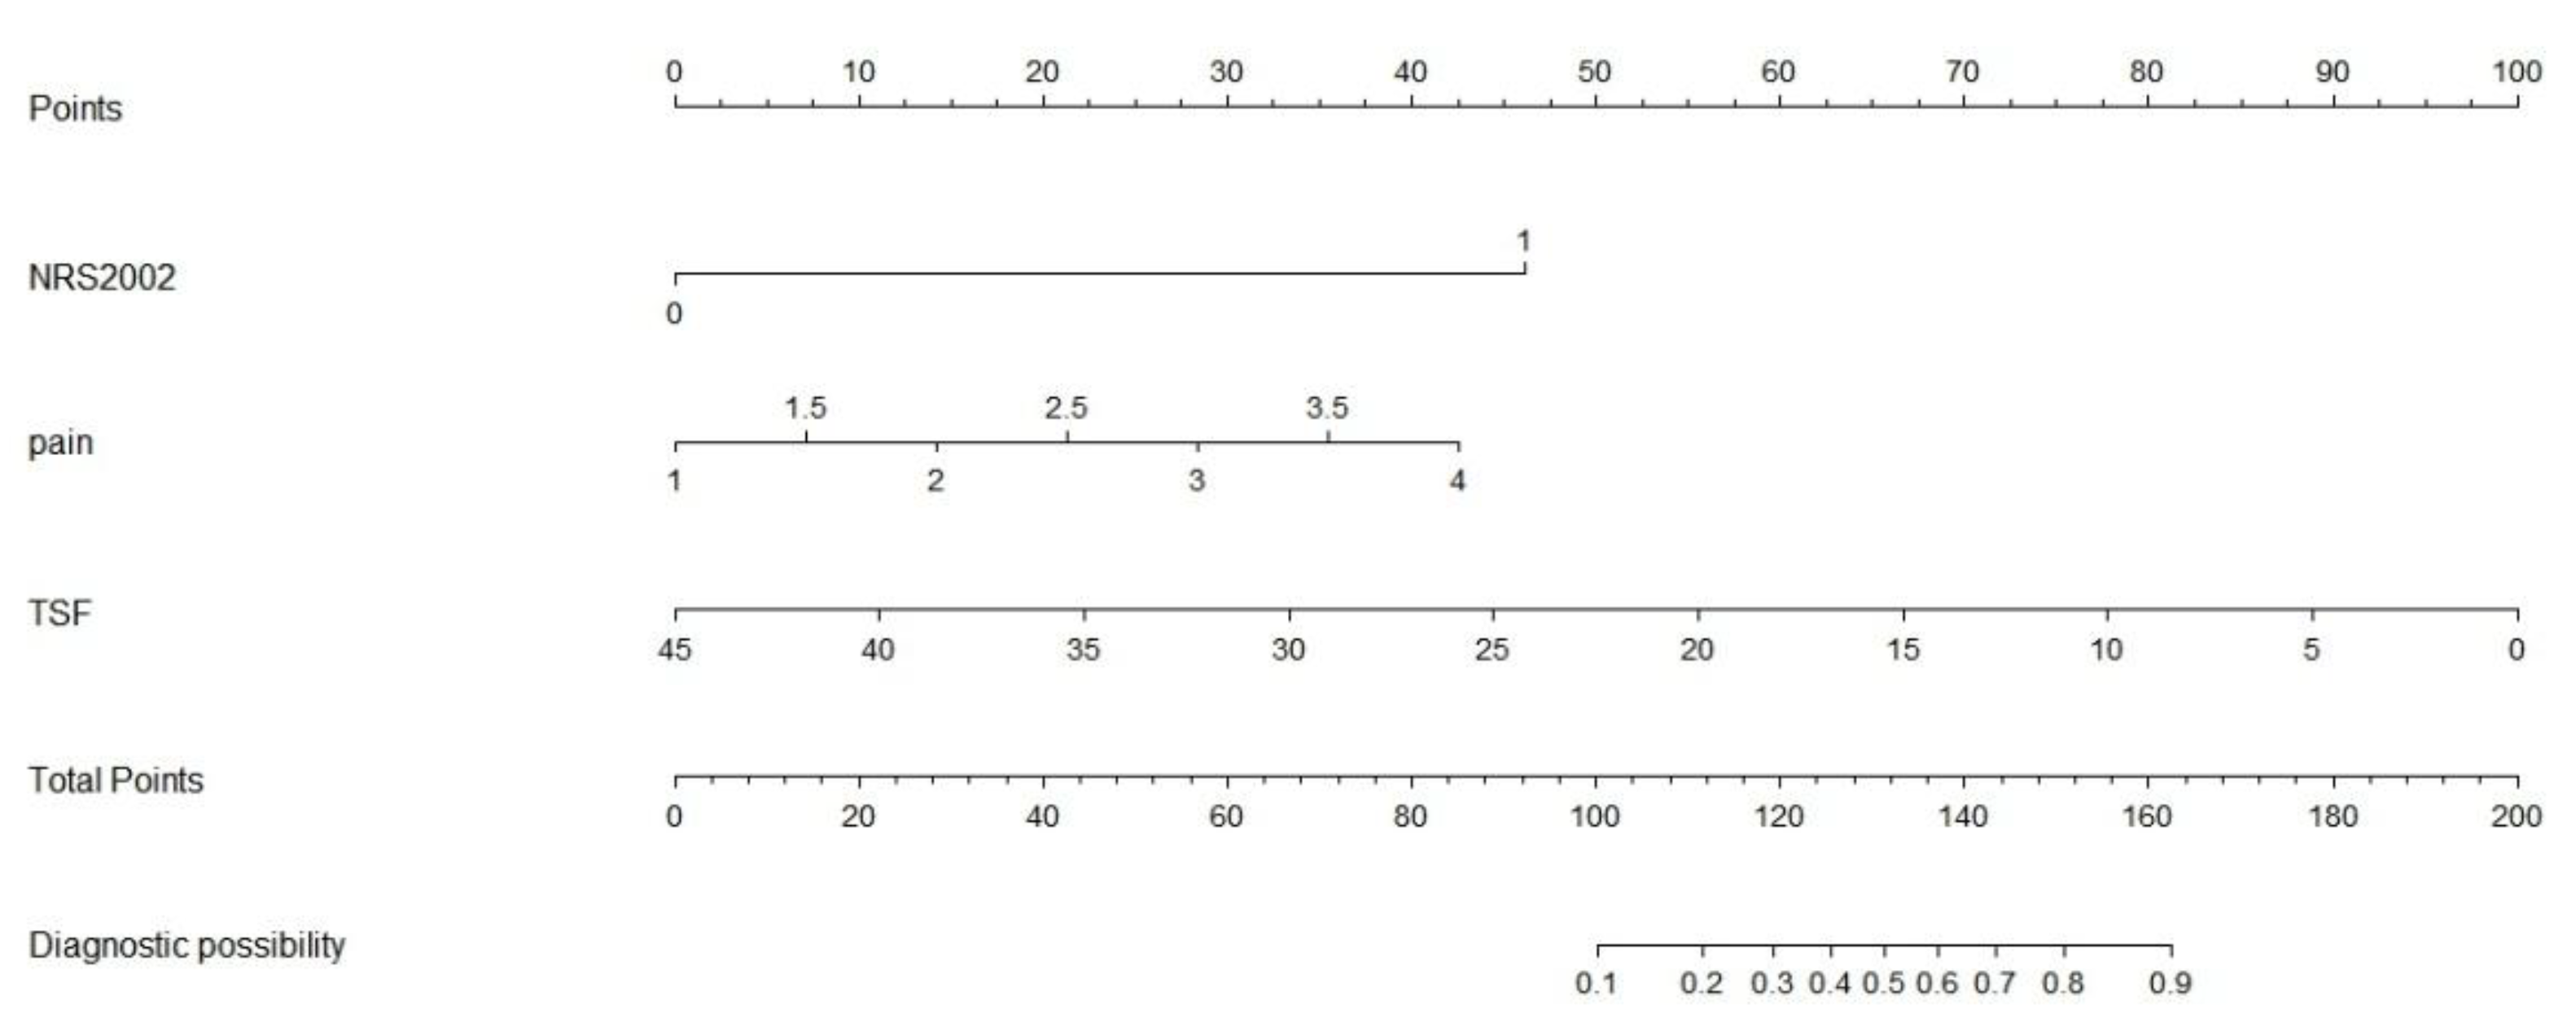
Figure 9.
ROC and Calibration Curves of the Predictive Model. Note:8a: ROC curve for the training cohort;8b: ROC curve for the validation cohort;8c: Calibration curve for the training cohort;8d: Calibration curve for the validation cohort.
Figure 9.
ROC and Calibration Curves of the Predictive Model. Note:8a: ROC curve for the training cohort;8b: ROC curve for the validation cohort;8c: Calibration curve for the training cohort;8d: Calibration curve for the validation cohort.
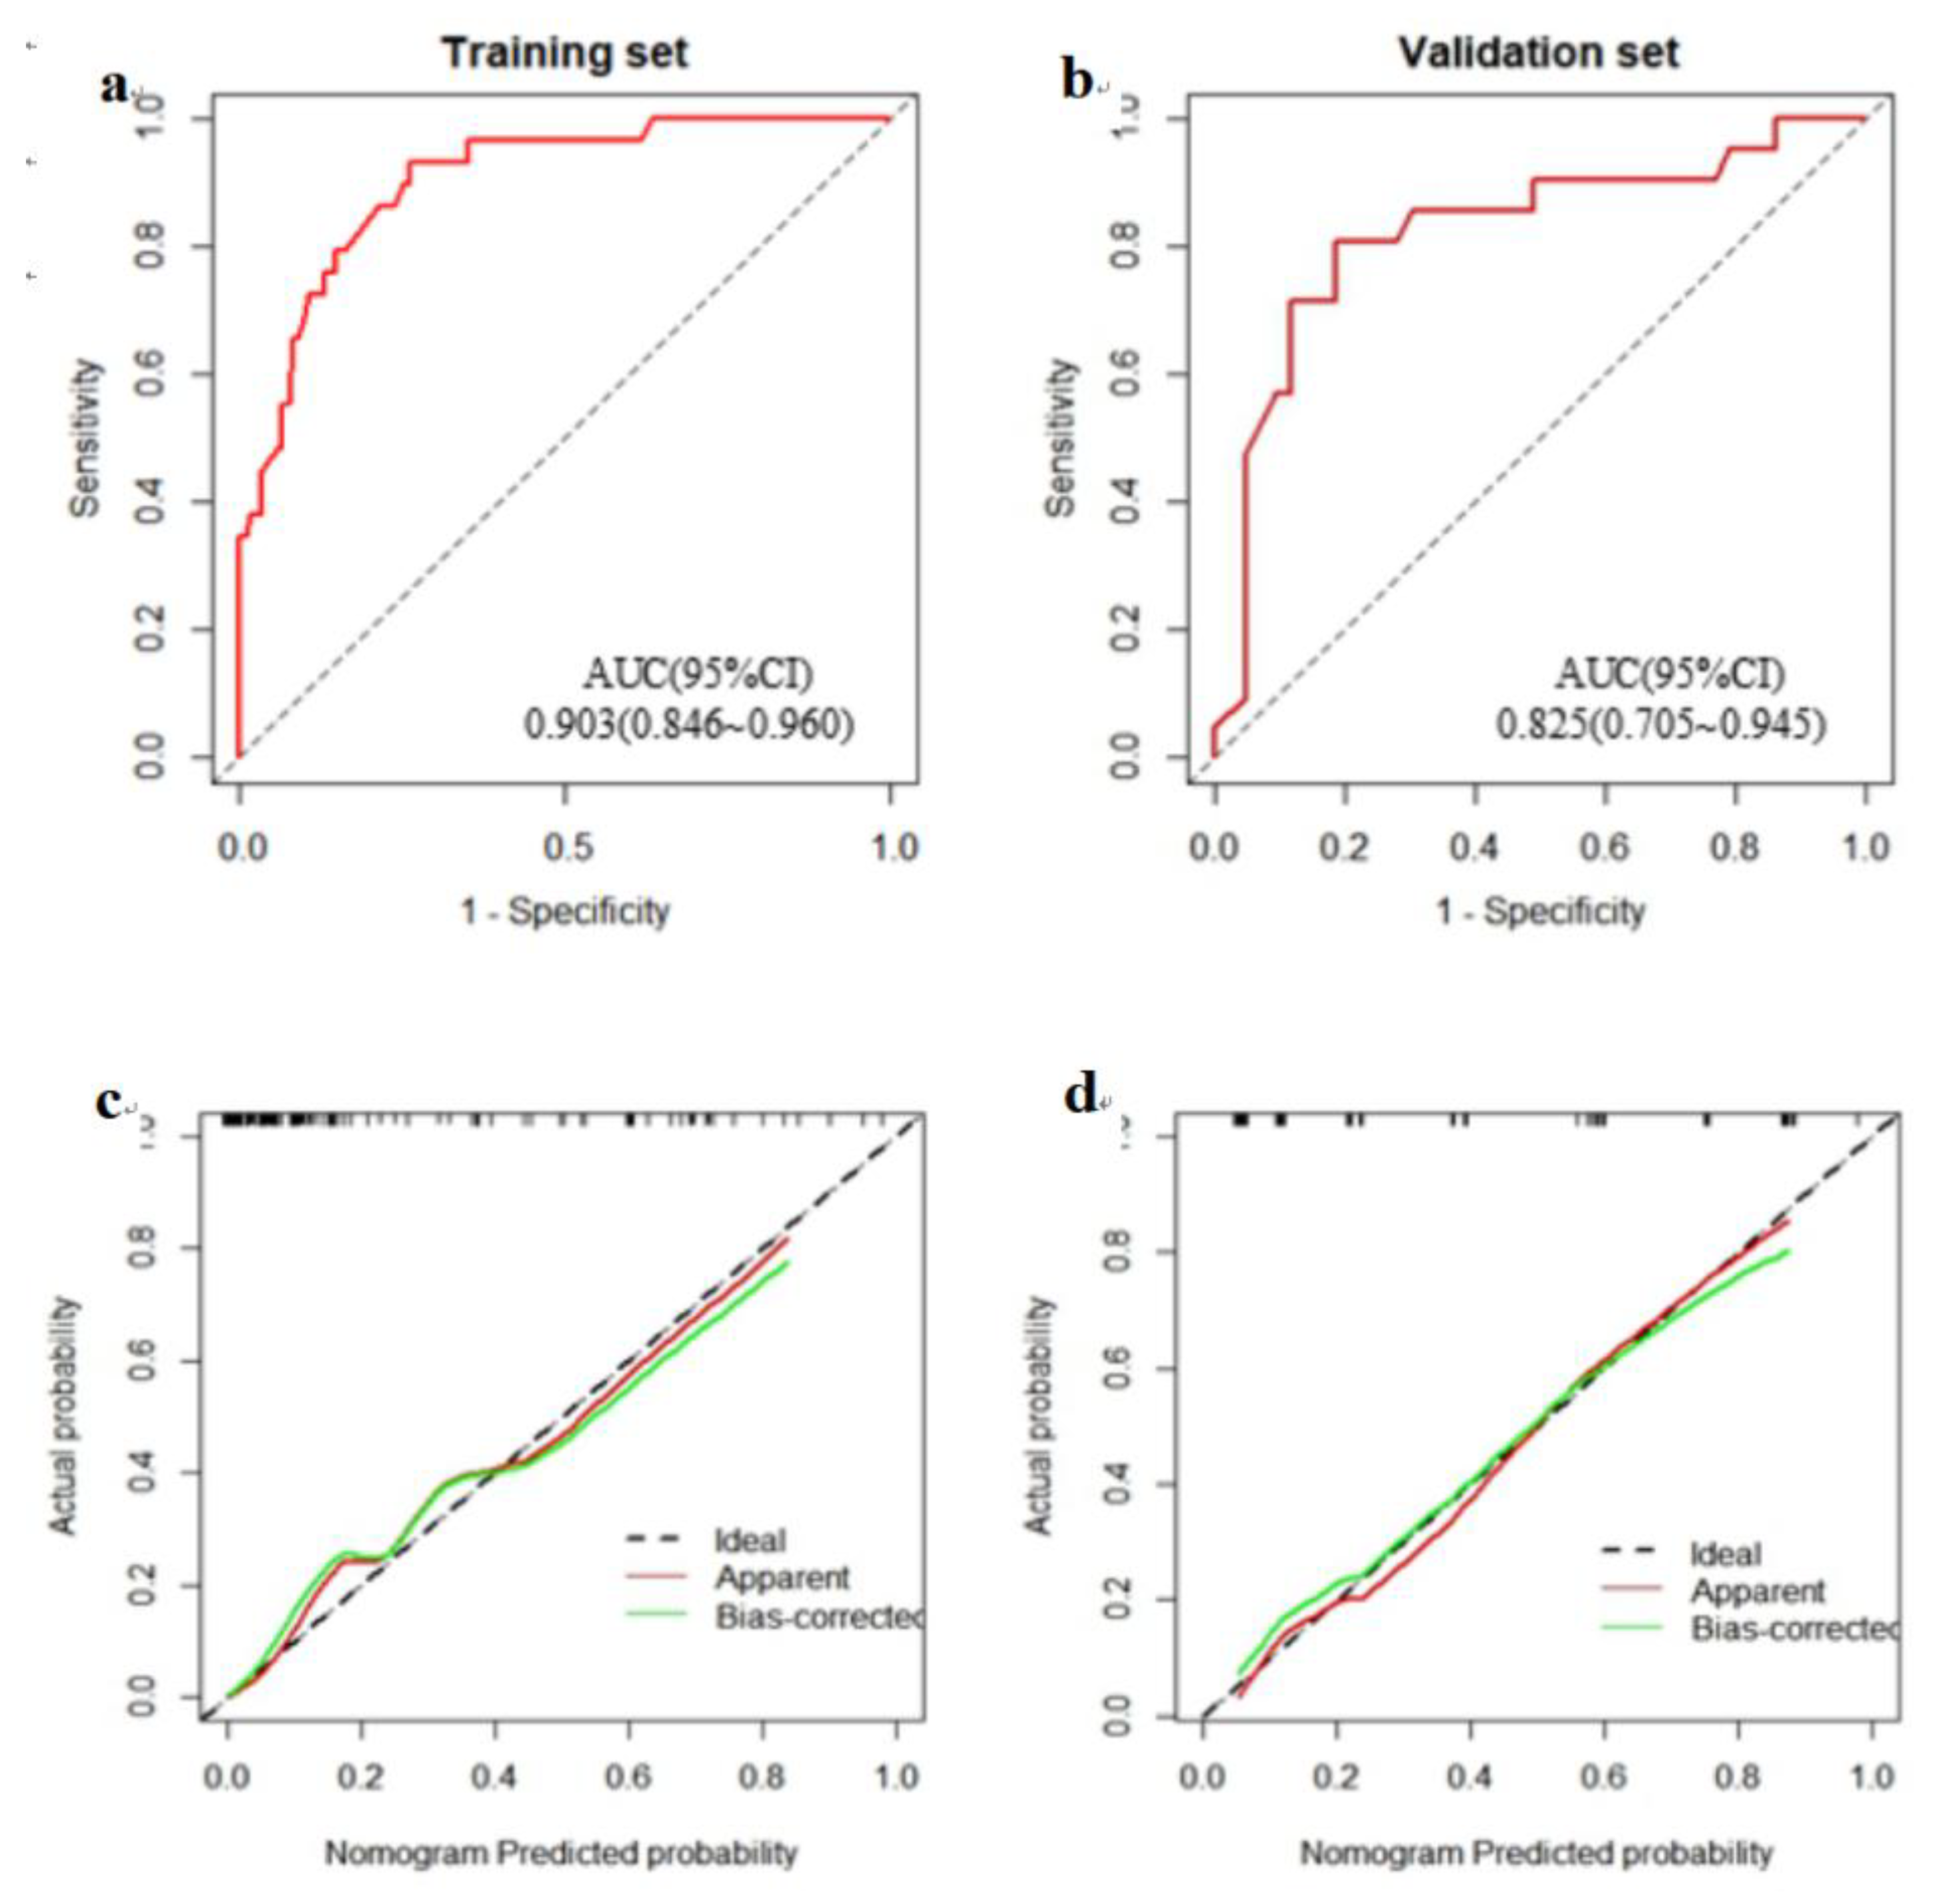
Table 1.
Baseline Characteristics of Hospitalized NPC Patients (n = 216).
| Variable | n (%) | Variable | n (%) |
| Gender | Smoking History | ||
| Male | 168 (77.78) | Yes | 117 (54.17) |
| Female | 48 (22.22) | No | 99 (45.83) |
| Age | Alcohol Consumption | ||
| <65 years | 190 (87.96) | Yes | 44 (20.37) |
| ≥65 years | 26 (12.04) | No | 172 (79.63) |
| Marital Status | Tea Consumption | ||
| Unmarried | 6 (2.78) | Yes | 70 (32.41) |
| Married | 206 (95.37) | No | 146 (67.59) |
| Divorced/Widowed | 4 (1.85) | Comorbidities | |
| Ethnicity | Yes | 49 (22.69) | |
| Han | 190 (87.96) | No | 167 (77.31) |
| Others | 26 (12.03) | Nutritional Support | |
| Family History of Cancer | Parenteral Nutrition | 10 (4.63) | |
| Yes | 17 (7.87) | Enteral Nutrition | 1 (0.47) |
| No | 199 (92.13) | None | 205 (94.90) |
| Place of Residence | Treatment Modality | ||
| Urban/Town | 98 (45.37) | Chemotherapy | 104 (48.15) |
| Rural | 118 (54.63) | Radiotherapy | 17 (7.87) |
| Clinical Stage | Chemoradiotherapy | 49 (22.68) | |
| Stage I | 4 (1.85) | Chemoradio + Targeted/Immuno | 6 (2.78) |
| Stage II | 13 (6.02) | None | 40 (18.52) |
| Stage III | 77 (35.65) | Length of Hospital Stay | |
| Stage IV | 122 (56.48) | <12 days | 106 (49.07) |
| Education Level | ≥12 days | 110 (50.93) | |
| No schooling/Primary School | 113 (52.31) | NRS 2002 Score | |
| Middle/High School | 97 (44.91) | <3 points | 158 (73.15) |
| College or above | 6 (2.78) | ≥3 points | 58 (26.85) |
Table 2.
Comparison of Physical Measurements Among Patients with Different PG-SGA Scores.
| Variable | PG-SGA | F | p-value | ||
| 0–3(n = 104) | 4–8(n = 62) | ≥9(n = 50) | |||
| Weight (kg) | 61.23 ± 10.52 | 58.78 ± 8.25 | 55.94 ± 9.40 | 5.191 | 0.006 |
| Body Mass Index (kg/m²) | 23.06 ± 3.19 | 22.63 ± 2.83 | 21.33 ± 3.20 | 5.328 | 0.006 |
| Mid-Arm Circumference (MAC, cm) | 25.96 ± 3.28 | 25.21 ± 2.64 | 24.42 ± 2.79 | 4.609 | 0.011 |
| Triceps Skinfold Thickness (TSF, mm) | 11.78 ± 8.63 | 10.65 ± 7.00 | 8.12 ± 6.83 | 3.711 | 0.026 |
| Non-Dominant Hand Grip Strength (ND-HGS, kg) | 27.03 ± 9.63 | 25.94 ± 9.13 | 21.98 ± 8.95 | 5.022 | 0.007 |
| Mid-Arm Muscle Circumference (MAMC, cm) | 22.26 ± 3.30 | 21.87 ± 3.32 | 21.87 ± 3.52 | 0.369 | 0.692 |
| Max Calf Circumference (Right, cm) | 34.32 ± 4.39 | 33.27 ± 2.36 | 31.75 ± 3.60 | 8.061 | <0.001 |
| Max Calf Circumference (Left, cm) | 34.09 ± 3.18 | 33.18 ± 2.30 | 31.60 ± 3.54 | 11.251 | <0.001 |
Table 5.
Univariate Logistic Regression Analysis of Factors Influencing Severe Malnutrition.
| Variable | β | S.E. | OR | 95% CI | Z | p-value |
| Gender | 0.347 | 0.537 | 1.41 | 0.49–4.05 | 0.647 | 0.518 |
| Age | 0.792 | 0.544 | 2.21 | 0.76–6.41 | 1.455 | 0.146 |
| Comorbidities | -0.212 | 0.504 | 0.81 | 0.30–2.17 | -0.421 | 0.674 |
| Family History of Cancer | 0.161 | 0.687 | 1.17 | 0.31–4.52 | 0.235 | 0.815 |
| Smoking History | 0.234 | 0.418 | 1.26 | 0.56–2.87 | 0.561 | 0.575 |
| Clinical Stage | ||||||
| Stage II | 15.18 | 1385.378 | 3912840.27 | 0–Inf | 0.011 | 0.991 |
| Stage III | 15.026 | 1385.378 | 3353863.09 | 0–Inf | 0.011 | 0.991 |
| Stage IV | 15.208 | 1385.378 | 4024636.71 | 0–Inf | 0.011 | 0.991 |
| KPS Score | -0.081 | 0.032 | 0.92 | 0.87–0.98 | -2.517 | 0.012 |
| Total Protein | -0.001 | 0.034 | 1 | 0.93–1.07 | -0.035 | 0.972 |
| Albumin | -0.072 | 0.047 | 0.93 | 0.85–1.02 | -1.545 | 0.122 |
| MAC | -0.132 | 0.076 | 0.88 | 0.75–1.02 | -1.742 | 0.081 |
| TSF | -0.103 | 0.04 | 0.9 | 0.83–0.98 | -2.578 | 0.01 |
| MAMC | 0.022 | 0.064 | 1.02 | 0.90–1.16 | 0.348 | 0.728 |
| Pain | 1 | 0.304 | 2.72 | 1.50–4.93 | 3.293 | 0.001 |
| NRS2002 Score | 2.975 | 0.507 | 19.6 | 7.25–52.94 | 5.874 | <0.001 |
| Total Bilirubin | -0.002 | 0.05 | 1 | 0.91–1.10 | -0.03 | 0.976 |
| BMI Category | ||||||
| Normal BMI | -1.674 | 0.604 | 0.19 | 0.06–0.61 | -2.771 | 0.006 |
| Overweight | -1.638 | 0.676 | 0.19 | 0.05–0.73 | -2.424 | 0.015 |
Table 6.
Multivariate Logistic Regression for Predictors of Severe Malnutrition in NPC Patients.
| Variable | β | S.E. | OR | 95% CI | Z | p-value |
| TSF | -0.192 | 0.067 | 0.83 | 0.72–0.94 | -2.872 | 0.004 |
| Pain | 1.032 | 0.421 | 2.81 | 1.23–6.41 | 2.454 | 0.014 |
| NRS-2002 | 3.35 | 0.643 | 28.52 | 8.09–100.56 | 5.213 | <0.001 |
Disclaimer/Publisher’s Note: The statements, opinions and data contained in all publications are solely those of the individual author(s) and contributor(s) and not of MDPI and/or the editor(s). MDPI and/or the editor(s) disclaim responsibility for any injury to people or property resulting from any ideas, methods, instructions or products referred to in the content. |
© 2025 by the authors. Licensee MDPI, Basel, Switzerland. This article is an open access article distributed under the terms and conditions of the Creative Commons Attribution (CC BY) license (http://creativecommons.org/licenses/by/4.0/).
Copyright: This open access article is published under a Creative Commons CC BY 4.0 license, which permit the free download, distribution, and reuse, provided that the author and preprint are cited in any reuse.


