
Submitted:
18 August 2025
Posted:
18 August 2025
You are already at the latest version
Abstract
This study evaluates the causal impact and mechanisms of China’s Low-Carbon City Pilot Policy (LCCPP) on urban Green Total Factor Energy Efficiency (GTFEE) by using a multi-period Difference-in-Differences (DID) model with a comprehensive panel dataset of Chinese cities from 2007 to 2022. We also conduct a series of robustness checks, including event studies and PSM-DID, to ensure the reliability of our findings. The results show that the LCCPP has a significant and robust positive effect on urban GTFEE. Furthermore, our mechanism analysis reveals that the policy primarily enhances GTFEE through two key channels: promoting green innovation and accelerating industrial structure upgrading. This study provides important policy implications, suggesting that the LCCPP is an effective tool for green development and that policymakers should focus on supporting green technology and industrial transformation to maximize the policy’s benefits.
Keywords:
Low-Carbon City Pilot Policy
; Green Total Factor Energy Efficiency
; difference-indifferences
; green innovation
; industrial structure upgrading
1. Introduction
China’s remarkable economic growth has been driven by intensive energy consumption, leading to significant environmental challenges like high pollution and low energy efficiency [1,2]. This reliance on traditional energy sources threatens sustainable development and energy security [3]. In response, China has prioritized green and low-carbon development, setting ambitious “dual carbon” goals. The Low-Carbon City Pilot Policy (LCCPP), initiated in 2010, is a key governance tool. Unlike conventional top-down approaches, the LCCPP adopts a bottom-up, differentiated strategy [4,5]. It grants local governments flexibility and autonomy, encouraging tailored low-carbon development paths based on unique regional characteristics. This approach fosters local initiatives in energy conservation, emission reduction, and green development [6,7,8].
Existing scholarship has extensively explored low-carbon development from various visions [9,10]. Regarding the effectiveness of low-carbon city policies, prior research has largely focused on assessing their overall impact on reducing carbon emissions and carbon intensity [11], improving air quality, and promoting urban energy transition [12]. These studies have also investigated the policy’s impact on enterprise total factor productivity, emphasizing the dual effects on high-pollution industries. These analyses often employ quasi-natural experimental designs to evaluate the policy’s influence on urban development. For instance, some study found that the LCCPP reduced local greenhouse gas emissions by enhancing energy efficiency and green technological innovation, while also demonstrating positive spillover effects on cities within a 1,000-kilometer radius [13]. Conversely, some studies found negative spatial spillover effects, where the “siphon effect” of innovation resources in pilot cities inhibited the green efficiency of neighboring cities [14]. Furthermore, a multi-mediating effect model was proposed based on “government–enterprise–resident” interactions, arguing that the LCCPP promotes urban energy transition by strengthening government intervention, fostering enterprise technological innovation, and raising residents’ green consumption awareness [9].
Concurrently, a considerable body of literature has been dedicated to the measurement and analysis of green total factor energy efficiency (GTFEE). Researchers have focused on its conceptualization, defining it as a comprehensive measure that accounts for both desired economic outputs and undesirable environmental outputs (A). Diverse measurement methodologies, such as the non-radial SBM-DEA model and stochastic frontier analysis (SFA), have been widely applied to estimate GTFEE across different regions and industries. For example, an SFA model was applied to panel data from Japan and found that the energy efficiency of the manufacturing sector was inferior to that of the wholesale and retail trade sector [15]. In the Chinese context, a DEA model was utilized to measure GTFEE at the provincial level, with capital, labor, and energy as inputs and industrial pollutants as undesirable outputs, and found that GTFEE in the eastern region was significantly lower than in the central and western regions [16]. Some research also extended this analysis to the city level, observing that while GTFEE in economically developed areas was initially low, it subsequently experienced significant growth [17]. Similarly, the SBM-DEA model was used to measure GTFEE across various Chinese industries, revealing that the overall efficiency was relatively low, with the heavy industry sector performing particularly poorly [18]. Other studies have decomposed the sources of GTFEE change and have identified a wide array of influencing factors on GTFEE, including technological progress, energy structure adjustments, financial development, human capital, industrial agglomeration, the degree of government intervention, and energy prices [19,20,21,22]
Building on these foundations, some studies have directly or indirectly examined the relationship between low-carbon initiatives and energy efficiency. Research has found that low-carbon city pilot policies can enhance urban energy efficiency primarily through mechanisms like industrial structure upgrading and technological innovation [23,24]. Scholars further expanded this by identifying a “government–enterprise–resident” multi-mediating effect, where the policy promotes energy transition through government intervention, enterprise technological innovation, and increased green consumption awareness among residents [12]. Comparisons have also been made between low-carbon city policies and other initiatives, such as smart city policies, in terms of their respective effects on energy efficiency, suggesting potential synergistic benefits. These studies provide valuable insights into the pathways through which low-carbon development efforts can influence energy efficiency [25].
Despite these valuable contributions, several critical research gaps persist in existing literature. While the positive effects of low-carbon city policies on environmental outcomes and broader economic performance have been acknowledged, there remains a limited number of studies that rigorously investigate the direct causal relationship between the Low-Carbon City Pilot Policy and urban green total factor energy efficiency [26]. More critically, the intrinsic mechanisms through which the LCCPP influences GTFEE, such as green innovation capacity and industrial structure upgrading, have not been sufficiently explored in depth. Furthermore, the potential heterogeneous impacts of the policy across cities with varying characteristics, such as geographical location and resource endowments, are often underexamined [2]. Understanding these specific transmission channels and differentiated effects is vital for a comprehensive evaluation of the policy’s efficacy, as the LCCPP is designed to encourage tailored approaches based on local conditions. Therefore, an in-depth analysis of these aspects is crucial for refining China’s regional green development policy system and promoting more effective energy utilization [27].
This study aims to fill the identified research gaps by systematically investigating the dynamic impact of the Low-Carbon City Pilot Policy on urban Green Total Factor Energy Efficiency within the context of China’s green transformation. The paper is structured as follows: First, we theoretically analyze how the LCCPP promotes GTFEE and elaborate on the mediating roles of green innovation capacity and industrial structure upgrading. Second, we measure the GTFEE of Chinese prefecture-level cities and analyze their development status and distribution characteristics. Third, we empirically examine the direct impact, mediating mechanisms, and heterogeneous effects of the LCCPP on GTFEE. Finally, based on our theoretical and empirical findings, we propose constructive policy recommendations.
To achieve our research objectives, this study employs a rigorous empirical strategy. For the measurement of urban Green Total Factor Energy Efficiency, we utilize the non-radial SBM-DEA (Slack-Based Measure Data Envelopment Analysis) model, which effectively accounts for undesirable outputs in the production process. To evaluate the policy effect of the Low-Carbon City Pilot Policy on GTFEE, we adopt a multi-period Difference-in-Differences (DID) model, which allows for the identification of the causal impact by comparing changes in pilot cities to those in non-pilot cities over time. Furthermore, a three-step mediation model is constructed to investigate the transmission channels, specifically focusing on the roles of green innovation capacity and industrial structure upgrading.
The remainder of this paper is organized as follows. Section 2 presents the theoretical analysis of the LCCPP’s impact on urban GTFEE and details the GTFEE measurement methodology. Section 3 describes the empirical strategy, including the multi-period Difference-in-Differences (DID) model and the mediation models used for mechanism tests. Section 4 presents and discusses the empirical findings from the baseline regressions, robustness checks, and mechanism analyses. Finally, Section 5 concludes the study and provides policy recommendations.
2. Measurement of Green Total Factor Energy Efficiency
2.1. Green Total Factor Energy Efficiency Measurement Model
Data Envelopment Analysis (DEA) is a widely adopted non-parametric method for measuring GTFEE. Unlike parametric approaches such as Stochastic Frontier Analysis (SFA), DEA effectively accommodates multiple inputs and outputs [28,29]. Given the need to incorporate pollution-related outputs for urban GTFEE, DEA is a more suitable choice [30]. Specifically, this study adopts the non-radial Slack-Based Measure (SBM) DEA model. As a significant advancement over traditional radial DEA models, SBM precisely accounts for undesirable outputs and slack variables, providing a more accurate efficiency measurement [22,25,31].
Specifically, the SBM-DEA model is formulated as follows. First, the model assumes that a production system with n DMUs, each utilizing m inputs to produce desirable outputs and undesirable outputs. For a specific DMU k, its input vector is , desirable output vector is , and undesirable output vector is . The matrices , , and represent the input, desirable output, and undesirable output vectors for all DMUs, respectively. The production possibility set P is defined as Eq. (1).
A DMU k is considered efficient if no other vector λ can improve its inputs or outputs without worsening others. The relative efficiency score (ρ) for DMU k is obtained by solving the following linear programming problem, as shown in Eq. (2).
A DMU k is considered efficient if no other vector λ can improve its inputs or outputs without worsening others. The relative efficiency score (ρ) for DMU k is obtained by solving the following linear programming problem, as shown in Eq. (3).
where , , and represent the slacks (excess inputs or insufficient outputs) for inputs, desirable outputs, and undesirable outputs, respectively. The efficiency score ρ ranges from 0 to 1. The score of indicates that the DMU is fully efficient, with no slacks in inputs or outputs. And the score of suggests inefficiency, implying room for improvement by reducing inputs or undesirable outputs, or increasing desirable outputs.
Following the research [32], our input indicators for urban production include capital, labor, and energy. Desirable output is represented by Gross Domestic Product (GDP), while undesirable outputs are the “three industrial wastes” (industrial sulfur dioxide, soot/dust, and wastewater emissions). Table 1 summarizes the input and output indicators used for measuring GTFEE in this study.

Table 2.1.
Categories and Measurements of Input and Output Indicators in the SBM-DEA Model.
| Indicator Type | Category | Measurement |
|---|---|---|
| Input Indicators | Capital Input | Fixed asset stock |
| Labor Input | Sum of employees in private and non-private units | |
| Energy Input | Estimated based on DMSP/OLS nighttime light data | |
| Output Indicators | Desired Output | City’s Gross Domestic Product (GDP) |
| Undesired Outputs | Industrial sulfur dioxide emissions | |
| Industrial soot (dust) emissions | ||
| Industrial wastewater emissions |
Our study sample comprises 262 cities in China from 2007 to 2022. Data were primarily collected from the China City Statistical Yearbook, China Regional Statistical Yearbook, China Energy Statistical Yearbook, and various provincial/municipal statistical yearbooks. Energy consumption data were standardized to tons of standard coal equivalent based on the General Principles for Comprehensive Energy Consumption Calculation (GB/T 2589-2020). DMSP/OLS nighttime light raster data from the National Earth System Science Data Center was used and matched to city administrative divisions. Data cleaning involved checking consistency, removing outliers, and inputting missing values using linear interpolation to maximize sample information retention.
2.2. Green Total Factor Energy Efficiency Measurement Results
Figure 1 illustrates the distribution of GTFEE across Chinese cities, as measured by the SBM-DEA model. A clear upward trend in urban GTFEE is observed from 2007 to 2022. In 2007, most cities had GTFEE scores below 0.4, with only a few exceeding 0.6. By 2022, a majority of cities achieved scores above 0.5, and some even surpassed 0.7, indicating a general improvement in green energy efficiency over time. Regionally, the Yangtze River Delta and Sichuan-Chongqing regions initially showed leading GTFEE levels. However, these regions experienced a dip in efficiency around 2012 and 2017, largely attributable to the extensive growth model prevalent in China during that period, which prioritized economic expansion over green production. Following the National Ecological Environmental Protection Conference in 2018, which emphasized ecological civilization, these regions saw a notable recovery and improvement in GTFEE by 2022.
Further analysis by geographical location (Eastern, Middle, and Western regions) is presented in Figure 2. Historically, the Western region’s GTFEE has generally been higher than the national average, while Eastern and Central regions lagged behind. This can be attributed to the Eastern and Central regions being in the mid-to-late stages of industrialization during earlier periods, with a higher proportion of energy-intensive heavy industries. Rapid urbanization and increased infrastructure investment in these regions, often followed the development concept of giving priority to economic growth, leading to inefficient resource consumption. Conversely, the Western region, with its relatively lagging industrialization, exhibited lower energy intensity and thus higher GTFEE per unit of output. However, a significant shift occurred after 2017. Following the 19th National Congress of the Communist Party of China, green development became a core objective for high-quality growth, especially with the "dual carbon" goals. Eastern and Central provinces accelerated their transition towards green manufacturing, energy conservation, and circular economy, strengthening environmental regulations. Robust scientific and technological resources, coupled with strong R&D investment in these regions, particularly in smart manufacturing and clean energy technologies, optimized industrial structures and enhanced energy utilization efficiency. By 2020, the GTFEE in Eastern and Central regions caught up with the Western region, with the Eastern region surpassing the West by 2022. In contrast, the Western region’s GTFEE remained relatively stable throughout the study period, showing no significant upward trend.
3. Data and Methodology
3.1. Data and Variables
This study utilizes panel data from 262 cities in China spanning from 2007 to 2022. The data for constructing the core variables, control variables, and for subsequent empirical analyses are primarily sourced from authoritative statistical yearbooks, including the China City Statistical Yearbook, China Regional Statistical Yearbook, China Energy Statistical Yearbook, and various provincial and municipal statistical yearbooks. Green patent data are collected from the China National Intellectual Property Administration (CNIPA) and classified based on the World Intellectual Property Organization (WIPO) green patent IPC classification codes. Data of the LCCPP are compiled from official announcements by the National Development and Reform Commission (NDRC) in 2010, 2012, and 2017. For data processing, missing values were imputed using linear interpolation, and all continuous variables were winsorized at the 1st and 99th percentiles to mitigate the influence of outliers.
The dependent variable in this study is GTFEE. Following the research [7] and [22], we measure GTFEE using the non-radial SBM-DEA model, which accounts for undesirable outputs. The input indicators include capital stock (measured using the perpetual inventory method), labor input (measured by the sum of employees in private and non-private units), and energy input (estimated based on DMSP/OLS nighttime light data). The desired output is represented by the city’s Gross Domestic Product (GDP), while the undesired outputs include industrial sulfur dioxide emissions, industrial dust emissions, and industrial wastewater emissions.
The core explanatory variable is the LCCPP. Given the staggered implementation of the LCCPP across different cities and years, we construct a multi-period DID variable. This variable is an interaction term between a treatment group dummy (Treat) and a policy implementation time dummy (Policy). Treat equals 1 if a city is designated as a pilot city, and 0 otherwise. Policy equals 1 for years during and after a city’s designation as a pilot city, and 0 for years before. The coefficient of DID captures the average treatment effect of the LCCPP on the GTFEE of pilot cities.
Based on theoretical analysis, we introduce two mediating variables. First, the Green Innovation Capacity (GreenInn) is measured by the number of green invention patent applications in a city for a given year. Invention patents are chosen due to their higher technological content compared to utility model and design patents, and applications are preferred over grants to better reflect current innovation activity. Besides, we also introduced the Industrial Structure Upgrading (AIS), which could affect the advancement of a city’s industrial structure from low-value-added labor-intensive industries to high-value-added technology-intensive industries. It is calculated by weighing the labor productivity of the primary, secondary, and tertiary industries by their respective output shares, with higher weights assigned to more advanced industries to avoid virtual advancement.
To account for other factors that might influence GTFEE and potentially bias the estimation of the LCCPP’s effect, we also included Economic Development Level (Eco), Financial Development Level (Fin), Human Capital Level (HR), Foreign Direct Investment (FDI), Industrial Agglomeration (Agg) and Government Intervention (Gov) into the model. And Table 1 provides the descriptive statistics for all variables used in this study.
3.2. Econometric Model
To investigate the impact of the Low-Carbon City Pilot Policy on Green Total Factor Energy Efficiency and its underlying mechanisms, we employ two main econometric models: a multi-period Difference-in-Differences (DID) model for baseline regression and a three-step mediation model for mechanism analysis.
Given the varied entry years for cities into the LCCPP, we construct a two-way fixed effects multi-period DID model. This model is designed to capture the policy effect by comparing the change in GTFEE in pilot cities before and after policy implementation, relative to the change in non-pilot cities over the same period. The specific model specification is as follows.
In Eq. (4), denotes the Green Total Factor Energy Efficiency of city i in year t, with a higher value indicating greater energy efficiency. is the core explanatory variable representing the Low-Carbon City Pilot Policy. is a vector of control variables, including Economic Development Level, Financial Development Level, Human Capital Level, Foreign Direct Investment, Industrial Agglomeration, and Government Intervention, to account for other potential influences on GTFEE. And represents city-fixed effects, controlling for unobserved time-invariant characteristics specific to each city, represents year-fixed effects, controlling for unobserved time-variant shocks common to all cities, is the error term. However, a positive and statistically significant estimate for could indicate that the Low-Carbon City Pilot Policy significantly enhances urban green total factor energy efficiency.
To examine the mediating roles of green innovation capacity and industrial structure upgrading, we employ a three-step mediation model. This approach involves estimating a series of regressions, as shown in Eq. (4)-(6).
First, we verify the total effect of the LCCPP on GTFEE through baseline model, as shown in Eq. (4). A statistically significant coefficient for indicates a direct impact. Second, we estimate the effect of the LCCPP on the mediating variables, as presented in Eq. (5). Where represents either Green Innovation Capacity () or Industrial Structure Upgrading (), and a significant coefficient for () suggests that the LCCPP influences the mediating variable. Finally, in Eq. (6), we estimate the effect of both the LCCPP and the mediating variables on GTFEE. For mediation to be established, the coefficient for () must be statistically significant and consistent with theoretical expectations. If the coefficient for () also remains significant, it implies partial mediation; if becomes insignificant, it indicates full mediation. This three-step approach allows us to disentangle the direct and indirect pathways through which the Low-Carbon City Pilot Policy impacts green total factor energy efficiency.
4. Results and Discussion
4.1. Baseline Regression Results
This section presents the baseline regression results from the multi-period DID model, examining the causal impact of the LCCPP on urban GTFEE. Table 2 displays the estimation results across four models, progressively adding control variables and fixed effects.
As shown in Table 2, the coefficient of the DID variable is consistently positive and statistically significant at the 1% level across all four models. Specifically, in Model (4), which includes all control variables and both city and year fixed effects, the DID coefficient is 0.0489. This indicates that the LCCPP significantly promotes urban GTFEE, suggesting the pilot policy has effectively enhanced the green total factor energy efficiency of designated cities. The robustness of this positive effect, maintained even after controlling various city-specific and time-specific factors, provides strong evidence to support that the LCCPP helps to enhance the GTFEE of cities.
Regarding the control variables in Model (4), several key findings emerge. The Economic Development Level (Eco) exhibits a positive and significant coefficient (0.0642***), suggesting that higher levels of economic development are associated with improved GTFEE, likely to reflect increased investment in green technologies and enhanced environmental governance as economies mature. Conversely, the Financial Development Level (Fin) shows an insignificant coefficient, indicating no statistically significant direct impact on GTFEE in this model. Human Capital Level (HR) demonstrates a positive and significant coefficient (0.3268***), implying that a more educated workforce contributes positively to GTFEE, potentially through enhanced innovation and the adoption of efficient practices. Similarly, Foreign Direct Investment (FDI) also presents a positive and significant coefficient (0.4690**), suggesting that FDI inflows may introduce advanced green technologies and management practices, thereby improving local GTFEE. In contrast, Industrial Agglomeration (Agg) displays a negative and significant coefficient (-0.0025**), which could suggest that excessive industrial concentration might lead to increased energy consumption and pollution, thereby hindering GTFEE. Finally, Government Intervention (Gov) has a positive and significant coefficient (0.1903**), indicating that increased government expenditure, possibly directed towards environmental protection and energy efficiency initiatives, positively influences GTFEE.
The R-squared values significantly increase from Model (1) to Model (2) (from 0.0192 to 0.6779) after including city and year fixed effects, highlighting the importance of controlling for unobserved heterogeneity. The R-squared further increases slightly in Models (3) and (4) as more control variables are added, indicating that these variables explain additional variation in GTFEE. Overall, the baseline regression results robustly demonstrate the positive and significant impact of the Low-Carbon City Pilot Policy on urban Green Total Factor Energy Efficiency.
4.2. Parallel Trend Test
A critical assumption for the validity of the Difference-in-Differences (DID) model is the parallel trend assumption, which posits that in the absence of the policy, the GTFEE trends in the pilot cities (treatment group) and non-pilot cities (control group) would have followed a similar path. To test this assumption, we employ an event study approach, estimating the dynamic effects of the LCCPP over time. The model specification for the parallel trend test is as Eq. (7) shown.
Where is a series of dummy variables. if city i in year t is k years relative to the policy implementation year, and 0 otherwise. For instance, indicates one year before policy implementation, and indicates one year after. The Current year (year 0, the year of policy implementation) is typically omitted as the reference group to avoid multicollinearity. The year of policy implementation (year 0) is omitted to serve as the reference group, and the coefficient thus captures the difference in GTFEE between the treatment and control groups in period k, relative to the difference in the year before policy implementation. Given our study period (2007-2022) and the staggered policy implementation dates (2010-2017), the relative policy periods (k) in our sample range from -10 to +12.
To validate the parallel trend assumption, we must ensure that the estimated coefficients are statistically insignificant for all periods before the policy (). This would confirm that the GTFEE trends of treatment and control groups were statistically parallel in the pre-treatment period. For the post-treatment period (), we expect the estimated coefficients to be positive and statistically significant, reflecting the dynamic positive policy effect of the LCCPP on urban GTFEE.
Figure 3 presents the estimated coefficients () and their 95% confidence intervals from the event study. The horizontal axis represents the years relative to policy implementation (with 0 being the implementation year), and the vertical axis shows the estimated coefficients. The dashed vertical line indicates the policy implementation year.
As depicted in Figure 3, prior to the policy implementation (i.e., for Pre10 to Pre2), all estimated coefficients are statistically insignificant from zero, and their confidence intervals largely overlap with the zero line. This indicates that there was no significant difference in the GTFEE trends between the pilot and non-pilot cities before the LCCPP was enacted, thus confirming that the parallel trend assumption holds.
Following the policy implementation, the coefficients for Post1 generally become positive and statistically significant, and their confidence intervals no longer overlap with zero. This suggests that the LCCPP began to significantly enhance urban GTFEE from the first year after its implementation, and this positive effect appears to be sustained over time. The coefficients show an increasing trend in the initial years post-implementation, indicating a growing positive impact of the policy on green total factor energy efficiency. These dynamic effects further reinforce the findings from the baseline regression, providing robust evidence for the effectiveness of the Low-Carbon City Pilot Policy.
4.3. Robustness Tests
To ensure the reliability and robustness of our baseline findings, we conduct a series of robustness tests by modifying the model specification and sample selection. The results are presented in Table 3.
The robustness checks consistently support our primary conclusion that the LCCPP significantly enhances urban GTFEE. First, we address potential external shocks by excluding the years impacted by the COVID-19 pandemic (2020-2022) from the sample. The results in column (1) show that the DID coefficient remains positive and highly significant (0.0416***), confirming that our findings are not driven by the extraordinary events of the pandemic. Second, to mitigate the potential influence of other coexisting policies, we exclude cities that also implemented other related policies during the study period. As shown in column (2), even with a reduced sample size, the DID coefficient remains positive and statistically significant (0.0346***), providing further confidence in the LCCPP’s distinct effect. Third, to account for potential serial correlation of errors within cities, we re-estimate the model using standard errors clustered at the city level. The results in column (3) show that while the t-statistic decreases, the DID coefficient (0.0489***) remains positive and highly significant, reinforcing the statistical robustness of our findings against potential within-city correlation. Finally, we address the possibility of omitted variable bias by introducing high-dimensional fixed effects. Column (4) presents the results from a model that includes City×Year FE, which controls for unobserved city-specific time trends that could potentially confound the policy effect. In this specification, the DID coefficient increases to 0.0893 and remains highly significant (p < 0.01), suggesting that our baseline results may even underestimate the true positive impact of the LCCPP on GTFEE.
In summary, across various alternative specifications and sample selections, the coefficient of the DID variable consistently remains positive and statistically significant. These robustness tests collectively confirm the reliability of our main conclusion: the Low-Carbon City Pilot Policy has a robust and positive effect on urban Green Total Factor Energy Efficiency.
4.4. PSM-DID Test
To address potential selection bias, we employ a Propensity Score Matching and Difference-in-Differences (PSM-DID) approach. This method constructs a more suitable control group by matching pilot cities with non-pilot cities that have similar observable characteristics [33]. The matching process is based on a propensity score derived from a logit model, and it uses one-to-one nearest neighbor matching with replacement [34].
Figure 4 displays the standardized percentage bias of the covariates before and after matching. The solid circles represent the unmatched samples, while the crosses represent the matched samples. The graph shows that after matching, the standardized bias for all covariates is significantly reduced, with most values falling within the ±10% range, which is well below the generally accepted threshold of 20%. This indicates that the matching process was successful in balancing the observable characteristics between the treatment and control groups, thereby strengthening the credibility of the DID estimation by mitigating selection bias.
Following the matching procedure, we apply the DID model to the new, matched sample. Table 4 presents the PSM-DID estimation results.
The results in Table 4 show that after controlling for selection bias, the DID coefficient remains positive and statistically significant at the 1% level across both models (Column 1 and 2), with values of 0.0414 and 0.0407, respectively. These results are highly consistent with our baseline findings and further confirm that the Low-Carbon City Pilot Policy has a genuine causal effect on improving urban GTFEE. The robustness of this finding across different methodologies provides strong evidence that the policy’s positive impact is not due to systematic pre-existing differences between pilot and non-pilot cities.
4.5. Mechanism Test
To explore the channels through which the LCCPP influences GTFEE, we conduct a series of mechanism tests. Specifically, we examine whether the policy operates by promoting green innovation and industrial structure upgrading. The results are presented in Table 5.
The results in Table 5 provide evidence that both green innovation and industrial structure upgrading serve as significant channels through which the LCCPP improves GTFEE. First, we examine the mediating role of green innovation (GreenInn). As shown in column (1), the coefficient of DID on GreenInn is positive and statistically significant (0.2350***), indicating that the LCCPP significantly promotes green innovation activities in pilot cities. In column (2), when both DID and GreenInn are included as explanatory variables for GTFEE, the coefficient for GreenInn is positive and highly significant (0.0397***), while the DID coefficient remains positive and significant (0.0396***). This suggests that LCCPP enhances GTFEE not only directly but also indirectly by fostering green innovation.
Second, we analyze the mediating effect of industrial structure upgrading (AIS). Column (3) shows a positive and significant coefficient for DID on AIS (0.0052*), suggesting the policy contributes to the upgrading of industrial structure. In column (4), where both DID and AIS are regressed on GTFEE, the AIS coefficient is positive and highly significant (0.1301***). The DID coefficient also remains positive and significant (0.0482***), indicating that industrial structure upgrading is another important channel through which the LCCPP improves GTFEE.
In conclusion, the mechanism tests confirm that the LCCPP’s positive impact on urban GTFEE is partially mediated by both the stimulation of green innovation and the acceleration of industrial structure upgrading.
5. Conclusions and Recommendation
In this study, we employed a multi-period Difference-in-Differences model to rigorously evaluate the causal impact and underlying mechanisms of China’s Low-Carbon City Pilot Policy on urban Green Total Factor Energy Efficiency. Using a comprehensive dataset of Chinese cities from 2007 to 2022, our research provides robust empirical evidence on the effectiveness of this significant environmental policy. The findings not only contribute to the literature on environmental policy evaluation but also offer critical insights for policymakers aiming to achieve sustainable development goals.
Our primary finding is that the LCCPP has a significant and robust positive impact on urban GTFEE. This conclusion is consistently supported by a series of empirical analyses, including baseline regressions with extensive control variables and fixed effects, a parallel trend test using an event study, and various robustness checks. Specifically, the parallel trend test confirmed the validity of our DID model, showing no significant differences between pilot and non-pilot cities before the policy implementation, while a strong positive effect emerged thereafter. Furthermore, robustness tests—such as excluding the pandemic period and using PSM-DID to mitigate selection bias—reinforced the reliability of our main conclusion, confirming a genuine causal link between the LCCPP and improved GTFEE.
Beyond the direct impact, our mechanism analysis revealed two key pathways through which the LCCPP exerts its positive influence. First, we found that the policy significantly promotes green innovation, which in turn leads to enhanced GTFEE. This suggests that by providing local autonomy and flexibility, the LCCPP successfully incentivizes cities to develop and adopt new green technologies. Second, our results indicate that the policy contributes to the upgrading of industrial structure, which also plays a crucial role in improving GTFEE. This dual-channel effect highlights the policy's comprehensive approach, driving both technological advancements and structural economic transformation towards a greener development path.
Based on our findings, we propose the following policy recommendations. First, given the proven effectiveness of the LCCPP, the Chinese government should consider scaling up this successful initiative by expanding it to more cities and regions. The policy’s “bottom-up” design, which allows for local adaptation and innovation, makes it a powerful tool for promoting sustainable development across diverse urban environments. When implementing this expansion, policymakers should encourage localized strategies that consider each city's unique economic structure, resource endowment, and environmental challenges to maximize the policy’s benefits.
Second, our mechanism analysis provides a clear roadmap for enhancing the policy’s effectiveness. To further leverage the role of green innovation, the government should strengthen supporting measures such as R&D subsidies, tax incentives for green technology development, and intellectual property protection for green patents. Simultaneously, efforts to accelerate industrial structure upgrading should be intensified through targeted policies aimed at phasing out outdated, high-emission industries and fostering the growth of strategic emerging sectors. By proactively nurturing these two key channels, the government can amplify the positive effects of the LCCPP and ensure a more sustainable and efficient urban development trajectory.
Despite the significant contributions of this study, several limitations provide avenues for future research. First, while our use of city-level panel data allows for robust DID analysis, it may not fully capture the heterogeneity of policy implementation and the diverse responses of different enterprise types, such as state-owned versus private firms, within each city. Future studies could benefit from using firm-level data to explore these micro-level effects in more detail, providing a more granular understanding of the impacts of the policy. Second, our analysis treats the LCCPP as a unified policy shock, but in reality, the specific measures and enforcement intensity can vary across different pilot cities. Future research could gather more detailed policy documents to conduct a more nuanced analysis of policy heterogeneity. Finally, while our event study provides insights into the short-to-medium-term dynamic effects, the long-term, sustained impact of the LCCPP on GTFEE remains an area for further investigation. A longer time series could help to fully assess the lasting effects of the policy as cities continue to adapt and evolve.
Author Contributions
Songyuan Liu: Data curation, Formal analysis, Investigation, Methodology, Software, Validation, Visualization, Writing – original draft, Writing – review & editing. Ziyu Wu: Conceptualization, Formal analysis, Investigation, Supervision, Validation, Writing – original draft, Writing – review & editing. Mei Wang: Conceptualization, Formal analysis, Funding acquisition, Investigation, Supervision, Validation, Writing – original draft, Writing – review & editing. Lingfeng Tan: Writing – review & editing, Supervision, Conceptualization.
Data Availability Statement
The datasets generated and/or analyzed during this study are available from the corresponding author upon reasonable request.
Acknowledgements
The authors are grateful to the financial support provided by the National Natural Science Foundation of China (nos. 72003195 & 72373065).
Conflicts of Interest
The authors declare no conflicts of interest.
Appendix A
|
Nomenclature Abbreviations | ||
| LCCPP | Low-Carbon City Pilot Policy | |
| GTFEE | Green Total Factor Energy Efficiency | |
| DID | Difference-in-Differences model | |
| SBM-DEA | Slacks-Based Measure Data Envelopment Analysis | |
| PSM-DID | Propensity Score Matching Difference-in-Differences model | |
| Variables | ||
| GTFEE | The green total factor energy efficiency of a city | |
| DID | The core explanatory variable, indicating the policy effect | |
| Eco | Economic development level | |
| Fin | Financial development level | |
| HR | Human capital level | |
| FDI | Foreign direct investment | |
| Med | The mediating variable | |
| Agg | Industrial agglomeration | |
| Gov | Government intervention | |
| GreenInn | Green innovation capacity | |
| AIS | Industrial structure upgrading | |
| Parameters | ||
| The intercept of the regression model | ||
| The coefficient of the DID variable, representing the policy’s causal effect | ||
| The coefficients of the control variables | ||
| City-specific fixed effects | ||
| Year-specific fixed effects | ||
| The error term | ||
| The coefficient for the core explanatory variable | ||
| The coefficient for the mediating variable | ||
References
- Du, X.; Huang, Z. Ecological and environmental effects of land use change in rapid urbanization: the case of Hangzhou, China. Ecol. Indic. 2017, 81, 243–251. [Google Scholar] [CrossRef]
- Liu, K.; Huang, T.; Xia, Z.; Xia, X.; Wu, R. The impact assessment of low-carbon city pilot policy on urban green innovation: A batch-time heterogeneity perspective. Appl. Energy 2025, 377, 124489. [Google Scholar] [CrossRef]
- Ahmad, M.; Zhao, Z.-Y.; Li, H. Revealing stylized empirical interactions among construction sector, urbanization, energy consumption, economic growth and CO2 emissions in China. Sci. Total Environ. 2019, 657, 1085–1098. [Google Scholar] [CrossRef] [PubMed]
- Li, X.; Xu, Y.; Tan, H.; Lei, Y. Low-carbon city pilot policies and urban carbon productivity improvement: An empirical analysis from the perspective of green competitiveness. Environ. Sustain. Indic. 2024, 24, 100531. [Google Scholar] [CrossRef]
- Yu, W.; Li, Z.; Hu, C. Carbon reduction and corporate sustainability: Evidence from low-carbon city pilot policy. Heliyon 2024, 10, e28992. [Google Scholar] [CrossRef]
- Ren, Y. S.; Liu, P. Z.; Klein, T.; Sheenan, L. Does the low-carbon pilot cities policy make a difference to the carbon intensity reduction? J. Econ. Behav. Organ. 2024, 217, 227–239. [Google Scholar] [CrossRef]
- Zhang, N.; Sun, F.; Hu, Y. Carbon emission efficiency of land use in urban agglomerations of Yangtze River Economic Belt, China: Based on three-stage SBM-DEA model. Ecol. Indic. 2024, 160, 111922. [Google Scholar] [CrossRef]
- Xie, L.; Hui, S. Low-carbon transition policy and employment structure: Evidence from China’s Low-carbon City Pilot. Cities 2025, 162, 105985. [Google Scholar] [CrossRef]
- Liu, X.; Jia, X.; Lyu, K.; Guo, P.; Shen, J. The impact of low-carbon city pilot policy on urban energy transition: an analysis of multiple mediating effects based on “government–enterprise–resident”. Energy, Ecology and Environment 2024, 9, 419–438. [Google Scholar] [CrossRef]
- Yuan, G.; Liu, J.; Wang, Y. Low-carbon city pilot policies, government attention, and green total factor productivity. Finance Res. Lett. 2025, 77, 107043. [Google Scholar] [CrossRef]
- Zeng, S.; Jin, G.; Tan, K.; Liu, X. Can low-carbon city construction reduce carbon intensity? Empirical evidence from low-carbon city pilot policy in China. J. Environ. Manag. 2023, 332, 117363. [Google Scholar] [CrossRef]
- Liu, Y.; Wu, K.; Liang, X. Does low-carbon pilot policy promote corporate green total factor productivity? Econ. Anal. Policy 2024, 84, 1–24. [Google Scholar] [CrossRef]
- Cui, H.; Cao, Y. Low-carbon city construction, spatial spillovers and greenhouse gas emission performance: Evidence from Chinese cities. J. Environ. Manag. 2024, 355, 120405. [Google Scholar] [CrossRef] [PubMed]
- Chen, L.; Wang, K. The spatial spillover effect of low-carbon city pilot scheme on green efficiency in China’s cities: evidence from a quasi-natural experiment. Energy Economics 2022, 110, 106018. [Google Scholar] [CrossRef]
- Honma, S.; Hu, J. L. A panel data parametric frontier technique for measuring total-factor energy efficiency: An application to Japanese regions. Energy 2014, 78, 732–739. [Google Scholar] [CrossRef]
- Wu, H.; Hao, Y.; Ren, S.; Yang, X.; Xie, G. Does internet development improve green total factor energy efficiency? Evidence from China. Energy Policy 2021, 153, 112247. [Google Scholar] [CrossRef]
- Gao, D.; Li, G.; Yu, J. Does digitization improve green total factor energy efficiency? Evidence from Chinese 213 cities. Energy 2022, 247, 123395. [Google Scholar] [CrossRef]
- Li, J.; Lin, B. Ecological total-factor energy efficiency of China’s heavy and light industries: which performs better? Renew. Sustain. Energy Rev. 2017, 72, 83–94. [Google Scholar] [CrossRef]
- Li, N.; Jiang, Y.; Yu, Z.; Shang, L. Analysis of agriculture total-factor energy efficiency in China based on DEA and Malmquist indices. Energy Procedia 2017, 142, 2397–2402. [Google Scholar] [CrossRef]
- Feng, C.; Huang, J. B.; Wang, M. Analysis of green total-factor productivity in China's regional metal industry: A meta-frontier approach. Resources Policy 2018, 58, 219–229. [Google Scholar] [CrossRef]
- Guo, W.; Liu, X. Market fragmentation of energy resource prices and green total factor energy efficiency in China. Resources Policy 2022, 76, 102580. [Google Scholar] [CrossRef]
- Guan, X.; Zhu, X.; Liu, X. Carbon Emission, air and water pollution in coastal China: Financial and trade effects with application of CRS-SBM-DEA model. Alexandria Eng. J. 2022, 61, 1469–1478. [Google Scholar] [CrossRef]
- Liu, H.; Yang, R.; Wu, J.; Chu, J. Total-factor energy efficiency change of the road transportation industry in China: A stochastic frontier approach. Energy 2021, 219, 119612. [Google Scholar] [CrossRef]
- Lyu, J.; Liu, T.; Cai, B.; Qi, Y.; Zhang, X. Heterogeneous effects of China’s low-carbon city pilots policy. J. Environ. Manag. 2023, 344, 118329. [Google Scholar] [CrossRef]
- Yang, S.; Jahanger, A.; Hossain, M.R. How effective has the low-carbon city pilot policy been as an environmental intervention in curbing pollution? Evidence from Chinese industrial enterprises. Energy Econ. 2023, 118, 106523. [Google Scholar] [CrossRef]
- Yang, X.; Yang, X.; Zhu, J.; Jiang, P.; Lin, H.; Cai, Z.; Huang, H. Achieving co-benefits by implementing the low-carbon city pilot policy in China: Effectiveness and efficiency. Environ. Technol. Innov. 2023, 30, 103137. [Google Scholar] [CrossRef]
- Lu, D.; Wenling, Z.; Aiping, H. The impact of pilot Low-carbon city policies on urban energy ecological efficiency. Econ. Anal. Policy 2025, 87, 1014–1031. [Google Scholar] [CrossRef]
- Kuosmanen, T.; Saastamoinen, A.; Sipiläinen, T. What is the best practice for benchmark regulation of electricity distribution? Comparison of DEA, SFA and StoNED methods. Energy Policy 2013, 61, 740–750. [Google Scholar] [CrossRef]
- Zhou, P.; Ang, B. W.; Zhou, D. Q. Measuring economy-wide energy efficiency performance: A parametric frontier approach. Appl. Energy 2012, 90, 196–200. [Google Scholar] [CrossRef]
- Lin, X.; Zhu, X.; Han, Y.; et al. Economy and carbon dioxide emissions effects of energy structures in the world: Evidence based on SBM-DEA model. Sci. Total Environ. 2020, 729, 138947. [Google Scholar] [CrossRef]
- Andersen, P.; Petersen, N.C. A procedure for ranking efficient units in data envelopment analysis. Manag. Sci. 1993, 39, 1261–1264. [Google Scholar] [CrossRef]
- Xu, G.; Feng, S.; Guo, S.; et al. The spatial-temporal evolution analysis of carbon emission of China’s thermal power industry based on the three-stage SBM—DEA model. Int. J. Clim. Chang. Strateg. Manag. 2023, 15, 247–263. [Google Scholar] [CrossRef]
- Xu, A.; Song, M.; Wu, Y.; Luo, Y.; Zhu, Y.; Qiu, K. Effects of new urbanization on China’s carbon emissions: A quasi-natural experiment based on the improved PSM-DID model. Technol. Forecast. Soc. Change 2024, 200, 123164. [Google Scholar] [CrossRef]
- Duan, Z.; Lee, S.; Lee, G. Evaluation of the effect of a low-carbon green city policy on carbon abatement in South Korea: A city-level analysis based on PSM-DID and LSA models. Ecol. Indic. 2024, 158, 111369. [Google Scholar] [CrossRef]
Figure 1.
Annual distribution map of green total factor energy efficiency.
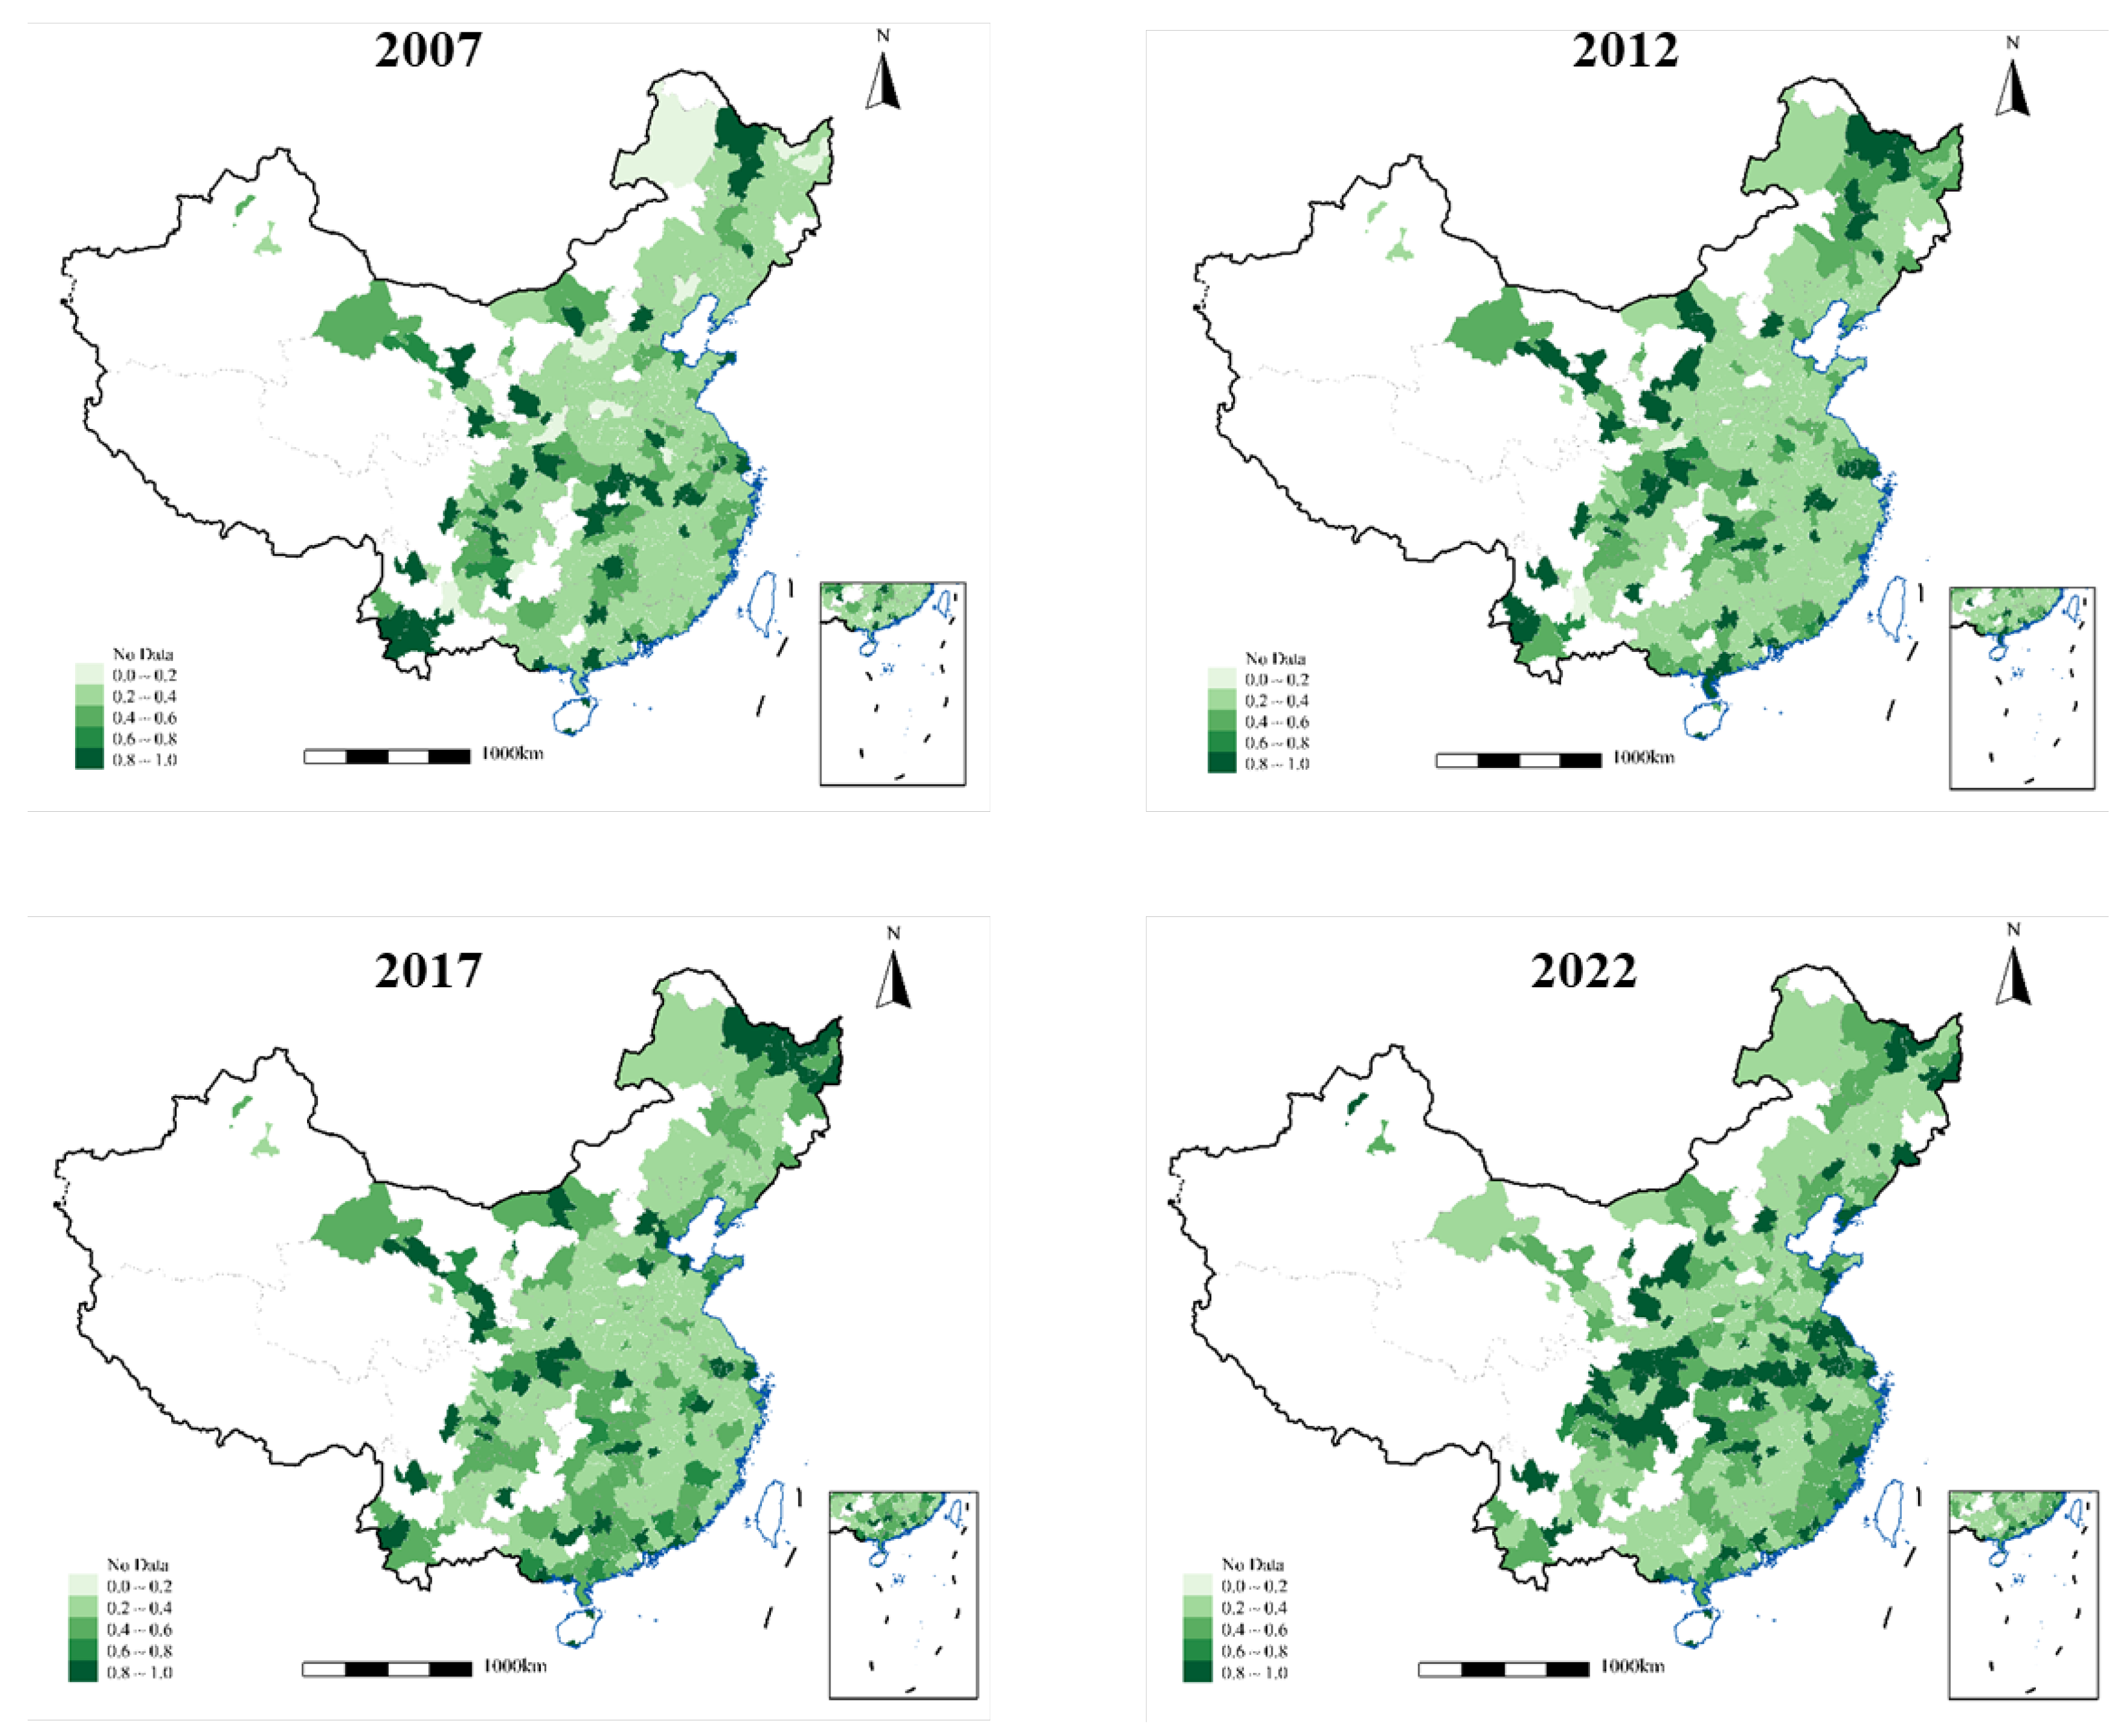
Figure 2.
Green total factor energy efficiency time chart by region.
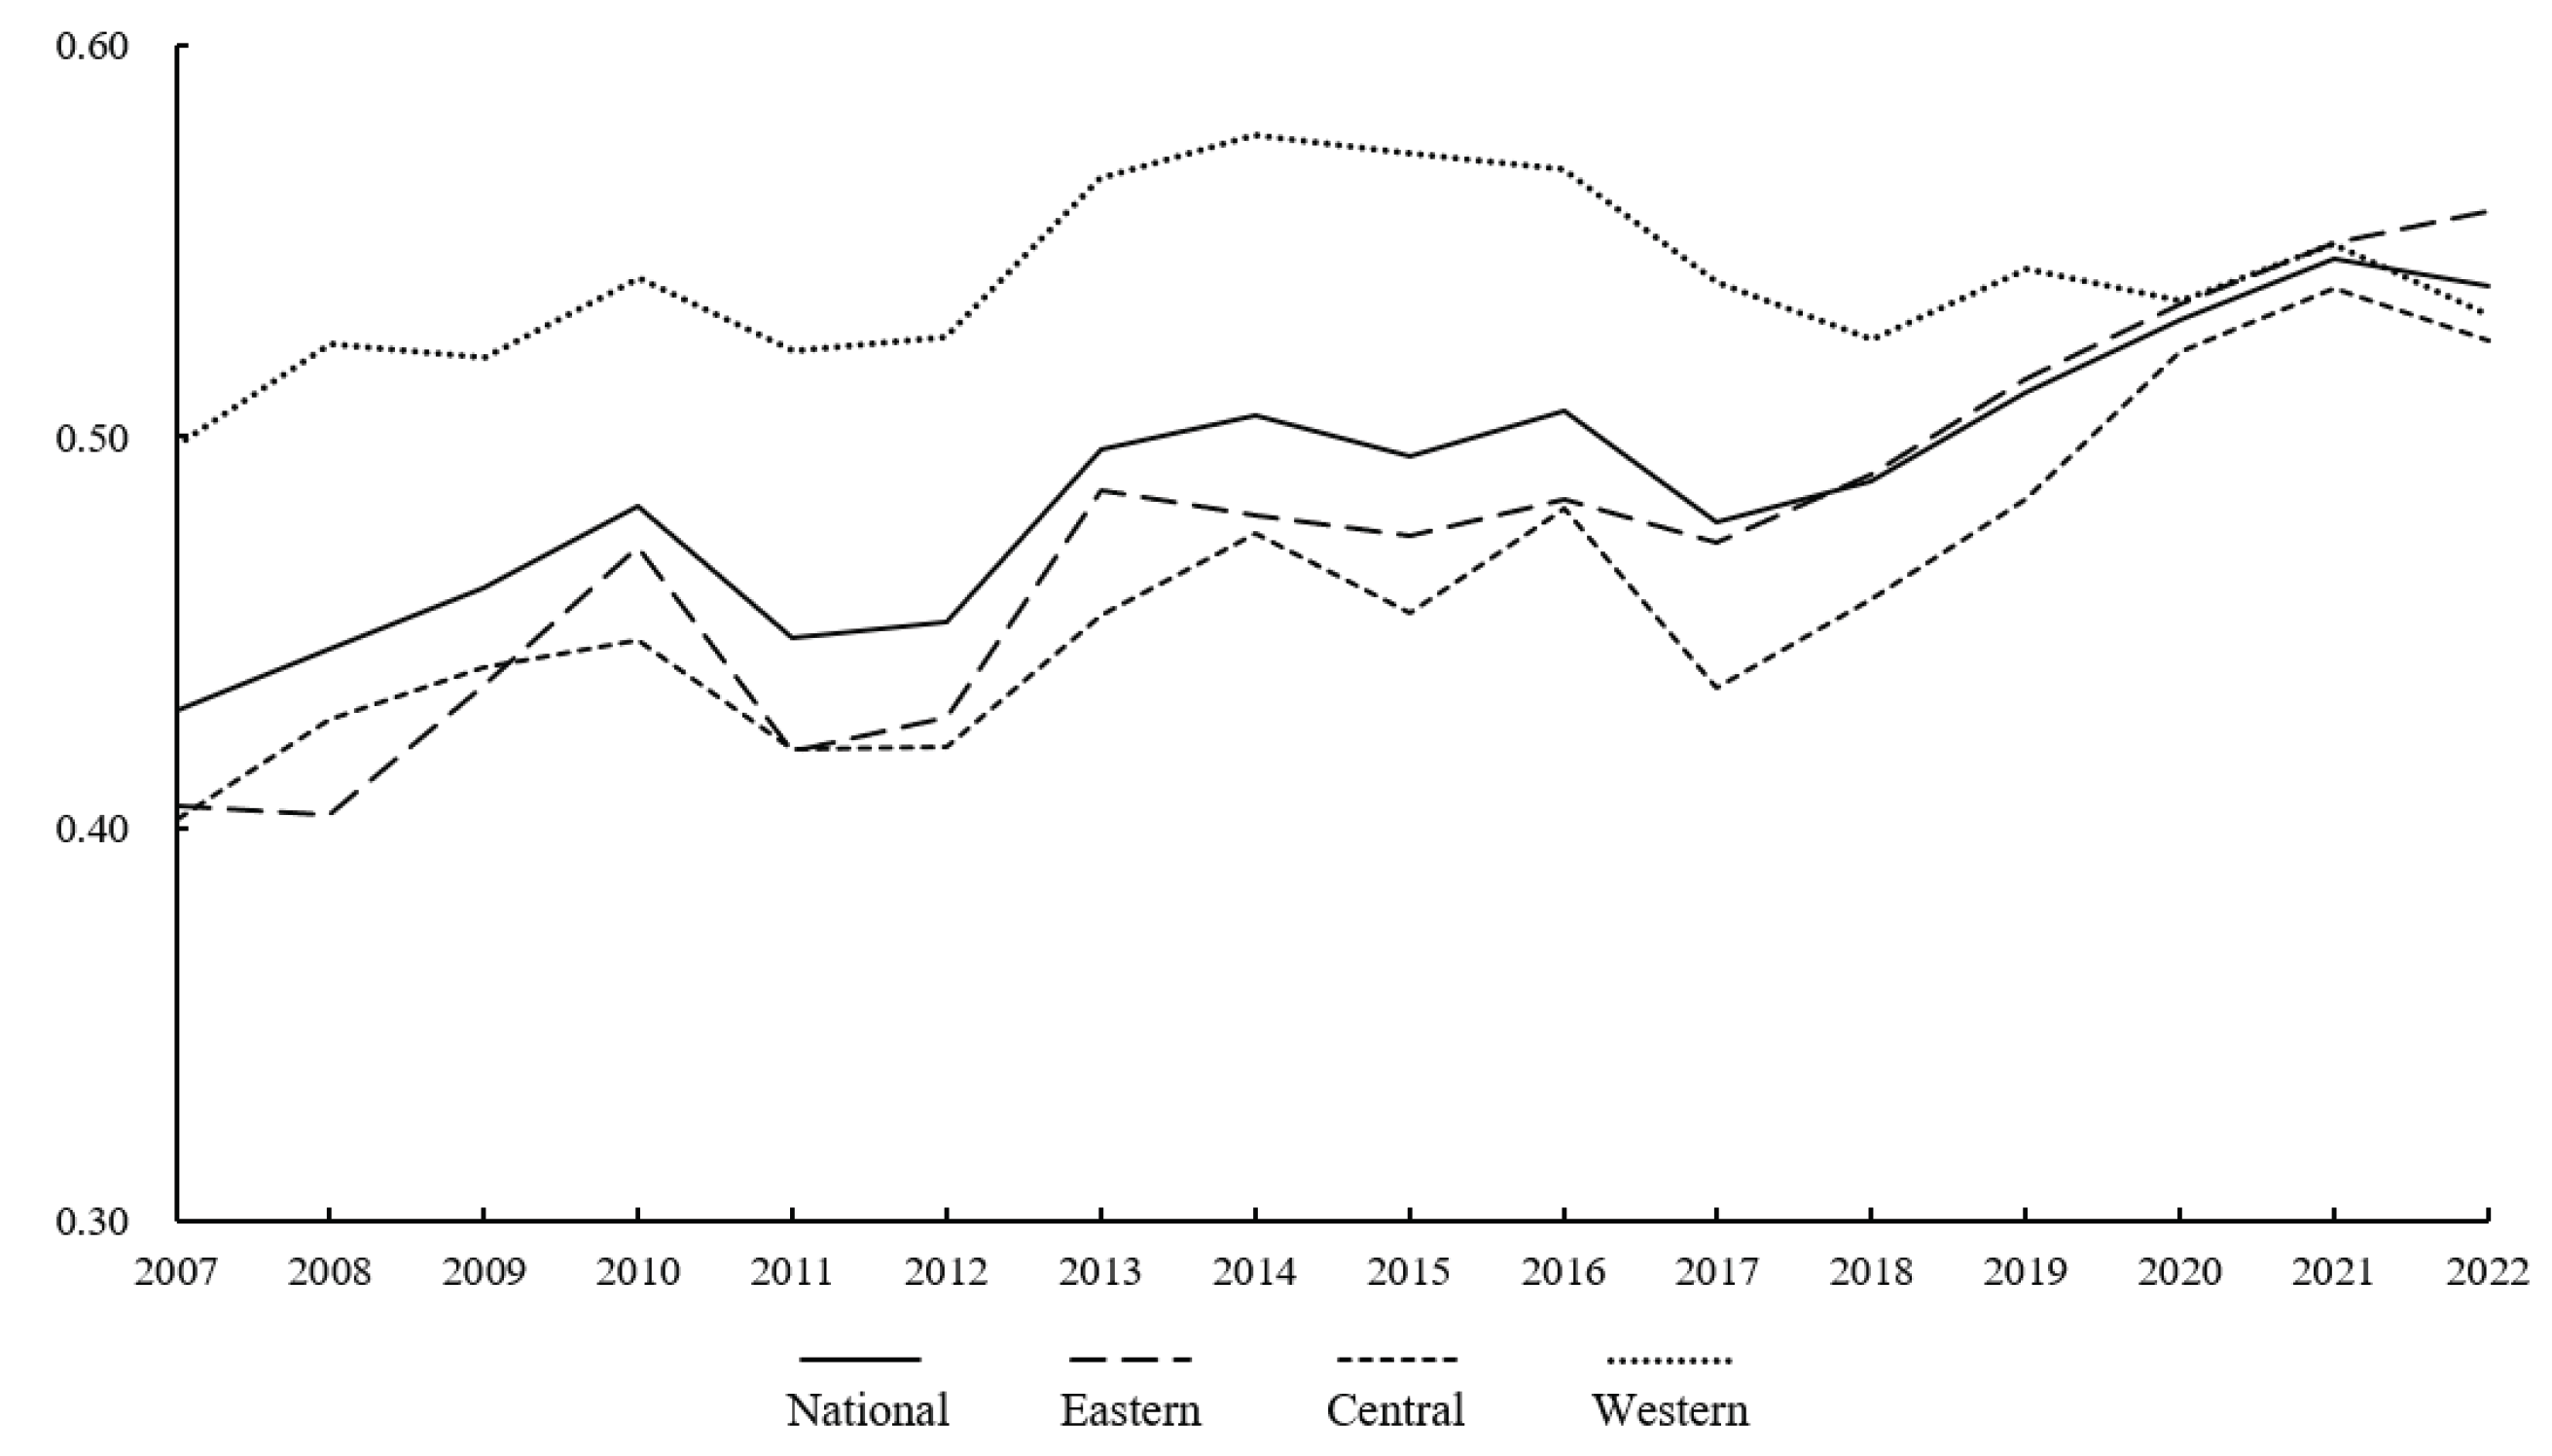
Figure 3.
The parallel trend test.
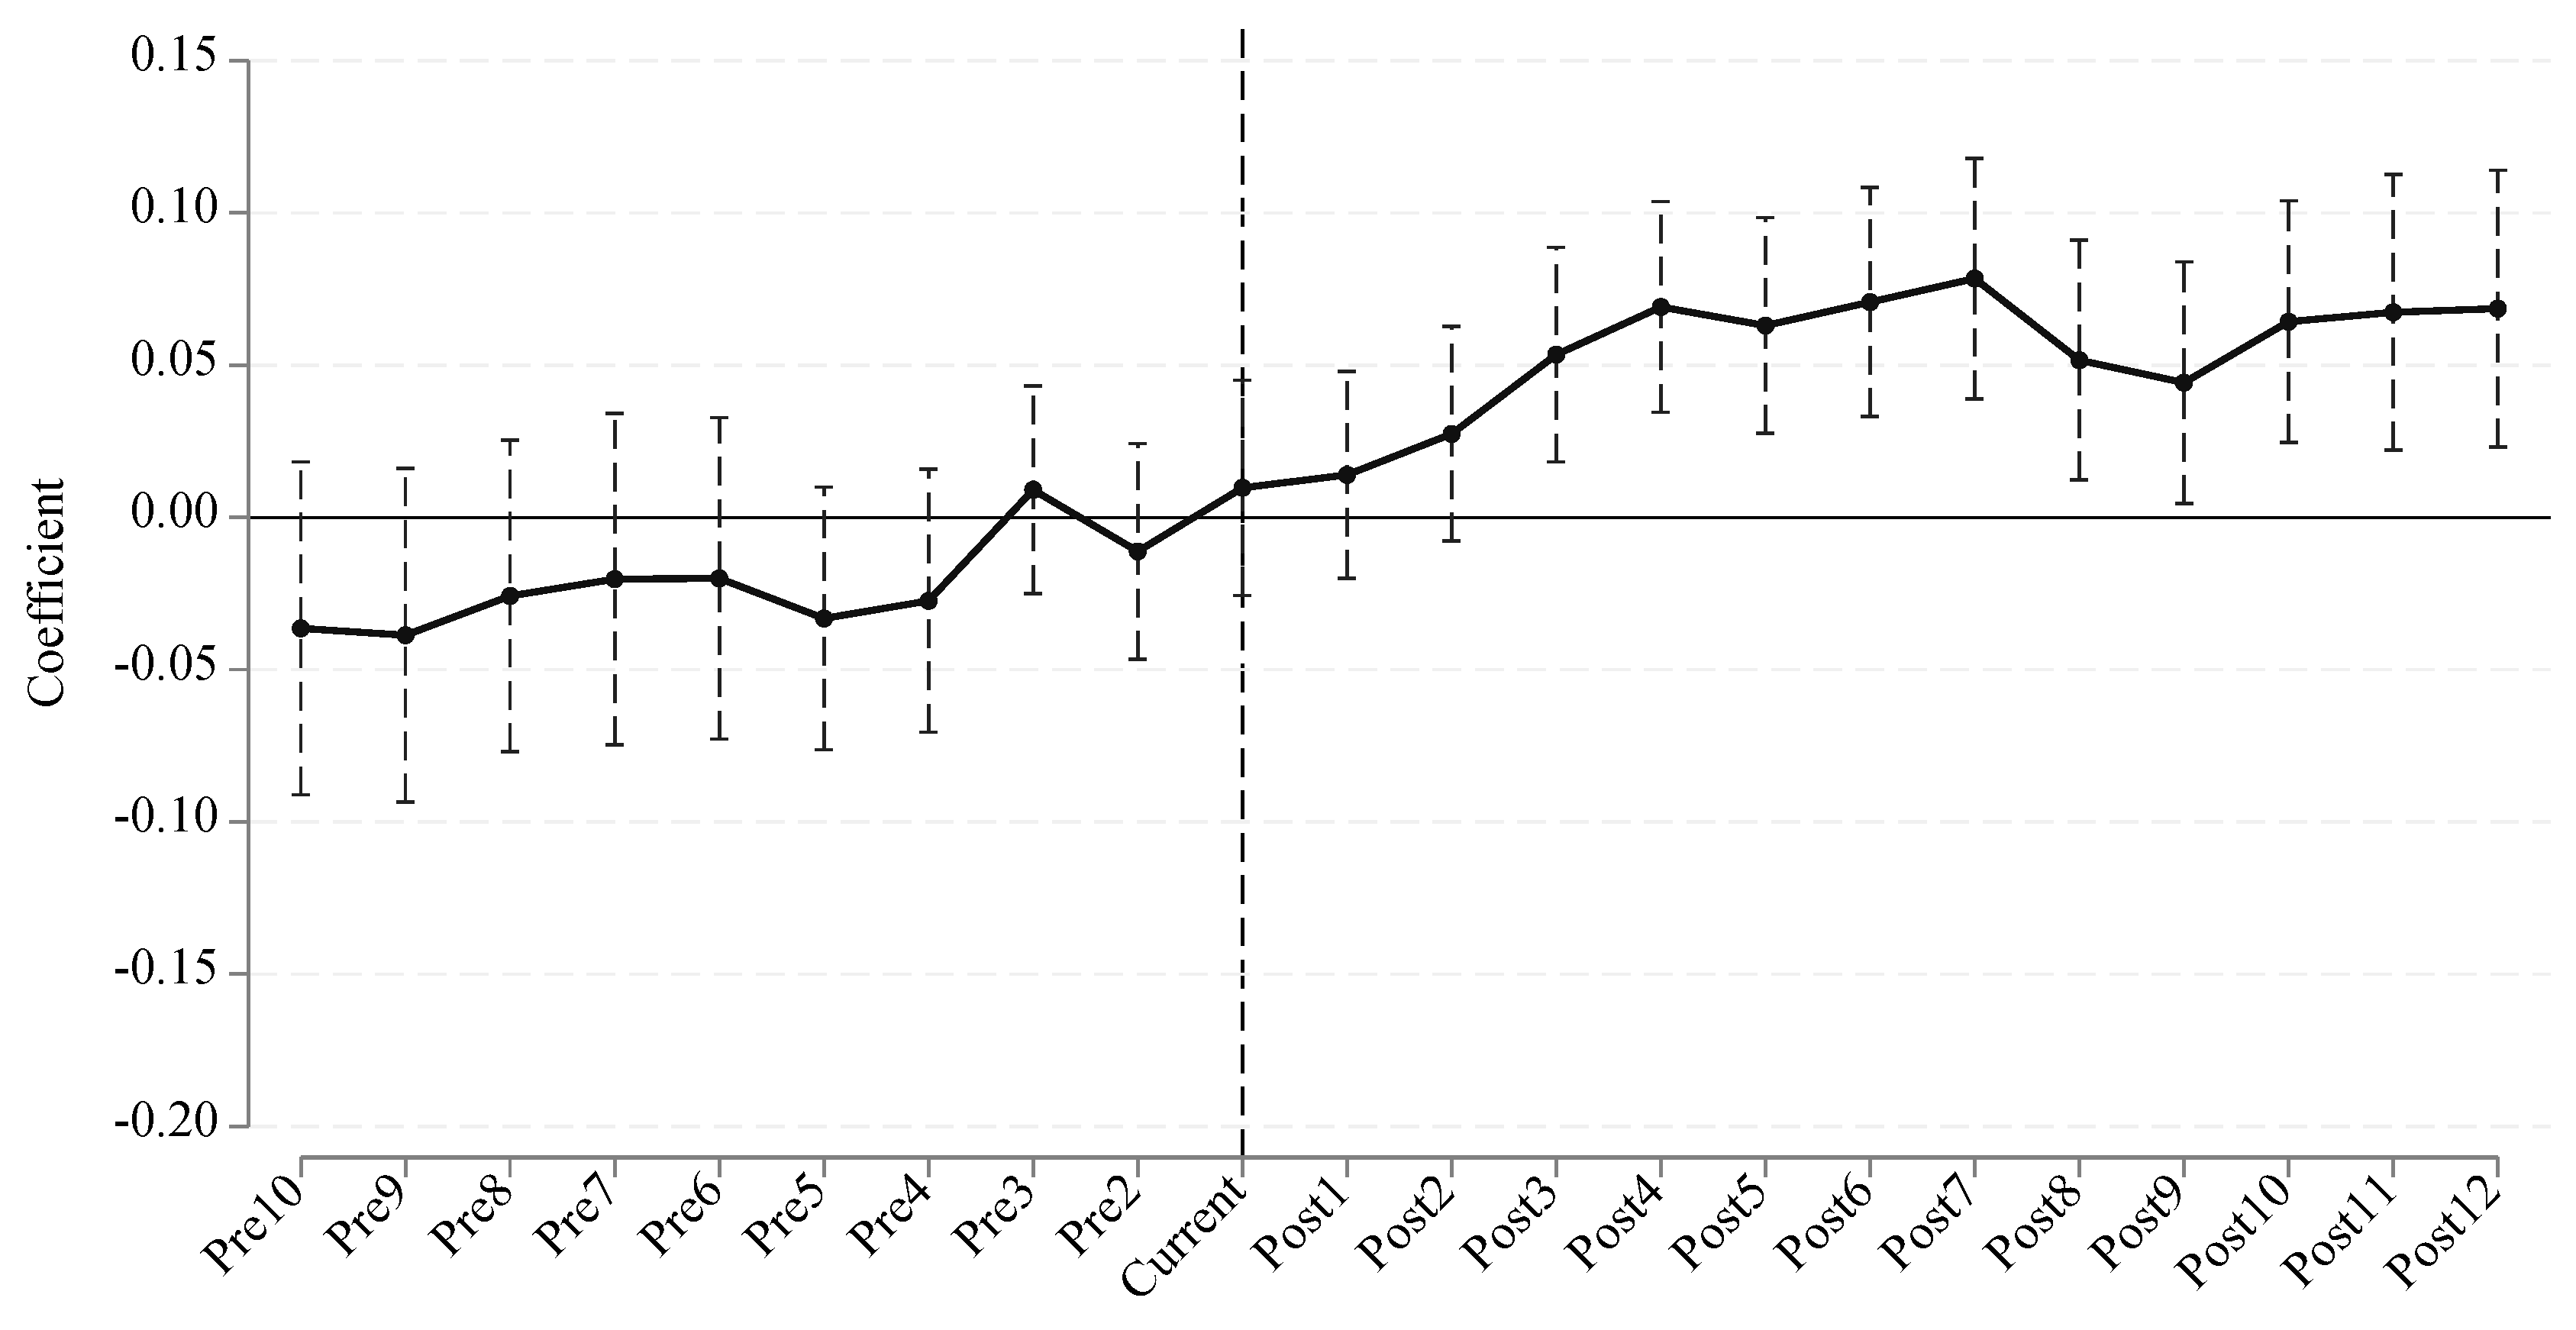
Figure 4.
Balance test results.
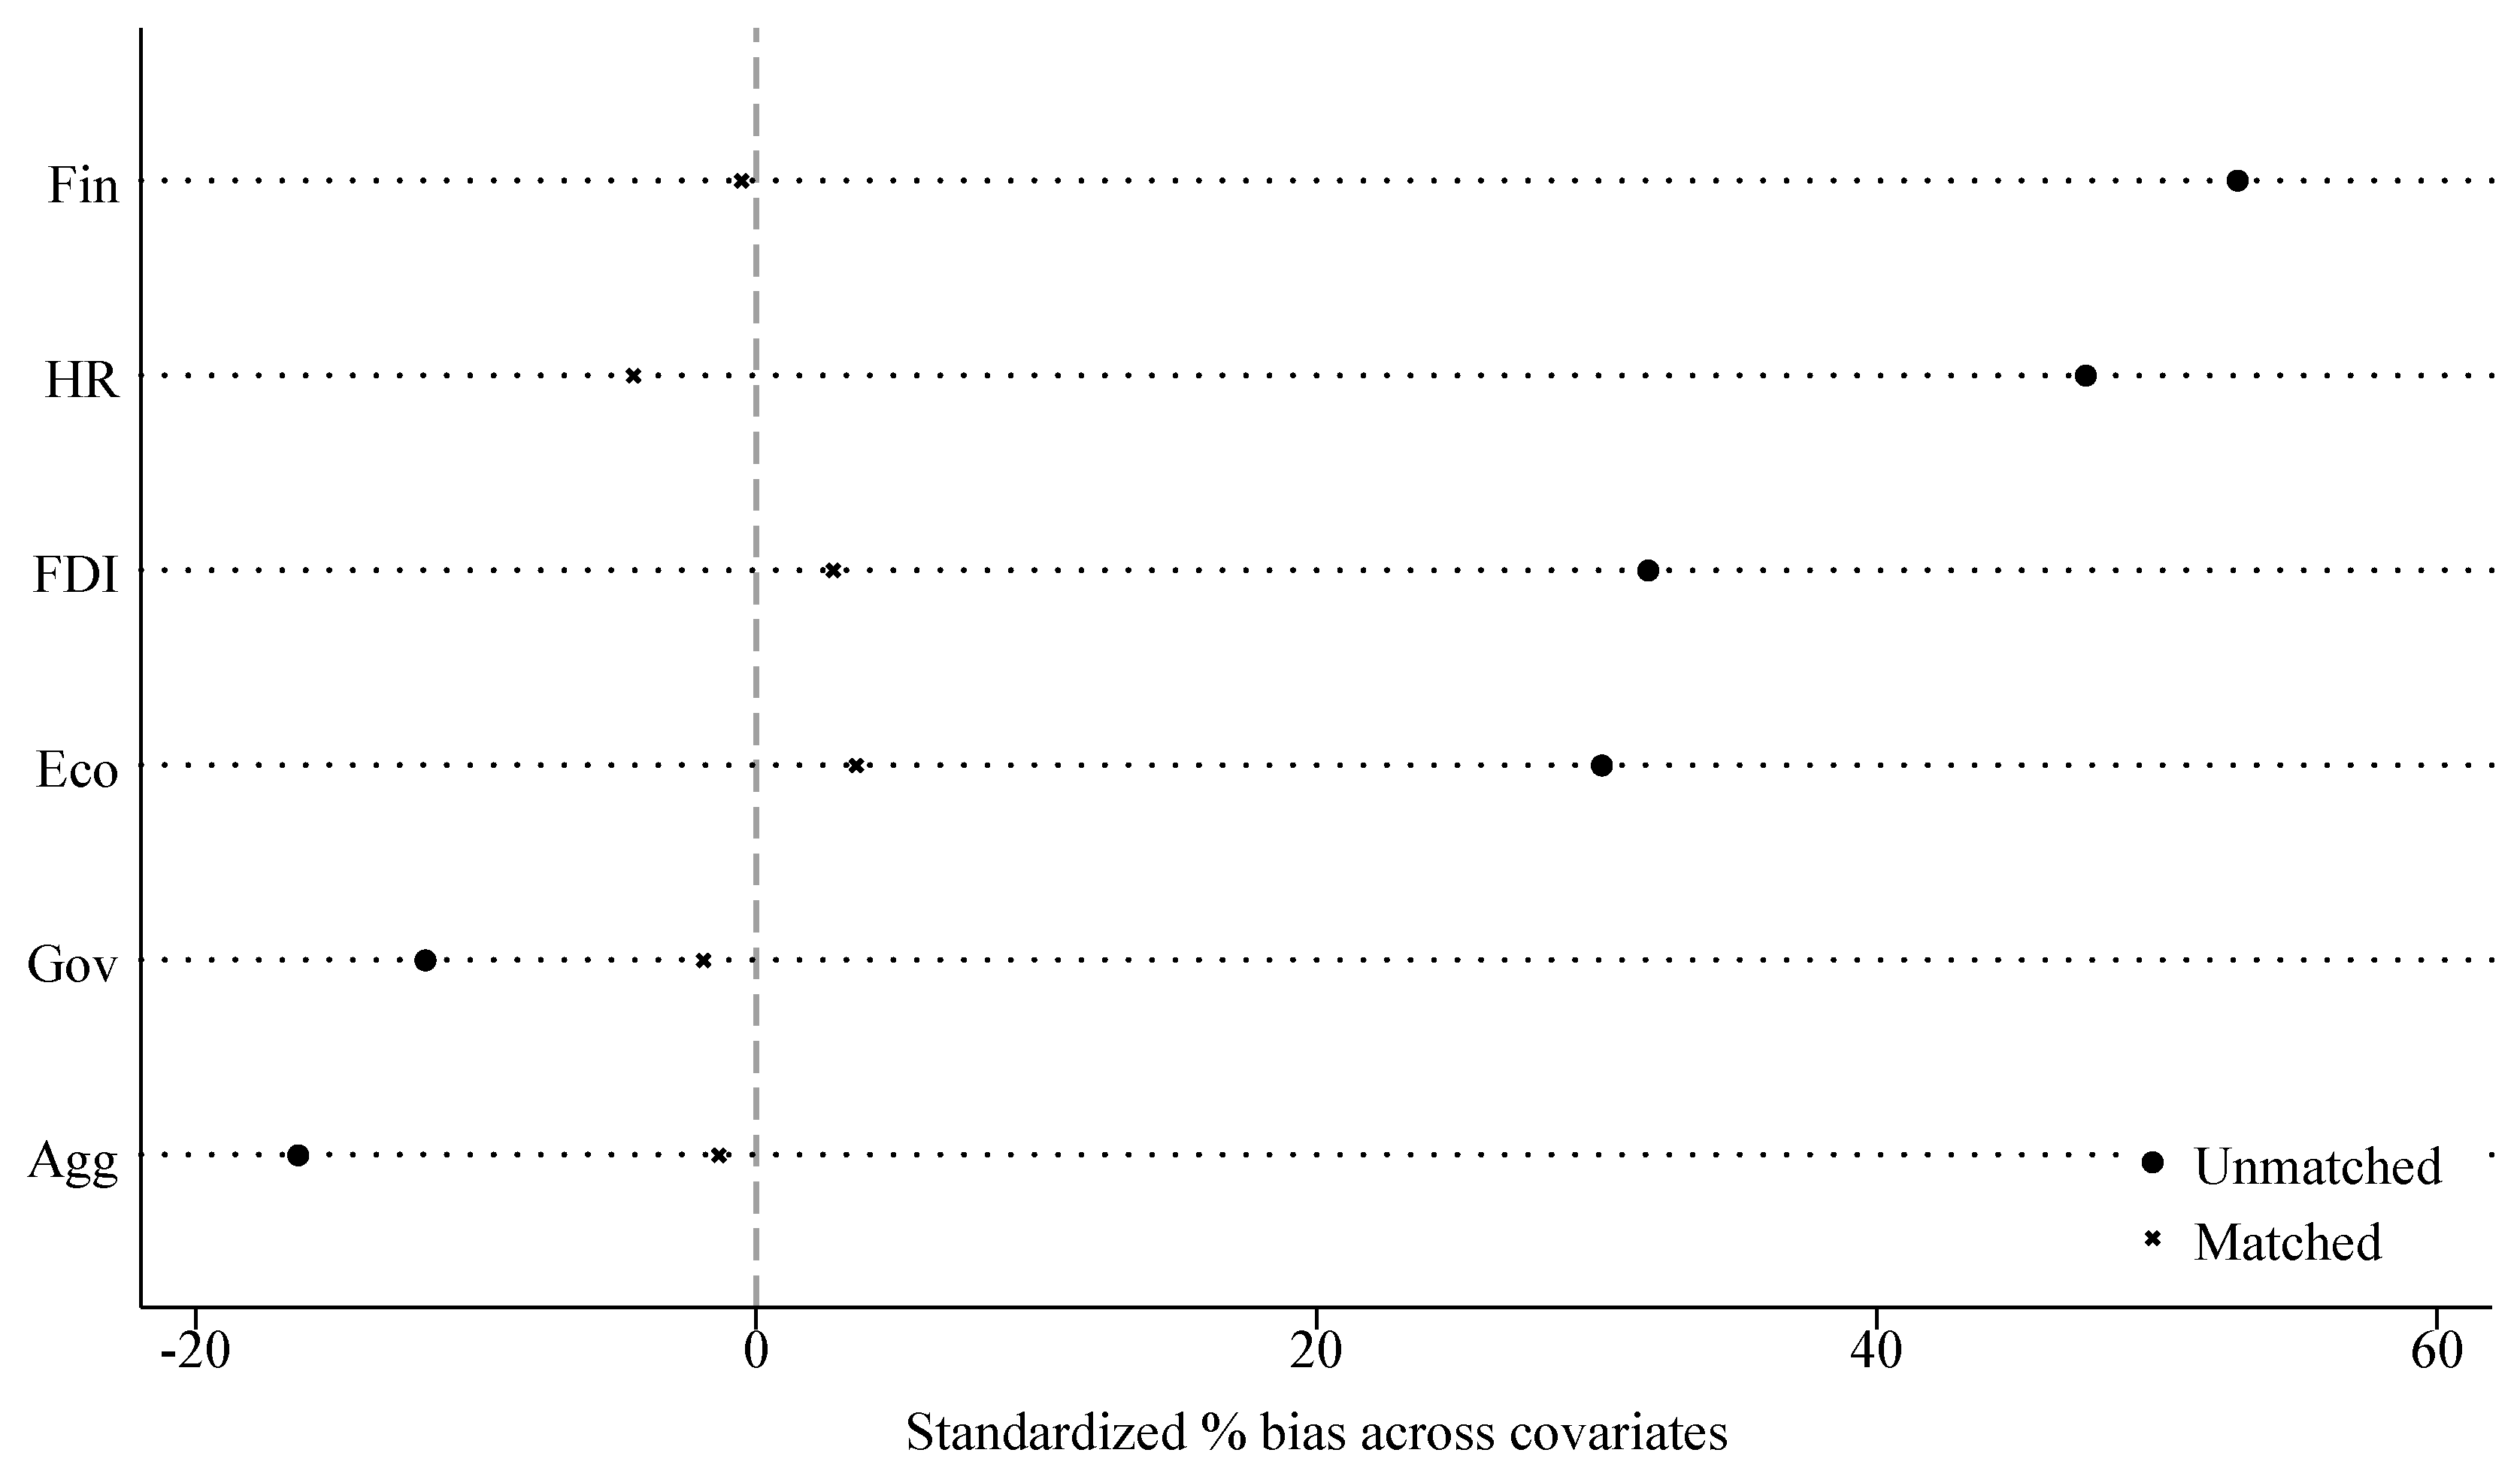
Table 1.
Descriptive statistics.
| Variable | Obs. | Mean | S.D. | Min | Median | Max |
| GTFEE | 4192 | 0.4853 | 0.2192 | 0.2075 | 0.4078 | 0.9818 |
| DID | 4192 | 0.3115 | 0.4632 | 0.0000 | 0.0000 | 1.0000 |
| GreenInn | 4192 | 0.2594 | 0.7082 | 0.0000 | 0.0375 | 5.0130 |
| AIS | 4192 | 2.3025 | 0.1483 | 1.9752 | 2.2944 | 2.7188 |
| Eco | 4192 | 10.6086 | 0.6618 | 8.9873 | 10.6329 | 12.0072 |
| Fin | 4192 | 2.4387 | 1.1450 | 0.9343 | 2.1178 | 6.6637 |
| HR | 4192 | 0.0999 | 0.1659 | 0.0015 | 0.0395 | 0.8779 |
| FDI | 4192 | 0.0198 | 0.0171 | 0.0025 | 0.0140 | 0.0828 |
| Agg | 4192 | 4.5763 | 4.2666 | 0.1954 | 3.1492 | 23.0769 |
| Gov | 4192 | 0.1804 | 0.0819 | 0.0672 | 0.1600 | 0.4906 |
Table 2.
Baseline regression.
| (1) | (2) | (3) | (4) | |
| GTFEE | GTFEE | GTFEE | GTFEE | |
| DID | 0.0659*** | 0.0512*** | 0.0506*** | 0.0489*** |
| (9.1048) | (6.3109) | (6.2470) | (5.9873) | |
| Eco | 0.0510*** | 0.0642*** | ||
| (3.5135) | (4.1984) | |||
| Fin | 0.0005 | -0.0036 | ||
| (0.0777) | (-0.5676) | |||
| HR | 0.3268*** | |||
| (4.6916) | ||||
| FDI | 0.4690** | |||
| (2.2253) | ||||
| Agg | -0.0025** | |||
| (-2.4029) | ||||
| Gov | 0.1903** | |||
| (2.5427) | ||||
| Constant | 0.4648*** | 0.4693*** | -0.0727 | -0.2671 |
| (115.0136) | (147.7691) | (-0.4478) | (-1.5543) | |
| City FE | N | Y | Y | Y |
| Year FE | N | Y | Y | Y |
| N | 4192 | 4192 | 4192 | 4192 |
| R2 | 0.0192 | 0.6779 | 0.6791 | 0.6818 |
Notes: t statistics are reported in parentheses. ***、**、* indicate significance at the 1%, 5% and 10%, respectively.
Table 3.
Robustness tests.
| (1) Exclude Pandemic | (2) Consider overlapping policy | (3) Cluster standard error | (4) High-dimension FE | |
| GTFEE | GTFEE | GTFEE | GTFEE | |
| DID | 0.0416*** | 0.0346*** | 0.0489*** | 0.0893*** |
| (4.9745) | (3.1721) | (3.2495) | (8.4321) | |
| Eco | 0.0542*** | 0.0024 | 0.0642* | 0.1062*** |
| (3.2742) | (0.1224) | (1.8234) | (5.6793) | |
| Fin | -0.0061 | -0.0011 | -0.0036 | -0.0035 |
| (-0.9065) | (-0.1410) | (-0.3196) | (-0.4734) | |
| HR | 0.2765*** | -0.1351 | 0.3268** | 0.3415*** |
| (3.6298) | (-0.6224) | (2.3431) | (4.7481) | |
| FDI | 0.4885** | 0.3370 | 0.4690 | 1.4599*** |
| (2.2104) | (1.1261) | (1.2321) | (5.3351) | |
| Agg | -0.0020* | -0.0036*** | -0.0025 | -0.0017 |
| (-1.8476) | (-2.8783) | (-1.2712) | (-1.6022) | |
| Gov | 0.1703** | 0.2266*** | 0.1903 | 0.1793** |
| (2.1049) | (2.6228) | (0.9979) | (2.0758) | |
| Constant | -0.1486 | 0.4328** | -0.2671 | -0.7458*** |
| (-0.8071) | (2.0271) | (-0.6905) | (-3.6434) | |
| City FE | Y | Y | Y | Y |
| Year FE | Y | Y | Y | Y |
| City×Year FE | N | N | N | Y |
| N | 3668 | 2624 | 4192 | 4112 |
| R2 | 0.6973 | 0.6992 | 0.6818 | 0.7148 |
Notes: t statistics are reported in parentheses, where the third column uses standard errors clustered at the city level. ***、**、* indicate significance at the 1%, 5% and 10%, respectively.
Table 4.
PSM-DID estimation.
| (1) Common support | (2) Matched samples | |
| GTFEE | GTFEE | |
| DID | 0.0414*** | 0.0407*** |
| (4.8159) | (4.6193) | |
| Eco | 0.0781*** | 0.0758*** |
| (4.9483) | (4.5815) | |
| Fin | 0.0037 | 0.0058 |
| (0.5348) | (0.8157) | |
| HR | 0.1801** | 0.1640* |
| (2.0738) | (1.8410) | |
| FDI | 0.5411** | 0.5624** |
| (2.4121) | (2.4242) | |
| Agg | -0.0029*** | -0.0032*** |
| (-2.7667) | (-2.9068) | |
| Gov | 0.2267*** | 0.2335*** |
| (2.9785) | (2.8917) | |
| Constant | -0.4151** | -0.3965** |
| (-2.3521) | (-2.1405) | |
| City FE | Y | Y |
| Year FE | Y | Y |
| N | 3921 | 3619 |
| R2 | 0.6731 | 0.6730 |
Notes: t statistics are reported in parentheses. ***、**、* indicate significance at the 1%, 5% and 10%, respectively.
Table 5.
Mechanism tests.
| Green innovation | Industrial structure upgrading | |||
| GreenInn | GTFEE | AIS | GTFEE | |
| DID | 0.2350*** | 0.0396*** | 0.0052* | 0.0482*** |
| (10.8525) | (4.7999) | (1.8387) | (5.9070) | |
| GreenInn | 0.0397*** | |||
| (6.6145) | ||||
| AIS | 0.1301*** | |||
| (2.8265) | ||||
| Eco | -0.3311*** | 0.0773*** | 0.0257*** | 0.0609*** |
| (-8.1691) | (5.0428) | (4.8450) | (3.9712) | |
| Fin | -0.0030 | -0.0034 | 0.0158*** | -0.0056 |
| (-0.1788) | (-0.5518) | (7.2400) | (-0.8895) | |
| HR | 4.2283*** | 0.1589** | 0.0152 | 0.3248*** |
| (22.9019) | (2.1540) | (0.6285) | (4.6671) | |
| FDI | -1.9656*** | 0.5471*** | 0.2752*** | 0.4332** |
| (-3.5186) | (2.6056) | (3.7602) | (2.0536) | |
| Agg | -0.0030 | -0.0024** | -0.0006* | -0.0024** |
| (-1.0914) | (-2.3002) | (-1.6941) | (-2.3276) | |
| Gov | -1.7273*** | 0.2589*** | -0.1300*** | 0.2072*** |
| (-8.7081) | (3.4447) | (-5.0050) | (2.7625) | |
| Constant | 3.6479*** | -0.4119** | 2.0089*** | -0.5285*** |
| (8.0103) | (-2.3908) | (33.6767) | (-2.7101) | |
| City FE | Y | Y | Y | Y |
| Year FE | Y | Y | Y | Y |
| N | 4192 | 4192 | 4192 | 4192 |
| R2 | 0.7858 | 0.6852 | 0.9162 | 0.6823 |
Notes: t statistics are reported in parentheses. ***、**、* indicate significance at the 1%, 5% and 10%, respectively.
Disclaimer/Publisher’s Note: The statements, opinions and data contained in all publications are solely those of the individual author(s) and contributor(s) and not of MDPI and/or the editor(s). MDPI and/or the editor(s) disclaim responsibility for any injury to people or property resulting from any ideas, methods, instructions or products referred to in the content. |
© 2025 by the authors. Licensee MDPI, Basel, Switzerland. This article is an open access article distributed under the terms and conditions of the Creative Commons Attribution (CC BY) license (http://creativecommons.org/licenses/by/4.0/).
Copyright: This open access article is published under a Creative Commons CC BY 4.0 license, which permit the free download, distribution, and reuse, provided that the author and preprint are cited in any reuse.


