Submitted:
11 August 2025
Posted:
18 August 2025
You are already at the latest version
Abstract
The behavior of S and Cs during the alternate adsorption of each adsorbate on the Ni(100) surface is studied at room and elevated temperatures by means of low energy electron diffraction (LEED), Auger electron spectroscopy (AES), thermal desorption spectroscopy (TDS) and work function (WF) measurements. For Cs deposition on the S-covered Ni(100) surface, the presence of sulfur increases the binding energy and the maximum amount of adsorbed cesium as it happens with other alkalis too. The first Cs overlayer is disordered, while the second strongly interacts with S in a tendency toward a CsxSy surface compound formation. This strong interaction causes the gradual demetallization of the Cs overlayer with increasing S coverage in the underlayer. When the CsxSy stoicheometry is complete, however, subsequent Cs deposition forms an independent rather metallic overlayer. When the sulfur covered surface, S(0.5ML)/Ni(100) is preheated to 1100 K, the S-Ni bond strengthens and S-Cs interaction correspondingly weaken to a degree that the S underlayer retains a periodic structure on the Ni substrate. This behavior indicates that the preheated S/Ni(100) surface is passivated. Differently, when S is adsorbed on the Cs-covered Ni(100) surface at room temperature, sulfur adatoms diffuse underneath the Cs overlayer to interact with the nickel substrate in the same manner as on clean surface. During that process the sticking coefficient of sulfur remains constant regardless the amount of predeposited cesium. The presence of Cs, however, increases the amount of S that can be deposited on the Ni substrate, probably in favor of the CsxSy surface compound formation, which demetallizes the surface independently of the sequence of adsorption.
Keywords:
adsorption
; cesium
; sulfur
; nickel
; sulfur passivation
; demetallization
; work function
; AES
; LEED
; TDS
1. Introduction
Sulfur (S) is an electronegative element, which can modify drastically the surface properties of materials in different ways, by forming buffer layers, controlling texture oxides’ layers, improving lattice mismatch and chemical inertness between superconducting YBCO layers and substrates etc. [1,2,3]. Also in heterogeneous catalysis S can affect the activity and selectivity of catalysts with a rather controversial way, either showing a poisoning behavior [4,5,6,7] or under some circumstances improving the catalytic activity [8], or even better acting as a catalyst promoter or selectivity modifier [9]. More recently cobalt and nickel sulfides have endowed superior electocatalytic performance in electrocatalysts for alkaline hydrogen evolution reactions and hydrogen resources [10,11]. In addition sulfur adsorption often passivates surfaces by improving the surface and interface quality of heterojunctions [12], increasing the performance of photodetectors [13] and the efficiency of solar cells [14].
On the other hand, alkalis due to their electropositive nature can drastically reduce the work function (WF) of the surfaces. The WF is a very prominent physical property which can affect crucially the catalytic [15,16,17,18], photoelectric [19,20] and thermionic properties [19,21] of materials. Especially the low WF interfaces are desirable for optimizing the opto-electronic properties of semiconducting devices such as diodes and transistors [20]. One efficient way to produce such interfaces is to adsorb low WF elements such as alkalis or alkaline earth metals (barium and calcium) on surfaces. Among the existing alkalis, cesium (Cs) is the most electropositive element with the lowest WF of all the metals (2.0-2.5 eV) [22]. Therefore, since 70’s, Cs has been applied as absorbate on surfaces to decrease WF even down to 1.0-1.6 eV (at submonolayer regime) [23,24,25]. However, impurities of electronegative elements such as oxygen or sulfur can modify the surface properties of cesium overlayer such as WF, thus affecting the catalytic and thermionic efficiency of the formed interface. In the particular case of nickel substrate, extensive reports over the last decades show a serious poisoning effect of S in catalytic efficiency [26,27,28,29,30,31,32]. Moreover, the interaction of the adsorbed S and alkalis from the gas phase on nickel based catalysts, can influence the catalytic activity for producing valuable fuels and chemicals from biomass gasification [33,34]. Unfortunately, the exact atomistic mechanism of S and alkali interaction on such kind of catalytic surfaces is not accurately known. For this reason the detailed study of the mutual influence of elemental S and adsorbed alkali and how the relative atomic concentration of the two elements affect the dynamics, the kinetics and finally the activity of an alkali modified surface is of particular interest. Based on that motivation, this contribution reports a detailed and systematic experimental investigation of S and Cs coadsorption on the Ni(100) surface. In particular, two co-adsorbing processes are followed: 1) the adsorption of Cs on S-covered Ni(100) surface at room temperature (RΤ) and with heat treatment too, and 2) the adsorption of S on Cs- covered Ni(100) surface. The surface analysis techniques of low energy electron diffraction (LEED), Auger electron spectroscopy (AES), thermal desorption spectroscopy (TDS) and relative work function (WF) measurements are used to acquire data.
2. Experimental Part
The experiments were carried out in an ultra high vacuum (UHV) chamber with base pressure of the order 10-10 mbar. The chamber is equipped with a cylindrical mirror analyzer (CMA) for AES measurements, a quadropole mass spectrometer (QMS) in correlation with a constant heating rate sample heater of ~20 K/s for TDS measurements, a Kelvin probe for relative WF measurements, LEED optics for observing the surface structure and an appropriate apparatus for Ar+ ion sputtering. All the AES measurements were recorded in the first derivative mode and thus the intensity of the Auger electron transition line (AETL) in each case was measured from the peak to peak height (Ap-pH).
The Ni(100) sample was cleaned by Ar+ ion bombardment (2 keV, 4 μA), and subsequent annealing at 1000 K. This cycle was repeated several times until the Auger peak heights of the main impurities (carbon, sulfur, oxygen) were under the detection limit. The sample heating was performed inductively by passing electric current through a heating tape of tantalum (Ta), uniformly pressed and fixed between the back side of the crystal and a metallic case of Ta, where the sample was firmly fixed inside. The temperature of the sample was measured by a Cr-Al thermocouple spot welted at the back side of the sample metallic case and calibrated with an infrared pyrometer in the range of 900 to 1300 K. The whole heating system with the crystal was mounted at the edge of a rotatable manipulator. In this manner the sample could be located in front of each experimental technique and evaporation source each time.
Cesium was evaporated from a commercial dispenser source (SAES getters), while elemental sulfur was deposited by thermal dissociation of molybdenum disulfide (MoS2) single crystal flakes mounted on a tungsten (W) heating filament and enclosed in a home-made Ta dispenser. In the past, most of the S adsorption studies have been taken place with exposure of the substrate surfaces to hydrogen sulfide (H2S) gas. Το remove the H2 from the surface, however, the substrates should be heated to temperatures between 400 K and 1300 K [35,36,37,38,39]. Coadsorption studies of S and alkali metals, therefore, cannot take place at RΤ using H2S as a sulfur source. Differently, with our method of the MoS2 thermal dissociation, a reliable evaporation source of S atoms with a controllable flux is created based on the flowing current through the W filament in the dispenser. Actually we have applied this method in earlier studies for successful coadsorption of sulfur with alkalis on the Ni(100) surface at RT [40,41,42,43]. The coverage of both Cs and S were calculated by correlating LEED and AES measurements. The surface atomic density of 1 ML of each adsorbate is considered equal to that of the outmost layer of the Ni(100) single crystal, 1.6x10¹⁵ atoms/cm2. Based on the combined AES and LEED measurements the coverage of one dose (1 D) of S deposition time was estimated ~0.038 ML, while that of Cs ~0.020 ML.
3. Results and Discussion
Before commencing with the analysis of the data pertinent to the coadsorption of S and Cs on Ni(100) obtained in the current work, it is useful to recall from the literature the behavior of each element adsorbed separately and not only on the clean nickel.
Concerning the adsorption of Cs on the Ni(100) surface at 300 K, it was firstly studied in an early work [24]. Very briefly to mention that as Cs deposits on surface, a uniform layer with a hexagonal close-packed (hcp) structure is completed at a cesium coverage, ΘCs=0.29 ML. In addition, measurements of the WF change lead in the characteristic WF curve of alkali metals deposited on metal surfaces, where the WF initially drastically decreases down to a minimum value Φmin=1.6 eV (at ΘCs=0.14 ML), and subsequently increases to a maximum constant value Φmax=2.0 eV, which coincides with the formation of the hcp surface structure and the metallization of the surface. No more than one physical layer of Cs is formed on nickel surface at RT.
With regards to the adsorption of elemental S on the clean Ni(100) surface at RT, it is well-known the p(2x2) super-lattice at sulfur coverage Θs=0.25 ML, and thereafter the c(2x2) at Θs=0.5 ML [44,45,46]. The latter structure coincides with the completion of the first sulfur physical layer on surface. For both symmetrical structures, it seems that S adatoms preferably occupy fourfold-hollow adsorption sites [44,45,47,48,49]. At increasing coverage, the sulfur growth occurs in a layer by layer mode, where the second layer is observed to be disordered. During S deposition on Ni(100) and the formation of the p(2x2) phase, the WF increases by ΔΦ=0.17 eV, while when the phase is transformed into the c(2x2) one, a final ΔΦ=0.25 eV is recorded [46]. This sequential WF increase probably reflects the change in the surface electronic structure between the two phases [45,48].
Relating to coadsorption experiments of Cs and S on the Ni(100) surface, some results have been previously reported [41]. Briefly describing, the presence of S on the Ni(100) surface at RT, increases the maximum coverage of Cs from one single layer to at least two atomic layers indicating a layer-by layer growth mode. Furthermore, the initial sticking coefficient of Cs remains unaffected of S presence. Deposited Cs at coverage ΘCs >0.5 ML on both p(2x2) and c(2x2) structures of S-covered Ni(l00) surface at RΤ, is randomly distributed on top of the sulfur layer causing a disappearance of its symmetrical structures. This effect indicates a rearrangement of the S underlayer to a disordered configuration due probably to a strong Cs-S interaction. This interaction seems to increase the binding energy of Cs on surface spoiling the metallization and the well-ordered hpc form of the alkali overlayer observed in the absence of sulfur [24]. Nevertheless, based on TDS measurements, there are no indications for desorbing Cs-S chemical compounds [41].
In the current work we followed two different coadsorption procedures for studying the Cs and S interaction on the Ni(100) surface: 1) the cesiation of the sulfur covered surface and 2) the sulfation of the cesiated surface. With this framework we reproduced and verified some earlier reported results and also collected new data revealing more details of the Cs and S mutual influence on the nickel surface especially at elevated temperatures. The results and discussion of each coadsorption procedure are following.
3.1. Cesium on S-Covered Ni(100)
We first carried out detailed LEED observations at RT for Cs deposition on clean and S-covered Ni(100) surfaces. The results are summarized in Table 1. The first row (top one) demonstrates the increasing Cs coverage in ML (ΘCs), while the first column (left hand one) demonstrates the S coverage in ML (Θs). Every row describes the surface structural changes observed when ΘCs increases on a certain S-covered Ni(100) surface at RT. On the other hand, every column describes the surface structural changes when ΘS increases on a certain Cs-covered Ni(100) surface at RT. The order of the structural changes caused by Cs deposition on surface is denoted by the horizontal arrows along the rows, while the corresponding order of the structural changes caused by S deposition is denoted by the vertical arrows along the columns. Note that LEED changes are presented for different S-covered nickel surfaces in the absence of Cs (ΘCs=0, second column), while LEED changes are also presented for different Cs-covered nickel surfaces in the absence of S (ΘS=0, second row). In general, Cs deposition takes place on S-covered nickel surfaces at RT in all the cases, that is why this temperature appears in brackets in the boxes of the first column. Only in one case Cs deposits at RT but on a preheated S(0.5 ML)/Ni(100) surface at 1100 K, (see the bottom row in Table 1). Also the Table 1 depicts the background of the LEED patterns. In fact, the higher background intensity in the LEED patterns is, the darker shading boxes are demonstrated.
Cesium deposition on the clean Ni(100) surface produces the hcp phase at 0.3 ML as it is expected by forming a complete single physical layer [24,41]. On the sulfated p(2x2):S/Ni(100) surface at Θs=0.25 ML, Cs adsorption creates initially a superimposed hcp LEED pattern with the p(2x2) one, while as the deposition proceeds and for ΘCs≥0.5 ML, the pattern is transformed into a (1x1) with significant increase of the background. These LEED observations indicate that Cs adatoms from the second developing layer interact mutually with the underlying symmetrically pre-adsorbed S atoms as well as with the hcp coordinated first layer Cs adatoms. This interaction spoils the coexisting sulfur and cesium structural phases rearranging the mixed overlayer into the initial (1x1) substrate symmetry. Similar effect is noticed for Cs adsorption on the c(2x2):S/Ni(100) surface at Θs=0.5 ML. In that case, however, no superimposed hcp pattern forms with the c(2x2) one, due probably to the much less existing available free symmetrical adsorption sites.
On the other hand the situation appears to be different for cesium deposition on the c(2x2):S/Ni(100), preheated to 1100 K for 30 s. In that case, Cs adsorption causes initially a change from c(2x2) pattern into a p(2x2) one with a background increase (see the heavy shadowed box at the bottom row in Table 1). This change becomes obvious above 0.3 ML of Cs (the completion of the first physical layer) and ceases at ~0.5 ML. Further Cs deposition changes the p(2x2) pattern to a (3x3) one. As we noticed above, the pattern’s changes are obvious after the completion of the first Cs layer (ΘCs>0.3 ML). Therefore, it is very likely that Cs adatoms from the second layer interact with part of the S underlying atoms by initially removing them from the c(2x2) phase, thus transforming the sulfur under-layer into the less dense p(2x2) one. More Cs adsorption on surface (ΘCs>0.5 ML), generates continued interaction with the under-layered S atoms in the p(2x2) structure, transforming it into a new (3x3) structural phase. As a result the coverage of the sulfur underlayer, bound directly to the Ni(100) substrate, is reducing further to about 0.11 ML. In addition, the appearing higher background designates the amorphous state of the Cs overlayer above the (3x3) sulfur phase. The above LEED observations presented in Table 1, predicate that the annealing of the c(2x2) sulfated nickel surface at elevated temperature, affects the dynamics and kinetics of the adsorbed S atoms, establishing a stronger chemisorption state on nickel.
The annealing effect is shown in Figure 1, where the Ap-pH of Cs (563 eV) AETL for ΘCs=0.3 ML on clean Ni(100) surface and ΘCs= 0.6 ML on S-covered Ni(100) surfaces for ΘS≤0.5 ML and ΘS>0.5 ML, is recorded, after annealing up to 1100 K with temperature increments of 100 K. All the shown Ap-pH measurements were performed after the sample was cooling down to temperatures near to RT. Cesium on the clean Ni(100) surface is thermally removed in two stages according to the lowest curve of Figure 1, most likely corresponding to two binding states of Cs on surface, one of low and one of high adsorption energy. This is also verified by TDS measurements described later. For Θs ≤0.5 ML, most of Cs is removed from the surface before 800 K, while the same two-stage desorption pattern is observed in the corresponding Ap-pH curve. The removed Cs from the substrate up to 800 K which corresponds to the ΘCs= 0.6 ML curve, includes the extra amount of alkali, the presence of S has allowed to adsorb onto the Ni(100) surface. This amount of desorbing Cs at temperatures less than 800 K, belongs to the low adsorption energy state. It is interesting to note that the amount of Cs left on the surface when Θs ≤0.5 ML after heating to 800 K is about the same as that on the clean Ni(100) surface. Bear in mind that 0.6 ML of Cs corresponds approximately to two physical layers [41]. This means that, prior to 800 K, the top layer is removed along with the first layer’s loosely bound Cs atoms. The removal of this initial portion of Cs is, however, delayed to higher temperatures with increasing amounts of pre-deposited S. Specifically, when Θs>0.5 ML, and sulfur starts to form a second layer [46], the corresponding curve in Figure 1 shows that most of the Cs (~0.6 ML) remains on the surface until 1000 Κ, and subsequently is completely removed at 1100 K. This effect can be ascribed to a relatively strong interaction between the Cs adatoms and the S ones of the second sulfur layer, supporting that the binding energy of cesium depends on the predeposited quantity of sulfur, and that the maximum of that energy results when a particular stoichiometry between the two adsorbates is attained. This, in turn, may suggest a kind of cesium sulfide compound CsxSy formation corresponding to the delay in its removal from the surface. The developing Cs-S interaction is consistent with the deorganization of the of the c(2x2) sulfur structure (Table 1).
Figure 2 compares the heat-influenced Auger electron signal intensity of Cs, S and Ni at the higher adsorbate coverage range. Specifically, it shows the variation of the Ap-pH of Cs (563 eV), S (151 eV) and Ni (61 eV) AETLs after annealing of the Cs(0.6 ML)/S(1 ML)/Ni(100) surface at different temperatures, in increments of 100 K. All the shown AES measurements were carried out when the sample’s temperature restored back to RT. The Cs (563 eV) Ap-pH, exhibits almost the same pattern described in Figure 1, with a small decrease up to 900 K. Above this temperature its rapid decrease indicates a drastic desorption of Cs, which is integrated at 1100 K leaving the surface clean of Cs. On the other hand, the S (151 eV) Ap-pH, increases with temperature up to 700 Κ, and thereafter remains nearly constant up to 900 K. Post-annealing, therefore, most likely favors a Cs-S interaction and intermixing, which brings S atoms into the Cs overlayer, and thus closer to the surface. As cesium starts to desorb above 900 K, sulfur interacts exclusively with nickel and possibly partially diffuses into the metal substrate bulk. This argument is in line with the final dramatic increase of the Ni (61 eV) Ap-pH signal accompanied with the slight decrease of the S (151 eV) one for temperature higher than 900 K. It is also in agreement with the earlier finding that before the desorption temperature at about 1200 K, S interacts strongly with Ni and an inter-diffusion between the two elements takes place leaving always a sharp c(2x2) phase [46]. In that sense, in our experiments there was always at about 0.5 ML of S remaining on surface because the predicted second desorption state above 1500 K was never achieved [50]. Based on the above discussion it is likely that the substrate annealing up to 1100 K causes the dissolution of the formed CsxSy compound on surface.
In Figure 3 the WF change ΔΦ is shown as a function of Cs deposition on the clean and the pre-covered with different amounts of sulfur Ni(100) surface. For Cs on clean Ni(100), the WF curve shows the very well known characteristic curve observed with cesium on several surfaces [23,24,25,51,52,53]. According to the electrostatic image model [54,55,56] the initially drastic and almost linear WF decrease is due to the initial dipole moment of the Cs adatoms “pointing outward” the surface, because of their electropositive nature. Therefore the initially isolated chemisorbed Cs adatoms on the nickel surface are expected to be in an ionic state, while as the coverage increases the interaction between the dipoles induces depolarization effects leading the WF first to a minimum and finally levels it off to a higher value (see plateau in Figure 3). At that final stage of adsorption the interaction between the Cs adatoms prevails over that with the substrate resulting in the metallization of cesium overlayer.
The shape of the above described WF curve, however, is gradually modified as the coverage of the pre-deposited S increases. The significant noticed modifications are the following: (a) The WF minimum, Φmin shifts to lower ΘCs and its value increases. (b) The value of the final WF, Φmax (maximum value at the formed plateaus in curves in Figure 3) also shifts to lower ΘCs and increases too. (c) Above Θs=0.5 ML, the WF curve does not show any minimum, but simply levels off to a final plateau. (d) For much higher Cs coverages (ΘCs> 1 ML) and Θs=1 ML, the WF decreases to a minimum value for ΘCs= 3.0 ML and subsequently increases at ΘCs=4.0 ML. Similar WF minimum, however, is not recorded for higher pre-deposited S quantity (Θs=1.5 ML). By considering the WF of the clean Ni(100) equal to 5.2 eV [22,57], we present in Table 2 some numerical data of the WF based on the above reported modifications. In addition, for more clarity, Figure 4 depicts some of these data with regards to Φmin and Φmax as a function of the Cs coverage on different sulfured Ni(100) surfaces (Figure 4 a) and the difference of Φmax - Φmin as a function of the S coverage.
Let us now discuss these modifications of the WF curves induced by the pre-deposited S quantity. At first, the shift of the Φmin as well as the Φmax to lower Cs coverages as the S coverage increase on surface (a and b modifications), has also been observed during Cs deposition on pre-deposited hydrogen (H) covered W(100) and W(110) surface [23,58] and potassium (Κ) deposition on H-covered Si(100) surfaces [59]. In those works, both of these shifts were attributed to the existence of the H interlayer and thus the longer interatomic distance between the alkali adatoms and the substrate resulting in a larger initial dipole moment po of the alkali adsorbate according with the Wimmer’s et al.’s polarization model [60]. In addition, the rather inert H interlayer apart of the po increase, inhibits the electron transfer from alkali overlayer to the substrate thus increasing the electron density and resulting to an earlier metallization (lower alkali coverages) with higher WFmax, effect consistent with the theory of Muscat’s and Batra’s [61]. Under the same consideration, the slope of the initial almost linear WF decrease observed in Figure 3 is proportional to po of Cs adatoms on surface and as it is evident pre-deposited sulfur for coverages up to Θs=0.5 ML does not change the slope at least within the experimental error. This means that S does not increase the po of Cs as H does for Cs and K [23,58,59]. The reason for that may be the relatively strong Cs-S interaction which reorganizes the array of S atoms reforming the sulfur interlayer from p(2x2) and c(2x2) into amorphous (see Table 1) after with Cs and S intermixing. This behavior is quite different than that of H and possibly happens because of the higher electronegativity of S (2.58 against 2.20 in Pauling scale). In that point of view, there is no a rather stable S interlayer between the Cs and nickel substrate. The displacement of the S atoms into the developing Cs overlayer appears to prevent the metallization of Cs, that is why the Φmin becomes shallower, less evident (i.e., smaller value of Φfinal – Φmin) and of higher value as Θs increases (see Figure 3 and Figure 4b). In addition, more S atoms on surface lead to less available adsorption sites for Cs on bare nickel substrate. This adsorption blocking effect also contributes to the shift of Φmin to higher values because of the less Cs-Ni dipoles. For Θs>0.5 ML the absence of Φmin with the plateau formation at Φmax for just 0.2 ML of Cs (c modification) declares a non metallic cesium overlayer due to the abundance of S atoms to interact with the Cs ones. The metallization does not occur even for the second Cs layer (ΘCs=0.6 ML). This is consistent with data in Figure 2 where no substantial Cs desorption occurs before 900 K indicating a high energy binding state in contrast to that of the metallic state related with the desorption of Cs between 300 and 800 K for Θs<0.5 ML. A similar behavior connecting the absence of Φmin together with the plateau formation in the WF curve and the non metallization of the alkali adsorbate, is well-known for alkalis’ adsorption on oxidized substrates [24,62,63]. It is concluded, therefore, that as the amount of the pre-deposited S increases, the bonding of Cs adatoms with the substrate remains ionic, thus preventing the final metallization of the Cs overlayer, observed on clean Ni(100). In other words the oxide-like bonding of Cs to sulfated Ni(100) is antagonistic to the finally metallic bonding of Cs on clean Ni. This is consistent with the Φmax=2.13 eV of Cs on the clean Ni(100) which approaches very well that of 2.14 eV of the metallic cesium [64]. The more pre-deposited S, however, the more Φmax declines that value (Table 2 and Figure 4a).
In addition, upon a closer inspection of Figure 3 lead us to note that at high Cs coverage, (ΘCs=4 ML), on both heavily sulfured 1.0 and 1.5 ML Ni(100) surfaces, the WF of the surface decreases and becomes almost equal to that of Cs overlayer on clean nickel (d modification). That observation supports the final metallization of the cesiated surface independently of the pro-adsorbed sulfur. In that view it seems that with the increasing ΘCs and when the compound-like bonding of Cs and S is completed stoichiometrically, the subsequently deposited cesium behaves as an independent Cs overlayer on the CsxSy compound-like underlayer. This produces the characteristic WF curve behavior with an initial decrease followed by an increase of the WF marking the metallization of the Cs overlayer after a certain number of Cs layers are formed. Thus, it appears that when ΘCs exceeding a few MLs on the S/Ni(100) surface, depending on the quantity of S, an ionic to metallic state transition takes place.
Some further thoughts with regard to the Cs-S interaction and the forming CsxSy compound-like overlayer, concern the thermodynamically stable chemical compound of cesium sulfide Cs2S (molar enthalpy of formation, ΔHο=-359.8 kJ/mol) [65]. Indeed as ΘCs approaches 2 ML on the S(1 ML)/Ni(100) surface, the atomic stoichiometry of Cs2S is likely achieved. Any extra Cs deposition behaves as that on a typical surface with Φmin formation and final Φmax. On the S(1.5 ML)/Ni(100) surface the stoichiometry of Cs2S is achieved for ΘCs=3 ML. However on that surface no clear Φmin is formed, perhaps due to the rather extensive three-dimensional cesium sulfide growth and the much higher demanded Cs quantity for the final metallization. In fact, based on Figure 4b, the absence of Φmin seems to happen at much lower ΘS (~0.7 ML), which means that the metallization prevention due to Cs-S interaction takes place even for atomic ratio Cs/S lower than 2. Nevertheless, unfortunately based only on the WF results it is not possible to detect for sure the chemical state of the adsorbates.
Information about the kinetics and dynamics of the adsorbates on surfaces can be extracted by TDS measurements. Figure 5 shows a series of the Cs(133 amu) QMS signal after Cs deposition on a pre-heated at 1100 Κ, S(0.5 ML)/Ni(100) surface, as compared to that of Cs(0.3 ML)/Ni(100) surface shown with dotted line (curve 9). The insert at the upper right depicts some TDS spectra of the Cs(133 amu) QMS signal after deposition of 0.3 ML of Cs on clean and without pre-heating S-covered Ni(100) surfaces. The data of this insert have been previously reported [41], but it is useful to present them here for purposes of comparison with the TDS data of the main portion of Figure 5. As the insert depicts, for a constant Θcs≈0.3 ML, Cs TDS spectra shift to higher temperatures with increasing S coverage. Of special interest is the spectrum 3 of the insert, representing Θcs=0.3 ML on Θs=0.5 ML with a c(2x2) structure, which corresponds to the completion of the first physical sulfur layer [46], since this corresponds directly to the S coverage utilized in the measurements represented by the spectra of the main part of Figure 5. In the insert, where the sulfated surfaces were not preheated, we notice that Cs desorbs from the surface at higher temperatures as ΘS increases. This means that S increases the binding energy of Cs on surface, due to the Cs-S interaction. Particularly the Cs TDS peak of greatest intensity appearing at about 1060 K for ΘS≥0.5 ML (curve 4 in the insert), clearly suggests that sulfur shifts energetically the bigger part of the absorbed Cs into a much higher binding energy state as the stoichiometric ratio S/Cs increases, due probably to the surface CsxSy sulfide compound formation as we have already postulated. This effect is in agreement with the discussed results of Figure 1. A similar effect of alkali sulfide compounds formation was observed for other alkalis’ adsorption too, such as sodium (Na) and potassium (K) on sulfur-covered Ni(100) surface [40,42]. It is also noteworthy, that the areas of all the Cs(0.3 ML) QMS curves presented in the insert are almost the same supporting that the sticking coefficient of Cs on the sulfated nickel remains constant and equal to that on the clean Ni(100) surface. In fact, as it has been previously shown for Cs and other alkalis’ adsorption on clean surfaces, the sticking coefficient presumably approaches unity [66,67,68,69]. After the complete desorption of Cs near to 1060 K, most of the S amount remains on the surface, and the c(2x2) or p(2x2) structures reappear. This implies that the first layer of S stays intact on the nickel surface after the annealing, For this reason the S TDS peak for ΘS=1.0 ML recorded at about 1140 K (dashed line of insert) is due to the desorption of the second sulfur layer leaving the first one on surface with the c(2x2) symmetry. This result is consistent with our assumption that possibly the formed surface cesium sulfide should be thermally decomposed on surface with only Cs desorbing species and S remaining on surface. In that direction, we need to point out that no any cesium sulfide compound was detected by the QMS.
It is useful to compare the spectra of the main portion of Figure 5 with those in the insert, as well as with the LEED observations in the last two rows in Table 1. The comparison actually shows that the behavior of Cs on the pre-heated at 1100 K, S(0.5 ML)/Ni(100) surface with a c(2x2) symmetry is surprisingly different than that on the unheated one. As was mentioned above, heating the S-covered Ni(100) surface with Θs>0.5 ML to ~1100 K will remove all but the first physical sulfur layer (0.5 ML) preserving the c(2x2) phase. When Cs is added, however, the heat induced interactions between S and the Ni(100) substrate are revealed by the changes in the TDS spectra of Cs, as compared to those on unheated S covered Ni(100) surfaces (insert of Figure 5). As seen in Figure 5, Cs (133 amu) QMS signal is represented by three TDS peaks, designated as β1, β2 and β3 respectively depending on Cs coverage. In particular the highest temperature β1 peak corresponds to the stronger binding energy of Cs of the first 0.1 ML. As shown in Table 1, the LEED pattern remains a clear c(2x2) when peak β1 dominates in the TDS spectrum. As ΘCs increases, β1 moves to lower temperatures while for ΘCs >0.1 ML a new peak β2 appears at ~755 K which develops and maximizes at 0.5 ML of Cs. At the same time for ΘCs>0.3 ML a third peak β3 appears at even lower desorption temperature ~555 K and grows for up to ΘCs=0.6 ML. Assuming a first order desorption of Cs atoms from the surface the desorption energy can be calculated by applying the Readheads’ equation [70]
where R=8.617×10⁻⁵ eV∙atom-1∙K-1 is the gas constant, T is the desorption temperature of the TDS peak, ν is a frequency factor ~1013 s-1, and κ is the heating rate of the sample ~20 K/s. Using this equation we report in Table 3 the desorption energies of all the recorded Cs TDS peaks β1, β2 and β3, which generally are related with all different cesium adsorption states.
The lower desorption energy of β2 than that of β1 designates a lower binding energy of Cs than the initial one, which rules within a coverage range of 0.1 ML< ΘCs< 0.3 ML. This new β2 adsorption state is probably due to a lower degree of ionicity of the Cs adatoms as ΘCs increases. In addition, the observed c(2x2) surface structure suggests that Cs interacts mostly with Ni at that stage of absorption. As ΘCs increases further (ΘCs > 0.3 ML) and the second Cs physical layer starts to grow, the third adsorption state β3 of much lower binding energy develops on surface and approaches the desorption state of the metallic state depicted with a vertical arrow and dashed line (see the curve 9 in the main Figure 5). Indeed, it is well known that the first physical layer of Cs on the clean Ni(100) surface is in metallic state [41].
An explanation of the dynamics of Cs adsorption on the heat-treated c(2x2) S/Ni(100) surface as compared to the respective unheated surface is called for at this point. Out of the above described TDS results and the combined LEED observations, it is concluded that the pre-heating process provides the activation energy for a stronger S-Ni interaction, thus strengthening the bonding between the two elements. This results in the subsequent weakening of the Cs-S interaction, but not enough to allow the metallization of the first Cs layer. It is evident that even near the completion of the second Cs overlayer (ΘCs=0.6 ML), the β3 adsorption state (curve 8) has not attained the desorption energy of the metallic state. This non-metallic Cs over-layer, however, exhibits an increased interaction with part of the sulfur under-layer by changing the c(2x2) atomic symmetry into p(2x2) (curve 7) and (3x3) (curve 8), as mentioned in the LEED analysis regarding the last row of Table 1. In that view, probably, the gradual attraction of a portion of the underneath S atoms by the Cs ones of the second cesium layer prevents the metallization of the latter. The weakening of the Cs-S interaction induced by the pre-heating process at 1100 K is evident from the lower desorption temperatures (proportional with the binding energies) of the β2 and β3 peaks of curve 5 in Figure 5 compared to those of curve 3 in the insert (both curves for ΘCs = 0.3 ML). Moreover the second Cs layer (ΘCs ≥ 0.5 ML) on the unheated surface interacts strongly with the S under-layer in such a manner as to result in a disordered mixed Cs-S overlayer, giving the 1x1 LEED patterns shown in the 2nd and 3rd rows of Table 1. In contrast the second Cs layer on the heat-treated c(2x2)-S(0.5 ML)/Ni(100) surface does not cause any disordering of the S under-layer. Most likely, the deposited Cs atoms of the first layer transfer some electric charge to the Ni substrate, thus causing a weakening of the S-Ni bond. This allows for the Cs of the second layer, also in a rather ionic state, to attract a portion of the S atoms by breaking some of the S-Ni bonds as well, thus changing the c(2x2) structure to a less dense p(2x2) where ΘS ≈0.25 ML. As the density of the Cs overlayer increases further, the portion of the attracted S atoms also increases, and the sulfur structure changes to a (3x3) (see last row of Table 1) where normally corresponds to ΘS ≈ 0.11 ML. In that manner the Cs-S interaction prevents the metallization of the second Cs layer, the desorption of which gives the β3 peak in Figure 5. It, therefore, appears that the S in the pre-heated c(2x2) structure on Ni(100) surface decreases the interaction of even the highly active electropositive alkali elements such as Cs. The clear evidence for that is the low intensity of the β1 adsorption state compared to those of β2 and β3. In other words, in our case, a heated single layer of S acts as a passivation element on the Ni(100) surface as it happens on Ge(100) [71], GaSb(100) [72], InAs(001) [73] and other surfaces too [12].
3.2. Sulfur on Cs-Covered Ni(100) Surface
As Table 1 describes, deposition of Cs on clean Ni(100) forms an hcp structure at saturation coverage ΘCs=0.3 ML. Adsorption of S on this structure causes a superposition of the hcp with a p(2x2) at ΘS=0.25 ML. With further S adsorption the LEED pattern changes to a diffused c(2x2) at ΘS=0.5 ML, while the hcp structure disappears. The disappearance of the hcp structure of Cs indicates that S adatoms disorganize the uniform ordered cesium layer by displacing the Cs atoms. The appearing, however, self-organized p(2x2) and c(2x2) two dimensional nanostructures of S look the same as those on clean the Ni (100), (see the second column in Table 1). This means that the S atoms diffuse under the Cs layer, and become bound directly to the nickel substrate, for at least up to 0.5 ML. It is notable, therefore, that the sulfur diffusion takes place at RT, declaring a strong tendency of S to interact with Ni.
Figure 6 shows the Ap-pH of S (151 eV), Ni (61 eV) and Cs (47 eV) AETLs as a function of S deposition on the Cs(0.3 ML)/Ni( 100) surface. For comparison reasons we also show the evolution of the S (151 eV) Ap-pH on clean Ni(100) with a dashed line and the corresponding appearing LEED patterns. The initial slope of the S (151 eV) AETL, curve on cesiated Ni(100) is lower than that of the clean substrate surface. This is attributed to the masking effect due to the submergence of the initially deposited S atoms under the Cs layer. With increasing adsorption of S, however, the slope of the sulfur Ap-pH curve increases too, but for coverages above 0.25 ML of S (~7.5 D) the slope of the curve decreases gradually. On the other hand, the Cs (47 eV) Ap-pH does not substantially change versus S coverage. In contrast, the intensity of the Ni (61 eV) Ap-pH decreases substantially during S deposition. The above described behavior of the three elements’ Ap-pHs supports that adsorbed S atoms are not relaxed on top of the Cs layer, but immediately diffuses in to be bound directly to the Ni substrate under and in between the pre-deposited Cs atoms, thus giving the same sulfur structures, p(2x2) and c(2x2), as in the case of S adsorption on clean Ni(100). This sulfur’s atoms arrangement in combination with the almost double and a half times bigger atomic size of Cs than S one, is expected to eliminate the masking effect keeping almost constant the intensity of the Cs (47 eV) Ap-pH.
A comparison between S adsorption on the clean and the cesiated nickel surface can be made by the Auger signals’ ratio too. Figure 7 shows the Ap-pH ratio of the S (151 eV) and Ni (61 eV) AETLs during S adsorption on the clean and the Cs(0.3 ML)/Ni(100) surface. The dependence of the aforementioned ratio versus the S concentration on the two surfaces is almost identical showing the same linear increase at around 15 D where the first layer of S is expected to complete. This indicates that the sticking coefficient of S on clean and Cs-covered Ni( 100) is the same, and independent of the presence of Cs. Furthermore, the TDS measurements of the Cs (133 amu) QMS signal after S deposition on the Cs-covered Ni(100) surface, are very similar to those of Cs on S-covered Ni(100) (see Figure 5), and for this reason are not shown here. In that view it seems that the surface dynamics of the two elements is independent of the adsorption sequence.
It is also interesting to record the work function change ΔΦ during S adsorption on cesiated nickel surfaces. Figure 8 shows ΔΦ as a function of S deposition on the clean and Cs-covered Ni(100) surface of varying Cs coverage. As it is evident from this figure, S adsorption causes an increase of the cesiated nickel WF, where its final magnitude depends on ΘCs. More specifically at relatively low ΘCs (≤0.15 ML) where less than half Cs layer is formed, S adatoms reside mostly on bare areas of the nickel substrate between the pre-deposited Cs atoms. This causes an initial slow WF increase as it happens on the clean surface which is reasonable because of the electronegative nature of sulfur. As ΘS increases further, S adatoms start to interact ionically with the Cs ones, possibly forming “pointing inward” electric dipoles thus increasing the WF. The more pre-deposited Cs on surface the bigger WF increase ΔΦ* is recorded, where ΔΦ*=Φfinal - Φinitial with Φfinal to be the final WF after 30 D of S deposition (corresponding to 1 ML coverage), and Φinitial the initial WF of the cesiated nickel surface each time. Both Φinitial and Φfinal values can be extracted for each Cs coverage from Figure 8 bearing in mind that the WF of the clean Ni(100) surface is taken equal to 5.2 eV. For lucidity, Figure 9 illustrates ΔΦ* as a function of ΘCs. A linear relationship holds for ΘCs≤0.15 ML reflecting the proportionality between the numbers of interacting S and Cs atoms. The situation, however, changes at ΘCs=0.3 ML where the WF curve in Figure 8 shows a different behavior. In fact the WF initially decreases and subsequently slowly increases forming a plateau at Φfinal. This behavior is consistent with an adsorption model where at the beginning stages of sulfur deposition the S atoms adsorb underneath the Cs layer, while at higher ΘS reside in between the Cs atoms by displacing them, inducing a disordering of the hcp structure of cesium, in agreement with LEED observations. On balance, the above discussion support the argument that the S adatoms are initially burrowing under the Cs overlayer reacting with nickel and later on with Cs too, independently of the sequence of Cs and S adsorption.
4. Conclusions
In this work we study the behavior of S and Cs during deposition of 1) Cs on S-covered Ni(100) and 2) S on Cs-covered Ni(100) surfaces at RT. The annealing effect for this coadsorption system is also investigated. Separate adsorption experiments show that cesium on clean Ni(100) forms a complete dense layer at 0.3 ML with hcp structure, while on the other hand sulfur on the same clean substrate forms a p(2x2) structure at 0.25 ML, and a c(2x2) one at 0.5 ML, which marks the completion of the first physical layer. Coadsorption experiments show that the presence of S increases the binding energy and the maximum coverage of Cs on the Ni substrate at RT, as it happens with others alkalis too [40,42]. The first Cs layer on both p(2x2) and c(2x2) sulfur structures at RT is disordered, while the second layer strongly interacts with S causing a disordering of the sulfur underlayer too, in a tendency to form a surface CsxSy compound. Cesium on clean Ni(100) lowers the WF to a minimum, and subsequently increases it to a final value close to that of metallic Cs. With increasing amounts of pre-deposited S at RT, however, the WF minimum is gradually diminished, and for ΘS>0.5 ML, the minimum disappears, while at increased Cs coverage the WF level attains a plateau at a value greater than the maximum WF of Cs on clean Ni(100). This is characteristic of a gradual demetallization of the Cs overlayer, due to a strong Cs-S interaction. When the formation of the CsxSy complex is completed stoicheometrically, subsequent Cs deposition forms an independent overlayer, resulting in a characteristic WF decrease followed by an increase consistent with the metallization of the surface. When the c(2x2) phase (i.e., the first physical S layer) is heated to 1100 K, the S-Ni bond strengthens, and the subsequently deposited Cs (ΘCs≥0.5 ML) alters the c(2x2) structure to a p(2x2), and then to a (3x3). Most likely the charge transfer from Cs to Ni substrate weakens the S-Ni bond, while the Cs ions in the second overlayer attract the S underlayer, thus gradually changing its structure to a lattice configuration of lower coverage. In addition, the binding energy of the Cs overlayer is smaller than that on unheated S-covered Ni(100) surface. The above behavior of Cs on the 1100 K heated c(2x2)-S/Ni(100) surface reveals that S passivates the substrate to a high degree (resisting interaction with the very active alkali element).
Adsorbed elemental S on Cs-covered Ni(100) at RT initially diffuses under the Cs layer, and forms the p(2x2) structure as on clean Ni(100). i.e., and. Continued adsorption of S, however, results in the c(2x2) phase by causing a disordering of the hcp structure of the Cs layer and the demetallization of the surface. The sticking coefficient of S remains the same, independent of the pre-deposited Cs amount. The presence of Cs, on the other hand, increases the amount of S that can be deposited on the Ni surface, as it happens for Cs adsorption on the sulfated nickel. This is probably due to the more extensive CsxSy compound like formation, which seems to be independent on the sequence of the two elements’ adsorption on nickel surface.
Author Contributions
All the authors have contributed equally to this work.
Funding
This work received no financial support.
Conflicts of Interest
The authors declare no conflicts of interest.
References
- Cantoni, C.; Christen, D.K.; Feenstra, R.; Norton, D.P.; Goyal, A.; Ownby, G.W.; Zehner, D.M.; Norton, D.P. Reflection high-energy electron diffraction studies of epitaxial oxide seed-layer growth on rolling-assisted biaxially textured substrate Ni(001): The role of surface structure and chemistry. Appl. Phys. Lett. 2001, 79, 3077–3079. [Google Scholar] [CrossRef]
- Cantoni, C.; Christen, D.K.; Heatherly, L.; Kowalewski, M.M.; List, F.A.; Goyal, A.; Ownby, G.W.; Zehner, D.M.; Kang, B.W.; Kroeger, D.M. Quantification and control of the sulfur c(2 × 2) superstructure on {100}〈100〉 Ni for optimization of YSZ, CeO2, and SrTiO3 seed layer texture. J. Mater. Res. 2002, 17, 2549–2554. [Google Scholar] [CrossRef]
- Li, C.S.; Yu, Z.M.; Odier, P.; Wang, Y.; Jina, L.H.; Lu, Y.F. Deposition of La2Zr2O7 (LZO) films on NiW substrates by chemical solution deposition process. Physica C Superconductivity and its Applications 2011, 471, 974–977. [Google Scholar] [CrossRef]
- Agrawal, P.K.; Fitzharris, W.D.; Katzer, J.R. Sulfur Poisoning and Carbon Deactivation of Alumina-Supported Ni, Co, Fe and Ru Catalysts in CO Hydrogenation. Stud. Surf. Sci. Catal. 1980, 6, 179–200. [Google Scholar]
- Stenger, H.G.; Satterfield, C.N. Effects of sulfur poisoning of a reduced fused magnetite catalyst in the Fischer-Tropsch synthesis. Ind. Eng. Chem. Process Des. Dev. 1985, 24, 415–420. [Google Scholar] [CrossRef]
- Liu, Z.T.; Li, Y.W.; Zhou, J.L.; Zhang, Z.X.; Zhang, B.J. Deactivation model of Fischer-Tropsch synthesis over an FeCuK commercial catalyst. Applied Catalysis A General 1997, 161, 137–151. [Google Scholar] [CrossRef]
- Visconti, C.G.; Lietti, L.; Forzatti, P.; Zennaro, R. Fischer–Tropsch synthesis on sulphur poisoned Co/Al2O3 catalyst. Applied Catalysis A General 2007, 330, 49–56. [Google Scholar] [CrossRef]
- Curtis, V.; Nicolaides, C.P.; Coville, N.J.; Hildebrandt, D.; Glasser, D. The effect of sulfur on supported cobalt Fischer–Tropsch catalysts. Catalysis Today 1999, 49, 33–40. [CrossRef]
- McCue, A.J.; Anderson, J.A. Sulfur as a catalyst promoter or selectivity modifier in heterogeneous catalysis. Catal. Sci. Technol. 2014, 4, 272–294. [Google Scholar] [CrossRef]
- Zhang, C.; Shi, Y.; Yu, Y.; Du, Y.; Zhang, B. Engineering sulfur defects, atomic thickness, and porous structures into cobalt sulfide nanosheets for efficient electrocatalytic alkaline hydrogen evolution. ACS Catal. 2018, 8, 8077–8083. [Google Scholar] [CrossRef]
- Gu, C.; Zhou, G.; Yang, J.; Pang, H.; Zhang, M.; Zhao, Q.; Gu, X.; Tian, S.; Zhang, J.; Xu, L.; Tang, Y. NiS/MoS2 Mott-Schottky heterojunction-induced local charge redistribution for high-efficiency urea-assisted energy-saving hydrogen production. Chemical Engineering Journal 2022, 443, 136321. [Google Scholar] [CrossRef]
- Zhou, L.; Bo, B.; Yan, X.; Wang, C.; Chi, Y.; Yang, X. Brief review of surface passivation on III-V semiconductor. Crystals 2018, 8, 226. [Google Scholar] [CrossRef]
- Guo, S.; Yang, D.; Wang, D.; Fang, X.; Fang, D.; Chu, X.; Yang, X.; Tang, J.; Liao, L.; Wei, Z. Response improvement of GaAs two-dimensional non-layered sheet photodetector through sulfur passivation and plasma treatment. Vacuum 2022, 197, 110792. [Google Scholar] [CrossRef]
- Tajik, N.; Peng, Z.; Kuyanov, P.; LaPierre, R.R. Sulfur passivation and contact methods for GaAs nanowire solar cells. Nanotechnology 2011, 22, 225402. [Google Scholar] [CrossRef]
- Vayenas, C.G.; Bebelis, S.; Ladas, S. Dependence of catalytic rates on catalyst work function. Nature 1990, 343, 625–627. [Google Scholar] [CrossRef]
- Wang, L.; Ge, J.; Wang, A.; Deng, M.; Wang, X.; Bai, S.; Li, R.; Jiang, J.; Zhang, Q.; Luo, Y.; Xiong, Y. Designing p-type semiconductor–metal hybrid structures for improved photocatalysis. Angew. Chem. 2014, 126, 5207–5211. [Google Scholar] [CrossRef]
- Peng, C.; Wei, P.; Lia, X.; Liu, Y.; Cao, Y.; Wang, H.; Yu, H.; Peng, F.; Zhang, L.; Zhang, B.; Lv, K. High efficiency photocatalytic hydrogen production over ternary Cu/TiO2@Ti3C2Tx enabled by low-work-function 2D titanium carbide. Nano Energy 2018, 53, 97–107. [Google Scholar] [CrossRef]
- Kant, R.; Kaur, J.; Mishra, G.K. Theory for Influence of the Metal Electrolyte Interface on Heterogeneous Electron Transfer Rate Constant: Fractional Electron Transferred Transition State Approach. J. Phys. Chem. C 2020, 124, 2273–2288. [Google Scholar] [CrossRef]
- Kawano, H. Effective work functions for ionic and electronic emissions from mono-and polycrystalline surfaces. Progress in Surface Science 2008, 83, 1–165. [Google Scholar] [CrossRef]
- Peng, X.; Hu, L.; Qin, F.; Zhou, Y.; Chu, P.K. Low Work Function Surface Modifiers for Solution-Processed Electronics: A Review. Adv. Mater. Interfaces 2018, 5, 1701404. [Google Scholar] [CrossRef]
- Yamamoto, S. Fundamental physics of vacuum electron sources. Rep. Prog. Phys. 2006, 69, 181–232. [Google Scholar] [CrossRef]
- Kawano, H. Effective Work Functions of the Elements: Database, Most probable value, Previously recommended value, Polycrystalline thermionic contrast, Change at temperature, Anisotropic dependence sequence, Particle size dependence. Progress in Surface Science 2022, 97, 100583. [Google Scholar] [CrossRef]
- Papageorgopoulos, C.A.; Chen, J.M. Coadsorption of electropositive and electronegative elements: I. Cs and H2 on W(100). Surf. Sci. 1973, 39, 283–312. [Google Scholar] [CrossRef]
- Papageorgopoulos, C.A.; Chen, J.M. Coadsorption of Cesium and Oxygen on Ni(100). I. Cesium probing of Ni-O bonding. Surf. Sci. 1975, 52, 40–52. [Google Scholar] [CrossRef]
- Papageorgopoulos, C.A.; Desplat, J.L. Interaction of Cesium and Oxygen on W(110). I. Cesium adsorption on oxygenated and oxidized W(110). Surf. Sci. 1980, 92, 97–118. [Google Scholar] [CrossRef]
- Oudar, J. Sulfur adsorption and poisoning of metallic catalysts. Catalysis Reviews 1980, 22, 171–195. [Google Scholar] [CrossRef]
- MacLaren, J.M.; Pendry, J.B.; Vvedensky, D.D.; Joyner, R.W. Influence of poisons and promoters on local bonding of CO to Ni(100). Surf. Sci. 1985, 162, 322–328. [Google Scholar] [CrossRef]
- Kiskinova, M.P. Electronegative additives and poisoning in catalysis. Surf. Sci. Rep. 1988, 8, 359–402. [Google Scholar] [CrossRef]
- Joyner, R.W.; Meehan, P.; MacLaren, J.M.; Pendry, J.B. Poisoning of the methanation reaction on the Ni(100) surface; theoretical calculations compared with the results of goodman et al. Applied Catalysis 1986, 25, 9–17. [Google Scholar] [CrossRef]
- Zha, S.; Cheng, Z.; Liu, M. Sulfur Poisoning and Regeneration of Ni-Based Anodes in Solid Oxide Fuel Cells. J. Electrochem. Soc. 2007, 154, B201. [Google Scholar] [CrossRef]
- Malyi, O.I.; Chen, Z.; Kulish, V.V.; Bai, K.; Wu, P. Density functional theory study of the effects of alloying additions on sulfur adsorption on nickel surfaces Appl. Surf. Sci. 2013, 264, 320–328. [Google Scholar] [CrossRef]
- Xu, X.; Zhang, Y.; Yang, Z. Resistance to sulfur poisoning of Ni-based alloy with coinage (IB) metals. Appl. Surf. Sci. 2015, 357, 1785–1791. [Google Scholar] [CrossRef]
- Moud, P.H.; Andersson, K.J.; Lanza, R.; Pettersson, J.B.C.; Engvall, K. Effect of gas phase alkali species on tar reforming catalyst performance: Initial characterization and method development. Fuel 2015, 154, 95–106. [Google Scholar] [CrossRef]
- Hernandez, A.; Andersson, K.J.; Engvall, K.; Kantarelis, E. Gas-Phase Potassium Effects and the Role of the Support on the Tar Reforming of Biomass-Derived Producer Gas Over Sulfur-Equilibrated Ni/MgAl2O4. Energy & Fuels 2020, 34, 11103–11111. [Google Scholar]
- Hardegree, E.L.; Ho, P.; White, J.M. Sulfur adsorption on Ni (100) and its effect on CO chemisorption: I. TDS, AES and work function results. Surf. Sci. 1986, 165, 488–506. [Google Scholar] [CrossRef]
- Starke, U.; Bothe, F.; Oed, W.; Heinz, K. LEED analysis of the adsorption structure of c (2× 2) SNi (100) including substrate modifications. Surf. Sci. 1990, 232, 56–62. [Google Scholar] [CrossRef]
- Oed, W.; Starke, U.; Bothe, F.; Heinz, K. LEED structure analysis of p (2× 2) S/Ni (100). Surf. Sci. 1990, 234, 72–78. [Google Scholar] [CrossRef]
- Mercer, J.R.; Scarel, G.; Santoni, A.; Cowie, B.C.C.; Lewis, D.; Robinson, A.W.; McGrath, R.; Dhanak, V.R. Structural study of Rh (100) - c (2×2)-S using the normal-incidence standing X-ray wavefield method. Surf. Sci. 1996, 369, 36–44. [Google Scholar] [CrossRef]
- Gall, N.R.; Rut’kov, E.V.; Tontegode, A.Y.; Usufov, M.M. Surface sulfide on (100) W: formation, stability, absolute concentration of sulfur. Appl. Surf. Sci. 1996, 93, 353–358. [Google Scholar] [CrossRef]
- Papageorgopoulos, C.A.; Kamaratos, M.; Papageorgopoulos, A. Coadsorption of Na and elemental S on Ni (100). Surf. Sci. 1998, 402–404, 120–124. [Google Scholar] [CrossRef]
- Papageorgopoulos, C.A.; Kamaratos, M.; Papageorgopoulos, A.C. Coadsorption of cesium and elemental sulfur on Ni (100) surfaces. Surf. Sci. 1999, 433–435, 806–810. [Google Scholar] [CrossRef]
- Papageorgopoulos, A.C.; Kamaratos, M. K and S coadsorption on Ni(100) surfaces. J. Phys. Condens. Matter 2000, 12, 9281–9291. [Google Scholar] [CrossRef]
- Papageorgopoulos, A.C.; Kamaratos, M.; Papageorgopoulos, C.A. Li on S covered Ni(100) surfaces. Surf. Sci. 2001, 481, 143–149. [Google Scholar] [CrossRef]
- Demuth, J.E.; Jepsen, D.W.; Marcus, P.M. Crystallographic dependence of chemisorption bonding for sulfur on (001),(110), and (111) nickel. Phys. Rev. Lett. 1974, 32, 1182–1185. [Google Scholar] [CrossRef]
- Partridge, A.; Tatlock, G.J.; Leibsle, F.M.; Flipse, C.F.J.; Hormandinger, G.; Pendry, J.B. Scanning-tunneling-microscopy investigation of the p(2×2) and c(2×2) overlayers of S on Ni(100). Phys. Rev. B 1993, 48, 8267–8276. [Google Scholar] [CrossRef]
- Papageorgopoulos, C.A.; Kamaratos, M. Adsorption of elemental S on Ni(100) surfaces. Surf. Sci. 1995, 338, 77–82. [Google Scholar] [CrossRef]
- Demuth, J.E.; Jepsen, D.W.; Marcus, P.M. Chemisorption Bonding of c(2x2) Chalcogen Qverlayers on Ni(001). Phys. Rev. Lett. 1973, 31, 540–542. [Google Scholar] [CrossRef]
- Plummer, E.W.; Tonner, B.; Holzwarth, N.; Liebsch, A. Electronic structure of ordered sulfur overlayers on Ni (001). Phys. Rev. B 1980, 21, 4306–4321. [Google Scholar] [CrossRef]
- McGrath, R.; MacDowell, A.A.; Hashizume, T.; Sette, F.; Citrin, P.H. Low-temperature adsorption of H2S on Ni(001) studied by near-edge and surface-extended - x-ray-absorption fine structure. Phys. Rev. B 1989, 40, 9457–9463. [Google Scholar] [CrossRef] [PubMed]
- Blaszcsyszyn, M.; Blaszcsyszyn, R.; Meclewski, R.; Melmed, A.J.; Madey, T.E. Interactions of sulfur with nickel surfaces: adsorption, diffusion and desorption. Surf. Sci. 1983, 131, 433–447. [Google Scholar] [CrossRef]
- Papageorgopoulos, C.A.; Foulias, S.; Kennou, S.; Kamaratos, M. The effect of Cs on the oxidation of Si (111) surfaces. Surf. Sci. 1989, 211–212, 991–1000. [Google Scholar] [CrossRef]
- Wu, R.Q.; Wang, D.S. Effect of the surface states of different transition-metal substrates on a Cs overlayer. Phys. Rev. B 1990, 41, 12541–12552. [Google Scholar] [CrossRef]
- Vlachos, D.; Giotopoulou, E.; Foulias, S.D.; Kamaratos, M. Cesium growth on the SrTiO3 (100) surface. Mater. Res. Express 2015, 2, 116501. [Google Scholar] [CrossRef]
- Rasor, N.S.; Warner, C. Correlation of Emission Processes for Adsorbed Alkali Films on Metal Surfaces. J. Appl. Phys. 1964, 35, 2589–2600. [Google Scholar] [CrossRef]
- Gasser, R.P.H. Introduction to Chemisorption and Catalysis by Metals Oxford University Press 1985.
- Woodruff, D.P.; Delchar, T.A. Modern Techniques of Surface Science Cambridge University Press 1986.
- Raaen, S. Adsorption of carbon dioxide on mono-layer thick oxidized samarium films on Ni(100). Nanomaterials 2021, 11, 2064. [Google Scholar] [CrossRef] [PubMed]
- Papageorgopoulos, C.A. Adsorption of Cs on H-precovered W(110) surfaces. Phys. Rev. B 1989, 40, 1546–1554. [Google Scholar] [CrossRef] [PubMed]
- Papageorgopoulos, C.A.; Kamaratos, M. Adsorption of K on clean and hydrogenated Si(100) 2×1. Vacuum 1990, 41, 567–570. [Google Scholar] [CrossRef]
- Wimmer, E.; Freeman, A.J.; Hishes, J.R.; Karo, A.M. All-electron local-density theory of alkali-metal bonding on transition-metal surfaces: Cs on W(001). Phys. Rev. B 1983, 28, 3074–3091. [Google Scholar] [CrossRef]
- Muscat, J.P.; Batra, I. Coverage dependence of the work function of metals upon alkali-metal adsorption. Phys. Rev. B 1986, 34, 2889–2892. [Google Scholar] [CrossRef]
- Kennou, S.; Kamaratos, M.; Papageorgopoulos, C.A. Potassium adsorption on NiO(100). Vacuum 1990, 41, 22–24. [Google Scholar] [CrossRef]
- Kennou, S.; Kamaratos, M.; Papageorgopoulos, C.A. Cesium and oxygen adsorption on NiO(100). Surf. Sci. 1991, 256, 312–316. [Google Scholar] [CrossRef]
- Michaelson, H.B. The work function of the elements and its periodicity. J. Appl. Phys. 1977, 48, 4729–4733. [Google Scholar] [CrossRef]
- Haynes, W.M. Editor in Chief CRC Handbook of Chemistry and Physics, 95th Edition, CRC Press Taylor & Francis Group (2014-2015).
- Greene, E.F.; Kelley, J.T.; Pickering, M.A.; Stewart, D.K. Silicon (111) and (100) surfaces and their interactions with Cs, K, Na and Li; phase changes and kinetics of desorption studied by surface ionization. Surf. Sci. 1984, 139, 185–207. [Google Scholar] [CrossRef]
- Cousty, J.; Papageorgopoulos, C.A.; Riwan, R. Electronic properties of Cs layers adsorbed on Pt (111). Surf. Sci. 1989, 223, 479–492. [Google Scholar] [CrossRef]
- Bhaskar, N.D.; Kahla, C.M.; Martin, L.R. Absorption of cesium by polycrystalline graphite-sticking coefficient studies. Carbon 1990, 28, 71–78. [Google Scholar] [CrossRef]
- Papageorgopoulos, A.C.; Kamaratos, M. K and S coadsorption on Ni(100) surfaces. J. Phys. Condens. Matter 2000, 12, 9281–9291. [Google Scholar] [CrossRef]
- Redhead, P.A. Thermal desorption of gases. Vacuum 1962, 12, 203–211. [Google Scholar] [CrossRef]
- Seok, T.J.; Cho, Y.J.; Jin, H.S.; Kim, D.H.; Kim, D.W.; Lee, S.M.; Park, J.B.; Won, J.Y.; Kim, S.K.; Hwang, C.S.; Park, T.J. High quality interfacial sulfur passivation via H2S pre-deposition annealing for an atomic-layer-deposited HfO2 film on a Ge substrate. J. Mater. Chem. C 2016, 4, 850–856. [Google Scholar] [CrossRef]
- Kunitsyna, E.V.; L’vova, T.V.; Dunaevskii, M.S.; Terent’ev, Ya.V.; Semenov, A.N.; Solov’ev, V.A.; Meltser, B.Ya.; Ivanov, S.V.; Yakovlev, Yu.P. Wet sulfur passivation of GaSb (1 0 0) surface for optoelectronic applications. Appl. Surf. Sci. 2010, 256, 5644–5649. [Google Scholar] [CrossRef]
- Petrovykh, D.Y.; Yang, M.J.; Whitman, L.J. Chemical and electronic properties of sulfur-passivated InAs surfaces. Surf. Sci. 2003, 523, 231–240. [Google Scholar] [CrossRef]
Figure 1.
The Ap-pH of Cs (563 eV) AETL for ΘCs=0.3 ML on clean Ni(100) surface and ΘCs= 0.6 ML on S-covered Ni(100) surfaces for ΘS≤0.5 ML and ΘS>0.5 ML, as a function of temperature of the sample post annealing. The Auger electron signal was recorded when the sample’s temperature restored close to RT.
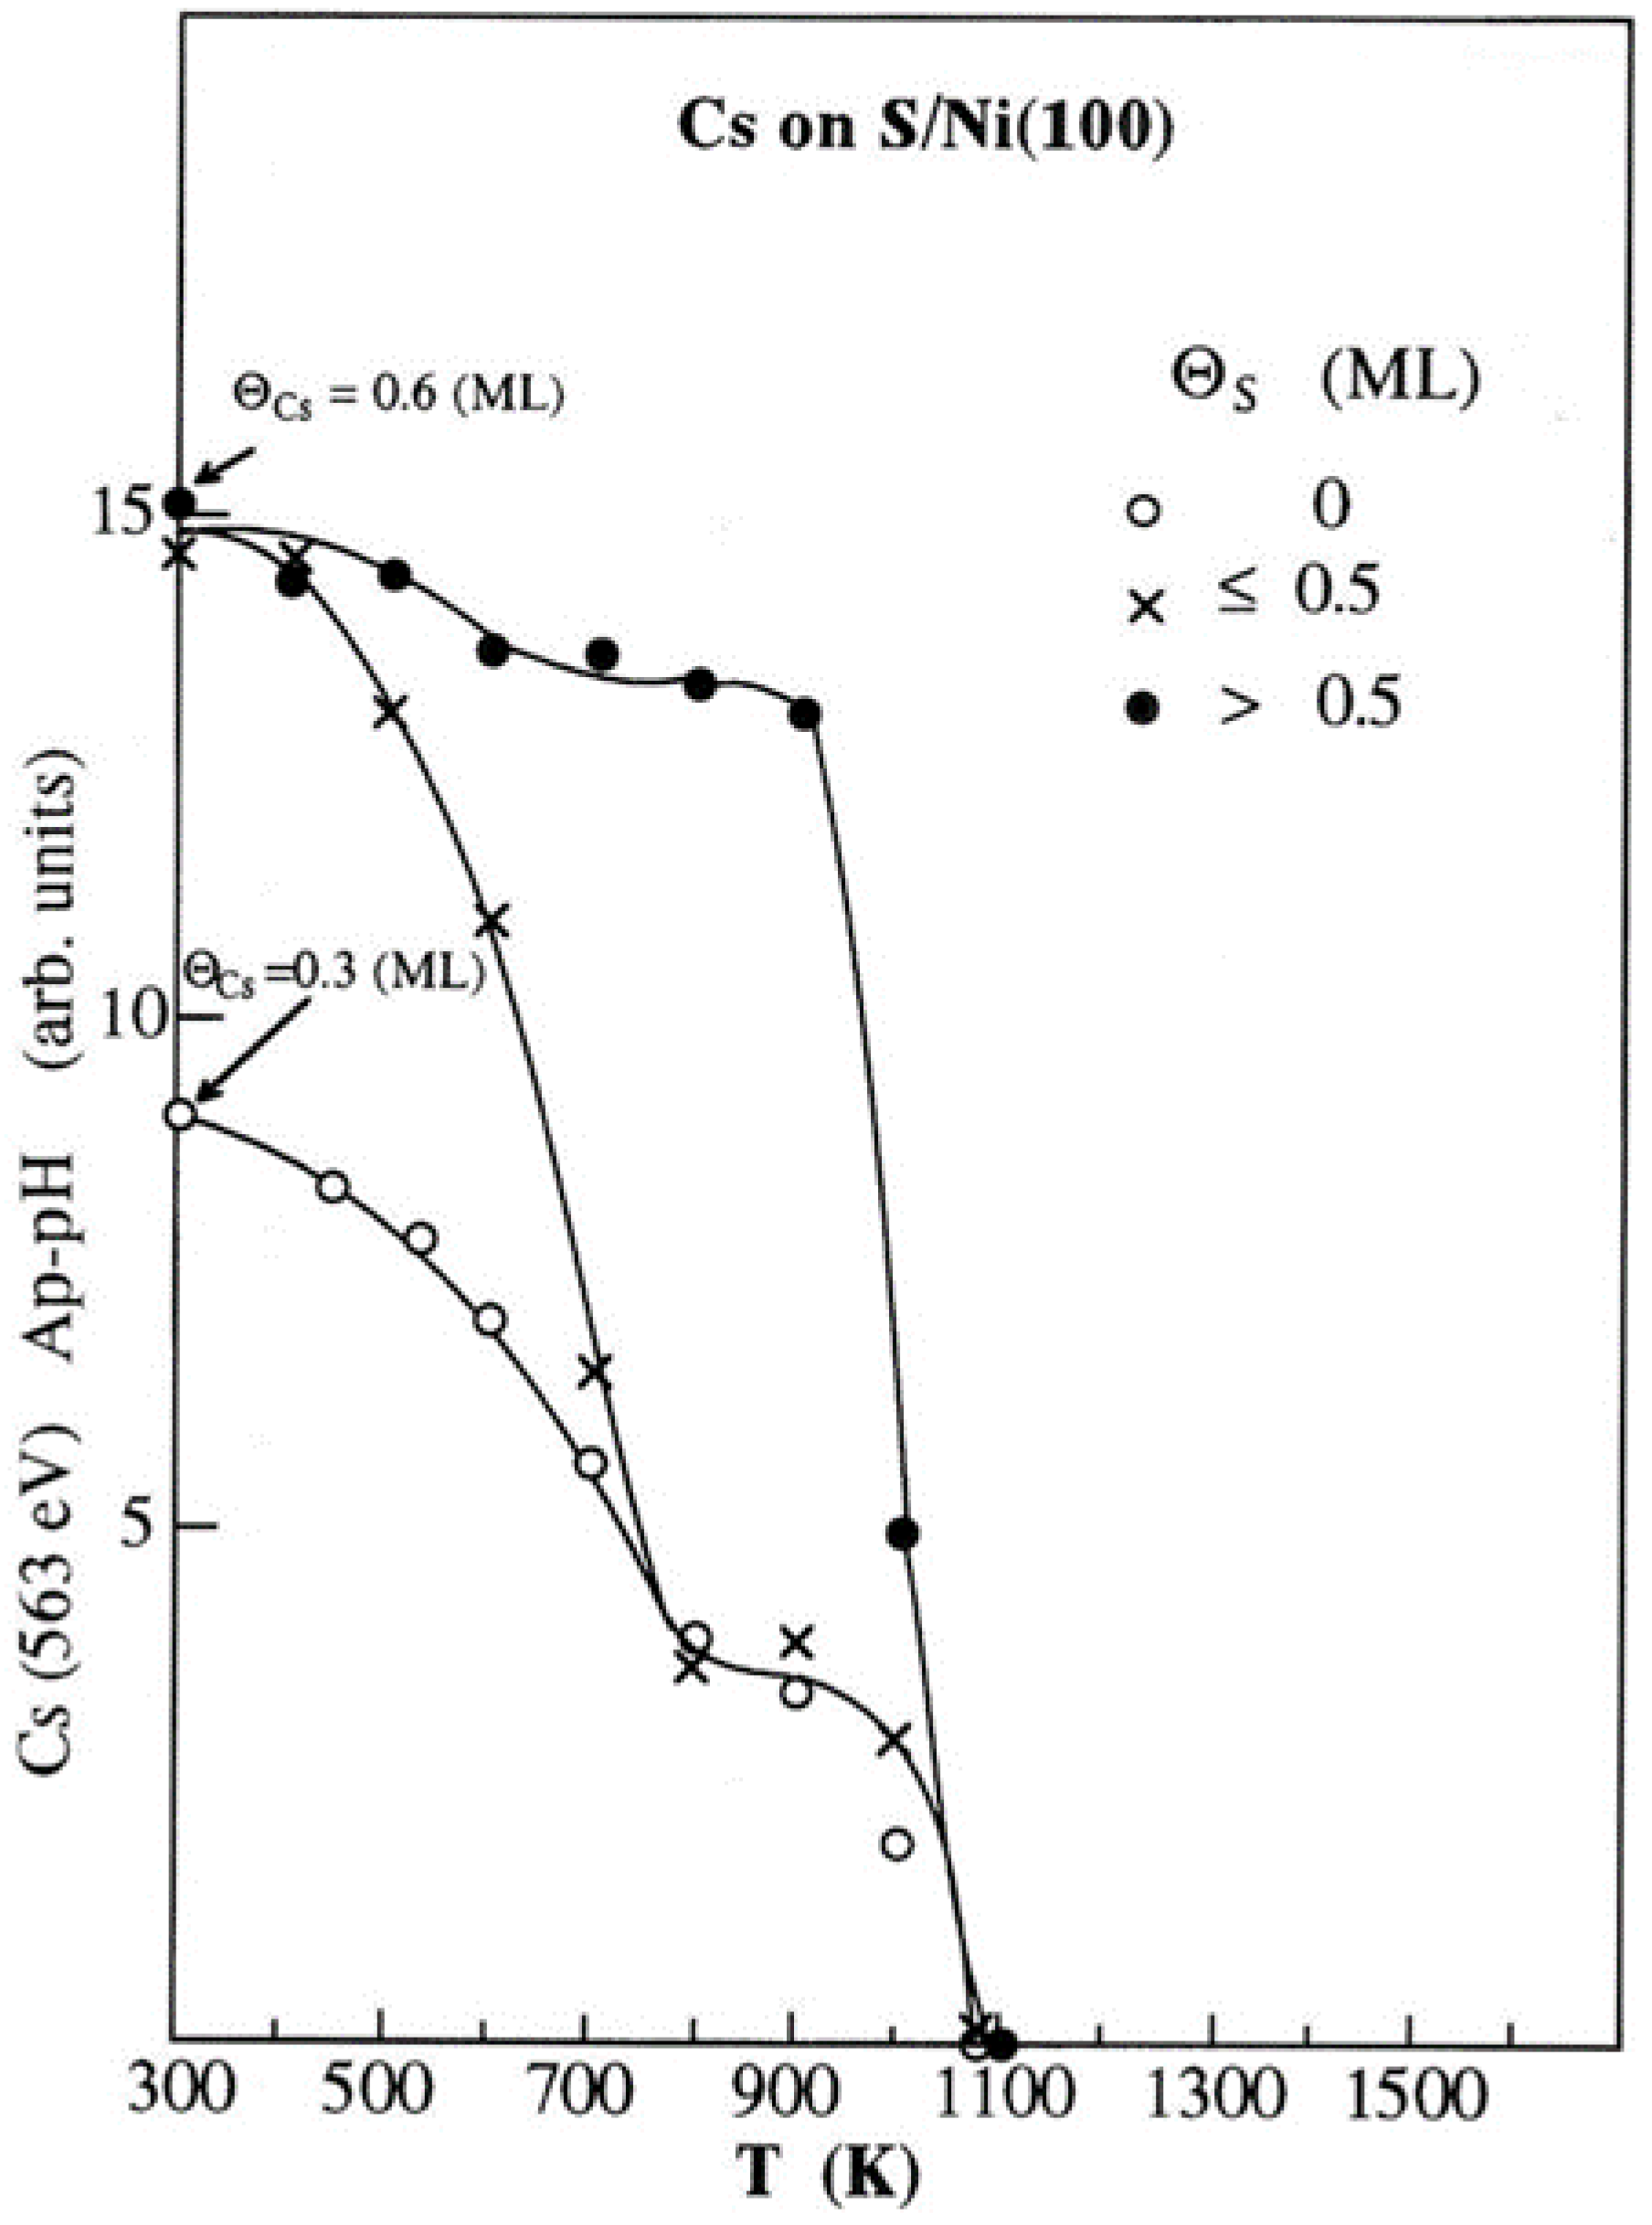
Figure 2.
The Ap-pH of Cs (563 eV), S (151 eV) and Ni (61 eV) AETLs of Cs(0.6 ML) on the S(1 ML) covered Ni(100) surface, as a function of temperature. All the Ap-pH signals were recorded when the sample restored its temperature near to RT.
Figure 2.
The Ap-pH of Cs (563 eV), S (151 eV) and Ni (61 eV) AETLs of Cs(0.6 ML) on the S(1 ML) covered Ni(100) surface, as a function of temperature. All the Ap-pH signals were recorded when the sample restored its temperature near to RT.
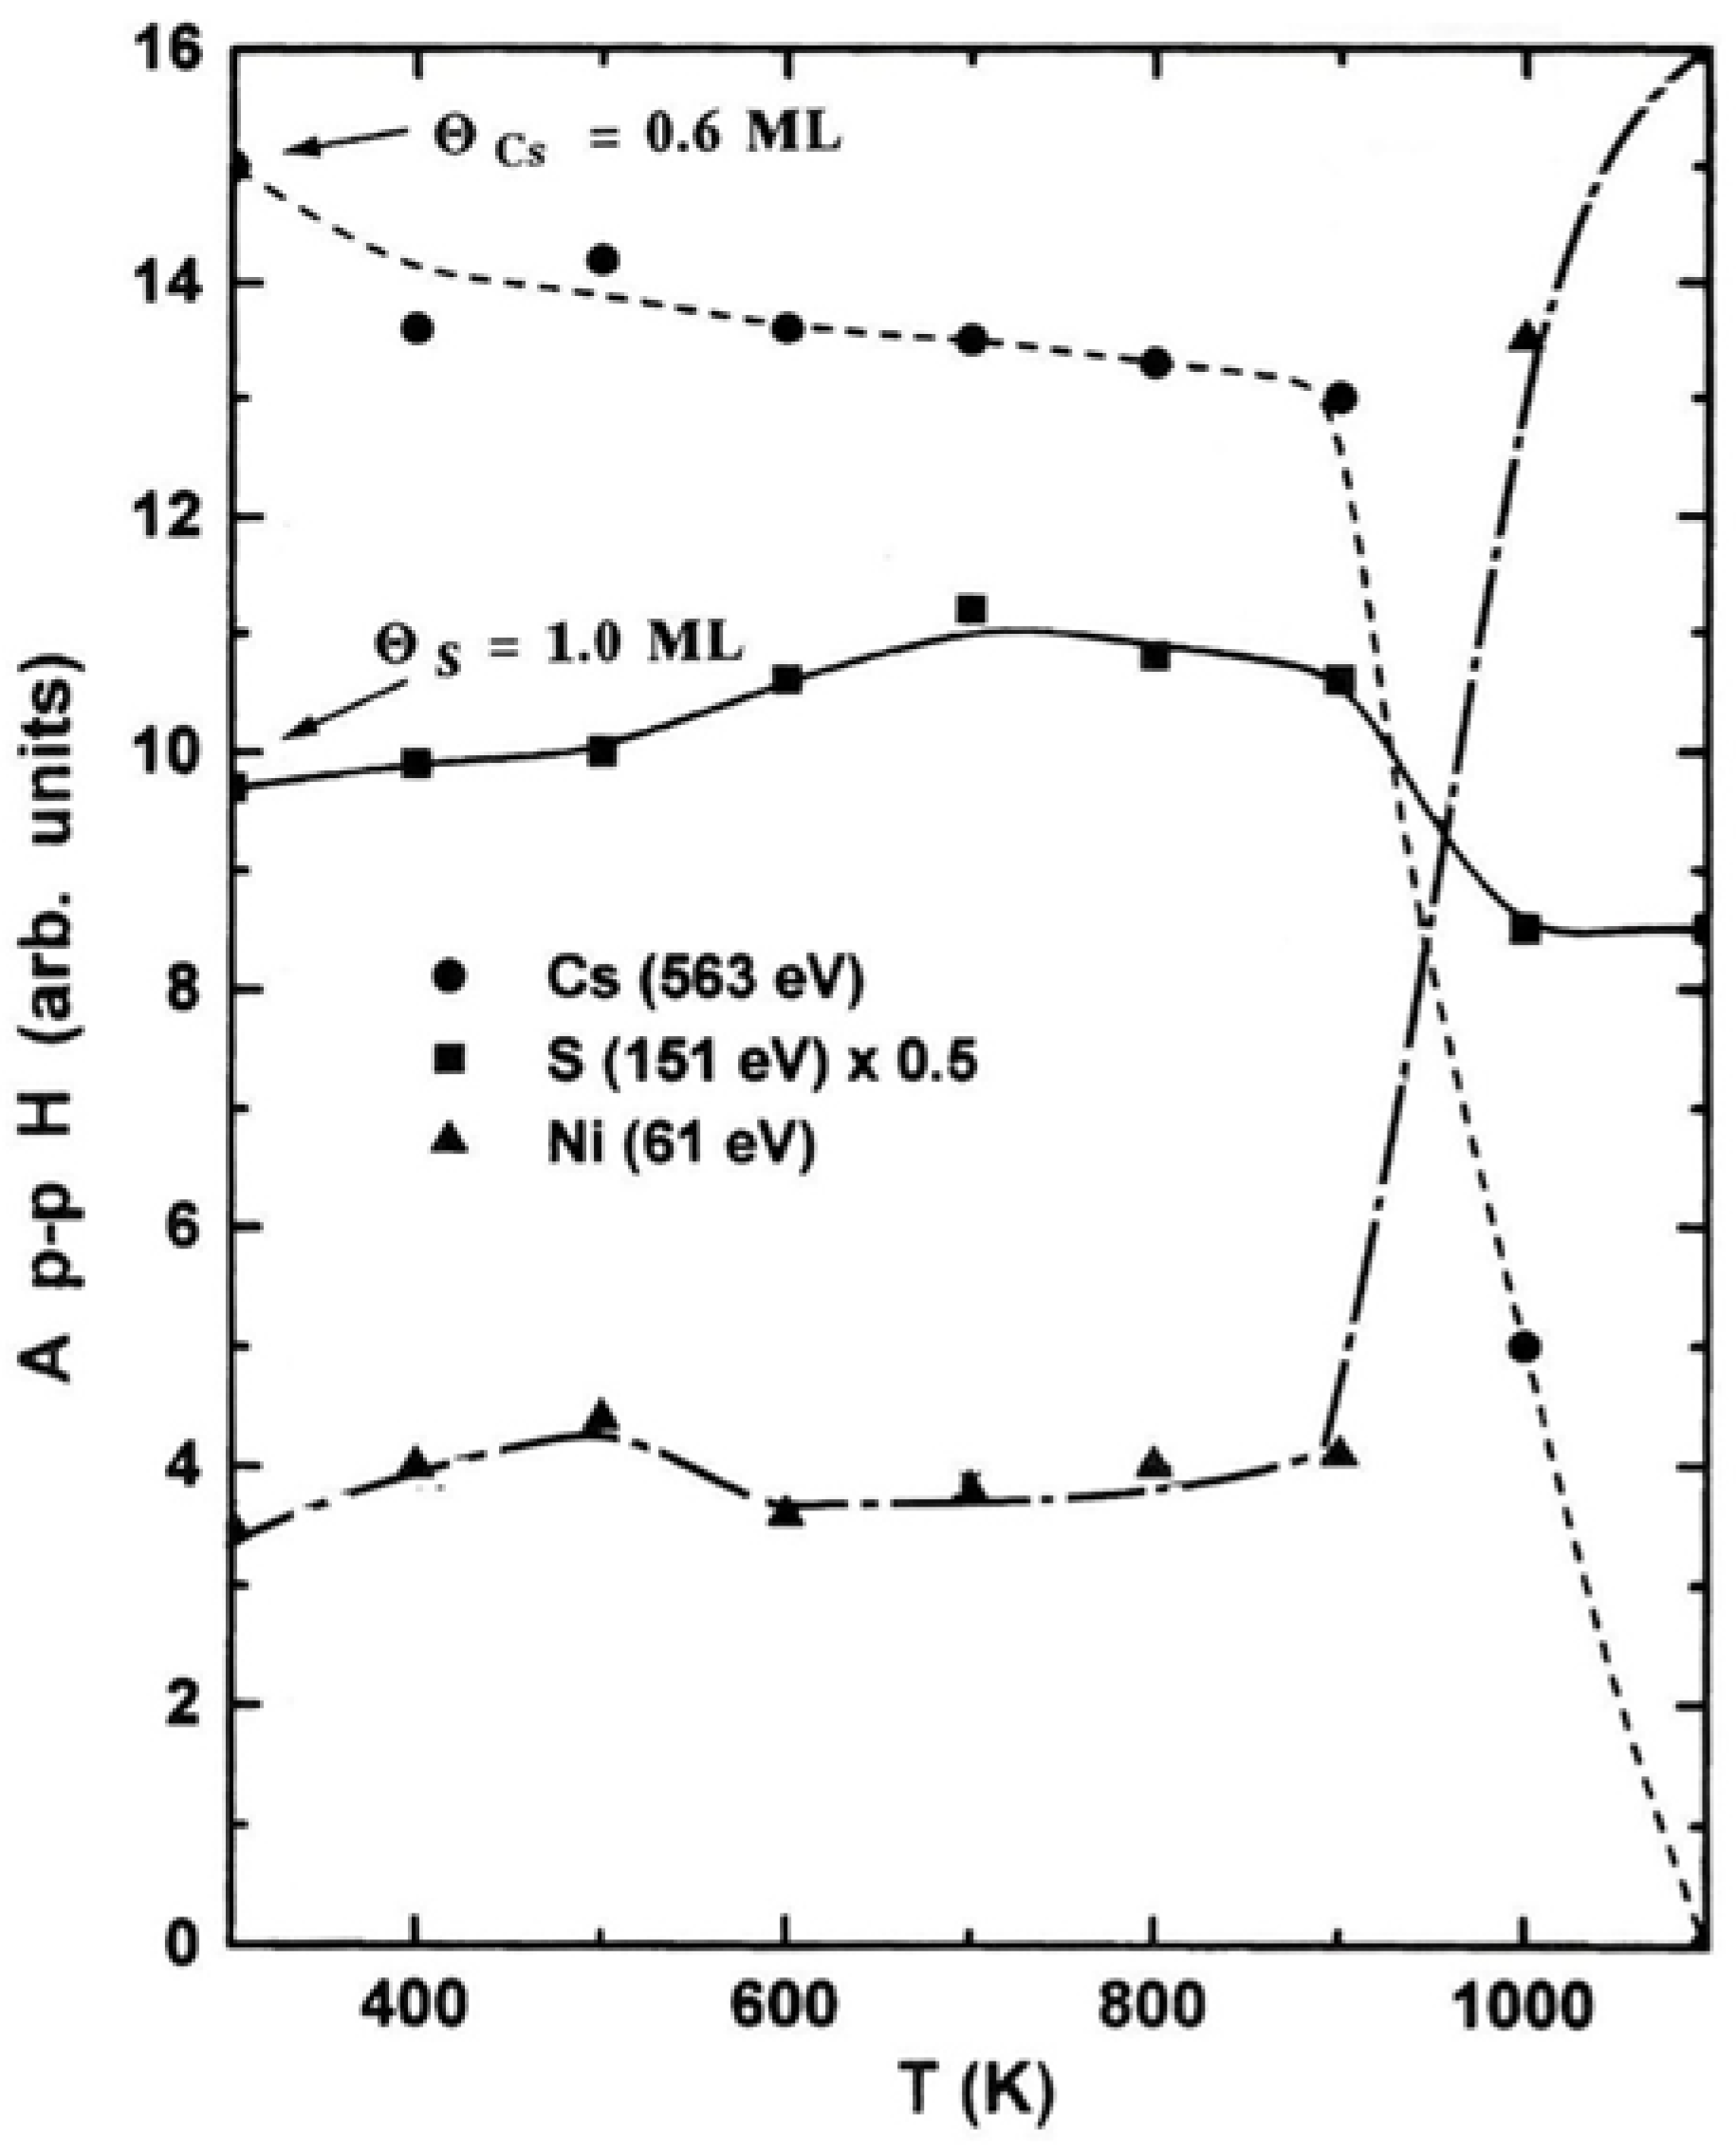
Figure 3.
The WF change ΔΦ at RT as a function of Cs deposition on the pre-covered with different amounts of sulfur Ni(100) surface.
Figure 3.
The WF change ΔΦ at RT as a function of Cs deposition on the pre-covered with different amounts of sulfur Ni(100) surface.
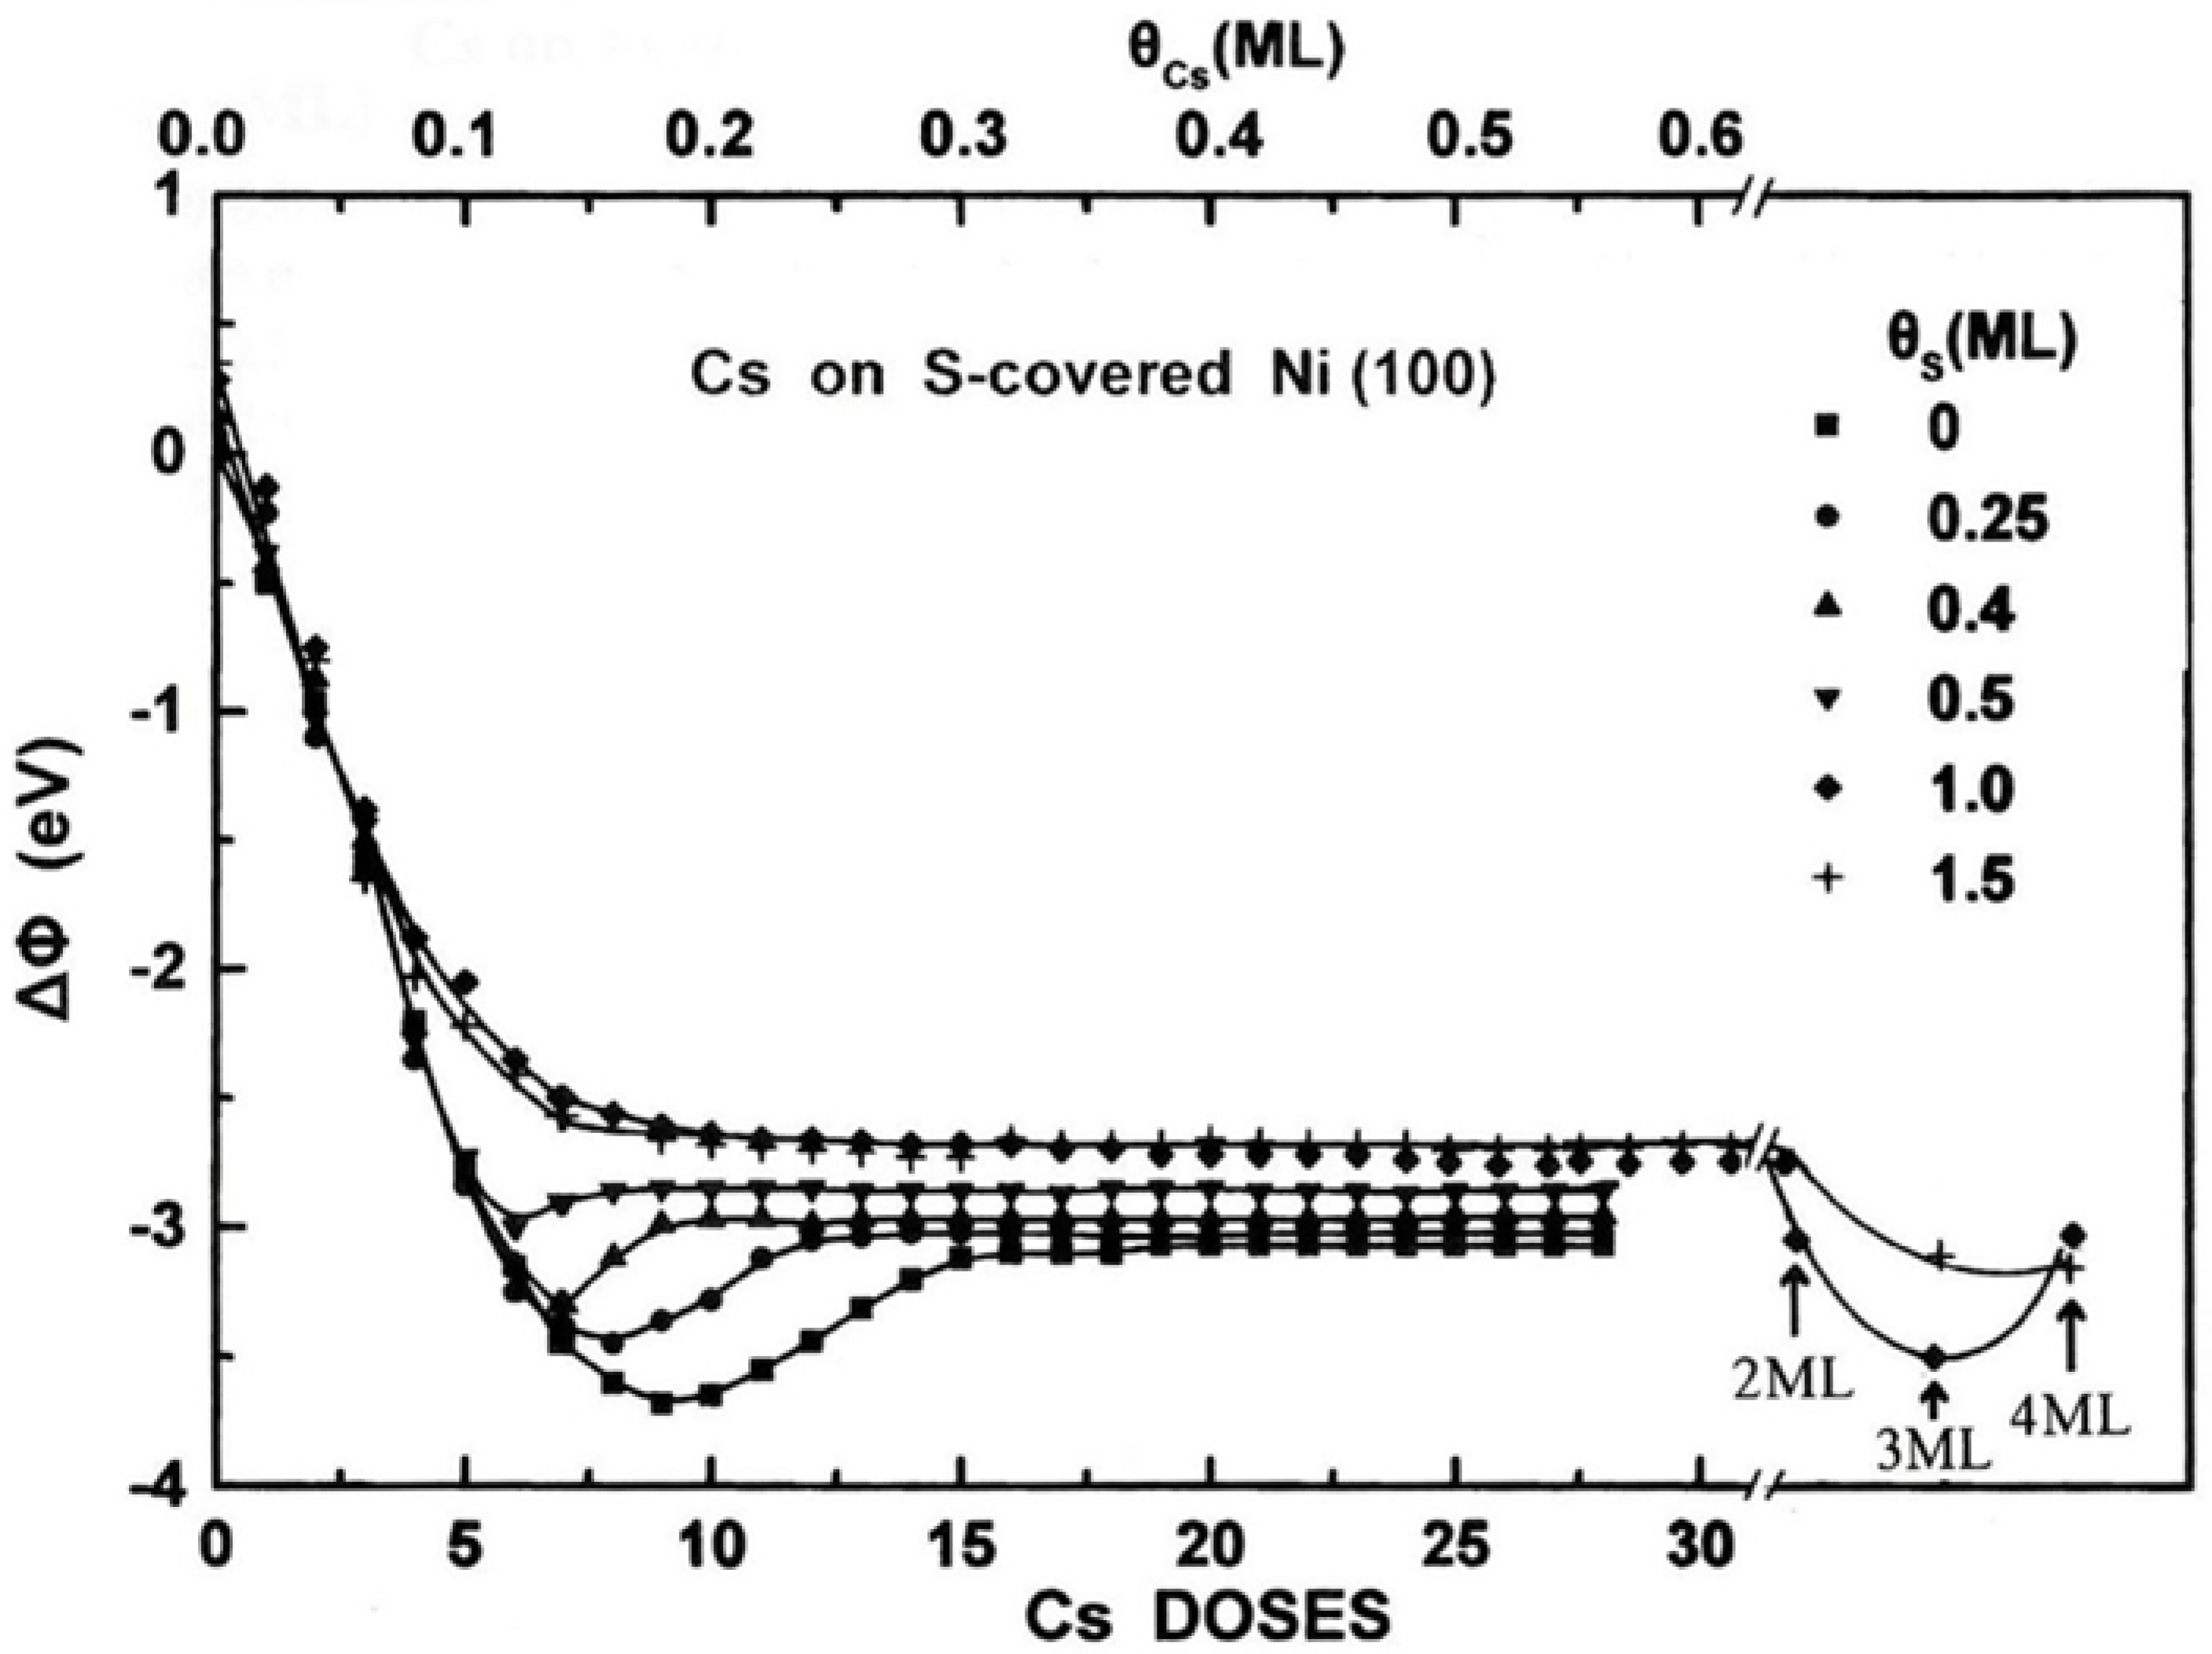
Figure 4.
(a) The WF values of Φmin and Φmax as a function of Cs coverage on different S pre-covered Ni(100) surfaces. (b) The difference Φmax - Φmin, as a function of S coverage. The data have been extracted from Table 2.
Figure 4.
(a) The WF values of Φmin and Φmax as a function of Cs coverage on different S pre-covered Ni(100) surfaces. (b) The difference Φmax - Φmin, as a function of S coverage. The data have been extracted from Table 2.
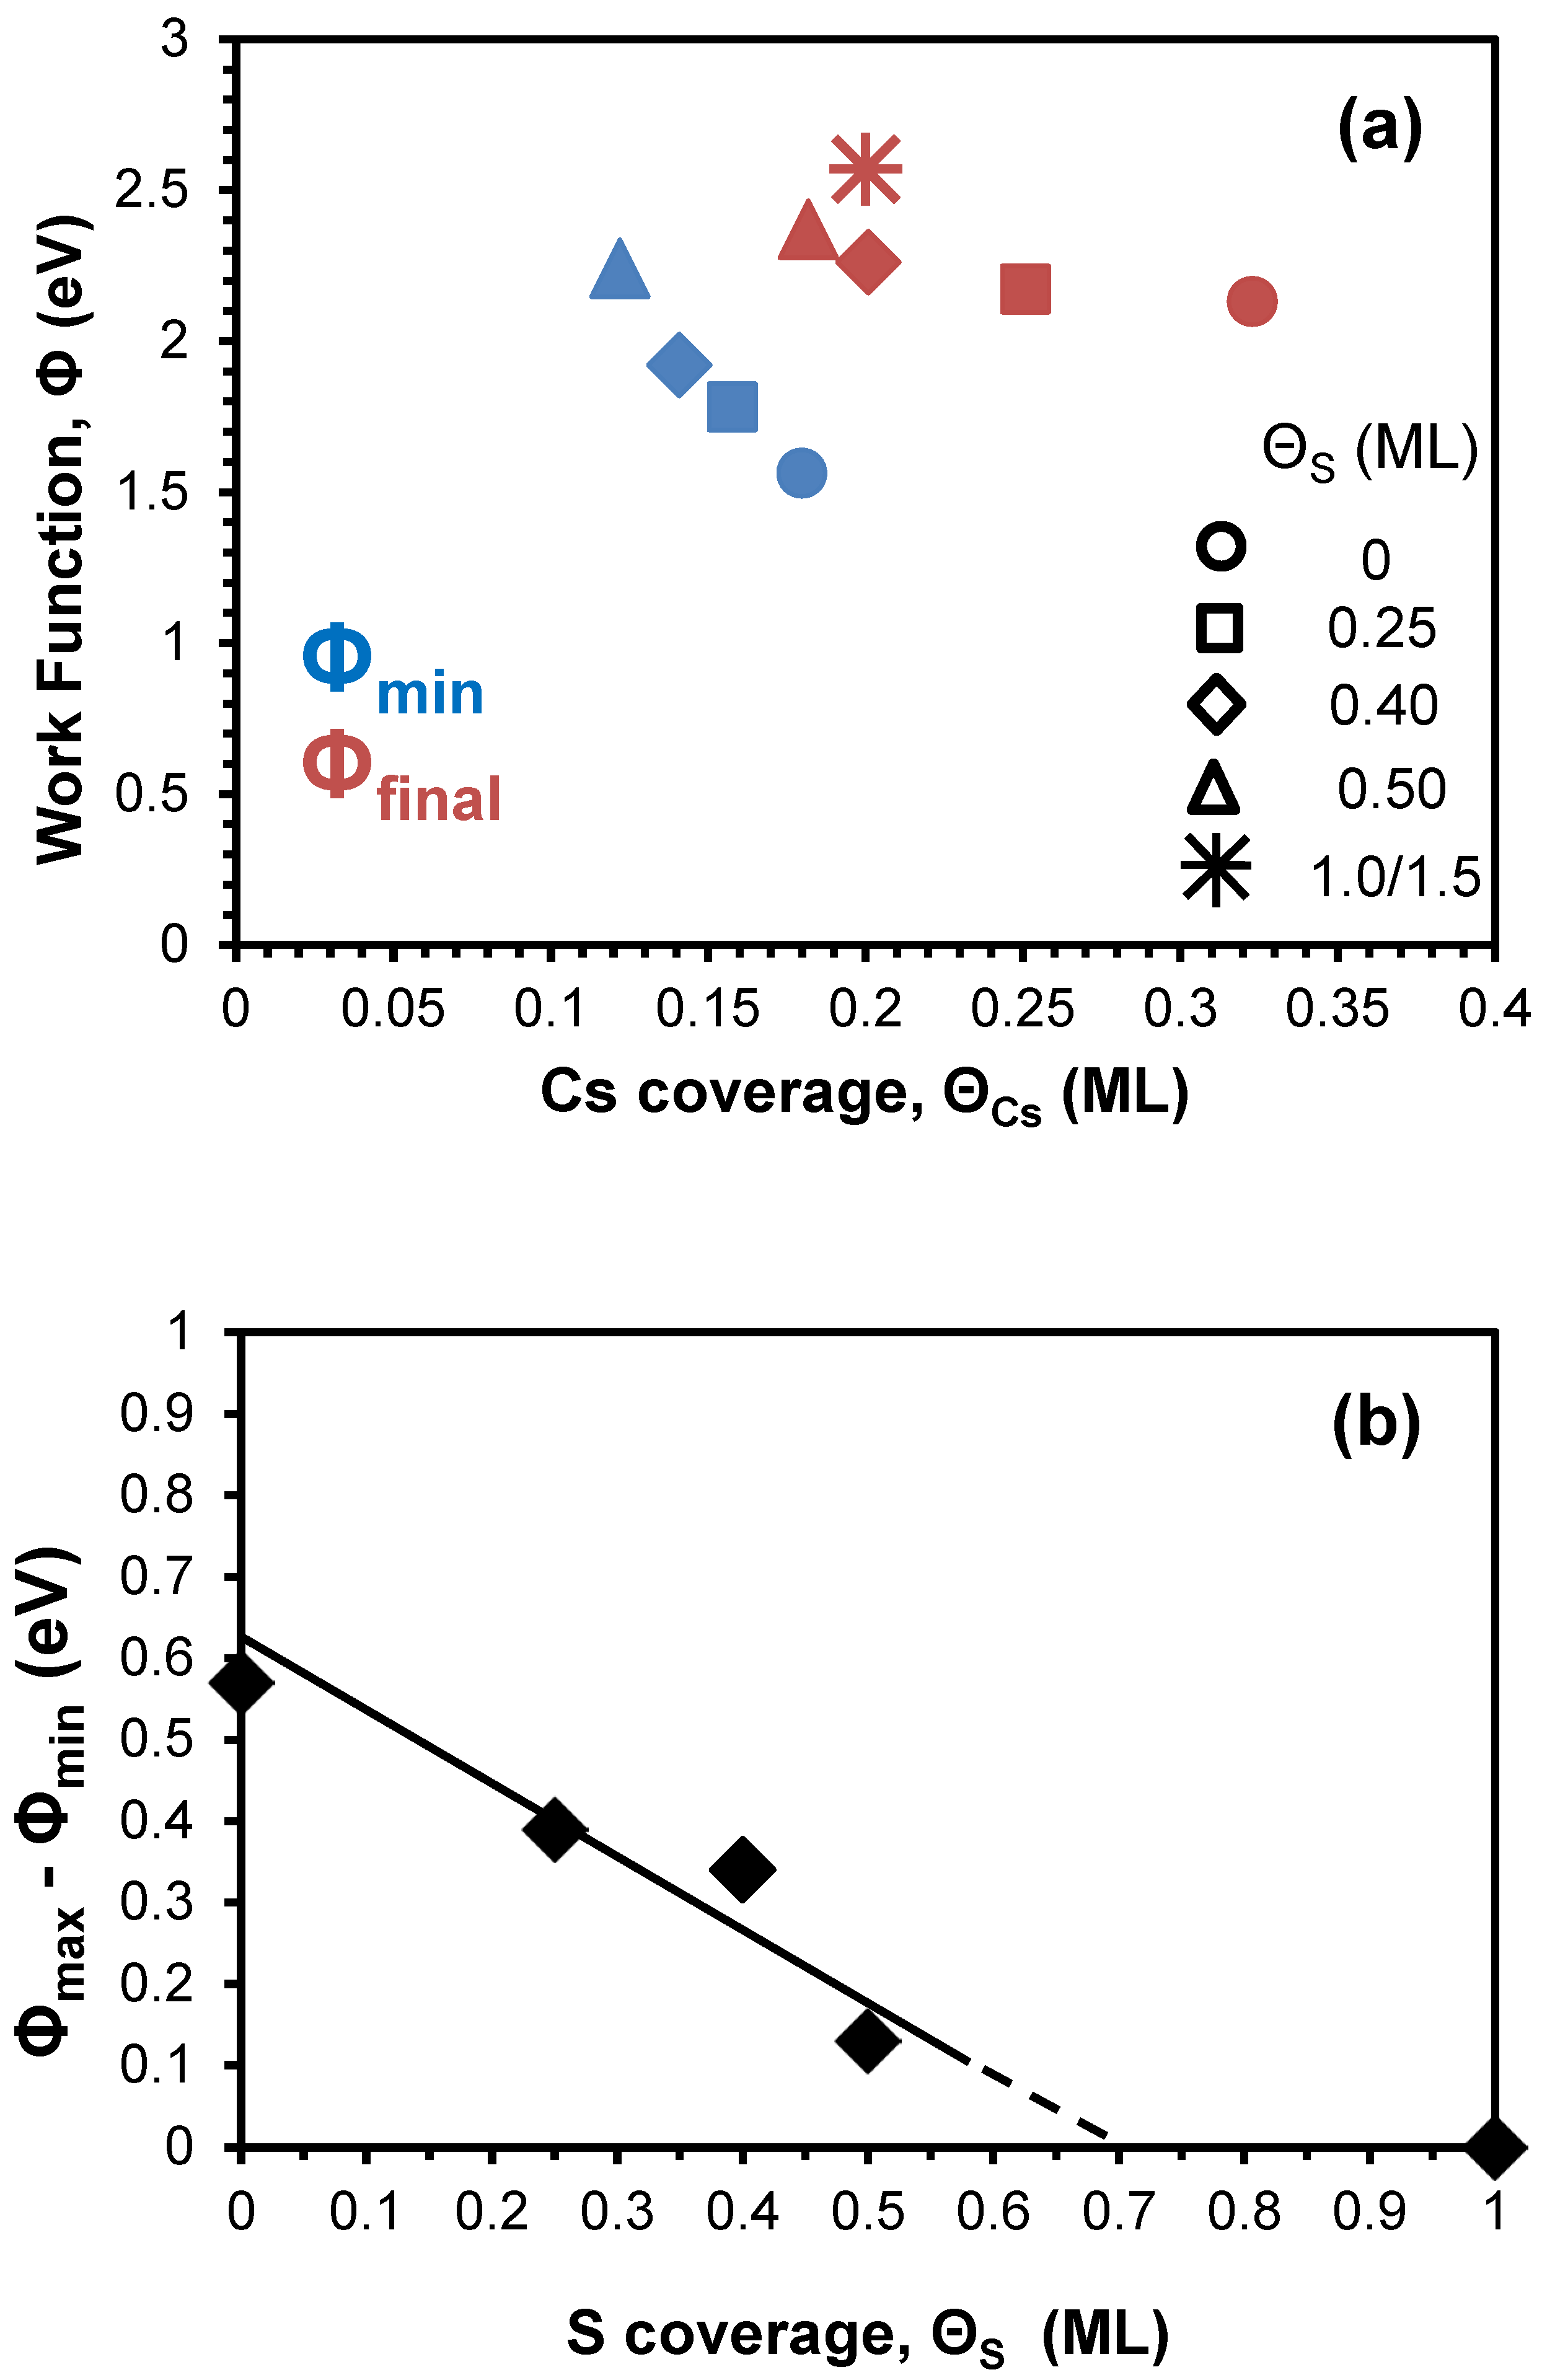
Figure 5.
A series of Cs(133 amu) TDS spectra after Cs deposition on a preheated at 1100 K c(2x2)-S(0.5 ML)/Ni(100) surface, as compared to that of 0.3 ML of Cs on clean Ni(100) (shown with dotted line). The insert at the upper right depicts for comparison reasons some TDS spectra of Cs(133 amu) after deposition of 0.3 ML of Cs on clean and S-covered Ni(100) surfaces [41].
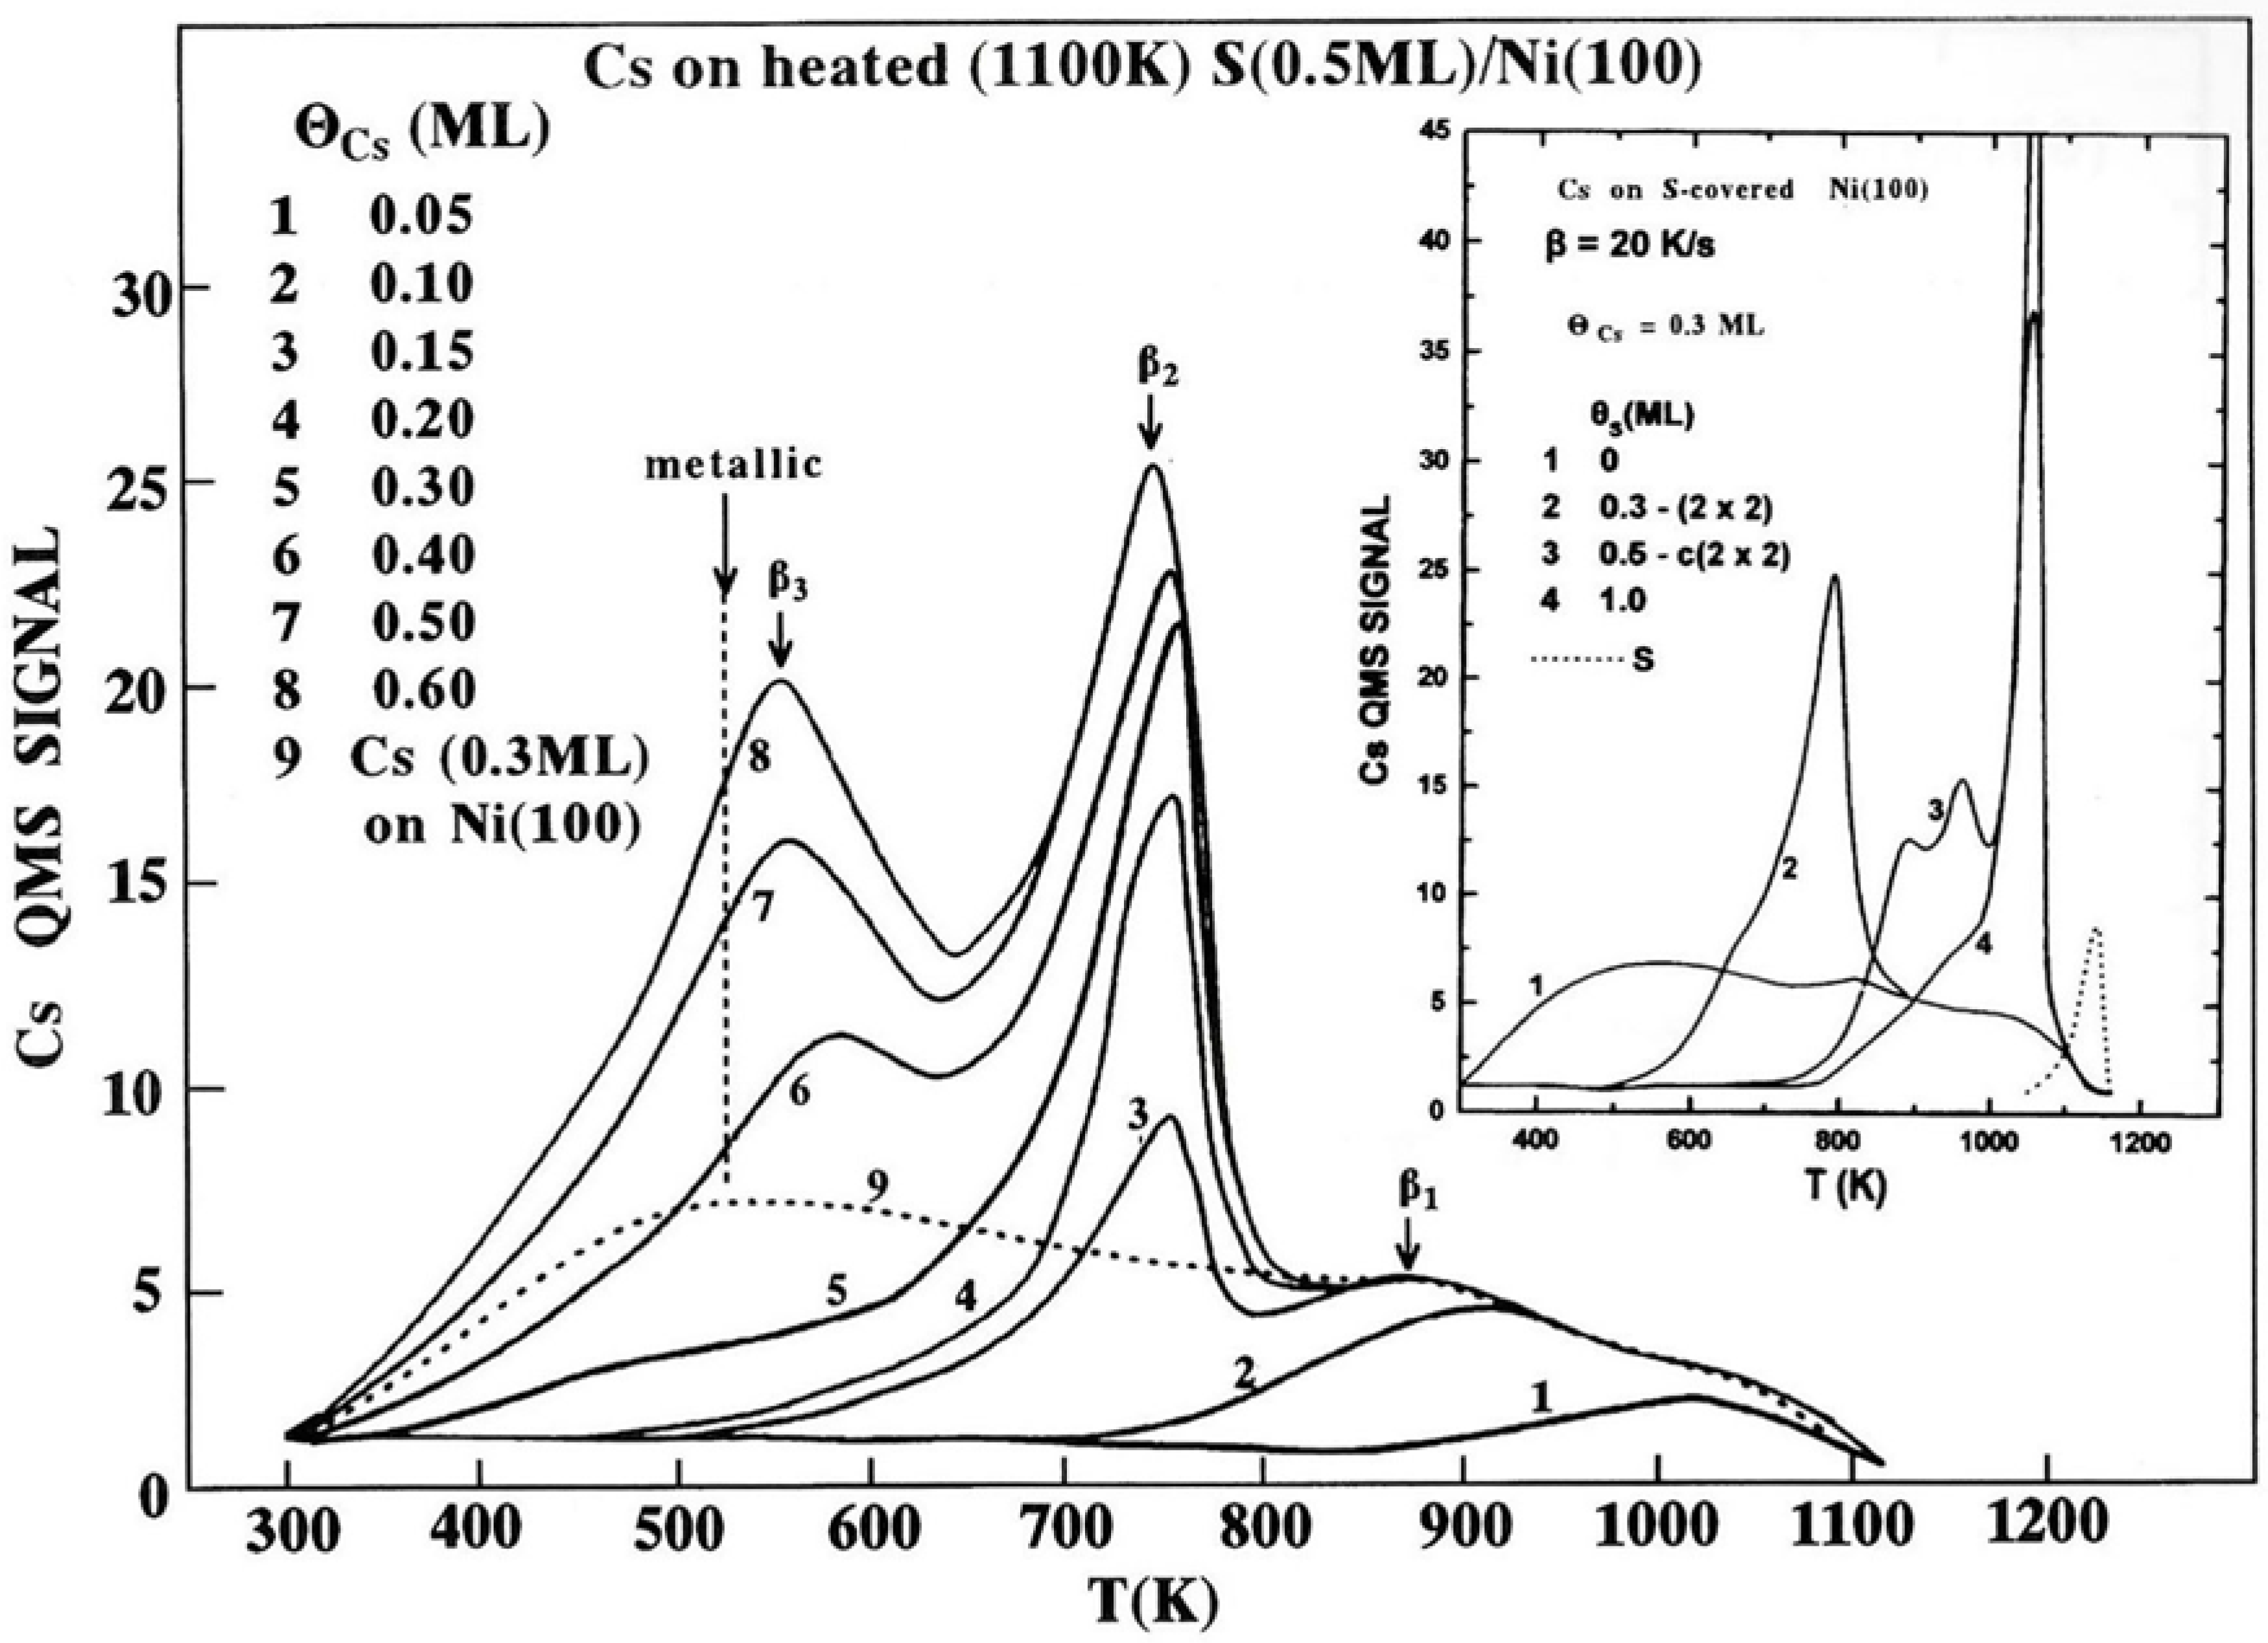
Figure 6.
The Ap-pH of the of S (151 eV), Ni (61 eV) and Cs (47 eV) AETLs as a function of sulfur deposition on the Cs(0.3 ML)/Ni(100) surface. The evolution of the S (151 eV) Ap-pH on the clean Ni(100) surface is also shown with the dotted line as well as the appearing LEED patterns.
Figure 6.
The Ap-pH of the of S (151 eV), Ni (61 eV) and Cs (47 eV) AETLs as a function of sulfur deposition on the Cs(0.3 ML)/Ni(100) surface. The evolution of the S (151 eV) Ap-pH on the clean Ni(100) surface is also shown with the dotted line as well as the appearing LEED patterns.
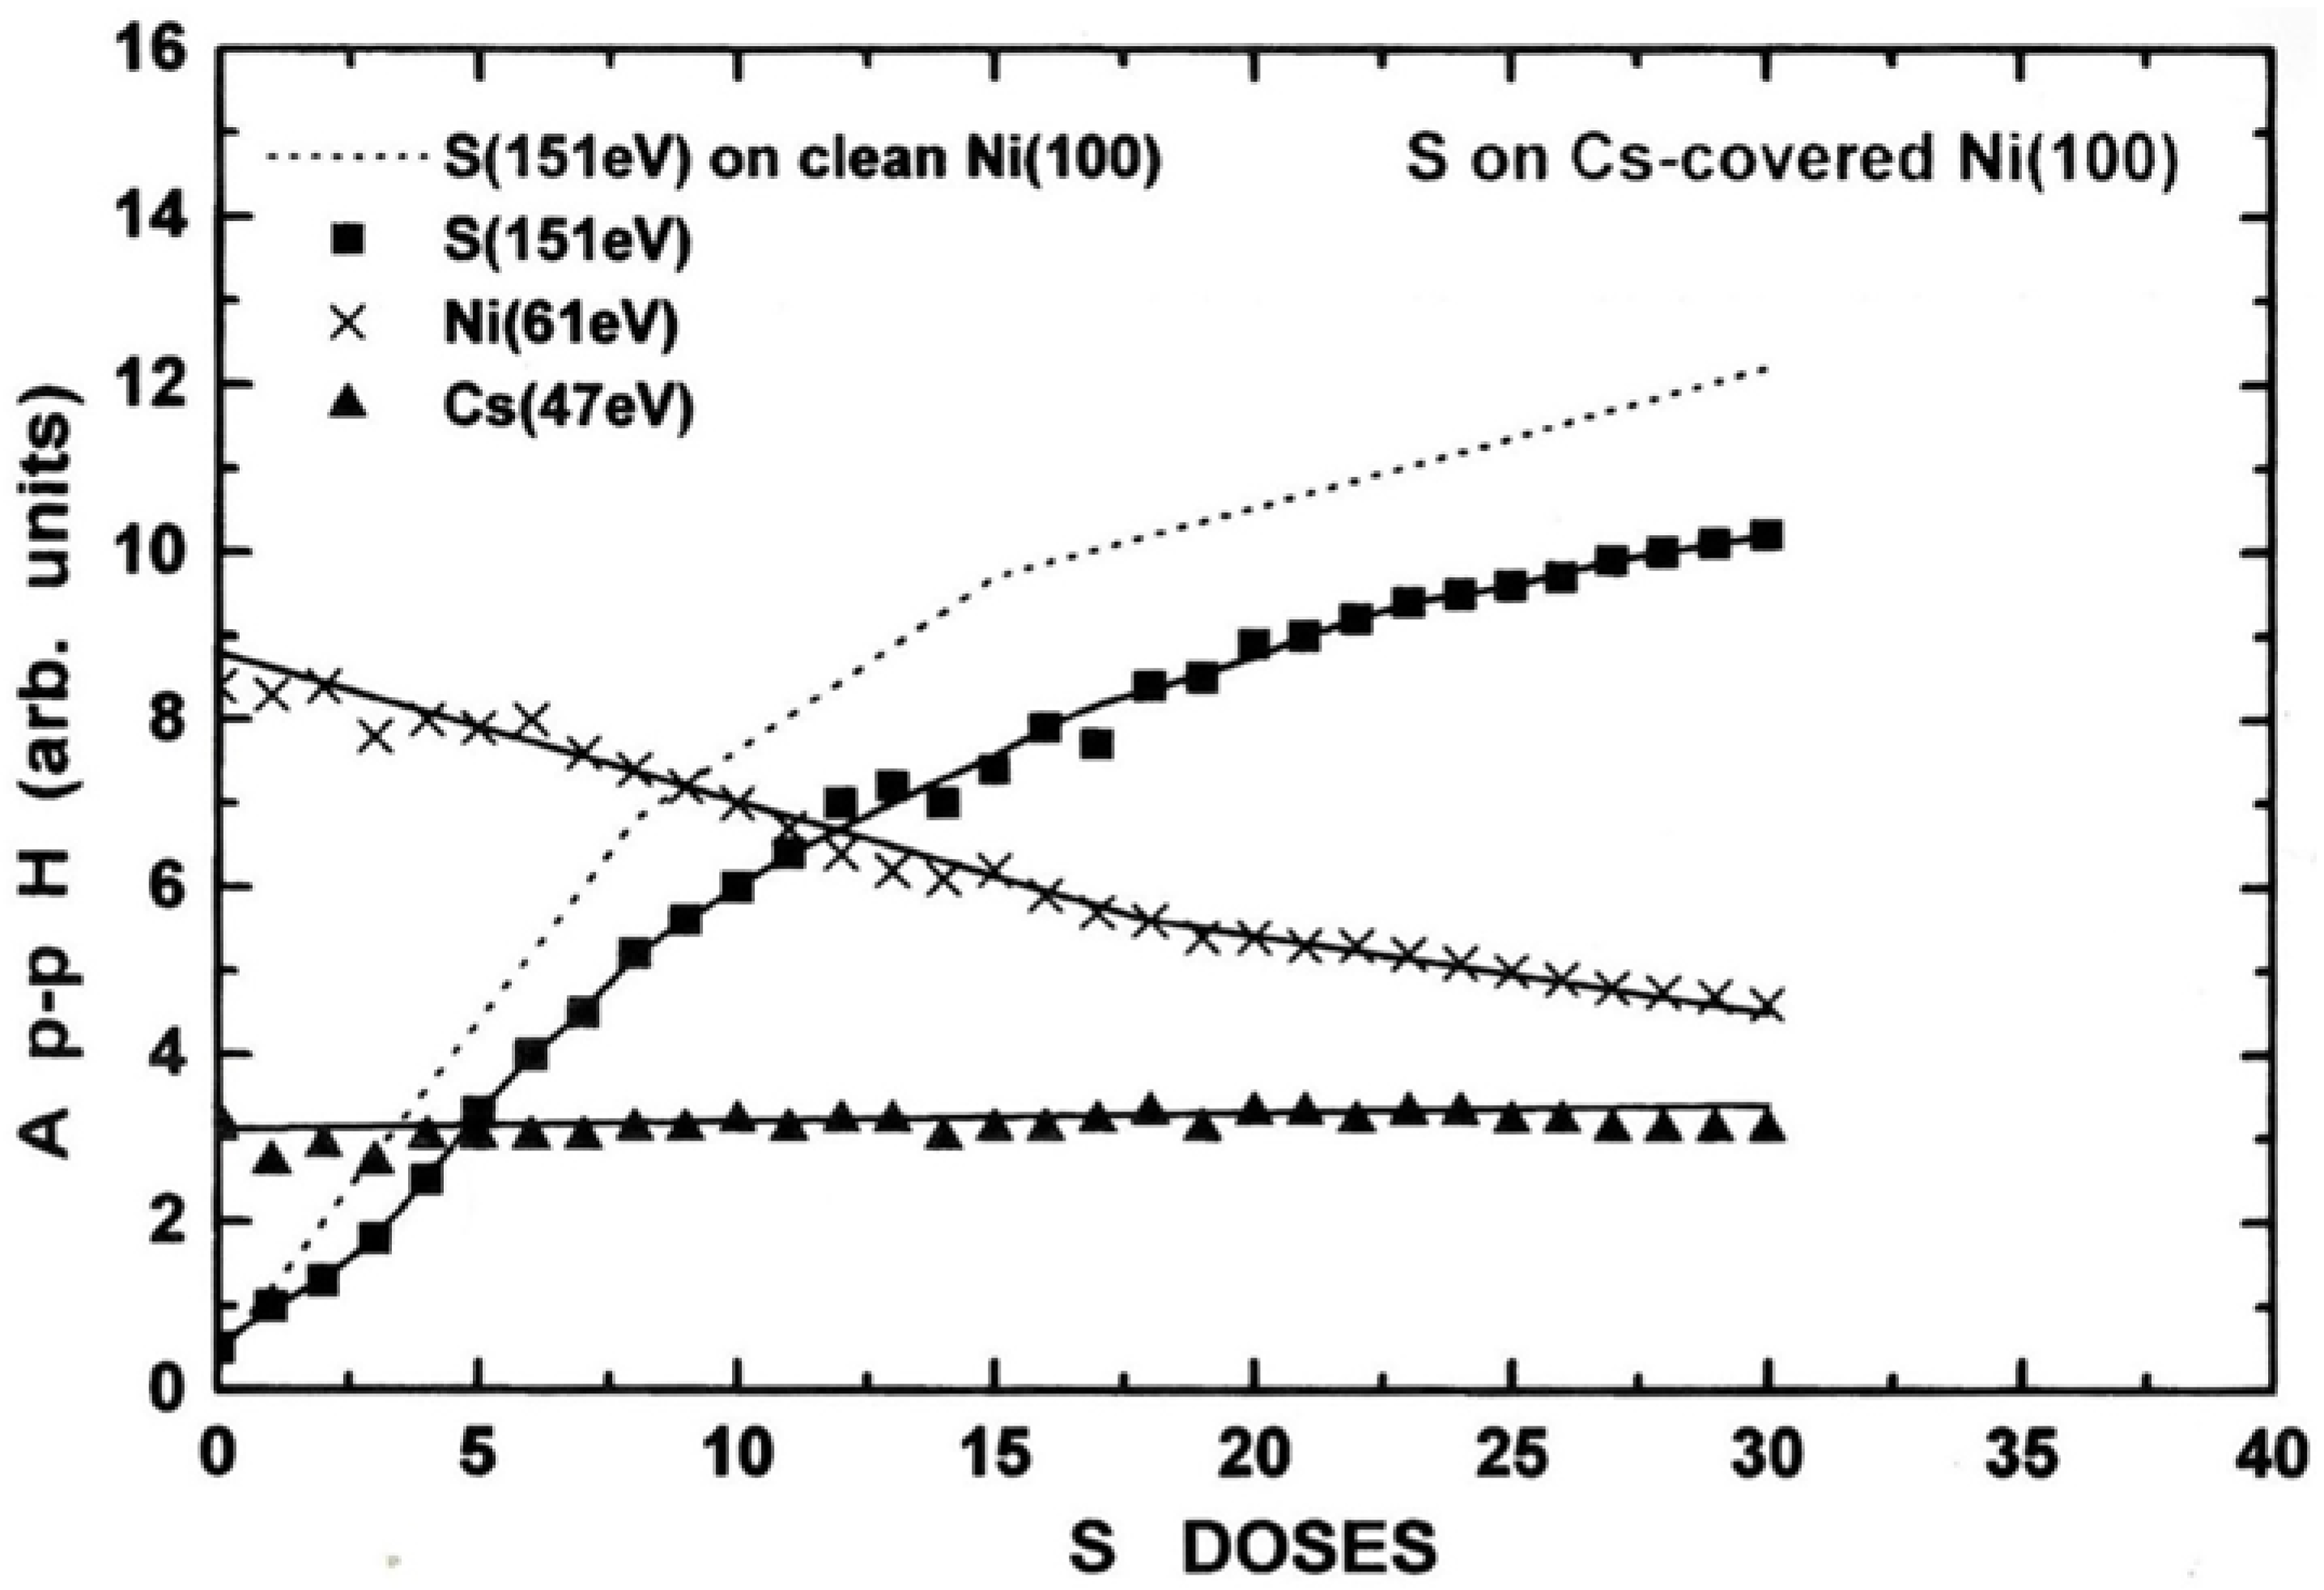
Figure 7.
The Ap-pH ratio of the of S (151 eV) / Ni (61 eV) AETLs during S deposition on the clean and the Cs(0.3 ML)/Ni(100) surface.
Figure 7.
The Ap-pH ratio of the of S (151 eV) / Ni (61 eV) AETLs during S deposition on the clean and the Cs(0.3 ML)/Ni(100) surface.
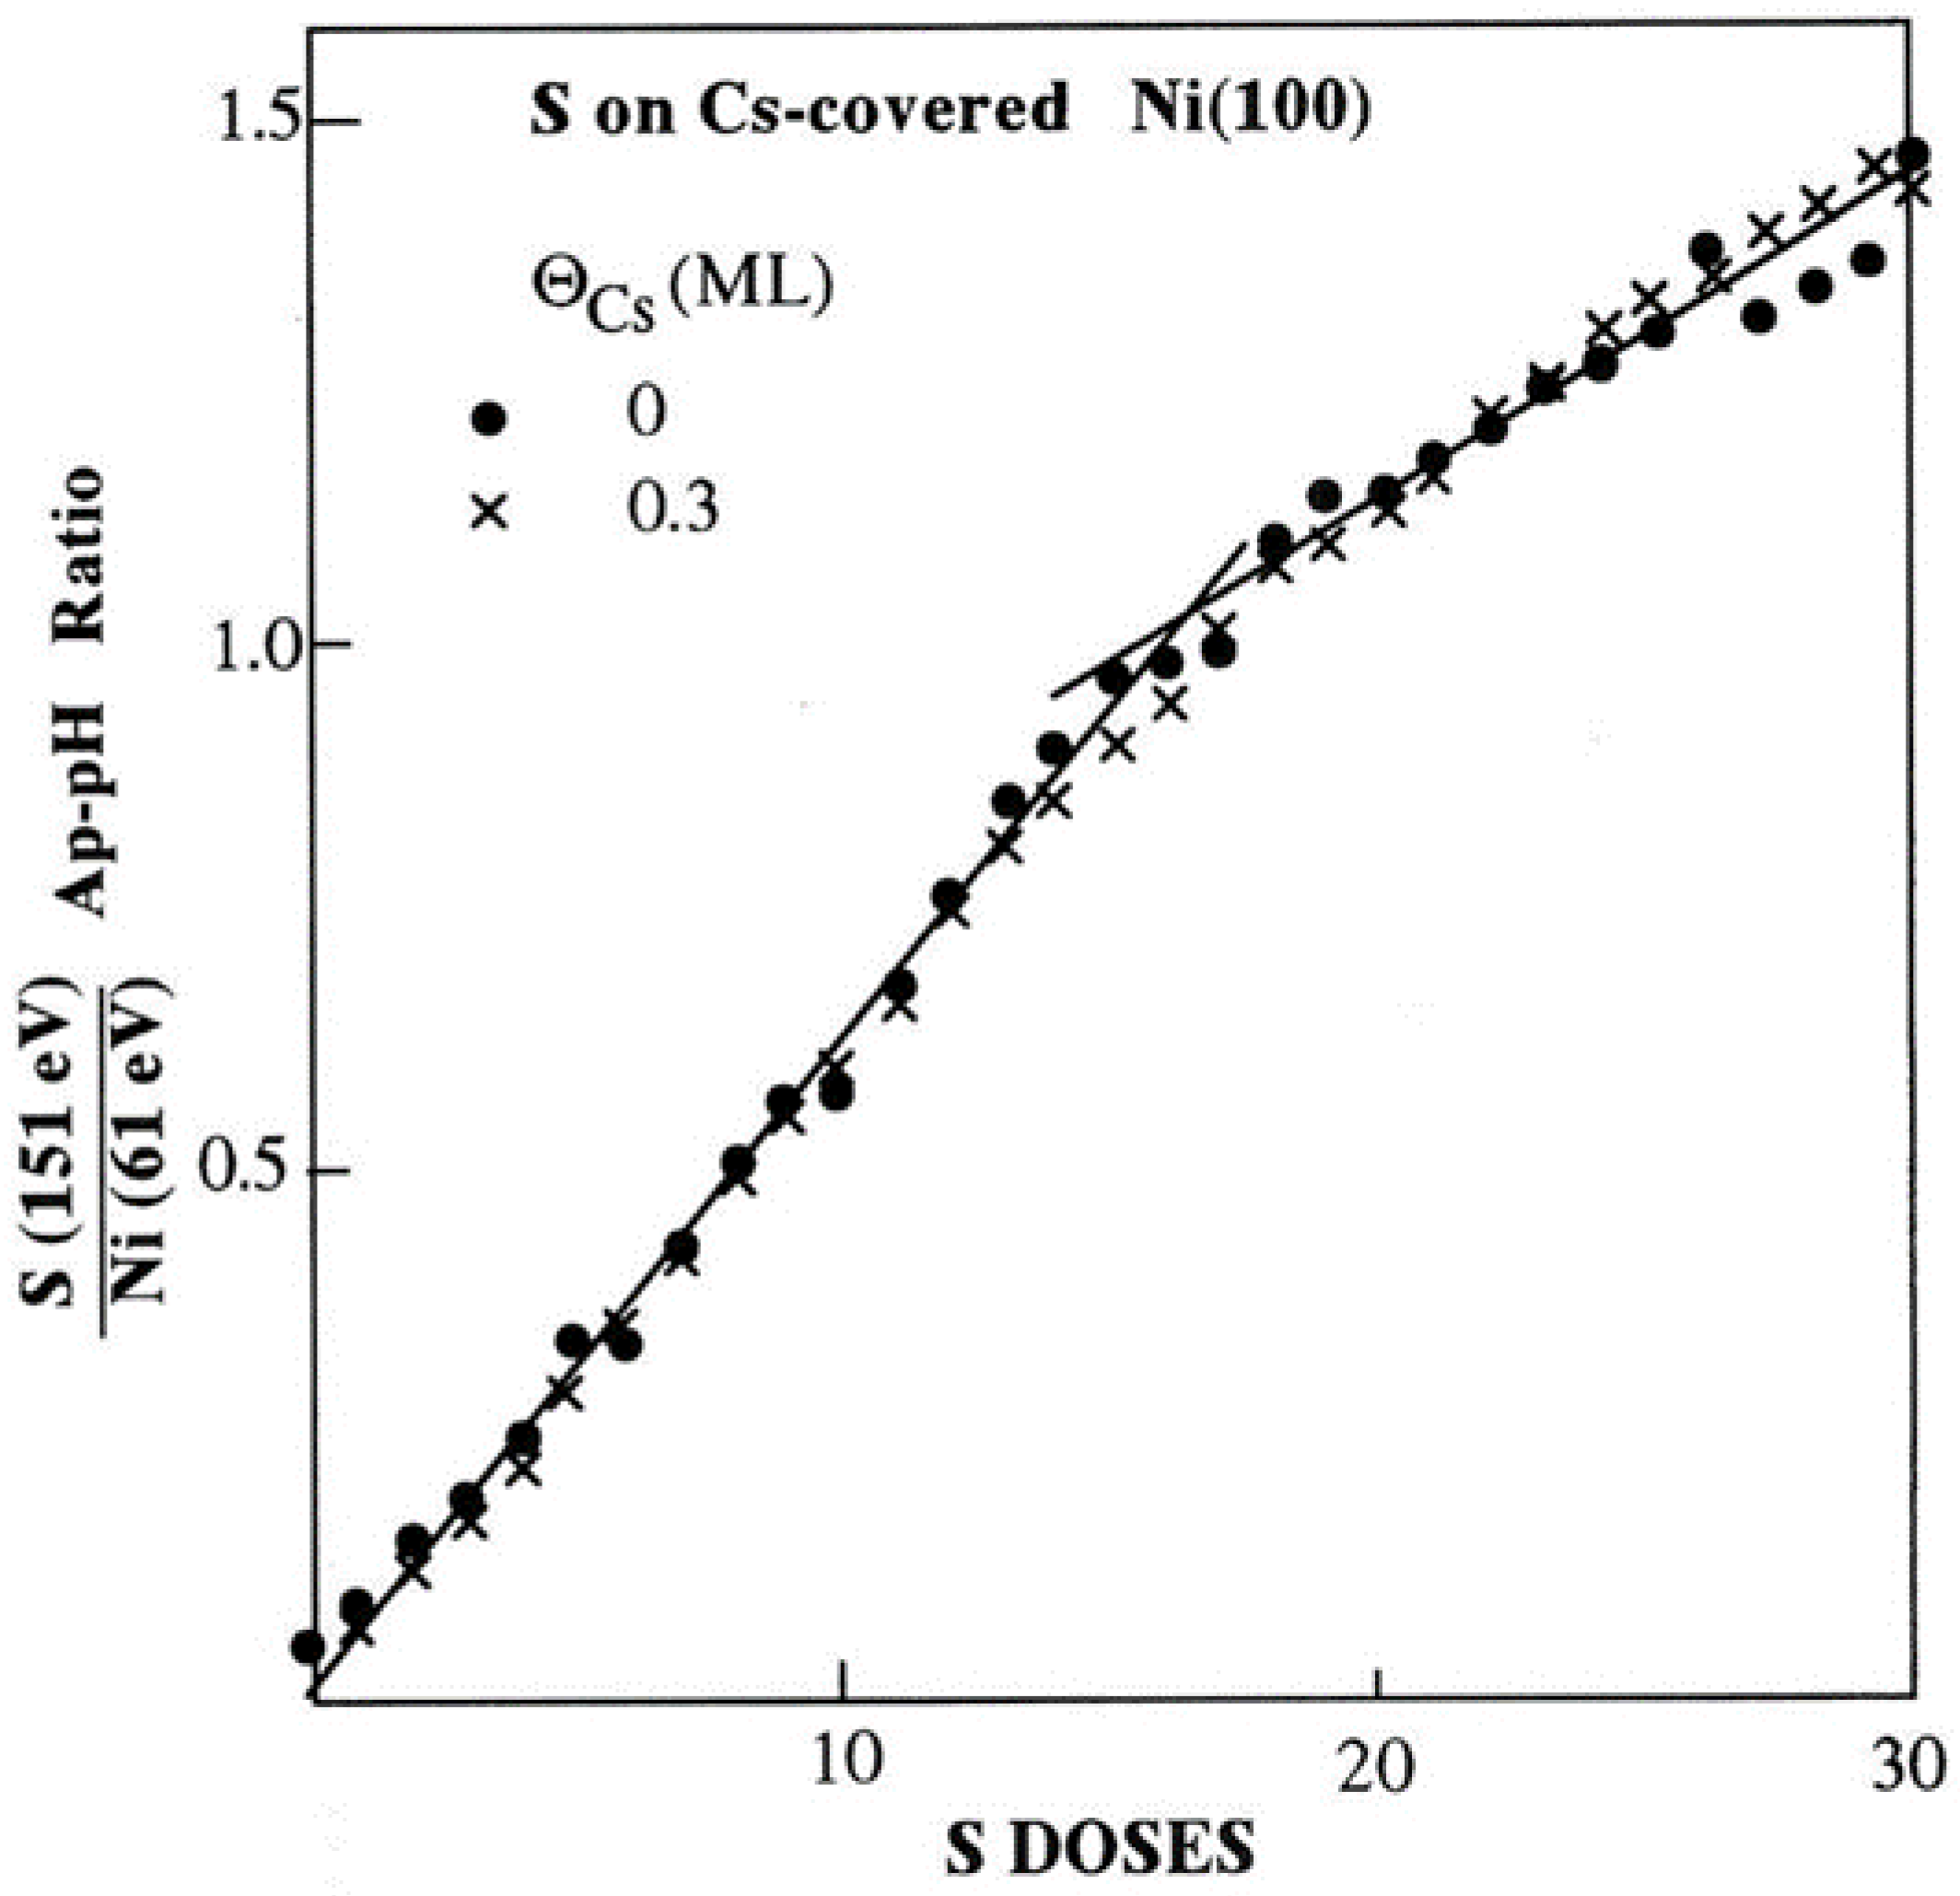
Figure 8.
The WF changes ΔΦ at RT for S adsorption on Cs-covered Ni(100) surfaces of varying Cs coverage.
Figure 8.
The WF changes ΔΦ at RT for S adsorption on Cs-covered Ni(100) surfaces of varying Cs coverage.
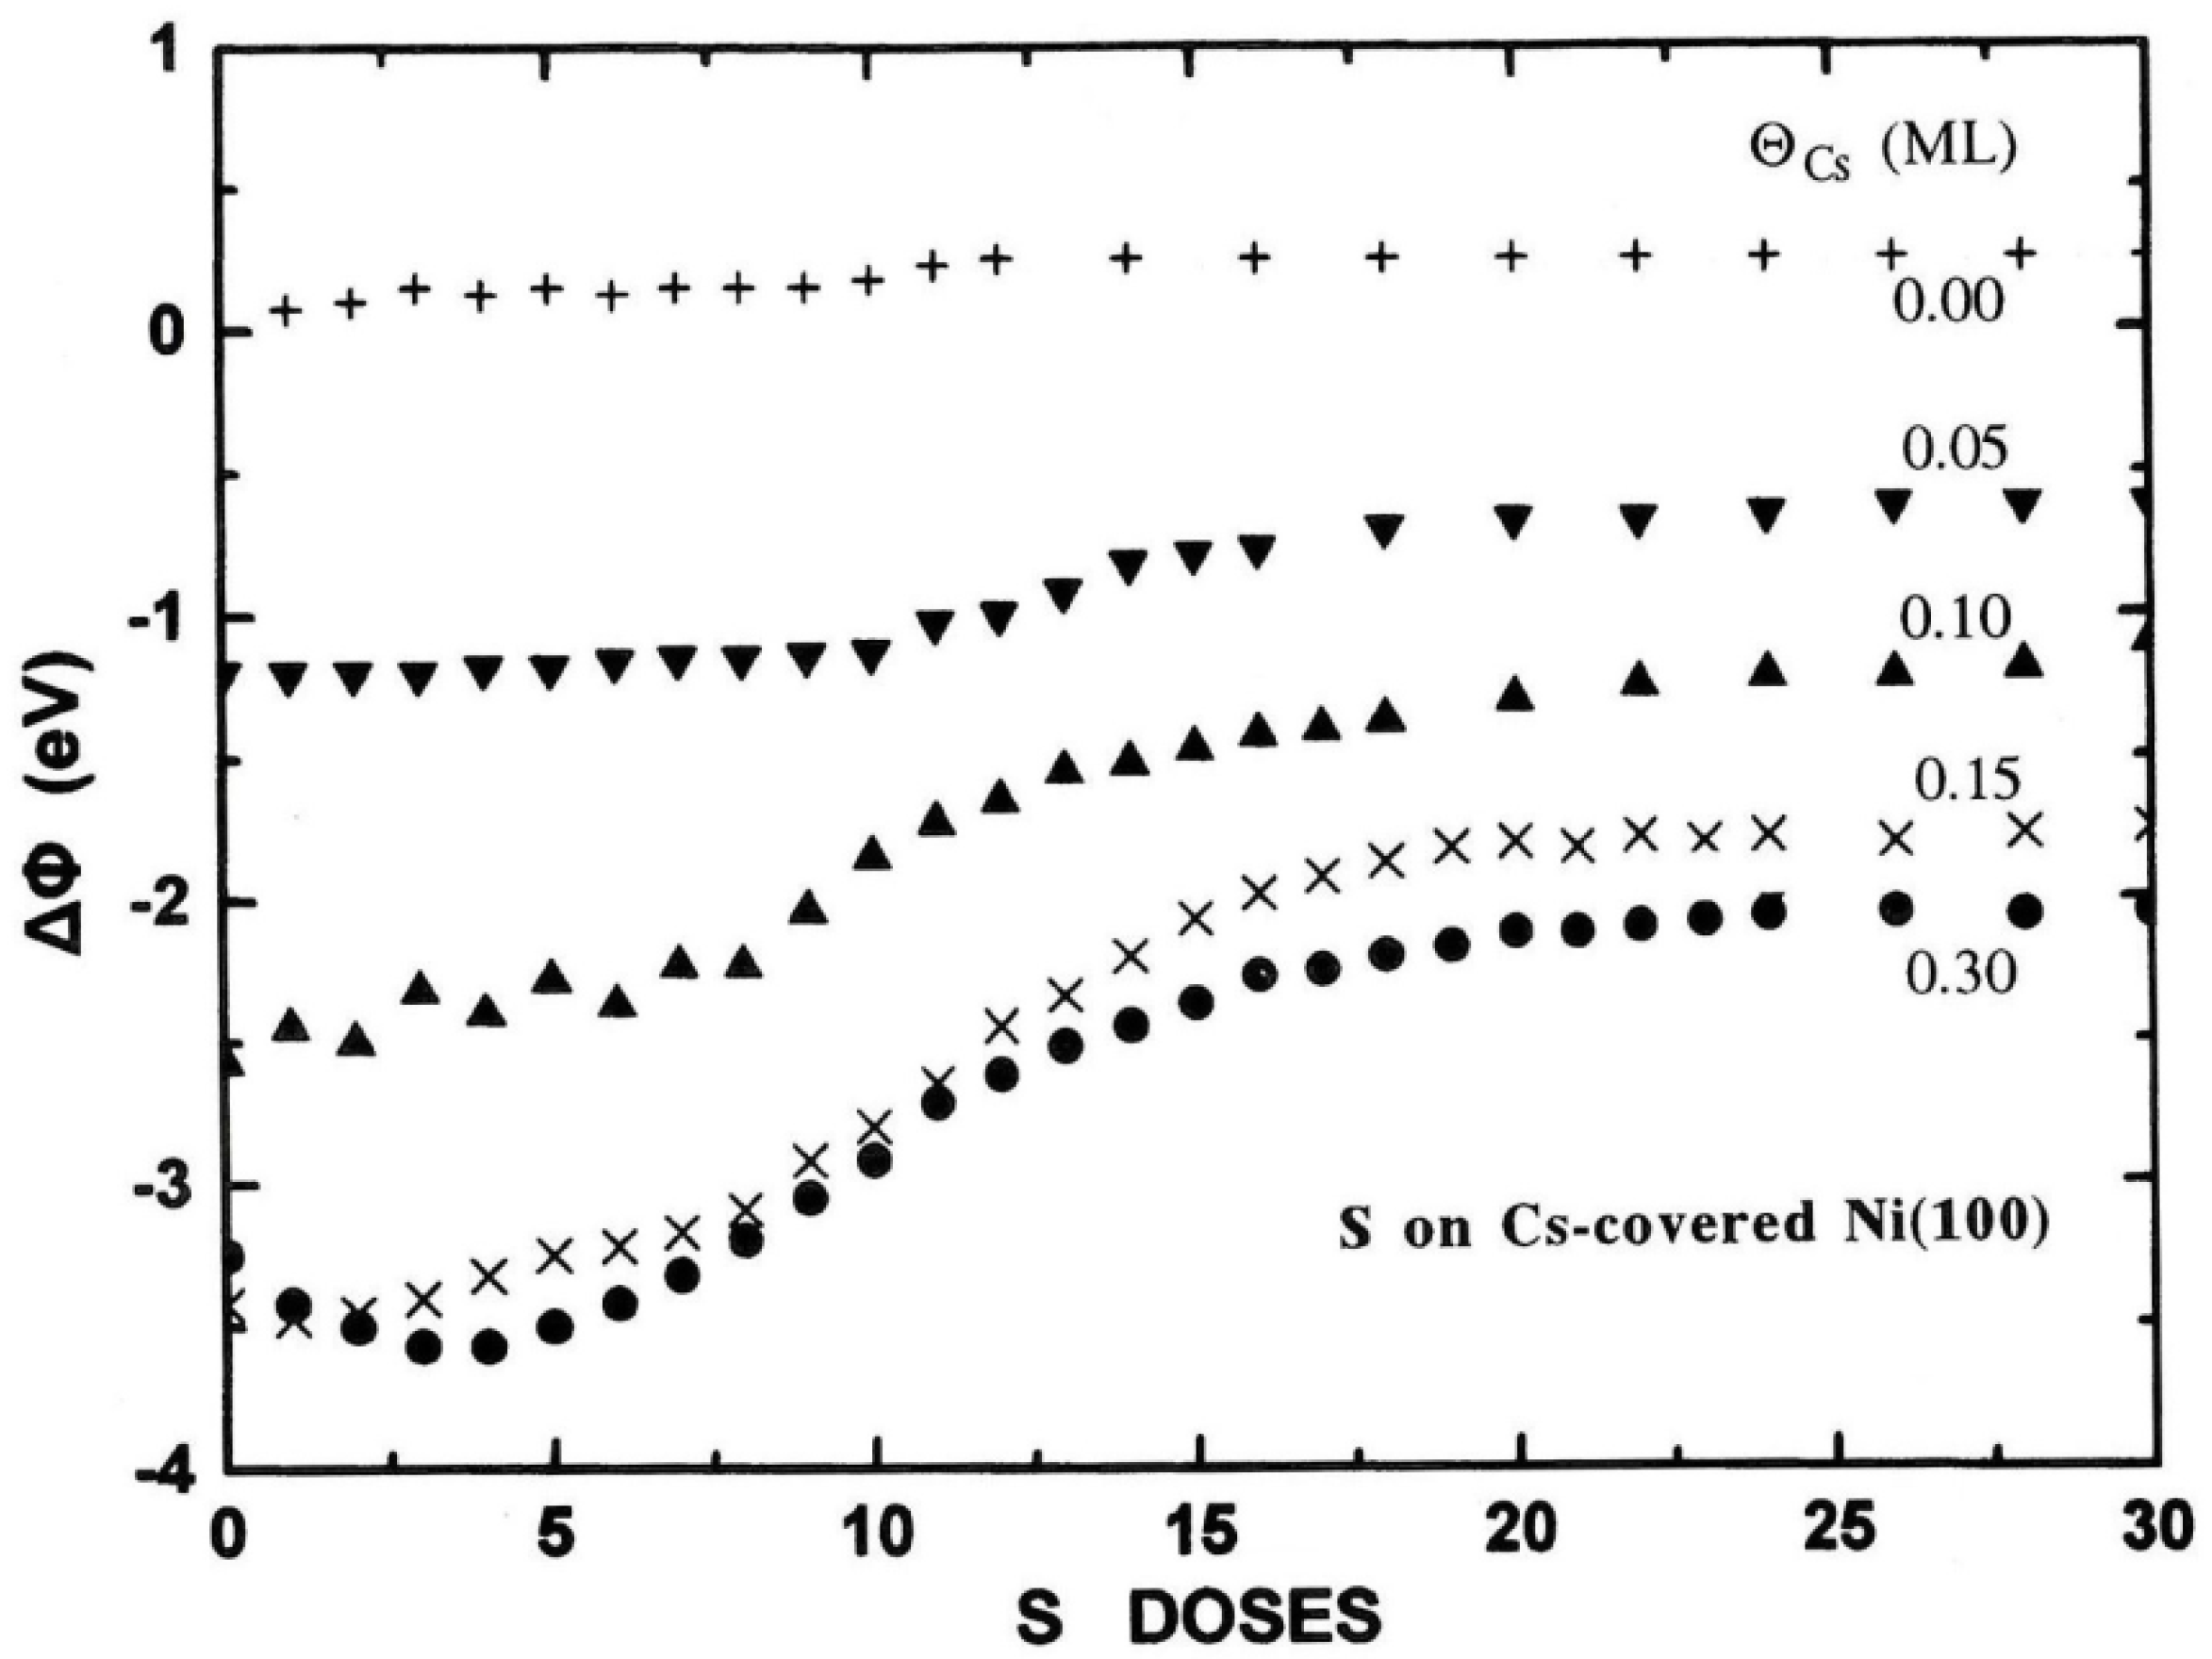
Figure 9.
The WF change ΔΦ* at RT for S (1 ML) adsorption on Cs-covered Ni(100) surfaces of varying Cs coverage. See the text for definition of ΔΦ*.
Figure 9.
The WF change ΔΦ* at RT for S (1 ML) adsorption on Cs-covered Ni(100) surfaces of varying Cs coverage. See the text for definition of ΔΦ*.
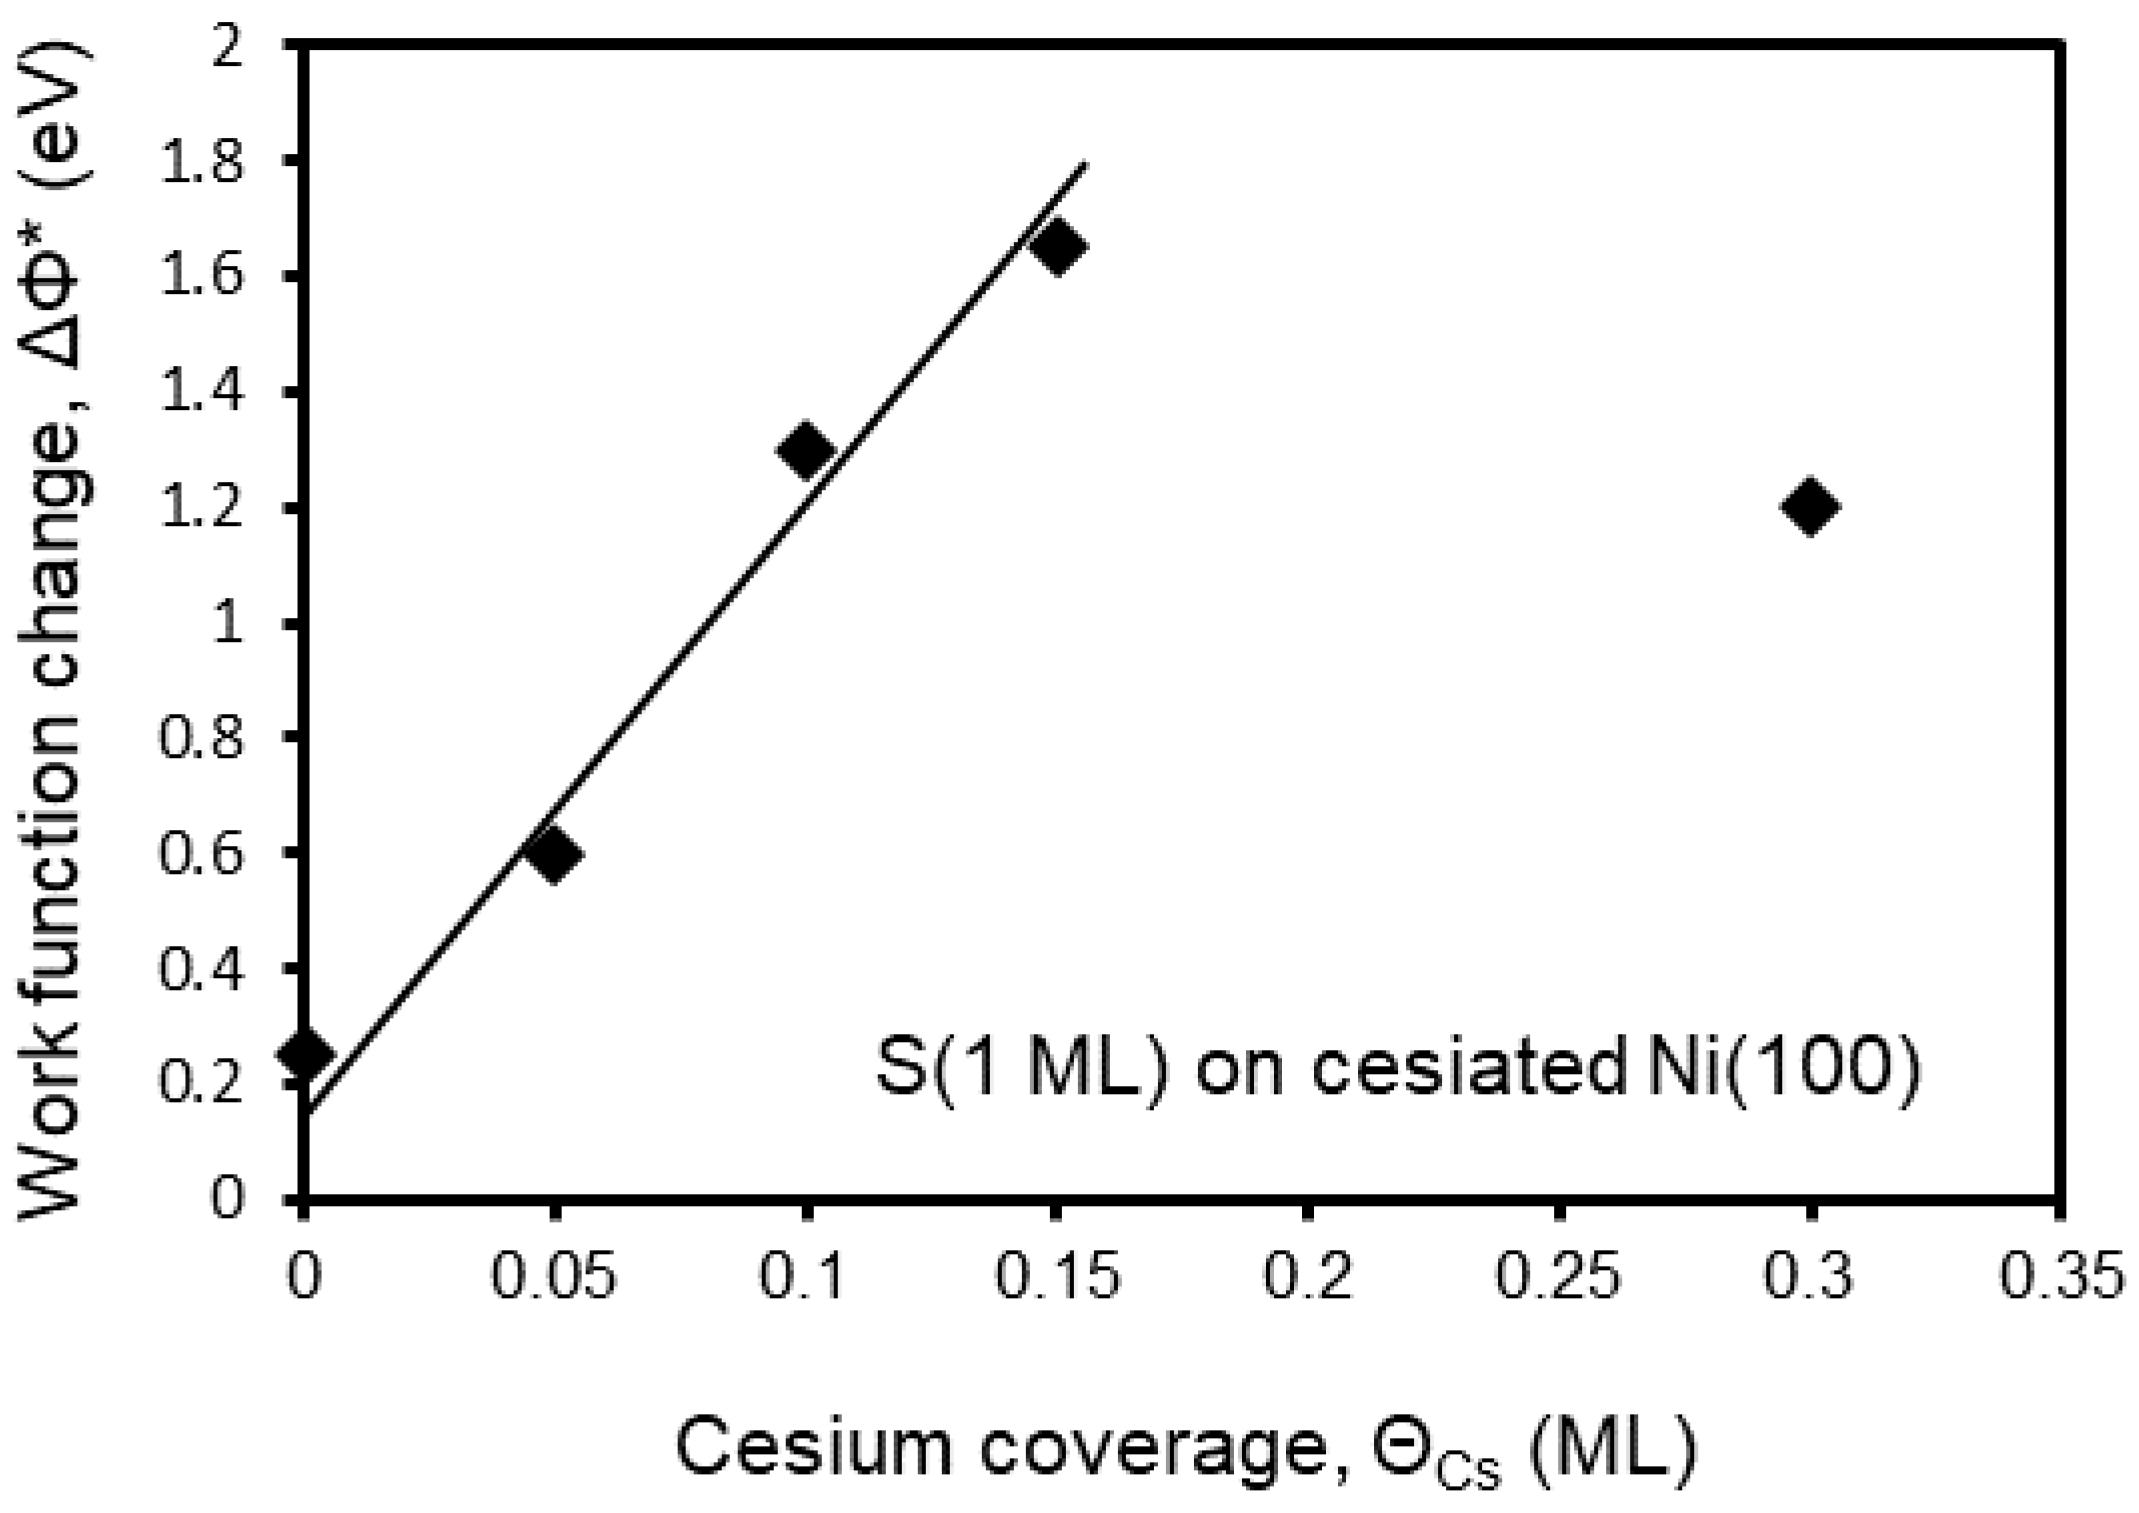

Table 1.
LEED observations are shown as a function of S and Cs coverages on the Ni(100) surface at RT and preheated S(0.5 ML)/Ni(100) surface at 1100 K. The arrows show the order of the LEED patterns’ appearance as the relative concentration of the two elements change on the surface (see text for details). The higher the background intensity of the pattern is the darker shadow in the box.
 |
Table 2.
The work function values of Φmin (eV) and Φfinal (eV) at the corresponding cesium coverages for Cs deposition on the S-covered Ni(100) surfaces. The difference of Φfinal – Φmin is also shown wherever is applied.
Table 2.
The work function values of Φmin (eV) and Φfinal (eV) at the corresponding cesium coverages for Cs deposition on the S-covered Ni(100) surfaces. The difference of Φfinal – Φmin is also shown wherever is applied.
| ΘCs (ML) (±0.004 ML) |
ΘS (ML) | Φmin (±0.02 eV) |
Φfinal (±0.02 eV) |
Φfinal – Φmin (±0.04 eV) |
| 0.180 | 0 | 1.56 | - | 0.57 |
| 0.323 | - | 2.13 | ||
| 0.158 | 0.25 | 1.78 | - | 0.39 |
| 0.251 | - | 2.17 | ||
| 0.141 | 0.40 | 1.92 | - | 0.34 |
| 0.201 | - | 2.26 | ||
| 0.122 | 0.50 | 2.24 | - | 0.13 |
| 0.182 | - | 2.37 | ||
| 0.200 | 1.00 | - | 2.57 | - |
| 0.200 | 1.50 | - | 2.57 | - |
| 2.000 | 1.00 | - | 2.19 | - |
| 3.000 | 1.70 | - | - | |
| 4.000 | - | 2.21 | - | |
| 2.000 | 1.50 | - | 2.48 | - |
| 3.000 | - | 2.10 | - | |
| 4.000 | - | 2.06 | - |
Table 3.
The calculated desorption energies of Cs for the three different desorption states β1, β2 and β3, as a function of the cesium coverages on the S(0.5ML)/Ni(100) pre-heated surface at 1100 K. The data are extracted from Figure 5.
Table 3.
The calculated desorption energies of Cs for the three different desorption states β1, β2 and β3, as a function of the cesium coverages on the S(0.5ML)/Ni(100) pre-heated surface at 1100 K. The data are extracted from Figure 5.
| Cs TDS peak | Cesium coverage ΘCs (ML) | Temperature (K) (±10 K) |
Desorption energy (eV∙atom-1) (±0.03 eV) |
| β1 | 0.05 | 1020 | 2.66 |
| 0.10 | 910 | 2.36 | |
| 0.15 | 875 | 2.27 | |
| β2 | 0.15-0.50 | 755 | 1.95 |
| 0.60 | 745 | 1.92 | |
| β3 | 0.40 | 585 | 1.50 |
| 0.50-0.60 | 555 | 1.42 |
Disclaimer/Publisher’s Note: The statements, opinions and data contained in all publications are solely those of the individual author(s) and contributor(s) and not of MDPI and/or the editor(s). MDPI and/or the editor(s) disclaim responsibility for any injury to people or property resulting from any ideas, methods, instructions or products referred to in the content. |
© 2025 by the authors. Licensee MDPI, Basel, Switzerland. This article is an open access article distributed under the terms and conditions of the Creative Commons Attribution (CC BY) license (http://creativecommons.org/licenses/by/4.0/).
Copyright: This open access article is published under a Creative Commons CC BY 4.0 license, which permit the free download, distribution, and reuse, provided that the author and preprint are cited in any reuse.


