
Submitted:
15 August 2025
Posted:
18 August 2025
You are already at the latest version
Abstract
Coastal areas are rich in diverse resources and are ideal locations for the development of the tourism industry. Thus, in coastal tourist centers, the growth rate is high, although often disorganized and unsustainable. In Mexico, tourist centers have fostered poverty belts where inhabitants live in conditions of high vulnerability due to hydro-meteorological and geological phenomena in regular and irregular settlements. Thus, various coastal tourist areas in Mexico have been impacted by these types of phenomena, causing deaths, a high number of victims, and significant economic losses. Previous studies have confirmed that tropical cyclones can trigger landslides resulting from intense rainfall; however, risk estimation models and their components are presented separately. This paper presents a model based on an IPCC framework to estimate vulnerability to tropical cyclones and landslides in the context of climate change. The integration of both disruptive phenomena and climate change was carried out in the exposure sub index. The socioeconomic situation of the inhabitants was included in the sensitivity sub index. Vulnerability was modeled for the near, medium, and distant future, with population growth projections for the towns of Cabo San Lucas and San José del Cabo, Mexico. The results indicate an estimated ~50% of the population will be highly vulnerable to these phenomena in the future. Finally, the model proved to be an effective tool for determining the combined vulnerability of both phenomena, allowing for the generation of strategies for decision-makers to implement actions focused on reducing vulnerability and building resilience.
Keywords:
tropical cyclones
; landslides
; climate change
; vulnerability
; coasts
1. Introduction
Coastal populations help nations develop by using marine resources for food, tourism, and other important industries. Therefore, it is not surprising that these population centers experience high rates of population growth, which are neither organized nor sustainable, leading to a series of socioeconomic and environmental problems [1,2]. Hydrometeorological events have a significant impact on these populations. According to data from [3], worldwide, the number of disasters related to floods and storms increased by 234% and 143%, respectively, from 1980-1999 to 2000-2019. Likewise, 72% of disasters are related to both phenomena [3]. Other weather-related disasters include extreme temperatures and droughts, representing 6% and 5% of all disasters for the same period [3]. In this sense, knowledge of weather conditions is essential for planning and conducting productive activities. Any deviation from standard patterns can affect the environment and society and, in extreme cases, lead to material losses and even human casualties.
On the other hand, mass movements are geological phenomena that are triggered by a variety of factors, including earthquakes, faulting, fracturing, rock alterations, and changes in density, and precipitation [4,5,6]. According to [3], mass movements account for less than 1% of all disasters, which is significantly lower than the figures for floods and storms. Due to their characteristics, mass movements are classified as geological phenomena, distinct from hydrometeorological phenomena. However, while mass movements are influenced by several factors, precipitation (especially intense rainfall) plays a crucial role. This is why they are often observed in areas that are vulnerable to the effects of tropical cyclones.
Mexico is no exception. Its main tourist destinations are located on the coast, e.g., Acapulco in Guerrero, Cancún in Quintana Roo, and Los Cabos in Baja California Sur. Beyond their success as tourist centers, all three cases present serious social and environmental problems. One situation shared by all three examples is their vulnerability to the impact of hydrometeorological phenomena. In the case of Quintana Roo, Hurricane Wilma in 2005 generated losses of $1.7 billion, while Hurricane Otis in Acapulco generated $15 billion of economic losses, and 560,000 residents were affected [7,8].
In Baja California Sur (BCS), Mexico, hydrometeorological disasters have historically included tropical cyclones, hurricanes, flash floods, and droughts. Due to its geographical location in a semiarid region, surrounded by the Pacific Ocean and the Gulf of California, BCS is highly vulnerable to extreme weather events. Notable examples include Hurricane Odile (2014), one of the strongest hurricanes to hit BCS, with sustained winds of 200 km/h. It caused widespread destruction in Los Cabos, La Paz, and other areas, damaging over 15,000 homes and leading to extensive power outages and infrastructure losses, totaling approximately USD 1 billion [9]. Hurricane Liza (1976) triggered catastrophic flooding in La Paz when the dam “Presa del Ejido” failed under heavy rainfall, resulting in over 600 deaths, thousands of displaced residents, and severe urban flooding, making it one of the deadliest hurricanes in the region’s history. The Hurricanes Isis (1998) and Juliette (2001) left many towns in the Los Cabos region wholly cut off after roads and highways were damaged [10,11]. Other significant storms include Hurricanes Ignacio and Marty in 2003, both Category 2, which caused severe damage and occurred less than four weeks apart [10,12]. Hurricane Jimena (2009) made landfall near Mulegé as a Category 2 storm, causing severe flooding, damaging roads, homes, and water infrastructure, and leaving several communities isolated for weeks [13]. The impact of tropical cyclones has led to the generation of storm surges, with a relatively low impact on the entity, highlighting Hurricane Juliette (2001), which caused two deaths and severely impacted the tourist resort of Cabo San Lucas, leaving it isolated from the outside world for several days and Hurricane Odile (2014) [9,14]
In addition to storm surges, the impact of tropical cyclones has generated hazards due to landslides. One of the few studies documenting the generation of landslides resulting from the impact of tropical cyclones in the state is that of [5], who quantified 419 landslides in the mountainous area south of the state because of the impact of Hurricane Juliette in 2013.
In this context, and although tropical cyclones and mass removal processes are distinct from each other, they are linked by the rainfall factor that contributes to the softening of geological strata (especially unconsolidated layers) and particularly those located in areas of moderate to high slopes [15,16]; however, on the hazard maps designed for decision-makers and society, these phenomena are represented separately, giving a lack of perception that both cannot coexist at a given time. This leads to an underestimation of the risk, vulnerability, and exposure calculations of urban and rural areas, as has occurred in municipalities of the state of Baja California Sur.
Based on data developed and presented in the Baja California Sur State Risk Atlas, a novel methodology is presented to calculate the vulnerability derived from the simultaneous occurrence of tropical cyclones and landslides in the context of climate change and with projections for the near and distant future, considering a population growth factor. The selected study areas are the towns of San José del Cabo and Cabo San Lucas, the main tourist and population centers of the Municipality of Los Cabos, which present significant problems related to the impact of tropical cyclones, urbanization in high-risk areas due to landslides, and irregular settlements, among others.
2. Materials and Methods
2.1. Study Area
The study area includes the towns of Cabo San Lucas and San José del Cabo, located in the state of Baja California Sur, northwest of Mexico, and in the municipality of Los Cabos. Both cities are the most important in the municipality due to the intense tourism industry and economic growth. According to data from [17], the municipal population increased from 238,387 inhabitants in 2010 to 351,111 in 2020, representing an increment of 47% (Figure 1). Population growth is highly related to the development of the tourism industry. According to [17], tourist arrivals increased from 2,290,000 in 2017 to 3,028,300 in 2023. Both increases have occurred in a disorganized and poorly planned manner, which has generated severe social, environmental, and socio-political issues [18,19,20,21]. Perhaps the clearest example of this situation is the development of irregular human settlements, conformed by illegally invaded areas characterized with low quality of life due to the lack of water supply, drainage, garbage collection service, and the fact that the houses are built with waste material. The crime rate and drug use are high. A large majority of these settlements occupy high-risk areas.
2.2. Climate Change Projections
Since 1988, the Intergovernmental Panel on Climate Change (IPCC) has accumulated evidence that climate change is unequivocal. The impact of humans on nature has been such that the UN Secretary-General warned that the era of global warming was over, beginning the era of “global boiling.” If current emissions rates continue, largely due to the differential increase in consumption patterns between rich and poor and the persistence of polluting practices, the impacts of climate change will become more acute, resulting in droughts, frost, loss of glaciers and melting of the polar ice caps, ocean warming and acidification, rising sea levels and certainly more intense and recurrent hydrometeorological events.
According to the IPCC Sixth Assessment Report [22], humanity still has a window of opportunity to have a habitable planet in the future, reversing the serious threats that climate change represents to human and planetary well-being and health. These threats, however, continue to worsen. Hurricane Otis, which hit the coasts of Acapulco and five other municipalities in Guerrero on October 25, 2023, illustrates that this is indeed happening, so this unfortunate disaster is undoubtedly a "late lesson" that, beyond adding to others that preceded it, seems to reveal the arrival of the impacts of a new phase of the climate crisis. The favorable conditions for the formation of this type of phenomenon are largely due to the intensification of the El Niño-Southern Oscillation – ENSO (we are in conditions of strengthening of the El Niño phase, which translates into an increase in cyclonic activity in the Pacific and its decrease in the Atlantic). It is also due to the increase in ocean temperatures, with records since March 2023, which have expanded the areas or “pools” of warm water. Likewise, it has been indicated that the presence of fresh water on the surface of the ocean, a product of rainfall, could change the salinity and surface temperature, causing Otis to feed on warm water at greater depth, thus increasing the volume of water extracted and therefore its strength.
Air Temperature
The base values (average of the years 1970-2000, WorldClim 2) [23] or values at “current conditions” indicate that for the State of Baja California Sur the minimum, maximum, and average values of the variable Minimum Temperature of the coldest month (Bio6) are 3.59°C, 14.1°C and 8.37°C, respectively. For the variable Maximum Temperature of the warmest month (Bio5), the minimum, maximum, and average values are 22.2°C, 39.79°C, and 35.22°C, respectively. On the other hand, the projected future values for the Bio6 variable indicate that it could reach a minimum value of up to 7.5°C with the Australian Community Climate and Earth System Simulator (ACCESS–CM2) general circulation model (GCM) with an Ssp5 8.5 scenario by 2070, while the highest value projected for the Bio5 variable could be up to 44°C with the ACCESS–CM2 GCM with the Ssp5 8.5 scenario by 2070 [24].
Regarding the temperature on the sea surface surrounding Baja California Sur, the base values (average of the years 2000-2020) obtained from the Bio-ORACLE ERDDAP database [25,26] show an average value of 22.59°C. While for the Ssp2-4.5 and Ssp5-8.5 scenarios projected to the year 2100, the average values could be 24.23°C and 26.06°C, respectively.
Precipitation
The base values (average of the years 1970-2000, WorldClim 2) [23] or values at “current conditions” show that for the State of Baja California Sur the minimum, maximum, and average values of the variable Precipitation of the Driest Month (Bio14) are 0 mm, 3 mm and 0.15 mm, respectively. While for the variable Precipitation of the Wettest Month (Bio13) the minimum, maximum, and average values are 11 mm, 224 mm, and 51.42 mm, respectively. However, the highest value projected for the future for the Bio13 variable is 394 mm with the ACCESS–CM2 GCM for the Ssp2 4.5 scenario by 2050 [24]. On the other hand, the future projections of the European Research Consortium EC-Earth GCM, the Max Planck Institute Earth System Model, and ACCESS–CM2 for the Bio14 variable in its minimum, maximum, and average values could be zero [24,27].
Sea Level Rise
The possible total sea level increase projected in the future with the Sea Level Projection Tool of the Sixth Assessment Report of the Intergovernmental Panel on Climate Change (IPCC) (https://sealevel.nasa.gov/) for the City of La Paz indicates that the sea level could increase on average 0.23 m and 0.26 m in the Ssp2-4.5 and Ssp5-8.5 scenarios by 2050, respectively. By 2100, the average sea level rise could be 0.62 m and 0.82 m for the Ssp2-4.5 and Ssp5-8.5 scenarios, respectively.
These scenarios reflect more extreme and contrasting climate conditions for the near future and that the object of study, both in meteorology and climate science, is rapidly changing, which leads to the difficulty of predicting this type of phenomenon with current models [28].
2.3. Present and Future Vulnerability Modeling
To determine vulnerability to hydrometeorological and landslide events in the context of climate change, the reference framework proposed by the IPCC [29] was used, in which vulnerability is the result of the interaction between exposure, sensitivity, and resilience capacity.
Vulnerability = Exposure + Sensitivity – Adaptation Capacity
In this context, exposure represents “The nature and degree to which a system is exposed to significant climatic variations”, while sensitivity is defined as “the degree to which a system is affected, either from adversely or beneficially from a climate-related stimulus”, and finally adaptation is defined as “The ability of a system to adjust to climate change, to moderate potential damage, take advantage of opportunities or minimize consequences” [29,30]. This approach has been used recently for estimating vulnerability in different contexts: Ecology [31], coastal areas [32], aquifers and seawater intrusion [20].
Regarding human settlements in urban areas, the exposure would represent an urbanized area impacted by hydrometeorological phenomena with specific frequency and intensity. The greater the frequency and intensity of the events, the greater the exposure, and vice versa. Cyclonic events can present three highly dangerous sub-events: cyclonic winds, intense rainfall, and sea level rise due to storm surges. Intense rainfall can cause flooding in situ or from increased flow in rivers and streams, which overflow into the surrounding floodplains.
In the case of mass remotion processes, various factors can trigger instability and eventual falls, landslides, and/or flows. There is consensus that the slope, the effect of water from rain and/or runoffs, together with lithology, and land use, among others, influence its formation. [33,35]. Around the study area, rainfall-triggered landslides have been recorded during the impact of tropical cyclones [5], an indicator of the relation between hydrometeorological and geological hazards.
With this context, exposure was calculated by the integration of a flood hazard map (FHM), a storm surge hazard map (SRHM), and a slope susceptibility map (SSM), obtained from the Risk Atlas for the state of Baja California Sur, which is a geospatial instrument for consulting hydrometeorological, geological and anthropogenic risks and hazards throughout the state. Quantitative values were defined from 1 to 5 (very low to very high hazard) for each set of data, multiplied by a weight of 1, 1, and 0.7 for FHM, SRHM, and SSM, respectively. Using a map algebra algorithm implemented in Qgis 3.22.16, the three maps were summed, and the result was scaled in a range of 1 to 5, obtaining the EHE index.
The sensitivity index (SEN) was calculated using seven indicators from the National Housing Inventory published by INEGI. The database has a resolution at block level for each central city in the state. The indicators used were Distance to hospitals (20km), distance to the closest airport or a runway (20km), freshwater coverage, sewage coverage, telecommunications, and housing construction (Table 1).
Having defined the value of each indicator for each block, these are added together to obtain the sensitivity value, which goes on a scale from 0 to 6, with 6 being a high sensitivity and 0 being the least sensitivity.
In the case of the adaptive capacity and for this investigation, we decided to define a constant value of zero.
The calculation of the vulnerability index for each block was obtained in Qgis 3.22.16 and a map algebra algorithm using equation 2:
Vulnerability=EHE + SEN - ADCA
In the case of climate change projections, the calculation is complicated because it is challenging to determine urban expansion from a geospatial context and the evolution of the indicators included in the sensitivity index since they depend on economic and political factors. On the other hand, although there is a level of uncertainty, scenarios of the variation of hydrometeorological phenomena in a regional context are available (Gutiérrez et al. 2021). In this context, the P95 values (extreme events) of the “Maximum 5-day precipitation” (RX5day) parameter obtained from the IPCC WGI Interactive Atlas [36] were used for RCP 8.5 and the near (2040), medium (2060), and long-term (2100). The obtained increments (10.1, 14.3, and 24.2) were applied to the FHM indicator of the EHE index, and the vulnerability was calculated with equation (2).
Once vulnerability was calculated for the different scenarios, geospatial calculations were performed in QGIS to determine the number of blocks classified as having high to very high vulnerability. To obtain data on the impacted population, it was necessary to estimate the average number of inhabitants per block using cartography and data from the 2020 population census provided by INEGI population census, resulting in an average of 56 inhabitants per block. This value was multiplied by the number of blocks identified to determine the vulnerable population under the above-mentioned scenarios and its percentage relative to the total population obtained from INEGI population census. However, this calculation yielded values assuming zero population growth. Therefore, it was necessary to perform a population projection for the defined periods using a growth rate of 4% every 5 years, as provided by INEGI population census. Subsequently, the estimate was recalculated for the simulated periods using the percentages of vulnerable populations.
3. Results
3.1. Current Vulnerability to Tropical Cyclones and Landslides
As previously described, the region of Los Cabos is exposed to the impact of extreme hydrometeorological events, especially tropical storms and related landslides. Considering current conditions, the exposure index indicates that 121.27 km2 of Los Cabos urban and rural areas has a high to very high exposure (Figure 2). Of this value, the majority represents unimpacted creeks, streams, and undeveloped land, however, a significant percentage represents urban areas including Caribe-Caribe Bajo (1), Lagunitas (2), Gastelum (3), Las Palmas-Mesa Colorada (4), Downtown (5), Cangrejos (6), 4 de Marzo (7) in Cabo San Lucas, and Lomas de Guaymitas (A), Vado Santa Rosa (B), Downtown (C), Vado Puerto Nuevo (D) and Vado La Ballena (E) in San José del Cabo (Figure 2). It is worth highlighting that the areas of Caribe-Caribe Bajo, Lagunitas, La Palma Mesa Colorada, Vado Santa Rosa, and Vado La Ballena are considered irregular settlements, which is why they lack adequately built housing, garbage collection services, drainage services, and high crime rates. In this context, 26.4% of the blocks between both cities have a high to very high exposure
Regarding the Sensitivity Index, approximately 165,200 people living in 2,950 blocks are found to be low-sensitivity, 145,152 people living in 2,592 blocks are found to be moderately sensitive, and finally, 52,976 people living in 946 blocks are found to be highly sensitive. In this regard, 17% of the population in both localities is highly sensitive, including Las Palmas-Mesa Colorada, Lagunitas, Caribe-Caribe Bajo, Vado Santa Rosa, Vado La Ballena.
In terms of vulnerability, it was determined that 5.51% of the blocks in both populations exhibit high or very high vulnerability, while the remaining 94.5% range from moderate to very low vulnerability. Currently, the areas with the highest vulnerability in Cabo San Lucas are the neighborhoods of Caribe-Caribe Bajo (1), Lagunitas (2), Gastelum (3), and Las Palmas-Mesa Colorada (4). Blocks of high vulnerability are observed throughout the urban area. In the case of the population of San José del Cabo, the most vulnerable areas are located along the margins of the Vado Santa Rosa (B), particular blocks of San José Viejo (C), and Vado Puerto Nuevo (D), Vado y Predio La Ballena (E), as well as their main branches. An estimated 74,786 inhabitants have a high vulnerability to tropical cyclones and landslides.
3.2. Future Scenarios of Vulnerability to Tropical Cyclones and Landslides
In the future, according to climate change scenarios, the exposed area would increase to 185.02 km², 663.11 km², and 956.74 km² for 2040, 2060, and 2100, respectively. As can be seen in Figure 2, the comparison between the exposure in 2025 and 2100 indicates that most of the increase occurs in unpopulated and mountainous areas, so in terms of blocks the exposed areas evolve from 26.4 (recent) to 39.51% for 2100, representing an increase of 12.75%. For the periods 2040-2060 and 2060-2100, the increases were 6.69% and 9.72%, respectively. Of the three periods, the one that registered the smallest increase within urban areas was 2040-2060, while the period 2025-2040 saw the largest increase. Considering both urban and rural areas, the period with the greatest increase was 2060-2100.
In terms of vulnerability, the number of blocks classified as highly to very highly vulnerable by 2040 will reach 5.9% of the total number of blocks, representing a 0.39% increase compared to the recent vulnerability. By 2060, the number of vulnerable blocks will increase to 6.3%, an increase of 0.79%. Finally, by 2100, the number of vulnerable blocks will increase to 6.85%, 1.35% higher than the recent scenario. The areas where there is greater vulnerability with respect to 2025 in Cabo San Lucas are: Caribbean-Lower Caribbean (1), Lagunitas (2), Gastelum (3), Las Palmas-Mesa Colorada (4), Downtown (5), Cangrejos (6), March 4 (7), Tourist Zone (9) and the Cabo San Lucas Airport, while in San José del Cabo the following stand out: Vado Santa Rosa (A-B), Downtown and touristic area (C), and Vado Puerto Nuevo (D), Vado, Predio La Ballena (E), San José Viejo (F), Puerto Los Cabos (G), and El Zacatal (H) (Figure 3).
In terms of population and using an average value of 57 people per block based on INEGI (2020) data, the current scenario shows approximately 133,266 people residing in areas of high-very high vulnerability. This number increases to 142,956 by 2040, 143,070 by 2060, and 165,642 by 2100. Applying a correction factor for population growth the estimated vulnerable people increase to 250,386 inhabitants for 2100 (Table 2).
4. Discussion
4.1. Model Limitations
The presented model is built on official data from INEGI Population Census. INEGI, the entity responsible for statistics in Mexico, conducts partial population censuses every 5 years and complete censuses every 10 years. In this regard, population growth projections and indicators for 2025 and further, will need to be calibrated once the official census results are published. The estimation of the impacted Population is based on an average number of inhabitants per block, which stems from the lack of updated data and significant uncertainty regarding areas where new human settlements may eventually be established. Consequently, the corrected values of the vulnerable population should be considered as approximations with high uncertainty, given that population dynamics in tourist areas (both in quantity and geographic distribution) are highly complex phenomena. These dynamics involve local, national, and international factors and economic, sociocultural, and political dimensions. Therefore, while total values of potentially vulnerable populations are estimated, the model does not account for the geographic expansion of regular and irregular settlements, which could alter the presented values.
4.2. The Construction of Vulnerability in the Municipality of Los Cabos
The towns of San José del Cabo and Cabo San Lucas began their boom as tourist destinations in the 1970s, when the National Tourism Fund (FONATUR) defined both towns as Integrated Planned Centers (IPCs), centers of organized tourism development [19]. IPCs emerge from urban planning theories designed for industrial centers, where neighboring development centers emerge from an industrial development center. Thus, by 1990, the populations of Cabo San Lucas and San José del Cabo reached 16,059 and 16,571, respectively. This figure practically doubled by 1995 and tripled by 2000 [19]. FONATUR’s strategy was successful in promoting the tourism industry, but it promoted negative externalities such as low quality of life for the population, social pressure on the environment, and speculation of goods [19,37].
Even with the creation of the Los Cabos Municipal Planning Institute (IMPLAN), an agency focused on coordinating urban planning actions to promote orderly and sustainable growth, population centers continue to grow rapidly and in a disorganized manner, and social problems are worsening. Data presented by the Los Cabos Municipal Government suggests the existence of 13 irregular settlements, home to approximately 42,004 inhabitants in 11,283 homes and an estimated 39,000 people "exposed to flooding, flows, and storm surges" [38]. Additionally, the wind factor must be considered, which significantly affects urban areas regardless of their regularity status. A prime example of this was Hurricane Odile in 2014, where 5,932 homes throughout the Municipality and the state were affected, in addition to damage to shopping centers, buildings, airports, hotels, and marinas, to name a few [9].
A couple of years after data were collected for this publication, and based on recent visits, a considerable expansion of irregular settlements located in riverbeds and streams has been detected. These settlements do not appear in records, population censuses, or official maps, a clear indication that the problem continues and is worsening.
4.3. Comparison with Other Touristic Related Cities in Mexico
Los Cabos tourism corridor demonstrates distinctive vulnerability characteristics relative to other Mexican destinations, particularly regarding water resource constraints, heat extremes, and flash flood hazards associated with its arid coastal context. However, it shares fundamental challenges with other regions, including coastal infrastructure exposure, uneven adaptive capacity, distribution, and implementation gaps between risk assessment and practical resilience measures.
Climate change projections amplify existing vulnerability patterns across all major Mexican tourism destinations, with particularly acute implications for coastal exposure, precipitation extremes, and thermal comfort thresholds. The capacity to respond to these intensifying challenges varies substantially across destinations, reflecting differential institutional frameworks, economic resources, and governance structures that significantly influence ultimate vulnerability outcomes.
The tourism corridor extending from Puerto Vallarta (Jalisco) to Nuevo Vallarta and Punta Mita (Nayarit) presents distinctive vulnerability characteristics shaped by its mountainous coastal topography and seasonal precipitation patterns. Landslide susceptibility represents a defining vulnerability factor, with 38% of tourism infrastructure in Puerto Vallarta constructed on slopes exceeding 15 degrees [39,40]
The complex watershed dynamics of the Ameca and Banderas Bay region create compound flood hazards during extreme precipitation events, as documented during Hurricane Kenna (2002) and Hurricane Patricia (2015). Despite making landfall as a weakened system, it generated precipitation exceeding 300mm in 24 hours across the Puerto Vallarta metropolitan area, triggering widespread flash flooding with disproportionate impacts on informal settlements and housing tourism sector workers [40,41].
Tourism seasonality creates temporal vulnerability patterns that are particularly relevant to emergency management. In destinations with overlapping hurricane and peak tourism season (particularly the Pacific coast), visitor populations with limited local knowledge and hazard awareness create distinctive emergency response challenges [42]. The Los Cabos corridor experiences this temporal coincidence, with peak hurricane activity and substantial international visitation occurring from August to October.
Infrastructure interdependence represents another cross-cutting vulnerability factor, with cascading failure potential, particularly in water-energy nexus systems. [9] documented how power outages during Hurricane Odile (2014) cascaded into water supply failures across Los Cabos, creating compound impacts that extended recovery timeframes from days to weeks in affected areas. Similar patterns have been observed across Mexican tourism destinations, where critical system redundancy remains underdeveloped despite recognized vulnerabilities.
Otis is the first Category 5 hurricane to have made landfall in a highly populated area of the Mexican Pacific, placing it among the cases where more people have experienced the eye of a storm of such intensity. The advance of urbanized space in Acapulco, particularly associated with tourism and beach real estate business, has indeed translated into a greater exposed space, understanding space as both its material and built dimension, as well as its socioeconomic and environmental dimension. According to [8], Otis potentially flooded ~11,000 hectares, and generate landslides affecting 11.4 ha damaging 273,844 homes, >5800 commercial buildings, and >100 health centers. In addition to the impacts on areas that support the tourism economy, including 80% of the hotel infrastructure, which caused a loss of jobs for many workers in the sector — other residential areas were also affected by Otis [43]. Among the areas that received the most significant force of the hurricane is the Diamante zone, an urban development that radically transformed the territory with important consequences on the landscape and the ecological balance. In a short time, the lowlands and wetlands were filled, and rivers and streams were diverted to make the advance of the built space viable, including areas that should have been preserved for their adaptive function. This is a challenge to avoid in future tourist developments and infrastructure.
5. Conclusions
The methodology developed and in this paper was used and tested in the populations of San José del Cabo and Cabo San Lucas, in the Municipality of Los Cabos, allowing to quantify the impact that these phenomena will have on regular and irregular settlements of both populations in the near and distant future.
In this sense it is evident that informal urbanization processes surrounding tourism enclaves generate distinctive vulnerability patterns affecting worker populations critical to tourism operations. In both Los Cabos as in other touristic destinations in Mexico, rapid tourism development has outpaced formal housing provision, resulting in extensive informal settlements frequently located in hazard-exposed areas with minimal protective infrastructure. This pattern creates systemic vulnerabilities that threaten both resident well-being and tourism operational continuity during extreme events.
In addition to management during the emergency caused by the disaster, post-disaster care is necessary and certainly central to, among other things, guaranteeing a desirable reconstruction of the territory that allows for an effective reduction of future vulnerability. Desirable reconstruction cannot repeat the same mistakes that have generated unequal urban spaces, where informality and poverty are notable characteristics, particularly in beach destinations where there are often strong contrasts between tourist areas and the rest of the built space.
Such reconstruction can be an opportunity to improve inclusive territorial planning and put into practice a series of measures that have been repeatedly proposed by different international reports. For example, the improvement of early warning systems and disaster risk prevention and management schemes, the promotion of sustainable and resilient construction designs and practices, the advancement of circularity schemes, the consolidation of green-blue infrastructure corridors, the advancement of renewable energies and sustainable mobility, among others that have to do with the creation of innovative alliances and financing mechanisms and the strengthening of schemes for the inclusive cogeneration of solutions.
The repair of damages and losses associated with climate change is a moral imperative, which will only be significant if the reconstruction, in this case the municipality of Los Cabos and surrounding affected areas, is inclusive and fair, so it must be carried out in full compliance with human rights, prioritizing the most vulnerable people and considering transversal aspects of gender, age and cultural identity.
Author Contributions
Conceptualization: MAIL, JW, AIB, MZFL and MVGG; data Analysis: MAIL, JW, AIB; Investigation: MAIL, JW, AIB, MZFL and MVGG; Methodology: MAIL; Supervision: MAIL Visualization: MAIL Writing—original draft: MAIL, JW, AIB, MZFL and MVGG; Writing—review & editing: MAIL, JW, AIB, MZFL and MVGG.
Funding
This research received no external funding.
Data Availability Statement
Data is available on request.
Acknowledgments
We would like to thank the Autonomous University of Baja California, as the work center of the authors of this work. We would like to thank the Department of Fisheries Engineering and the Center for Research in Integrated Risk Management of the Autonomous University of Baja California Sur (CIGIR-UABCS) (https://sites.google.com/uabcs.mx/cigir-uabcs/inicio). We would also like to thank the Mexican Network of Climate Scientists (REDCIC) (https://www.redcic.mx/).
Conflicts of Interest
The authors declare no conflicts of interest.
References
- Fiorentino, S. , Sielker, F., Tomaney, J. Coastal towns as “left-behind places”: economy, environment and planning. Cambridge Journal of Regions, Economy and Society, 2023, 113. [CrossRef]
- Laino, E. and Iglesias, G. Extreme climate change hazards and impacts on European coastal cities: A review. Renewable and Sustainable Energy Reviews, 2023, 184, 113587. [Google Scholar] [CrossRef]
- Center of Research on the Epidemiology of Disasters (CRED). Human cost of disasters. An overview of the last 20 years. UN Office for Disaster Risk Reduction (UNDRR), 2018, 17p.
- Sánchez-Núñez, J.M. , Macías, J.L., Zamorano-Orozco, J.J., Saucedo, R., Torres, J.R., Novelo D. Mass movement processes at the Motozintla Basin, Chiapas, Southern Mexico. Geofísica Internacional, 2012, 51, 2, 169-186. [Google Scholar]
- Antinao, J.L. , and Farfán, L.M. Ocurrence of landslides during the approach of tropical cyclone Juliette (2001) to Baja California Sur, México. Atmósfera, 2013, 26, 2, 183–208. [Google Scholar] [CrossRef]
- Romero-Vadillo, E. y Romero-Vadillo, I.G. Estimación del riesgo en las viviendas de Baja California sur ante el impacto de ciclones tropicales. Teoría y Praxis, 2016, 50-73. [CrossRef]
- Centro Nacional de Prevención de Desastres (CENAPRED). Características e impacto socioeconómico de los huracanes Stan y Wilma en la República Mexicana en el 2005. CENAPRED, México, México, 2006, 332p. Obtained from: https://hdl.handle.net/11362/25801 [Accesed 05/04/25].
- Ramirez-Herrera, M.T. , Coca, O., Gaidzik, K., Vargas-Espinoza, V. Hurricane Otis: Category 5 storm effects and cascading hazards in Acapulco Bay, México. Global and Earth Surface Processes Change, 2025, 3. [Google Scholar] [CrossRef]
- Muriá-Vila, D. El huracán Odile y sus efectos en la infraestructura del sur de la península de Baja California. Investigación y Desarrollo. UNAM, México, México, 2015, ISBN 978-607-02-7411-4. 134p.
- Lawrence, Miles B. (2003). "Hurricane Ignacio Tropical Cyclone Report" (PDF). National Hurricane Center. Retrieved 2025-02-17. https://www.nhc.noaa.gov/data/tcr/EP092003_Ignacio.pdf.
- Martínez-Gutiérrez, G. , & Mayer, L. (2004). Huracanes en Baja California, México y sus implicaciones en la sedimentación en el Golfo de California. Geos, https://geos.cicese.mx/index.php/geos/article/view/156. 2004, 24, 1, 57–64. [Google Scholar]
- Franklin, J. L. (2015). "Hurricane Marty Tropical Cyclone Report" (PDF). National Hurricane Center. Retrieved 2025-02-17. https://www.nhc.noaa.gov/data/tcr/EP132003_Marty.pdf.
- Beven, John L. (2010). "Hurricane Jimena Tropical Cyclone Report" (PDF). National Hurricane Center. Retrieved 2025-02-17. https://www.nhc.noaa.gov/data/tcr/EP132009_Jimena.pdf.
- Lawrence, M. B. , Mainelli, M. M. (2001). Tropical Cyclone Report: Hurricane Juliette (PDF) (Report). National Hurricane Center. Retrieved 2025-02-17. https://www.nhc.noaa.gov/data/tcr/EP112001_Juliette.pdf.
- Zinke, L. Hurricanes and landslides. Nat Rev Earth Environ, 2021, 2, 304. [Google Scholar] [CrossRef]
- Lin, S. , Chen, S., Rasanen, R. A., Zhao, Q., Chavan, V., Tang, W., Shanmugam, N., Allan, C., Braxtan, N., & Diemer, J. Landslide Prediction Validation in Western North Carolina after Hurricane Helene. Geotechnics, 2024, 4, 4, 1259–1281. [Google Scholar] [CrossRef]
- Gobierno del Municipio de Los Cabos (GOB-LCB). (2024). Plan Municipal de Desarrollo 2024-2027. 178p. Tomado de: https://www.loscabos.gob.mx/PMD/PLAN%20DE%20DESARROLLO%20MUNICIPAL%202024-2027%20LOS%20CABOS%20B%20C%20S.pdf.
- Montaño-Armendariz, A. , Martínez-Sidón, G., and Perez-Concha, J.C. Tourism activity and income inequality in Los Cabos, Baja California Sur, Mexico. Análisis Económico, 2023, 38, 98, 152–172. [Google Scholar] [CrossRef]
- Bojórquez Luque, J. and Ángeles Villa, M. Turismo y polarización social en Los Cabos, México. El proyecto Zona Dorada. Bitácora. Urbano Territorial, 2019, 29, 2, 117–126. [Google Scholar] [CrossRef]
- Imaz-Lamadrid, M. A. , Wurl, J., and Ramos-Velázquez, E. Future of Coastal Lagoons in Arid Zones under Climate Change and Anthropogenic Pressure. A Case Study from San Jose Lagoon, Mexico. Resources, 2019, 8, 1, 57. [Google Scholar] [CrossRef]
- Gobierno del Estado de Baja California Sur (GOB-BCS). Atlas Estatal de Riesgo de Baja California Sur. Universidad Autónoma de Baja California Sur. La Paz, Baja California Sur, México, 2024, 210 p. https://atlasriesgo.uabcs.mx.
- IPCC, 2023: Climate Change 2023: Synthesis Report. Contribution of Working Groups I, II and III to the Sixth Assessment Report of the Intergovernmental Panel on Climate Change [Core Writing Team, H. Lee and J. Romero (eds.)]. IPCC, Geneva, Switzerland, 2023; 35–115. [CrossRef]
- Fick, S.E. and R.J. Hijmans. WorldClim 2: new 1km spatial resolution climate surfaces for global land areas. International Journal of Climatology, 2017, 37, 12, 4302–4315. [Google Scholar] [CrossRef]
- Dix, Martin; Bi, Daohua; Dobrohotoff, Peter; Fiedler, Russell; Harman, Ian; Law, Rachel; Mackallah, Chloe; Marsland, Simon; O’Farrell, Siobhan; Rashid, Harun; Srbinovsky, Jhan; Sullivan, Arnold; Trenham, Claire; Vohralik, Peter; Watterson, Ian; Williams, Gareth; Woodhouse, Matthew; Bodman, Roger; Dias, Fabio Boeira; Domingues, Catia M.; Hannah, Nicholas; Heerdegen, Aidan; Savita, Abhishek; Wales, Scott; Allen, Chris; Druken, Kelsey; Evans, Ben; Richards, Clare; Ridzwan, Syazwan Mohamed; Roberts, Dale; Smillie, Jon; Snow, Kate; Ward, Marshall; Yang, Rui (2019). CSIRO-ARCCSS ACCESS-CM2 model output prepared for CMIP6 CMIP historical. Version.Earth System Grid Federation. [CrossRef]
- Tyberghein L, Verbruggen H, Pauly K, Troupin C, Mineur F, De Clerck O. Bio-ORACLE: A global environmental dataset for marine species distribution modelling. Global Ecology and Biogeography, 2012, 21, 272–281. [Google Scholar] [CrossRef]
- Assis, J. , Tyberghein, L., Bosh, S., Verbruggen, H., Serrão, E. A., & De Clerck, O. Bio-ORACLE v2.0: Extending marine data layers for bioclimatic modelling. Global Ecology and Biogeography. 2017, 27, 3. [Google Scholar] [CrossRef]
- EC-Earth Consortium (EC-Earth). EC-Earth-Consortium EC-Earth3-Veg model output prepared for CMIP6 ScenarioMIP. Version, Earth System Grid Federation. 2019. [CrossRef]
- Ivanova-Boncheva, A., González-Rubio, C., Bermúdez-Contreras, A., Estrada-Contreras, I., Talamantes-Geraldo, J., Tejas-Álvarez, Z. (2024). IV. Perspectiva del Cambio Climático. In: Gobierno del Estado de Baja California Sur (GOB-BCS). Atlas Estatal de Riesgo de Baja California Sur. Universidad Autónoma de Baja California Sur. La Paz, Baja California Sur, México, 2024. 210 p.
- IPCC. Climate change 2001: impacts, adaptation and vulnerability, Contribution of Working Group II to the Third Assessment Report of the Intergovernmental Panel on Climate Change, edited by J. J. McCarthy, O. F. Canziani, N. A. Leary, D. J. Dokken and K. S. White (eds). Cambridge University Press, Cambridge, UK, and New York, USA, 2001. ISBN 0-521-80768-9. [CrossRef]
- Imaz-Lamadrid, M.A. , Ivanova-Boncheva, A., Flores-López, M.Z. & Cortés-Martínez, M.Y. Participative Policy Design to Manage Droughts and Floods in an Arid Region under Changing Climate Scenarios: The Case of Baja California Sur, Mexico. Sustainability, 2023, 15, 13547. [Google Scholar] [CrossRef]
- Fortini, L. Fortini, L., Schubert, O. Beyond exposure, sensitivity and adaptive capacity: a response based ecological framework to assess species climate change vulnerability. Clim Chang Responses, 2017, 4, 2. [CrossRef]
- González-Baheza, A. , and Arizpe, O. Vulnerability assessment for supporting sustainable coastal city development: a case study of La Paz, Mexico. Climate and Development, 2017, 10, 6, 552–565. [CrossRef]
- Rotigliano, E. , Cappadonia, C., Conoscenti, C. Slope units-based flow susceptibility model: using validation tests to select controlling factors. Nat Hazards, 2012, 61, 143–153. [Google Scholar] [CrossRef]
- Fhatuwani, S. , Frederick Mokibelo, M., Dhiren, A. An integrated approach to develop a slope susceptibility map based on a GIS-based approach, soft computing technique and finite element formulation of the bound theorems. Transportation Geotechnics, 2022, 36, 100818. [Google Scholar] [CrossRef]
- Yechale, A. , Trufat Hailemariam, G., Tarun Kumar R. GIS-based statistical analysis for landslide susceptibility evaluation and zonation mapping: A case from Blue Nile Gorge, Gohatsion-Dejen road corridor, Central Ethiopia. Environmental Challenges, 2024, 16, 100968. [Google Scholar] [CrossRef]
- Gutiérrez, J.M. Gutiérrez, J.M., R.G. Jones, G.T. Narisma, L.M. Alves, M. Amjad, I.V.Gorodetskaya, M. Grose, N.A.B. Klutse, S. Krakovska, J. Li, D.Martínez-Castro, L.O. Mearns, S.H. Mernild, T. Ngo-Duc, B. van den Hurk, and J.-H. Yoon, (2021). Atlas. In Climate Change 2021: The Physical Science Basis. Contribution of Working Group I to the Sixth Assessment Report of the Intergovernmental Panel on Climate Change [Masson-Delmotte, V., P. Zhai, et al. (eds.)]. Cambridge University Press, Cambridge, United Kingdom and New York, NY, USA, pp. 1927–2058. Interactive Atlas available from http://interactive-atlas.ipcc.ch/. [CrossRef]
- Ángeles Villa, M. y Gámez A. E. Crecimiento turístico y desarrollo humano en B.C.S. Ponencia en Seminario Anual de Investigación de la Cuenca del Pacífico, 2024, Universidad de Colima. Colima, México.
- Gobierno del Municipio de Los Cabos (GOB-LCB). (2024). Plan Municipal de Desarrollo 2024-2027. 178p. Retrieved 2025-02-17. Obtained from: https://www.loscabos.gob.mx/PMD/PLAN%20DE%20DESARROLLO%20MUNICIPAL%202024-2027%20LOS%20CABOS%20B%20C%20S.pdf.
- Muñiz-Jauregui, J.A. , and Hernandez-Madrigal, V.M. Zonificación de procesos de remoción en masa en Puerto Vallarta, Jalisco, mediante combinación de análisis multicriterio y método heurístico. Revista Mexicana de Ciencias Geológicas, 2012, 28, 1, 103–114. [Google Scholar]
- Morales-Hernandez, J.C. , Frausto-Martínez, O., Cruz-Romero, B., Chavoya Gama, J.I., and Carrillo-Gonzalez, F.M. Susceptibility to Flooding of Urban Areas Puerto Vallarta – Mexico. International Journal of Design and Nature and Ecodynamics, 2022, 17, 3, 359–367. [Google Scholar] [CrossRef]
- Arellano-Ramirez, S.P. , Ulloa-Godinez, H. H., Avila-Verá, M., and García-Guadalupe, M. E. Comparison of cyclones and damage generated by Kenna and Patricia in western Mexico. Estudios de la Cienega, 2024, 25, 50, 132–143. [Google Scholar]
- Becken, S. , and Hughey, K.F.D. Linking tourism into emergency management structures to enhance disaster risk reduction. Tourism management, 2013, 36, 77–85. [Google Scholar] [CrossRef]
- Gian, C. Delgado-Ramos, Simone Lucatello, Debora Ley, Antonina Ivanova, Ma de Lourdes Romo-Aguilar, Cecilia Conde and Miguel Imaz-Lamadrid. A 2023 hurricane caught Mexico off guard: we must work together to prepare better. Nature, 2024, 628, 33–35. [Google Scholar] [CrossRef]
Figure 1.
Location map of the study area including population distribution for 2020.
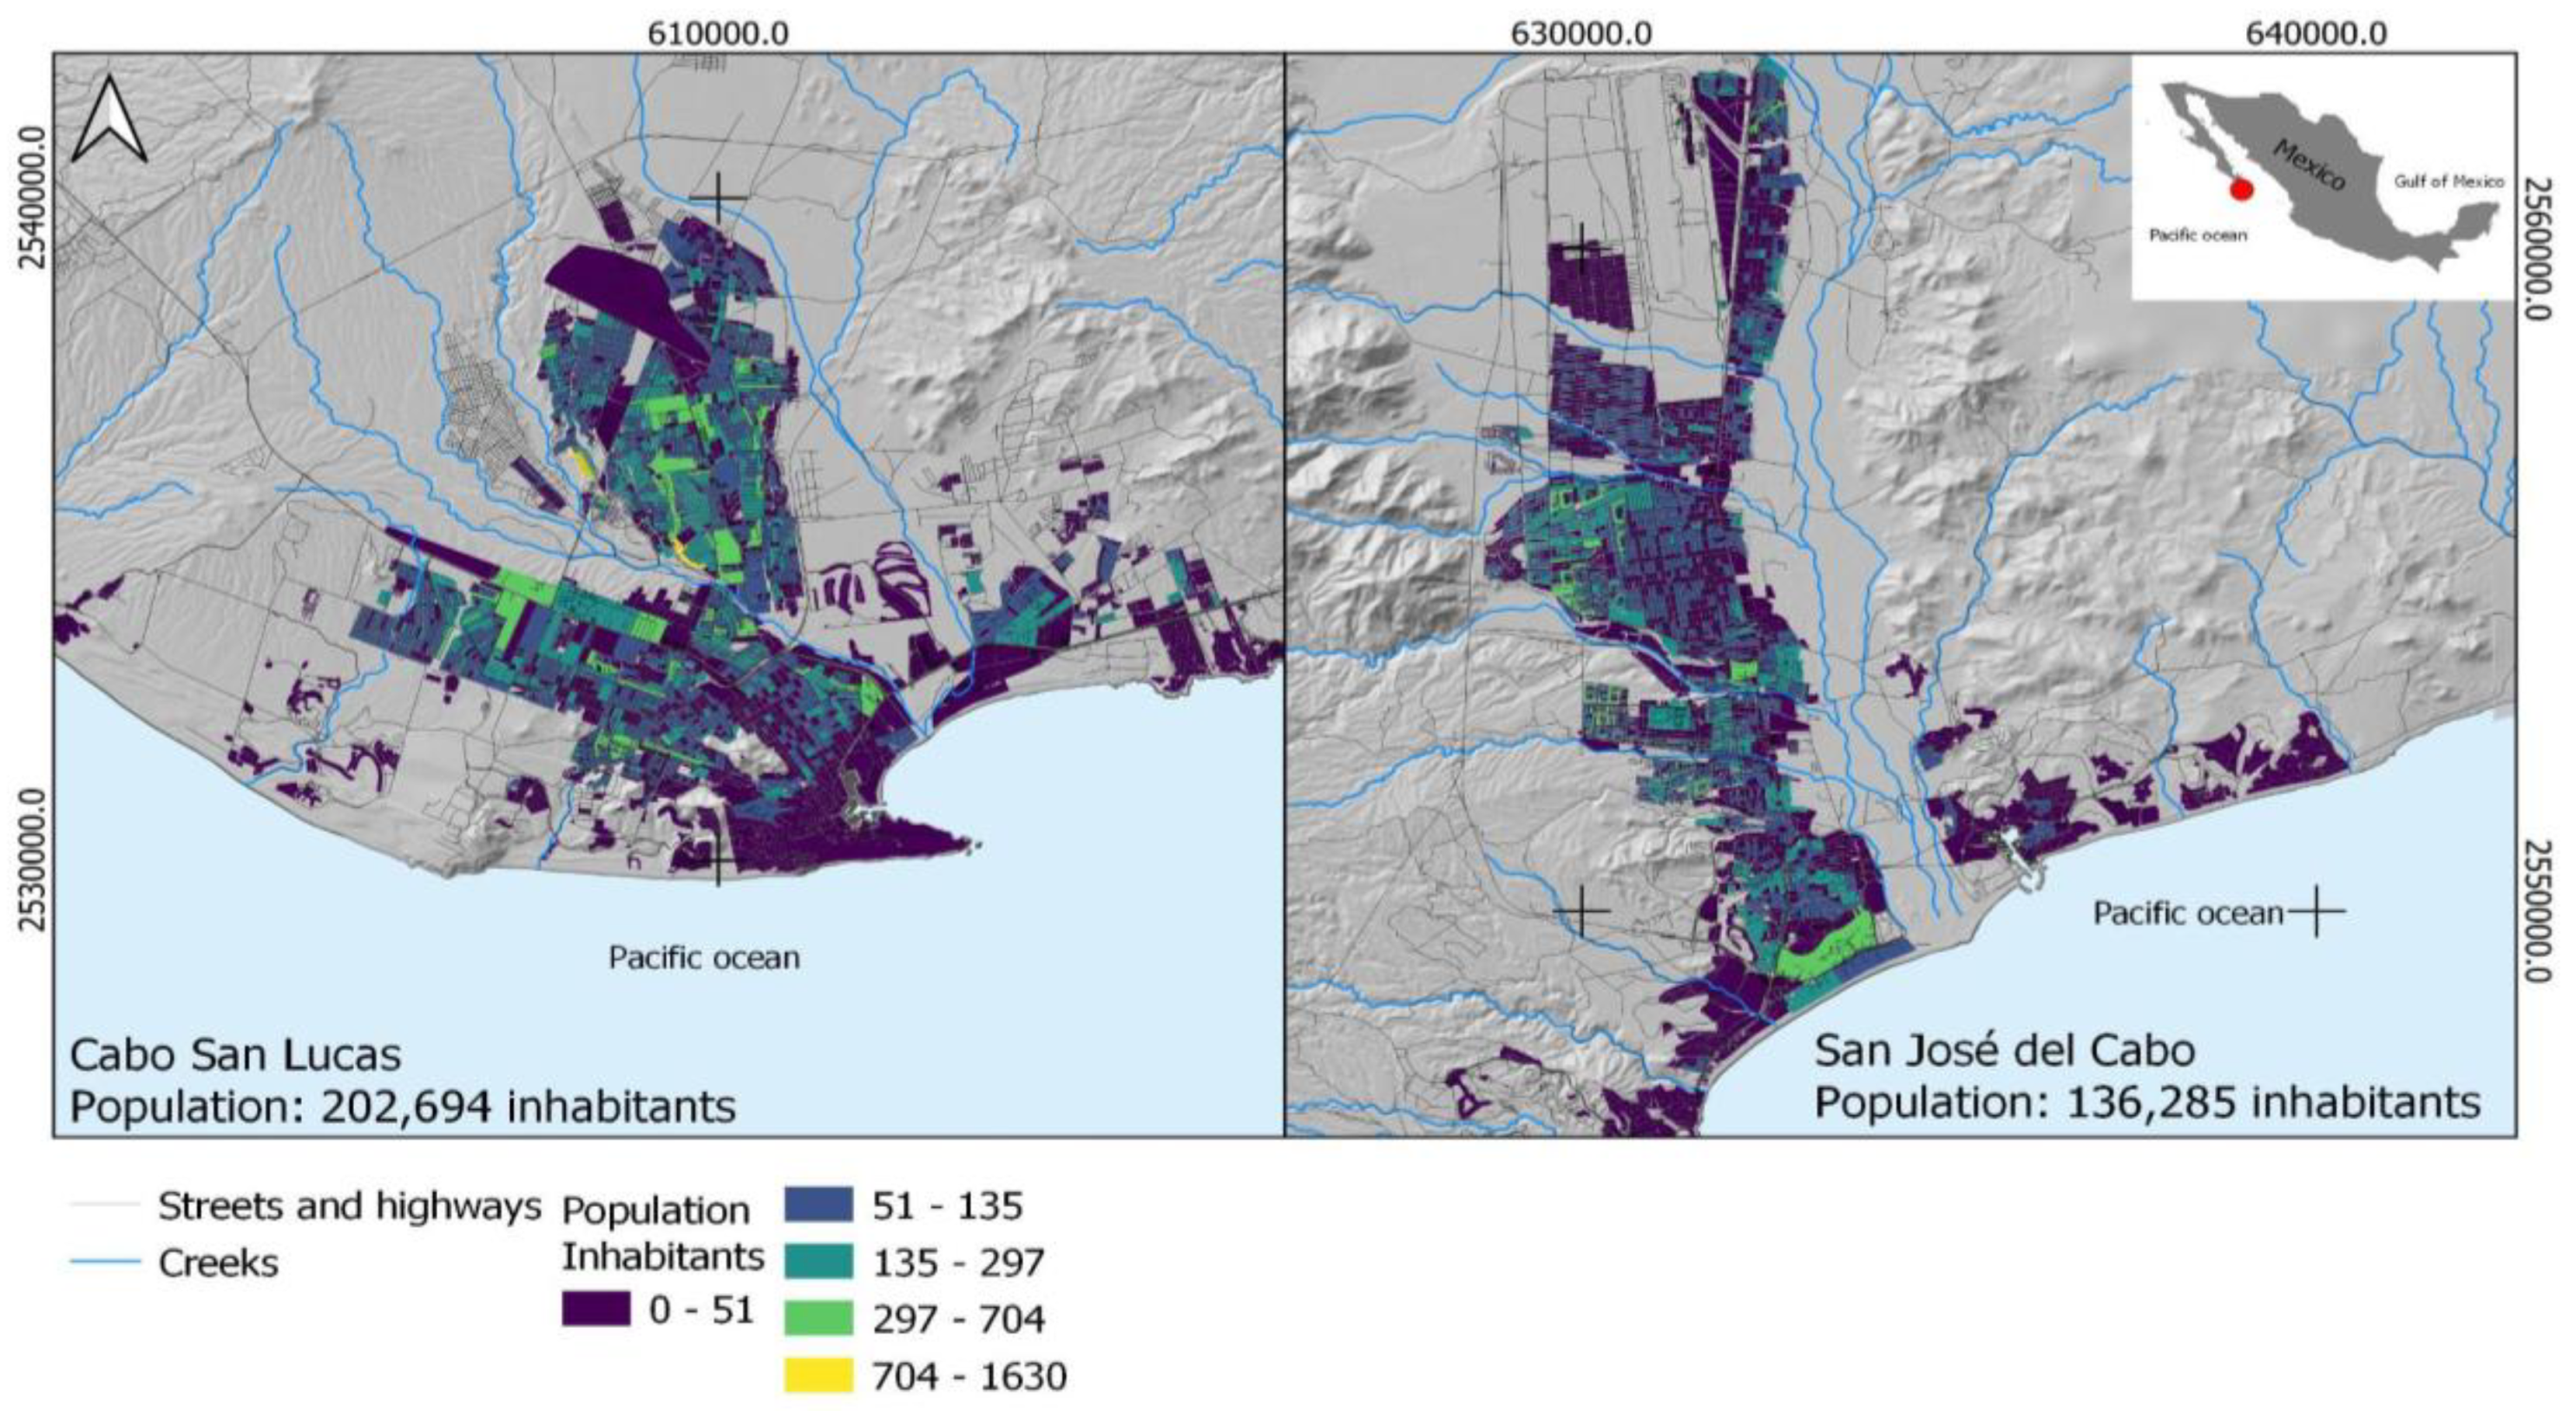
Figure 2.
Future exposure to extreme hydrometeorological and landslide events in the study area.
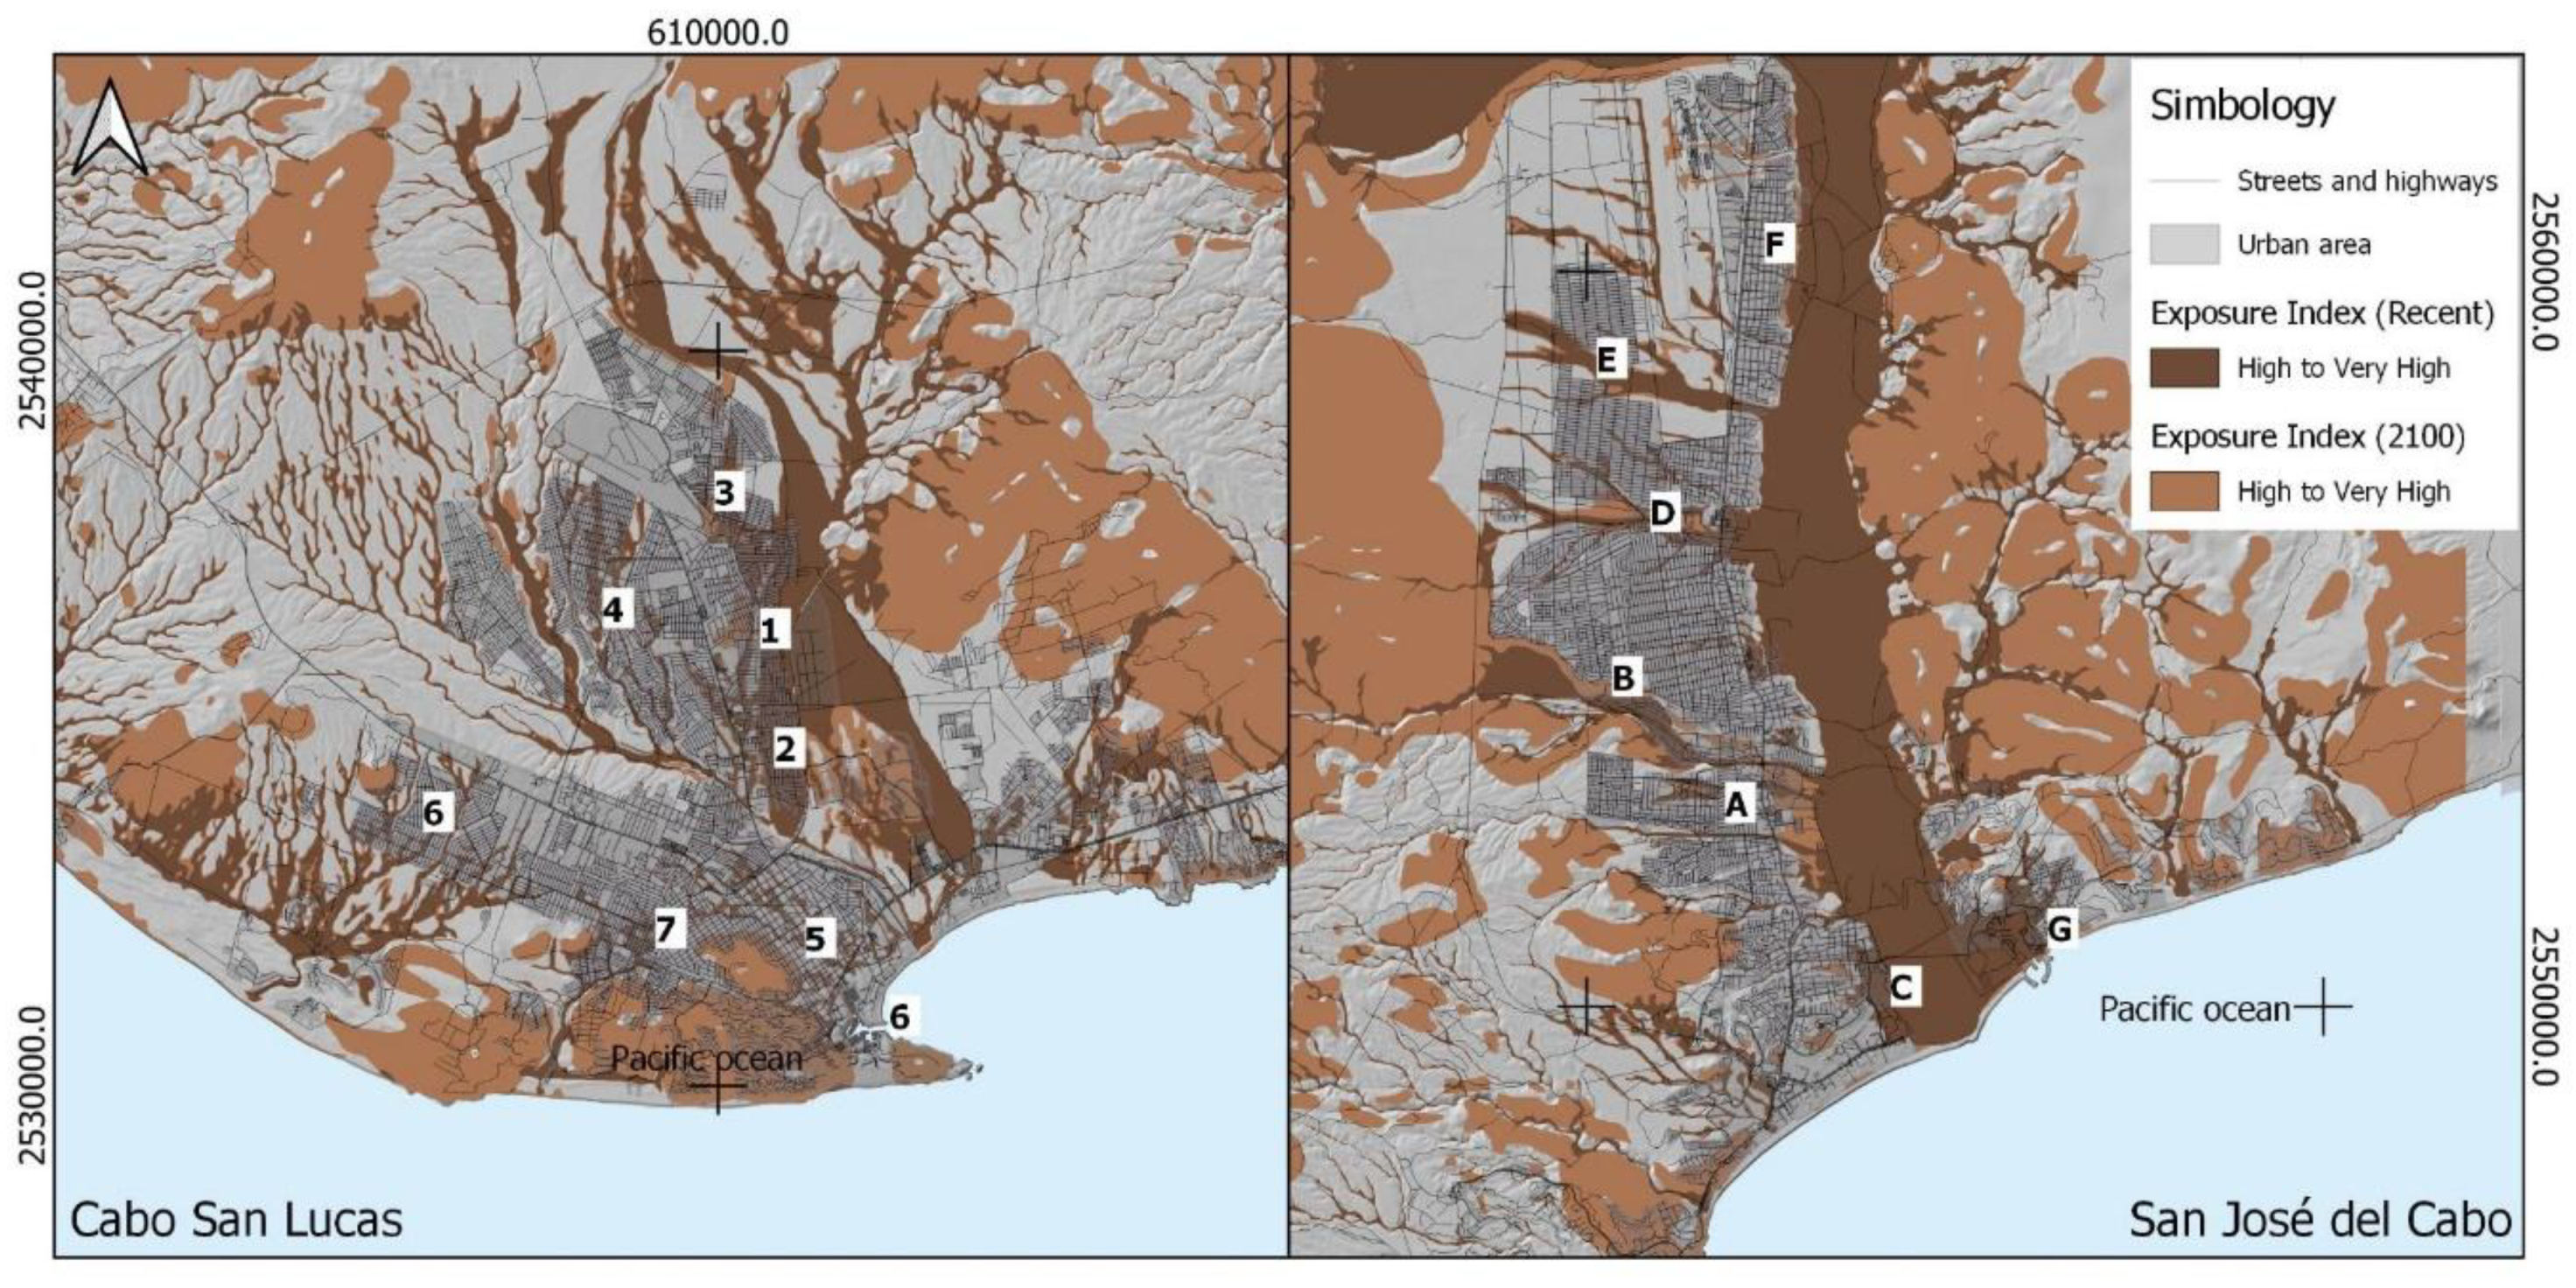
Figure 3.
Forecasting of vulnerable population to hydrometeorological and landslide events in the study area.
Figure 3.
Forecasting of vulnerable population to hydrometeorological and landslide events in the study area.
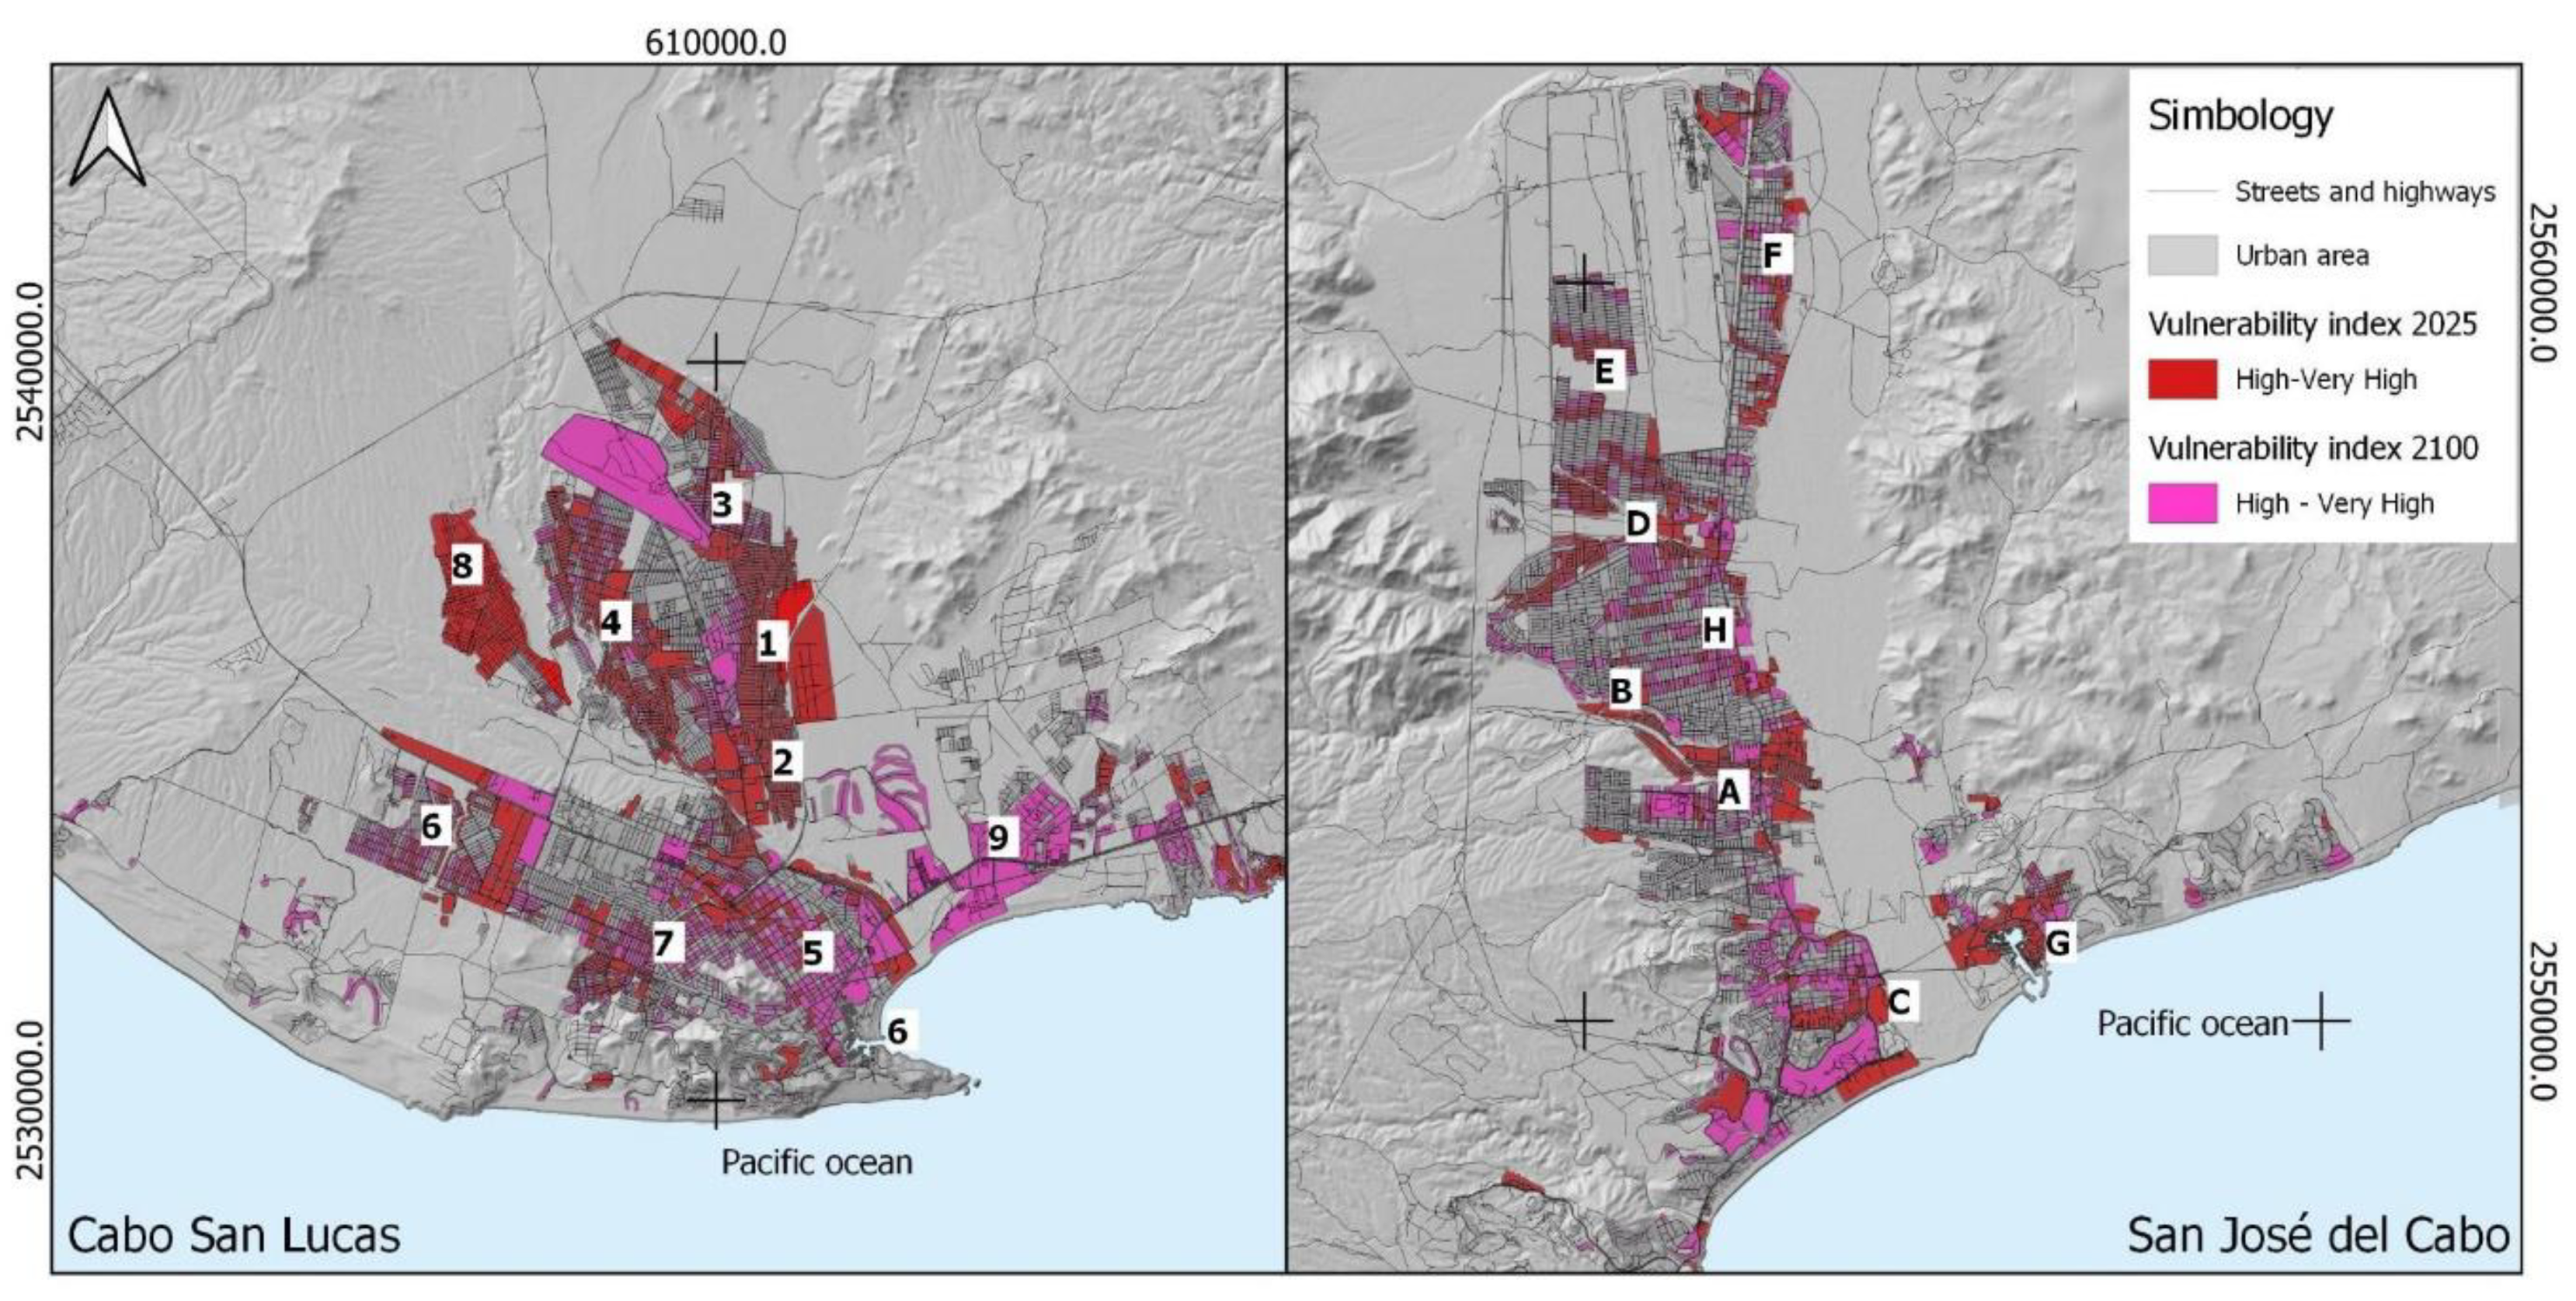

Table 1.
Description and value for each indicator of the sensitivity index.
| Indicator | Definition | Value |
|---|---|---|
| Distance to hospital | Access to health services is vital in the face of the impact of a disturbing phenomenon. The greater the distance, the greater the sensitivity | Distance < 20km=0 Distance > 20km=1 |
| Distance to closest airport or runway | Air bridges are vital for receiving supplies in the event of a disturbing phenomenon or to speed up preventive evacuation. The greater the distance, the less capacity for attention and, therefore, the greater the sensitivity. | Distance < 20km=0 Distance > 20km=1 |
| Freshwater coverage | Due to the aridity and development of cities, the population does not have constant access to water. Access to water is a human right and a necessity that, when absent, increases sensitivity. | Total coverage=0 Partial coverage=0.5 No coverage=1 |
| Sewage coverage | Connection to the drainage system is a clear indicator of the development of a population. A population without drainage is more sensitive | Total coverage=0 No coverage=1 |
| Telecommunication | Developed and less sensitive areas have access to mobile phones, landlines, the Internet, and other types of communication. The lack of connectivity increases the population´s sensitivity | 3 or more telecom items=0 Less than 3 telecomm items=1 |
| Housing construction | Houses built with concrete (brick, blocks, steel) indicate a less sensitive population than artisanal houses constructed with wood or waste material (cardboard, sheet metal, among others). | Concrete (with blocks, bricks, steel) =0 Mix or other material=1 |
Table 2.
This is a table caption.
| Scenario | Exposure (km2) | Vulnerability (% of blocks) | Vulnerable population | %1 | Vulnerable population (growth rate correction) 2 |
|---|---|---|---|---|---|
| Recent | 121.27 | 5.51 | 133,266 | 37.9 | 133,266 |
| 2040 | 185.02 | 5.90 | 142,956 | 40.7 | 149,039 |
| 2060 | 663.11 | 6.30 | 151,533 | 46.6 | 178,847 |
| 2100 | 956.74 | 6.85 | 165,642 | 53.4 | 250,386 |
1 Percentage considering null population growth. 2 Estimation based on population growth factor.
Disclaimer/Publisher’s Note: The statements, opinions and data contained in all publications are solely those of the individual author(s) and contributor(s) and not of MDPI and/or the editor(s). MDPI and/or the editor(s) disclaim responsibility for any injury to people or property resulting from any ideas, methods, instructions or products referred to in the content. |
© 2025 by the authors. Licensee MDPI, Basel, Switzerland. This article is an open access article distributed under the terms and conditions of the Creative Commons Attribution (CC BY) license (http://creativecommons.org/licenses/by/4.0/).
Copyright: This open access article is published under a Creative Commons CC BY 4.0 license, which permit the free download, distribution, and reuse, provided that the author and preprint are cited in any reuse.


