
Submitted:
30 September 2025
Posted:
01 October 2025
Read the latest preprint version here
Abstract
The acute infection with Trypanosoma cruzi induces an exuberant immune response; however, despite this, the host is unable to clear the parasite, and the infection progresses to a chronic phase. T and B cells play a crucial role in controlling infections. Although the parasite presents numerous antigenic determinants capable of activating many T and B cell clones, some antigens trigger a large proportion of CD8 T cells, implying TCR cross-reactivity targeting these determinants. Polyclonal activation may result in an inefficient immune response against the parasite, diverting it toward less critical antigenic determinants, which allows for persistent infection and opens up the possibility of autoimmunity. Cross-reactivity has been demonstrated for CD8 T cells, but not for CD4 T cells. Herein, we demonstrate, using cytometry, that CD4+ T cells expressing high levels of the DO11.10 transgenic TCR, which are responsive to OVA, are activated during T. cruzi acute infection, differentiating into effector memory T cells that produce cytokines such as IFN-γ, TNF-α, and IL-10. Furthermore, prior exposure to OVA via the oral route modified cytokine production of these transgenic T cells upon infection. We also demonstrate that T. cruzi induces the expression of Foxp3 in a sizable pool of transgenic T cells.
Keywords:
chagas disease
; Trypanosoma cruzi
; DO11.10 T cells
; ovalbumin
; interferon-γ
; TNF
; interleukin-10
; cross-reactivity
Fabíola Cardillo 1, Jorge Nihei 2and José Mengel 3,4,*,†
1 Gonçalo Moniz Research Center, Oswaldo Cruz Foundation, Salvador, Bahia, Brazil
2 Center of Health Sciences, Federal University of Recôncavo da Bahia (UFRP), Santo Antonio de Jesus, Brazil
3 Laboratory of Basic and Applied Immunology, Faculty of Medicine of Petrópolis, UNIFASE, Petrópolis, RJ, Brazil
4 Laboratory of Clinical Immunology, Oswaldo Cruz Institute, Oswaldo Cruz Foundation, Rio de Janeiro, RJ, Brazil
Introduction
Trypanosoma cruzi is the etiological agent of a neglected condition known as Chagas disease [1]. The acute infection is followed by a potent immune response that controls parasite replication [2]. However, the host can not clear the parasite, and a chronic infection is established [2]. A wide range of immune responses can be detected during the acute phase of the disease, helping to control parasite growth [2]. Yet, most of the lymphocyte response is polyclonal and may occur through bystander activation [3]. It has been proposed, however, that T cell receptors are cross-reactive to a large extent [4]. Several molecular mechanisms have been proposed to explain TCR cross-reactivity in various models [5]. Therefore, it is reasonable to argue that T cell cross-reactivity may partly explain the polyclonal T cell activation during T. cruzi infection.
Cross-reactivity may have important immunological implications. For instance, T cells are positively selected in the thymus by self-peptides and MHC. Still, T cells can also interact with and produce immune responses to non-self peptides in the peripheral lymphoid organs [5,6]. Importantly, infections can trigger and expand clones with cross-reactivity to self-antigens, potentially leading to autoimmune diseases [7,8].
On the other hand, cross-reactivity may aid in the development of vaccines to prevent or mitigate autoimmune diseases. For instance, it has been described that non-self heat shock protein-derived peptides may induce activation of cross-reactive regulatory T cells, thereby preventing autoimmune diseases [9,10,11]. Moreover, previous exposure to pathogens or non-pathogenic microflora can alter the immune response to an unrelated microorganism, as previously documented [8,12]. For example, we have previously described how aged or thymectomized mice are completely resistant to infection by T. cruzi, whereas young mice are susceptible [13,14]. Resistance, in this case, correlated with the increase in naturally occurring memory T cells in these animals at the time of infection, due to the lack of regulation caused by aging or thymectomy, suggesting that environmental antigen-reactive T cells may help control the parasite load by responding to T. cruzi antigens through cross-reactivity [2]. Interestingly, a great degree of cross-reactivity between different clones of CD8 T cells and T. cruzi antigen-derived peptides has recently been demonstrated [15]. Together, these findings might contribute to explaining important aspects of Chagas disease pathogenicity. Yet, there is no clear information concerning the cross-reactivity of CD4+ T cells in the context of class II MHC during T. cruzi infection.
In this study, we describe the phenotypes and functional changes of the DO11.10 transgenic CD4+ T cell, which bears the TCR recognized by the clonotypic monoclonal antibody KJ1-26, upon acute T. cruzi infection. Originally, the DO11.10 transgenic TCR is specific for an Ovalbumin-derived peptide (323–339) in the context of IAd class II MHC [16]. Therefore, the activation of DO11.10 transgenic CD4+ T cells by unrelated antigens, such as those from T. cruzi, was unexpected. We demonstrate that DO11.10 transgenic CD4 T cells are largely activated into an effector memory phenotype during the acute T. cruzi infection in BALB/c mice. Additionally, part of the DO11.10 CD4 T cells begin to express Foxp3. The percentage of cells expressing IFN-γ and TNF also increases in the acute phase. Previous oral immunization with OVA altered the pattern of cytokine production by DO11.10 CD4 T cells, increasing the percentage of IL-10-expressing cells. These results suggest that cross-reactivity between CD4 T cells and class II MHC peptides may be similar to the CD8 T cell compartment and peptides related to class I MHC. These findings might have profound implications for the quality of the immune response during infection.
Materials and Methods
Animals
Female DO11.10 BALB/c mice (4–6 weeks old) were obtained from the Centro de Pesquisas Gonçalo Moniz animal house. The animals were housed in microisolators under conventional conditions and handled according to institutional ethical guidelines. All mouse procedures were carried out in accordance with the Ethics Committee of the Oswaldo Cruz Foundation, under protocol numbers CPqGM 015/09 and CPqGM 038/09.
Ovalbumin Immunization
Ovalbumin (A5253, Sigma Aldrich) was dissolved in drinking water at a concentration of 5 mg/mL, filtered, and administered ad libitum for 5 days. A fresh solution was prepared daily. Mice were rested for 7 days and then immunized intravenously via the retroorbital sinus using 300 μg/0.1 mL of OVA (A5503, Sigma-Aldrich) diluted in PBS. This protocol contained slight modifications of a previously published study [17].
Infection
Groups of 5 to 30 mice were infected intraperitoneally with 103 blood-form trypomastigotes of the Tulahuen strain of T. cruzi in 0.2 mL of 0.15 M phosphate-buffered saline (PBS). Control mice received the same volume of PBS. Mice were sacrificed between days 22 and 25 after infection, depending on the experiment. No significant differences were observed during this brief period.
In vitro Cell Culture
Splenocytes were cultured in triplicate at a density of 107 cells/well in 24-well plates (Nunc) in RPMI 1640 (Gibco, Grand Island, NY) supplemented with 10% fetal bovine serum (FBS, Hyclone), 50 μM 2-ME, and 1 mM HEPES (complete medium). Cells were cultured at 37°C and 5% CO2 for 24 hours in complete medium alone, as previously described [18]. Brefeldin A was added 6 hours before cell harvest to facilitate intracellular staining for flow cytometric analysis.
Flow Cytometric Analysis
Spleen cells were isolated as described [19] and placed in ice-cold PBS supplemented with 5% FBS and 0.01% sodium azide. Staining was performed as previously described [19]. In some experiments, CD4 T cells were magnetically sorted using surface staining with APC anti-CD4 (Clone RM4-4), followed by anti-APC microbeads (Miltenyi Biotec, Germany), according to the manufacturer’s instructions. Purity was consistently above 95%, as confirmed by cross-checking with a PE-CY5.5 anti-CD4 antibody (Clone GK1.5, a non-epitope-overlapping antibody). The fluorochrome-conjugated monoclonal antibodies used were: anti-CD4 (Clones GK1.5 and RM4-4), anti-DO11.10 clonotype (Clone KJ1-26), anti-CD44 (Clone IM7), anti-CD62L (Clone MEL-14), anti-Foxp3 (Clone 150D), anti-IL-4 (Clone 11B11), anti-IL-10 (Clone JES5-16E3), anti-IFN-γ (Clone XMG1.2), and anti-TNF-α (Clone MP6-XT22). These were purchased from eBioscience, BioLegend, or Caltag. Streptavidin-PE-Cy5.5 from Caltag was used to reveal biotin-conjugated antibodies. Intracellular staining for IL-4, IL-10, IFN-γ, and TNF-α was performed as described [20]. Buffer kits for intracellular and intranuclear staining were from eBioscience and used according to the manufacturer’s instructions. Isotype controls (clones RTK2071 and RTK4530) were included to establish background levels for cytokine intracellular assays. After surface staining, the cells were fixed with 1% paraformaldehyde in PBS and analyzed using a FACScan (Becton & Dickinson). Results were analyzed using FlowJo software.
Statistical Analysis
Results are presented as means ± SD. The significance of differences between experimental and control groups was determined as described in each figure legend. P values below 0.05 were considered statistically significant.
Results
Activation of transgenic DO11.10 CD4 T cells during acute T. cruzi infection
To test whether cross-reactivity could also be observed in CD4 T cells, we infected DO11.10 transgenic mice with T. cruzi. The DO11.10 mice have a transgenic TCR specific for OVA 323–339 peptide in the context of IAd ([16]). Flow cytometric analysis of sorted splenic KJ1-26+CD4+ T cells from infected DO11.10 mice revealed a significant increase in the percentage of memory T cells when compared with control mice (Figure 1). Figure 1A,B show that DO11.10+CD4+ T cells from normal mice are predominantly in the resting stage, exhibiting low percentages of markers associated with memory T cells. On the other hand, infected DO11.10 transgenic mice increased the rate of effector memory transgenic T cells, expressing high levels of CD44 and low levels of CD62L. Immunization with OVA also increases the percentage of effector and central memory transgenic CD4+ T cells compared to the other groups.
T. cruzi Infection Increases the Frequencies of Splenic TNF-α+ and IFN-γ+ DO11.10 Transgenic T Cells
To further characterize these activated cells, intracellular cytokine staining was performed. Infection with T. cruzi increased the frequencies of CD4+KJ1-26+ cells that spontaneously expressed TNF-alpha after 24 hours of culture in medium, as shown in Figure 2 (upper histogram set). OVA-immunization also increased the spontaneous production of TNF-alpha compared to non-immunized controls. However, the infection did not increase the frequencies of transgenic splenic T cells expressing TNF-alpha in OVA-immunized animals.
The frequencies of transgenic splenic T cells, which spontaneously produce IFN-γ, increase upon infection compared to uninfected mice and are similar to those of mice previously immunized with OVA. In addition, infection in OVA-immunized mice does not further augment the percentages of transgenic T cells that produce IFN-gamma. These results suggest that previous OVA-immunization has set a limit to the production of TNF-alpha and IFN-gamma induced by T. cruzi infection.
DO11.10 Transgenic CD4+ T Cells Spontaneously Produce IL-4 and IL-10 Upon T. cruzi Infection
To assess whether T. cruzi infection could induce the production of potentially regulatory cytokines, we evaluated IL-4 and IL-10 in naive and orally OVA-exposed mice before infection. Figure 3 shows that transgenic CD4+ T splenocytes from infected mice presented higher frequencies of IL-4- and IL-10-expressing cells compared to unstimulated controls. Additionally, previous OVA immunization significantly increased the frequency of IL-4+ cells compared to non-immunized animals. However, the infection did not augment the relative number of IL-4+ cells in OVA-immunized mice. We have also studied the frequencies of IL-10 expression on transgenic CD4+ T lymphocytes. The lower histograms in Figure 3 show that infection increased the frequencies of splenic IL-10 transgenic producers when compared to control, OVA-immunized, or OVA-immunized-infected DO11.10 mice. Interestingly, pre-immunization with OVA significantly increased the frequencies of IL-10-producing transgenic T cells compared to non-immunized mice, but was still lower than those in infected non-immunized mice. These results suggest that prior oral exposure to OVA modulates the immune response of DO11.10 T cells, shifting them toward a more regulatory phenotype.
Induction of Foxp3 Expression in DO11.10 CD4 T Cells During Infection
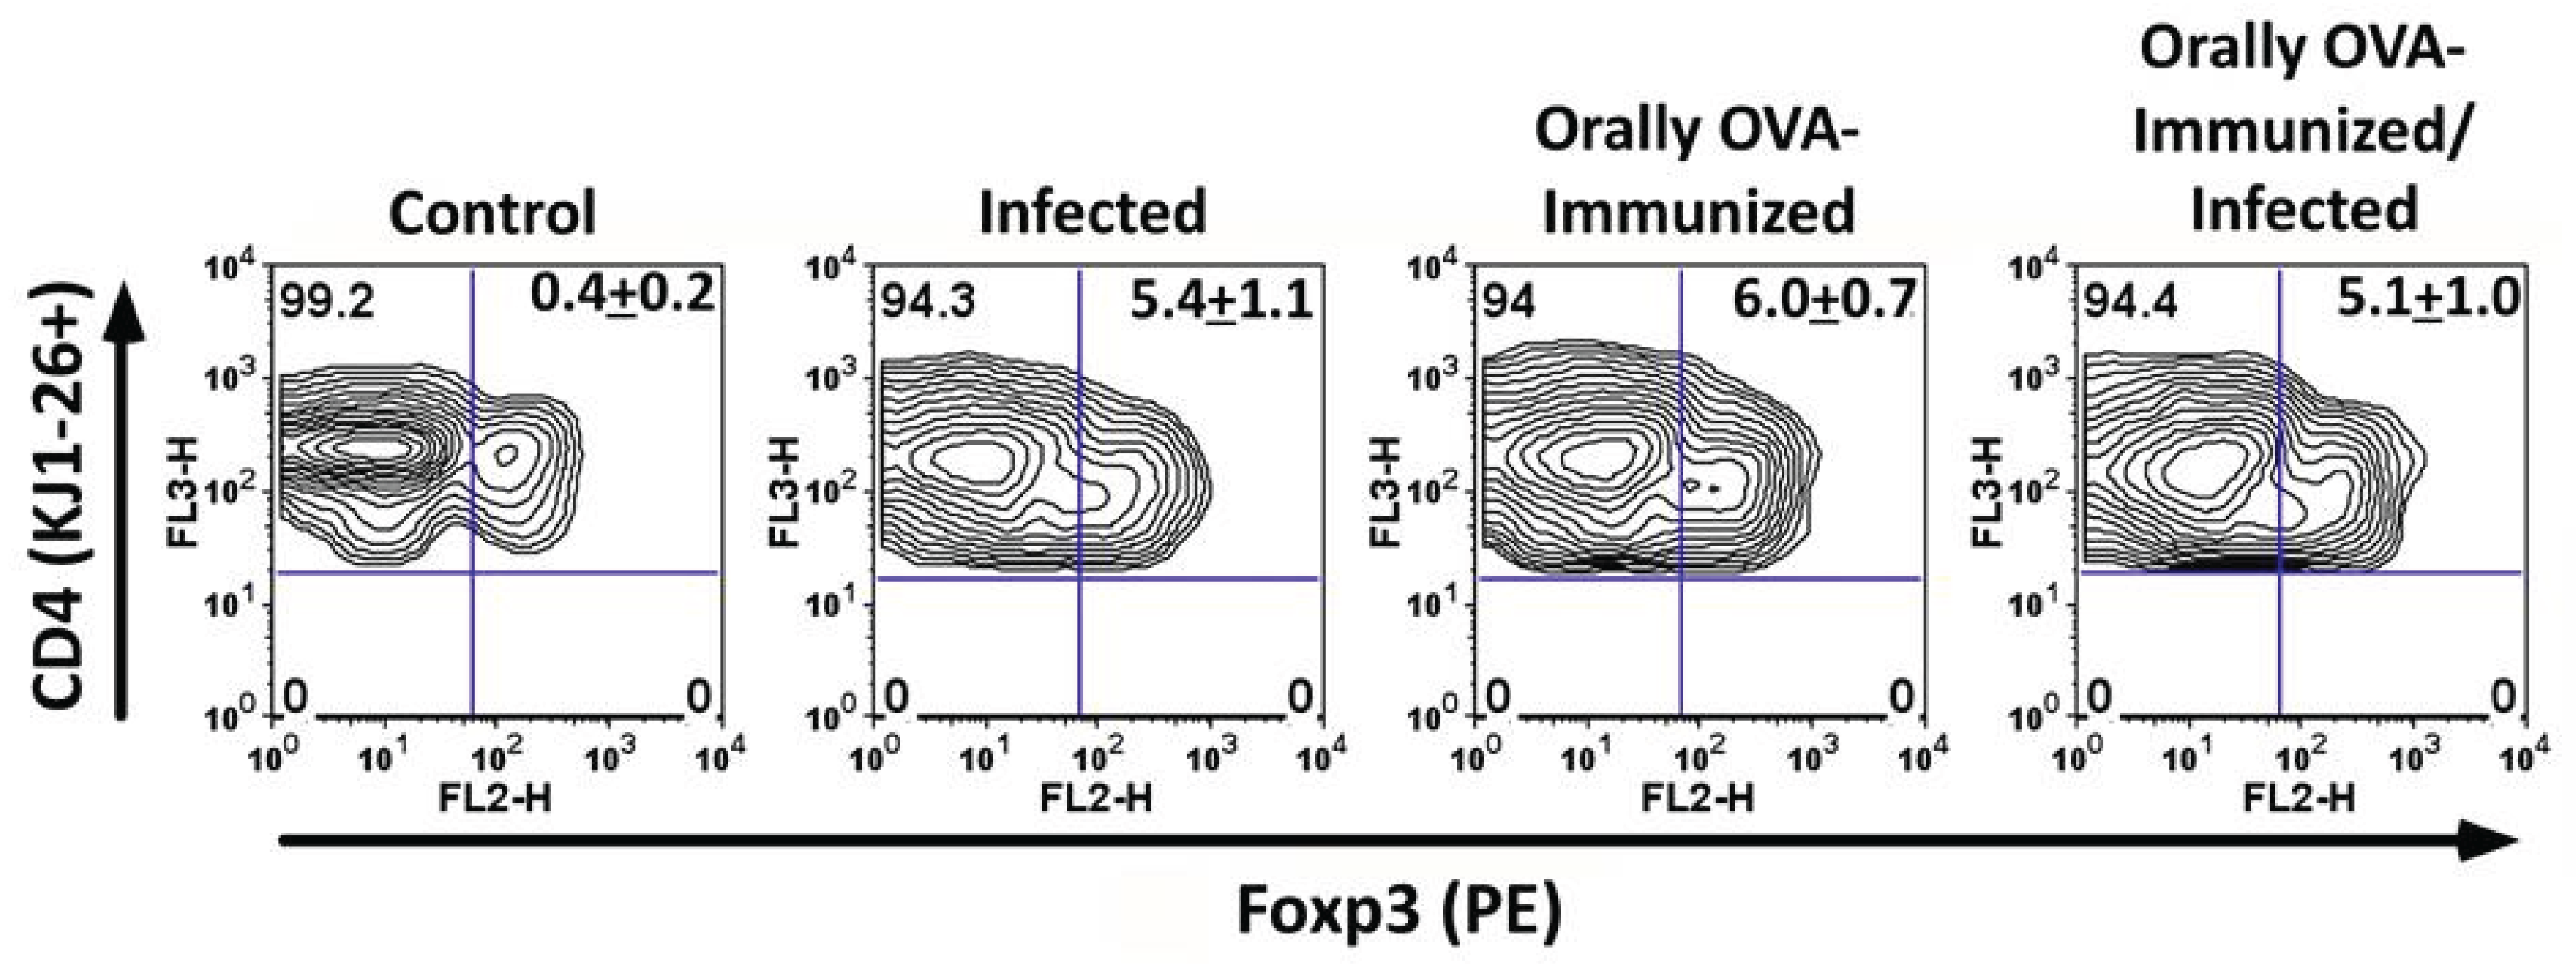
We also examined Foxp3 expression in DO11.10 CD4 T cells during acute T. cruzi infection. A considerable proportion of KJ1-26+ CD4 T cells upregulated Foxp3 in infected mice (Figure 4). This indicates that T. cruzi infection can induce the differentiation of a subset of DO11.10 CD4 T cells into regulatory T cells, potentially contributing to immune regulation during infection.
Discussion
Cross-reactivity is a well-known characteristic of CD8 T cells during T. cruzi infection ([15]). However, whether CD4 T cells also display cross-reactivity in this context has remained unclear. In this study, we demonstrate that DO11.10 CD4 T cells, which are specific for OVA 323–339 in the context of IAd, can be activated during acute T. cruzi infection. These cells not only acquired an effector memory phenotype but also produced pro-inflammatory cytokines such as IFN-γ and TNF-α. Moreover, a subset of these cells expressed IL-10 and Foxp3, suggesting the induction of a regulatory component.
The finding that DO11.10 CD4 T cells were activated in the absence of OVA strongly supports the hypothesis that cross-reactivity extends to CD4 T cells. This is consistent with previous work demonstrating extensive TCR cross-reactivity in CD8 T cells ([4,15]). Cross-reactivity may provide the immune system with flexibility to respond to a broad range of antigens, but it can also lead to potentially harmful outcomes, such as autoimmune responses ([5,6,7]).
Interestingly, prior oral exposure to OVA modified the cytokine profile of DO11.10 CD4 T cells during infection, increasing the proportion of IL-10–producing cells. Oral tolerance is known to promote regulatory T cell responses, and our findings suggest that prior antigen exposure can shape the outcome of cross-reactive responses during infection ([9,10,11]). This observation underscores the significance of environmental antigen exposure in shaping immune responses to pathogens.
The induction of Foxp3 expression in DO11.10 CD4 T cells during infection further supports the idea that T. cruzi can promote the differentiation of regulatory T cells. Regulatory T cells have been implicated in modulating the balance between protective immunity and immune-mediated pathology in Chagas disease ([2]). Thus, cross-reactivity in CD4 T cells may not only contribute to parasite persistence by diverting responses away from critical epitopes but also play a role in controlling immunopathology.
In summary, our results demonstrate that cross-reactivity in CD4+ T cells occurs during T. cruzi infection, a phenomenon similar to that observed in CD8+ T cells. This expands our understanding of T cell responses in Chagas disease and suggests that both effector and regulatory outcomes of cross-reactivity may significantly influence the course of infection.
References
- D.V. Andrade, K.J. Gollob, W.O. Dutra, Acute chagas disease: new global challenges for an old neglected disease, PLoS neglected tropical diseases 8(7) (2014) e3010. [CrossRef]
- F. Cardillo, R.T. de Pinho, P.R. Antas, J. Mengel, Immunity and immune modulation in Trypanosoma cruzi infection, Pathogens and disease 73(9) (2015) ftv082.
- P.M. Minoprio, A. Coutinho, M. Joskowicz, M.R. D’Imperio Lima, H. Eisen, Polyclonal lymphocyte responses to murine Trypanosoma cruzi infection. II. Cytotoxic T lymphocytes, Scandinavian journal of immunology 24(6) (1986) 669-79.
- D. Mason, A very high level of cross-reactivity is an essential feature of the T-cell receptor, Immunology today 19(9) (1998) 395-404.
- G. Petrova, A. Ferrante, J. Gorski, Cross-reactivity of T cells and its role in the immune system, Critical reviews in immunology 32(4) (2012) 349-72. [CrossRef]
- H.L. Lang, H. Jacobsen, S. Ikemizu, C. Andersson, K. Harlos, L. Madsen, P. Hjorth, L. Sondergaard, A. Svejgaard, K. Wucherpfennig, D.I. Stuart, J.I. Bell, E.Y. Jones, L. Fugger, A functional and structural basis for TCR cross-reactivity in multiple sclerosis, Nature immunology 3(10) (2002) 940-3. [CrossRef]
- U. Christen, K.H. Edelmann, D.B. McGavern, T. Wolfe, B. Coon, M.K. Teague, S.D. Miller, M.B. Oldstone, M.G. von Herrath, A viral epitope that mimics a self antigen can accelerate but not initiate autoimmune diabetes, The Journal of clinical investigation 114(9) (2004) 1290-8. [CrossRef]
- S. Sharma, P.G. Thomas, The two faces of heterologous immunity: protection or immunopathology, Journal of leukocyte biology 95(3) (2014) 405-16. [CrossRef]
- K.D. Moudgil, S.J. Thompson, F. Geraci, B. De Paepe, Y. Shoenfeld, Heat-shock proteins in autoimmunity, Autoimmune diseases 2013 (2013) 621417.
- R. van der Zee, S.M. Anderton, A.B. Prakken, A.G. Liesbeth Paul, W. van Eden, T cell responses to conserved bacterial heat-shock-protein epitopes induce resistance in experimental autoimmunity, Seminars in immunology 10(1) (1998) 35-41. [CrossRef]
- G. Zheng, T.T. Oo, S.S.S. Janjam, C. Ellis, S. Pallikonda Chakravarthy, S. Palani, W. Anthon, G. Tsaras, A. Williams, A. Feng, A. Chen, An antigen-less pro-vaccine for treating autoimmunity, Journal of immunology 214(7) (2025) 1477-1482. [CrossRef]
- Y. Belkaid, T.W. Hand, Role of the microbiota in immunity and inflammation, Cell 157(1) (2014) 121-41.
- F. Cardillo, R.P. Falcao, M.A. Rossi, J. Mengel, An age-related gamma delta T cell suppressor activity correlates with the outcome of autoimmunity in experimental Trypanosoma cruzi infection, European journal of immunology 23(10) (1993) 2597-605.
- F. Cardillo, A. Nomizo, J. Mengel, The role of the thymus in modulating gammadelta T cell suppressor activity during experimental Trypanosoma cruzi infection, International immunology 10(2) (1998) 107-16. [CrossRef]
- M.E. Bunkofske, P. Dash, W. Awad, P.G. Thomas, R.L. Tarleton, Highly cross-reactive and competent effectors dominate the CD8+ T cell response in Trypanosoma cruzi infection, Journal of immunology (2025). [CrossRef]
- K.M. Murphy, A.B. Heimberger, D.Y. Loh, Induction by antigen of intrathymic apoptosis of CD4+CD8+TCRlo thymocytes in vivo, Science 250(4988) (1990) 1720-3.
- P. Zhou, R. Borojevic, C. Streutker, D. Snider, H. Liang, K. Croitoru, Expression of dual TCR on DO11.10 T cells allows for ovalbumin-induced oral tolerance to prevent T cell-mediated colitis directed against unrelated enteric bacterial antigens, Journal of immunology 172(3) (2004) 1515-23. [CrossRef]
- J. Nihei, F. Cardillo, J. Mengel, The Blockade of Interleukin-2 During the Acute Phase of Trypanosoma cruzi Infection Reveals Its Dominant Regulatory Role, Frontiers in cellular and infection microbiology 11 (2021) 758273. [CrossRef]
- F. Cardillo, F.Q. Cunha, W.M. Tamashiro, M. Russo, S.B. Garcia, J. Mengel, NK1.1+ cells and T-cell activation in euthymic and thymectomized C57Bl/6 mice during acute Trypanosoma cruzi infection, Scandinavian journal of immunology 55(1) (2002) 96-104. [CrossRef]
Figure 1.
Quantitation of central and effector memory splenic DO11.10 transgenic CD4+ T cells. Spleen cells from different groups of transgenic mice, obtained on day 22 of infection, were studied. Each dot plot represents one mouse from the same experiment. In Figure 1B, the mean + SD of the percentages of central (white bars) and effector (black bars) memory KJ1-26+CD4+ T cells are shown. In these experiments, CD4+ spleen cells were magnetically sorted as described in the Materials and Methods section. Groups were of five mice each. The Mann-Whitney test was used to compare two different groups of mice. (**P < 0.01, ***P < 0.005).. Results are representative of at least three independent experiments. Data are shown as mean ± SD.
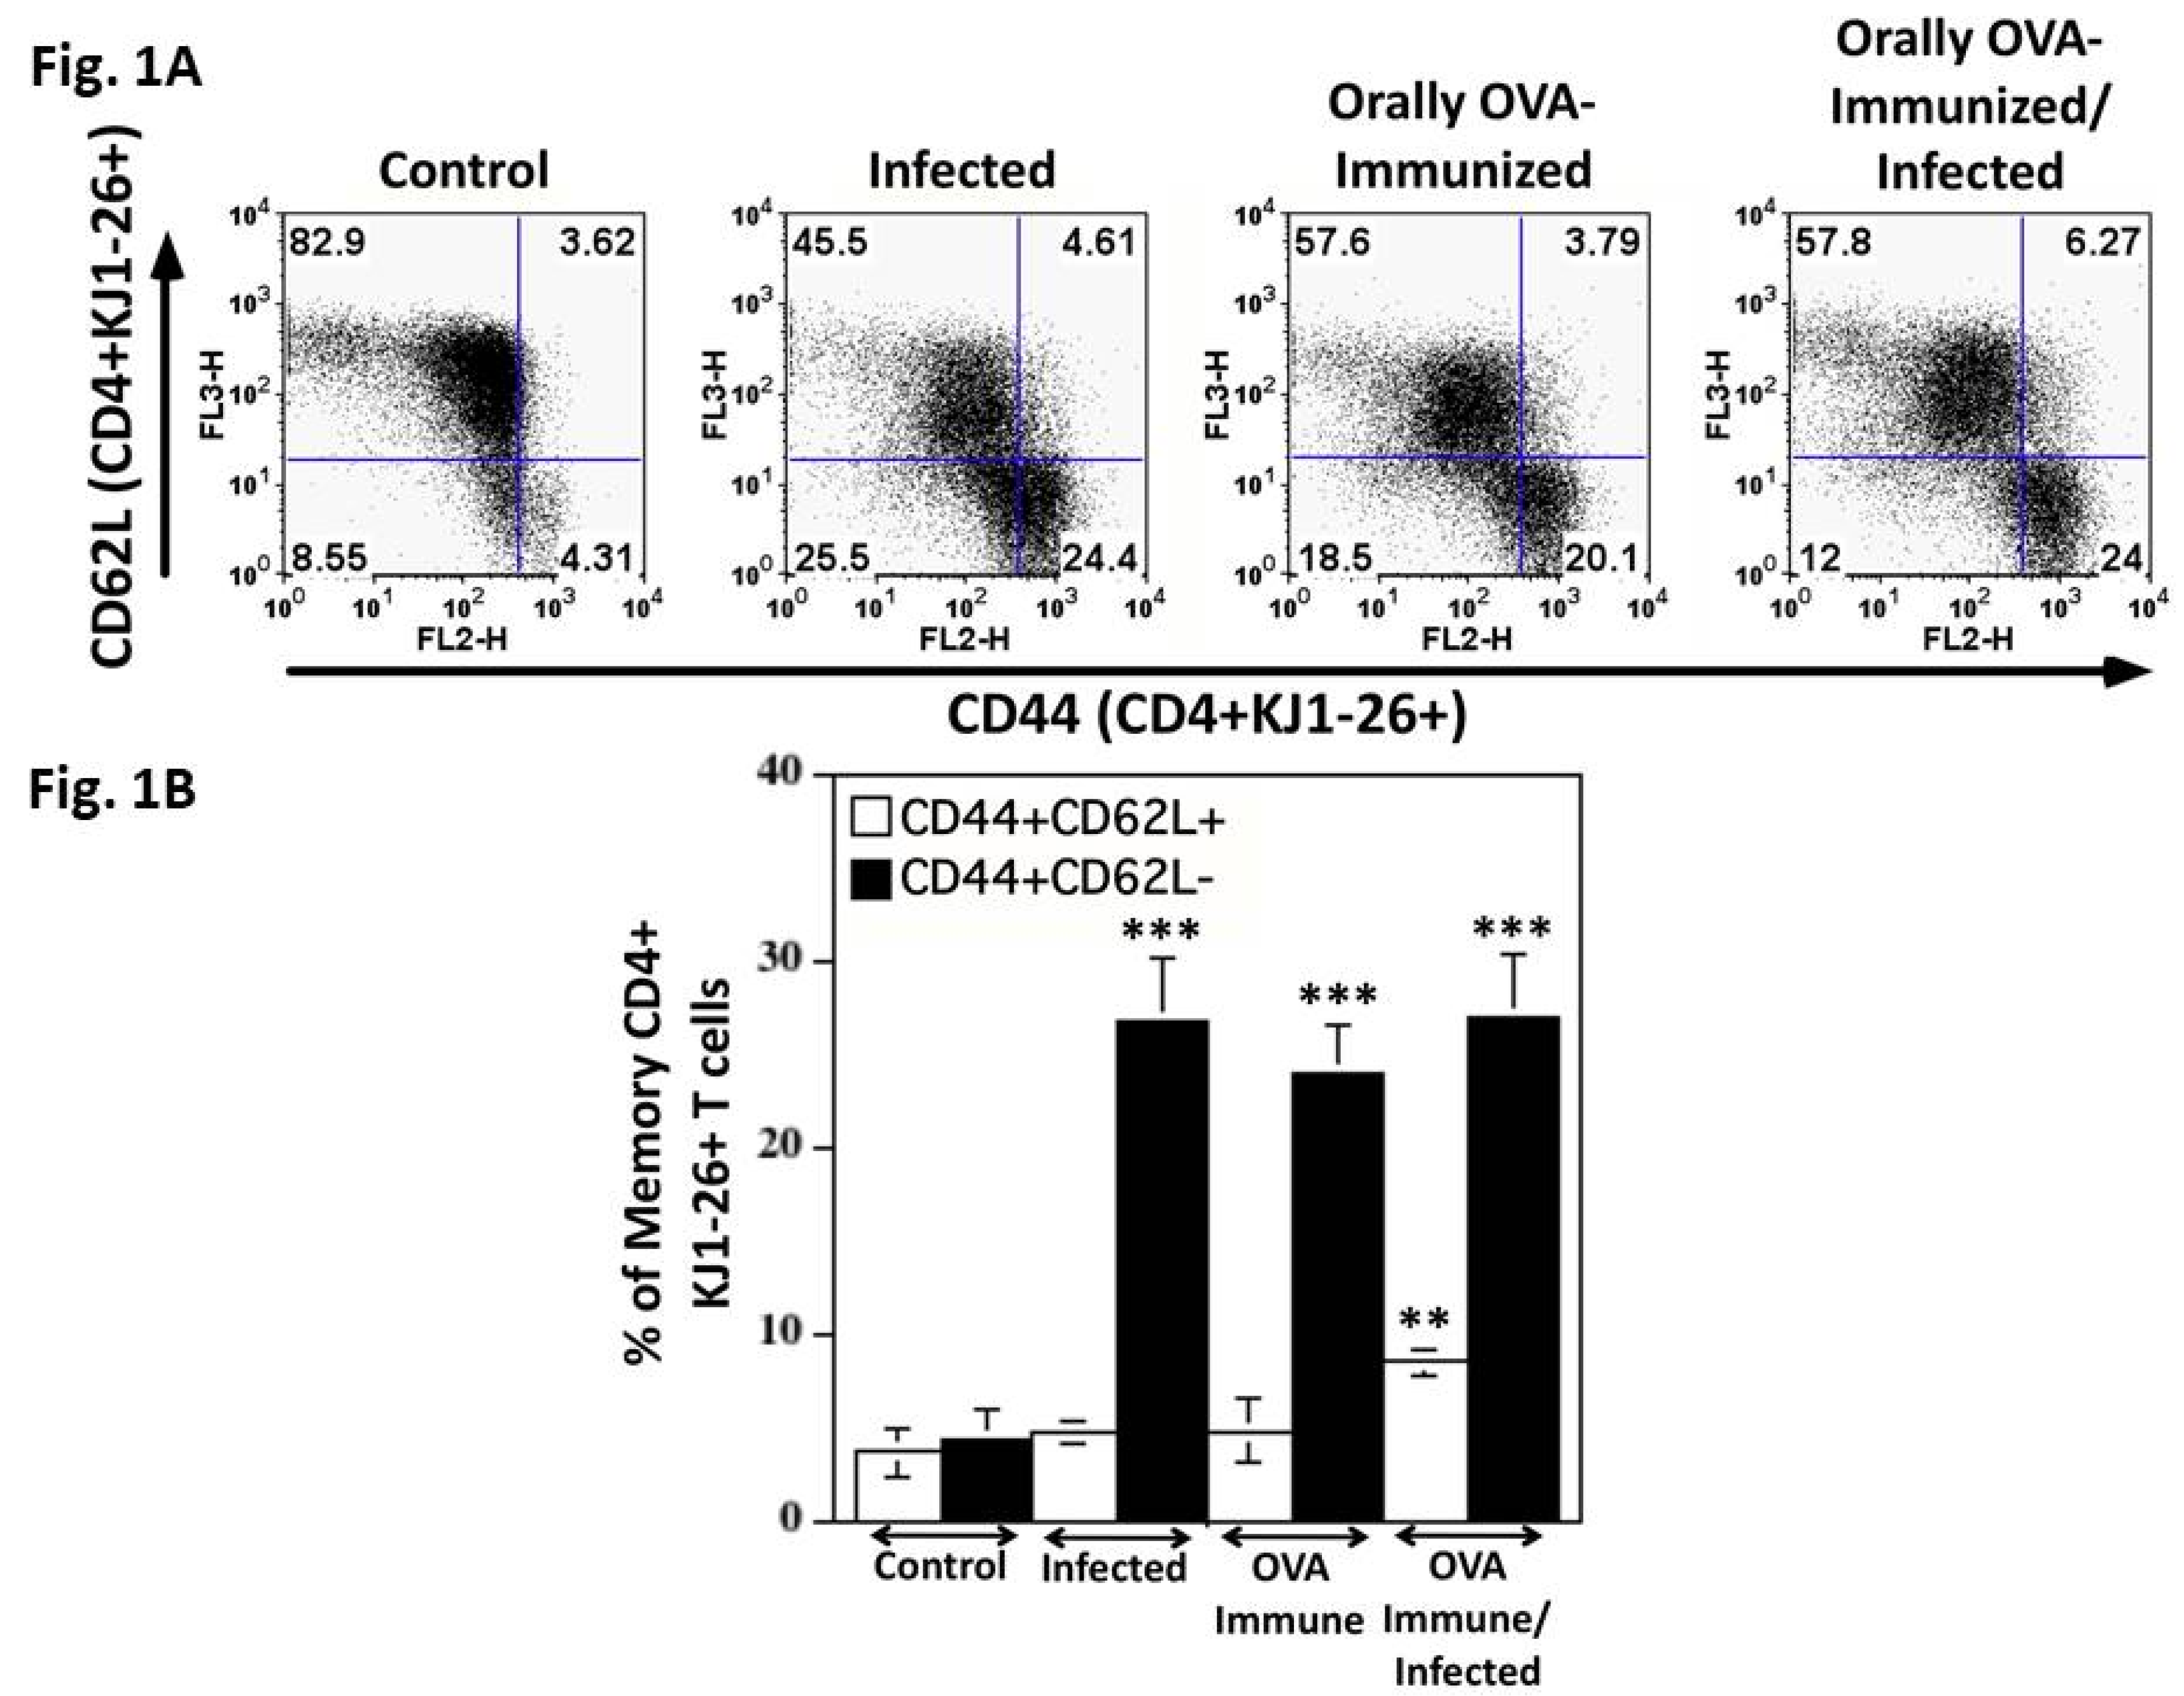
Figure 2.
The frequencies of DO11.10 transgenic T cells expressing TNF-α and IFN-γ increased during acute T. cruzi infection. The upper set of histograms shows the percentage of splenic TNF-producer CD4+ KJ1-26+ T cells from the different experimental groups. The lower set of histograms represents the percentage of DO11.0 transgenic T cells producing IFN-γ. To establish the lower limits for TNF or IFN-γ-expression, a negative control was established using isotype mAb controls (red line histogram). Numbers in the right upper corner of each histogram represent the mean of the percentage of TNF- or IFN-γ-producer cells + SD. Illustrative histograms from one animal for each experimental group are shown. Spleen cells from transgenic mice were cultured in complete medium for 24 h. Experiments were conducted 23 days after initial infection. Mice were analyzed individually (n = 5 per group). A total of three independent experiments were performed with similar results. Two groups were compared, using the Mann-Whitney test (P < 0.05 was considered statistically significant).
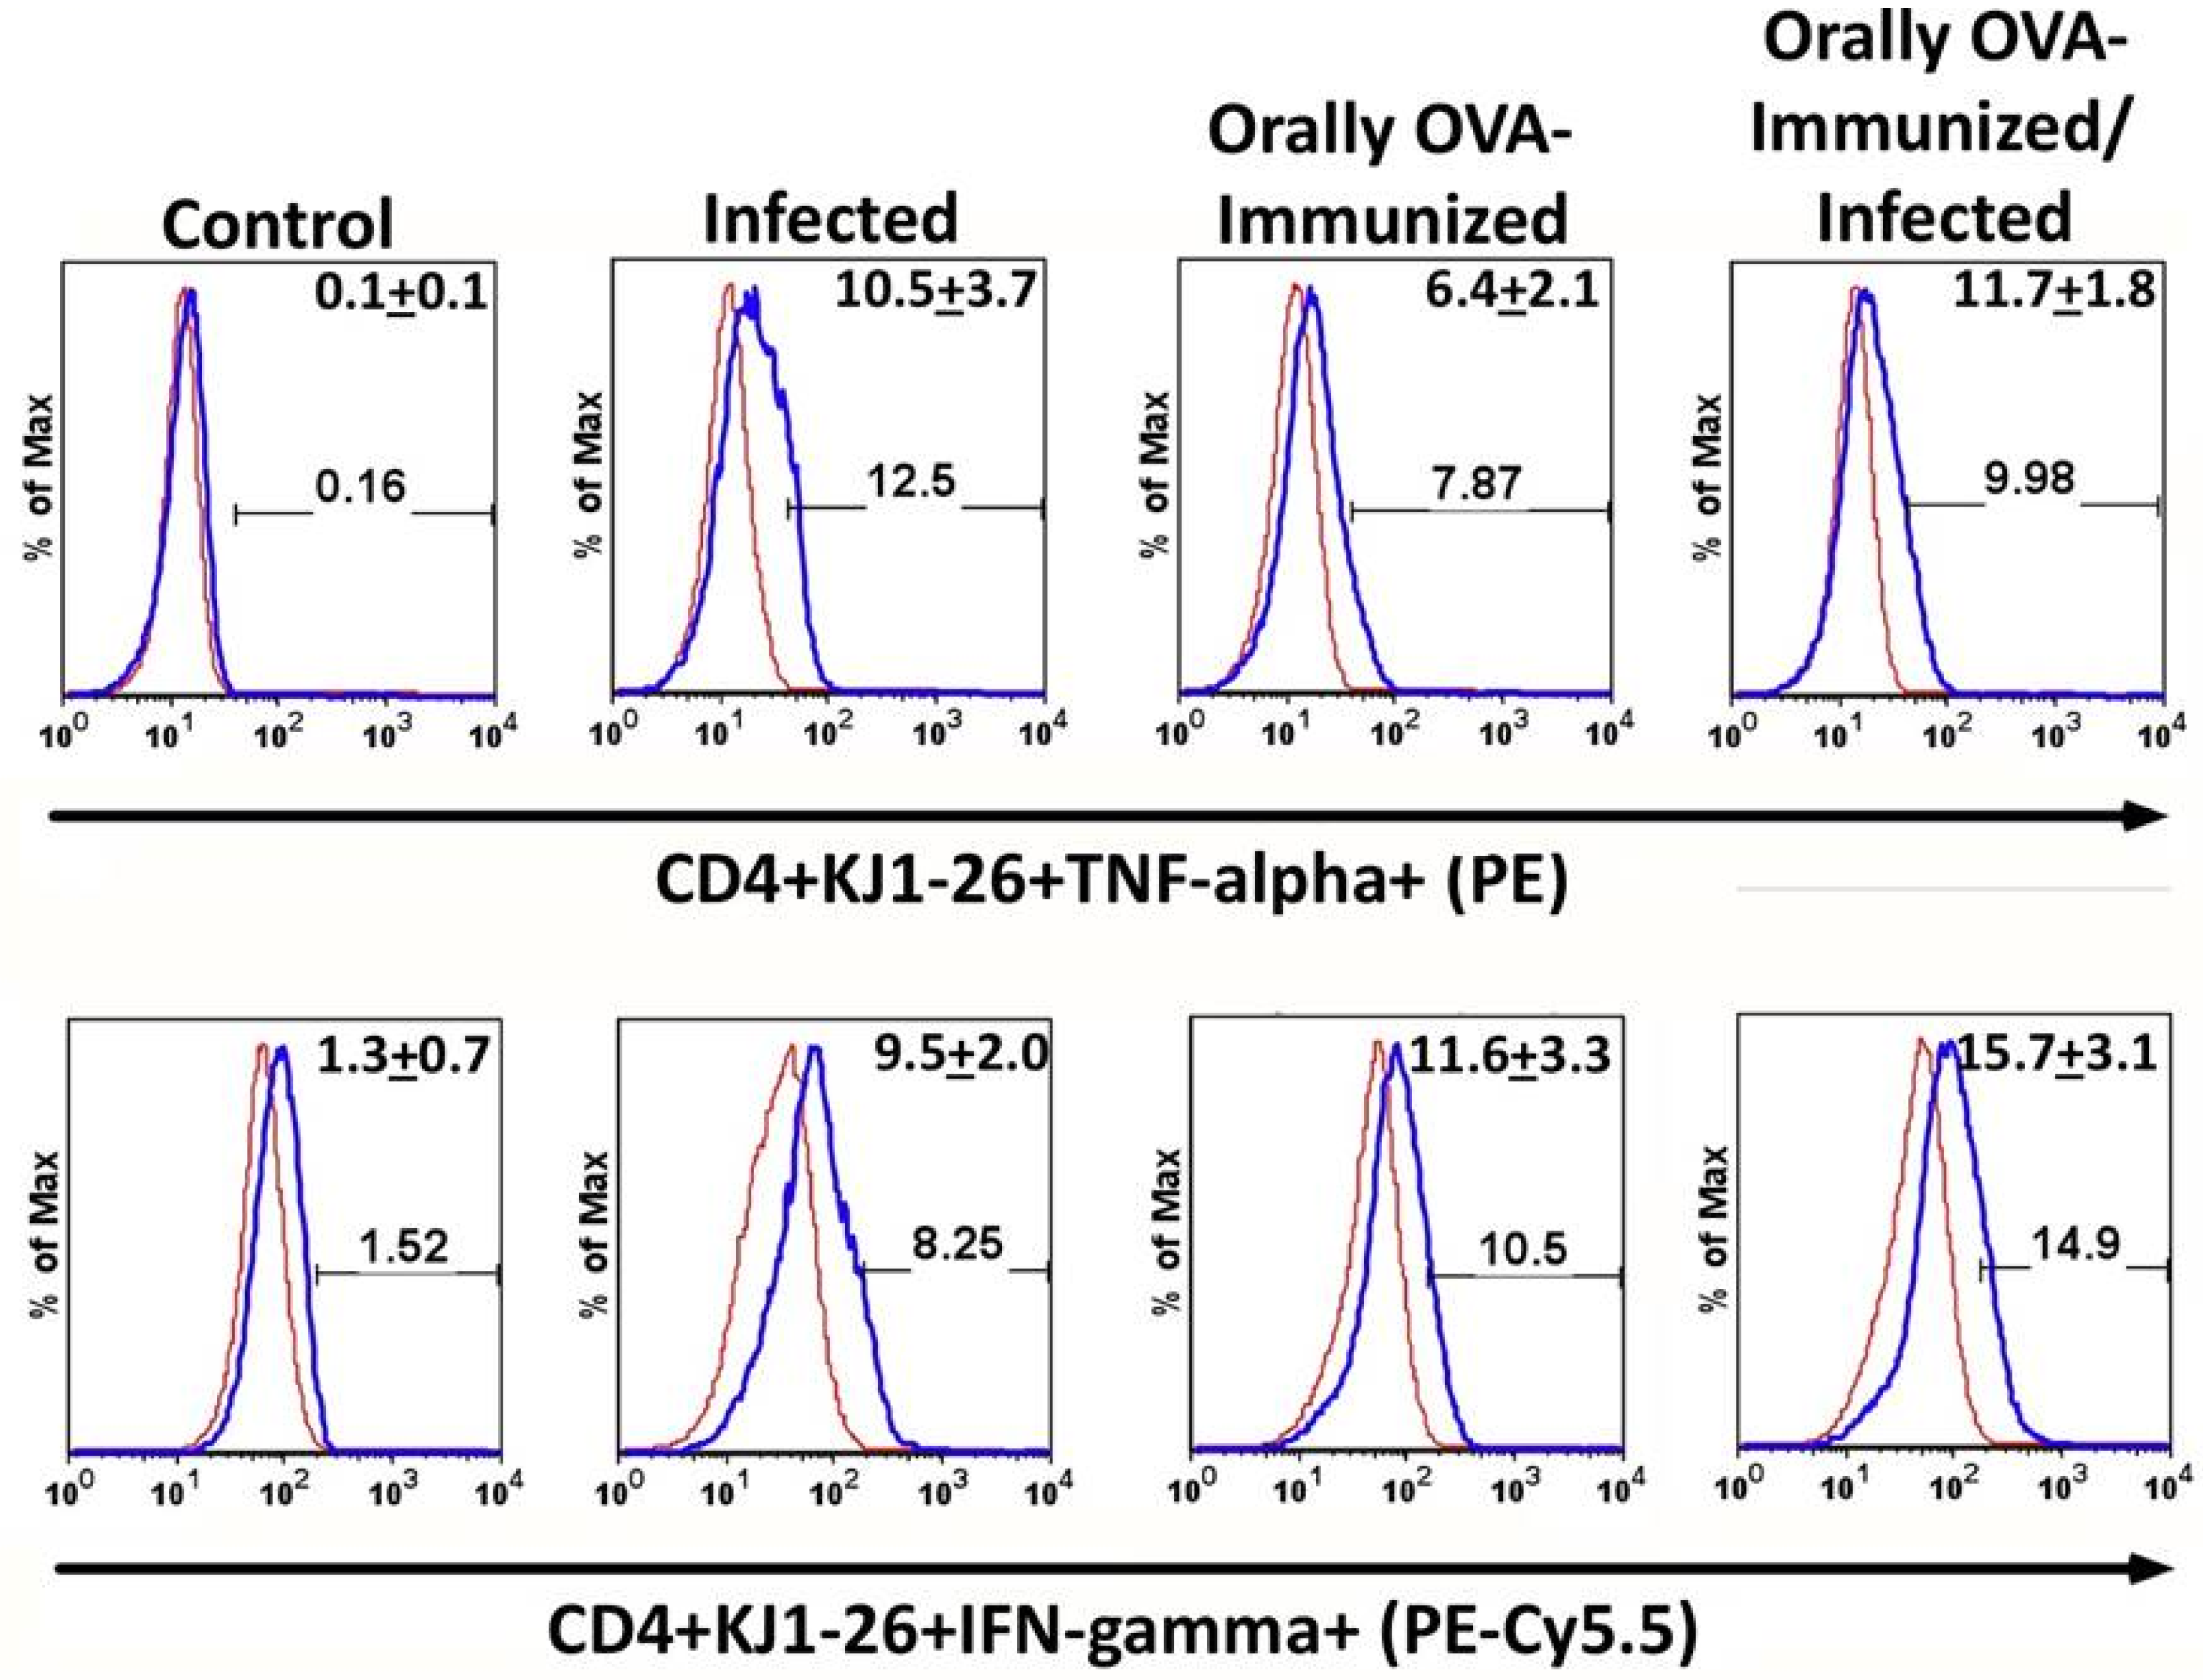
Figure 3.
Production of IL-4 and IL-10 by DO11.10 transgenic T cells upon T. cruzi infection. The upper and lower sets of histograms show the percentage of splenic IL-4 or IL-10-producing CD4+ KJ1-26+ T cells from the different experimental groups, respectively. To establish the lower limits for IL-4 and IL-10 expression, a negative control was established using isotype mAb controls (red line histogram). Numbers in the right upper corner of each histogram represent the mean of the percentage of IL-4 or IL-10 producer cells + SD. Illustrative histograms from one animal for each experimental group are shown. Spleen cells from transgenic mice were cultured in complete medium for 24 hours. Experiments were conducted 23 days after initial infection. Mice were analyzed individually (n = 5 per group). A total of three independent experiments were performed with similar results. Two groups were compared, using the Mann-Whitney test (P < 0.05 was considered statistically significant).
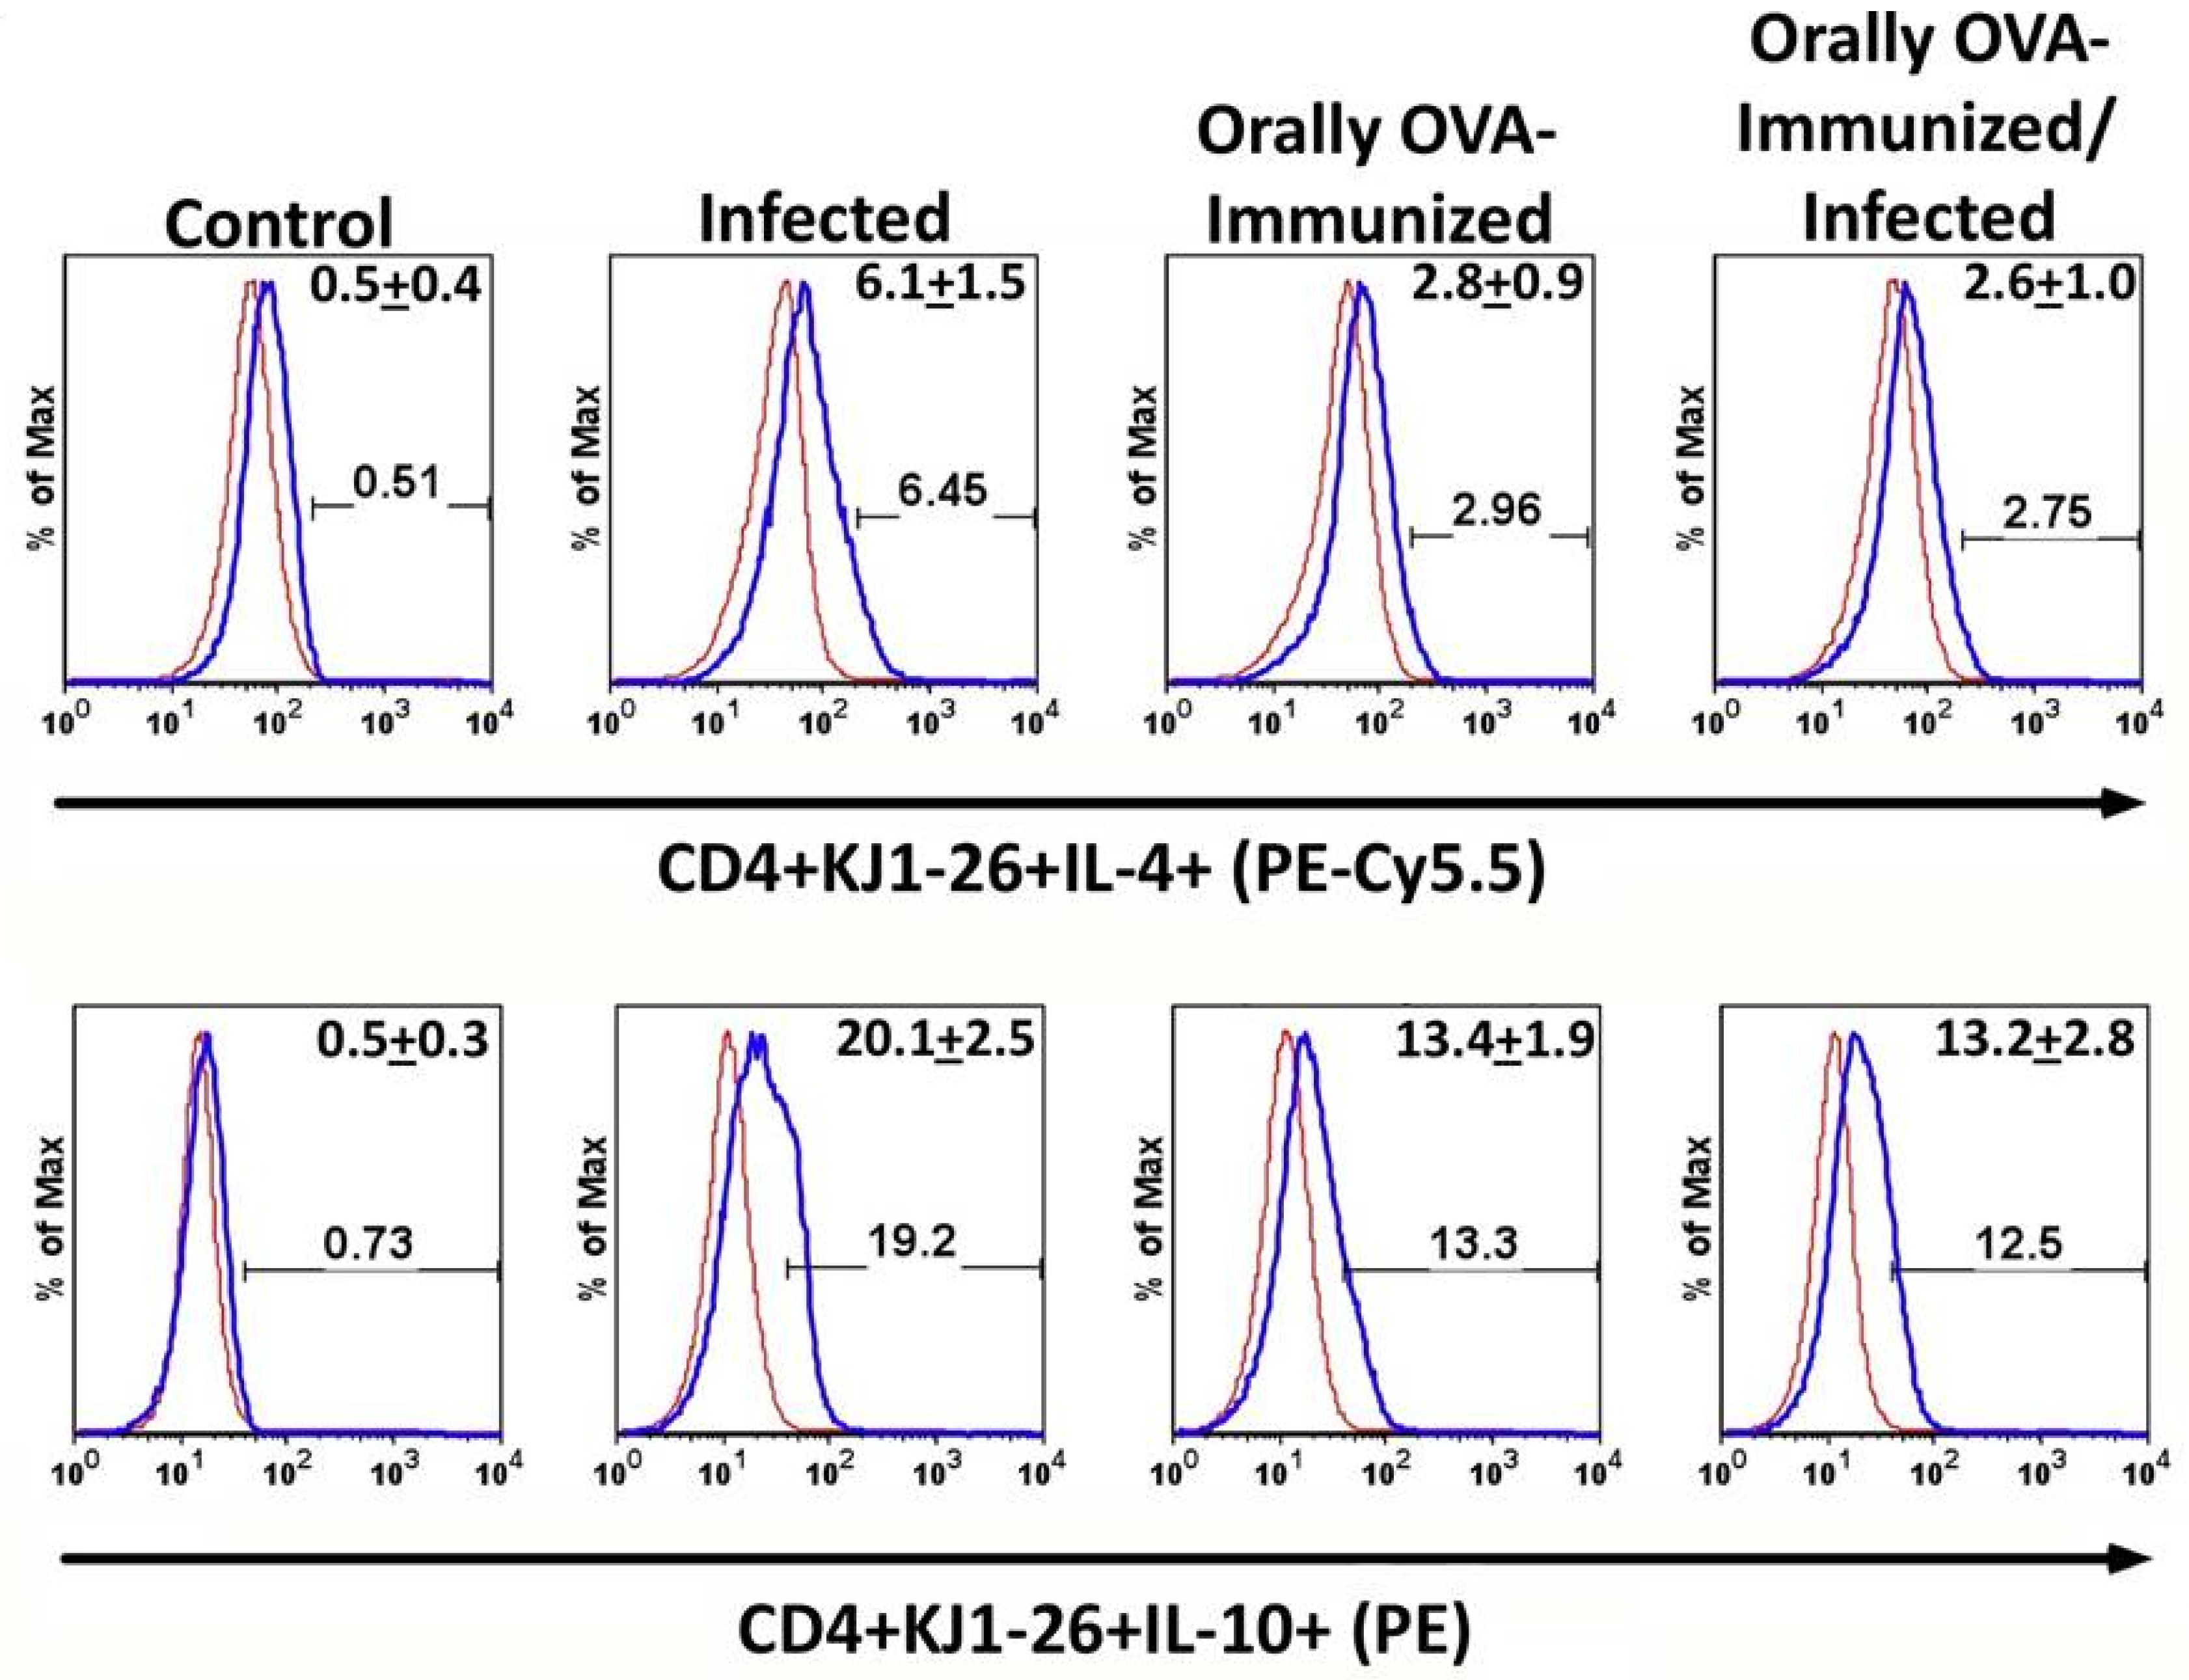
Figure 4.
Induction of Foxp3 expression in DO11.10 CD4 T cells during infection. Splenocytes from infected and control mice were analyzed for Foxp3 expression by flow cytometry. (A) Representative dot plots showing Foxp3 expression in KJ1-26+ CD4 T cells. (B) Percentage of Foxp3+ KJ1-26+ CD4 T cells. Data represent the mean ± SD from one representative experiment of two performed, P < 0.005, Mann-Whitney test.
Disclaimer/Publisher’s Note: The statements, opinions and data contained in all publications are solely those of the individual author(s) and contributor(s) and not of MDPI and/or the editor(s). MDPI and/or the editor(s) disclaim responsibility for any injury to people or property resulting from any ideas, methods, instructions or products referred to in the content. |
© 2025 by the authors. Licensee MDPI, Basel, Switzerland. This article is an open access article distributed under the terms and conditions of the Creative Commons Attribution (CC BY) license (http://creativecommons.org/licenses/by/4.0/).
Copyright: This open access article is published under a Creative Commons CC BY 4.0 license, which permit the free download, distribution, and reuse, provided that the author and preprint are cited in any reuse.


