
Submitted:
14 August 2025
Posted:
18 August 2025
You are already at the latest version
Abstract
This study investigates the high-pressure luminescence characteristics of Y2MoO6:Eu3+, a material prepared by a self-initiated and self-sustained reaction. Using a 405 nm laser diode and an Ocean optics spectrometer, we acquired emission spectra under varying pressures. While the pressure-dependent curve, based on the intensities of two key peaks, clearly showed a crystal phase transition, the resulting non-unique relationship between pressure and peak intensity hindered its use for precise sensing. We address this limitation by introducing a machine learning approach. Our method uses Uniform Manifold Approximation and Projection (UMAP) for initial data visualization and a deep neural network to accurately estimate pressure from the full luminescence spectrum.
Keywords:
high pressure
; luminescence
; machine learning
; deep learning
1. Introduction
The growing interest in using luminescent materials for high-pressure measurement, often doped with rare earths, highlights their potential in various industrial and scientific applications where the monitoring of this crucial physical parameter is essential [1,2,3,4,5,6,7,8,9].
This paper reports on a machine learning analysis of the high-pressure luminescence properties of :. The material, known for its excellent thermal and chemical stability due to the presence of ions in non-centrosymmetric sites [10,11,12], was prepared using a self-initiated and self-sustained reaction method, as detailed in a previous study [13].
According to the Judd-Ofelt (J-O) theory, materials doped with the ion are excellent candidates for optoelectronic devices because the luminescence of is highly sensitive to its local crystal environment [8,10,14,15]. For this reason, the ion is frequently used as a probe to monitor subtle changes in a material’s crystalline structure [8,16].
The unique properties of the ion are a direct result of its electrons. In a centrosymmetric structure, the outer shell electrons shield the electrons from the environment, which forbids electric dipole transitions and allows only magnetic dipole transitions. Conversely, in a non-centrosymmetric structure, electric dipole transitions can occur due to an interaction with an odd-parity crystal field [8,14,15].
High-pressure techniques offer a powerful way to systematically alter a crystal’s structure by changing interatomic bond lengths, bond angles, and atomic positions [17]. As Halevy et al. proposed, increasing external pressure has a similar effect on the host’s crystal structure as increasing temperature [18]. This manipulation of the crystal field directly impacts the luminescence properties of the material, which is why high pressure is used as a tool to study and tune these characteristics [8,16].
While recent studies in high-pressure sensing have largely concentrated on developing new luminescent probes, advancements in spectral data analysis methods have been comparatively limited. This gap highlights a promising opportunity for machine learning (ML) algorithms, which have seen a surge of interest for investigating various scientific and social data sources in recent publications [19,20,21,22], and the references therein.
Machine learning (ML) is increasingly employed to analyze luminescence, near-infrared, and other spectral data [23,24,25,26,27,28,29,30,31,32]. Traditional analysis methods, however, typically rely on a single, empirically chosen spectral parameter. While this approach is widely used for remote thermometry, publications on high-pressure measurements using luminescence are less numerous. Both fields, however, often share this same calculation method, highlighting a common limitation in their analytical techniques.
While our previous research on the phosphor [33] successfully used a single spectral feature (e.g., intensity ratio or spectral shift) for thermometric and high-pressure measurements, this approach inherently limits accuracy and resolution by only partially utilizing the available spectral data. The method was effective in that specific case because the phosphor did not undergo a phase transition. However, a similar single-parameter approach is inadequate for the phosphor investigated here, as it undergoes a crystal phase transition, rendering a simple calibration curve ineffective across the full measurement range. In contrast, the deep learning neural network approach developed by the authors of [32] demonstrates the potential to fully exploit temperature-dependent spectral data by extracting multiple features, an approach that is necessary to overcome the challenges presented by our current material.
Our study investigates the pressure effects on the optical properties of a nanophosphor, with a focus on improving the accuracy of high-pressure measurements using a machine learning (ML) approach. To our knowledge, this is the first time ML has been applied to enhance high-pressure measurements in this manner. For our analysis, we used the Uniform Manifold Approximation and Projection (UMAP) method for initial data visualization and a deep learning artificial neural network to predict pressure intensity based on luminescence spectral data.
2. Materials and Methods
The powder was synthesized using a self-initiated and self-sustained reaction method. To ensure full crystallinity, the material was then calcined at different temperatures, as detailed in [13]. The photoluminescence emission spectrum was characterized using a 405 nm laser diode for excitation and an Ocean optics spectrometer for detection. The pressure dependence of the emission spectrum was then measured, and a pressure-dependent plot was constructed based on the intensity ratio of two prominent peaks.
While the experimental setup for luminescence measurements as a function of temperature and pressure is described in [33], we will now focus specifically on the setup used for high-pressure measurements.
2.1. Experimental Setup for High-Pressure Measurements
High pressure was generated using a Membrane Diamond Anvil Cell (MDAC) manufactured by BETSA, which featured a culet diameter. The fundamental principle of a Diamond Anvil Cell (DAC) is to create very high pressures by applying a reasonable mechanical force to a tiny surface area (the culet). While earlier DAC models used a screw to apply this force, the MDAC achieves fine control and adjustment through pressurized helium, which presses a circular membrane against a piston.
The powdered sample, along with a pressure transmitting fluid and a small ruby sphere, was placed inside a metal gasket. The gasket was pre-indented between the diamond anvils to create a secure, leak-proof seal. We used a 4:1 mixture of methanol and ethanol as the pressure transmitting medium to ensure a uniform pressure distribution on the sample.
Since the diamond anvils are optically transparent, we were able to perform optical measurements on the pressurized sample. The applied pressure was accurately determined by measuring the redshift of the ruby R1 fluorescence line.
2.2. Machine Learning Analysis
To perform our machine learning (ML) analysis, we used the Solo+Mia software package (Version 9.1, Eigenvector Research Inc, USA) [36]. This user-friendly software was chosen for its accessibility, allowing individuals without programming expertise to analyze data.
Early on, we determined that our number of measurements was insufficient for effective ML training. To overcome this, we employed an image data augmentation technique, as surveyed in [37], to expand our training dataset. Specifically, we generated new data by adding random noise to the original measured samples, a method we successfully utilized in a previous study [38].
3. Results
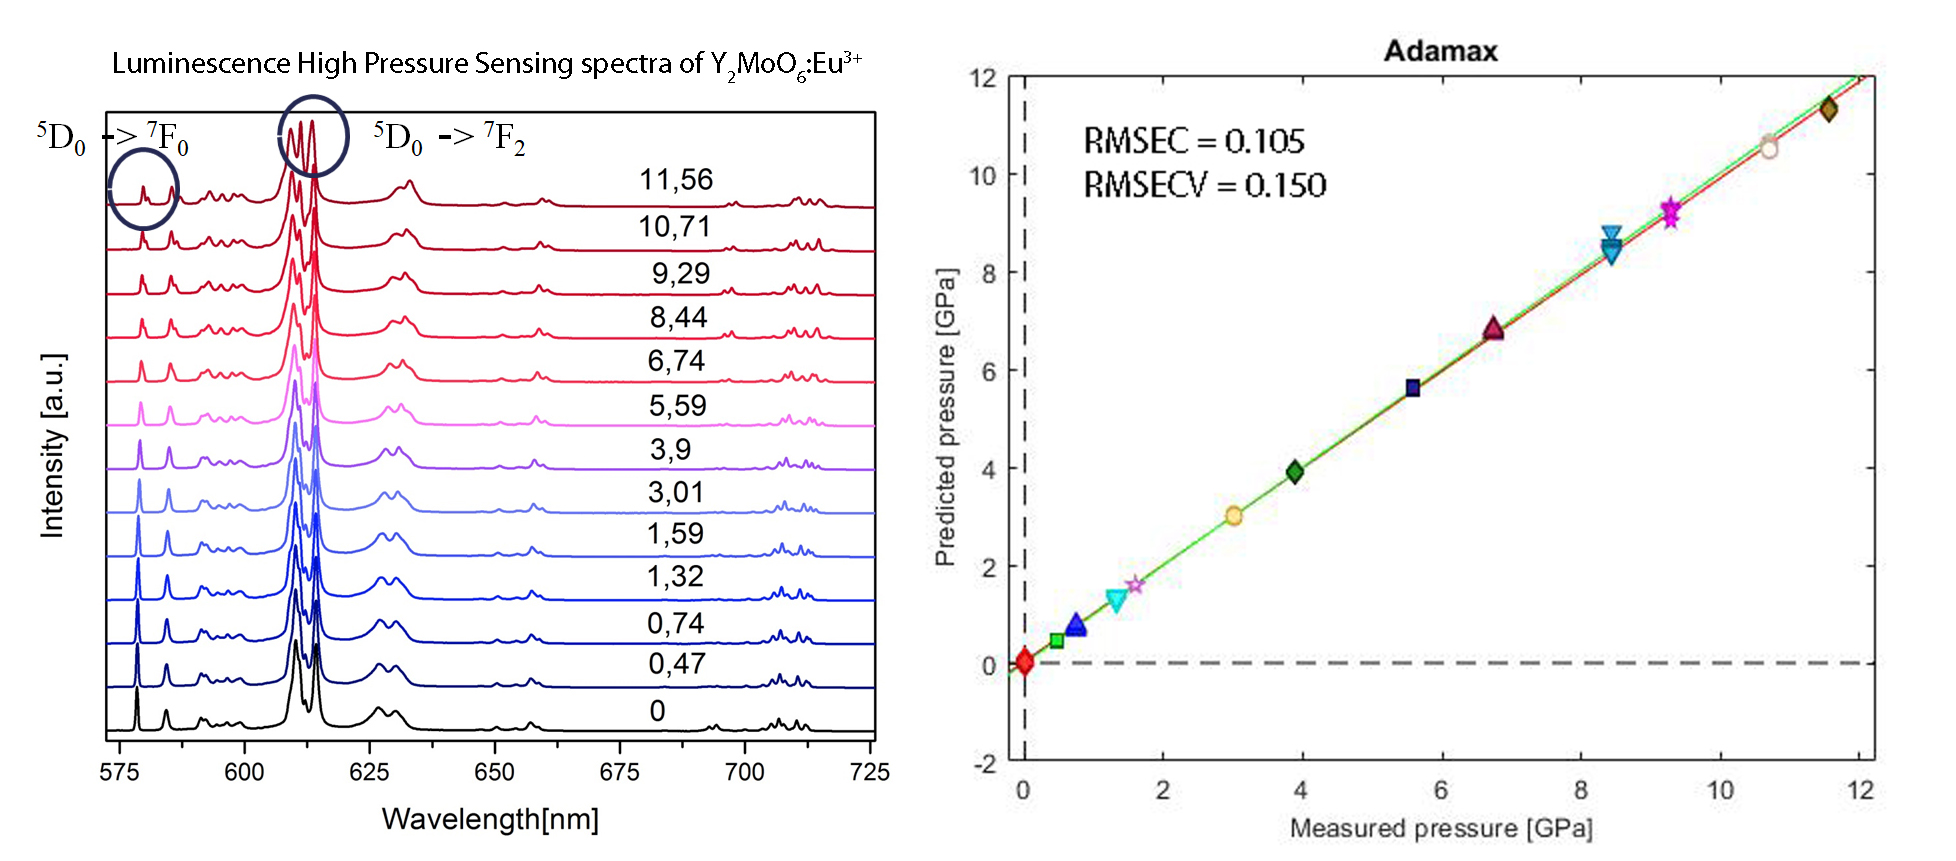
To analyze how high pressure affects the photoluminescence emission of the nanophosphor, we measured its spectral responses at various pressures. The resulting luminescence spectra are presented in Figure 1.
Rare earth ions are well known for their high sensitivity to local symmetry, which makes any change in the crystal structure observable in their luminescence spectra [39]. The paper by Zhang et al. [8] provides a detailed explanation of how pressure-induced phase transitions in a crystal structure affect the luminescence of the ion.
Specifically, as pressure increases, two key changes occur in the luminescence spectrum:
– Red shift of emissions: This is attributed to the expansion of the orbital.
– Change in relative intensity ratio: This variation is caused by a change in the crystal field, which is a direct consequence of the pressure-induced phase transition.
Both of these effects could be seen in Figure 1.
Pressure-induced changes to the crystal lattice parameters also disturb the energy level positions, particularly those of the and states. This variation, along with changes in the charge transfer region, increases the probability of non-radiative transitions. As shown in Figure 1, the applied pressure predominantly affects the level.
The exact positions of the luminescence peaks used for calculating intensity ratios are at 584 nm (→) and 614 nm (→) at atmospheric pressure. A slight variation in the intensity of the most prominent → transition line can also be observed in Figure 1. The resulting intensity ratios of the emission lines from the states are presented in Figure 2.
A change in a luminescence spectrum, such as a deformation or discontinuity, implies a phase transition. Such transitions are easily identified when the measured data points cannot be accurately fitted by a single curve, suggesting that different segments of the data correspond to distinct physical models.
As shown in Figure 2, the intensity ratio calibration data for the nanophosphor exhibits these discrepancies across the measured pressure range. This confirms that our sample underwent a pressure-induced phase transition, with different segments of the data corresponding to separate crystal phases. Consequently, the resulting curve lacks a unique and consistent relationship between the peak intensities and pressure, making it unsuitable for a reliable calibration method.
To enhance our analysis, we applied machine learning techniques to the data. For clearer visualization of the results from the UMAP and deep learning methods, we employed a color-coding system. Figure 3 shows the specific color scheme used to represent the different measured pressures of the sample.
Figure 4 shows the UMAP clustering of the high-pressure data for the sample. The data points are clearly grouped, with a strong correlation between the proximity of points in the intensity ratio data (from Figure 2) and their arrangement in the UMAP embeddings plot. While it is important to note that UMAP, unlike methods such as Principal Component Analysis, does not have a direct physical analogy, we have consistently found it to be the most effective visualization method for this type of spectral data in both this and our previous studies.
After successfully visualizing our data with UMAP, we began using a deep learning neural network to model the measured spectra. Following a period of trial and error, we found that a network with two hidden layers, each containing 100 neurons, provided the best results.
3.1. Model and Training Configuration
After extensive experimentation, we configured our deep learning model using the Relu activation function. We found that the Adam and Adamax optimizers performed best, with Adamax showing a slight edge in performance. Based on the learning curves in Figure 5 and Figure 6, we set the number of epochs to 60 for the Adam optimizer and 50 for Adamax. The learning curve for Adamax demonstrated a slightly more consistent and stable convergence pattern compared to the one for Adam.
We used a Venetian blind cross-validation method with a 10-fold split, meaning 90 % of the data was used for training and 10 % for validation in each sub-validation experiment. After further testing, we selected a batch size of 10, a value different from the default setting in the Solo software.
3.2. Data Preprocessing
Before training, the data underwent a two-step preprocessing procedure using built-in options in the SOLO software. First, a 1-Norm (area=1) normalization was applied to the dataset. The data was then smoothed using a Savitzky–Golay filter with a width of 5, a polynomial order of 0, and weighted tails.
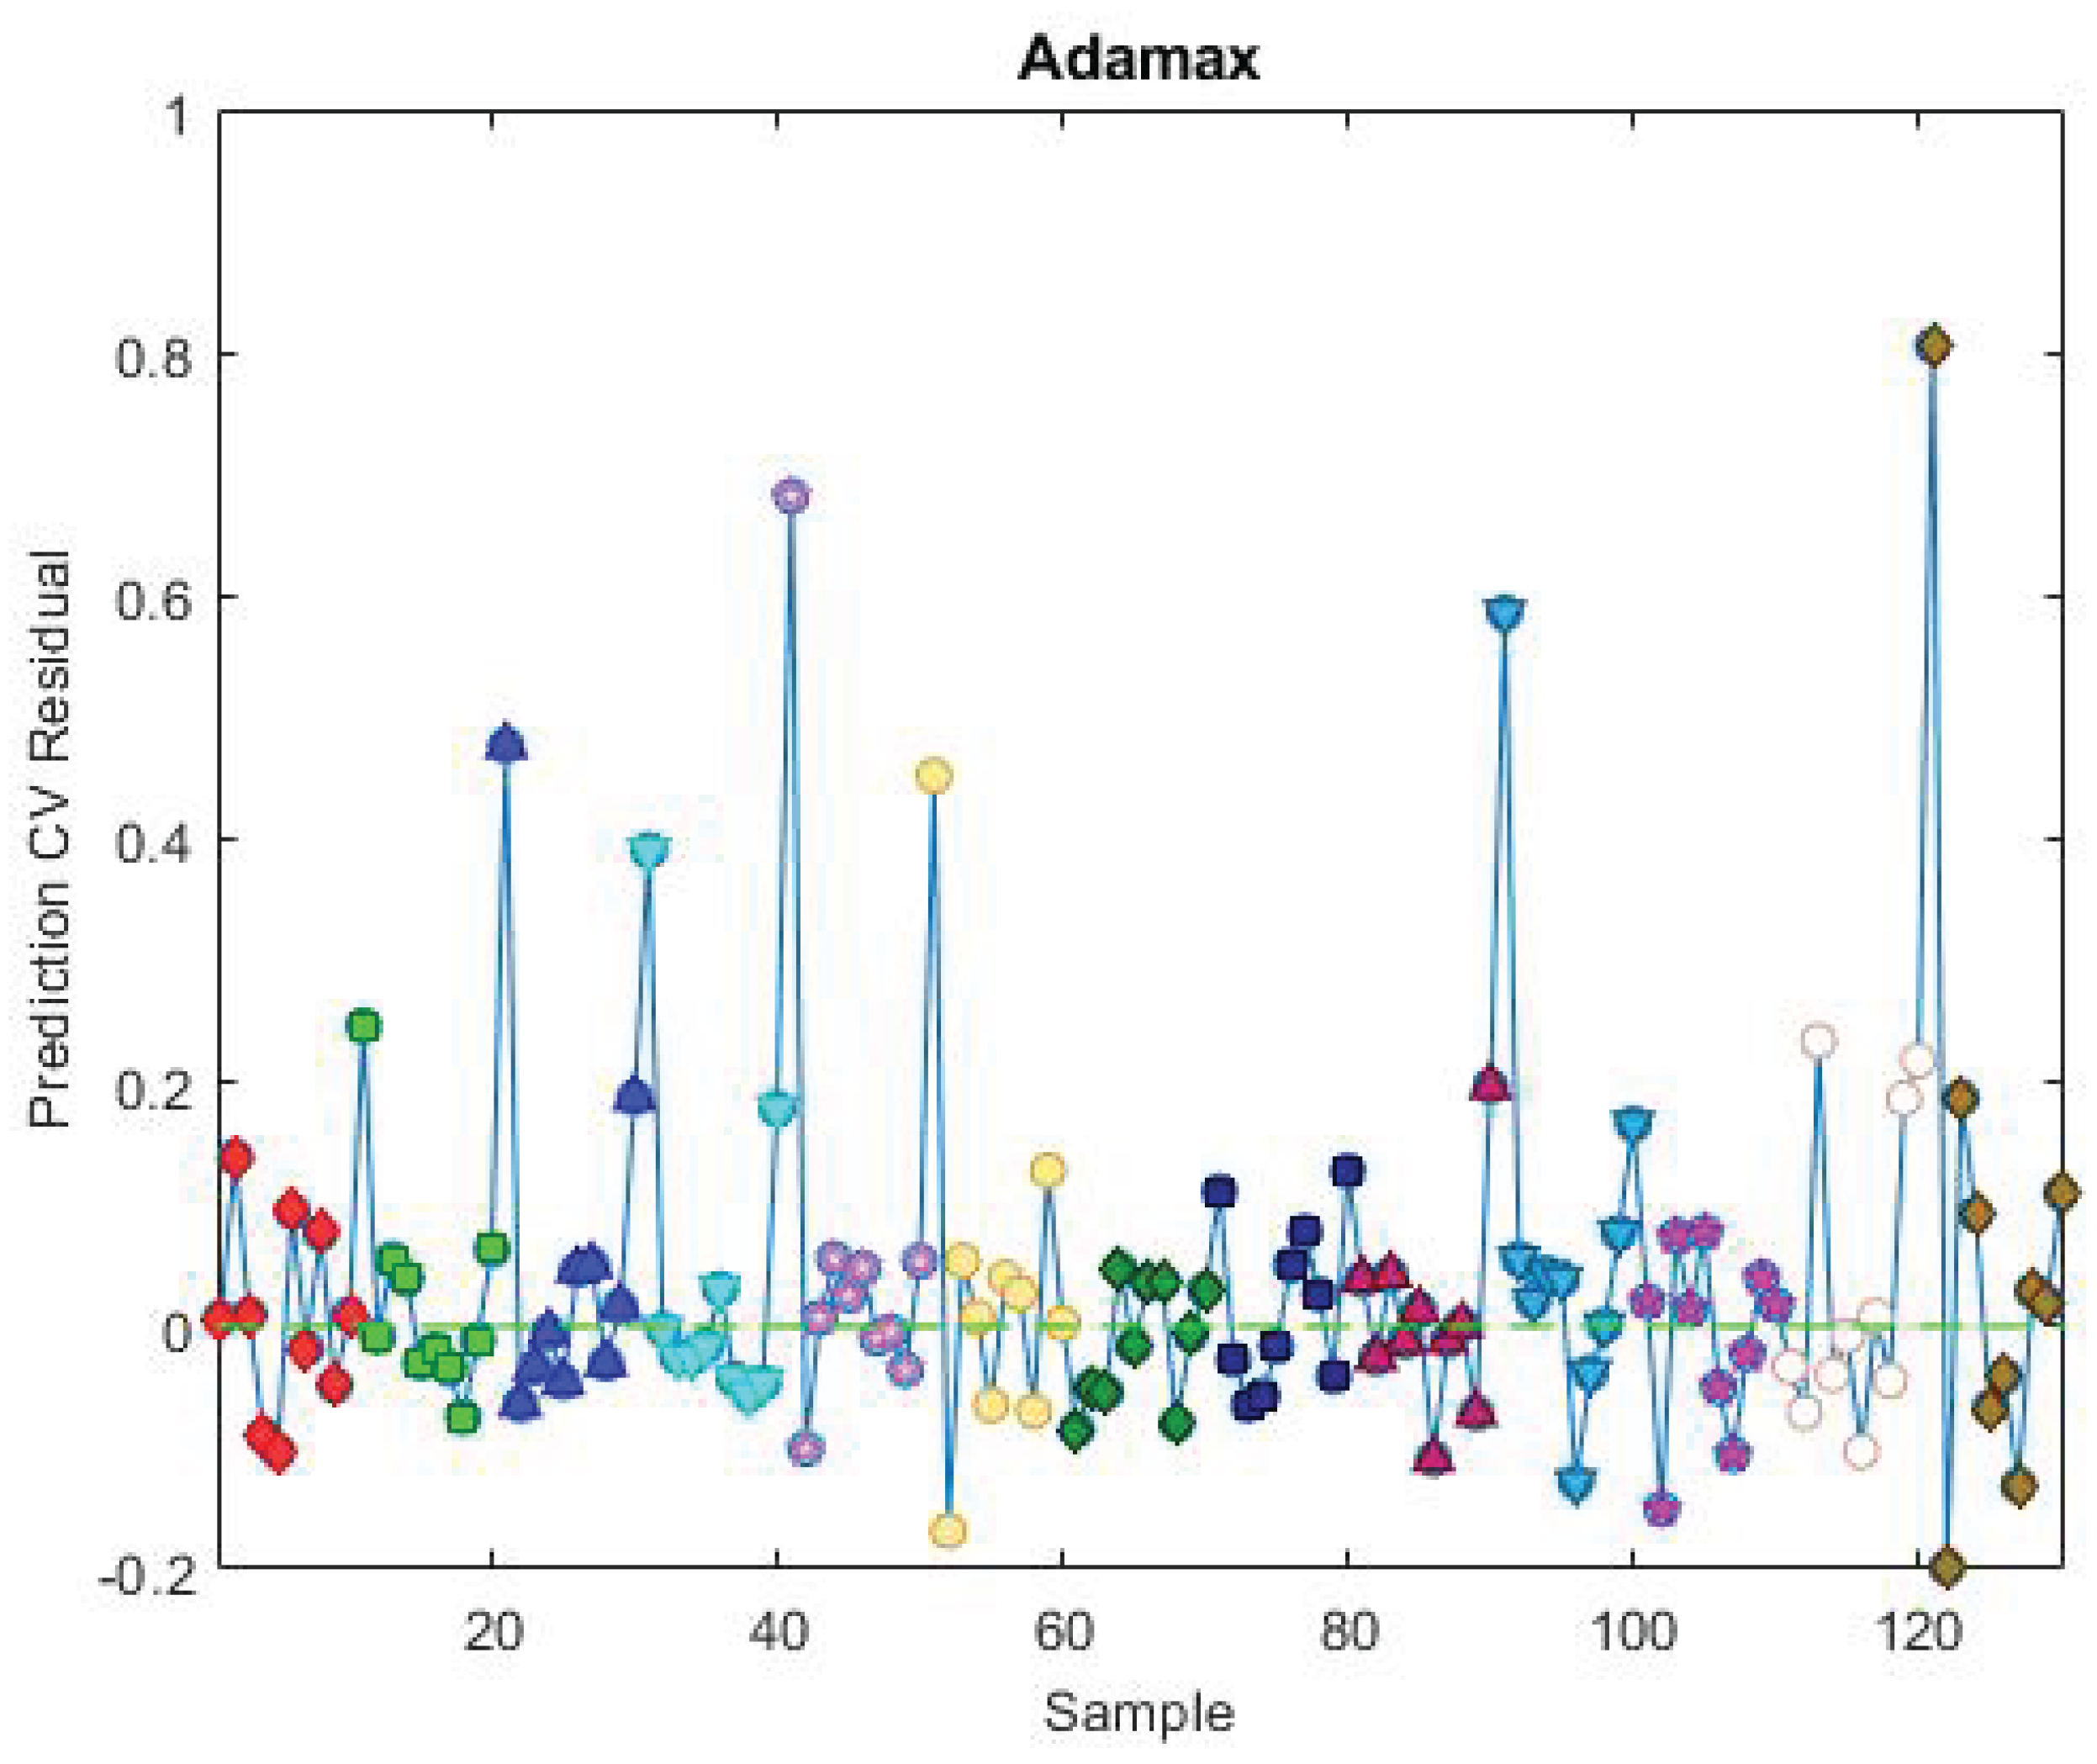
Figure 7 and Figure 8 display the deep learning model’s predictions versus the measured pressures for the Adam and Adamax optimizers. The performance metrics for Adam are RMSEC (root-mean-standard error of calibration) = 0.106 and RMSECV (root-mean-standard error of cross-validation) = 0.312. The Adamax optimizer demonstrated superior performance, achieving a slightly better RMSEC of 0.105 and a significantly lower RMSECV of 0.150. This indicates that while both optimizers behaved similarly on the training data, Adamax showed a marked advantage in its ability to generalize and make accurate predictions on new, unseen data. These errors are quite satisfactory, as visually confirmed by the plots.
4. Discussion and Conclusions
In this study, we successfully demonstrated the potential of using machine learning (ML) to improve high-pressure luminescence sensing. The UMAP visualization method confirmed that our augmented experimental data could be effectively grouped by pressure, validating its suitability for ML analysis. We then showed that a deep learning neural network could accurately predict the applied pressure based on the measured luminescence spectra. To our knowledge, this is the first study to present such a machine learning-based improvement for high-pressure sensing.
While the nanomaterial used in this research has a more limited measurement range compared to some other hosts and dopants in the literature [1,3,5,6,7,8,9], its performance is slightly superior to others [2,4]. Our primary goal, however, was not to maximize the measurement range but to provide a method that fully utilizes all available information from the measured spectra, enabling a more complete and accurate analysis within the working range of the material.
We employed a machine learning (ML) approach to improve high-pressure measurements from the optical spectra of . This method moves beyond the conventional technique of using only the intensity ratio or spectral shift of select spectral peaks. Instead, we trained a computer model to recognize the complete spectral signature associated with different pressures, which allowed us to incorporate both peak intensity ratios and spectral shifts. This advanced analysis successfully extended the useful pressure range of the material to 12 GPa, representing a significant improvement over traditional methods.
Author Contributions
Conceptualization, D.S., M.S.R. and M.G.N.; methodology, D.S., M.S.R. and M.G.N..; software, D.S. and M.S.R.; formal analysis, D.S., M.S.R. and M.G.N.; investigation, D.S., M.S.R. and M.G.N.; resources, M.G.N.; writing—original draft preparation, D.S. and M.S.R.; writing—review and editing, D.S. and M.S.R. All authors have read and agreed to the published version of the manuscript.
Funding
This research was funded by the Institute of Physics Belgrade, through the grant by the Ministry of Science, Technological Development and Innovations of the Republic of Serbia.
Data Availability Statement
The original contributions presented in the study are included in the article, further inquiries can be directed to the corresponding author/s.
Conflicts of Interest
The authors declare no conflicts of interest. The funders had no role in the design of the study; in the collection, analyses, or interpretation of data; in the writing of the manuscript; or in the decision to publish the results.
References
- Lv, Q’; Wang, C.; Chen, S.; Zheng, H.; Dong, E.; Zhu, G. Ultrasensitive Pressure-Induced Optical Materials: Europium-Doped Hafnium Silicates with a Khibinskite Structure for Optical Pressure Sensors and WLEDs. Inorganic Chemistry 2021 61, 3212 – 3222.
- Runowski, M.; Zheng, T.; Woźny, P.; Du, P. NIR emission of lanthanides for ultrasensitive luminescence manometry—Er3+-activated optical sensor of high pressure. Dalton Trans. 2021, 50, 14864–14871. [Google Scholar] [CrossRef]
- Antoniak, M. A.; Zelewski, S. J.; Oliva, R.; Żak, A.; Kudrawiec, R.; Nyk, M. Combined Temperature and Pressure Sensing Using Luminescent NaBiF4:Yb,Er Nanoparticles. ACS Applied Nano Materials 2020, 3, 4209–4217. [Google Scholar] [CrossRef]
- Goderski, S.; Runowski, M.; Woźny, P.; Lavín, V.; Lis, S. Lanthanide Upconverted Luminescence for Simultaneous Contactless Optical Thermometry and Manometry–Sensing under Extreme Conditions of Pressure and Temperature ACS Applied Materials & Interfaces 2020 12, 40475 – 40485.
- Runowski, M.; Woźny, P.; Stopikowska, N.; Guo, Q.; Lis, S. Optical Pressure Sensor Based on the Emission and Excitation Band Width (fwhm) and Luminescence Shift of Ce3+-Doped Fluorapatite—High-Pressure Sensing ACS Applied Materials & Interfaces 2019, 11, 4131 – 4138.
- Runowski, M.; Woźny, P.; Lavin, V.; Lis, S. Optical pressure nano-sensor based on lanthanide doped SrB2O4:Sm2+ luminescence – Novel high-pressure nanomanometer B: Chemical Sensors and Actuators 2018 273, 585 – 591.
- Matovic, B,; Nikolic M.;, Prekajski Djordjevic, M.; Dmitrovic, S.; Lukovic J.; Maletaskic, J.; Jelenkovic B. LUMINESCENCE PROPERTIES OF Eu3+ DOPED MAYENITE UNDER HIGH PRESSURE. Journal of Innovative Materials in Extreme Conditions 2020, 1, 12–14.
- Zhang, J.; Cui, H.; Zhu, P.; Ma, C.; Wu, X.; Zhu, H.; Ma, Y.; Cui, Q. Photoluminescence studies of Y2O3:Eu3+ under high pressure. J. Appl. Phys. 2014, 115, 023502. [Google Scholar] [CrossRef]
- Baran, A.; Mahlik, S.; Grinberg, M.; Zych, E. High pressure and time-resolved luminescence spectra of Ca3Y2(SiO4)3 doped with Eu2+ and Eu3+. Journal of Physics Condensed Matter 2013, 25, 025603. [Google Scholar] [CrossRef]
- He, X.; Bian, D.; Wang, H.; Xu, J. Eu3+ activated Y2MoO6 A narrow band red-emitting phosphor with strong near-UV absorption. Luminescence 2013, 28, 973–976. [Google Scholar] [CrossRef]
- Han, B.; Zhang, J.; Wang, Z.; Liu, Y.; Shi, H. Investigation on the concentration quenching and energy transfer of red-light-emitting phosphor Y2MoO6:Eu3+. J. Lumin. 2014, 149, 150–154. [Google Scholar] [CrossRef]
- Wu, L.; Tian, X.; Deng, K.; Liu, G.; Yin, M. Site selective spectroscopic study of an efficient red-emitting phosphor Y2MoO6:Eu. Opt. Mater. 2015, 45, 28–31. [Google Scholar] [CrossRef]
- Stankovic, N.; Nikolic, G.M.; Jelenkovic, B.; Daneu, N.; Maletaskic, J.; Prekajski DJordjevic, M.; Matovic, B. Luminescence properties of Eu3+ activated Y2MoO6 powders calcined at different temperatures. Processing and Application of Ceramics 2020, 14, 71–76. [Google Scholar] [CrossRef]
- Ofelt, G. S. Intensities of Crystal Spectra of Rare-Earth Ions. J. Chem. Phys. 1962, 37, 511–520. [Google Scholar] [CrossRef]
- Judd, B. R. Optical Absorption Intensities of Rare-Earth Ions. Phys. Rev. 1962, 127, 750–761. [Google Scholar] [CrossRef]
- Yu, L.; Song, H.; Lu, S.; Liu, Z.; Yang, L.; Kong, X. Luminescent Properties of LaPO4:Eu Nanoparticles and Nanowires. J. Phys. Chem. B 2004, 108, 1520–6106. [Google Scholar] [CrossRef]
- Zhong, S.; Wang, S.; Liu, Q.; Wang, Y.; Wang, S.; Chen, J.; Xu, R.; Luo, L. Y2O3:Eu3+ microstructures: Hydrothermal synthesis and photoluminescence properties. Mat. Res. Bull. 2009, 44, 2201–2205. [Google Scholar] [CrossRef]
- Halevy, I.; Carmon, R.; Winterrose, M. L.; Yeheskel, O.; Tiferet, E.; Ghose, S. Pressure-induced structural phase transitions in Y2O3 sesquioxide. Journal of Physics Conference Series 2010, 215, 012003. [Google Scholar] [CrossRef]
- Sangiorgio, M.; Deep learning in multi-step forecasting of chaotic dynamics Book chapter, Special Topics in Information Technology. (PoliMI SpringerBriefs).
- Scalia, G. Machine learning for scientific data analysis Book chapter, Special Topics in Information Technology (PoliMI SpringerBriefs).
- Sayin B, Krivosheev E, Yang J, Passerini A and Casati F 2021 Areview and experimental analysis of active learning over crowdsourced data Artif. Intell. Rev. 54 5283–305.
- Yu H, Li J,WuZ, XuHand Zhu L 2022 Two-step learning for crowdsourcing data classification Multimedia Tools Appl. 81 34401–16.
- Chatzidakis, M.; Botton, G. A. Towards calibration-invariant spectroscopy using deep learning. Scientific Reports 2019, 9, 2126. [Google Scholar] [CrossRef]
- Weng, S.;, Yuan, H.; Zhang, X.; Li, P.; Zheng, L.; Zhao, J.; Huanga, L. 2020 Deep learning networks for the recognition and quantitation of surface-enhanced Raman spectroscopy. Analyst 2020, 145, 4827–4835. [CrossRef] [PubMed]
- Ranamukhaarachchi, S.A.; Peiris, R.H.; Moresoli, C. Fluorescence spectroscopy and principal component analysis of soy protein hydrolysate fractions and the potential to assess their antioxidant capacity characteristics. Food Chem. bf 2017, 217, 469–475. [Google Scholar] [CrossRef]
- Dramicanin, T.; Zekovic, I.; Perisa, J.; Dramicanin, M.D. The Parallel Factor Analysis of Beer Fluorescence. em J. Fluoresc. 2019, 29, 1103–1111. [Google Scholar] [CrossRef]
- Ximendes, E.; Marin, R.; Carlos, L.D.; Jaque, D. Less is more: Dimensionality reduction as a general strategy for more precise luminescence thermometry. Light Sci. Appl. 2022, 11, 237. [Google Scholar] [CrossRef] [PubMed]
- Barbon, S.; da Costa Barbon, A.P.A.; Mantovani, R.G.; Barbin, D.F. Machine Learning Applied to Near-Infrared Spectra for Chicken Meat Classification. J. Spectrosc. 2018, 2018, 1–12. [Google Scholar] [CrossRef]
- Geronimo, B.C.; Mastelini, S.M.; Carvalho, R.H.; Barbon Júnior, S.; Barbin, D.F.; Shimokomaki, M.; Ida, E.I. Computer vision system and near-infrared spectroscopy for identification and classification of chicken with wooden breast, and physicochemical and technological characterization. Infrared Phys. Technol. 2019, 96, 303–310. [Google Scholar] [CrossRef]
- Junior, S.B.; Mastelini, S.M.; Barbon, A.P.A.; Barbin, D.F.; Calvini, R.; Lopes, J.F.; Ulrici, A. Multi-target prediction of wheat flour quality parameters with near infrared spectroscopy. Inf. Process. Agric. 2020, 7, 342–354. [Google Scholar] [CrossRef]
- Nolasco Perez, I.M.; Badaró, A.T.; Barbon, S.; Barbon, A.P.A.; Pollonio, M.A.R.; Barbin, D.F. Classification of Chicken Parts Using a Portable Near-Infrared (NIR) Spectrophotometer and Machine Learning. Appl. Spectrosc. 2018, 72, 1774–1780. [Google Scholar] [CrossRef]
- Cui, J.; Xu, W.; Yao, M.; Zheng, L.; Hu, C.; Zhang, Z.; Sun, Z. Convolutional neural networks open up horizons for luminescence thermometry. J. Lumin. 2023, 256, 119637. [Google Scholar] [CrossRef]
- Vlasic, A.; Sevic, D.; Rabasovic, M. S.; A Krizan, J.; Savic-Sevic, S.; Rabasovic, M. D; Mitric, M.; Marinkovic, B. P.;Nikolic, M. G. Effects of temperature and pressure on luminescent properties of Sr2CeO4:Eu3+ nanophosphor. J. Lumin. 2018 199, 285–292.
- McInnes, L.; Healy, J.; Melville, J. UMAP: Uniform Manifold Approximation and Projection for Dimension Reduction. arXiv e-prints 2018, doi = 10.48550/arXiv.1802.03426 arXiv:1802.03426.
- McInnes, L.; Healy, J.; Melville, J. UMAP: Uniform Manifold Approximation and Projection for Dimension Reduction. arXiv e-prints 2020, doi = 10.48550/arXiv.1802.03426 arXiv:1802.03426v3.
- Wise, B. M.; Gallagher N. B.; Bro, R.; Shaver, J. M.; Windig, W.; Koch, R. S. Chemometrics tutorial for PLS Toolbox and Solo, ISBN: 0-9761184-1-6, Eigenvector Research, Inc. USA 2006.
- Shorten, C.; Khoshgoftaar, T.M. A survey on Image Data Augmentation for Deep Learning. J. Big Data 2019, 6, 60. [Google Scholar] [CrossRef]
- Jelic, J.Z.; Dencevski, A.; Rabasovic, M.D.; Krizan, J.; Savic-Sevic, S.; Nikolic, M.G.; Aguirre, M.H.; Sevic, D.; Rabasovic, M.S. Improving the Two-Color Temperature Sensing Using Machine Learning Approach: GdVO4:Sm3+ Prepared by Solution Combustion Synthesis (SCS). em Photonics 2024, 11, 642. [Google Scholar] [CrossRef]
- Blasse, G.; Grabmaier, B. C. (1994). A general introduction to luminescent materials. In Luminescent materials (pp. 1-9). Berlin, Heidelberg: Springer Berlin Heidelberg.
Figure 1.
Luminescence spectra of : at various pressures. (Continuous laser diode excitation at 405 nm).
Figure 1.
Luminescence spectra of : at various pressures. (Continuous laser diode excitation at 405 nm).

Figure 2.
High pressure sensing intensity ratio calibration data drawn from luminescence spectra of : nanophosphor. The points could not be reasonably fitted with a single curve.
Figure 2.
High pressure sensing intensity ratio calibration data drawn from luminescence spectra of : nanophosphor. The points could not be reasonably fitted with a single curve.
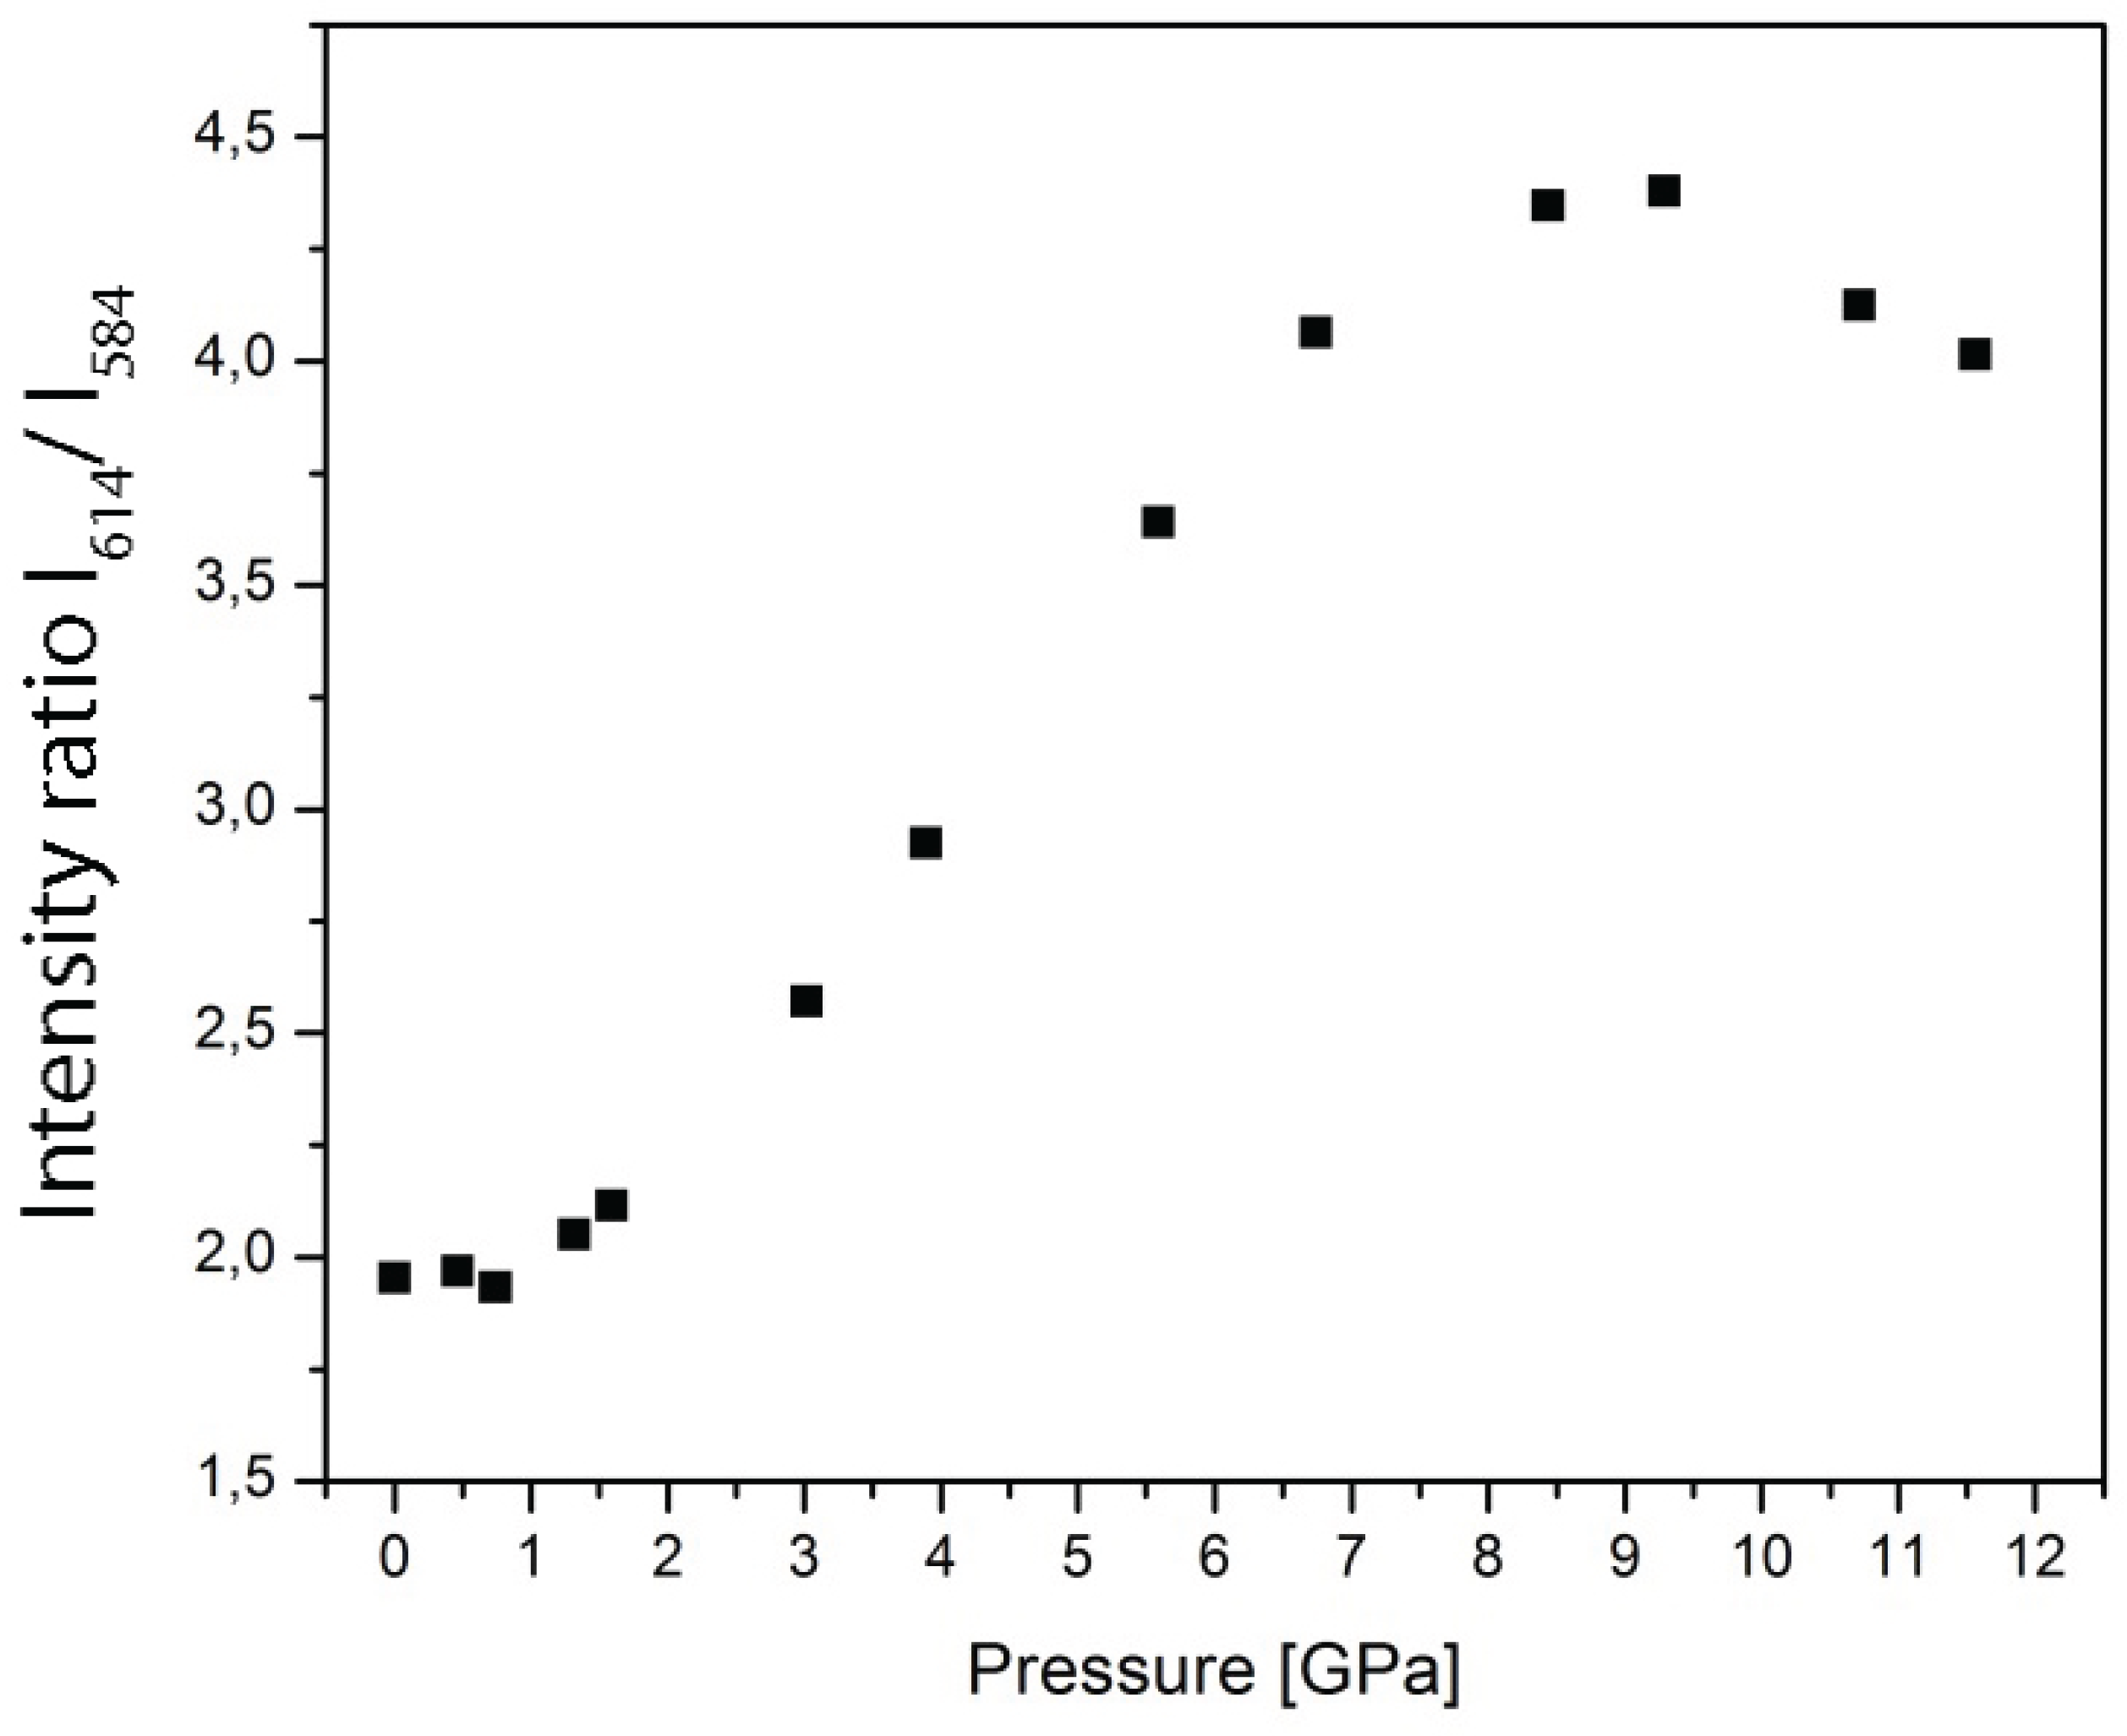
Figure 3.
Color coding of measured pressures of : sample.
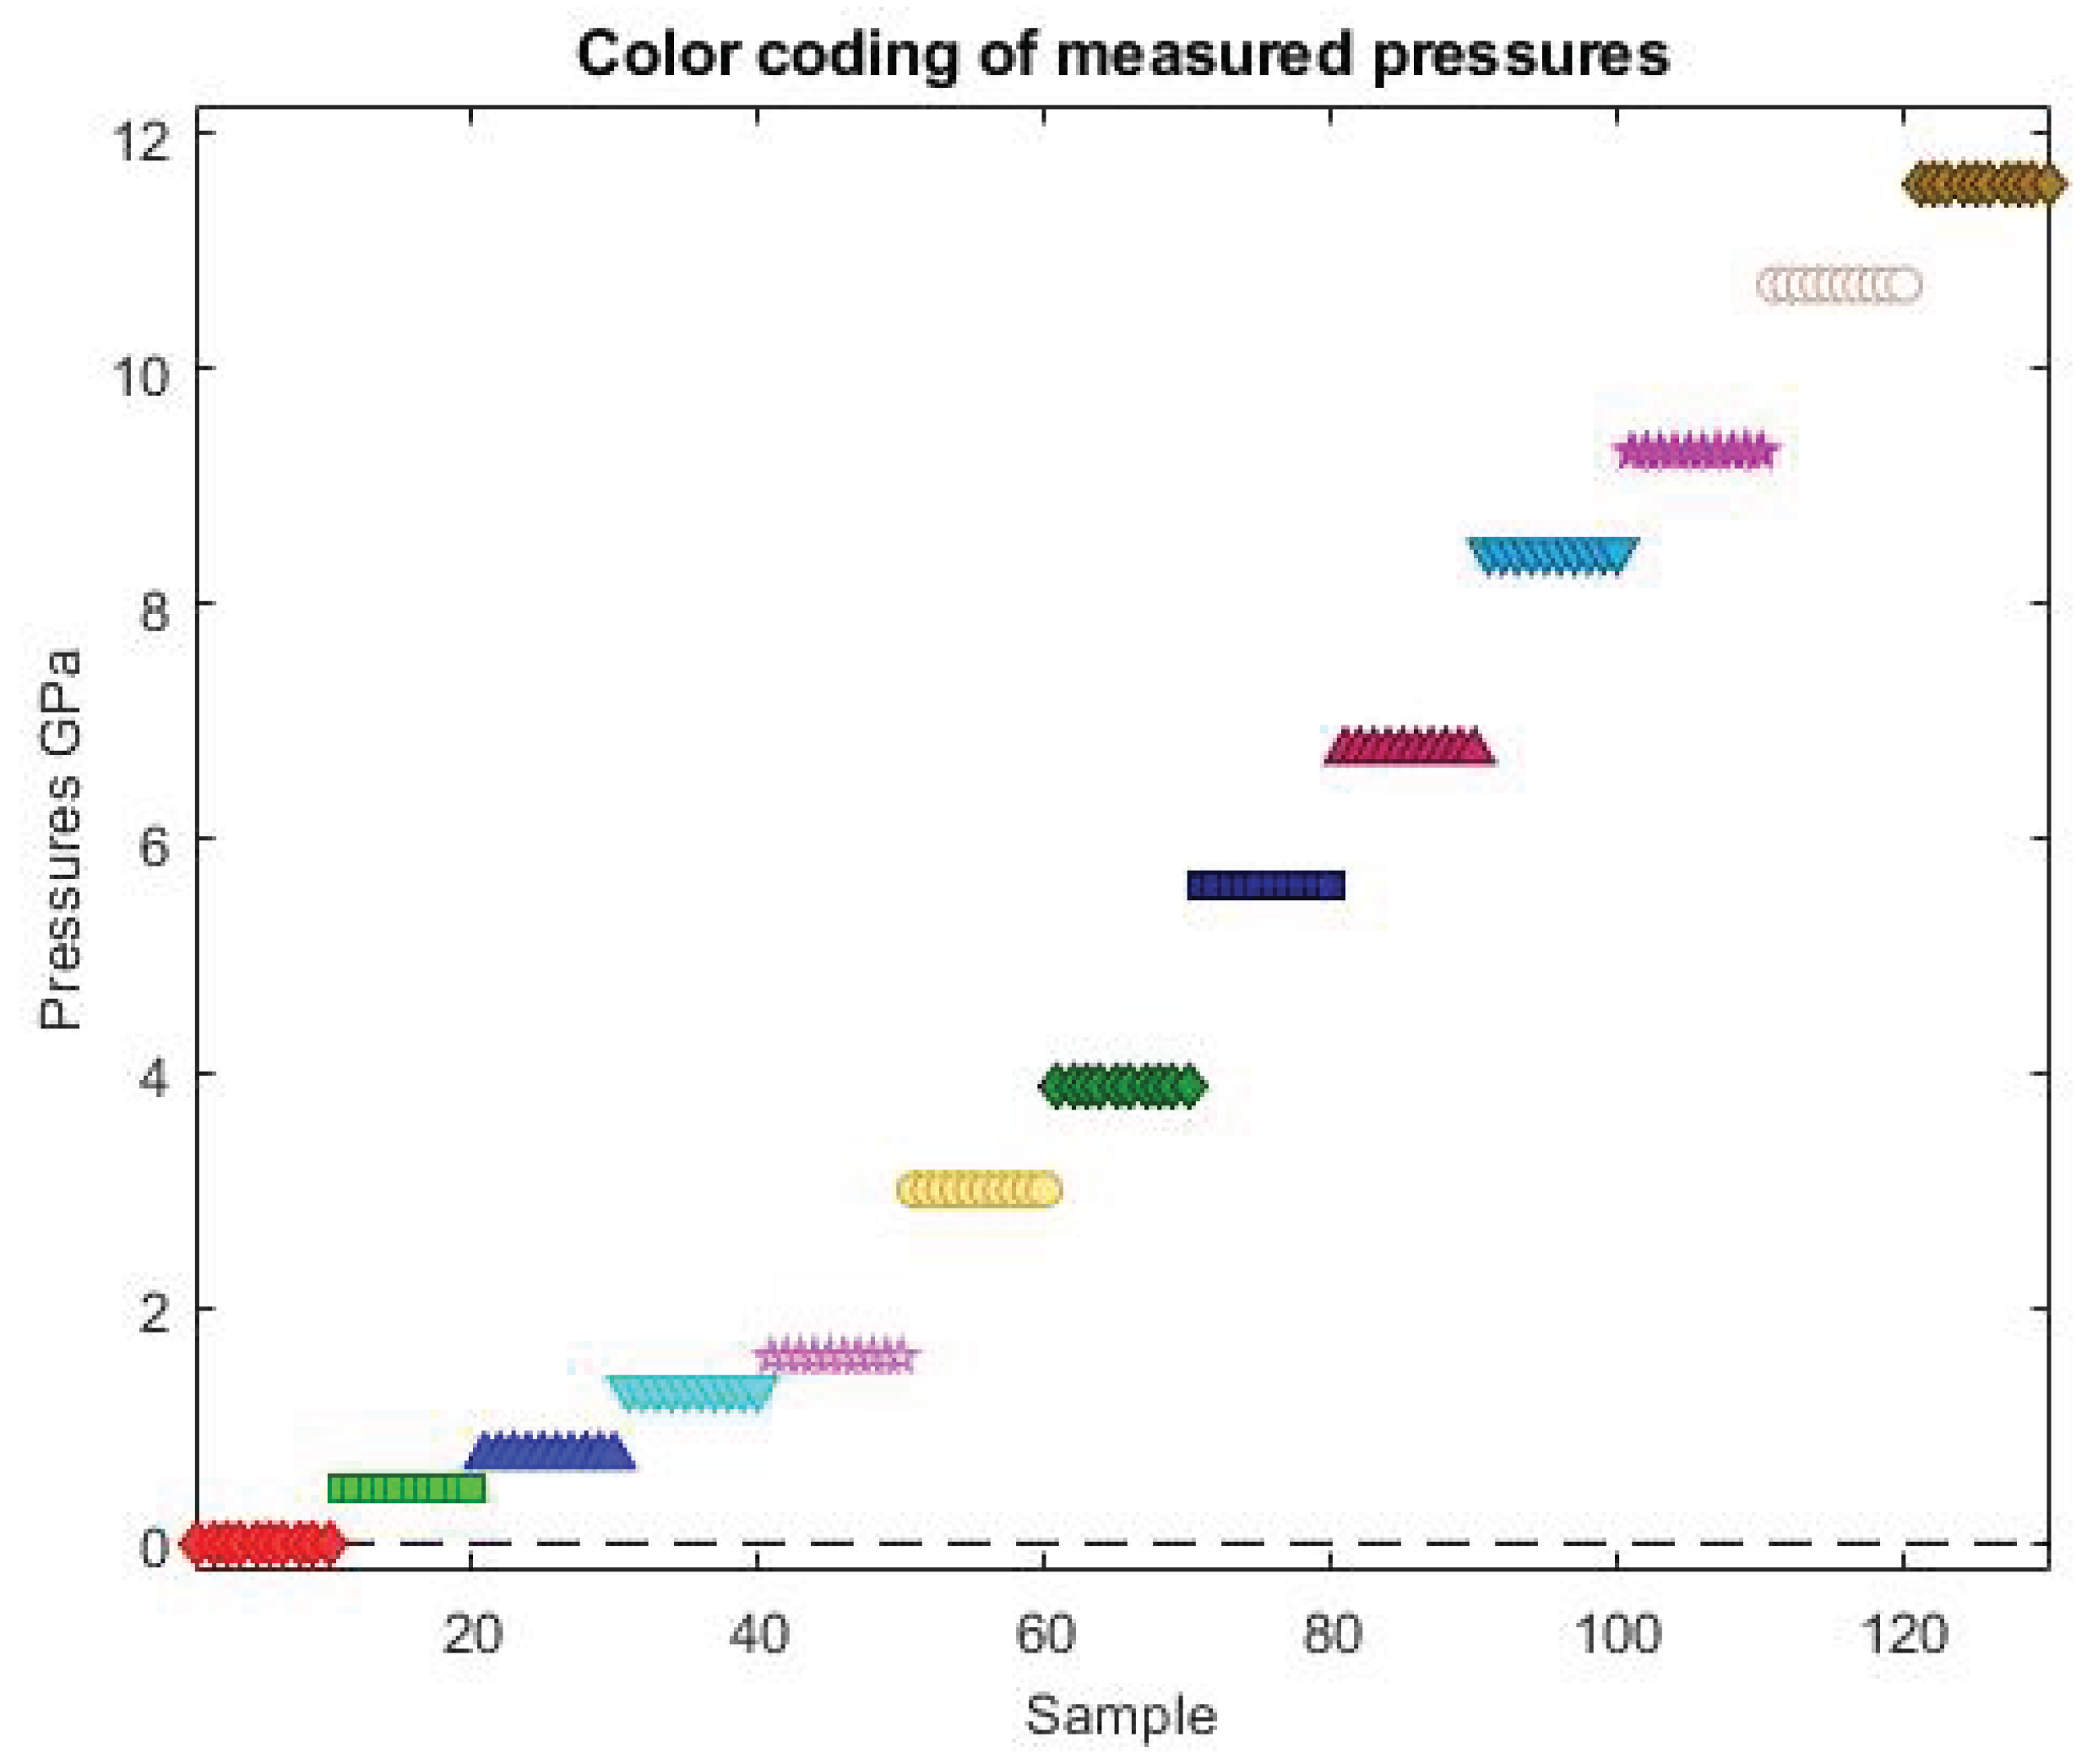
Figure 4.
Uniform Manifold Approximation and Projection (UMAP) clustering of : spectra at different pressures.
Figure 4.
Uniform Manifold Approximation and Projection (UMAP) clustering of : spectra at different pressures.
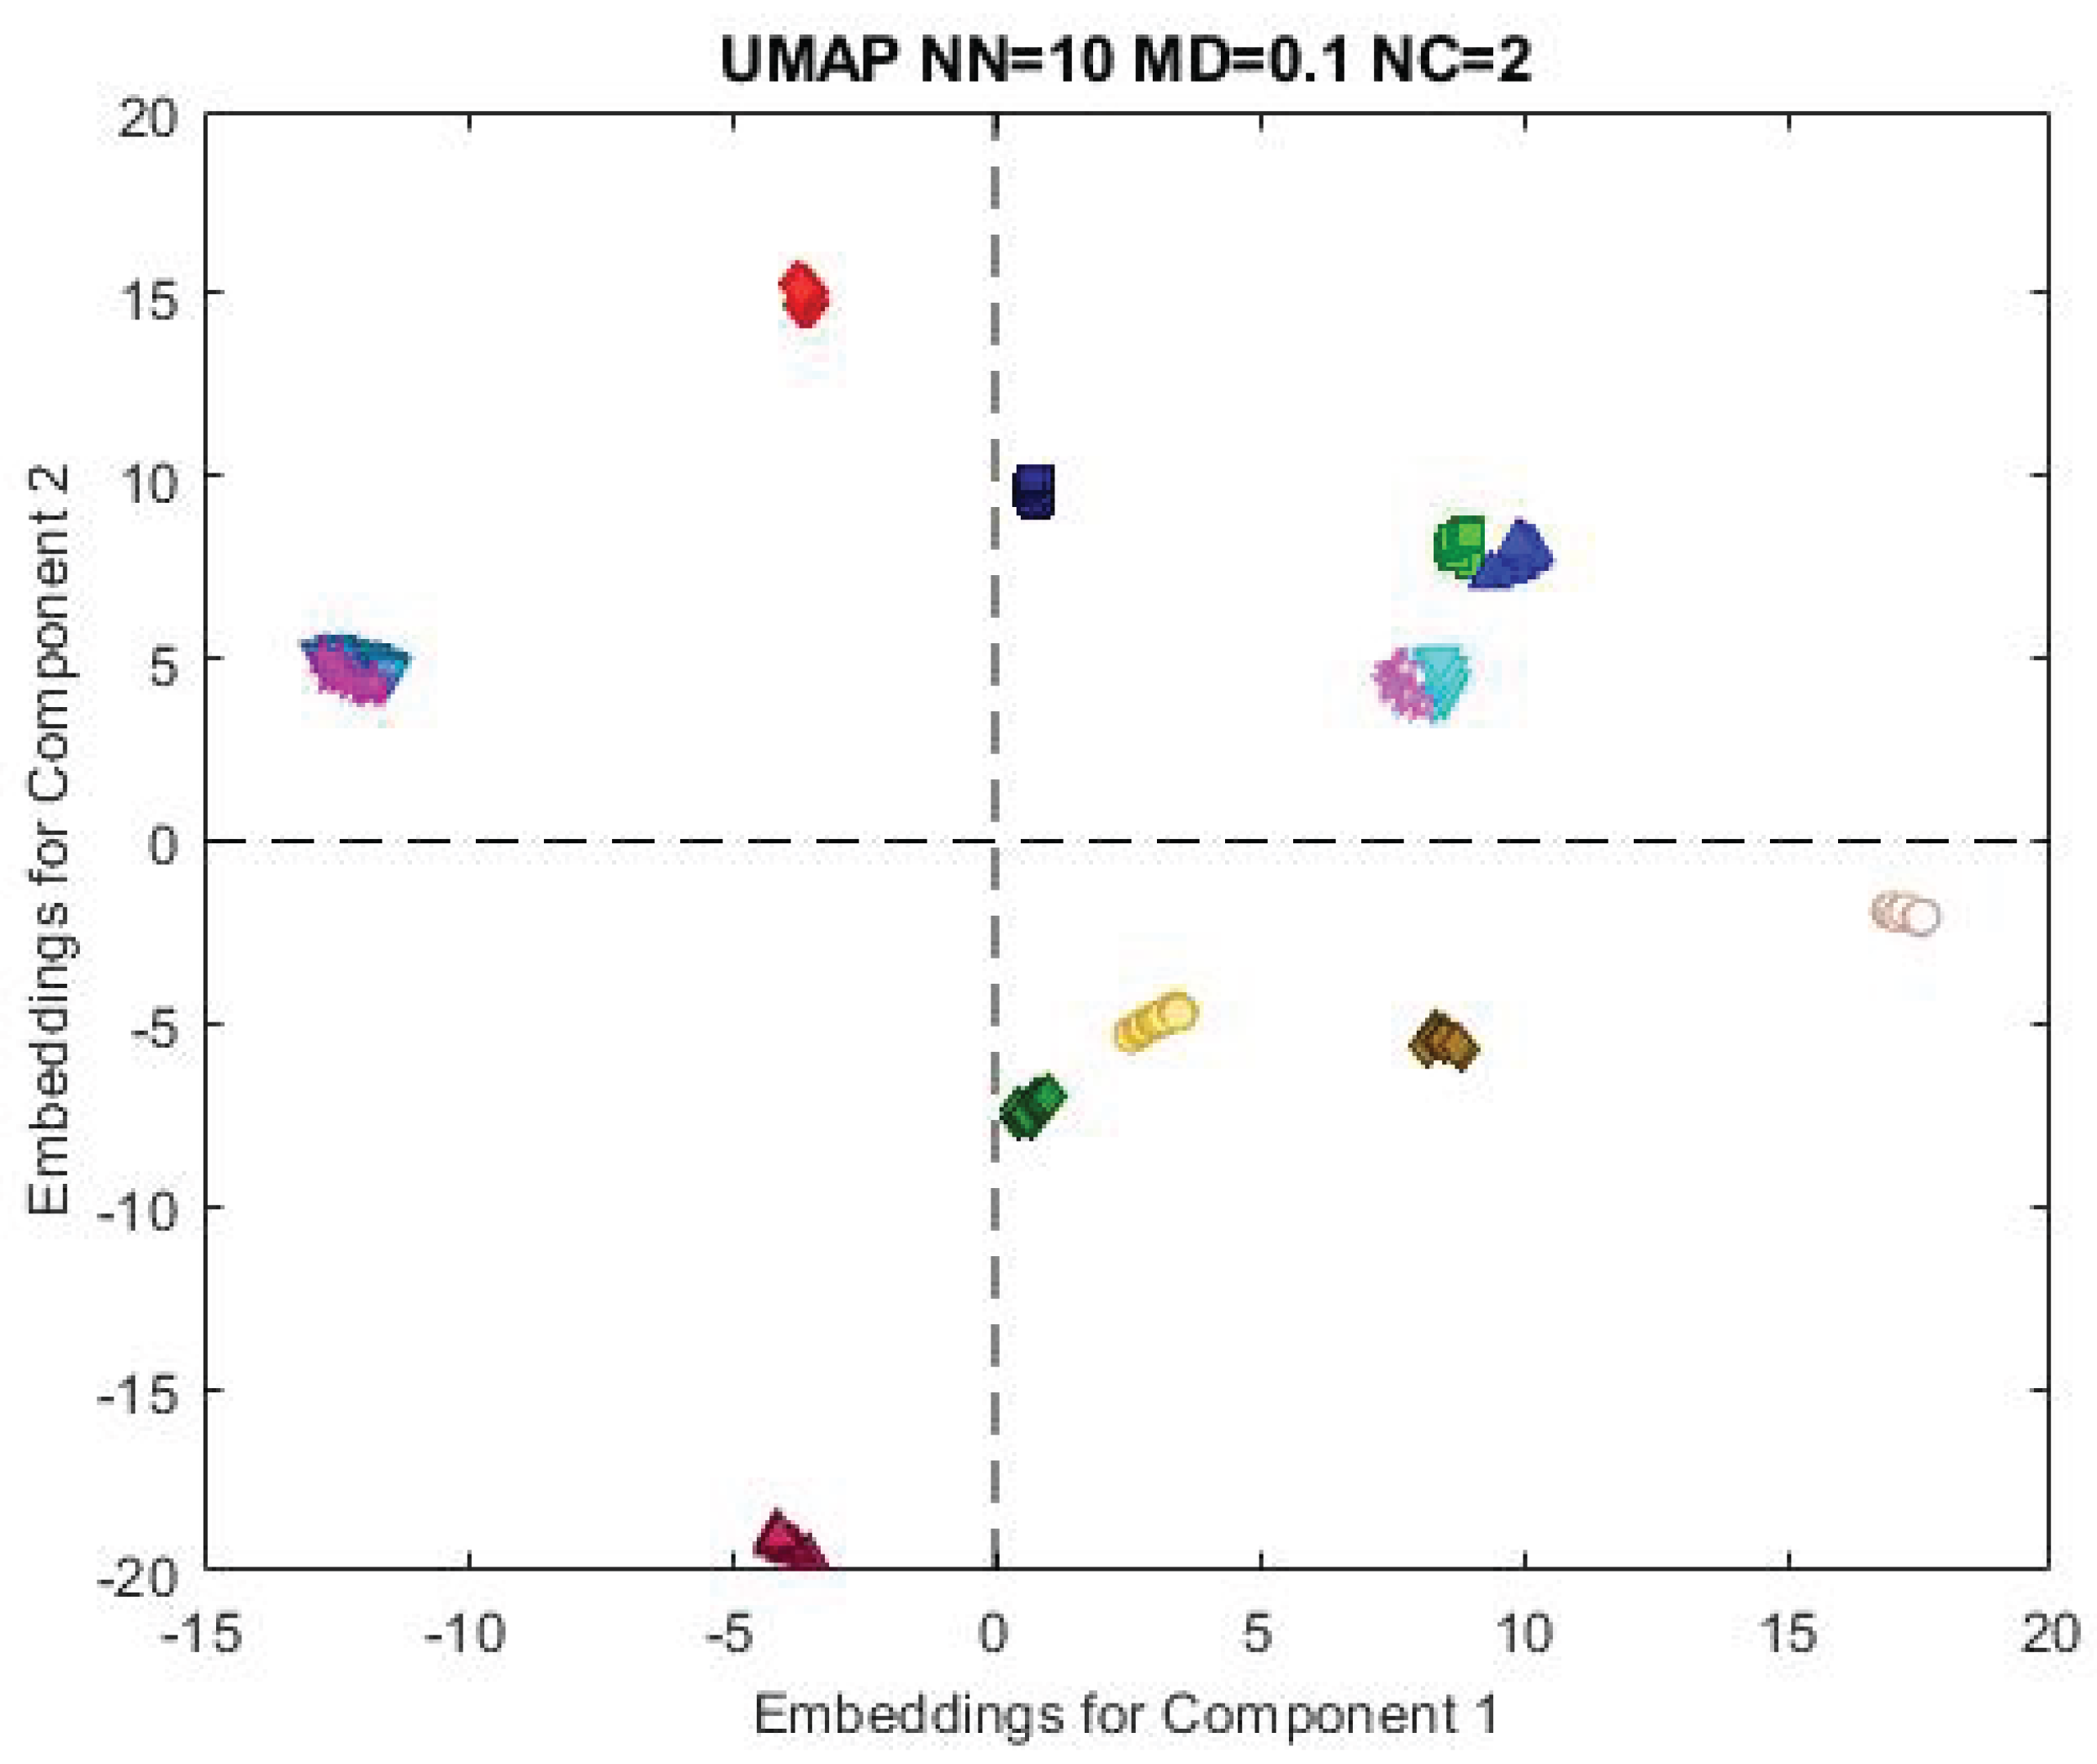
Figure 5.
The learning curves depicting the training progress of the ANNDL model using ADAM optimizer.
Figure 5.
The learning curves depicting the training progress of the ANNDL model using ADAM optimizer.
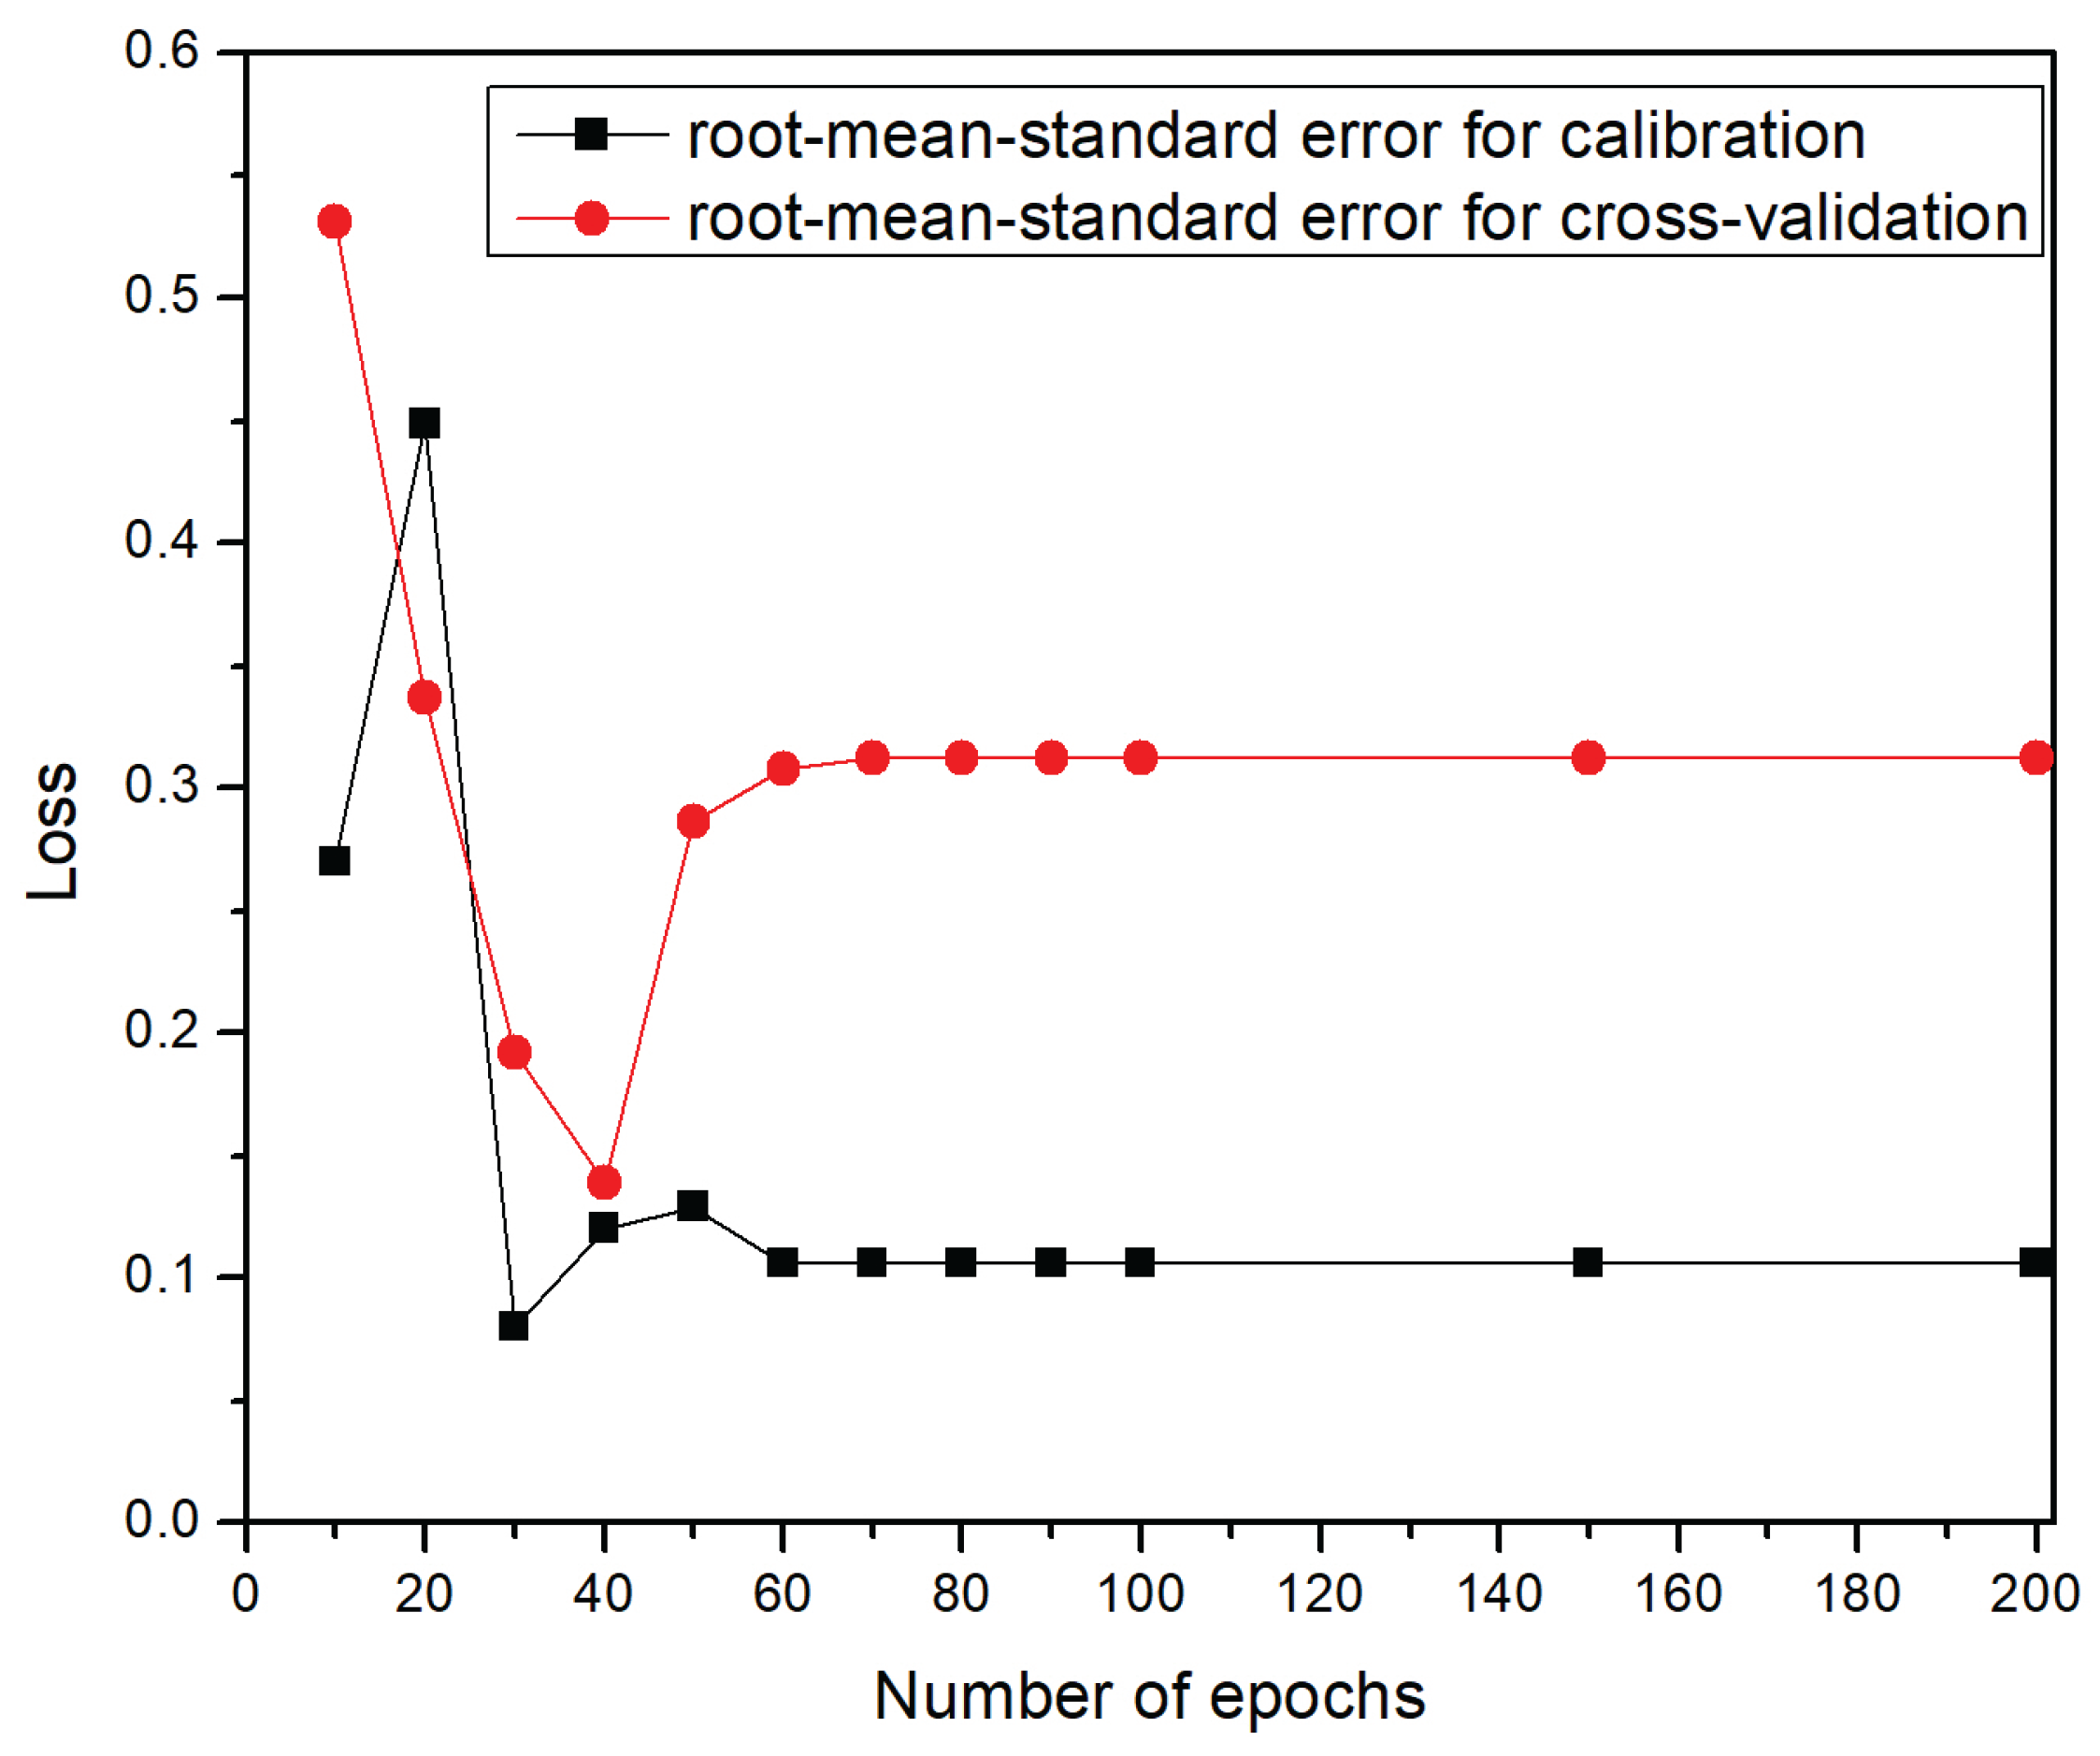
Figure 6.
The learning curves depicting the training progress of the ANNDL model using ADAMAX optimizer.
Figure 6.
The learning curves depicting the training progress of the ANNDL model using ADAMAX optimizer.
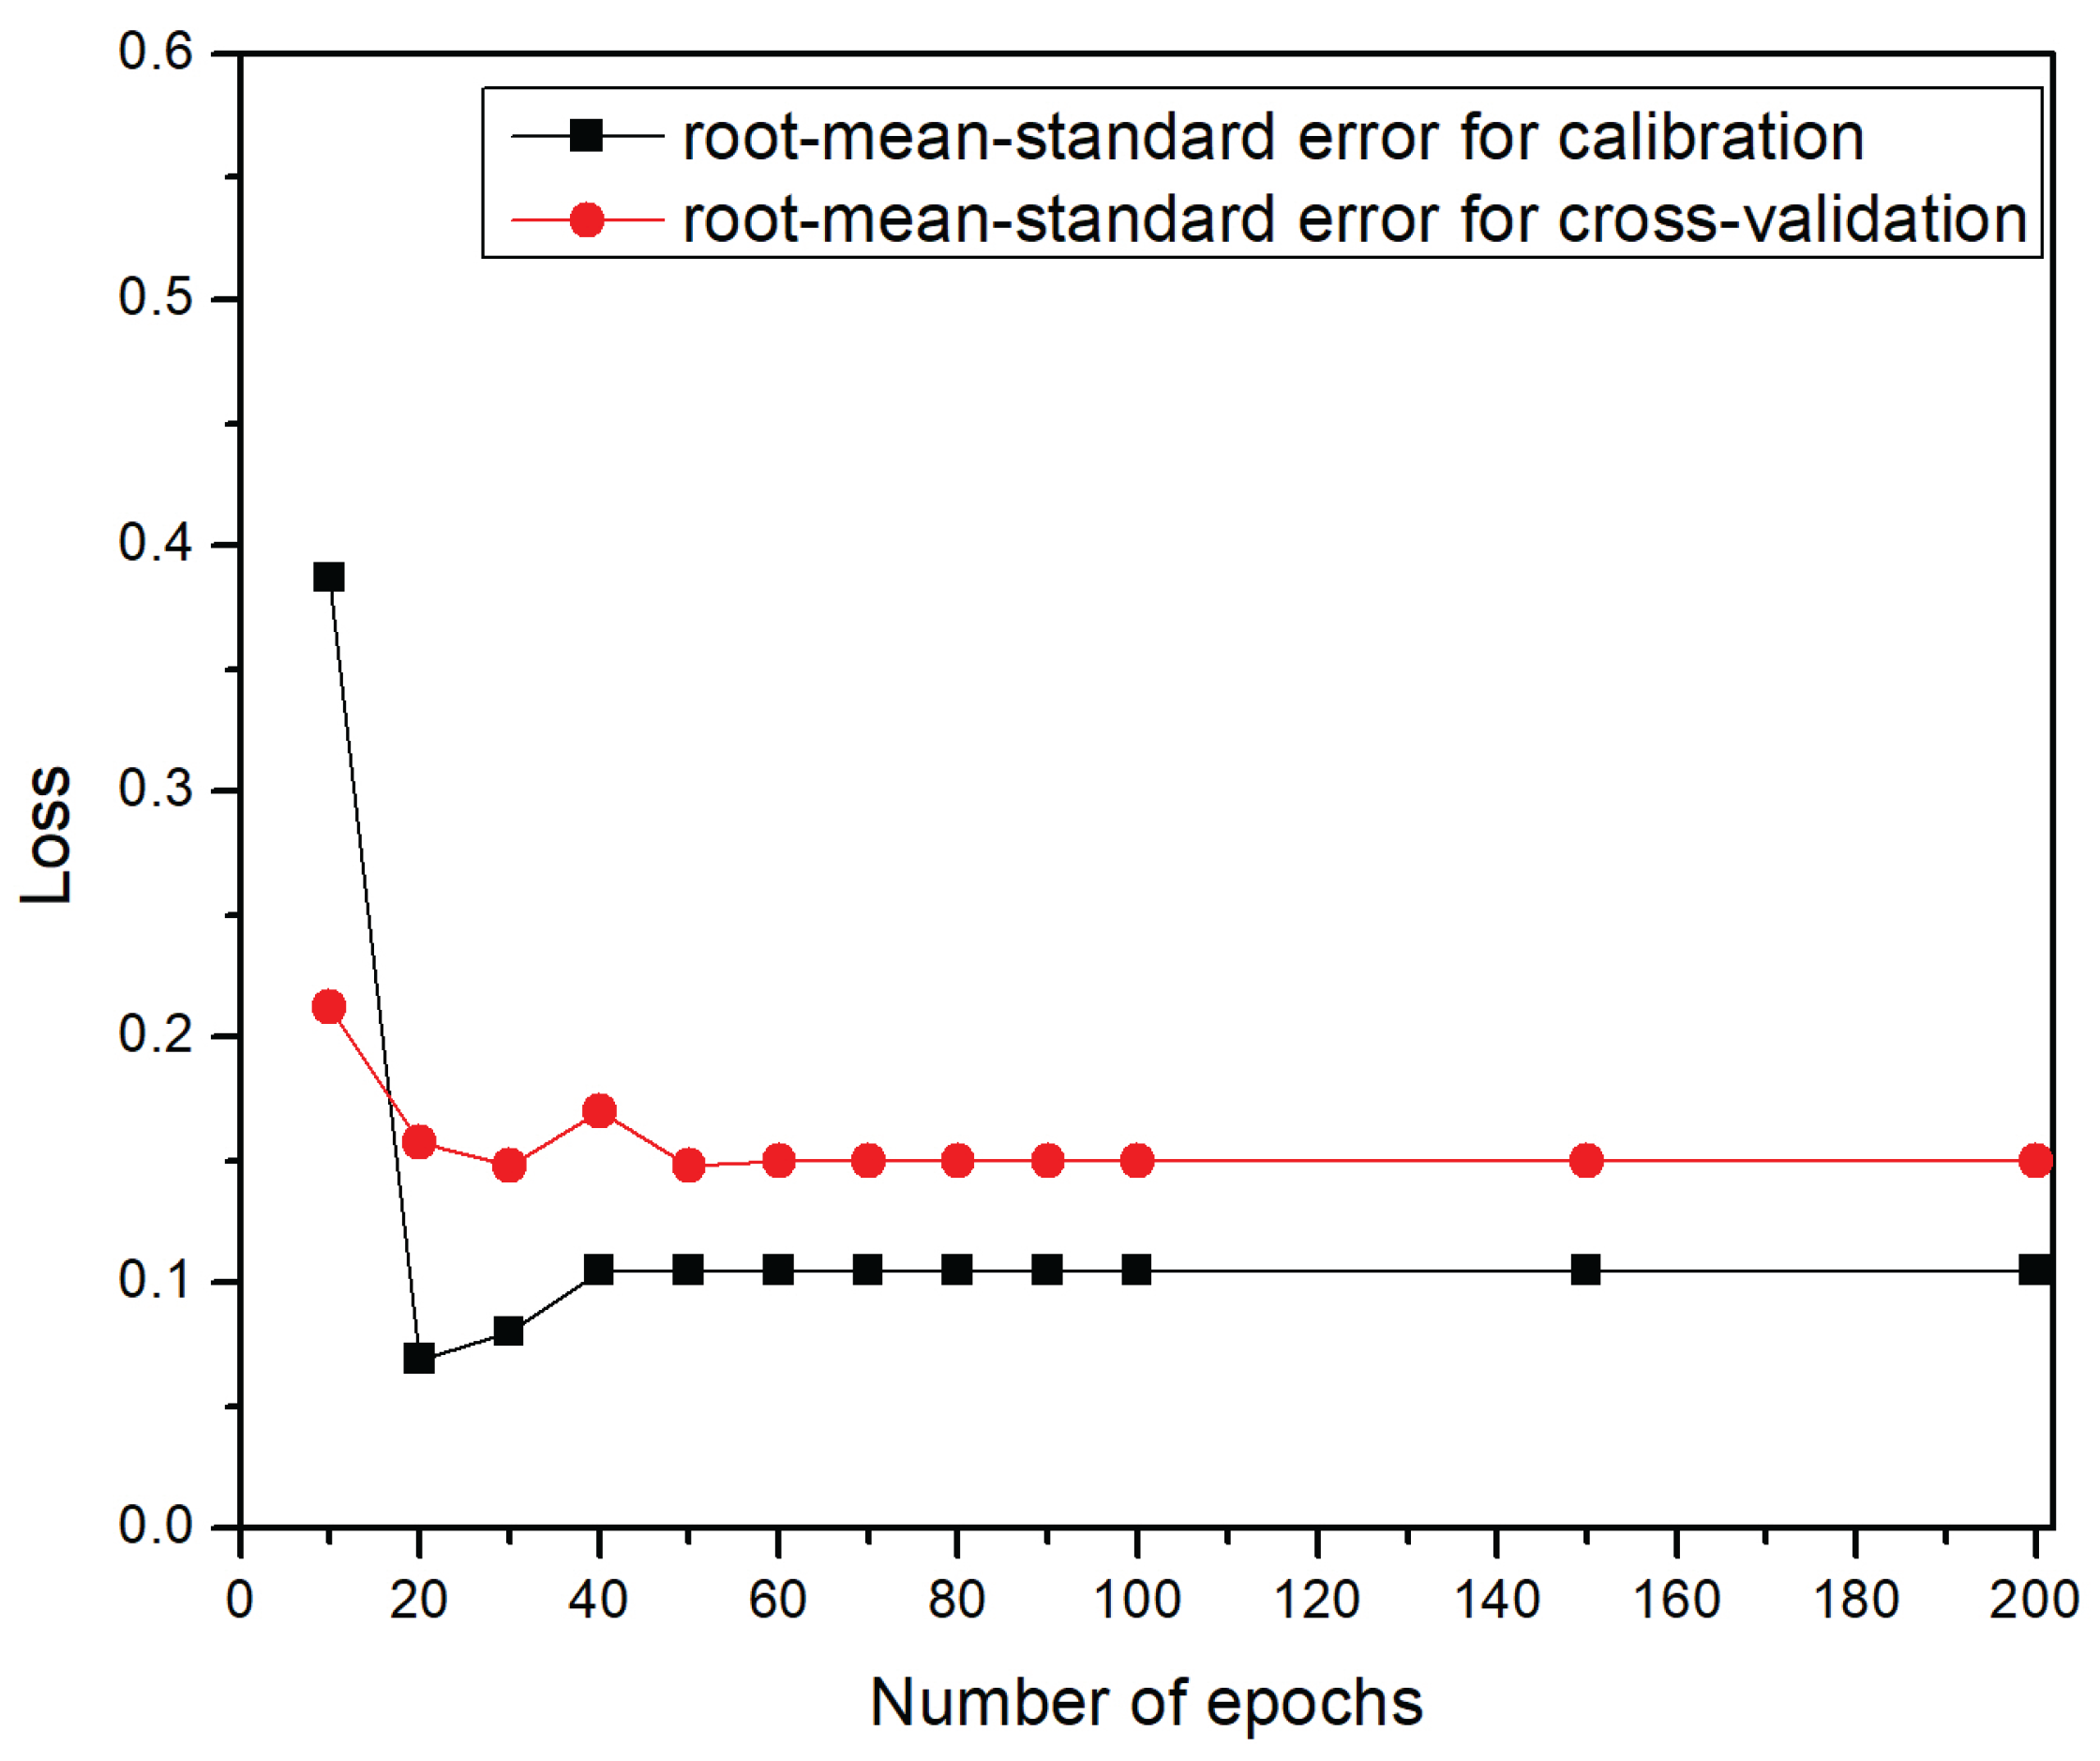
Figure 7.
Plot of predicted temperatures using the training set of 10 samples for each temperature. RMSEC = 0.106 refers to the root-mean-standard error of calibration; RMSECV = 0.312 refers to the root-mean-standard error of cross-validation (Adam optimizer).
Figure 7.
Plot of predicted temperatures using the training set of 10 samples for each temperature. RMSEC = 0.106 refers to the root-mean-standard error of calibration; RMSECV = 0.312 refers to the root-mean-standard error of cross-validation (Adam optimizer).
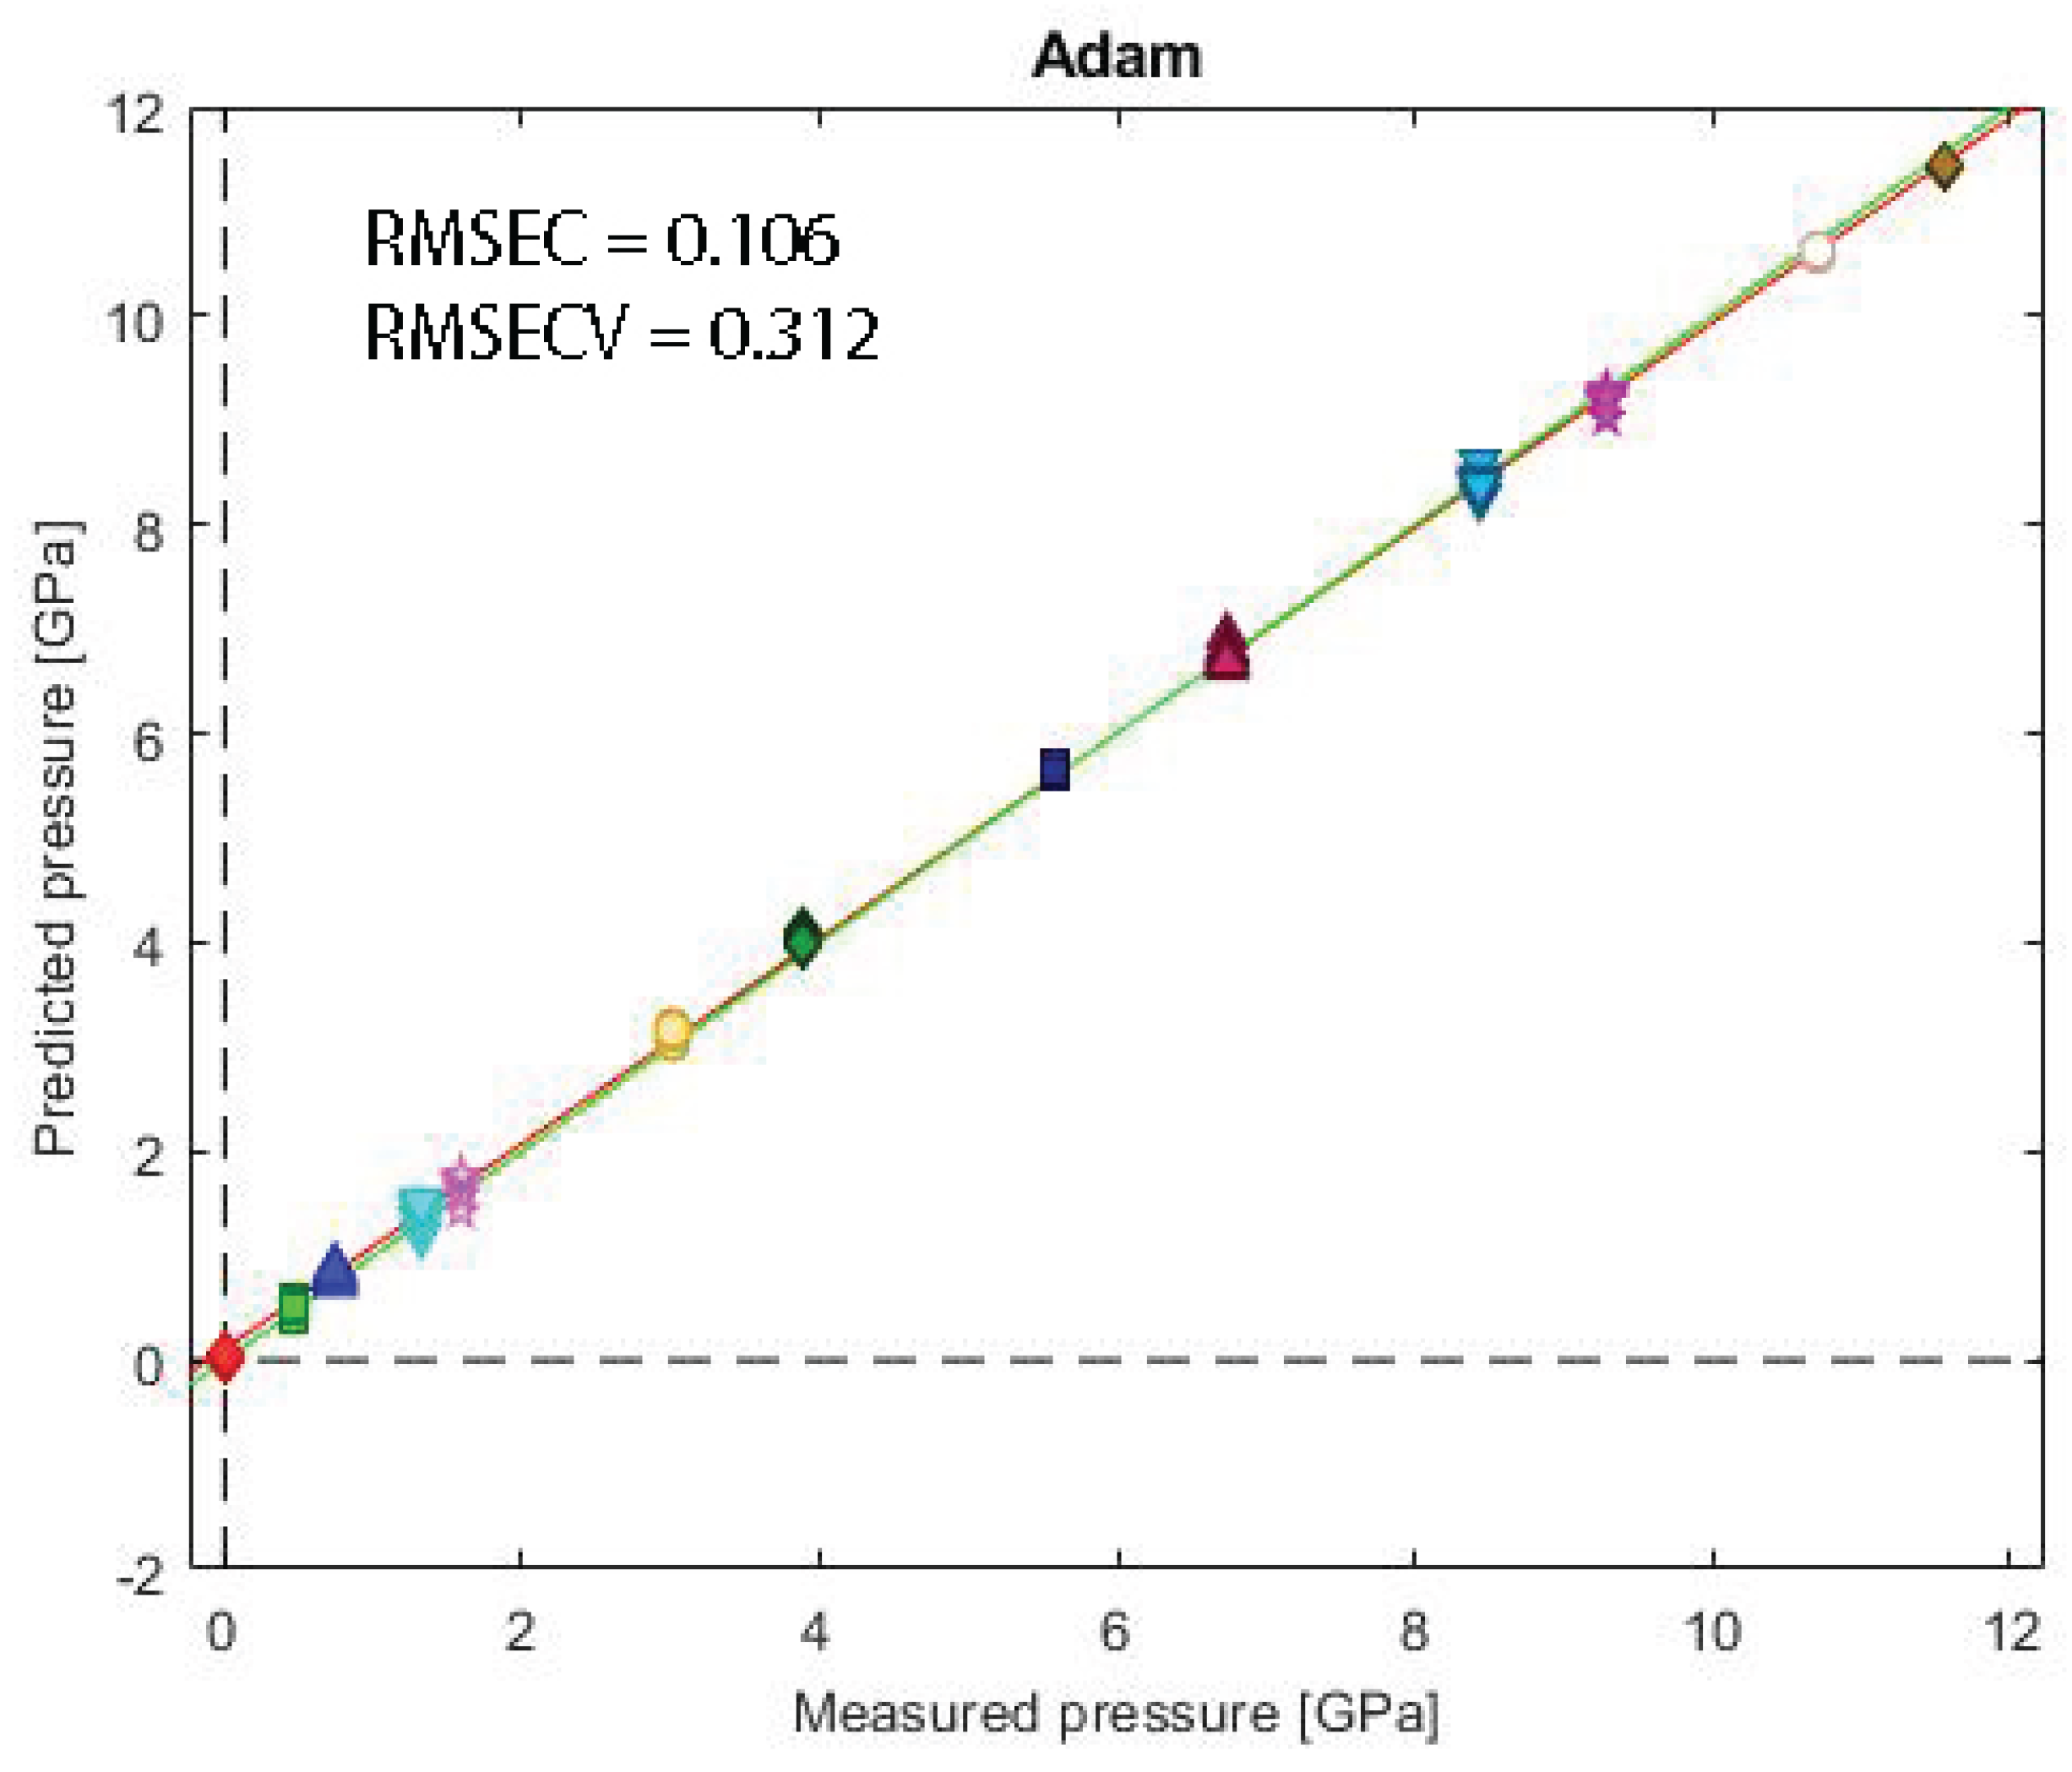
Figure 8.
Plot of predicted temperatures using the training set of 10 samples for each temperature. RMSEC = 0.105 refers to the root-mean-standard error of calibration; RMSECV = 0.150 refers to the root-mean-standard error of cross-validation.
Figure 8.
Plot of predicted temperatures using the training set of 10 samples for each temperature. RMSEC = 0.105 refers to the root-mean-standard error of calibration; RMSECV = 0.150 refers to the root-mean-standard error of cross-validation.
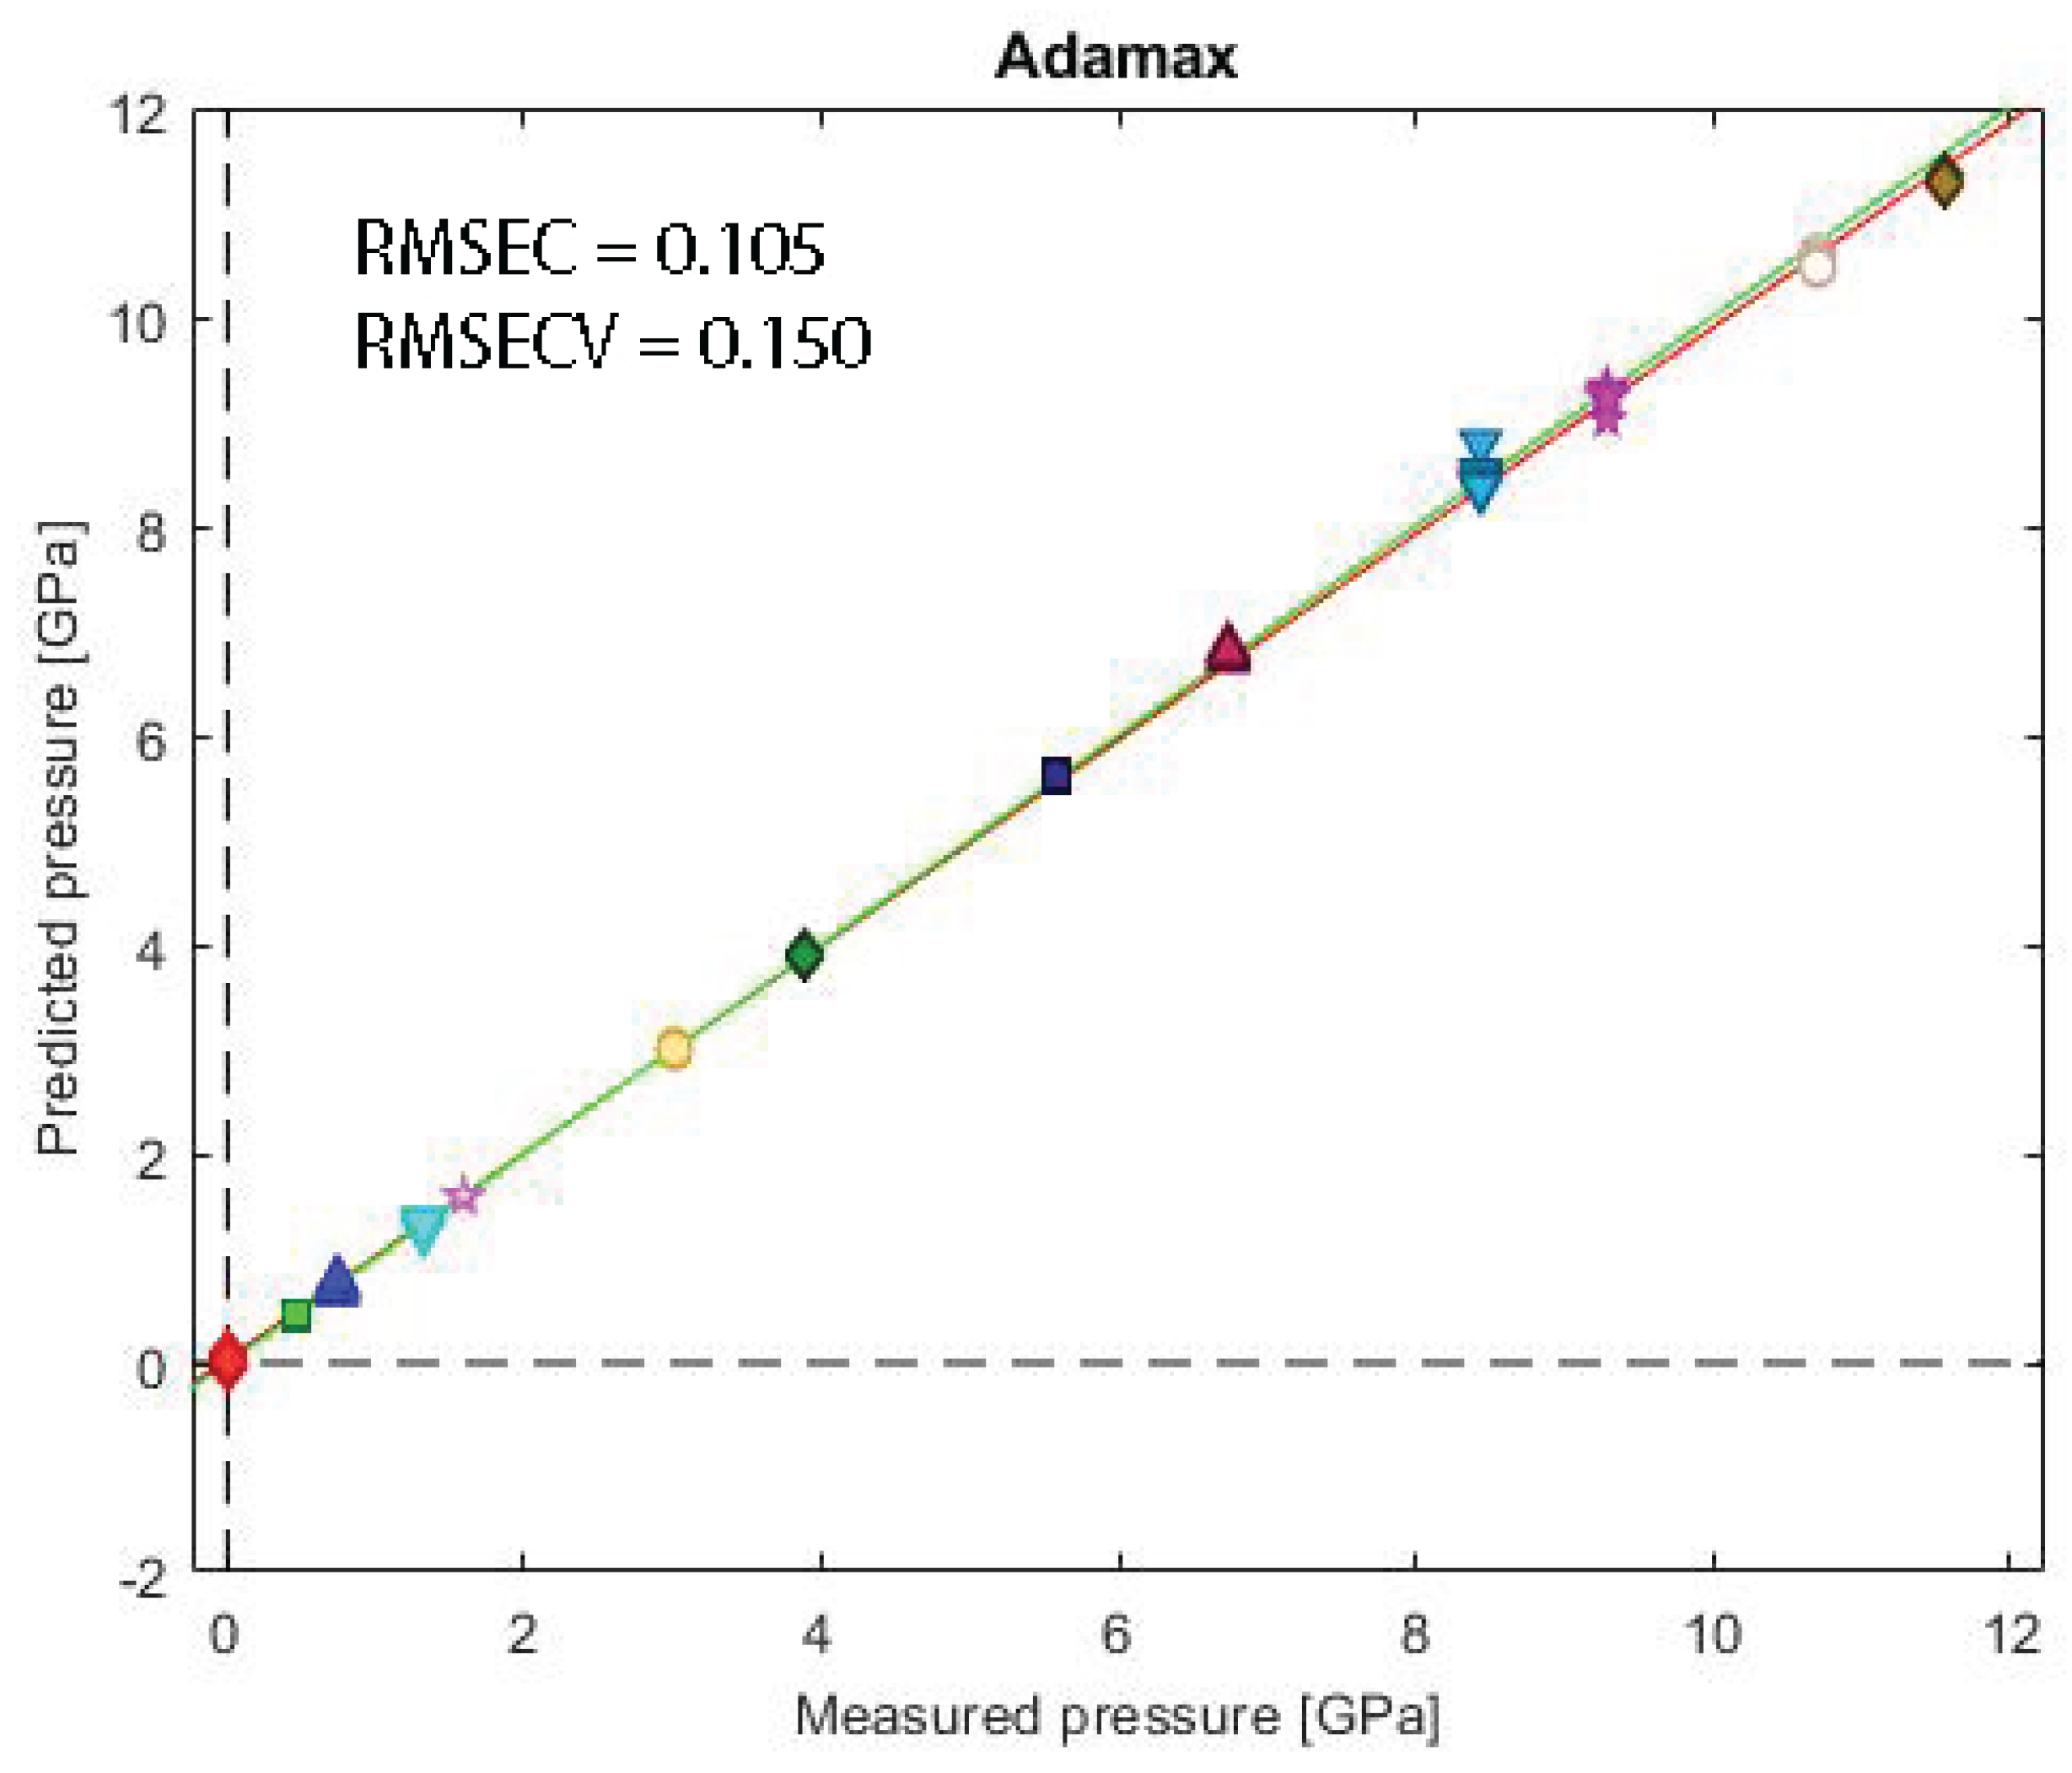
Figure 9.
Residuals plot for Adam optimizer.
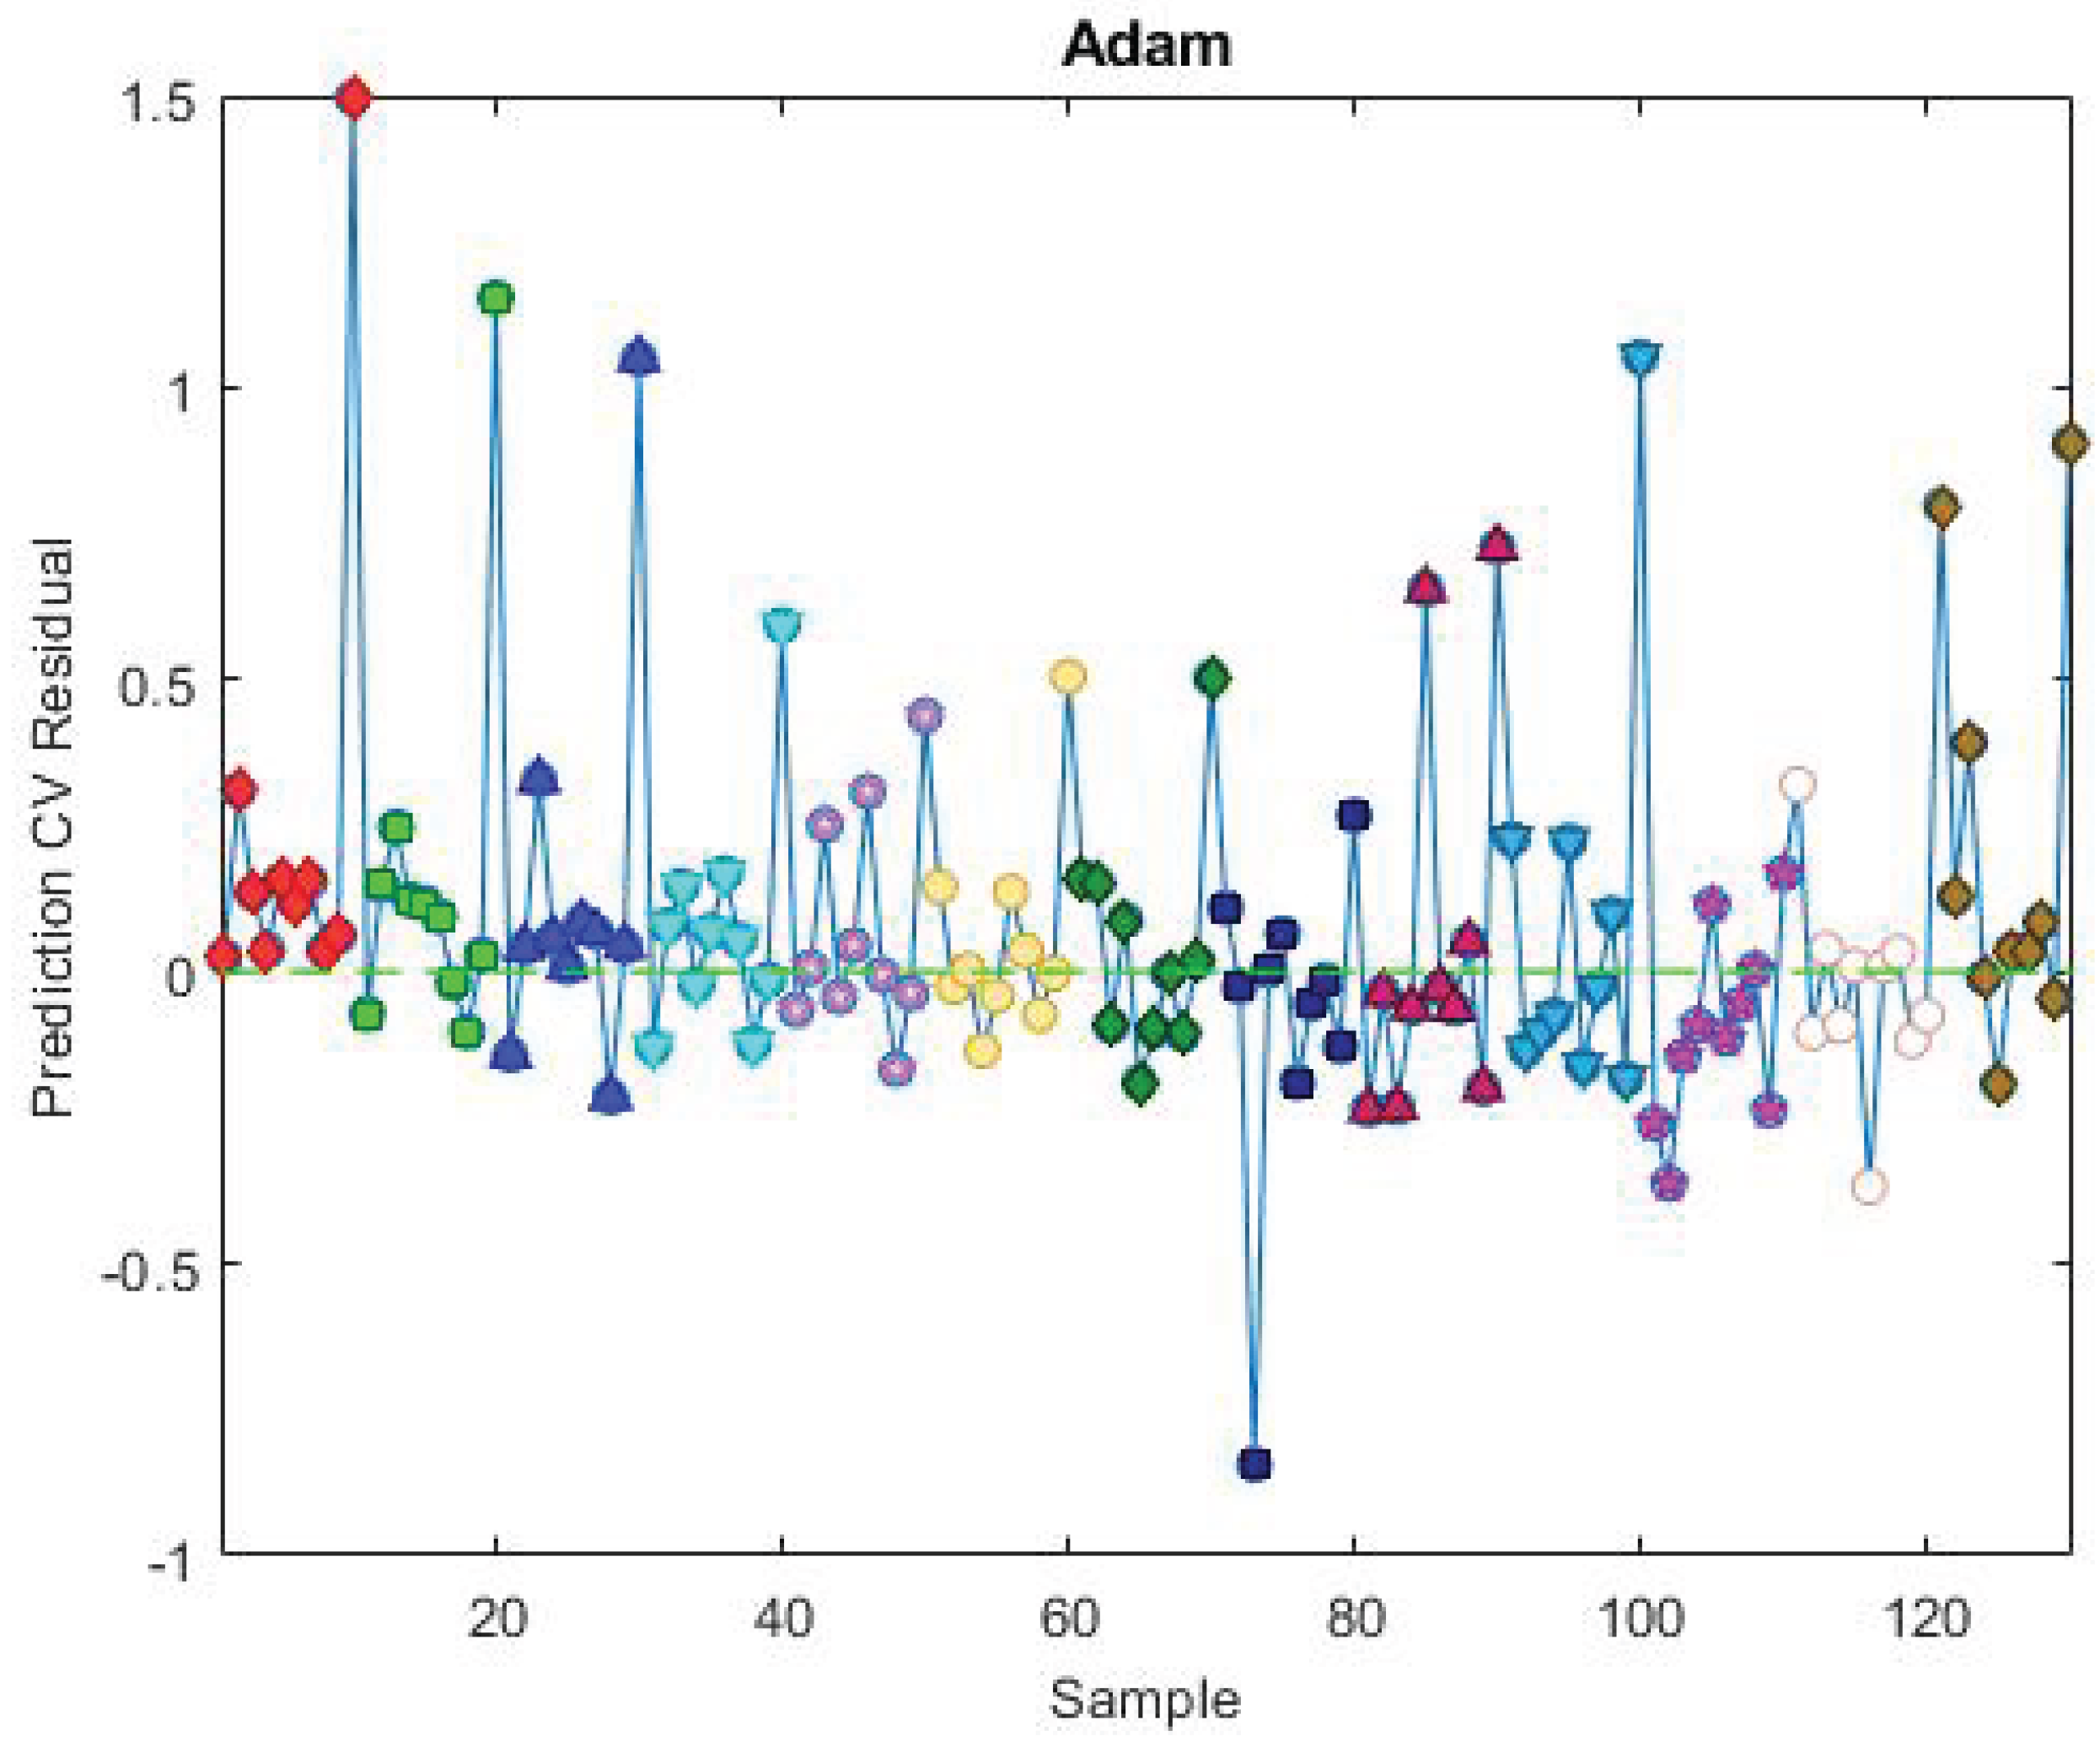
Figure 10.
Residuals plot for Adamax optimizer.
Disclaimer/Publisher’s Note: The statements, opinions and data contained in all publications are solely those of the individual author(s) and contributor(s) and not of MDPI and/or the editor(s). MDPI and/or the editor(s) disclaim responsibility for any injury to people or property resulting from any ideas, methods, instructions or products referred to in the content. |
© 2025 by the authors. Licensee MDPI, Basel, Switzerland. This article is an open access article distributed under the terms and conditions of the Creative Commons Attribution (CC BY) license (http://creativecommons.org/licenses/by/4.0/).
Copyright: This open access article is published under a Creative Commons CC BY 4.0 license, which permit the free download, distribution, and reuse, provided that the author and preprint are cited in any reuse.


