
Submitted:
15 August 2025
Posted:
18 August 2025
You are already at the latest version
Abstract
Background: Inborn errors of immunity (IEIs) are a heterogeneous group of rare disorders caused by genetic defects in one or more components of the immune system. The Jeffrey Modell Foundation’s (JMF) Ten Warning Signs are widely used for early detection; however, their diagnostic sensitivity is limited. Machine learning (ML) approaches may improve prediction accuracy by integrating additional clinical variables into decision-making frameworks. Methods: This retrospective study included 298 participants (98 IEI, 200 non-IEI) evaluated at a university-affiliated clinical immunology clinic between January and December 2020. IEI diagnoses were confirmed using European Society for Immunodeficiencies (ESID) criteria. Two datasets were constructed: one containing only JMF criteria and another combining JMF criteria with additional clinical variables. Four ML algorithms—random forest (RF), k-nearest neighbors (k-NN), support vector machine (SVM), and naive Bayes (NB)—were trained and optimized using nested 5-fold stratified cross-validation repeated three times. Performance metrics included accuracy, sensitivity, specificity, F1 score, Youden Index, and the area under the receiver operating characteristic curve (AUROC). SHapley Additive exPlanations (SHAP) were applied to evaluate feature importance. Results: Using only JMF criteria, the best-performing model was SVM (accuracy: 0.90 ± 0.04, sensitivity: 0.93 ± 0.05, AUROC: 0.91 ± 0.02). With the addition of clinical variables, the SVM achieved superior performance (accuracy: 0.94 ± 0.03, sensitivity: 0.97 ± 0.03, AUROC: 0.99 ± 0.00), outperforming both the classical JMF criteria (accuracy: 0.91, sensitivity: 0.87, AUROC: 0.90) and the JMF-only SVM model. SHAP analysis identified family history of early death, pneumonia history, and ICU admission as the most influential predictors. Conclusion: ML models, particularly SVM integrating JMF criteria with additional clinical variables, substantially improve IEI prediction compared with classical JMF criteria. Implementation of such models in clinical settings may facilitate earlier diagnosis and timely intervention, potentially reducing morbidity and healthcare burden in IEI patients.
Keywords:
inborn errors of immunity
; Jeffrey Modell Foundation
; machine learning
; support vector machine
; clinical decision support systems
1. Introduction
Inborn errors of immunity (IEIs) constitute a heterogeneous group of disorders caused by functional impairments in one or more components of the immune system, leading to insufficient or dysregulated immune responses [1]. To date, pathogenic variants in 508 genes and 17 phenocopies have been associated with IEIs [2]. Advances in modern diagnostic tools and genomic technologies continue to expand the list of genes implicated in these conditions [3]. Despite this growing genetic landscape, IEIs are still classified as rare diseases. Globally, the estimated prevalence of IEIs is approximately 1 in 1,200 individuals, whereas in some Asian countries, the prevalence has been reported as 3.9 per 100,000 [4,5]. Patients with IEIs represent a particularly vulnerable population and impose a considerable economic burden, thus constituting a significant public health issue.
One of the major challenges in the clinical management of IEIs is the delay in diagnosis, often due to limited awareness among healthcare professionals. Such delays can lead to suboptimal treatment, increased morbidity, and higher mortality rates [6]. Therefore, early recognition of IEIs is crucial for improving patient outcomes. To address this, several clinical warning systems have been developed to assist in the early identification of individuals with suspected immune deficiencies.
Among the most widely used tools for this purpose are the Jeffrey Modell Foundation’s (JMF) Ten Warning Signs, the German Patients' Organization for Primary Immunodeficiencies (DSAI) criteria, and the Association of the Scientific Medical Societies in Germany (AWMF) and Düsseldorf Warning Signs [7,8,9,10]. These tools aim to provide simple yet effective clinical criteria for predicting the likelihood of an underlying IEI. Their primary objective is to facilitate the identification of affected individuals within large populations, thereby enabling timely referral and diagnostic work-up. Of these, the JMF warning signs have become one of the most commonly adopted and internationally recognized clinical tools in the early detection of IEIs [7].
Although the JMF warning signs are among the most commonly used clinical criteria for the early identification of IEIs, they may be insufficient in detecting certain cases [11]. In this study, we aimed to evaluate the diagnostic performance of classical JMF criteria within our cohort and to explore whether machine learning (ML) models based on these criteria could enhance predictive accuracy. Furthermore, we sought to investigate whether the integration of additional clinical features into the models could further improve the performance of these algorithms in predicting the presence of IEIs.
2. Methods
2.1. Ethical Considerations
Ethical approval for this study was obtained from the Ethics Committee of Necmettin Erbakan University, School of Medicine (Decision No: 2024/4828). Written informed consent was obtained from the legal guardians of all participants prior to inclusion in the study.
2.2. Study Design and Population
Between January 2020 and December 2020, individuals who presented to a university-affiliated clinical immunology outpatient clinic were retrospectively evaluated. Based on a comprehensive review of their clinical records, patients were classified into two groups: IEI and non-IEI. The eligibility of individuals in the IEI group was determined according to the diagnostic criteria established by the European Society for Immunodeficiencies (ESID). Patients who did not fulfill the ESID diagnostic criteria or had incomplete clinical data were excluded from the analysis. Additionally, individuals with HIV infection or secondary immunodeficiencies (e.g., due to immunosuppressive therapy, malignancy, or chronic diseases) were also excluded to avoid potential confounding.
Demographic variables (including age and sex), the presence or absence of JMF warning signs, and other relevant clinical features (as detailed in Table 1) were extracted from the institutional electronic health records and compiled into a structured dataset for further analysis.
2.3. Machine Learning Model Development
In this study, we aimed to predict the presence of IEI by utilizing both JMF critera and JMF criteria plus clinical data through the application of supervised ML algorithms. All analyses were performed using Python version 3.11.5 along with standard scientific libraries including pandas (v2.1.1) for data manipulation, numpy (v1.26.0) for numerical operations, scikit-learn (v1.3.1) for model development and evaluation, and matplotlib (v3.8.0) for data visualization.
To ensure an unbiased assessment of model performance, patients were randomly allocated into training (80%; n = 239) and test (20%; n = 59) sets. Stratified sampling was employed to preserve the class distribution of IEI and non-IEI cases within both subsets. This partitioning procedure was repeated independently for each algorithm to maintain consistency. Furthermore, stratification was preserved throughout all cross-validation folds to avoid potential bias arising from class imbalance.
We evaluated four commonly used supervised classification algorithms: random forest (RF), k-nearest neighbors (k-NN), support vector machine (SVM), and naive Bayes (NB). For each classifier, hyperparameter optimization was performed using RandomizedSearchCV. The parameter ranges were defined through ParameterGrid to ensure comprehensive search coverage while enabling computational efficiency through random sampling of the space. The hyperparameters explored included:
- for k-NN, the number of neighbors (3, 5, 7, 9) and weighting scheme ('uniform', 'distance');
- for SVM, the regularization parameter C (0.1, 1, 10), kernel type ('linear', 'rbf'), and kernel coefficient gamma ('scale', 'auto');
- for RF, the number of estimators (100, 200, 500), maximum depth (None, 10, 20), and the number of features considered at each split ('sqrt', 'log2');
- for NB, the smoothing parameter var_smoothing (1e-9, 1e-8, 1e-7).
Hyperparameter tuning was carried out using nested cross-validation with a 5-fold stratified approach repeated three times (i.e., 15 folds in total), implemented via RepeatedStratifiedKFold. The primary optimization metric was the area under the receiver operating characteristic curve (AUROC), selected for its robustness in evaluating binary classifiers, especially in datasets with class imbalance. For each algorithm, the hyperparameter configuration yielding the highest mean AUROC across the validation folds was selected for final model training.
Following optimization, each model was retrained on the full training dataset using the best-performing hyperparameters and subsequently evaluated on the independent test set. To ensure the robustness and generalizability of performance estimates, the entire training, validation, and testing pipeline was repeated 15 times for each classifier. This iterative approach allowed for the generation of a distribution of performance metrics, providing a more reliable basis for comparing model accuracy.
Finally, we examined feature contributions across all models and repetitions to identify variables that consistently demonstrated high predictive importance. Clinical variables and JMF-based features that emerged as key predictors may have future utility in informing diagnostic strategies and enhancing the performance of clinical decision support systems designed to facilitate the early detection of IEI.
2.4. Model Evaluation and Performance Metrics
To evaluate the predictive performance of the developed ML models, several standard classification metrics were calculated, including accuracy, sensitivity (recall), specificity, F1 score, and the AUROC. These metrics were computed for each model and for each grade category, across all cross-validation folds and repetitions. Receiver operating characteristic (ROC) curves were also generated to visually assess the diagnostic performance of each model.
For each model, the mean and standard deviation of the performance metrics were calculated across all iterations, enabling robust comparison between classifiers. Additionally, to gain insight into model interpretability and identify the most influential features in predicting IEI status, we applied SHapley Additive exPlanations (SHAP). Feature importance scores derived from SHAP values and model-intrinsic weight analyses were used to highlight the clinical parameters contributing most significantly to model predictions.
2.5. Statistical Analysis
Descriptive statistics were used to summarize the study cohort. Categorical variables were reported as frequencies and percentages, and group comparisons were performed using the chi-square test. Continuous variables were expressed as mean ± standard deviation (SD) along with 95% confidence intervals (CIs). The Kolmogorov–Smirnov test was used to assess the normality of data distribution. For comparisons between two groups, Student’s t-test was applied to normally distributed variables, while the Mann–Whitney U test was used for non-normally distributed variables. A two-tailed p-value < 0.05 was considered statistically significant. All statistical analyses were conducted using DATAtab software (Graz, Austria: DATAtab GmbH).
3. Results
3.1. Patient Characteristics
298 participants were included in the study, consisting of 98 IEIs and 200 controls. The average age of the participants was 74.93±62.59 months, with 146 females and 152 males. There was no significant sex differences between IEI and non-IEI groups. IEI participants were classified and included according to the International Union of Immunodeficiency Society (IUIS) 2024 system. IEI participants were most commonly comprised of antibody deficiencies (Table S1).
3.2. Clinical and JMF Features of Participants
The JMF criteria and clinical features of the participants were evaluated and presented in Table 1 and Table 2. There was a significant association and difference between IEI and non-IEI groups in terms of total JMF scores (3.37±1.66 vs. 0.34±0.61; p<0.001) (Table 1). IEI participants met the criteria for each JMF criterion significantly more than non-IEI participants (Table 1). In the JMF criteria, the criterion with the most significant difference between IEI and non-IEI participants was the need for intravenous (IV) antibiotics (82.65% vs. 15%; p<0.001). In the IEI group, the percentage of participants not meeting at least 2 criteria from the JMF criteria was 12.24%. Additionally, in the non-IEI group, the percentage of participants meeting at least 2 criteria was 6.5% (Table 2).
The presence, number, and duration of hospitalizations were higher in the IEI group compared to the non-IEI group, and there was a significant difference. Furthermore, the frequency of being in the intensive care unit was more common in the IEI group compared to the non-IEI group (43.88% vs. 3%; p<0.001). In addition to the otitis, pneumonia, and sinusitis parameters in the JMF criteria, the average number of these parameters per year was also evaluated, and it was observed that the average annual occurrence of these parameters was higher in the IEI group compared to the non-IEI group. (Table 1) Additionally, the average number of herpes labialis episodes per year was significantly higher in the IEI group compared to the non-IEI group (1.12±2.49 vs. 0.03±0.19; p<0.001). The rate of post-vaccination complications was significantly higher in the IEI group compared to the non-IEI group, and the rate of lymphadenopathy following BCG vaccination was also higher in the IEI group compared to the non-IEI group. (Table 1) However, in our cohort, there was no significant difference between the groups in terms of the occurrence of discharge following BCG vaccination. (Table 1) The frequency of chronic skin problems among participants was significantly higher in the IEI group compared to the non-IEI group. (Table 1) The day of umbilical cord detachment was significantly higher in the non-IEI group compared to the IEI group (8.56±4.52 vs. 7.1±2.32; p<0.001). In the IEI group, there was a significantly higher rate of delayed shedding of deciduous teeth and delayed wound healing compared to the non-IEI group. (Table 1) The occurrence rate of seizures, congenital heart disease, and chronic diarrhea was more frequent in IEI participants compared to the non-IEI group (Table 1).
The rate of consanguinity among parents was more frequent in the IEI group compared to the non-IEI group, and additionally, the average degree of consanguinity was significantly higher in the IEI group compared to the non-IEI group. (Table 1) The incidence of a family history of early death, tuberculosis activation, autoimmunity, and cancer were higher in the IEI group, while the incidence of allergies in the family was more frequent in the non-IEI group (Table 1).
3.3. The Performance of Machine Learning Models
ML algorithms are commonly used for classification and regression problems, and they often demonstrate superiority over basic prediction tools. In our study, we developed 8 different ML models using four different ML algorithms on two datasets created from the same participants (JMF criteria and additional clinical data beyond JMF criteria). To compare the effectiveness of the developed ML models in distinguishing between IEI and non-IEI, we calculated six different performance metrics. Performance metrics were computed for each repeat and cross-validation of the ML models, and the mean and standard deviation of the performance metrics were calculated.
3.3.1. Accuracy
One of the most widely used metrics for assessing the performance of ML models is accuracy, which is defined as the proportion of correctly classified instances to the total number of predictions made. In predicting the presence of IEI, the classical JMF criteria alone achieved an accuracy of 0.91. Among the ML models developed using only the JMF criteria, the k-NN algorithm achieved the highest accuracy (0.91 ± 0.04). When additional clinical variables were incorporated alongside the JMF criteria, the highest accuracy was obtained with the SVM model (0.94 ± 0.03). (Table 3)
3.3.2. F1 Score
The F1 score is another key performance metric for evaluating ML models, defined as the harmonic mean of precision and recall, and particularly useful in scenarios involving class imbalance. Using the classical JMF warning signs alone, the F1 score was 0.87. Among the ML models developed solely on the basis of JMF criteria, the highest F1 scores were achieved by the k-NN model (0.86 ± 0.06) and the SVM model (0.86 ± 0.05). When additional clinical variables were incorporated alongside the JMF criteria, the SVM model achieved the highest F1 score (0.92 ± 0.04). (Table 3)
3.3.3. Sensitivity
When evaluating the sensitivity of the classical JMF criteria, the JMF-based ML models, and the ML models developed by integrating additional clinical variables with the JMF criteria, the classical JMF criteria demonstrated a sensitivity of 0.87. Among the JMF-based ML models, the SVM achieved the highest sensitivity (0.93 ± 0.05). In the models incorporating additional clinical variables alongside the JMF criteria, the SVM again exhibited the best performance, with a sensitivity of 0.97 ± 0.03. (Table 3)
3.3.4. Specificity
When evaluating specificity metrics, the classical JMF criteria achieved a specificity of 0.93. Among the ML models developed using only the JMF criteria, the NB model demonstrated the highest specificity (0.95 ± 0.02). In contrast, when additional clinical variables were incorporated alongside the JMF criteria, the highest specificity was achieved by the k-NN model (0.99 ± 0.01). (Table 3)
3.3.5. Youden Index
To cumulatively assess sensitivity and specificity, we also calculated the Youden Index (YI), defined as (sensitivity + specificity − 1). The classical JMF criteria yielded a YI of 0.81. Among the ML models developed solely on the basis of JMF criteria, the highest YI was achieved by the SVM model (0.81 ± 0.07). When additional clinical variables were incorporated into the JMF-based models, the SVM again demonstrated the highest YI, reaching 0.90 ± 0.04. (Table 3)
3.3.6. AUROC
When comparing the AUROC values of the classical JMF criteria, the JMF-based ML models, and the models developed by integrating additional clinical variables with the JMF criteria, the AUROC for the classical JMF criteria was 0.90. Among the ML models developed using only the JMF criteria, the highest AUROC values were achieved by the k-NN model (0.92 ± 0.03) and the RF model (0.92 ± 0.03) (Figure 1 and Table 3). In contrast, when additional clinical variables were incorporated into the JMF-based dataset, the SVM model achieved the highest AUROC (0.99 ± 0.00) (Figure 2 and Table 3).
3.3.7. Comparison of the Classical JMF Criteria with the Best-Performing JMF-Based ML Model
When comparing the classical JMF criteria with ML models developed using only JMF features, the SVM demonstrated the best performance among the JMF-based models (AUROC: 0.91±0.02, Accuracy: 0.90±0.04, Sensitivity: 0.93±0.05, Specificity: 0.89±0.05, F1 score: 0.86±0.05, YI: 0.81±0.07). Relative to the classical JMF criteria (AUROC: 0.90, Accuracy: 0.91, Sensitivity: 0.87, Specificity: 0.93, F1 score: 0.87, YI: 0.81), the SVM model achieved a notable improvement in sensitivity while maintaining comparable accuracy and F1 score, albeit with a slight reduction in specificity (Table 3).
3.3.8. Comparison of the Best JMF-Based ML Model with the Best Integrated Model (JMF + Additional Clinical Variables)
When additional clinical variables were incorporated alongside the JMF criteria, the SVM again emerged as the best-performing model (AUROC: 0.99±0.00, Accuracy: 0.94±0.03, Sensitivity: 0.97± 0.03, Specificity: 0.93±0.05, F1 score: 0.92±0.04, YI: 0.90±0.04). Compared with the SVM trained solely on JMF criteria, the integrated model achieved consistent improvements across all performance metrics, including marked increases in AUROC (+0.08), accuracy (+0.04), sensitivity (+0.04), and YI (+0.09), while maintaining specificity at a similar level.
3.3.9. Comparison of the Classical JMF Criteria with the Best Integrated Model (JMF + Additional Clinical Variables)
Direct comparison between the classical JMF criteria and the integrated SVM model demonstrated clear superiority of the latter across all evaluated metrics. AUROC increased from 0.90 to 0.99, accuracy from 0.91 to 0.94, sensitivity from 0.87 to 0.97, and F1 score from 0.87 to 0.92, with the YI rising from 0.81 to 0.90, while specificity remained constant at 0.93. These findings indicate that incorporating additional clinical variables into JMF-based ML models substantially enhances diagnostic performance in predicting the presence of IEI.
3.4. Feature Importance Analysis of the Integrated SVM Model Using SHAP Values
SHAP analysis of the best-performing model (SVM trained with JMF criteria and additional clinical variables) revealed that the most influential predictors for IEI classification were family history of early death, history of pneumonia according to JMF criteria, and ICU admission. Other variables with substantial contributions included JMF – ear infection, number of pneumonia episodes within one year, primary immunodeficiency in the family, and presence of tuberculosis activation in the family. Clinical parameters such as IV antibiotic requirement (JMF), thrush (JMF), and duration of hospitalization also ranked among the top contributors. High SHAP values for these features were associated with an increased likelihood of IEI prediction, whereas features with lower SHAP values, such as number of herpes labialis episodes in one year and presence of hospitalization, had comparatively less impact on model output. These findings suggest that, in addition to classical JMF warning signs, certain clinical indicators reflecting severe or recurrent infections, family history, and hospitalization burden substantially enhance the discriminatory capacity of ML-based IEI prediction models (Figure 3).
4. Discussion
Inborn errors of immunity are disorders characterized by dysfunction or overactivation of the immune system of genetic origin [11,12]. As per the IUIS 2024 update, there are 508 genetic variants releated to IEI identified, and new immunodeficiencies are being identified as days go by [2]. Various systems have been developed for both pediatric and adult patients to facilitate early detection of IEI and raise awareness [13,14]. These classification systems contribute to the early identification of IEI patients, enabling them to receive timely diagnosis and consequently benefit from more targeted and effective treatment strategies. This, in turn, enhances the overall prognosis and treatment outcomes for individuals afflicted with IEI. Additionally, early diagnosis of IEI patients can help reduce the financial burden on the healthcare system associated with managing IEI-related complications [6]. The most commonly used system for identifying the presence of IEI is the "10 Warning Signs of IEI" created by the non-profit organization, the JMF [7]. However, it's acknowledged that this system may be insufficient in recognizing the presence of IEI in some patients [14]. In a study conducted by Eldeniz et al., the JMF system failed to identify 12.2% of IEI patients [7]. The sensitivity of the JMF system in identifying IEI was 56%, while its specificity was 15% [14]. In our study, we aimed to utilize ML algorithms, which continue to be an indispensable part of modern medicine, to determine the presence of IEI.
ML algorithms are commonly used for regression, classification, and clustering problems, often yielding successful results. They serve as pioneers in systems frequently employed in modern medicine, assisting healthcare professionals. ML algorithms are extensively utilized in tasks such as disease diagnosis through the processing of radiological images, predicting post-operative complications, and cancer staging [15,16,17]. In the field of allergies, ML algorithms have been utilized for determining the effectiveness of subcutaneous immunotherapy, assessing the risk of anaphylaxis, and identifying the presence of pediatric asthma [18,19,20]. In the field of clinical immunology, ML techniques are less frequently used compared to the allergy domain. This may be attributed to the lower prevalence of allergic diseases compared to diseases relevant to clinical immunology. Generating a sufficiently large dataset can be more challenging in clinical immunology than in allergy. However, there are studies indicating the potential use of ML and AI models in clinical immunology for differential diagnosis of IEIs, ensuring early diagnosis of IEIs, and IEI screening [21,22,23].
In our study, we created two separate datasets using the JMF criteria and clinical data of 298 participants. The first dataset was constructed solely from the participants' JMF criteria, while the second dataset included both the JMF criteria and additional clinical data. We developed a total of 8 ML models using four different algorithms simultaneously from both datasets (four models using only the JMF criteria and four models using the JMF criteria plus additional clinical data). We calculated the performance metrics of accuracy, sensitivity, specificity, F1 score, YI and AUROC for each ML model in every repeat and cross-validation. To determine which dataset and algorithm performed best in detecting IEI presence, we compared the performance metrics of the models with each other. Our model with the highest performance was the SVM model using the JMF criteria plus additional clinical data dataset. The SVM model had an accuracy of 0.94 ± 0.03, sensitivity of 0.97 ± 0.03, and specificity of 0.93 ± 0.05. The most effective features used by the SVM model developed with the JMF criteria plus additional clinical data for IEI detection were family history of early death, JMF-penumonia criteria, ICU admission, JMF-ear infection criteria, and number of pneumonia cases in 1 year. Additionally, these features could be evaluated as triggering indicators for determining IEI presence more effectively.
In studies related to the determination of IEI presence, Mayampurath et al. developed ML models for the early diagnosis of IEI patients. In their study, when they incorporated laboratory data in addition to clinical data, they achieved an AUROC value of 0.72 [23]. Similar to our study, they also reached the highest AUROC value using the SVM model (0.99 ± 0.00).20 Barrera, Jose Alfredo Méndez, et al. developed ML models to differentiate IEI cases according to subtypes defined by the IUIS using the USIDNET database and succeeded in creating highly successful models. In their developed model, they achieved the highest accuracy (0.996) in detecting leukocyte adhesion defects, while they reached the highest AUROC value (0.89) in detecting DiGeorge syndrome [22]. Rider et al. developed an artificial intelligence-based IEI screening system [21]. In their developed system, they first identify high-risk cases for IEI using only the JMF criteria and then utilize AI to detect IEI patients. They achieved high performance metrics with their developed AI system.18 The most successful model had an accuracy of 1.0, an AUROC of 1.0, and an F1 score of 1.0.18 However, relying solely on the initial screening with JMF criteria in their developed system may lead to missing some IEI cases. This is because literature reports that JMF may incorrectly predict some IEI cases.
This study has several limitations that should be acknowledged. First, its retrospective, single-center design may limit the generalizability of the findings to broader populations with differing demographic and clinical characteristics. Second, although the study included a relatively large cohort for an IEI-focused investigation, the sample size (particularly within specific IEI subtypes )remains limited, which may reduce the robustness of subgroup analyses and potentially affect model stability. Third, external validation of the developed ML models was not performed; therefore, their predictive performance in other healthcare settings remains to be determined. Fourth, while we incorporated multiple performance metrics and used SHAP analysis to improve interpretability, laboratory and genetic data were not included in model development. Integration of such data could potentially enhance predictive accuracy. Lastly, the study did not assess the cost-effectiveness or real-world clinical impact of implementing these ML models in routine practice, which warrants further prospective investigation.
In conclusion, we developed models that demonstrate high performance in determining the presence of IEI using ML algorithms. By utilizing these models, clinicians can provide earlier diagnoses for IEI patients, potentially reducing the burden on the healthcare system. With increased utilization of ML and artificial intelligence models, preventive measures or effective treatments for allergic and immunological disorders can be achieved. Future studies should focus on external validation of these models in multi-center, prospective cohorts and explore the integration of laboratory and genetic data to further enhance predictive performance and clinical applicability.
Supplementary Materials
The following supporting information can be downloaded at the website of this paper posted on Preprints.org.
Author Contributions
Conceptualization, A.Y. and A.Ş.; methodology, G.S.; software, F.C.E.; validation, Y.G., M.A.K. and Ş.N.G.; formal analysis, S.K.; investigation, A.Y.; resources, A.Ş.; data curation, G.S.; writing—original draft preparation, A.Y.; writing—review and editing, S.K.; visualization, M.A.K.; supervision, A.Y.; project administration, İ.R. All authors have read and agreed to the published version of the manuscript.
Funding
This research received no external funding.
Institutional Review Board Statement
Ethical approval for this study was obtained from the Ethics Committee of Necmettin Erbakan University, School of Medicine (Decision No: 2024/4828), approved on 1 March 2024.
Informed Consent Statement
Written informed consent was obtained from the legal guardians of all participants prior to inclusion in the study.
Data Availability Statement
The data that support the findings of this study are available from the corresponding author upon reasonable request.
Conflicts of Interest
The authors declare no conflict of interest.
References
- Tangye, S.; Al-Herz, W.; Bousfiha, A.; Cunningham-Rundles, C.; Franco, J.; Holland, S.; Klein, C.; Morio, T.; Oksenhendler, E.; Picard, C.; et al. Human Inborn Errors of Immunity: 2022 Update on the Classification from the International Union of Immunological Societies Expert Committee. JOURNAL OF CLINICAL IMMUNOLOGY 2022, 42, 1473-1507. [CrossRef]
- Poli MC, A.I., Bousfiha A, Cunningham-Rundles C, Hambleton S, Klein C, Morio T, Picard C, Puel A, Rezaei N, Seppanen MR. Human inborn errors of immunity: 2024 Update on the classification from the International Union of Immunological Societies Expert Committee. Journal of Human Immunology, 2025.
- Bousfiha, A.; Jeddane, L.; Ailal, F.; Casanova, J.; Abel, L. Primary Immunodeficiency Diseases Worldwide: More Common than Generally Thought. JOURNAL OF CLINICAL IMMUNOLOGY 2014, 34, 371-371.
- Boyle, J.; Buckley, R. Population prevalence of diagnosed primary immunodeficiency diseases in the United States. JOURNAL OF CLINICAL IMMUNOLOGY 2007, 27, 497-502. [CrossRef]
- Abolhassani, H.; Azizi, G.; Sharifi, L.; Yazdani, R.; Mohsenzadegan, M.; Delavari, S.; Sohani, M.; Shirmast, P.; Zahra; Mahdaviani, S.; et al. Global systematic review of primary immunodeficiency registries. EXPERT REVIEW OF CLINICAL IMMUNOLOGY 2020, 16, 717-732. [CrossRef]
- Elsink, K.; van Montfrans, J.; van Gijn, M.; Blom, M.; van Hagen, P.; Kuijpers, T.; Frederix, G. Cost and impact of early diagnosis in primary immunodeficiency disease: A literature review. CLINICAL IMMUNOLOGY 2020, 213. [CrossRef]
- Eldeniz, F.; Gul, Y.; Yorulmaz, A.; Guner, S.; Keles, S.; Reisli, I. Evaluation of the 10 Warning Signs in Primary and Secondary Immunodeficient Patients. FRONTIERS IN IMMUNOLOGY 2022, 13. [CrossRef]
- Wahn, V. The infection susceptible child. HNO, 2000; pp 2000;2048(2003):2231–2004.
- Farmand, S.; Baumann, U.; von Bernuth, H.; Borte, M.; Foerster-Waldl, E.; Franke, K.; Habermehl, P.; Kapaun, P.; Klock, G.; Liese, J.; et al. Interdisciplinary AWMF Guideline for the Diagnostics of Primary Immunodeficiency. KLINISCHE PADIATRIE 2011, 223, 378-385. [CrossRef]
- Lankisch, P.; Schiffner, J.; Ghosh, S.; Babor, F.; Borkhardt, A.; Laws, H. The Duesseldorf Warning Signs for Primary Immunodeficiency: Is it Time to Change the Rules? JOURNAL OF CLINICAL IMMUNOLOGY 2015, 35, 273-279. [CrossRef]
- Notarangelo, L. Primary immunodeficiencies. JOURNAL OF ALLERGY AND CLINICAL IMMUNOLOGY 2010, 125, S182-S194. [CrossRef]
- Jamee, M.; Azizi, G.; Baris, S.; Karakoc-Aydiner, E.; Ozen, A.; Kiliç, S.; Kose, H.; Chavoshzadeh, Z.; Mahdaviani, S.; Momen, T.; et al. Clinical, immunological, molecular and therapeutic findings in monogenic immune dysregulation diseases: Middle East and North Africa registry. CLINICAL IMMUNOLOGY 2022, 244. [CrossRef]
- Arslan, S.; Ucar, R.; Caliskaner, A.; Reisli, I.; Guner, S.; Sayar, E.; Baloglu, I. How effective are the 6 European Society of Immunodeficiency warning signs for primary immunodeficiency disease? ANNALS OF ALLERGY ASTHMA & IMMUNOLOGY 2016, 116, 151-+. [CrossRef]
- Arkwright, P.; Gennery, A. Ten warning signs of primary immunodeficiency: a new paradigm is needed for the 21st century. In YEAR IN HUMAN AND MEDICAL GENETICS: INBORN ERRORS OF IMMUNITY I, 2011; Vol. 1238, pp 7-14.
- Madabhushi, A.; Lee, G. Image analysis and machine learning in digital pathology: Challenges and opportunities. MEDICAL IMAGE ANALYSIS 2016, 33, 170-175. [CrossRef]
- Altintas, E.; Sahin, A.; Babayev, H.; Gül, M.; Batur, A.; Kaynar, M.; Kiliç, Ö.; Göktas, S. Machine learning algorithm predicts urethral stricture following transurethral prostate resection. WORLD JOURNAL OF UROLOGY 2024, 42. [CrossRef]
- Altıntaş E, Ş.A., Erol S, Özer H, Gül M, Batur AF, Kaynar M, Kılıç Ö, Göktaş S. Navigating the gray zone: Machine learning can differentiate malignancy in PI-RADS 3 lesions. Elsevier: In Urologic Oncology: Seminars and Original Investigations, 2024; pp S1078-1439(1024)00645-00648.
- Wang, N.; Song, J.; Sun, S.; Zhu, K.; Li, J.; Wang, Z.; Guo, C.; Xiang, W.; Tong, Y.; Zeng, M.; et al. Immune signatures predict response to house dust mite subcutaneous immunotherapy in patients with allergic rhinitis. ALLERGY 2024, 79, 1230-1241. [CrossRef]
- Randhawa, I.; Groshenkov, K.; Sigalov, G. Food anaphylaxis diagnostic marker compilation in machine learning design and validation. PLOS ONE 2023, 18. [CrossRef]
- Kothalawala, D.; Murray, C.; Simpson, A.; Custovic, A.; Tapper, W.; Arshad, S.; Holloway, J.; Rezwan, F.; Investigators, S.U. Development of childhood asthma prediction models using machine learning approaches. CLINICAL AND TRANSLATIONAL ALLERGY 2021, 11. [CrossRef]
- Rider, N.; Coffey, M.; Kurian, A.; Quinn, J.; Orange, J.; Modell, V.; Modell, F. A validated artificial intelligence-based pipeline for population-wide primary immunodeficiency screening. JOURNAL OF ALLERGY AND CLINICAL IMMUNOLOGY 2023, 151, 272-279. [CrossRef]
- Barrera, J.; Guzman, S.; Cascajares, E.; Garabedian, E.; Fuleihan, R.; Sullivan, K.; Reyes, S. Who's your data? Primary immune deficiency differential diagnosis prediction via machine learning and data mining of the USIDNET registry. JOURNAL OF CLINICAL IMMUNOLOGY 2022, 42, S7-S8.
- Mayampurath, A.; Ajith, A.; Anderson-Smits, C.; Chang, S.; Brouwer, E.; Johnson, J.; Baltasi, M.; Volchenboum, S.; Devercelli, G.; Ciaccio, C. Early Diagnosis of Primary Immunodeficiency Disease Using Clinical Data and Machine Learning. JOURNAL OF ALLERGY AND CLINICAL IMMUNOLOGY-IN PRACTICE 2022, 10, 3002-+. [CrossRef]
Figure 1.
ROC curves of machine learning models developed using only JMF criteria for predicting IEI. The four evaluated algorithms were KNN, SVM, RF, and NB. The AUROC values were 0.92 for KNN, 0.91 for SVM, 0.92 for RF, and 0.91 for NB, indicating comparable discriminatory performance across models.
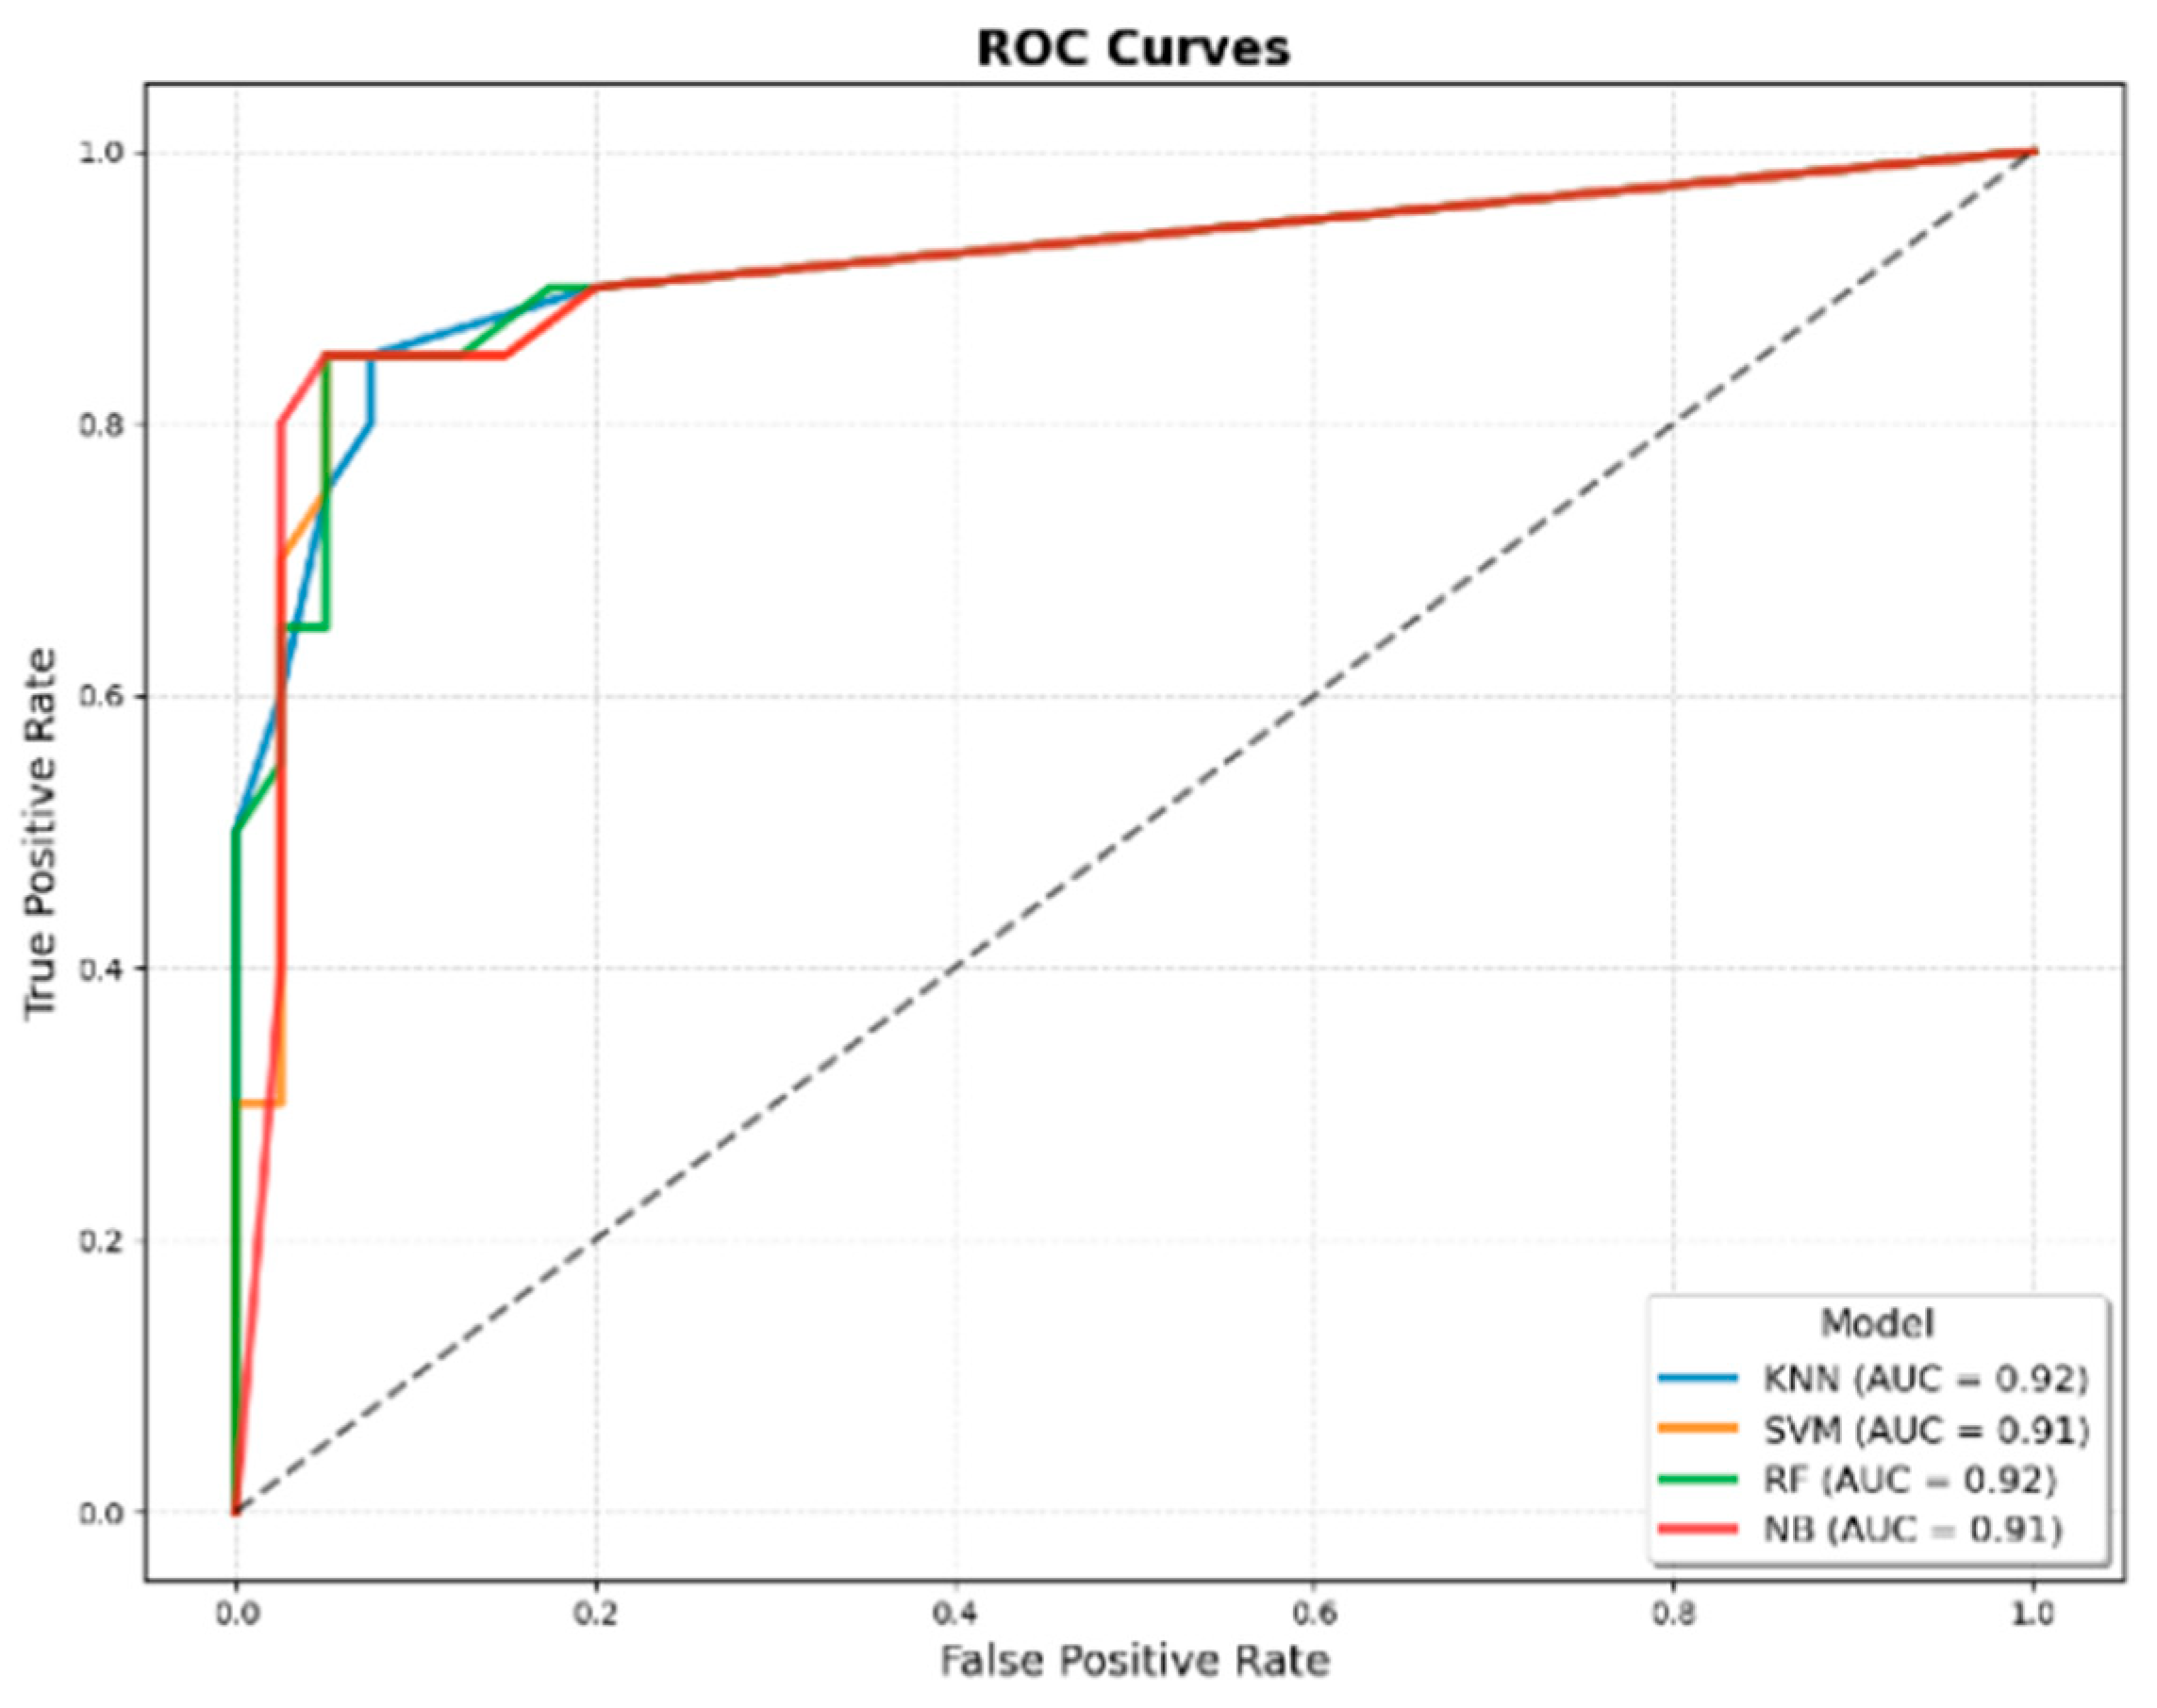
Figure 2.
ROC curves of machine learning models developed using JMF criteria combined with additional clinical variables for predicting IEI. The four evaluated algorithms were KNN, SVM, RF, and NB. The AUROC values were 0.95 for KNN, 0.99 for SVM, 0.98 for RF, and 0.97 for NB, demonstrating superior discriminatory performance compared with models developed using only JMF criteria.
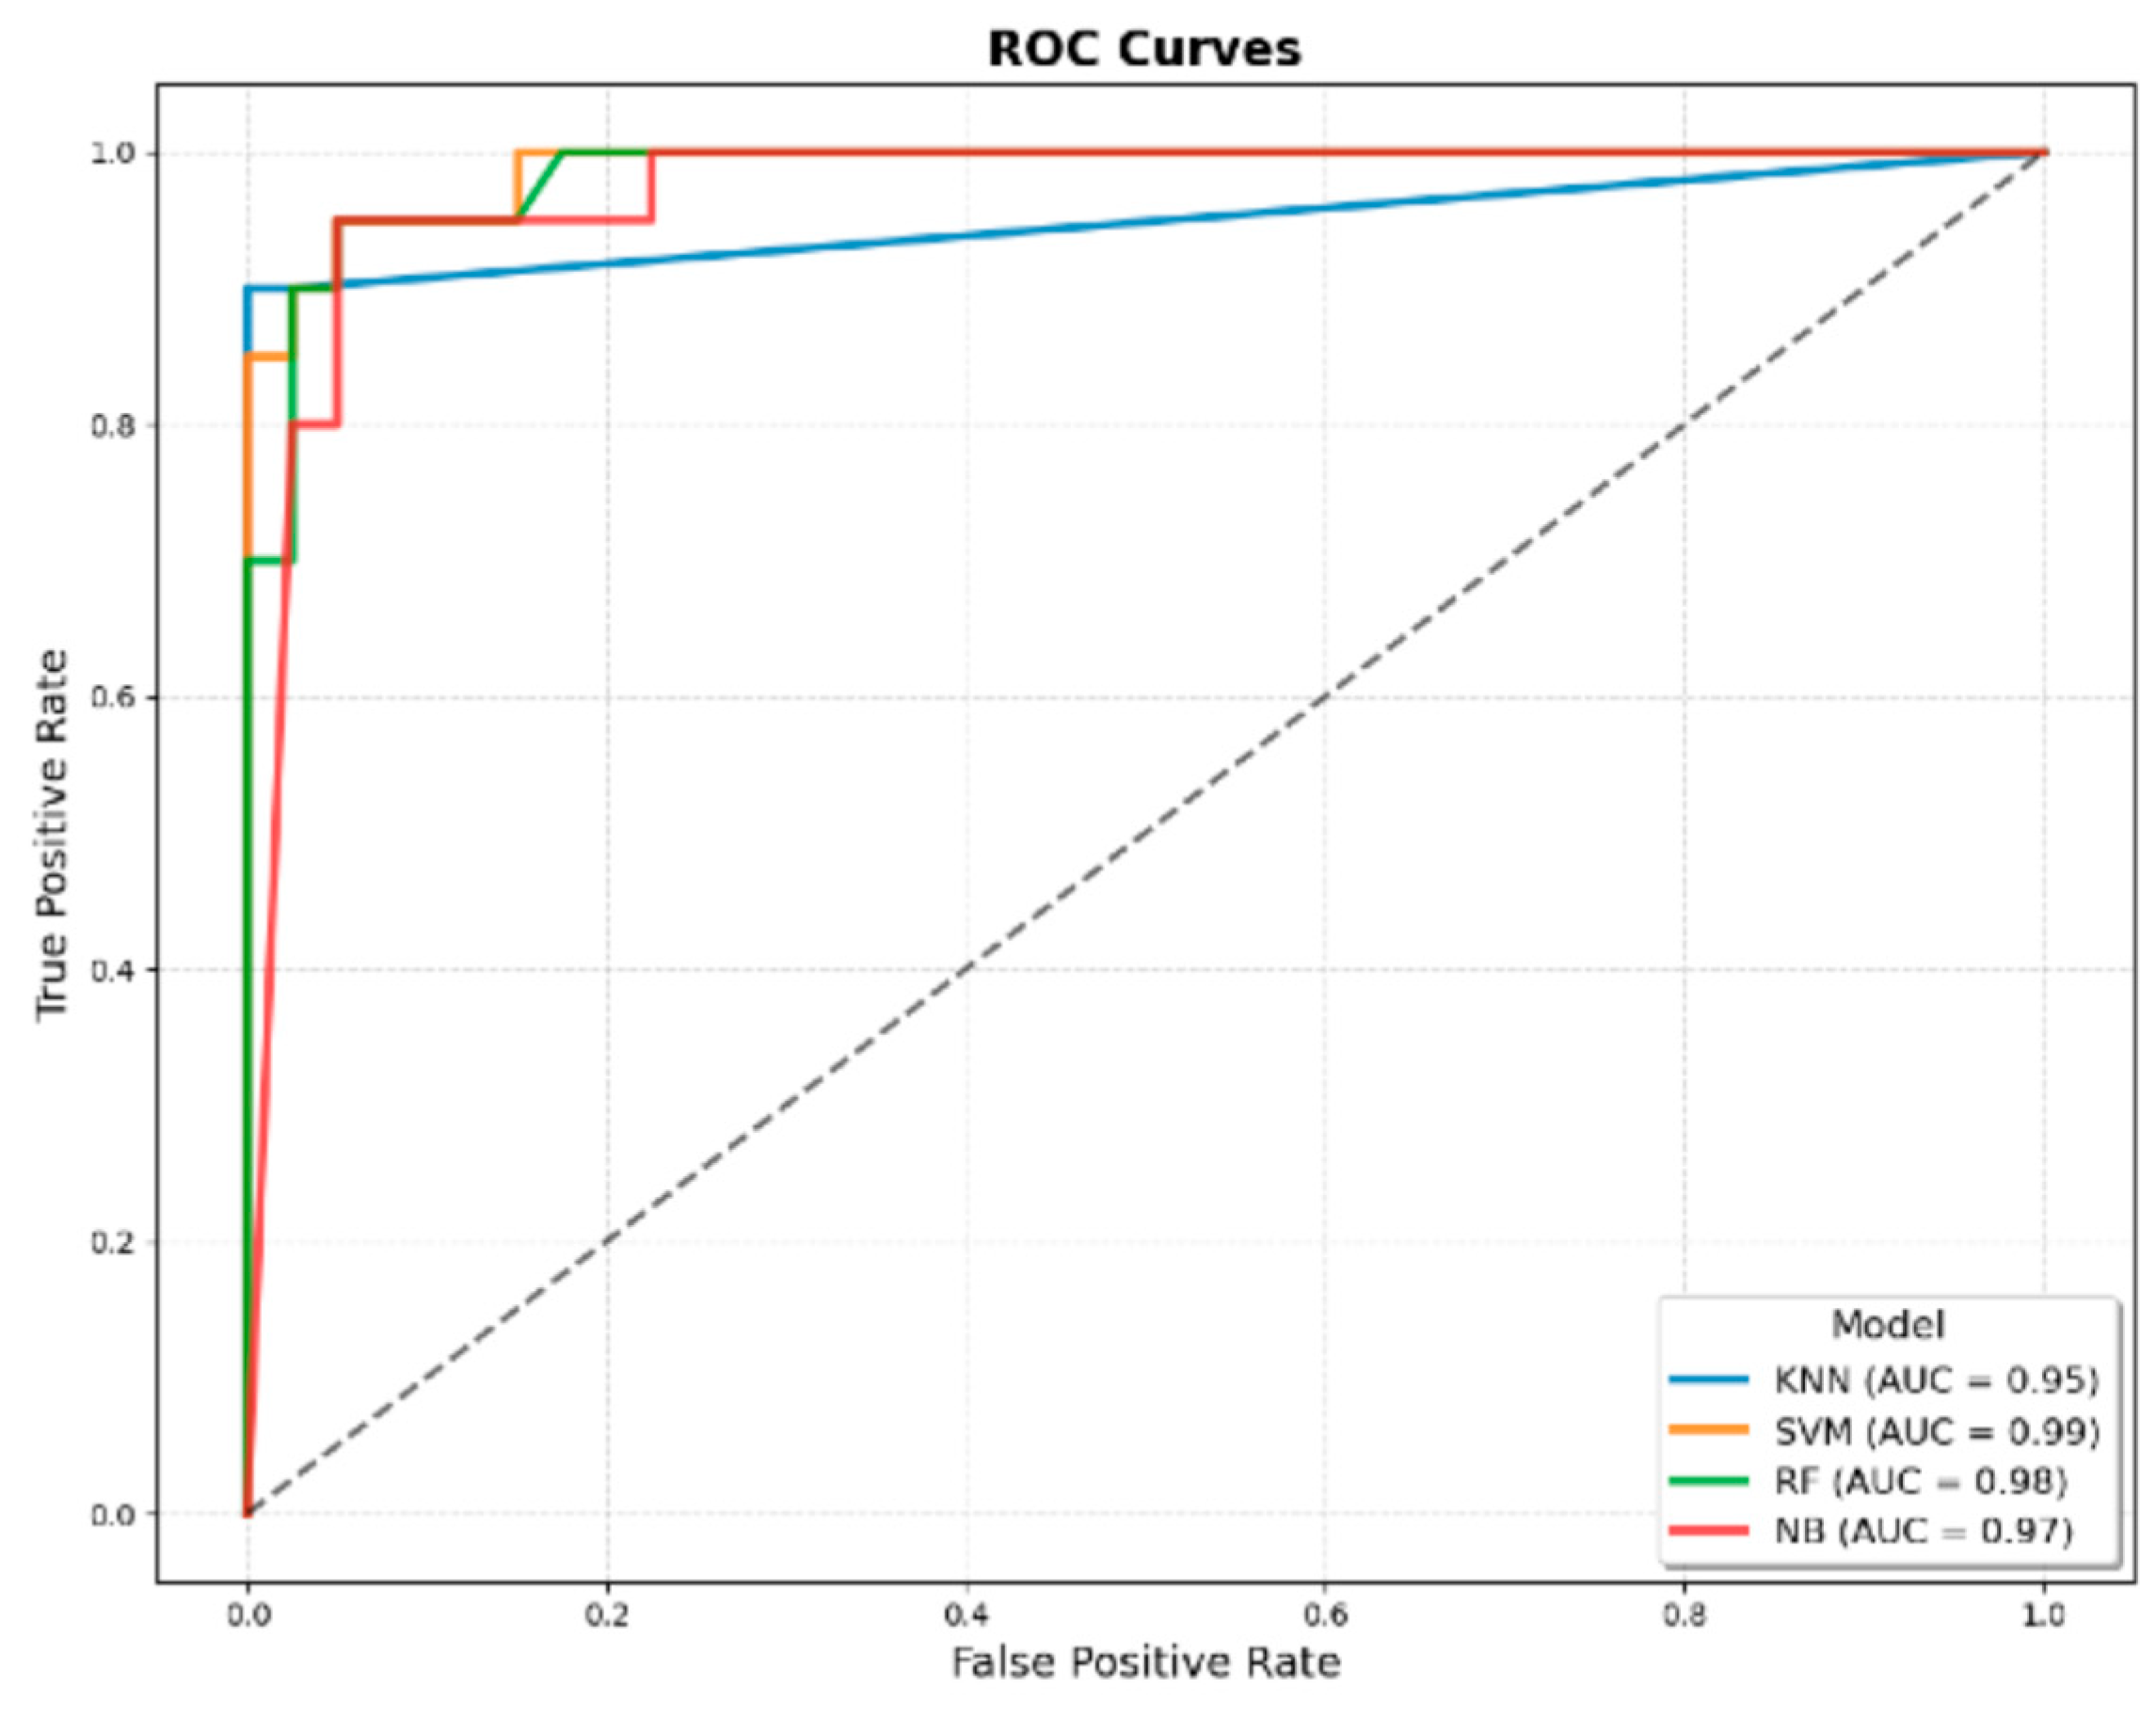
Figure 3.
SHAP summary plot of the best-performing SVM model developed using JMF criteria combined with additional clinical variables for predicting IEI. The plot ranks features by their average absolute SHAP value, indicating their relative contribution to model predictions. The most influential predictors were family history of early death, JMF–pneumonia criterion, ICU admission, JMF–ear infection criterion, and number of pneumonia cases within one year. Color denotes the original feature value (red = high, blue = low), and position along the x-axis reflects the impact on the model output.
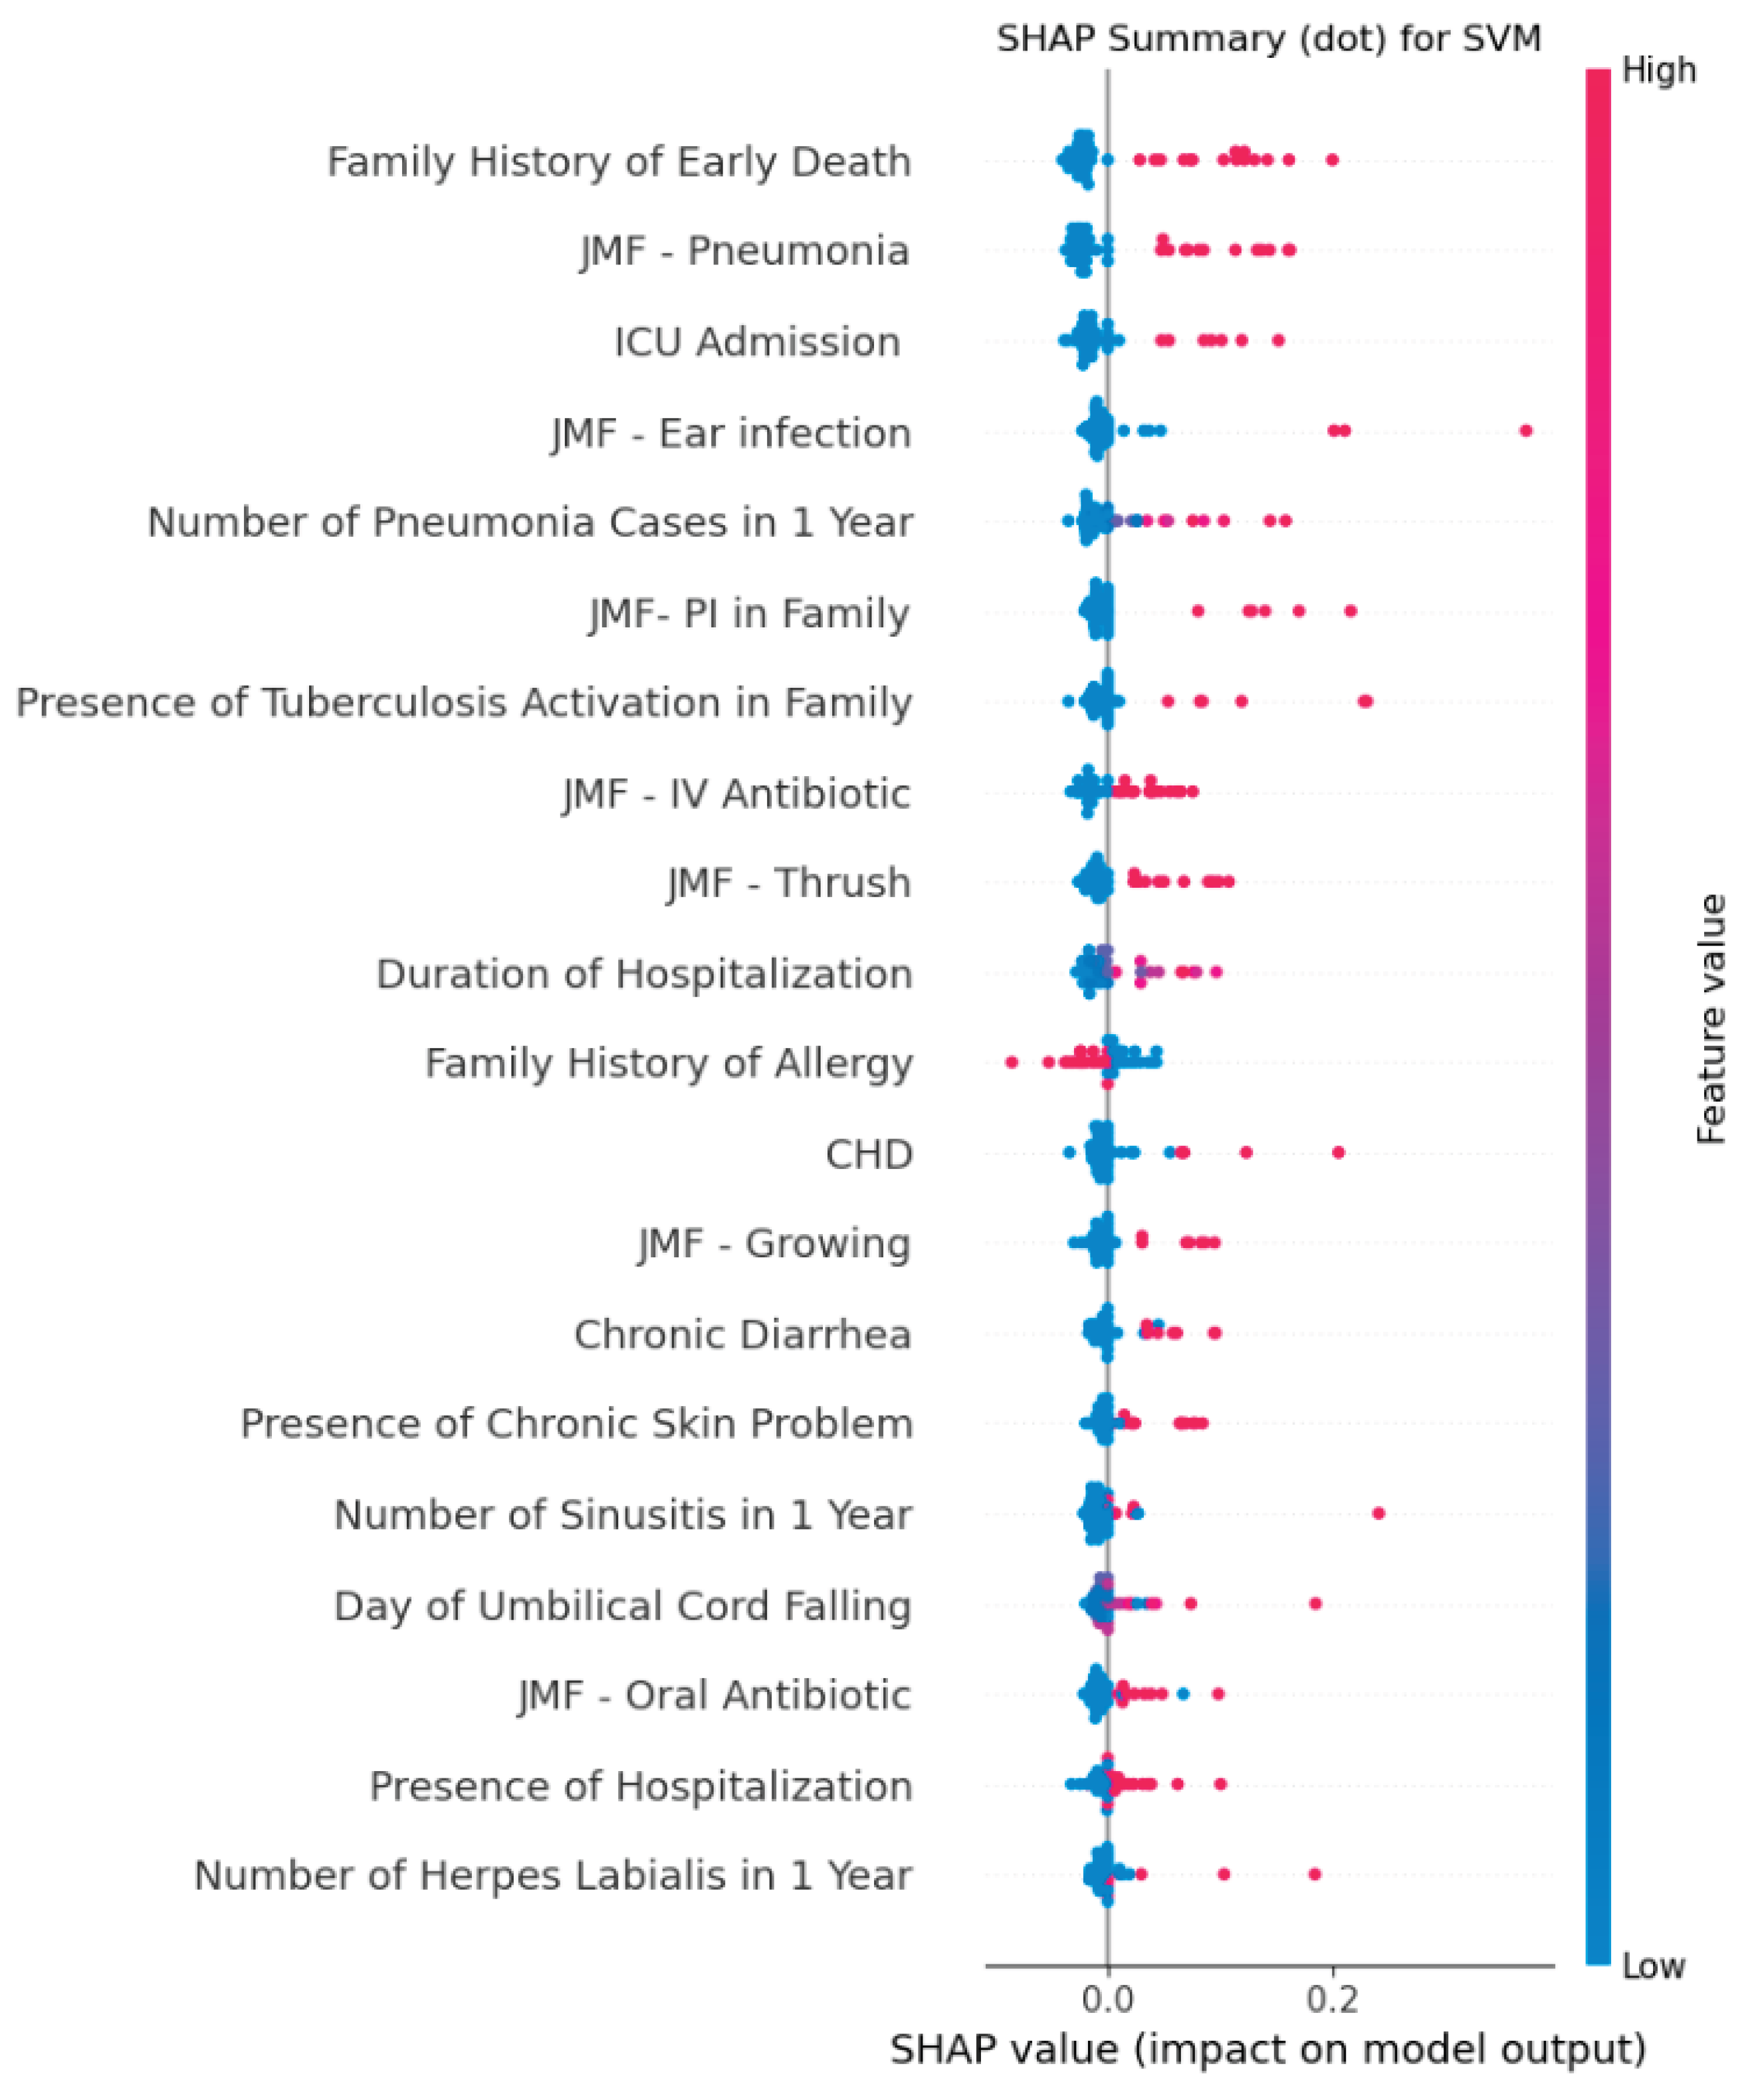

Table 1.
The characteristics of clinical and JMF 10 warning sign criteria for IEI and non-IEI participants. (Abbreviations: IEI, inborn errors of immunity; n, number; ns, non significant; CI, confidence interval; BCG, Bacillus Calmette–Guérin; CHD, Congenital heart disease; ICU, intensive care unit; JMF, Jeffery Modell Foundation; αchi-square test applied; βMann-Whitney U-test applied).
| Features | Overall | IEI | non-IEI | p value | |
|---|---|---|---|---|---|
| Patients, (n, %) | 298 (100) | 98 (32.8) | 200 (67.2) | - | |
| Age (month), (mean±SD) | 74.93 ± 62.59 [68.43 - 81.44] | 98.87±66.37 [85.56 - 112.17] |
65.46 ± 63.71 [56.53 - 74.38] |
<0.001α | |
| Sex | Female, (n, %) | 146 (48.99) | 48 (48.98) | 98 (49) | nsα |
| Male, (n, %) | 152 (51.01) | 50 (51.02) | 102 (51) | ||
| JMF Warning Signs | |||||
| ≥ 4 new ear infections within 1 year, (n, %) | 9 (3.02) | 8 (8.16) | 1 (0.5) | <0.001α | |
| ≥ 2 serious sinus infections within 1 year, (n, %) | 11 (3.69) | 9 (9.18) | 2 (1) | <0.001α | |
| ≥ 2 months on antibiotics with little effect, (n, %) | 53 (17.79) | 45 (45.92) | 8 (4) | <0.001α | |
| ≥ 2 pneumonias within 1 year, (n, %) | 70 (23.49) | 63 (64.29) | 7 (3.5) | <0.001α | |
| Failure of an infant to gain weight or grow normally, (n, %) | 40 (13.42) | 37 (37.76) | 3 (1.5) | <0.001α | |
| Recurrent, deep skin or organ abscesses, (n, %) | 10 (3.36) | 9 (9.18) | 1 (0.5) | <0.001α | |
| Persistent thrush in mouth or fungal infection on skin, (n, %) | 55 (18.46) | 43 (43.88) | 12 (6) | <0.001α | |
| Need for IV antibiotics to clear infections, (n, %) | 111 (37.25) | 81 (82.65) | 30 (15) | <0.001α | |
| ≥ 2 deep-seated infections including septicemia, (n, %) | 10 (3.36) | 9 (9.18) | 1 (0.5) | <0.001α | |
| Family history of IEI, (n, %) | 29 (9.73) | 25 (25.51) | 4 (2) | <0.001α | |
| Total JMF points, (mean±SD) [95% CI] | 1.34 ± 1.78 [1.13 - 1.54] |
3.37 ± 1.66 [3.03 - 3.7] |
0.34 ± 0.61 [0.25 - 0.43] |
<0.001β | |
| Additional Clinical Data | |||||
| Presence of Hospitalization, (n, %) | 130 (43.62) | 86 (87.76) | 44 (12.24) | <0.001α | |
| Number of Hospitalizations, (mean±SD) [95% CI] |
7.07 ± 18.68 [4.93 - 9.21] |
12.83 ± 25.42 [7.73 - 17.92] |
4.25 ± 13.47 [2.36 - 6.13] |
<0.001β | |
| Duration of Hospitalization, (mean±SD) [95% CI] |
4.87 ± 6.33 [4.15 - 5.6] |
10.69 ± 7.43 [9.2 - 12.18] |
2.02 ± 2.85 [1.62 - 2.42] |
<0.001β | |
| Number of Otitis in 1 Year, (mean±SD) [95% CI] |
0.42 ± 1.37 [0.26 - 0.57] |
1.07 ± 2.16 [0.64 - 1.5] |
0.1 ± 0.47 [0.03 - 0.16] |
<0.001β | |
| Number of Sinusitis in 1 Year, (mean±SD) [95% CI] |
0.24 ± 0.94 [0.13 - 0.35] | 0.59 ± 1.38 [0.31 - 0.87] |
0.07 ± 0.54 [-0.01 - 0.15] |
<0.001β | |
| Number of Pneumonia in 1 Year, (mean±SD) [95% CI] |
1.37 ± 2.58 [1.07 - 1.66] |
3.65 ± 3.42 [2.97 - 4.34] |
0.25 ± 0.6 [0.17 - 0.33] |
<0.001β | |
| Number of Herpes Labialis in 1 Year, (mean±SD) [95% CI] |
0.39 ± 1.52 [0.21 - 0.56] |
1.12 ± 2.49 [0.62 - 1.62] |
0.03 ± 0.19 [0 - 0.05] |
<0.001β | |
| Vaccination Releated Complications, (n, %) | 8 (2.68) | 6 (6.12) | 2 (1) | <0.05α | |
| Discharge After BCG Vaccination, (n, %) | 5 (1.68) | 3 (3.06) | 2 (1) | nsα | |
| Lymphadenopathy After BCG Vaccination, (n, %) | 3 (1.01) | 3 (1.01) | 0 (0) | <0.05α | |
| Presence of Chronic Skin Problem, (n, %) | 55 (18.46) | 44 (44.9) | 11 (5.5) | <0.001α | |
| Day of Umbilical Cord Falling, (mean±SD) [95% CI] |
7.58 ± 3.28 [7.2 - 7.95] |
7.1 ± 2.32 [6.77 - 7.42] |
8.56 ± 4.52 [7.66 - 9.47] |
<0.001β | |
| Delay in Milk Tooth Shedding, (n, %) | 16 (5.37) | 12 (12.24) | 4 (2) | <0.001α | |
| Delay in Wound Healing, (n, %) | 35 (11.74) | 29 (29.59) | 6 (3) | <0.001α | |
| Convulsion, (n, %) | 26 (8.72) | 20 (20.41) | 6 (3) | <0.001α | |
| CHD, (n, %) | 23 (7.72) | 21 (21.43) | 2 (1) | <0.001α | |
| Chronic Diarrhea, (n, %) | 34 (11.41) | 28 (28.57) | 6 (3) | <0.001α | |
| ICU Admission, (n, %) | 49 (16.44) | 43 (43.88) | 6 (3) | <0.001α | |
| Presence of Consanguinity Between Parents, (n, %) | 21 (7.05) | 16 (16.33) | 5 (2.5) | <0.001α | |
| Degree of Consanguinity, (mean±SD) [95% CI] |
0.28 ± 0.69 [0.2 - 0.36] |
0.57 ± 0.86 [0.4 - 0.74] |
0.14 ± 0.53 [0.06 - 0.21] |
<0.001β | |
| Family History of Early Death, (n, %) | 77 (25.84) | 66 (67.35) | 11 (5.5) | <0.001α | |
| Presence of Tuberculosis Activation in Family, (n, %) | 21 (7.05) | 16 (16.33) | 5 (2.5) | <0.001α | |
| Family History of CHD, (n, %) | 25 (8.39) | 11 (11.22) | 14 (7) | nsα | |
| Family History of Autoimmunity, (n, %) | 51 (17.11) | 28 (28.57) | 23 (11.5) | <0.001α | |
| Family History of Allergy, (n, %) | 129 (43.29) | 31 (31.63) | 98 (49) | <0.05α | |
| Family History of Cancer, (n, %) | 52 (17.45) | 28 (28.57) | 24 (12) | <0.001α | |
Table 2.
The distribution of JMF scores for IEI and non-IEI groups. (Abbreviations: JMF, Jeffery Modell Foundation; IEI, Inborn Errors of Immunity; αchi-square test applied.).
Table 2.
The distribution of JMF scores for IEI and non-IEI groups. (Abbreviations: JMF, Jeffery Modell Foundation; IEI, Inborn Errors of Immunity; αchi-square test applied.).
| Total JMF Points | Overall | IEI | non-IEI | p valueα |
|---|---|---|---|---|
| 0 points | 148 (49.66) | 2 (2.04) | 146 (73) | <0.001 |
| 1 points | 51 (17.11) | 10 (10.2) | 41 (20.5) | |
| 2 points | 34 (11.41) | 22 (22.45) | 12 (6) | |
| 3 points | 21 (7.05) | 19 (19.39) | 1 (0.5) | |
| 4 points | 20 (6.71) | 21 (21.43) | 0 (0) | |
| 5 points | 13 (4.36) | 13 (13.27) | 0 (0) | |
| 6 points | 7 (2.35) | 7 (7.14) | 0 (0) | |
| 7 points | 4 (1.34) | 4 (4.08) | 0 (0) | |
| 8 points | 0 (0) | 0 (0) | 0 (0) | |
| 9 points | 0 (0) | 0 (0) | 0 (0) | |
| 10 points | 0 (0) | 0 (0) | 0 (0) |
Table 3.
Performance metrics of the classical JMF criteria, ML models developed using only JMF features, and ML models developed using JMF features combined with additional clinical variables for predicting IEI. The four evaluated ML algorithms were KNN, SVM, RF, and NB. Metrics include accuracy, sensitivity, specificity, F1 Score, Youden Index, and AUROC. Values are reported as mean ± SD across all cross-validation folds and repetitions for ML models, and as single values for the classical JMF criteria.
| Classical JMF Criteria | ML Models (Using Only JMF Features) |
ML Models (Using JMF + Additional Features) |
|||||||
|---|---|---|---|---|---|---|---|---|---|
| Metrics | Threshold-based Scoring | KNN | SVM | RF | NB | KNN | SVM | RF | NB |
| Accuracy | 0.91 | 0.91 ± 0.04 | 0.90 ± 0.04 | 0.90 ± 0.03 | 0.88 ± 0.03 | 0.85 ± 0.03 | 0.94 ± 0.03 | 0.93 ± 0.03 | 0.93 ± 0.03 |
| Sensitivity | 0.87 | 0.83 ± 0.06 | 0.93 ± 0.05 | 0.84 ± 0.08 | 0.73 ± 0.10 | 0.56 ± 0.08 | 0.97 ± 0.03 | 0.84 ± 0.07 | 0.93 ± 0.04 |
| Specificity | 0.93 | 0.94 ± 0.04 | 0.89 ± 0.05 | 0.93 ± 0.04 | 0.95 ± 0.02 | 0.99 ± 0.01 | 0.93 ± 0.05 | 0.98 ± 0.02 | 0.94 ± 0.04 |
| F1 Score | 0.87 | 0.86 ± 0.06 | 0.86 ± 0.05 | 0.85 ± 0.05 | 0.80 ± 0.07 | 0.71 ± 0.07 | 0.92 ± 0.04 | 0.89 ± 0.05 | 0.90 ± 0.04 |
| Youden Index | 0.81 | 0.78 ± 0.08 | 0.81 ± 0.07 | 0.77 ± 0.08 | 0.68 ± 0.10 | 0.56 ± 0.08 | 0.90 ± 0.04 | 0.82 ± 0.08 | 0.86 ± 0.05 |
| AUROC | 0.90 | 0.92 ± 0.03 | 0.91 ± 0.02 | 0.92 ± 0.03 | 0.91 ± 0.02 | 0.95 ± 0.03 | 0.99 ± 0.00 | 0.98 ± 0.01 | 0.97 ± 0.02 |
Disclaimer/Publisher’s Note: The statements, opinions and data contained in all publications are solely those of the individual author(s) and contributor(s) and not of MDPI and/or the editor(s). MDPI and/or the editor(s) disclaim responsibility for any injury to people or property resulting from any ideas, methods, instructions or products referred to in the content. |
© 2025 by the authors. Licensee MDPI, Basel, Switzerland. This article is an open access article distributed under the terms and conditions of the Creative Commons Attribution (CC BY) license (http://creativecommons.org/licenses/by/4.0/).
Copyright: This open access article is published under a Creative Commons CC BY 4.0 license, which permit the free download, distribution, and reuse, provided that the author and preprint are cited in any reuse.


