

Submitted:
14 August 2025
Posted:
15 August 2025
You are already at the latest version
Abstract
Background/Objectives: Effective palliative care relies on accurate identification and management of symptoms, especially in patients referred for palliative radiotherapy (PRT). This study aimed to identify symptom clusters (SCs)—defined as ≥2 interrelated symptoms—in patients evaluated at a multidisciplinary Radiotherapy and Palliative Care (RaP) outpatient clinic, using the Edmonton Symptom Assessment System (ESAS). Methods: We retrospectively analyzed data from patients referred to the RaP clinic between February 2017 and April 2020. Demographic and clinical characteristics, including ESAS scores at first visit, were collected. Principal component analysis (PCA) and unsupervised K-means clustering (KMC) were used to identify SCs. Associations with ECOG performance status (PS), primary tumor site, metastases site and PRT administration were analyzed. Exploratory survival analyses were performed.Results: Among 215 patients (median age 71 years; 53% male), the mean total ESAS score was 24.03 ± 15.28. PCA identified four SCs: SCPCA1 (tiredness, drowsiness, dyspnea, malaise), SCPCA2 (depression, anxiety), SCPCA3 (nausea, loss of appetite) and SCPCA4 (pain). KMC revealed three SCs: SCKMC1 (pain, tiredness, drowsiness, malaise), SCKMC2 (nausea, loss of appetite, dyspnea), SCKMC3 (depression, anxiety). Worse ECOG PS correlated significantly with physical SCs (p < 0.05). A trend linked SCKMC1 with greater PRT use. Psychological SCs (SCPCA2, SCKMC3) were significantly associated with a lower likelihood of receiving PRT. A trend toward shorter survival was observed among patients belonging to SCKMC2. Conclusions: SC analysis could improve clinical decision-making in the PRT setting. SC profiles reflect patient complexity and may guide personalized symptom management and treatment selection in advanced cancer.
Keywords:
symptom clusters
; palliative radiotherapy
; ESAS
; advanced cancer
; decision-making
; multidisciplinary care
1. Introduction
Palliative radiotherapy (PRT) plays a pivotal role in the management of advanced cancer patients, offering effective relief from symptoms such as pain, bleeding, or neurological deficits caused by tumor progression [1,2,3]. These patients frequently present with a high symptom burden, arising not only from the underlying malignancy but also from the adverse effects of systemic therapies [4,5]. Beyond the physical domain, psychological distress is also highly prevalent, often resulting from a complex interplay of poorly controlled symptoms, existential concerns, and the emotional impact of an incurable illness [6,7,8]. Clinical decision-making regarding the administration of PRT is inherently complex, particularly in terms of appropriateness, timing, and dose-fractionation regimens. In this context, a comprehensive, patient-centered approach becomes essential. Integrating radiation oncology with palliative care services within a dedicated clinical setting promotes a more holistic assessment and facilitates shared decision-making [9,10]. Our institution has implemented this model through the Radiotherapy and Palliative Care (RaP) outpatient clinic, a multidisciplinary service in which radiation oncologists and palliative care specialists collaborate in the evaluation and management of patients referred for PRT. Preliminary experience from this clinic has demonstrated improvements in care quality, including more appropriate patient selection for radiotherapy and timely access to supportive and palliative care services [11].
To further enhance individualized care, it is crucial to consider symptoms not as isolated entities but as interrelated phenomena that may reflect underlying syndromic patterns. The concept of symptom clusters (SC) - defined as groups of two or more concurrent and interrelated symptoms with potential shared pathophysiology - has gained prominence as a framework for understanding the multidimensional symptom burden in advanced cancer [12,13,14,15,16,17,18].
SCs identification may shed light on the shared mechanisms behind symptom co-occurrence and may support more effective and targeted symptom management strategies. Among the most widely used tools for symptom assessment in oncology is the Edmonton Symptom Assessment System (ESAS), a validated instrument that evaluates eight symptoms (pain, tiredness, drowsiness, nausea, loss of appetite, dyspnea, depression, anxiety) and malaise (i.e., reduced well-being) using a numerical rating scale (NRS)[19].
This secondary analysis of the RaP study by Rossi et al.[11] aims to retrospectively identify SCs through ESAS in patients referred for PRT.
2. Materials and Methods
This study represents a secondary, post hoc retrospective cohort analysis of the RaP clinic database. In particular all patients evaluated in the RaP clinic between February 2017 to April 2020 were included.
All patients before entering the joint visit with the radiotherapist and the palliative care physician completed the Italian Validated version of ESAS [20], in the presence of a specialist nurse.
For all patients demographic (i.e., gender and age at first RaP visit) and clinical data (i.e., ECOG PS according to radiotherapist and palliativist) were recorded. Primary tumor site, metastasis site and the presence of locally advanced cancer were recorded too. Moreover ESAS items NRS scores were recorded for all patients.
Statistical Analysis
Demographic and baseline clinical data was summarized by means of absolute frequencies and relative percentages. To describe each ESAS item, mean, standard deviation and the proportion of patients presenting a score greater or equal to four were reported. Furthermore, SCs were identified using both Principal Component Analysis (PCA) and unsupervised k-means clustering (KMC). In practice, to explore potential patterns of association (i.e., linear combinations) between ESAS items, a PCA with varimax rotation was performed. Indeed, the PCA transforms several observed variables into a reduced number of variables called principal components. Pragmatically, prior to the analysis, all variables were standardized to ensure comparability and minimize scale-related bias. Essentially, the varimax rotation was used to maximize the variance of a column of the factor pattern matrix. Significant principal components were selected with an eigenvalue higher than 0.8, and each component explained at least 10% of the variance. The highest factor loading score was used for assigning the ESAS items to an independent factor. The set of items assigned to the same independent factor collectively compose a cluster. Robust relationships and correlations among symptoms were displayed with the bi-plot representation. Subsequently, unsupervised k-means clustering was applied to the scaled data to identify natural groupings of the patients based on their ESAS symptoms. The optimal number of clusters was determined using a combination of statistical methods, namely the Elbow method (within-cluster sum of squares), the Silhouette method and the Gap Statistic. The final number of clusters was selected based on the maximum gap statistic and interpretability, resulting in a three-cluster solution. To further interpret cluster structures, between-cluster variance and R2 statistics were computed for each variable. R2 for each variable was calculated as the ratio of between-cluster sum of squares to total sum of squares. Additionally, a separation metric was derived to compare each variable’s fit within its assigned cluster versus the best alternative cluster.
To investigate the association between SCs and the likelihood of receiving PRT logistic regression models were developed. The binary outcome variable was defined as receipt of RT (1 = yes; 0 = no). Predictor variables included membership in SCs as derived from principal component analysis (PCA1–PCA4) and k-means cluster analysis (CL1–CL3). Specifically, each patient was classified as a SC belonging if at least half of the symptoms of a cluster were reported as clinically relevant (ESAS item score ≥ 4).
Univariate logistic regressions were performed separately for each SC to assess their individual association with RT. Finally, multivariable models including interaction terms were tested to explore potential combined effects among SCs. Model selection was guided by the Akaike Information Criterion (AIC) using backward stepwise selection. Coherently, final model coefficients were exponentiated and reported as odds ratios (OR) with their 95% confidence intervals (CI).
Moreover, to assess associations between SCs and clinical characteristics (e.g., ECOG status, primary tumor site, metastatic locations), chi-square tests of independence were conducted.
Finally, Kaplan–Meier survival curves were generated to compare overall survival (OS) across PCA and KMC groups. OS was defined as the time from the first RaP consultation to death or last follow-up, and expressed in months. Survival curves were drawn separately for each symptom cluster and grouped by patients belonging to each cluster.
All analyses were performed using R Statistical Software (version 4.4.2). The ‘psych’, ‘factoextra’ and ‘cluster’ libraries were used for performing the PCA and K-means cluster analysis. Finally, ‘ggplot2’ package was used for drawing the figures and graphs.
3. Results
Of the 215 patients included in the present analysis, the median age was 71 years (range: 37–90), and 122 (53%) were male. ECOG PS was 0–1 in 102 patients (47%) and ≥2 in 113 patients (53%), with complete inter-rater concordance between radiotherapist and palliative care physician. Lung cancer was the most common primary tumor (n = 68, 31%), while bone was the most frequent metastatic site (n = 106, 49%). Detailed demographic and clinical characteristics are summarized in Table 1.
The mean total ESAS score was 24.03 ± 15.28 (range: 0–80). Tiredness and pain had the highest mean NRS values (4.91 ± 3.04 and 4.76 ± 2.97, respectively), as well as the highest proportion of moderate-to-severe symptoms (≥4 in 67% and 65% of patients, respectively). Mean values and distributions for each ESAS item are reported in Table 2.
3.1. Symptom Clusters Using PCA and K-Means Clustering
PCA revealed four SCs, each of them accounting for over 10% of total variance. Taken together, the first four components explained a cumulative variance of 70%. In detail, SCPCA1 included tiredness, drowsiness, dyspnea, and malaise. SCPCA2 grouped depression and anxiety, SCPCA3 included nausea and loss of appetite, and SCPCA4 consisted solely of pain. K-means cluster analysis identified three clinically meaningful clusters: SCKMC1 (pain, tiredness, drowsiness and malaise), SCKMC2 (nausea, loss of appetite and dyspnea), and SCKMC3 (depression and anxiety) (See Table A1, Table A2 and Table A3 and Figure A1, Figure A2 and Figure A3).
3.2. Associations Between SCs and Clinical Variables
Higher scores in SCPCA1, SCPCA3, and SCPCA4, as well as membership in SCKMC1, were significantly associated with worse ECOG PS (p<0.05). Regarding the primary tumor site, a non-significant trend toward clustering was observed. Nevertheless, both SCPCA2 and SCKMC3 belonging groups showed higher proportion of patients with breast and prostate cancer if compared with non belongings (p = 0.078 for both). Interestingly, liver metastases were significantly associated with SCKMC2, while a borderline association was observed with SCPCA3 (p = 0.055). Even if statistical significance was not observed, a trend toward association was also noted between bone metastases and SCPCA4 (p = 0.074). Full results are presented in Table 3 and Table 4.
3.3. Associations with Palliative Radiotherapy
In multivariable logistic regression, SCPCA2 was significantly associated with a lower likelihood of receiving PRT (p = 0.010), whereas SCPCA1 was not significantly associated (p = 0.205). Belonging to SCKMC1 was significantly associated with a higher probability of receiving PRT (p = 0.008), while SCKMC3 was associated with a significantly lower likelihood of treatment (p = 0.034). Full model estimates, including odds ratios and confidence intervals, are reported in Table 5.
3.4. Exploratory Survival Analysis
Patients within SCKMC2 had a median OS of 3.22 months, compared to 4.63 months in those not belonging to the cluster. Furthermore, this trend toward shorter survival was also observed in the SCKMC2 group at both 25th and 75th percentiles (see Table A4 and Table A5 and Figure A4 and Figure A5). Surprisingly, patients belonging and not belonging to the SCPCA1 had a similar median OS of 4.42 and 4.45 months, respectively.
4. Discussion
PRT represents a cornerstone in the symptomatic management of patients with advanced-stage cancer. Nevertheless, estimating the net clinical benefit of PRT - balancing symptom relief against potential treatment-related toxicity - remains challenging in the absence of a structured pre-treatment symptom assessment. In this context, a thorough evaluation of the patient’s physical condition, psychological status, and prognosis is essential for making personalized treatment decisions. Over the last decade, several studies have highlighted the utility of a multidisciplinary and multidimensional approach, particularly emphasizing the collaboration between radiation oncologists and palliative care specialists in defining treatment indications and timing [21,22,23,24]. In Italy, the RaP outpatient clinic represents one of the few structured initiatives incorporating this collaborative model into routine clinical care [11].
Within this setting, we analyzed SCs with the aim of improving symptom monitoring and exploring their potential role in guiding therapeutic decisions. The PCA identified four clusters. SCPCA1, comprising tiredness, drowsiness, dyspnea, and malaise, is consistent with a systemic cluster. SCPCA2, including depression and anxiety, represents a psychological cluster. SCPCA3, composed of nausea and loss of appetite, reflects a gastrointestinal cluster. Finally, SCPCA4, defined solely by pain, suggests a distinct somatic experience not strongly correlated with other symptoms. The k-means cluster analysis identified three clinically relevant SCs: SCKMC1 (pain, tiredness, drowsiness and malaise), representing a physical burden cluster; SCKMC2 (nausea, loss of appetite and dyspnea), indicating a visceral discomfort cluster; and SCKMC3 (depression and anxiety), mirroring a psychological cluster. These findings reinforce the concept that patients with advanced cancer frequently present with interrelated symptoms rather than isolated complaints.
A consistent and clinically meaningful association emerged between ECOG PS and SCs characterized by physical symptoms. Specifically, both SCPCA1 and SCKMC1, characterized by fatigue-related and somatic symptoms, were significantly associated with worse ECOG PS. These results suggest that systemic symptom burden, especially symptoms such as tiredness, drowsiness, and malaise, is closely linked to impaired functional status in this patient population. Conversely, no significant association was observed between ECOG PS and psychological symptom clusters (SCPCA2 and SCKMC3). This indicates that, in our cohort, psychological distress did not substantially influence patients’ performance status. While psychological symptoms may compromise quality of life or emotional well-being, they appear to play a limited role in determining physical functioning, at least as assessed by ECOG. This is consistent with previous findings by Nieder et al.[25], who reported that nausea, fatigue, dry mouth, and appetite loss were significantly more prevalent in patients with poor PS. Although temporary symptom worsening post-PRT may occur in patients with poor PS, selected individuals—particularly those with dyspnea or pain—may still benefit from palliative RT. Similar results were also reported in older studies [26,27].
Although not statistically significant, we observed a consistent trend—across both PCA and KMC models—suggesting a stronger association between breast cancer as the primary tumor and psychological symptom clusters (SCPCA2 and SCKMC3). While this observation warrants cautious interpretation, it may hold clinical relevance. Hormonal dysregulation, common in breast cancer due to both disease and endocrine therapy, may increase susceptibility to psychological symptoms such as anxiety, depression, and fatigue [28,29]. Further research is needed to clarify this potential relationship.
We also identified meaningful symptom patterns according to metastatic sites. Liver metastases were significantly associated with the visceral discomfort cluster (SCKMC2), comprising nausea, loss of appetite, and dyspnea, with a borderline association observed for the gastrointestinal cluster (SCPCA3). These results align with existing literature indicating that hepatic involvement often contributes to cancer cachexia, metabolic dysfunction, anorexia, and fatigue, even before overt liver failure develops [30,31,32]. Conversely, a trend between bone metastases and the pain-specific cluster (SCPCA4), though not statistically significant, remains clinically intuitive, reflecting the well-established pathophysiology of skeletal metastases—osteolysis, nerve compression, and inflammatory mediator release [33]. These findings underscore how SCs may reflect underlying tumor biology and metastatic burden. Larger prospective studies are warranted to validate these associations.
Our findings also highlighted a potential role for SCs in influencing treatment decisions. In multivariable analysis, patients belonging to psychological clusters (i.e., SCPCA2 and SCKMC3) had a significantly lower likelihood of receiving PRT. These consistent findings across two clustering methods suggest that psychological distress may act as a negative predictor of treatment referral in patients perceived as more vulnerable, or patient hesitancy or refusal related to emotional burden, low motivation, or treatment fatigue. Conversely, SCKMC1, (physical burden cluster) characterized by tiredness, drowsiness, pain, and malaise was positively associated with the likelihood of receiving PRT. This association is likely reflective of the clinical intent to address substantial symptom burden through localized treatment, particularly when pain is present and PRT is expected to provide rapid palliation. Interestingly, SCPCA1, which shares a similar symptom composition but emerged from PCA, was not significantly associated with treatment, possibly due to differences in clustering methodology or relative symptom weighting. Taken together, these results suggest that SCs may not only reflect the patient’s current symptom burden, but also influence clinical decision-making, potentially acting as adjunctive tools to traditional prognostic factors.
When comparing our results with previous studies exploring SCs in patients referred for PRT using ESAS scores, a number of consistent patterns emerge despite methodological differences. Several authors, including Chen et al.[34], Ganesh et al.[35] and McKenzie et al.[36], have applied various statistical techniques (PCA, EFA, HCA), consistently identifying symptom pairs such as anxiety and depression, nausea and loss of appetite, and tiredness and drowsiness as strongly interrelated. These recurring associations align closely with our findings, suggesting that some symptom constellations may reflect stable and reproducible clinical phenomena rather than statistical artifacts.
Interestingly, while certain symptoms—such as nausea and loss of appetite or anxiety and depression—cluster together consistently across studies, others like pain, dyspnea, and malaise demonstrate greater variability depending on the population studied or the analytical method employed. Consequently, it is essential to note that the derivation of SC from principal component analysis should be guided by clinical reasoning, taking into account the pathophysiological and experiential interrelationships among symptoms. For symptom cluster analysis to be clinically meaningful, it must not only reflect consistent statistical associations but also provide practical utility in shaping care pathways and improving patient outcomes.
Our exploratory survival analysis showed that patients within SCKMC2 (i.e., visceral discomfort cluster) had a median OS of 3.2 months, compared to 4.6 months in those not belonging to this SC. Although, given the observational nature of the study and the relatively small sample size of the SCKMC2 belonging group, the statistical significance was not tested, the observed trend is clinically noteworthy. SCKMC2 includes loss of appetite and dyspnea—the only two clinical symptoms explicitly represented within the PaP prognostic score, a validated tool for estimating short-term survival in advanced cancer patients [37,38]. The ProPaRT study further confirmed the prognostic value of these symptoms in patients selected for PRT [39]. The alignment between SCKMC2 and this high-risk symptom profile lends biological plausibility to the observed survival trend, suggesting that symptom clustering could serve as a proxy for latent prognostic trajectories. Given the limited sample size and statistical power, this hypothesis warrants investigation in larger, prospective datasets.
This study has some limitations. Its cross-sectional design prevents assessment of symptom evolution over time or changes in SCs following PRT. Additionally, being a single-center study, the findings may not be generalizable to broader populations or different healthcare systems. While PCA and KMC are robust exploratory methods, cluster interpretation partially depends on clinical reasoning, and the absence of validation in an independent cohort limits the reproducibility of our cluster solution. Finally, although exploratory survival analysis was performed, the limited sample size and number of events precluded a statistically rigorous survival analysis, reducing the power to draw definitive prognostic conclusions.
Nevertheless, this study has several strengths. The dual use of PCA and k-means clustering strengthens the internal consistency and robustness of the identified SCs. The selection of a well-characterized patient population enhances the reliability of our findings. Importantly, our SCs demonstrate biological plausibility and mirror previously reported symptom patterns, reinforcing their clinical relevance.
In conclusion, we identified clinically meaningful SCs in patients referred for PRT using both PCA and k-means clustering, revealing consistent psychological, gastrointestinal, and physical burden patterns. SCs dominated by physical symptoms were associated with poorer ECOG PS and a higher likelihood of receiving PRT, while psychological clusters were linked to lower treatment rates. A SC characterized by dyspnea and appetite loss was also associated with shorter OS, underscoring its potential prognostic value. These findings suggest that SC analysis may enhance clinical assessment and support more personalized, timely, and appropriate care in PRT settings. Prospective validation is warranted.
Author Contributions
Conceptualization, L.A, A.R., I.M. and R.R.; methodology, L.A. and A.R.; software, A.R.; validation, L.A., A.R. and R.R.; formal analysis, A.R.; investigation, R.R., L.T., M.P. and V.V.; data curation, R.R., L.A. and A.R.; writing—original draft preparation, L.A., A.R. and R.R.; writing—review and editing, all authors.; visualization, all authors; supervision, R.R.; project administration, L.A. All authors have read and agreed to the published version of the manuscript.
Funding
This work was partly supported thanks to the contribution of Ricerca Corrente by the Italian Ministry of Health.
AI Tool Use Statement
The authors used ChatGPT (OpenAI) to assist with language editing and stylistic improvement during manuscript preparation. All content was reviewed and validated by the authors.
Institutional Review Board Statement
The study was conducted in accordance with the Declaration of Helsinki.
Informed Consent Statement
Patient consent was waived due to the retrospective nature of this secondary analysis and the use of fully anonymized data.
Data Availability Statement
The raw data supporting the conclusions of this article will be made available by the authors on request.
Acknowledgments
The authors have no acknowledgments to declare.
Conflicts of Interest
The authors declare no conflicts of interest.
Abbreviations
The following abbreviations are used in this manuscript:
| PRT | Palliative Radiotherapy |
| SC | Symptom Clusters |
| RaP | Radiotherapy and Palliative Care |
| ESAS | Edmonton Symptom Assessment System |
| PCA | Principal Component Analysis |
| KMC | K-Means Clustering |
| ECOG PS | Eastern Cooperative Oncology Group Performance Status |
| NRS | Numerical Rating Scale |
| AIC | Akaike Information Criterion |
| OR | Odds Ratios |
| CI | Confidence Intervals |
| OS | Overall Survival |
| No. | Number |
| n. | Number |
| SD | Standard Deviation |
| P | P value |
| SE | Standard Error |
Appendix A

Table A1.
Eigenvalues and proportions of variance for components from the PCA.
| PCA | Eigenvalue | Proportion | Cumulative |
| 1 | 3,201748 | 0,3557 | 0,3557 |
| 2 | 1,128046 | 0,1253 | 0,4811 |
| 3 | 0,977049 | 0,1086 | 0,5896 |
| 4 | 0,949627 | 0,1055 | 0,6952 |
| 5 | 0,794355 | 0,0883 | 0,7834 |
| 6 | 0,648179 | 0,0720 | 0,8554 |
| 7 | 0,483856 | 0,0538 | 0,9092 |
| 8 | 0,452139 | 0,0502 | 0,9594 |
| 9 | 0,365001 | 0,0406 | 1,0000 |
Table A2.
Loading factors from the PCA.
| Symptom | Component 1 | Component 2 | Component 3 | Component 4 |
| Pain | 0,189301 | 0,205798 | 0,170293 | 0,796603 |
| Tiredeness | 0,762965 | 0,224414 | 0,22392 | 0,083604 |
| Nausea | 0,147157 | 0,368723 | 0,733906 | -0,08928 |
| Depression | 0,127723 | 0,856198 | 0,064731 | 0,174531 |
| Anxiety | 0,205678 | 0,827394 | 0,145361 | 0,010091 |
| Drowsiness | 0,734788 | -0,04932 | 0,041778 | 0,349109 |
| Loss of appetite | 0,166618 | -0,04658 | 0,869242 | 0,214205 |
| Malaise | 0,660036 | 0,289289 | 0,078702 | -0,01671 |
| Dyspnea | 0,538887 | 0,107873 | 0,279936 | -0,43031 |
Figure A1.
Biplots among components 1 to 4 from the PCA.
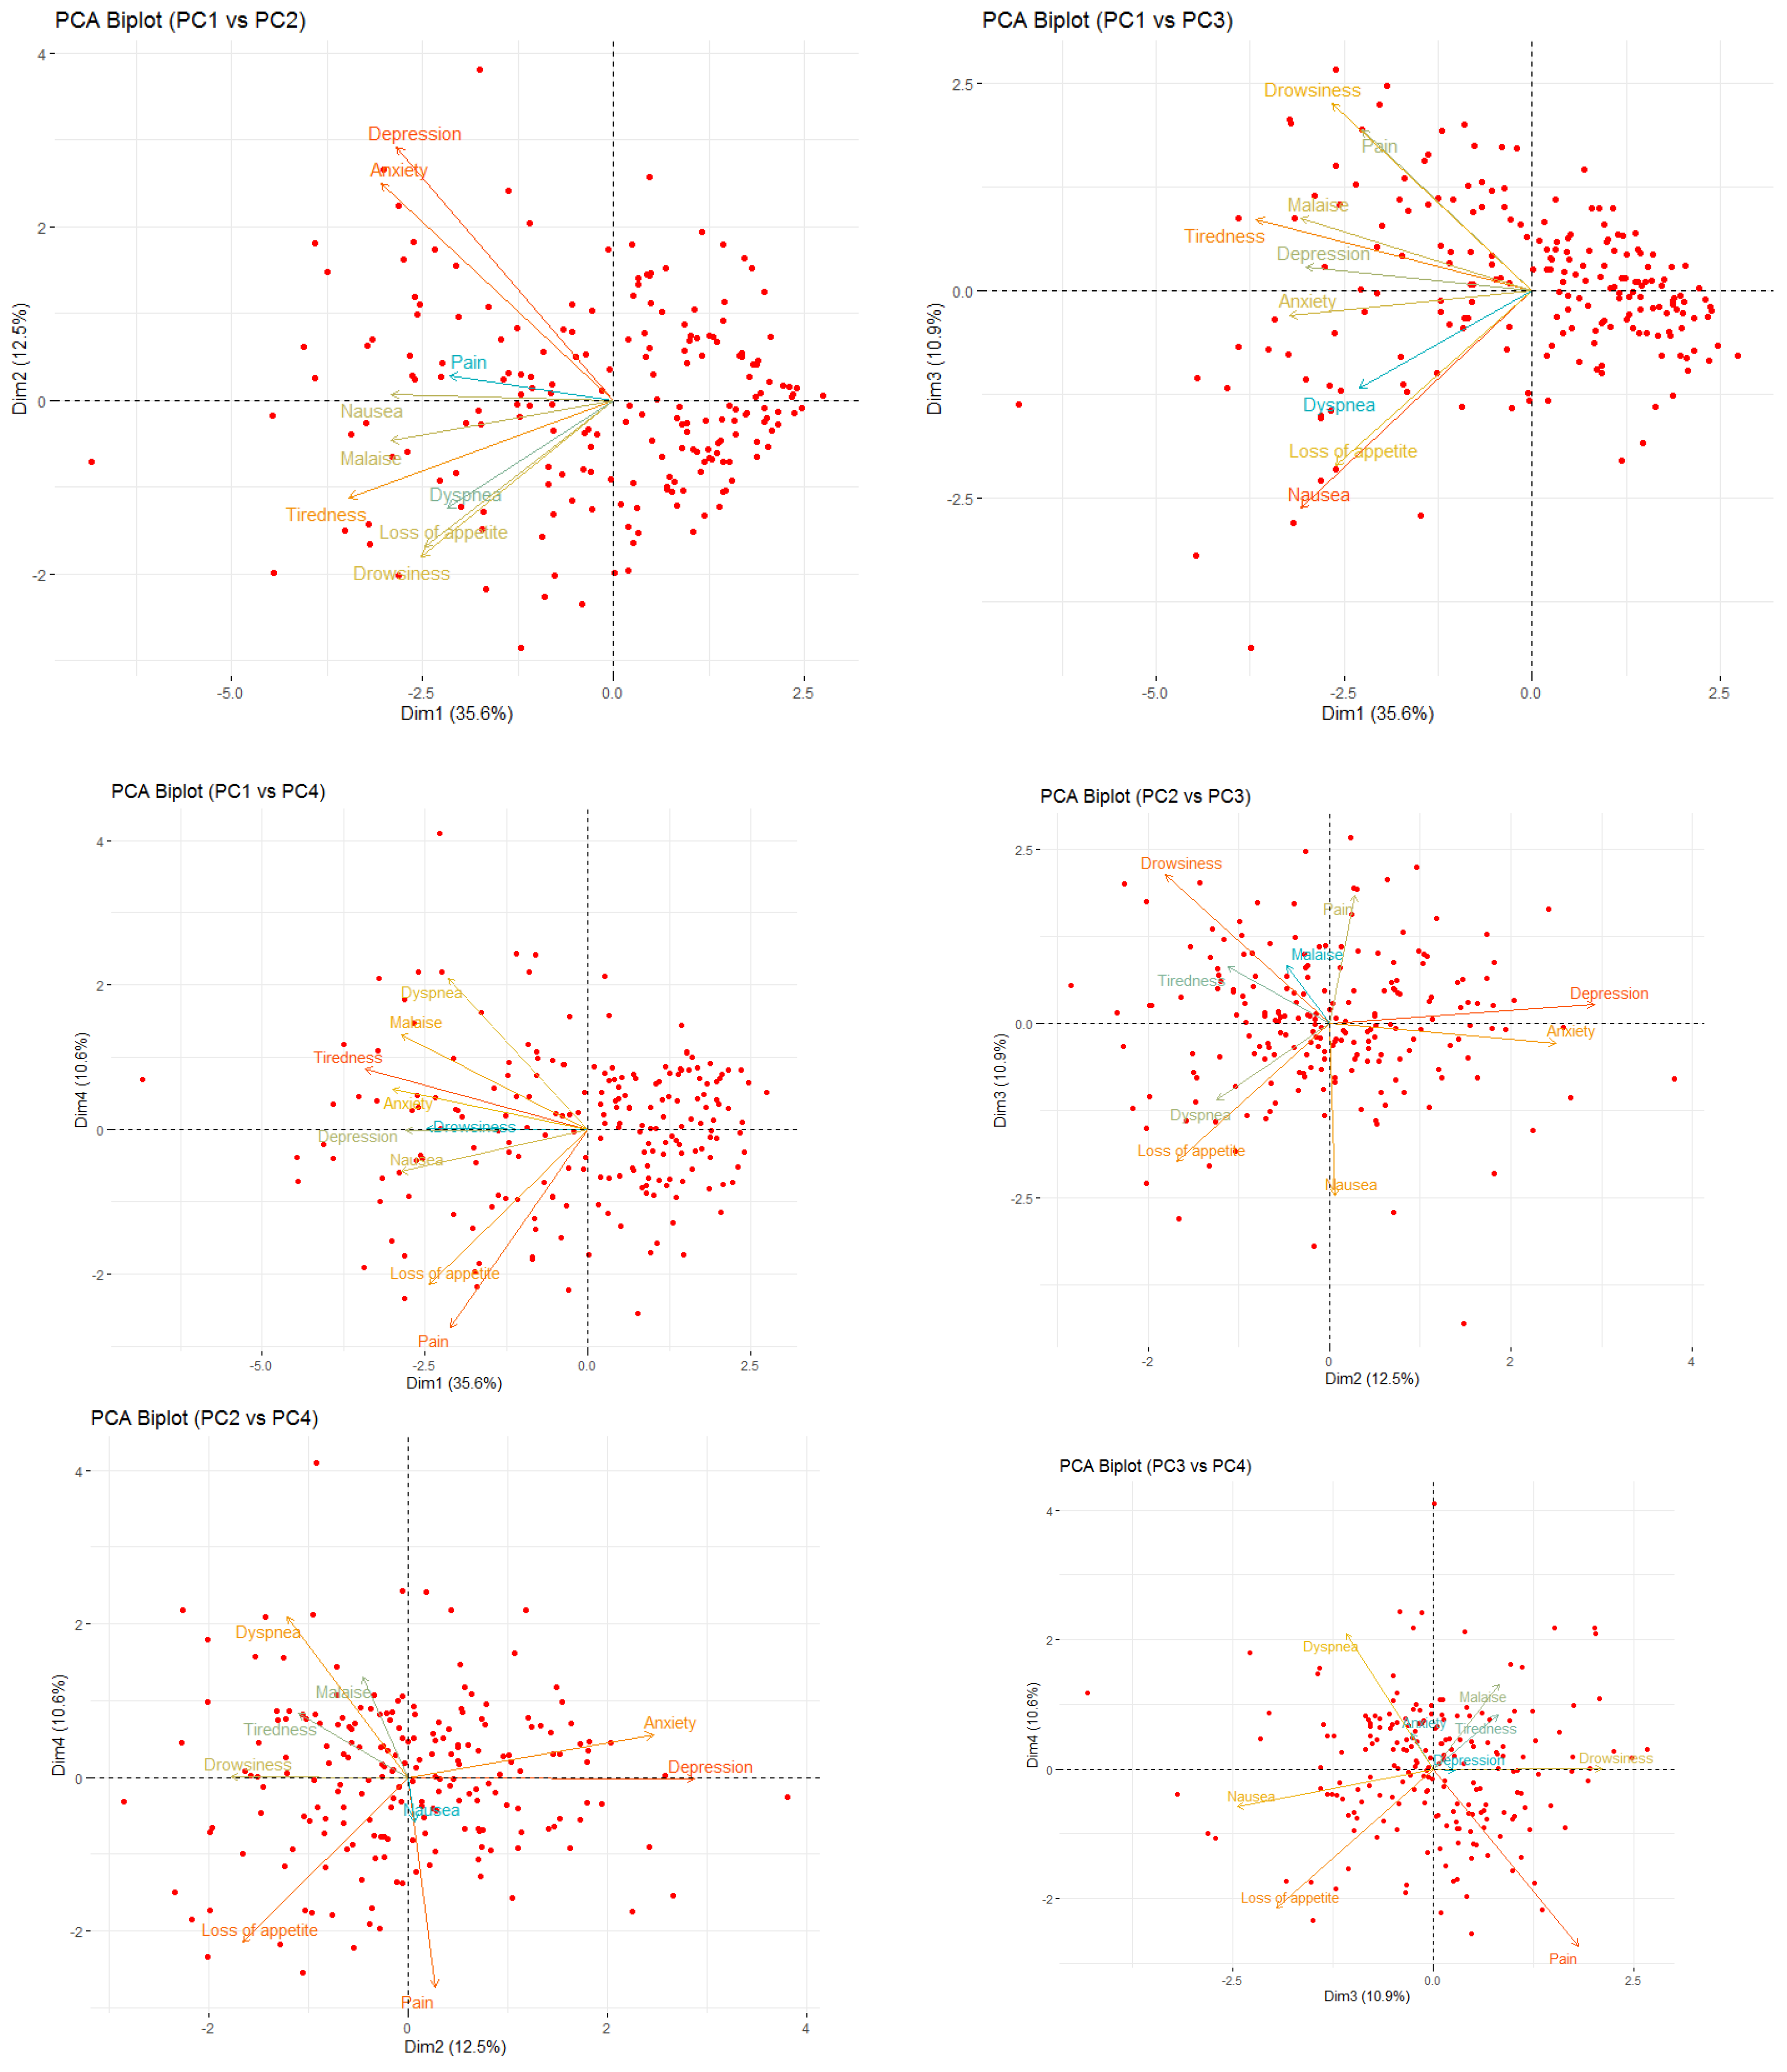
Figure A2.
Optimal number of clusters determination: Elbow method, Silhouette method and Gap Statistic.
Figure A2.
Optimal number of clusters determination: Elbow method, Silhouette method and Gap Statistic.
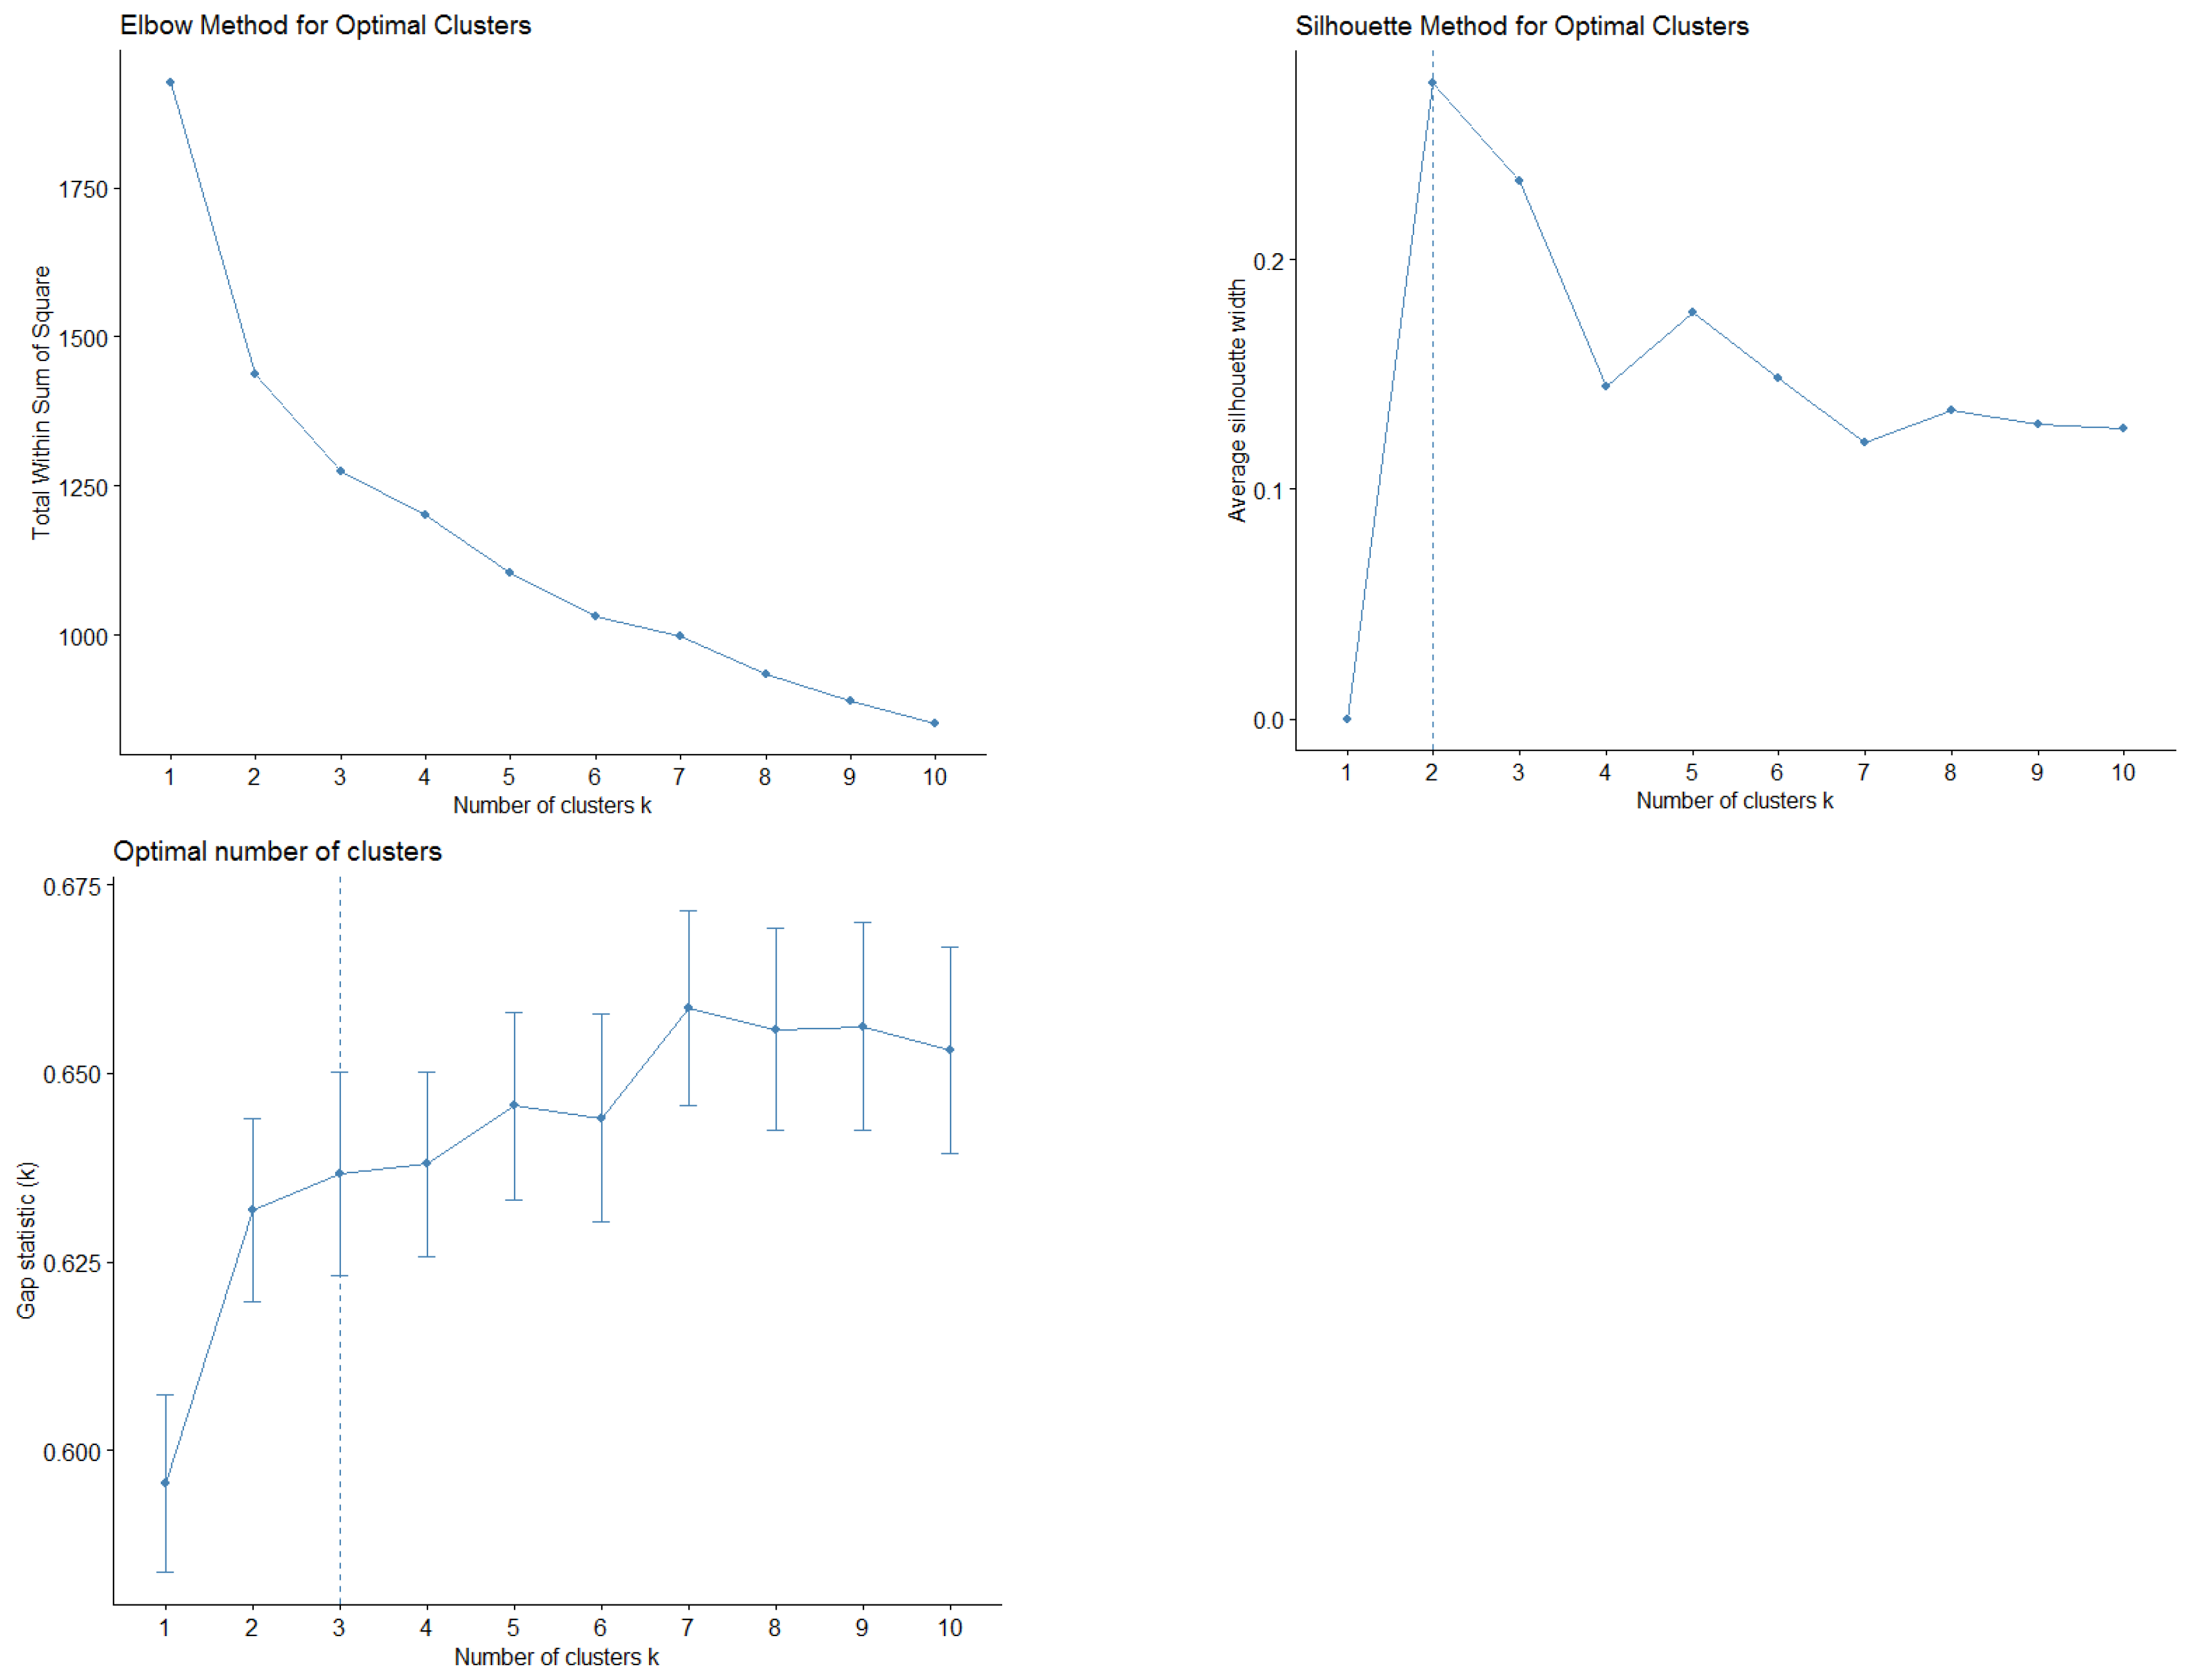
Table A3.
Loading factors from the PCA.
| R2 Own Cluster | R2 Next Cluster | Separation Metric | ||
| Cluster 1 | Pain | 0,146 | 0,146 | 1,000 |
| Malaise | 0,267 | 0,259 | 0,990 | |
| Tiredness | 0,489 | 0,261 | 0,691 | |
| Drowsiness | 0,376 | 0,360 | 0,974 | |
| Cluster 2 | Nausea | 0,724 | 0,026 | 0,284 |
| Loss of appetite | 0,310 | 0,209 | 0,871 | |
| Dyspnea | 0,149 | 0,044 | 0,890 | |
| Cluster 3 | Depression | 0,243 | 0,060 | 0,805 |
| Anxiety | 0,342 | 0,250 | 0,877 |
Figure A3.
Combined cluster visualization and PCA biplots.
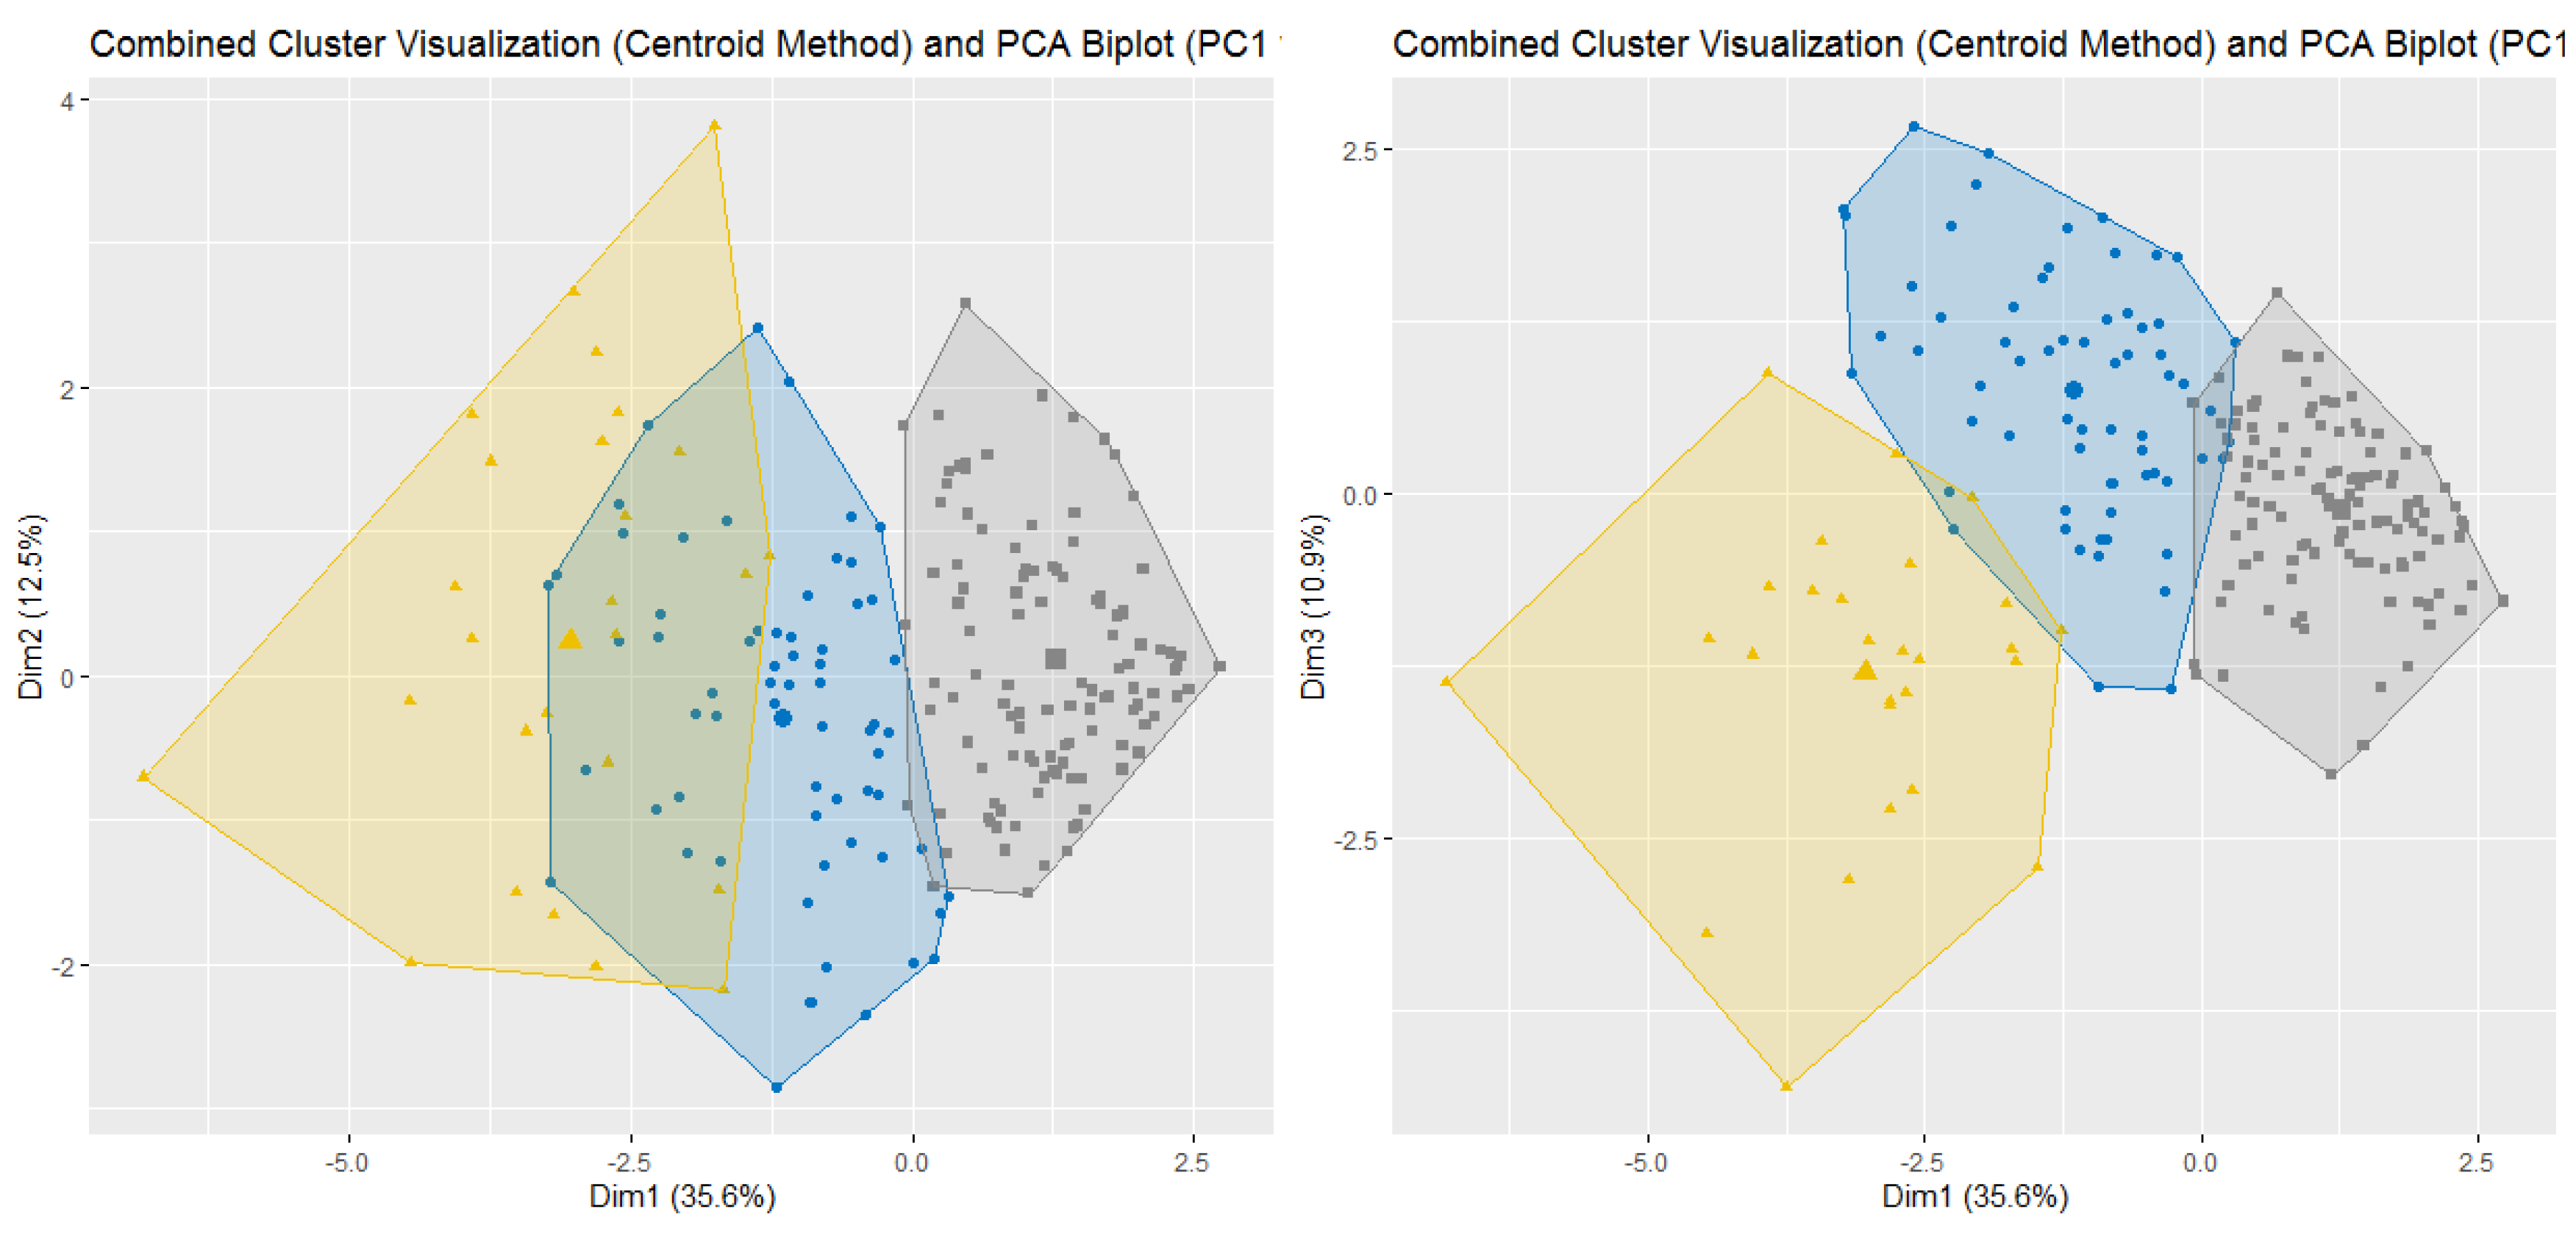
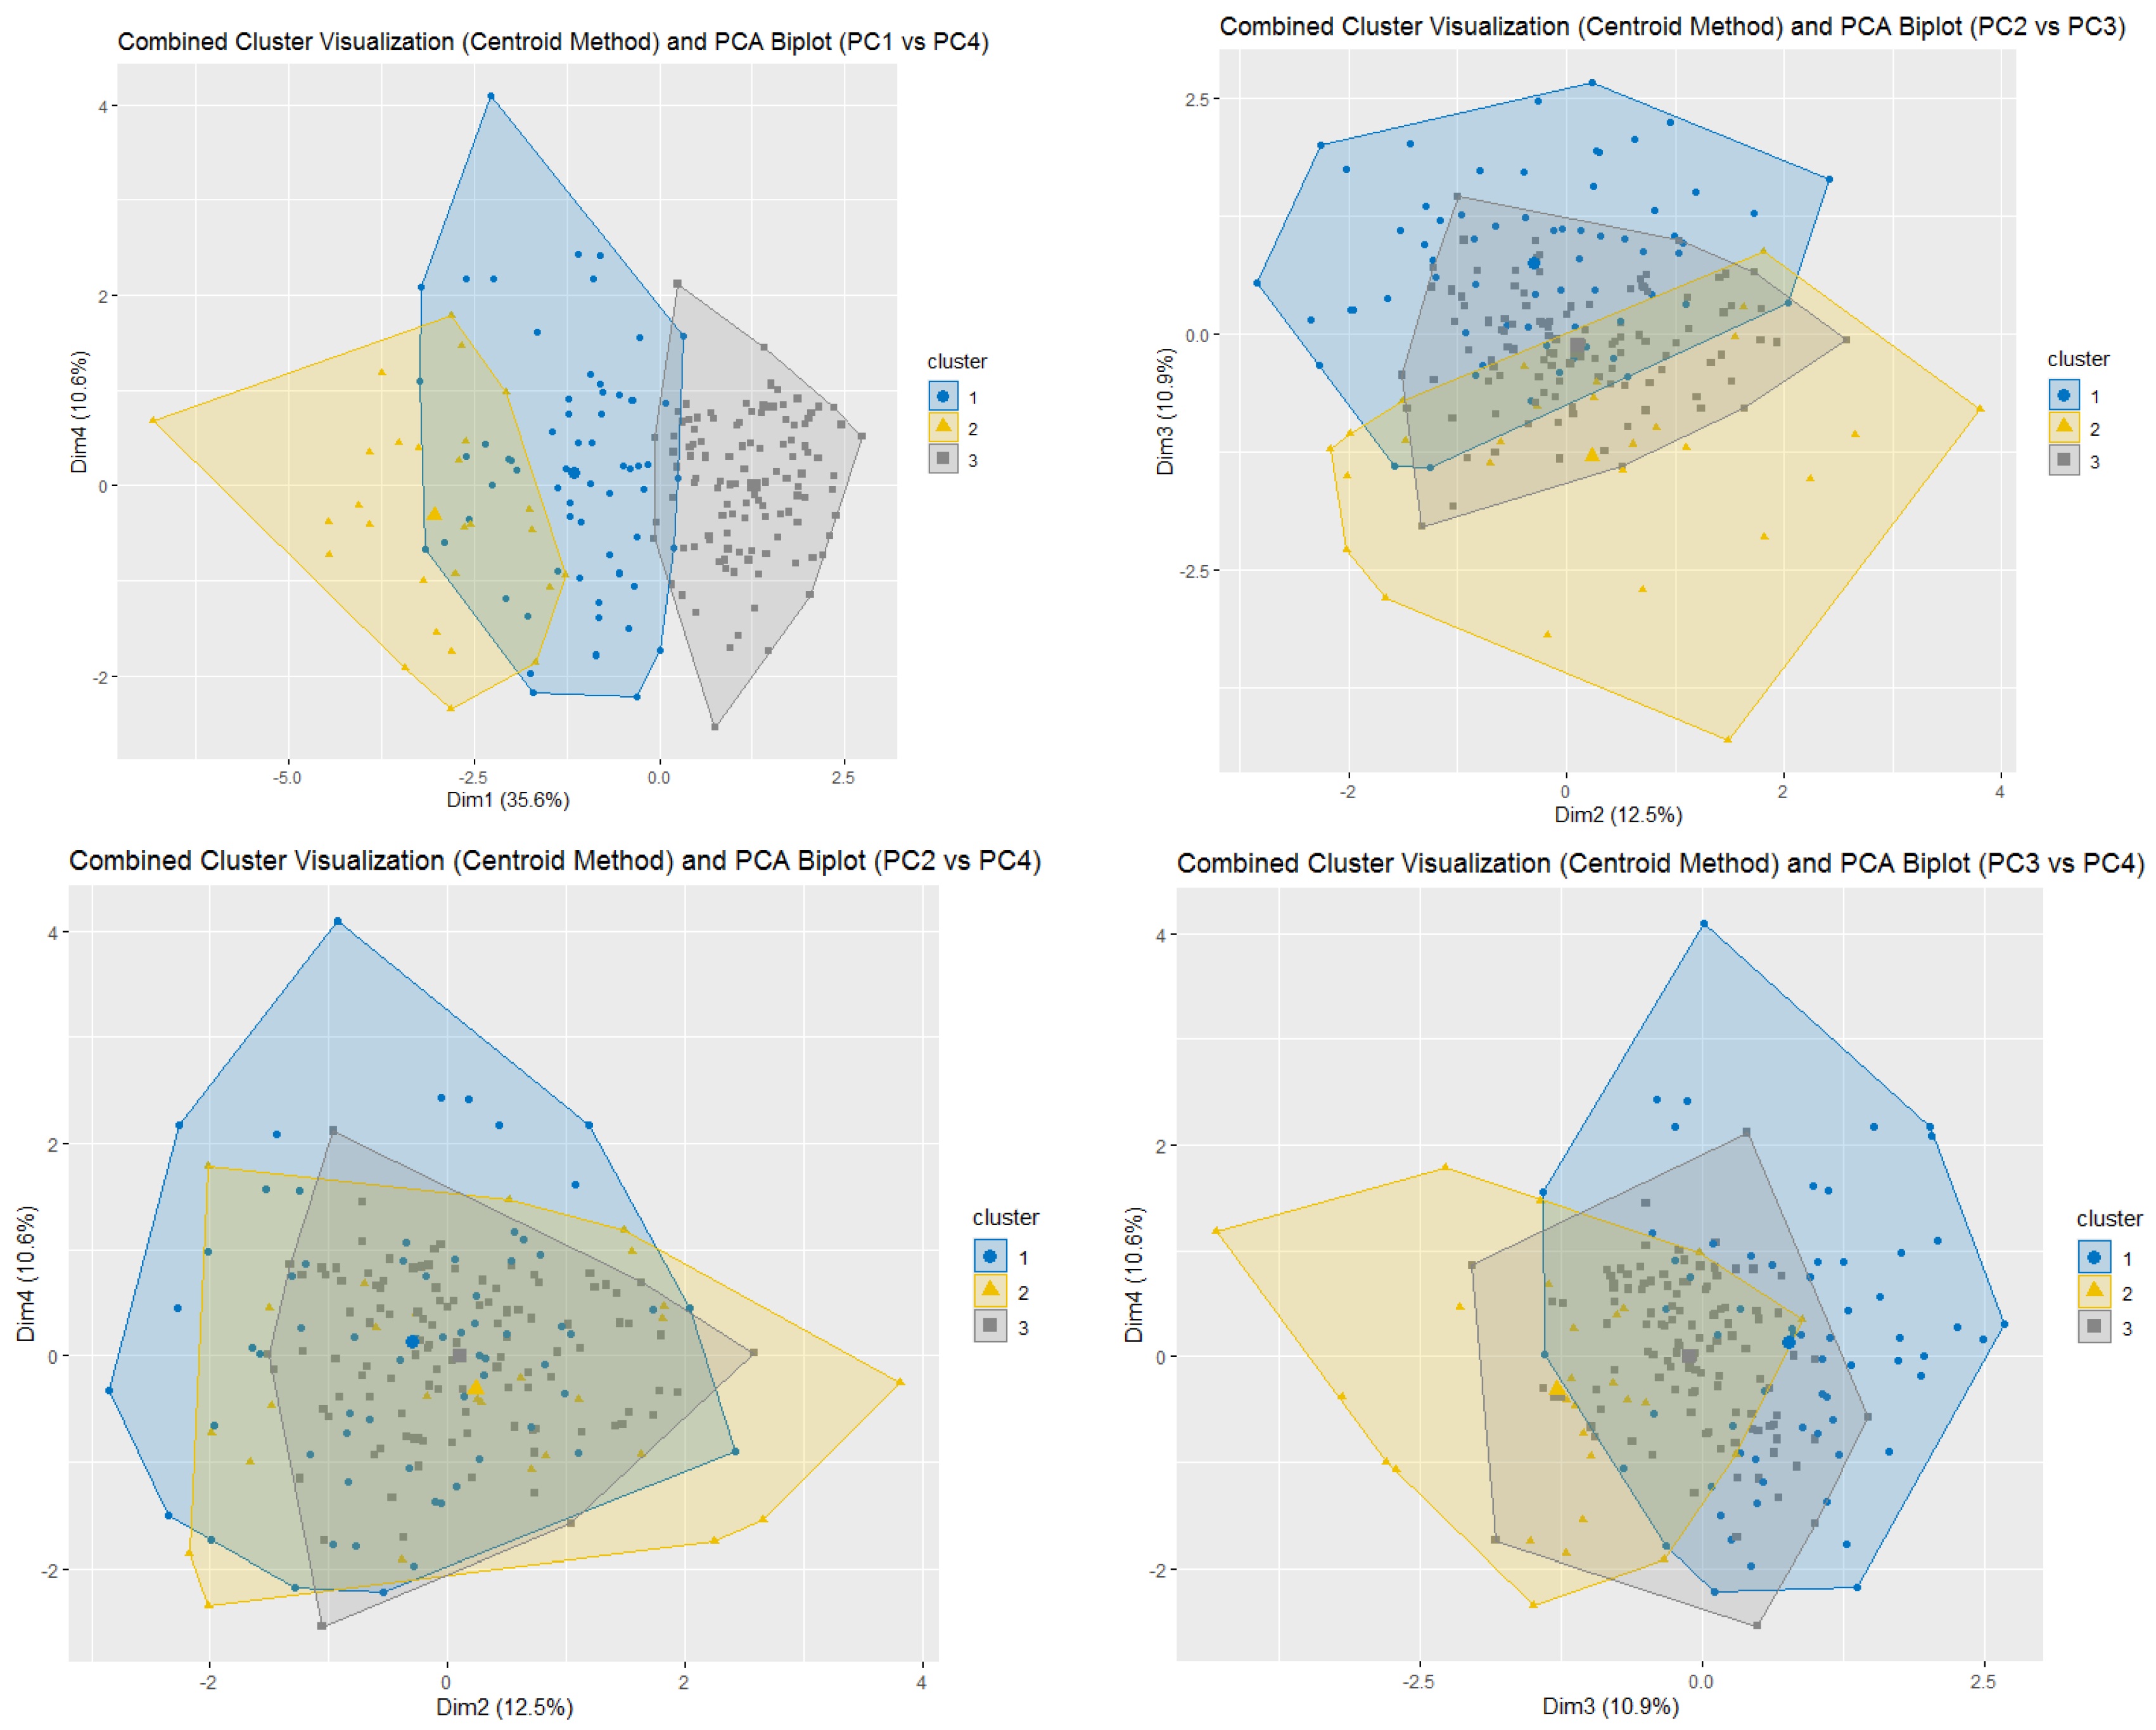
Figure A4.
Survival analysis since the first REP ambulatory access by PCA symptoms cluster.
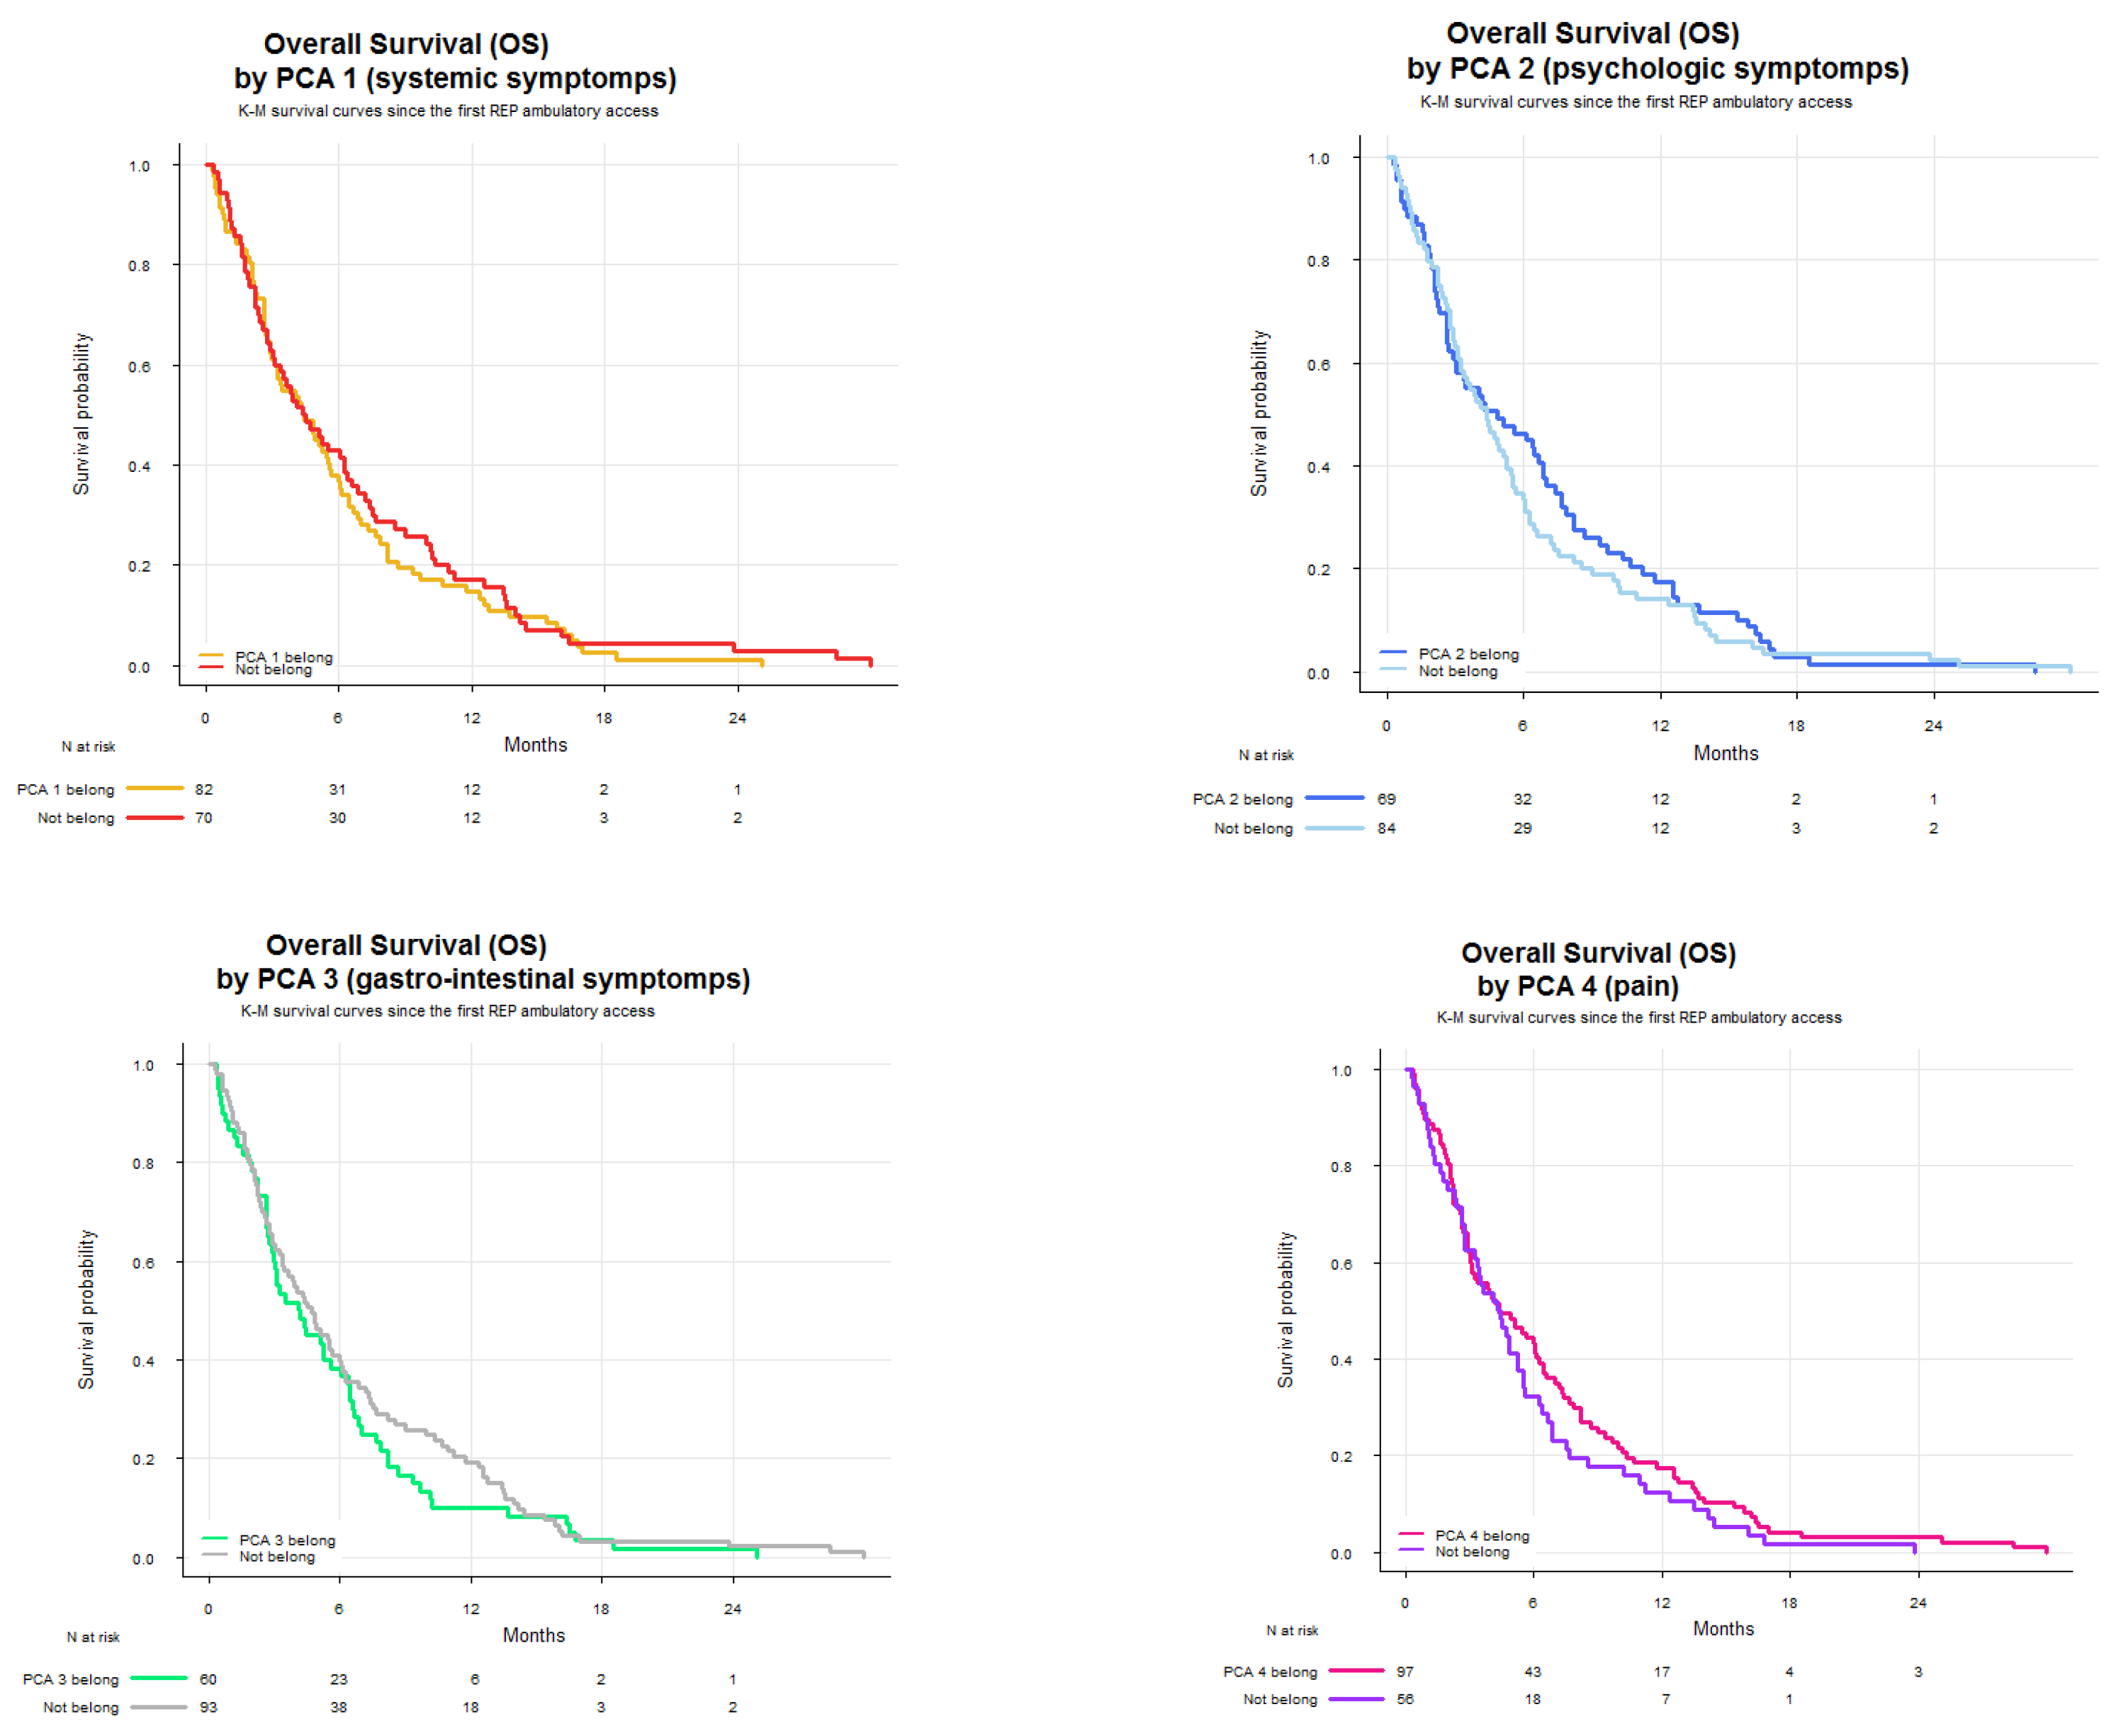
Table A4.
Summary statistics of OS since the first REP ambulatory access by PCA symptoms cluster.
| Median OS (months) | OS IQR (25p-75p) | |
| PCA 1 belong | 4.42 | 2.27 – 7.89 |
| PCA 1 not belong | 4.45 | 2.23 – 9.92 |
| Median OS (months) | OS IQR (25p-75p) | |
| PCA 2 belong | 4.86 | 2.14 – 9.36 |
| PCA 2 not belong | 4.39 | 2.33 – 7.24 |
| Median OS (months) | OS IQR (25p-75p) | |
| PCA 3 belong | 4.14 | 2.25 – 7.33 |
| PCA 3 not belong | 4.73 | 2.23 – 9.92 |
| Median OS (months) | OS IQR (25p-75p) | |
| PCA 4 belong | 4.40 | 2.23 – 9.00 |
| PCA 4 not belong | 4.37 | 2.14 – 6.87 |
Figure A5.
Survival analysis since the first REP ambulatory access by KMC symptoms cluster.
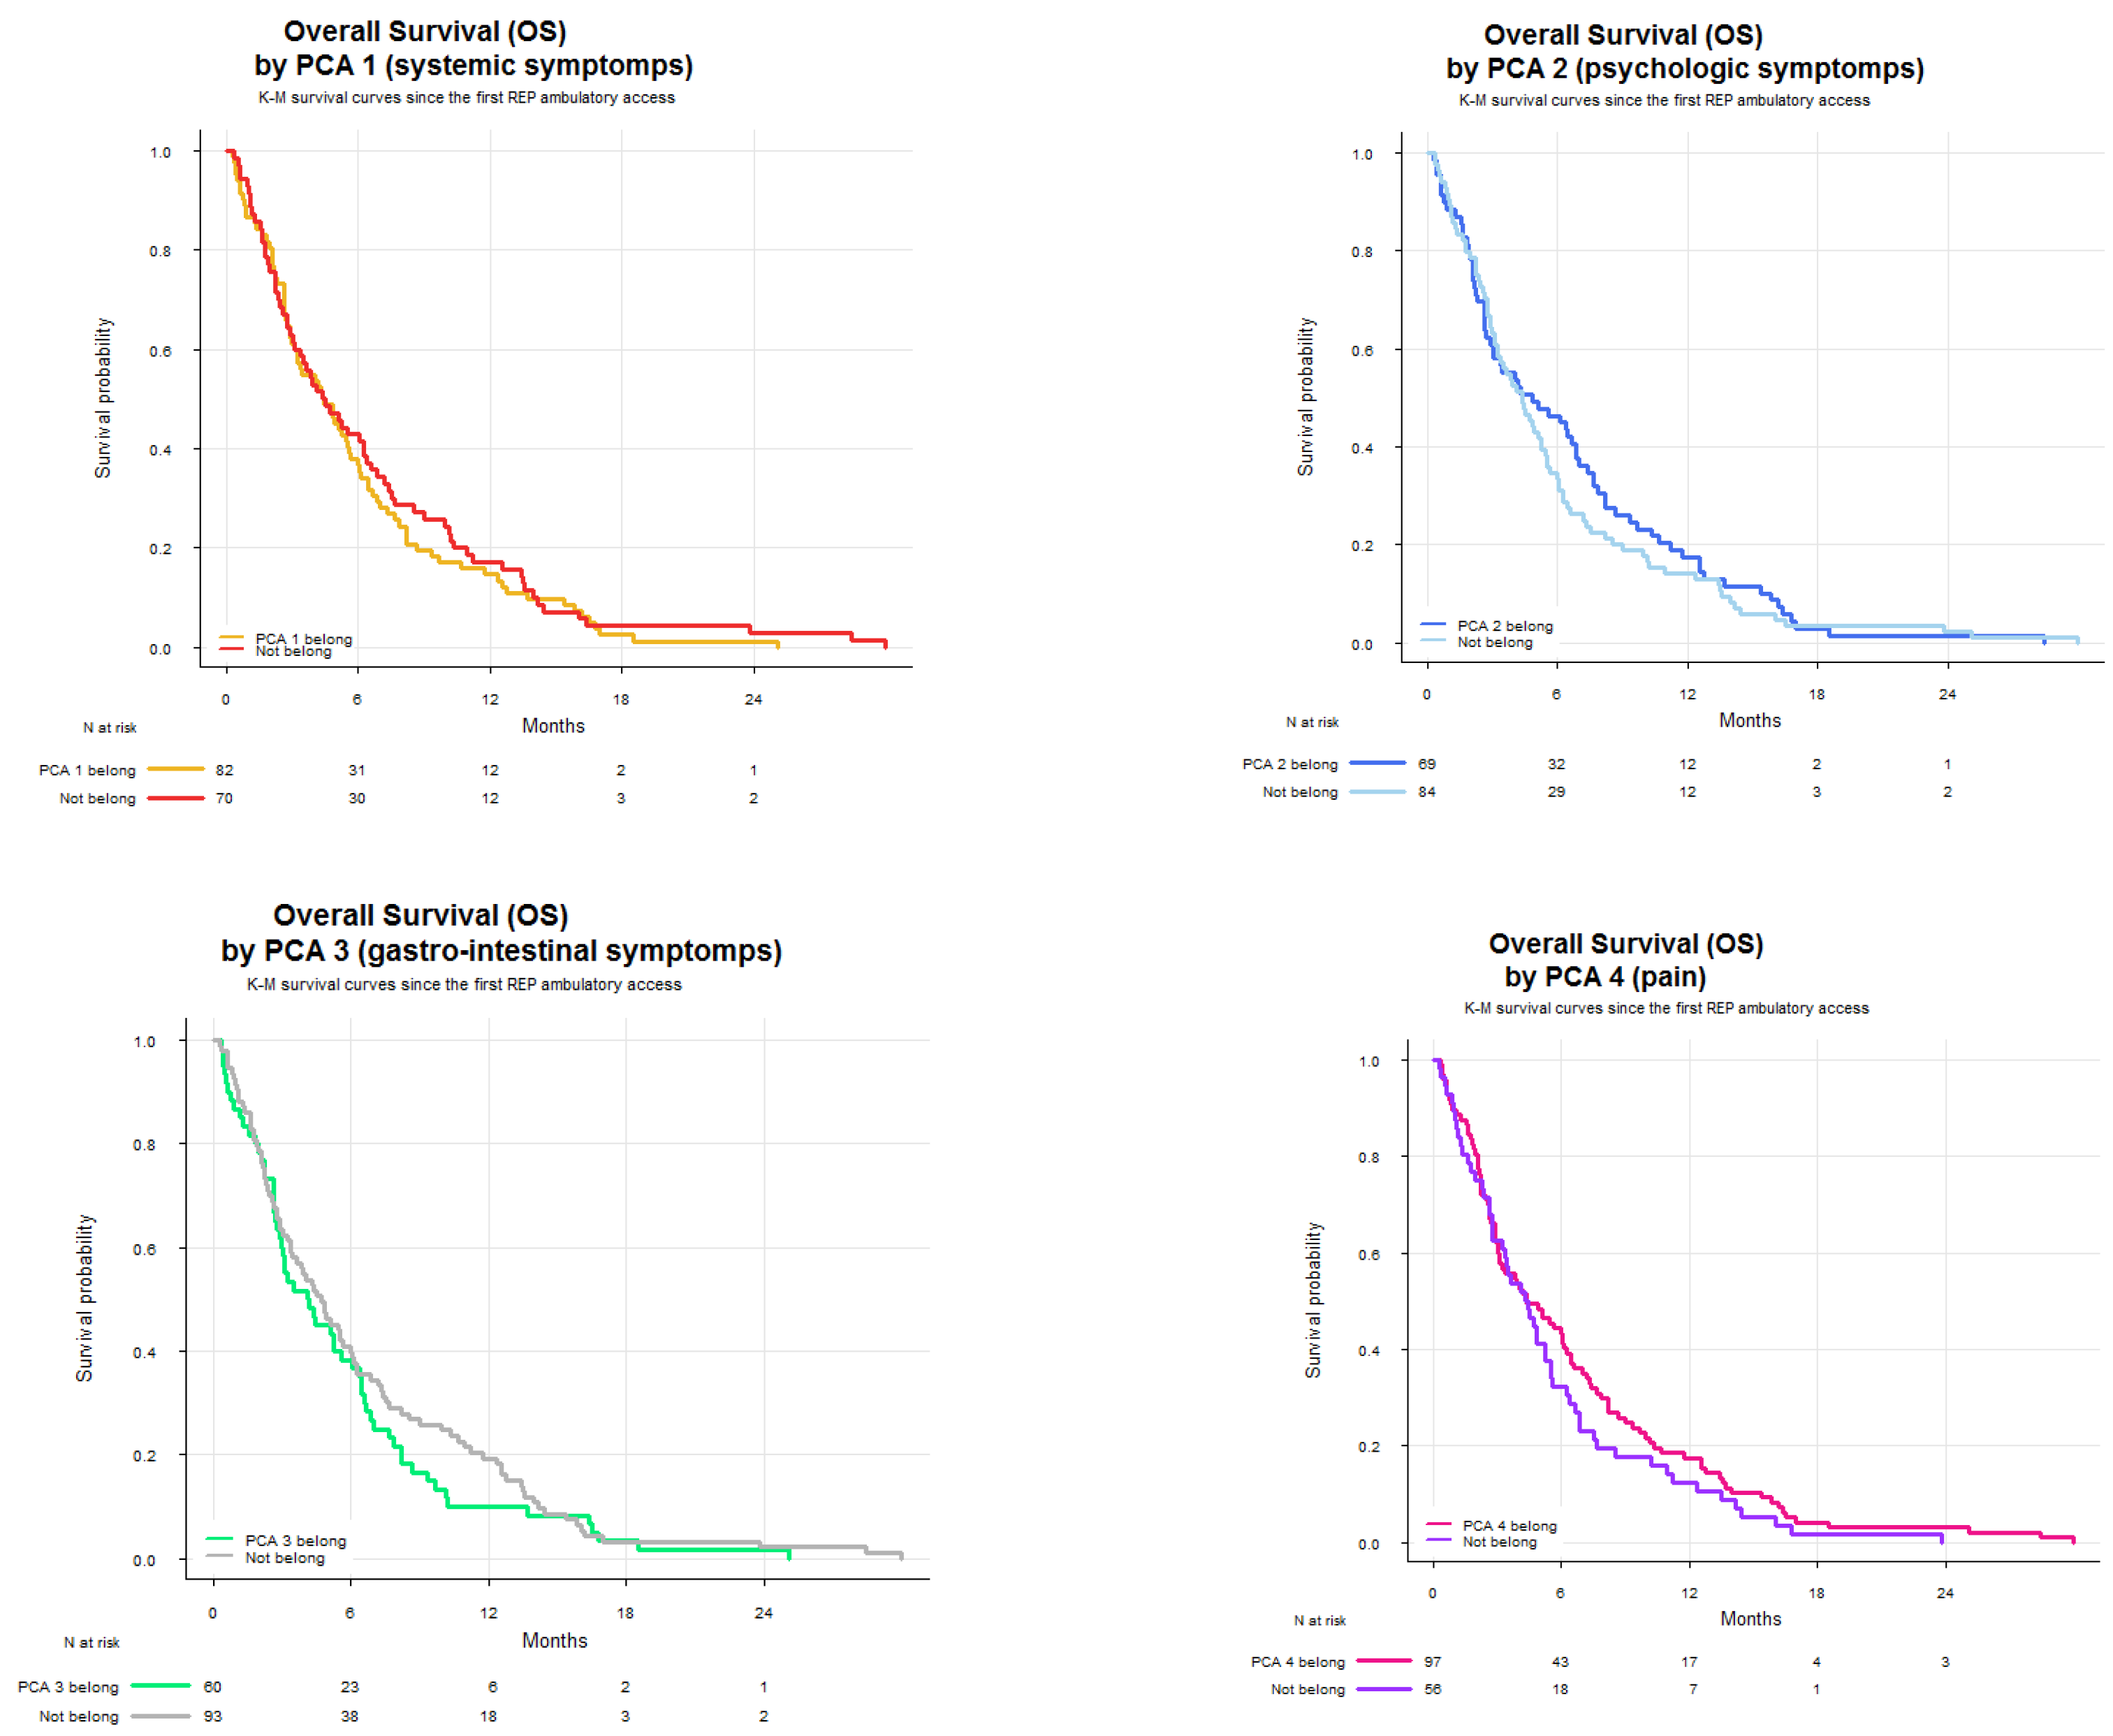
Table A5.
Summary statistics of OS since the first REP ambulatory access by KMC symptoms cluster.
| Median OS (months) | OS IQR (25p-75p) | |
| KMC 1 belong | 4.40 | 2.27 – 8.18 |
| KMC 1 not belong | 4.53 | 1.74 – 10.21 |
| Median OS (months) | OS IQR (25p-75p) | |
| KMC 2 belong | 3.22 | 0.89 – 6.87 |
| KMC 2 not belong | 4.63 | 2.27 – 8.51 |
| Median OS (months) | OS IQR (25p-75p) | |
| KMC 3 belong | 4.86 | 2.14 – 9.36 |
| KMC 3 not belong | 4.39 | 2.33 – 7.24 |
References
- Guhlich, M.; Verschuren, P.; Oldenburger, E. Palliative radiotherapy for the hemostasis of bleeding tumors: An overview of the most recent literature. Curr. Opin. Support. Palliat. Care 2025, 19, 33–40. [Google Scholar] [CrossRef]
- Ito, K.; Nakamura, N. Palliative stereotactic body radiotherapy for spinal and non-spinal bone metastases: Combining tradition and innovation. Int. J. Clin. Oncol. 2025. [CrossRef]
- Zaki, P.; Barbour, A.; Zaki, M.M.; Tseng, Y.D.; Amin, A.G.; Venur, V.; McGranahan, T.; Vellayappan, B.; Palmer, J.D.; Chao, S.T.; et al. Emergent radiotherapy for spinal cord compression/impingement: A narrative review. Ann. Palliat. Med. 2023, 12, 1447–1462. [Google Scholar] [CrossRef]
- Henson, L.A.; Maddocks, M.; Evans, C.; Davidson, M.; Hicks, S.; Higginson, I.J. Palliative care and the management of common distressing symptoms in advanced cancer: Pain, breathlessness, nausea and vomiting, and fatigue. J. Clin. Oncol. 2020, 38, 905–914. [Google Scholar] [CrossRef]
- He, Y.; Pang, Y.; Su, Z.; Zhou, Y.; Wang, Y.; Lu, Y.; Jiang, Y.; Han, X.; Song, L.; Wang, L.; et al. Symptom burden, psychological distress, and symptom management status in hospitalized patients with advanced cancer: A multicenter study in China. ESMO Open 2022, 7, 100595. [Google Scholar] [CrossRef] [PubMed]
- Dong, S.T.; Butow, P.N.; Tong, A.; Agar, M.; Boyle, F.; Forster, B.C.; Stockler, M.; Lovell, M.R. Patients’ experiences and perspectives of multiple concurrent symptoms in advanced cancer: A semi-structured interview study. Support. Care Cancer 2016, 24, 1373–1386. [Google Scholar] [CrossRef]
- Nipp, R.D.; El-Jawahri, A.; Moran, S.M.; D’Arpino, S.M.; Johnson, P.C.; Lage, D.E.; Wong, R.L.; Pirl, W.F.; Traeger, L.; Lennes, I.T.; et al. The relationship between physical and psychological symptoms and health care utilization in hospitalized patients with advanced cancer. Cancer 2017, 123, 4720–4727. [Google Scholar] [CrossRef]
- Koyama, N.; Matsumura, C.; Tahara, Y.; et al. Symptom clusters and their influence on prognosis using EORTC QLQ-C15-PAL scores in terminally ill patients with cancer. Support. Care Cancer 2022, 30, 135–143. [Google Scholar] [CrossRef] [PubMed]
- Scirocco, E.; Cellini, F.; Donati, C.M.; Capuccini, J.; Rossi, R.; Buwenge, M.; Montanari, L.; Maltoni, M.; Morganti, A.G. Improving the integration between palliative radiotherapy and supportive care: A narrative review. Curr. Oncol. 2022, 29, 7932–7942. [Google Scholar] [CrossRef] [PubMed]
- Cilla, S.; Rossi, R.; Donati, C.M.; Habberstad, R.; Klepstad, P.; Dall’Agata, M.; Valenti, V.; Kaasa, S.; Medici, F.; Morganti, A.G.; et al. Pain management adequacy in patients with bone metastases: A secondary analysis from the palliative radiotherapy and inflammation study trial. Clin. Med. Insights Oncol. 2025, 19, 11795549241297054. [Google Scholar] [CrossRef]
- Rossi, R.; Foca, F.; Tontini, L.; Pieri, M.; Micheletti, S.; Nanni, O.; Altini, M.; Massa, I.; Pallotti, M.C.; Ricci, M.; et al. Radiotherapy and palliative care outpatient clinic: A new healthcare integrated model in Italy. Support. Care Cancer 2023, 31, 174. [Google Scholar] [CrossRef]
- Dodd, M.; Janson, S.; Facione, N.; Faucett, J.; Froelicher, E.S.; Humphreys, J.; Lee, K.; Miaskowski, C.; Puntillo, K.; Rankin, S.; et al. Advancing the science of symptom management. J. Adv. Nurs. 2001, 33, 668–676. [Google Scholar] [CrossRef] [PubMed]
- Dodd, M.J.; Miaskowski, C.; Lee, K.A. Occurrence of symptom clusters. J. Natl. Cancer Inst. Monogr. 2004, 32, 76–78. [Google Scholar] [CrossRef]
- Dong, S.T.; Butow, P.N.; Costa, D.S.; Lovell, M.R.; Agar, M. Symptom clusters in patients with advanced cancer: A systematic review of observational studies. J. Pain Symptom Manage. 2014, 48, 411–450. [Google Scholar] [CrossRef]
- Kim, H.J.; McGuire, D.B.; Tulman, L.; Barsevick, A.M. Symptom clusters: Concept analysis and clinical implications for cancer nursing. Cancer Nurs. 2005, 28, 270–282. [Google Scholar] [CrossRef]
- Fan, G.; Hadi, S.; Chow, E. Symptom clusters in patients with advanced-stage cancer referred for palliative radiation therapy in an outpatient setting. Support. Cancer Ther. 2006, 3, 157–162. [Google Scholar] [CrossRef] [PubMed]
- Nieder, C.; Haukland, E.C.; Mannsåker, B.; Dalhaug, A. Palliative appropriateness criteria: External validation of a new method to evaluate the suitability of palliative radiotherapy fractionation. Strahlenther. Onkol. 2023, 199, 278–283. [Google Scholar] [CrossRef] [PubMed]
- Ganesh, V.; Zhang, L.; Chan, S.; Wan, B.A.; Drost, L.; Tsao, M.; Danjoux, C.; Barnes, E.; McDonald, R.; Rowbottom, L.; et al. An update in symptom clusters using the Edmonton Symptom Assessment System in a palliative radiotherapy clinic. Support. Care Cancer 2017, 25, 3321–3327. [Google Scholar] [CrossRef]
- Bruera, E.; Kuehn, N.; Miller, M.J.; Selmser, P.; Macmillan, K. The Edmonton Symptom Assessment System (ESAS): A simple method for the assessment of palliative care patients. J. Palliat. Care 1991, 7, 6–9. [Google Scholar] [CrossRef]
- Ripamonti, C.; Leporati, R.; De Feo, G.; Di Pede, P.; Toffolatti, L.; Guglielmo, M.; La Carpia, D.; Miccinesi, G.; Chiesi, F. Italian version of the Edmonton Symptom Assessment System (ESAS)-Total Care (TC): Development and psychometric validation in patients undergoing cancer treatment or follow-up. Support. Care Cancer 2022, 30, 1923–1933. [Google Scholar] [CrossRef]
- Dennis, K.; Linden, K.; Balboni, T.; Chow, E. Rapid access palliative radiation therapy programs: An efficient model of care. Future Oncol. 2015, 11, 2417–2426. [Google Scholar] [CrossRef] [PubMed]
- Lefresne, S.; Berthelet, E.; Cashman, R.; Levy, K.; Liu, M.; Carolan, H.; McKenzie, M.; Kostuik, P.; Olson, R. The Vancouver rapid access clinic for palliative lung radiation, providing more than just rapid access. Support. Care Cancer 2015, 23, 125–132. [Google Scholar] [CrossRef] [PubMed]
- Pituskin, E.; Fairchild, A.; Dutka, J.; Gagnon, L.; Driga, A.; Tachynski, P.; Borschneck, J.A.; Ghosh, S. Multidisciplinary team contributions within a dedicated outpatient palliative radiotherapy clinic: A prospective descriptive study. Int. J. Radiat. Oncol. Biol. Phys. 2010, 78, 527–532. [Google Scholar] [CrossRef]
- Fairchild, A.; Hill, J.; Alhumaid, M.; Rau, A.; Ghosh, S.; Le, A.; Watanabe, S.M. Palliative radiotherapy delivery by a dedicated multidisciplinary team facilitates early integration of palliative care: A secondary analysis of routinely collected health data. J. Med. Imaging Radiat. Sci. 2022, 53, S51–S55. [Google Scholar] [CrossRef]
- Nieder, C.; Kämpe, T.A. Symptom burden in patients with reduced performance status at the start of palliative radiotherapy. In Vivo 2020, 34, 735–738. [Google Scholar] [CrossRef]
- Bradley, N.; Davis, L.; Chow, E. Symptom distress in patients attending an outpatient palliative radiotherapy clinic. J. Pain Symptom Manage. 2005, 30, 123–131. [Google Scholar] [CrossRef]
- Lien, K.; Zeng, L.; Zhang, L.; Nguyen, J.; Di Giovanni, J.; Popovic, M.; Jamani, R.; Cramarossa, G.; Culleton, S.; Chow, E. Predictive factors for well-being in advanced cancer patients referred for palliative radiotherapy. Clin. Oncol. (R. Coll. Radiol.) 2012, 24, 443–451. [Google Scholar] [CrossRef] [PubMed]
- Li, H.; Marsland, A.L.; Conley, Y.P.; Sereika, S.M.; Bender, C.M. Genes involved in the HPA axis and the symptom cluster of fatigue, depressive symptoms, and anxiety in women with breast cancer during 18 months of adjuvant therapy. Biol. Res. Nurs. 2020, 22, 277–286. [Google Scholar] [CrossRef]
- Mészáros Crow, E.; López-Gigosos, R.; Mariscal-López, E.; Agredano-Sánchez, M.; García-Casares, N.; Mariscal, A.; Gutiérrez-Bedmar, M. Psychosocial interventions reduce cortisol in breast cancer patients: Systematic review and meta-analysis. Front. Psychol. 2023, 14, 1148805. [Google Scholar] [CrossRef]
- Rosa-Caldwell, M.E.; Brown, J.L.; Lee, D.E.; Wiggs, M.P.; Perry, R.A., Jr.; Haynie, W.S.; Caldwell, A.R.; Washington, T.A.; Lo, W.J.; Greene, N.P. Hepatic alterations during the development and progression of cancer cachexia. Appl. Physiol. Nutr. Metab. 2020, 45, 500–512. [Google Scholar] [CrossRef]
- Siddiqui, J.A.; Pothuraju, R.; Jain, M.; Batra, S.K.; Nasser, M.W. Advances in cancer cachexia: Intersection between affected organs, mediators, and pharmacological interventions. Biochim. Biophys. Acta Rev. Cancer 2020, 1873, 188359. [Google Scholar] [CrossRef]
- Gonçalves, D.C.; Gomes, S.P.; Seelaender, M. Metabolic, inflammatory, and molecular impact of cancer cachexia on the liver. Int. J. Mol. Sci. 2024, 25, 11945. [Google Scholar] [CrossRef]
- Knapp, B.J.; Devarakonda, S.; Govindan, R. Bone metastases in non-small cell lung cancer: A narrative review. J. Thorac. Dis. 2022, 14, 1696–1712. [Google Scholar] [CrossRef]
- Chen, E.; Nguyen, J.; Khan, L.; Zhang, L.; Cramarossa, G.; Tsao, M.; Danjoux, C.; Barnes, E.; Sahgal, A.; Holden, L.; et al. Symptom clusters in patients with advanced cancer: A reanalysis comparing different statistical methods. J. Pain Symptom Manage. 2012, 44, 23–32. [Google Scholar] [CrossRef]
- Ganesh, V.; Zhang, L.; Chan, S.; Wan, B.A.; Drost, L.; Tsao, M.; Danjoux, C.; Barnes, E.; McDonald, R.; Rowbottom, L.; et al. An update in symptom clusters using the Edmonton Symptom Assessment System in a palliative radiotherapy clinic. Support. Care Cancer 2017, 25, 3321–3327. [Google Scholar] [CrossRef]
- McKenzie, E.; Zhang, L.; Zaki, P.; Chan, S.; Ganesh, V.; Razvi, Y.; Tsao, M.; Barnes, E.; Hwang, M.K.; DeAngelis, C.; et al. Re-analysis of symptom clusters in advanced cancer patients attending a palliative outpatient radiotherapy clinic. Ann. Palliat. Med. 2019, 8, 140–149. [Google Scholar] [CrossRef] [PubMed]
- Pirovano, M.; Maltoni, M.; Nanni, O.; Marinari, M.; Indelli, M.; Zaninetta, G.; Petrella, V.; Barni, S.; Zecca, E.; Scarpi, E.; et al. A new palliative prognostic score: A first step for the staging of terminally ill cancer patients. J. Pain Symptom Manage. 1999, 17, 231–239. [Google Scholar] [CrossRef]
- Maltoni, M.; Nanni, O.; Pirovano, M.; Scarpi, E.; Indelli, M.; Martini, C.; Monti, M.; Arnoldi, E.; Piva, L.; Ravaioli, A.; et al. Successful validation of the palliative prognostic score in terminally ill cancer patients. J. Pain Symptom Manage. 1999, 17, 240–247. [Google Scholar] [CrossRef] [PubMed]
- Maltoni, M.; Scarpi, E.; Dall’Agata, M.; Micheletti, S.; Pallotti, M.C.; Pieri, M.; Ricci, M.; Romeo, A.; Tenti, M.V.; Tontini, L.; et al. Prognostication in palliative radiotherapy—ProPaRT: Accuracy of prognostic scores. Front. Oncol. 2022, 12, 918414. [Google Scholar] [CrossRef] [PubMed]
Table 1.
Demographic and clinical characteristics.
| Variable | No. | % |
| Radiotherapist assessed ECOG Performance status | ||
| 0-1 | 102 | 47 |
| ≥2 | 113 | 53 |
| Palliativist assessed ECOG Performance status | ||
| 0-1 | 102 | 47 |
| ≥2 | 113 | 53 |
| Gender | ||
| Female | 93 | 47 |
| Male | 122 | 53 |
| Primary tumor site | ||
| Breast | 43 | 21 |
| Lung | 68 | 31 |
| Prostate | 26 | 12 |
| Gastro-enteric | 21 | 10 |
| Genito-urinary | 24 | 11 |
| Other malignancies | 33 | 15 |
| Bone metastases | ||
| No | 45 | 21 |
| Yes | 170 | 79 |
| Liver metastases | ||
| No | 182 | 85 |
| Yes | 33 | 15 |
| Lung metastases | ||
| No | 165 | 77 |
| Yes | 50 | 23 |
| Central nervous system metastases | ||
| No | 177 | 82 |
| Yes | 38 | 18 |
| Soft tissue metastases | ||
| No | 206 | 96 |
| Yes | 9 | 4 |
| Locally advanced primary tumor | ||
| No | 190 | 88 |
| Yes | 25 | 12 |
| Other metastases | ||
| No | 135 | 63 |
| Yes | 80 | 37 |
| Median age | 71 |
No.=number, ECOG PS=Eastern Cooperative Oncology Group Performance Status.
Table 2.
Summary statistics of ESAS items.
| ESAS item | Total (n = 215) |
| Pain | 215 |
| Mean ± SD | 4.76 ± 2.97 |
| Range | 0 - 10 |
| % of scores ≥ 4 | 65 |
| Tiredness | |
| Mean ± SD | 4.91 ± 3.04 |
| Range | 0 - 10 |
| % of scores ≥ 4 | 67 |
| Drowsiness | |
| Mean ± SD | 2.53 ± 3.01 |
| Range | 0 - 10 |
| % of scores ≥ 4 | 33 |
| Nausea | |
| Mean ± SD | 0.98 ± 2.23 |
| Range | 0 - 10 |
| % of scores ≥ 4 | 12 |
| Loss of appetite | |
| Mean ± SD | 2.10 ± 2.98 |
| Range | 0 - 10 |
| % of scores ≥ 4 | 31 |
| Dyspnea | |
| Mean ± SD | 1.31 ± 2.40 |
| Range | 0 - 10 |
| % of scores ≥ 4 | 15 |
| Depression | |
| Mean ± SD | 2.50 ± 2.88 |
| Range | 0 - 10 |
| % of scores ≥ 4 | 33 |
| Anxiety | |
| Mean ± SD | 2.44 ± 2.72 |
| Range | 0 - 10 |
| % of scores ≥ 4 | 35 |
| Malaise | |
| Mean ± SD | 1.97 ± 2.84 |
| Range | 0 - 10 |
| % of scores ≥ 4 | 24 |
| Other symptoms | |
| Mean ± SD | 0.48 ± 1.90 |
| Range | 0 - 10 |
| % of scores ≥ 4 | 6 |
| ESAS Total score | |
| Mean ± SD | 24.03 ± 15.28 |
| Range | 0 - 80 |
ESAS= Edmonton Symptom Assessment System, n=number, SD: standard deviation.
Table 3.
Association between PCA Symptom clusters and clinical characteristics.
| Variable | PC 1 | PC 2 | PC 3 | PC 4 | p | ||||||||||||||||
| Belong | Not belong | p | Belong | Not belong | p | Belong | Not belong | p | Belong | Not belong | p | ||||||||||
| No. | % | No. | % | No. | % | No. | % | No. | % | No. | % | No. | % | No. | % | ||||||
| Palliativist assessed ECOG Performance | |||||||||||||||||||||
| 0-1 | 35 | 36 | 67 | 56 | 0.004 | 48 | 48 | 54 | 47 | 0.777 | 26 | 36 | 76 | 54 | 0.013 | 59 | 42 | 43 | 57 | 0.047 | 0.252 |
| ≥2 | 61 | 64 | 52 | 44 | 51 | 52 | 62 | 53 | 47 | 64 | 66 | 46 | 80 | 58 | 33 | 43 | |||||
| Missing | 0 | 0 | 0 | 0 | 0 | 0 | 0 | 0 | |||||||||||||
| Primary tumor site | |||||||||||||||||||||
| Breast | 18 | 19 | 25 | 21 | 0.756 | 25 | 25 | 18 | 16 | 0.078 | 16 | 22 | 27 | 19 | 0.943 | 28 | 20 | 15 | 20 | 0.773 | 0.885 |
| Lung | 34 | 35 | 34 | 29 | 32 | 32 | 36 | 31 | 25 | 34 | 43 | 30 | 43 | 31 | 25 | 33 | |||||
| Prostate | 9 | 9 | 17 | 14 | 15 | 15 | 11 | 9 | 7 | 10 | 19 | 13 | 16 | 12 | 10 | 13 | |||||
| Gastro-enteric | 8 | 8 | 13 | 11 | 5 | 5 | 16 | 14 | 7 | 10 | 14 | 10 | 12 | 9 | 9 | 12 | |||||
| Genito-urinary | 12 | 12 | 12 | 10 | 8 | 8 | 16 | 14 | 8 | 11 | 16 | 11 | 15 | 11 | 9 | 12 | |||||
| Other malignancies | 15 | 16 | 18 | 15 | 14 | 14 | 19 | 16 | 10 | 14 | 23 | 16 | 25 | 18 | 8 | 11 | |||||
| Bone metastases | |||||||||||||||||||||
| No | 22 | 23 | 23 | 19 | 0.520 | 19 | 19 | 26 | 22 | 0.563 | 20 | 27 | 25 | 18 | 0.095 | 24 | 17 | 21 | 28 | 0.074 | 0.336 |
| Yes | 74 | 77 | 96 | 81 | 80 | 81 | 90 | 78 | 53 | 73 | 117 | 82 | 115 | 83 | 55 | 72 | |||||
| Missing | 0 | 0 | 0 | 0 | 0 | 0 | 0 | 0 | |||||||||||||
| Liver metastases | |||||||||||||||||||||
| No | 79 | 82 | 103 | 87 | 0.389 | 88 | 89 | 94 | 81 | 0.111 | 57 | 78 | 125 | 88 | 0.055 | 117 | 84 | 65 | 86 | 0.792 | 0.282 |
| Yes | 17 | 18 | 16 | 13 | 11 | 11 | 22 | 19 | 16 | 22 | 17 | 12 | 22 | 16 | 11 | 14 | |||||
| Missing | 0 | 0 | 0 | 0 | 0 | 0 | 0 | 0 | |||||||||||||
| Lung metastases | |||||||||||||||||||||
| No | 71 | 74 | 94 | 79 | 0.385 | 76 | 77 | 89 | 77 | 0.994 | 57 | 78 | 108 | 76 | 0.739 | 111 | 80 | 54 | 71 | 0.144 | 0.760 |
| Yes | 25 | 26 | 25 | 21 | 23 | 23 | 27 | 23 | 16 | 22 | 34 | 24 | 28 | 20 | 22 | 29 | |||||
| Missing | 0 | 0 | 0 | 0 | 0 | 0 | 0 | 0 | |||||||||||||
| Central nervous system metastases | |||||||||||||||||||||
| No | 77 | 80 | 100 | 84 | 0.465 | 83 | 84 | 94 | 81 | 0.591 | 59 | 81 | 118 | 83 | 0.679 | 119 | 86 | 58 | 76 | 0.088 | 0.582 |
| Yes | 19 | 20 | 19 | 16 | 16 | 16 | 22 | 19 | 14 | 19 | 24 | 17 | 20 | 14 | 18 | 24 | |||||
| Missing | 0 | 0 | 0 | 0 | 0 | 0 | 0 | 0 | |||||||||||||
| Soft tissue metastases | |||||||||||||||||||||
| No | 92 | 96 | 114 | 96 | 0.990 | 94 | 95 | 112 | 97 | 0.559 | 68 | 93 | 138 | 97 | 0.162 | 132 | 95 | 74 | 97 | 0.400 | 0.890 |
| Yes | 4 | 4 | 5 | 4 | 5 | 5 | 4 | 3 | 5 | 7 | 4 | 3 | 7 | 5 | 2 | 3 | |||||
| Missing | 0 | 0 | 0 | 0 | 0 | 0 | 0 | 0 | |||||||||||||
| Locally advanced primary tumor | |||||||||||||||||||||
| No | 80 | 83 | 110 | 92 | 0.038 | 92 | 93 | 98 | 84 | 0.054 | 62 | 85 | 128 | 90 | 0.259 | 124 | 89 | 66 | 87 | 0.605 | 0.166 |
| Yes | 16 | 17 | 9 | 8 | 7 | 7 | 18 | 16 | 11 | 15 | 14 | 10 | 15 | 11 | 10 | 13 | |||||
| Missing | 0 | 0 | 0 | 0 | 0 | 0 | 0 | 0 | |||||||||||||
| Other metastases | |||||||||||||||||||||
| No | 56 | 58 | 79 | 66 | 0.225 | 60 | 61 | 75 | 65 | 0.540 | 39 | 53 | 96 | 68 | 0.042 | 73 | 60 | 52 | 68 | 0.207 | 0.812 |
| Yes | 40 | 42 | 40 | 34 | 39 | 39 | 41 | 35 | 34 | 47 | 46 | 32 | 56 | 40 | 24 | 32 | |||||
| Missing | 0 | 0 | 0 | 0 | 0 | 0 | 0 | 0 | |||||||||||||
PCA=principal component analysis, PC= principal component, No.=number, p=p value.
Table 4.
Association between K-means Symptom clusters and clinical characteristics.
| Variable | Cluster 1 | Cluster 2 | Cluster 3 | p | ||||||||||||
| Belong | Not belong | p | Belong | Not belong | p | Belong | Not belong | p | ||||||||
| No. | % | No. | % | No. | % | No. | % | No. | % | No. | % | |||||
| Palliativist assessed ECOG Performance | ||||||||||||||||
| 0-1 | 50 | 38 | 52 | 62 | 0.001 | 9 | 32 | 93 | 50 | 0.082 | 48 | 48 | 54 | 47 | 0.777 | 0.165 |
| ≥2 | 81 | 62 | 32 | 38 | 19 | 68 | 94 | 40 | 51 | 52 | 62 | 53 | ||||
| Missing | 0 | 0 | 0 | 0 | 0 | 0 | ||||||||||
| Primary tumor site | ||||||||||||||||
| Breast | 25 | 19 | 18 | 21 | 0.784 | 6 | 21 | 37 | 20 | 0.926 | 25 | 25 | 18 | 16 | 0.078 | 0.906 |
| Lung | 44 | 34 | 24 | 29 | 10 | 36 | 58 | 31 | 32 | 32 | 36 | 31 | ||||
| Prostate | 15 | 11 | 11 | 13 | 2 | 7 | 24 | 13 | 15 | 15 | 11 | 9 | ||||
| Gastro-enteric | 11 | 8 | 10 | 12 | 2 | 7 | 19 | 10 | 5 | 5 | 16 | 14 | ||||
| Genito-urinary | 17 | 13 | 7 | 8 | 4 | 14 | 20 | 11 | 8 | 8 | 16 | 14 | ||||
| Other malignancies | 19 | 15 | 14 | 17 | 4 | 14 | 29 | 16 | 14 | 14 | 19 | 16 | ||||
| Bone metastases | ||||||||||||||||
| No | 29 | 22 | 16 | 19 | 0.587 | 9 | 32 | 36 | 19 | 0.118 | 19 | 19 | 26 | 22 | 0.563 | 0.345 |
| Yes | 102 | 78 | 68 | 81 | 19 | 68 | 151 | 81 | 80 | 81 | 90 | 78 | ||||
| Missing | 0 | 0 | 0 | 0 | 0 | 0 | ||||||||||
| Liver metastases | ||||||||||||||||
| No | 108 | 82 | 74 | 88 | 0.262 | 20 | 71 | 162 | 87 | 0.037 | 88 | 89 | 94 | 81 | 0.111 | 0.074 |
| Yes | 23 | 18 | 10 | 12 | 8 | 29 | 25 | 13 | 11 | 11 | 22 | 19 | ||||
| Missing | 0 | 0 | 0 | 0 | 0 | 0 | ||||||||||
| Lung metastases | ||||||||||||||||
| No | 100 | 76 | 65 | 77 | 0.859 | 21 | 75 | 144 | 77 | 0.815 | 76 | 77 | 89 | 77 | 0.994 | 0.981 |
| Yes | 31 | 24 | 19 | 23 | 7 | 25 | 43 | 23 | 23 | 23 | 27 | 23 | ||||
| Missing | 0 | 0 | 0 | 0 | 0 | 0 | ||||||||||
| Central nervous system metastases | ||||||||||||||||
| No | 108 | 82 | 69 | 82 | 0.955 | 20 | 71 | 157 | 84 | 0.105 | 83 | 84 | 94 | 81 | 0.591 | 0.311 |
| Yes | 23 | 18 | 15 | 18 | 8 | 29 | 30 | 16 | 16 | 16 | 22 | 19 | ||||
| Missing | 0 | 0 | 0 | 0 | 0 | 0 | ||||||||||
| Soft tissue metastases | ||||||||||||||||
| No | 123 | 94 | 83 | 99 | 0.079 | 25 | 89 | 181 | 97 | 0.064 | 94 | 95 | 112 | 97 | 0.559 | 0.547 |
| Yes | 8 | 6 | 1 | 1 | 3 | 11 | 6 | 3 | 5 | 5 | 4 | 3 | ||||
| Missing | 0 | 0 | 0 | 0 | 0 | 0 | ||||||||||
| Locally advanced primary tumor | ||||||||||||||||
| No | 114 | 87 | 76 | 90 | 0.441 | 24 | 86 | 166 | 89 | 0.638 | 92 | 93 | 98 | 84 | 0.054 | 0.299 |
| Yes | 17 | 13 | 8 | 10 | 4 | 14 | 21 | 11 | 7 | 7 | 18 | 16 | ||||
| Missing | 0 | 0 | 0 | 0 | 0 | 0 | ||||||||||
| Other metastases | ||||||||||||||||
| No | 76 | 58 | 59 | 70 | 0.070 | 12 | 43 | 123 | 66 | 0.019 | 60 | 61 | 75 | 65 | 0.540 | 0.240 |
| Yes | 55 | 42 | 25 | 30 | 16 | 57 | 64 | 34 | 39 | 39 | 41 | 35 | ||||
| Missing | 0 | 0 | 0 | 0 | 0 | 0 | ||||||||||
No.=number, p=p value.
Table 5.
Factors associated with radiotherapy treatment initiation.
| Logit model for identifying principal components associated with radiotherapy treatment | ||||||
| Parameter | Odds Ratio (OR) | SE | 95% CI | Z | p-value | |
| Lower limit | Upper limit | |||||
| (Intercept) | 0,464 | 0,110 | 0,287 | 0,731 | -3,233 | 0,0012 |
| PCA 1 | 1,700 | 0,713 | 0,743 | 3,875 | 1,267 | 0,2052 |
| PCA 2 | 0,190 | 0,123 | 0,043 | 0,593 | -2,565 | 0,0103 |
| PCA 1: PCA2 | 3,931 | 3,064 | 0,933 | 21,186 | 1,756 | 0,0791 |
| Logit model for identifying (K-means) clusters associated with radiotherapy treatment | ||||||
| Parameter | Odds Ratio (OR) | SE | 95% CI | Z | p-value | |
| Lower limit | Upper limit | |||||
| (Intercept) | 0,346 | 0,094 | 0,198 | 0,577 | -3,917 | 0,0001 |
| Cluster 1 | 2,431 | 0,818 | 1,276 | 4,793 | 2,640 | 0,0083 |
| Cluster 3 | 0,507 | 0,162 | 0,268 | 0,941 | -2,124 | 0,0336 |
SE=standard error, CI=confidence interval, PCA=principal component analysis.
Disclaimer/Publisher’s Note: The statements, opinions and data contained in all publications are solely those of the individual author(s) and contributor(s) and not of MDPI and/or the editor(s). MDPI and/or the editor(s) disclaim responsibility for any injury to people or property resulting from any ideas, methods, instructions or products referred to in the content. |
© 2025 by the authors. Licensee MDPI, Basel, Switzerland. This article is an open access article distributed under the terms and conditions of the Creative Commons Attribution (CC BY) license (http://creativecommons.org/licenses/by/4.0/).
Copyright: This open access article is published under a Creative Commons CC BY 4.0 license, which permit the free download, distribution, and reuse, provided that the author and preprint are cited in any reuse.


