
Submitted:
06 August 2025
Posted:
15 August 2025
You are already at the latest version
Abstract
Rural poverty in Indonesia remains a complex issue involving various aspects. West Manggarai, East Nusa Tenggara, is a national tourist destination and a significant focus of national development, yet poverty rates remain very high. Therefore, this study developed a Composite Poverty Index (CPI) using the Sustainable Rural Livelihoods Approach (SRLA) to illustrate the complexity of rural deprivation in West Manggarai Regency. The CPI was developed by normalizing eighteen validated indicators across five livelihood capitals—human, social, natural, physical, and financial. These indicators were then classified using a Likert-type scale, and their weights were determined through the Analytic Hierarchy Process (AHP) to produce village-level CIP scores. The results show that most villages fall into the "Moderate" category (CIP: 0.40–0.60), reflecting chronic but not extreme deprivation. Spatial inequalities are evident, particularly in access to education, infrastructure, clean water, financial services, and ecological resources. Remote villages recorded higher CIP scores. Natural and financial capital performed the weakest, while human and social capital performed relatively well. Therefore, poverty alleviation in West Manggarai requires an integrated strategy tailored to local spatial conditions and livelihood capital.
Keywords:
composite index
; multidimensional poverty
; spatial inequality
; sustainable rural livelihoods
1. Introduction
Poverty remains a significant challenge facing communities in rural areas. Poverty is characterized not only by income deprivation but also by limitations in several areas, including limited access to resources, high vulnerability, social exclusion, and marginalization from institutional processes. This creates overlapping deprivations across all dimensions—human, social, natural, physical, and financial—which exacerbate livelihood fragility and social isolation [1,2].
In Indonesia, poverty alleviation has long been a governmental priority, pursued through income support programs, infrastructure development, and conditional cash transfers (CCTs). However, poverty reduction has slowed recently, particularly in rural areas. According to the World Bank, between 2007 and 2011, the rural poverty rate declined from 16.6% to 12.5%—a reduction of 4.1 percentage points. In contrast, the period from 2012 to 2018 saw a smaller decline of only 2.1 percentage points. Furthermore, national poverty dropped only marginally from 10.6% in September 2017 to 9.7% in September 2018, averaging a yearly decline of 0.36 percentage points from 2012 to 2018, compared to a 0.97-point annual decrease from 2007 to 2012 [3]
This stagnant situation is common in remote and underdeveloped areas, such as West Manggarai Regency, East Nusa Tenggara (NTT). West Manggarai Regency boasts substantial infrastructure and tourism investment. However, the poverty rate in this region remains above the national average. Between 2015 and 2023, the poverty rate declined from 20.12% to 16.82%, a decrease of only 3.3 percentage points over eight years. This averages out to a reduction of 0.41 percentage points per year. This situation needs more effective poverty alleviation strategies in this region [4]. This slow decline is especially striking when contrasted with the scale of public investment in the region.
Further complicating the picture, research by Gai et al. [2025] reveals that the benefits of tourism-led development in Labuan Bajo have been unevenly distributed. Households with better access to capital, education, and institutional networks disproportionately capture these benefits, while poorer and more remote communities remain economically marginalized and disconnected from the tourism value chain [5]. This difference indicates that income and consumption aspects are not yet adequate to represent the characteristics and complexity of the causes of rural poverty. Therefore, a more comprehensive understanding of rural poverty is needed, considering the various forms of deprivation experienced by rural communities.
An increasing body of literature argues that poverty in rural areas cannot be adequately assessed using income indicators alone. Rural livelihoods are shaped by the dynamic interplay among multiple forms of capital—human, social, natural, physical, and financial—which collectively influence households' well-being, vulnerability, and ability to respond to shocks (6–8). The Sustainable Rural Livelihoods Approach (SRLA) presents a robust, community-centered framework. It show how households can utilize and manage their assets, adapt to shocks, and address institutional challenges to achieve more stable and sustainable livelihoods [9,10]. Recent reformulations of SRLA also reflect its adaptation to 21st-century challenges, including climate change, resilience, and technological transitions [11].
This study uses the SRLA to construct a Composite Poverty Index (CPI) to analyze the complexity of rural life using five livelihood capital indicators. This study aims to provide a broader and more relevant view of rural poverty. The results are expected to help shape more appropriate policies to address overlapping deprivations across human, social, natural, physical, and financial dimensions, exacerbating livelihood fragility and social isolation. Furthermore, the results are expected to improve the design of effective and inclusive poverty reduction strategies in rural Indonesia.
2. Conceptual Framing
2.1. Sustainable Rural Livelihood Framework
The Sustainable Livelihood Framework (SLF) was developed by the UK Department for International Development [12]. This framework presents a comprehensive perspective rooted in societal realities to understand the complexities of rural poverty. Based on the concept of limited capabilities, this framework emphasizes that poverty alleviation is not simply about increasing income. Furthermore, it requires individual empowerment, strengthening resilience to life's pressures, and expanding access to resources and opportunities that support sustainable development [13].
Based on this, the SLF has five indicators in the form of interrelated forms of livelihood capital, including human, social, natural, physical, and financial. First, human capital consists of health, education, and skills, which are key for individuals to pursue a productive livelihood. Second, social capital refers to social networks, norms, and levels of trust that facilitate collective action and access to support systems. Third, natural capital consists of access to and control over environmental resources such as land, water, and biodiversity, which are important for agrarian and resource-dependent communities. Fourth, physical capital consists of infrastructure and devices that support economic and social activities, such as roads, energy access, and housing. Lastly, financial capital consists of income, credit, savings, and other financial services, enabling households to invest in their future and manage risk.
These forms of capital are continuously shaped by the vulnerability context, which includes environmental shocks, economic trends, and seasonal fluctuations [12,14]. This context is mediated by institutions, governance structures, and policies, which are central in determining how people access resources and opportunities. As Scoones (1998) and Chambers and Conway (1992) argue, a livelihood can only be considered sustainable if it enables people to withstand and recover from stresses and shocks, maintain or enhance their capabilities and assets, and generate livelihood opportunities that are environmentally and socially viable for future generations [12,14].
The SLF helps understand rural poverty by examining how community assets, the rules and institutions that govern their lives, and external challenges interact. In this study, the SLF serves as a valuable guide for identifying what truly impacts rural communities and designing strategies that can strengthen their livelihoods to become more resilient, equitable, and sustainable.
2.2. Multidimensional Poverty and Composite Indices
A multidimensional view of poverty includes deprivation across education, health, living conditions, and access to services [17,18]. Composite indices aggregate such diverse indicators into a single value that simplifies interpretation while maintaining multidimensional richness [19,20]. Such indices are increasingly used to inform policy due to their communicability and ability to support disaggregated spatial analysis [21,22].
2.3. Spatial and Dynamic Dimensions of Poverty
Poverty is not evenly distributed geographically. Spatial dynamics, affected by proximity to urban centers, infrastructure, and ecological vulnerability, play a crucial role in shaping livelihood opportunities [22,25]. The use of spatial statistics, such as Moran’s I and Local Indicators of Spatial Association (LISA), can reveal poverty clustering and regional disparities [26,27].
Moreover, static evaluations are insufficient for capturing long-term changes in livelihoods. System Dynamics Models (SDM) offer an alternative by simulating feedback loops and time-based interactions between assets, policies, and poverty outcomes [23].
3. Materials and Methods
3.1. Study Area
This study focuses on Manggarai Barat Regency, a lagging region in East Nusa Tenggara (NTT), Indonesia, despite its designation as a National Strategic Tourism Area (Kawasan Strategis Pariwisata Nasional or KSPN). The regency is a representative case for exploring the disconnect between macro-level tourism investments and persistent rural poverty. This condition is further exacerbated by limited institutional capacity, poor infrastructure, and geographic isolation.
3.2. Data Sources
Primary data were obtained through structured household surveys to collect information on income levels, access to basic services, livelihood strategies, asset ownership, and perceived shock vulnerability. Secondary data included official statistics from national and regional agencies (e.g., BPS, TNP2K), spatial datasets (e.g., land use, road network, topography), and programmatic documents such as regional development plans (RPJMD) and strategic tourism policies. These diverse data sources enabled quantitative and spatial analysis of rural poverty conditions.
3.3. Composite Index Construction
The Composite Index of Poverty (CIP) construction followed a rigorous multi-step methodology grounded in the Sustainable Rural Livelihoods Approach (SRLA). The objective was to integrate multiple indicators that reflect the multidimensional and spatially contextual nature of rural poverty into a single composite metric. This process involved: (1) selecting indicators based on five livelihood capitals—human, social, natural, physical, and financial; (2) normalizing data to ensure comparability; (3) assigning weights using the Analytic Hierarchy Process (AHP) based on expert judgment; and (4) aggregating the weighted scores to produce village-level CIP values. Variable classification was context-specific and based on empirical patterns observed in the Manggarai Barat region.
3.3.1. Indicator Selection
Indicators are selected to reflect the five capital assets outlined in the SRLA framework [12,15]. It represents human, social, natural, physical, and financial dimensions of livelihoods (Table 1). Each indicator was assigned an index score from 1 (very good condition) to 5 (very poor condition), following predefined thresholds (see subcategories below).
Each variable was confirmed to be significantly associated with the dependent variable, percentage of the poor population, based on the result of an ANOVA test. Subsequently, each variable was classified according to its value range (for interval-scale data) or based on its original category (nominal-scale data converted into ordinal classes), and then mapped to a five-point Likert-type scale:
Example: Classification of Selected Indicators
- 1.
- Number of high school institutions:
- 5 = Worst condition (0.00–0.80)
- ...
- 1 = Optimal condition (3.20–4.00)
- 2.
- Source of drinking water:
- 1 = Branded bottled water
- ...
- 5 = River, rainwater, etc.
- 3.
- Access to a financial credit institution:
- 1 = presence
- 5 = absence
- 4.
- Distance to nearest higher education institution (km):
- 1 = Optimal condition (3.00–22.38)
- ...
- 5 = Worst condition (80.52–99.90)
A variable index table maintains a complete classification rubric (see Appendix).
3.3.2. Normalization
After classification, all indicators were normalized to a [0, 1] scale to ensure comparability across dimensions with different units and ranges. The Min-Max normalization formula was applied:
Where:
- is the raw class score (1 to 5),
- is the normalized value,
This results in a scale where 0 = optimal condition and 1 = worst condition, aligning the directionality across all indicators for composite aggregation.
3.3.3. Weighting
Indicator weights are determined using the Analytical Hierarchy Process (AHP), a structured decision-making method that facilitates prioritizing weights based on expert judgment and pairwise comparisons (Saaty, 1980). This method allows for consistently evaluating multiple criteria and sub-indicators by quantifying their relative importance in influencing poverty outcomes.
To ensure contextual relevance and methodological rigor, AHP questionnaires were administered to a panel of experts with professional experience in poverty alleviation in Indonesia. Respondents assessed the relative importance of each livelihood capital (human, social, natural, physical, and financial) and their associated indicators using Saaty’s 9-point scale.
The consistency ratio (CR) was calculated for each respondent's matrix to ensure logical consistency in pairwise comparisons, with CR values below 0.10 considered acceptable. Final indicator weights were obtained by aggregating the normalized principal eigenvectors of the pairwise comparison matrices, reflecting the collective judgment of all experts.
This AHP-based approach provides a transparent and participatory weighting structure that aligns with both empirical priorities and local development perspectives, thereby strengthening the validity of the composite index used in the spatial poverty analysis.
3.3.4. Aggregation
The Composite Index of Poverty (CIP) was calculated using a linear weighted aggregation model:
Where:
- = composite index for unit (e.g., village)
- = normalized score of indicator or unit
- = final weight for indicator
Referring to the general model above, the equation for CIP can be written explicitly as:
CIP = ⋅ [(⋅X1) + (⋅X2) + (⋅X3) + (⋅X4)]
+ ⋅ [(⋅X5) + (⋅X6) + (⋅X7)]
+ ⋅ [(⋅X8) + (⋅X9) + (⋅X10) + (⋅X11) + (⋅X12)]
+ ⋅ [(⋅X13) + (⋅X14) + (⋅X15)]
+ ⋅ [(⋅X16) + (⋅X17) +(⋅X18)]
Where:
This produces a continuous index ranging from 0 (least poor) to 1 (most poor), which can be classified into quintiles or categorical classes: Very Low Poverty (0.00–0.20); Low Poverty (0.20–0.40); Moderate Poverty (0.40–0.60); High Poverty (0.60–0.80); and Very High Poverty (0.80–1.00). These classifications can be spatially mapped using GIS tools to visualize geographic disparities and support spatially targeted interventions [21,22].
4. Results
4.1. Spatial Disparities in Multidimensional Poverty
This study adopts a multidimensional poverty approach grounded in the Sustainable Rural Livelihood Framework (SRLF) to provide a more comprehensive assessment of poverty conditions at the village level. The approach utilizes 18 indicators that represent the five core livelihood capitals, namely:
- Human Capital: Access to senior high schools (A), prevalence of communicable diseases (B), access to higher education (C), access to vocational training (D), and neighborhood safety initiatives (E).
- Social Capital: Neighborhood safety initiatives (E), maintenance of local security systems (F), and variations in crime rates (G).
- Natural Capital: Trends in disaster occurrences (H), presence of mangrove ecosystems (I), and access to surface water sources (J).
- Physical Capital: Access to drinking water (K), access to clean water (L), sanitation facilities (M), road infrastructure quality (N), and access to electricity (O).
- Financial Capital: Access to financial credit (P), presence of village-owned enterprises (BUMDes) (Q), and access to banking services (R).
Each indicator was assessed at the village/urban village level across multiple subdistricts in Manggarai Barat Regency, including Komodo, Boleng, Sano Nggoang, Mbeliling, Lembor, Welak, Lembor Selatan, Kuwus, Ndoso, Kuwus Barat, Macang Pacar, and Pacar (Figure 1). The indicators were scored based on actual conditions using a five-point ordinal scale: very good (1), good (2), moderate (3), poor (4), and very poor (5). These scores were then aggregated to construct a Multidimensional Poverty Index (MPI) for each village.
This approach reveals significant spatial disparities in poverty levels across Manggarai Barat Regency. Key determinants such as access to clean water, road infrastructure, education, and financial services critically influence rural livelihoods and poverty outcomes. Although progress has been made in sanitation, electrification, and the development of BUMDes, persistent spatial inequalities—particularly in remote inland villages—underscore the urgent need for targeted, multi-sectoral interventions to ensure inclusive and sustainable poverty reduction.
Access to safe drinking water is perhaps the most acute infrastructural shortfall in the region. Many villages, primarily in remote hinterland subdistricts such as Welak, Ndoso, Kuwus, and Lembor Selatan, fall under the “Fairly Poor” and “Very Poor” classifications. These communities rely heavily on untreated wells, springs, rivers, or seasonal rainwater, making them vulnerable to contamination, waterborne diseases, and prolonged drought conditions. This lack of safe water impacts health outcomes and imposes a disproportionate time burden, especially on women and children, who often travel long distances for water collection. In contrast, only a few semi-urban areas, such as Labuan Bajo and Batu Cermin, benefit from piped or refillable water systems and fall under the “Good” category. This stark divide illustrates how inadequate water infrastructure perpetuates poverty, reinforces health inequities, and limits educational and economic productivity.
Closely linked to water access is the availability of infrastructure for bathing and washing. Over 70% of villages fall into the "Fairly Poor" category, often relying on rivers or unprotected wells. This again underscores serious hygiene-related health risks, particularly for children and vulnerable populations, and exacerbates the intergenerational cycle of poverty. Conversely, urban and tourism-adjacent communities such as Labuan Bajo enjoy "Very Good" infrastructure, highlighting the uneven distribution of public investments.
Road infrastructure is a key factor in poverty, especially in remote areas like Ndoso, Kuwus Barat, Pacar, and Welak. Villages here are labeled as having "Very Poor" access, and many routes become impassable during the rainy season. This isolation limits access to markets, schools, health facilities, and government services, which deepens poverty and stagnation. In contrast, coastal and peri-urban areas such as Macang Tanggar and Wae Kelambu have "Very Good" road conditions, often due to investments related to tourism. These improvements boost connectivity and economic mobility. Villages with intermediate road quality, categorized as "Good" or "Poor," are precarious. Their infrastructure allows for some access but is still at risk of disruption from environmental factors.
Education plays a vital role in breaking the cycle of poverty. Access to senior high school education is relatively strong in many parts of Manggarai Barat, including urban and rural areas. Villages such as Labuan Bajo, Golo Keli, and Wae Lolos are categorized as "Very Good," reflecting the presence of more than three senior high schools. However, access is still uneven. Villages like Batu Cermin and Golo Bilas are classified as "Poor" or "Moderate," highlighting barriers to human capital development that can inhibit long-term socio-economic mobility.
Vocational education access shows similar patterns. Over 95% of villages are categorized as "Very Good," indicating high availability of vocational institutions supporting skills training for employment in agriculture, tourism, and service sectors. Yet, outliers such as Desa Golo Mbu and Desa Bari fall into "Moderate" or "Very Poor" categories, exposing pockets of exclusion that risk being overlooked in broader regional development plans.
Financial inclusion presents a complex picture. Although banking agent access is classified as "Very Good" in over 85% of villages, thanks partly to national programs like Laku Pandai and BRILink, true financial inclusion remains elusive. Credit access remains critically low across most of the regency. Most villages are categorized as "Poor," particularly in inland areas like Welak, Kuwus, and Ndoso, where banks, cooperatives, and microfinance services are largely absent. This financial exclusion limits the ability of residents to invest in livelihoods, manage crises, and escape poverty.
Higher education access presents perhaps the most significant spatial inequality. While villages near Labuan Bajo benefit from strong proximity to universities and academies, only 17.8% of villages fall into the “Very Good” accessibility category. In contrast, nearly 30% of villages, particularly in interior subdistricts such as Macang Pacar, Lembor Selatan, and Welak, have “Poor” or “Very Poor” access, located over 60 km from the nearest institution. These distances create barriers to higher education enrollment, reduce opportunities for social mobility, and perpetuate generational poverty.
Access to diverse surface water sources like rivers, springs, and lakes also shapes poverty dynamics. Villages like Desa Komodo and Pasir Panjang benefit from "Very Good" access, supporting agriculture and domestic needs. However, many villages, particularly in Komodo, Sano Nggoang, and Lembor, fall under "Poor" or "Very Poor" classifications, exposing them to seasonal shortages and reduced livelihood options. These disparities reinforce the importance of water resource diversification in reducing rural vulnerability.
Electricity access is one area in which Manggarai Barat has made substantial progress. Approximately 86% of villages have "Very Good" electrification, enhancing education, health, and economic activity. Nonetheless, villages such as Loha (Pacar), Watu Galang (Mbeliling), and Golo Poleng (Ndoso) remain without reliable grid access, classified as “Poor” or “Very Poor.” Without targeted investment, these areas risk falling further behind.
Sanitation access paints a more optimistic picture, with over 95% of villages using private household latrines and being categorized as "Very Good." This success, primarily attributed to the STBM (Sanitasi Total Berbasis Masyarakat) initiative, demonstrates how targeted public health programs can have a widespread impact. However, villages such as Papagarang and Golo Keli still fall into the “Very Poor” category, indicating persistent challenges in specific geographic or densely populated areas.
Village-Owned Enterprises (BUMDes) are also a strong point in Manggarai Barat’s development landscape. More than 90% of villages are classified as "Very Good," hosting 4–5 active enterprises that stimulate local economies and generate village revenue. Yet a handful of villages—Golo Kempo, Golo Pua, and Tanjung Boleng—remain in the "Poor" or "Very Poor" categories, often due to limited human capital, weak governance, or geographic remoteness. Strengthening these institutions could help bridge economic gaps.
Environmental poverty, measured through mangrove presence, also plays a role. Although only 27 of the regency’s villages are coastal, those with healthy mangrove ecosystems—such as parts of Komodo and Boleng—benefit from natural protection and support for fisheries-based livelihoods. Coastal villages like Labuan Bajo and Watu Waja without mangroves face higher exposure to erosion and flooding, amplifying their economic vulnerability.
Public health indicators, particularly disease prevalence, show generally positive trends. About 97.2% of villages are classified as "Very Good" with low epidemic rates. This suggests effective rural disease control and supports reduced healthcare costs for households. However, due to its urban density and tourism influx, Labuan Bajo is an outlier with "Very Poor" classification, highlighting the need for targeted health interventions in growing urban centers.
Finally, low crime variation across 85% of villages classified as "Very Good" supports a secure environment that can attract investment and foster community well-being. However, isolated hotspots in Batu Cermin, Komodo, and Lembor subdistricts point to pockets of socio-economic stress that may require integrated social and security policies.
4.2. Composite Poverty Index Distribution
The study began by identifying a wide range of variables previously recognized in the literature as relevant to rural poverty to construct the Composite Livelihood Capital Index. These candidate indicators were then statistically tested using multiple linear regression analysis, with the poverty rate in each village as the dependent variable. This step ensured empirical relevance by retaining only variables significantly associated with poverty levels. Following this, a multi-criteria decision-making approach was employed to determine the relative importance of each capital type and its associated indicators. Specifically, the Analytic Hierarchy Process (AHP) was applied, involving experts who evaluated and weighted the significance of each component based on its perceived contribution to livelihoods and vulnerability (Table 3).

Table 2.
Weights of Livelihood Capital and Their Indicators Based on AHP Result.
| Livelihood Capital | Capital Weight | Indicator | Indicator Weight | IW x CW |
| (CW) | (IW) | |||
| Human Capital | 0,371 | Number of senior high schools (SMA/MA/SMK) | 0,368 | 0,137 |
| Number of Epidemic Disease Cases | 0,14 | 0,052 | ||
| Distance to the nearest higher education institution | 0,153 | 0,057 | ||
| Number of Vocational training institutions | 0,339 | 0,126 | ||
| Social Capital | 0,239 | Activation of neighbourhood security system initiated by residents | 0,11 | 0,026 |
| Construction/maintenance of local security systems | 0,309 | 0,074 | ||
| Number of crime type variations | 0,581 | 0,139 | ||
| Natural Capital | 0,123 | Trend in the number of disaster events | 0,261 | 0,032 |
| Presence of mangrove vegetation | 0,411 | 0,051 | ||
| Number of surface water source types available | 0,328 | 0,04 | ||
| Physical Capital | 0,167 | Main drinking water source | 0,189 | 0,032 |
| Primary water source for bathing/washing | 0,257 | 0,043 | ||
| Predominant type of sanitation facility used | 0,276 | 0,046 | ||
| Road access from production areas to trade centers | 0,095 | 0,016 | ||
| Percentage of households not using electricity | 0,183 | 0,031 | ||
| Financial Capital | 0,1 | Availability of small business credit facilities (KUK) | 0,548 | 0,055 |
| Number of village-owned enterprises (BUMDes) | 0,241 | 0,024 | ||
| Distance to the nearest banking agent | 0,211 | 0,021 |
According to the result shown in Table 3, human Capital emerged as the most influential category with a weight of 0.371, driven particularly by the availability of senior high schools and vocational training institutions. Social Capital followed, highlighting the significance of crime variation and local security infrastructure. Physical Capital and Natural Capital were weighted moderately, reflecting the importance of water, sanitation, electricity, road access, and environmental conditions such as mangrove presence and disaster trends. Although relatively lower in weight, Financial Capital emphasized access to credit and local economic institutions such as BUMDes. These weighted components were used in subsequent index construction to assess village-level livelihood resilience and poverty risk.
To assess multidimensional deprivation across villages in the study area, a Composite Index of Poverty (CIP) was constructed using a weighted linear aggregation of normalized indicators. The resulting index, scaled from 0 (least poor) to 1 (most poor), captures relative poverty intensity across villages and suburbs in Manggarai Barat Regency. The index was subsequently classified into five categories: Very Low, Low, Moderate, High, and Very High poverty, following quintile-based thresholds (Figure 2).
Figure 2.
Composite Index of Poverty Based on SRLA.
Figure 3.
Composite Index of Poverty.
Figure 4.
Poverty Index of Various Capitals.
The results reveal that the majority of villages (over 75%) fall within the “Moderate” poverty category (CIP: 0.40–0.60), indicating a widespread but relatively even level of deprivation across the regency. Notably, none of the villages registered CIP values above 0.60, suggesting the absence of extreme poverty conditions (High or Very High). In contrast, a smaller proportion of villages (approximately 15%) recorded Low poverty levels (CIP: 0.20–0.40). Only a handful of villages, such as Seraya Maranu (0.29), Pasir Putih (0.32), and Liang Ndara (0.33), achieved CIP scores near the threshold for Very Low poverty, reflecting relatively strong performance in key well-being indicators.
Spatially, pockets of lower poverty were observed in parts of Komodo, Mbeliling, and Macang Pacar subdistricts, where villages such as Komodo, Pasir Panjang, Golo Mori, Golo Sembea, and Nanga Kantor scored below 0.35. In contrast, villages with higher CIP values, though still within the moderate range, clustered in Welak, Lembor Selatan, and Pacar subdistricts. For example, Golo Ronggot (0.55), Golo Lajang Barat (0.51), Rancang Welak (0.51), and Wae Mowol (0.52) are among the most deprived locations in relative terms, though still not exceeding the moderate poverty category.
These spatial patterns highlight a narrow poverty band across the district. Deprivation is spread out moderately, without extreme differences. However, the steady presence of villages at the upper end of the moderate range shows the need for focused help to stop poverty from worsening. This is especially important in remote or peri-urban areas, where access to services or job options may be limited.
The CIP model's output gives a solid foundation for spatial visualization and prioritization. This helps local policymakers allocate resources to moderately poor clusters while learning from the best-performing villages. Using this composite index supports recent studies that promote detailed and precise poverty diagnostics as a tool for targeted planning and regional fairness [21,22].
5. Discussion
5.1. Spatial Dimensions of Multidimensional Poverty in Rural Context
This study underscores the critical role of spatial heterogeneity in shaping multidimensional poverty across Manggarai Barat Regency. The uneven distribution of natural, physical, human, and financial capitals demands targeted, context-specific interventions to foster sustainable rural livelihoods and equitable development outcomes. Drawing on the sustainable livelihoods framework [15,16], we argue that addressing disparities in asset endowments is essential to poverty alleviation and long-term resilience.
The spatial distribution of mangrove ecosystems reveals significant environmental and economic implications. Villages with intact mangrove cover benefit from vital ecosystem services, including coastal protection, biodiversity support, and fishery productivity [28,29]. These areas present opportunities for ecosystem-based livelihood programs such as community-based conservation, ecotourism, and sustainable fisheries [30,31]. Conversely, mangrove-deficient coastal zones require reforestation efforts integrated into broader climate adaptation and disaster risk reduction strategies [32].
Access to clean water emerges as another critical dimension of spatial inequality. Villages classified as “Very Poor” and “Fairly Poor” in drinking water availability face heightened health risks and reduced livelihood productivity. Targeted interventions such as rainwater harvesting, deep-well construction, and piped water systems have proven effective in similar rural contexts [33]. In highly vulnerable areas, interim solutions like mobile water delivery and subsidized refillable containers are essential for preventing disease and ensuring dignity. Access to clean water underpins improvements in health, education, and productivity, key levers for breaking intergenerational poverty cycles [34].
While sanitation services appear to be a relative strength in Manggarai Barat, with most villages classified as “Very Good,” persistent gaps in locations such as Papagarang and Golo Keli highlight the need for continued investment. Achieving Open Defecation Free (ODF) status requires not only infrastructure support but also behavior change campaigns and community-based financing mechanisms [35]. The regency’s progress offers a model for rural sanitation success in Eastern Indonesia, yet sustaining these gains necessitates investment in maintenance, training, and wastewater management.
Transportation infrastructure exhibits stark spatial disparities. Poor road conditions in interior areas such as Ndoso and Welak inhibit access to markets, schools, and healthcare facilities, reinforcing multidimensional poverty. These findings align with previous research highlighting road quality as a determinant of rural development and economic integration [36,37]. Strategic investments in road rehabilitation, all-weather corridors, and innovative solutions like riverine transport or cableway systems in mountainous zones are needed to overcome physical isolation and support inclusive growth.
Financial capital remains one of the most unevenly distributed livelihood assets in Manggarai Barat. Although programs like Laku Pandai and BRILink have extended banking access, financial exclusion persists in many interior and agriculture-dependent communities. This limits households’ capacity to invest in income-generating activities and buffer economic shocks [38,39]. Expanding mobile banking services and incentivizing agent presence in underserved areas are critical for inclusive financial development.
Human capital indicators, particularly access to vocational and senior secondary education, show encouraging coverage but reveal lingering qualitative and spatial disparities. In remote or sparsely populated villages, limited access to qualified teachers, learning materials, and relevant vocational tracks curtails educational outcomes. Policy solutions should include targeted expansion of institutions, alignment with local economies (e.g., tourism, agriculture, fisheries), and integrated youth employment strategies [40].
Electricity access remains a crucial determinant of quality of life and development potential. The spatial variation in electrification reflects uneven infrastructure rollout, particularly in peripheral villages. As a proxy for broader service delivery, electricity availability impacts educational attainment, business development, and household well-being [41]. Investing in localized, renewable energy solutions like solar mini-grids could bridge energy gaps and accelerate inclusive development.
The pattern of surface water access highlights ecological and livelihood vulnerabilities. Inadequate access undermines daily consumption, irrigation, and resilience to climate shocks. Strengthening watershed protection and water infrastructure—particularly in “Poor” and “Very Poor” villages—is essential for sustaining natural capital and mitigating spatial environmental inequality [42].
Institutional capital, represented by the proliferation of Village-Owned Enterprises (BUMDes), reflects rural governance and innovation progress. However, poor-performing villages reveal gaps in local capacity, underscoring the importance of tailored training and technical assistance. Strengthening BUMDes can enhance village autonomy, stimulate rural entrepreneurship, and anchor local economic development [43,44].
In public health, the low prevalence of epidemic diseases in rural areas contrasts sharply with higher rates in urban Labuan Bajo. This discrepancy may reflect both effective rural health governance and potential underreporting. Labuan Bajo’s status as a tourism hub necessitates stronger urban health infrastructure, disease surveillance, and preventive services [45]. Ensuring robust data collection systems across settings will be critical for monitoring spatial health inequalities.
Higher education access remains limited for residents of western and southern subdistricts. Strategies to promote inclusion include satellite campuses, distance learning platforms, and mobility subsidies. The integration of higher education planning with spatial poverty data can guide multisectoral interventions and support regional human capital development [46,47].
Finally, the success of agent-based banking models in Manggarai Barat offers lessons for other service sectors. While gaps remain in hard-to-reach areas, initiatives like mobile banking units, subsidized agent deployment, and infrastructure co-location with BUMDes could expand coverage. These innovations exemplify how cross-sectoral learning can enhance rural service delivery and poverty alleviation.
Overall, the spatially explicit analysis presented in this study provides actionable insights into the distribution of livelihood assets and deprivation in Manggarai Barat. Bridging these gaps requires integrated, multi-capital strategies aligned with local contexts. By investing in infrastructure, institutions, and ecosystem services, the regency can move closer to achieving sustainable, inclusive, and resilient rural development.
5.2. Construction and Interpretation of the Composite Poverty Index
The findings from the Composite Index of Poverty (CIP) underscore the complexity of rural poverty in Manggarai Barat Regency, where deprivation manifests in a spatially moderate but persistent manner. The prevalence of villages in the “Moderate” poverty category (CIP: 0.40–0.60) suggests a condition of chronic deprivation that lacks the dramatic indicators of extreme poverty. Nonetheless, it represents a significant barrier to well-being and development. This aligns with Chambers and Conway’s [1992] seminal definition of sustainable rural livelihoods, which emphasizes survival and the ability to cope with and recover from stress and shocks. Villages that hover near the upper boundary of the “Moderate” category may be particularly vulnerable to shocks, such as climate variability, economic downturns, or health crises, that could rapidly exacerbate their poverty conditions [16].
The use of a composite index based on livelihood capitals is consistent with the Sustainable Livelihoods Framework (SLF), which posits that poverty is multidimensional and driven by unequal access to human, social, physical, natural, and financial capital [15]. In this study, the high weight of Human Capital, particularly secondary education and vocational training, reinforces existing evidence that educational access and quality are pivotal in rural poverty alleviation [17,48]. The substantial contributions of vocational education infrastructure resonate with recent findings emphasizing the role of skills development in enhancing employability and entrepreneurship in rural contexts [49,50].
The spatial analysis reveals that certain villages consistently underperform across multiple indicators even within a relatively narrow band of poverty levels. These findings align with the growing body of literature arguing that poverty is both place-based and path-dependent [51,52]. In the case of Manggarai Barat, several subdistricts—such as Welak, Kuwus, Lembor Selatan, Mbeliling, and Ndoso—are not among the poorest regions when viewed through the lens of income or expenditure. However, their persistently high Composite Index of Poverty (CIP) values indicate structural disadvantages beyond conventional poverty measurements. These disadvantages may stem from geographic isolation, inadequate infrastructure, limited access to markets and services, and weak institutional support. Such conditions reflect what the literature refers to as geographic poverty traps or development traps, in which poverty becomes self-perpetuating due to spatial and systemic constraints [53]. As such, policy responses in these areas must go beyond income transfers or economic assistance, instead tackling the entrenched barriers that limit mobility and opportunity.
The relatively low weight assigned to Financial Capital in the AHP analysis reflects broader trends in rural Indonesia, where formal financial inclusion remains uneven despite policy advances [39]. Access to financial services, including credit, savings, and insurance, is essential for smoothing consumption and enabling productive investment [54,55]. The finding that financial indicators contributed less to the overall index suggests a lack of infrastructure and a potential mismatch between existing financial services and local livelihood needs.
From a natural capital perspective, the inclusion of mangrove presence and surface water diversity as key indicators reflects their role in both ecosystem service provision and climate resilience [56,57]. Villages with poor scores on these indicators are environmentally vulnerable and less able to buffer livelihood shocks, particularly those reliant on fisheries, agriculture, or ecotourism. This supports the argument by Adger [2003] that environmental degradation and poverty are tightly interlinked, particularly in peripheral rural economies [58].
The relatively strong performance of Social Capital, highlighted through indicators such as crime variation and community-based security systems, offers an essential insight into informal institutional resilience. As Putnam (2000) and Woolcock & Narayan (2000) have argued, social cohesion and local governance can substitute for weak formal institutions and play a critical role in poverty mitigation, especially in areas lacking consistent state presence [59,60].
Moreover, the CIP's utility lies in diagnosis and strategic planning. The index provides a spatially explicit template for place-based policy targeting, echoing Alkire, Roche, and Vaz (2017) call for multidimensional poverty indices to be used in subnational planning. Identifying high-CIP villages within an otherwise moderate poverty landscape enables targeted interventions that are both equitable and efficient. This spatially nuanced approach is essential for achieving the Sustainable Development Goals (SDGs), particularly SDG 1 (No Poverty), SDG 10 (Reduced Inequalities), and SDG 11 (Sustainable Cities and Communities) [61].
Finally, the absence of villages in the “High” or “Very High” poverty categories may indicate some degree of basic service reach and policy success, yet it also raises questions about data sensitivity and indicator calibration. As noted by Alkire and Foster (2011), the ability of a multidimensional poverty index to distinguish severity is crucial for effective policy response. Future refinements could incorporate temporal dynamics or shocks (e.g., COVID-19, climate extremes) to test the robustness of current classifications [17].
Even though this composite approach offers a robust analytical lens to examine rural poverty in its multidimensional and spatially differentiated forms, it confirms the critical role of human capital development, the persistent lag of financial and natural capital, and the importance of integrated, localized interventions. Addressing rural poverty in Manggarai Barat will require coordinated action across sectors, guided by empirically grounded, spatially explicit diagnostics such as the CIP.
6. Conclusions
This study provides a detailed look at poverty in Manggarai Barat Regency by creating a Composite Index of Poverty (CIP) based on the Sustainable Rural Livelihoods Approach (SRLA). The CIP combines indicators from five types of livelihood capital: human, social, natural, physical, and financial. This gives a better view of rural deprivation compared to traditional income-based measures. The results show that while absolute poverty is low in most villages, many communities face moderate deprivation. This situation makes them vulnerable to structural problems and risks from outside events.
The spatial analysis revealed significant inequalities in the distribution of assets. This is especially clear in natural capital, such as mangrove coverage and access to surface water, physical infrastructure like road quality and electricity, and financial access. These differences highlight challenges related to geographic isolation, local environmental issues, and institutional barriers that hinder adaptation and the ability to diversify livelihoods. On the other hand, stronger performance in human and social capital indicates areas of resilience that could be used to support broader strategies for reducing poverty.
The CIP has demonstrated utility as a diagnostic tool and a strategic instrument for spatially targeted and multisectoral policy design. High-CIP villages, even within a generally “moderate” poverty landscape, can be prioritized for interventions that align infrastructure investment, ecosystem management, education access, and financial services. The index thus aligns with the broader goals of the Sustainable Development Agenda, particularly those targeting poverty eradication, inequality reduction, and resilient rural development.
However, this study also highlights limitations and opportunities for future improvement. The results, which show no villages in the "very high" poverty category, raise questions about the sensitivity of the threshold and the ability of cross-sectoral indicators to identify hidden vulnerabilities. Incorporating temporal data, capturing post-shock dynamics (e.g., the impact of pandemics or climate extremes), and enhancing community-level data collection would strengthen the analytical precision of the CIP.
Resolving rural poverty in West Manggarai requires an integrated approach that focuses on spatially and contextually integrated strategies. The CIP framework presented in this study offers a strong foundation for such efforts, enabling policymakers and practitioners to identify where and how deprivation is most entrenched and which forms of capital most need support. Only through integrated, data-driven, and locally tailored interventions can sustainable, inclusive, and resilient rural development be realized in this and similar contexts across Indonesia.
Author Contributions
Conceptualization, A.G., R.E., A.F., and B.B.; methodology, A.G.; formal analysis, A.G.; investigation, A.G. and D.P.; resources, A.G.; data curation, A.G., R.E., A.F., and B.B.; writing—original draft preparation, A.G.; writing—review and editing, A.G.; visualization, D.P.; supervision, R.E., A.F., and B.B.; project administration, D.P.; funding acquisition, A.G. All authors have read and agreed to the published version of the manuscript.
Funding
This research received no external funding.
Data Availability Statement
All data generated or analyzed during this study are included in this published article.
Conflicts of Interest
The authors declare no conflict of interest.
References
- Roblek V, Kejžar A. A comprehensive examination of indicators for evaluating poverty and social exclusion. Discov Glob Soc [Internet]. 2025;3(1). Available from. [CrossRef]
- Ayele AW, Ewinetu Y, Delesho A, Alemayehu Y, Edemealem H. Prevalence and associated factors of multidimensional poverty among rural households in East Gojjam zone, Northern Ethiopia: a community-based cross-sectional study. BMC Public Health. 2025;25(1). [CrossRef]
- World Bank Group. Poverty & Equity Brief [Internet]. World Bank Group. 2019. Available from: https://databankfiles.worldbank.org/public/ddpext_download/poverty/33EF03BB-9722-4AE2-ABC7-AA2972D68AFE/Global_POVEQ_IDN.pdf.
- BPS-Statistics of Manggarai Barat Regency. Manggarai Barat Regency in Figures [Internet]. Labuan Bajo; 2024. Available from: https://manggaraibaratkab.bps.go.id/id/publication/2024/02/28/b3f41d3b859a25216d016797/kabupaten-manggarai-barat-dalam-angka-2024.html.
- Gai A, Ernan R, Fauzi A, Barus B, Putra D. Poverty Reduction Through Adaptive Social Protection and Spatial Poverty Model in Labuan Bajo, Indonesia’s National Strategic Tourism Areas. Sustain. 2025;17(2):1–17. [CrossRef]
- Hickel, J. The true extent of global poverty and hunger: questioning the good news narrative of the Millennium Development Goals. Third World Q [Internet]. 2016 May 3;37(5):749–67. Available from. [CrossRef]
- Béné C, Newsham A, Davies M, Ulrichs M, Godfrey-Wood R. Resilience, poverty and development. J Int Dev. 2014;26(5):598–623.
- Scoones, I. Sustainable livelihoods and rural development. Practical Action Publishing Rugby; 2015.
- Morse, S. Having Faith in the Sustainable Livelihood Approach: A Review. Sustainability. 2025;17(539):1–27. [CrossRef]
- Amaliah Y, Husni AHAA, Ansar MC, Chowdhury K. The research landscape of rural sustainable livelihood: a scientometric analysis. Front Sustain. 2025;6(May). [CrossRef]
- Natarajan N, Newsham A, Rigg J, Suhardiman D. A sustainable livelihoods framework for the 21st century. World Dev. 2022;155:105898. [CrossRef]
- DFID, GS. Sustainable livelihoods guidance sheets, Section 2. Framework. 2000.
- Sen, A. Development as Freedom (1999). In: Roberts JT, Hite AB, Chorev N, editors. The Globalization and Development Reader: Perspectives on Development and Global Change [Internet]. Second edi. Chichester: Wiley-Blackwell; 2015. p. 525–48. Available from: https://diarium.usal.es/agustinferraro/files/2020/01/Roberts-Hite-and-Chorev-2015-The-Globalization-and-Development-Reader.pdf#page=539.
- Serrat, O. The Sustainable Livelihoods Approach. In: Knowledge Solutions. Springer Singapore; 2017. p. 21–6.
- Scoones, I. Sustainable rural livelihoods: a framework for analysis. 1998. [Google Scholar]
- Chambers R, Conway G. Sustainable rural livelihoods: practical concepts for the 21st century. 1992.
- Alkire S, Foster J. Counting and multidimensional poverty measurement. J Public Econ. 2011;95(7–8):476–87. [CrossRef]
- Zanganeh M, Akbari E. Zoning and spatial analysis of poverty in urban areas (Case Study: Sabzevar City-Iran). J Urban Manag. 2019;8(3):342–54. [CrossRef]
- Farrugia, N. Conceptual issues in constructing composite indices. 2007. [Google Scholar]
- Saltelli, A. Composite indicators between analysis and advocacy. Soc Indic Res. 2007;81(1):65–77. [CrossRef]
- Álvarez-Gamboa J, Cabrera-Barona P, Jácome-Estrella H. Financial inclusion and multidimensional poverty in Ecuador: A spatial approach. World Dev Perspect. 2021;22:100311. [CrossRef]
- Liu M, Ge Y, Hu S, Stein A, Ren Z. The spatial–temporal variation of poverty determinants. Spat Stat. 2022. [CrossRef]
- Deng Q, Li E, Zhang P. Livelihood sustainability and dynamic mechanisms of rural households out of poverty: An empirical analysis of Hua County, Henan Province, China. Habitat Int [Internet]. 2020;99:102160. Available from. [CrossRef]
- Barman P, Sarkar B, Islam N. Livelihood assessment through the sustainable livelihood security index in Majuli river Island, Assam. GeoJournal [Internet]. 2025;90(3):105. Available from. [CrossRef]
- Anselin, L. Spatial econometrics: methods and models. Vol. 4. Springer Science & Business Media; 1988. [CrossRef]
- Tian J, Sui C, Zeng S, Ma J. Spatial Differentiation Characteristics, Driving Mechanisms, and Governance Strategies of Rural Poverty in Eastern Tibet. Land. 2024;13(7). [CrossRef]
- Liu M, Ge Y, Hu S, Hao H. The Spatial Effects of Regional Poverty: Spatial Dependence, Spatial Heterogeneity and Scale Effects. ISPRS Int J Geo-Information. 2023;12(12). [CrossRef]
- Alongi, DM. Mangrove forests: resilience, protection from tsunamis, and responses to global climate change. Estuar Coast Shelf Sci. 2008;76(1):1–13.
- Walters, BB. Mangrove forests and human security. CABI Rev. 2008;(2008):1–9. [CrossRef]
- Walters, BB. Local management of mangrove forests in the Philippines: successful conservation or efficient resource exploitation? Hum Ecol. 2004;32(2):177–95. [CrossRef]
- Primavera, JH. Integrated mangrove-aquaculture systems in Asia. Integr Coast Zo Manag. 2000;121–30.
- Brown B, Fadillah R, Nurdin Y, Soulsby I, Ahmad R. Case Study: Community Based Ecological Mangrove Rehabilitation (CBEMR) in Indonesia. From small (12-33 ha) to medium scales (400 ha) with pathways for adoption at larger scales (> 5000 ha). SAPI EN S Surv Perspect Integr Environ Soc. 2014;(7.2).
- Unesco. The United Nations World Water Development Report 2021: Valuating Water. 2021st ed. Paris: United Nations Educational, Scientific and Cultural Organization (UNESCO); 2021. 206 p.
- Choudhary N, Schuster RC, Brewis A, Wutich A. Household water insecurity affects child nutrition through alternative pathways to WASH: evidence from India. Food Nutr Bull. 2021;42(2):170–87. [CrossRef]
- Cairncross S, Valdmanis V. Water supply, sanitation and hygiene promotion (chapter 41). 2006.
- Dercon S, Gilligan DO, Hoddinott J, Woldehanna T. The impact of agricultural extension and roads on poverty and consumption growth in fifteen Ethiopian villages. Am J Agric Econ. 2009;91(4):1007–21. [CrossRef]
- Fan S, Chan-Kang C. Road development, economic growth, and poverty reduction in China. Vol. 12. Intl Food Policy Res Inst; 2005.
- Ritonga DHS. The Effectiveness Of Layanan Keuangan Tanpa Kantor Dalam Rangka Keuangan Inklusif (Laku Pandai) Study On Brilink Pt Bank Rakyat Indonesia (Persero) Tbk. North Sumatera Regional Office. Universitas Brawijaya; 2019.
- Demirgüç-Kunt A, Singer D. Financial inclusion and inclusive growth: A review of recent empirical evidence. World bank policy Res Work Pap. 2017;(8040).
- Psacharopoulos G, Patrinos* HA. Returns to investment in education: a further update. Educ Econ. 2004;12(2):111–34.
- Agency(IEA), IE. Energy Access Outlook Report. 2017. [Google Scholar]
- Rockström J, Falkenmark M, Folke C, Lannerstad M, Barron J, Enfors E, et al. Water resilience for human prosperity. Cambridge University Press; 2014.
- Adeningsih, SH. Capacity Building of Village-Owned Enterprises (BUMDes) in Encouraging Village Economic Welfare. Riwayat Educ J Hist Humanit. 2025;8(1):602–9. [CrossRef]
- Putra IRAS, Wibowo RA, Purwadi, Andari T, Asrori, Christy NNA, et al. Village-Owned Enterprises Perspectives Towards Challenges and Opportunities in Rural Entrepreneurship: A Qualitative Study with Maxqda Tools. Adm Sci. 2025;15(3):74. [CrossRef]
- Wulandari RD, Laksono AD, Nantabah ZK, Rohmah N, Zuardin Z. Hospital utilization in Indonesia in 2018: do urban–rural disparities exist? BMC Health Serv Res [Internet]. 2022;22(1):1–11. Available from. [CrossRef]
- Firmansyah MR, Antariksa A, Ridjal AM. Pola Ruang Pura Kahyangan Jawa Timur Dan Bali Berdasarkan Susunan Kosmos Tri Angga Dan Tri Hita Karana. Brawijaya University; 2017.
- Altbach, PG. Access means inequality. In: The international imperative in higher education. Springer; 2013. p. 21–4.
- Alkire S, Santos ME. Acute multidimensional poverty: A new index for developing countries. 2011.
- Subiyantoro H, Tarziraf A, Asmara A. The role of vocational education as the key to economic development in Indonesia. In: Proceedings of the 3rd Multidisciplinary International Conference, MIC. 2023.
- Chakravarty S, Lundberg M, Nikolov P, Zenker J. Vocational training programs and youth labor market outcomes: Evidence from Nepal. J Dev Econ. 2019;136:71–110. [CrossRef]
- Lanjouw PF, Tarp F. Poverty, vulnerability and Covid-19: Introduction and overview. Rev Dev Econ. 2021;25(4):1797–802.
- Kanbur R, Venables AJ. Spatial inequality and development overview of unu-wider project. 2005.
- Kraay A, McKenzie D. Do poverty traps exist? Assessing the evidence. J Econ Perspect. 2014;28(3):127–48.
- Collins D, Morduch J, Rutherford S, Ruthven O. Portfolios of the poor: how the world’s poor live on $2 a day. Princeton University Press; 2009.
- Ghosh, J. Microfinance and the challenge of financial inclusion for development. Cambridge J Econ. 2013;37(6):1203–19. [CrossRef]
- Barbier EB, Hacker SD, Kennedy C, Koch EW, Stier AC, Silliman BR. The value of estuarine and coastal ecosystem services. Ecol Monogr. 2011;81(2):169–93. [CrossRef]
- Dasgupta, P. The economics of biodiversity: the Dasgupta review. Hm Treasury; 2021.
- Adger, WN. Social capital, collective action, and adaptation to climate change. Economic Geography79: 387-404. 2003.
- Woolcock M, Narayan D. Social capital: Implications for development theory, research, and policy. world bank Res Obs. 2000;15(2):225–49. [CrossRef]
- Putnam, RD. Bowling alone: America’s declining social capital. In: Culture and politics: A reader. Springer; 2000. p. 223–34.
- Alkire S, Roche JM, Vaz A. Changes over time in multidimensional poverty: Methodology and results for 34 countries. World Dev. 2017;94:232–49. [CrossRef]
Figure 1.
Poverty Index on Each Indicator of SRLF.
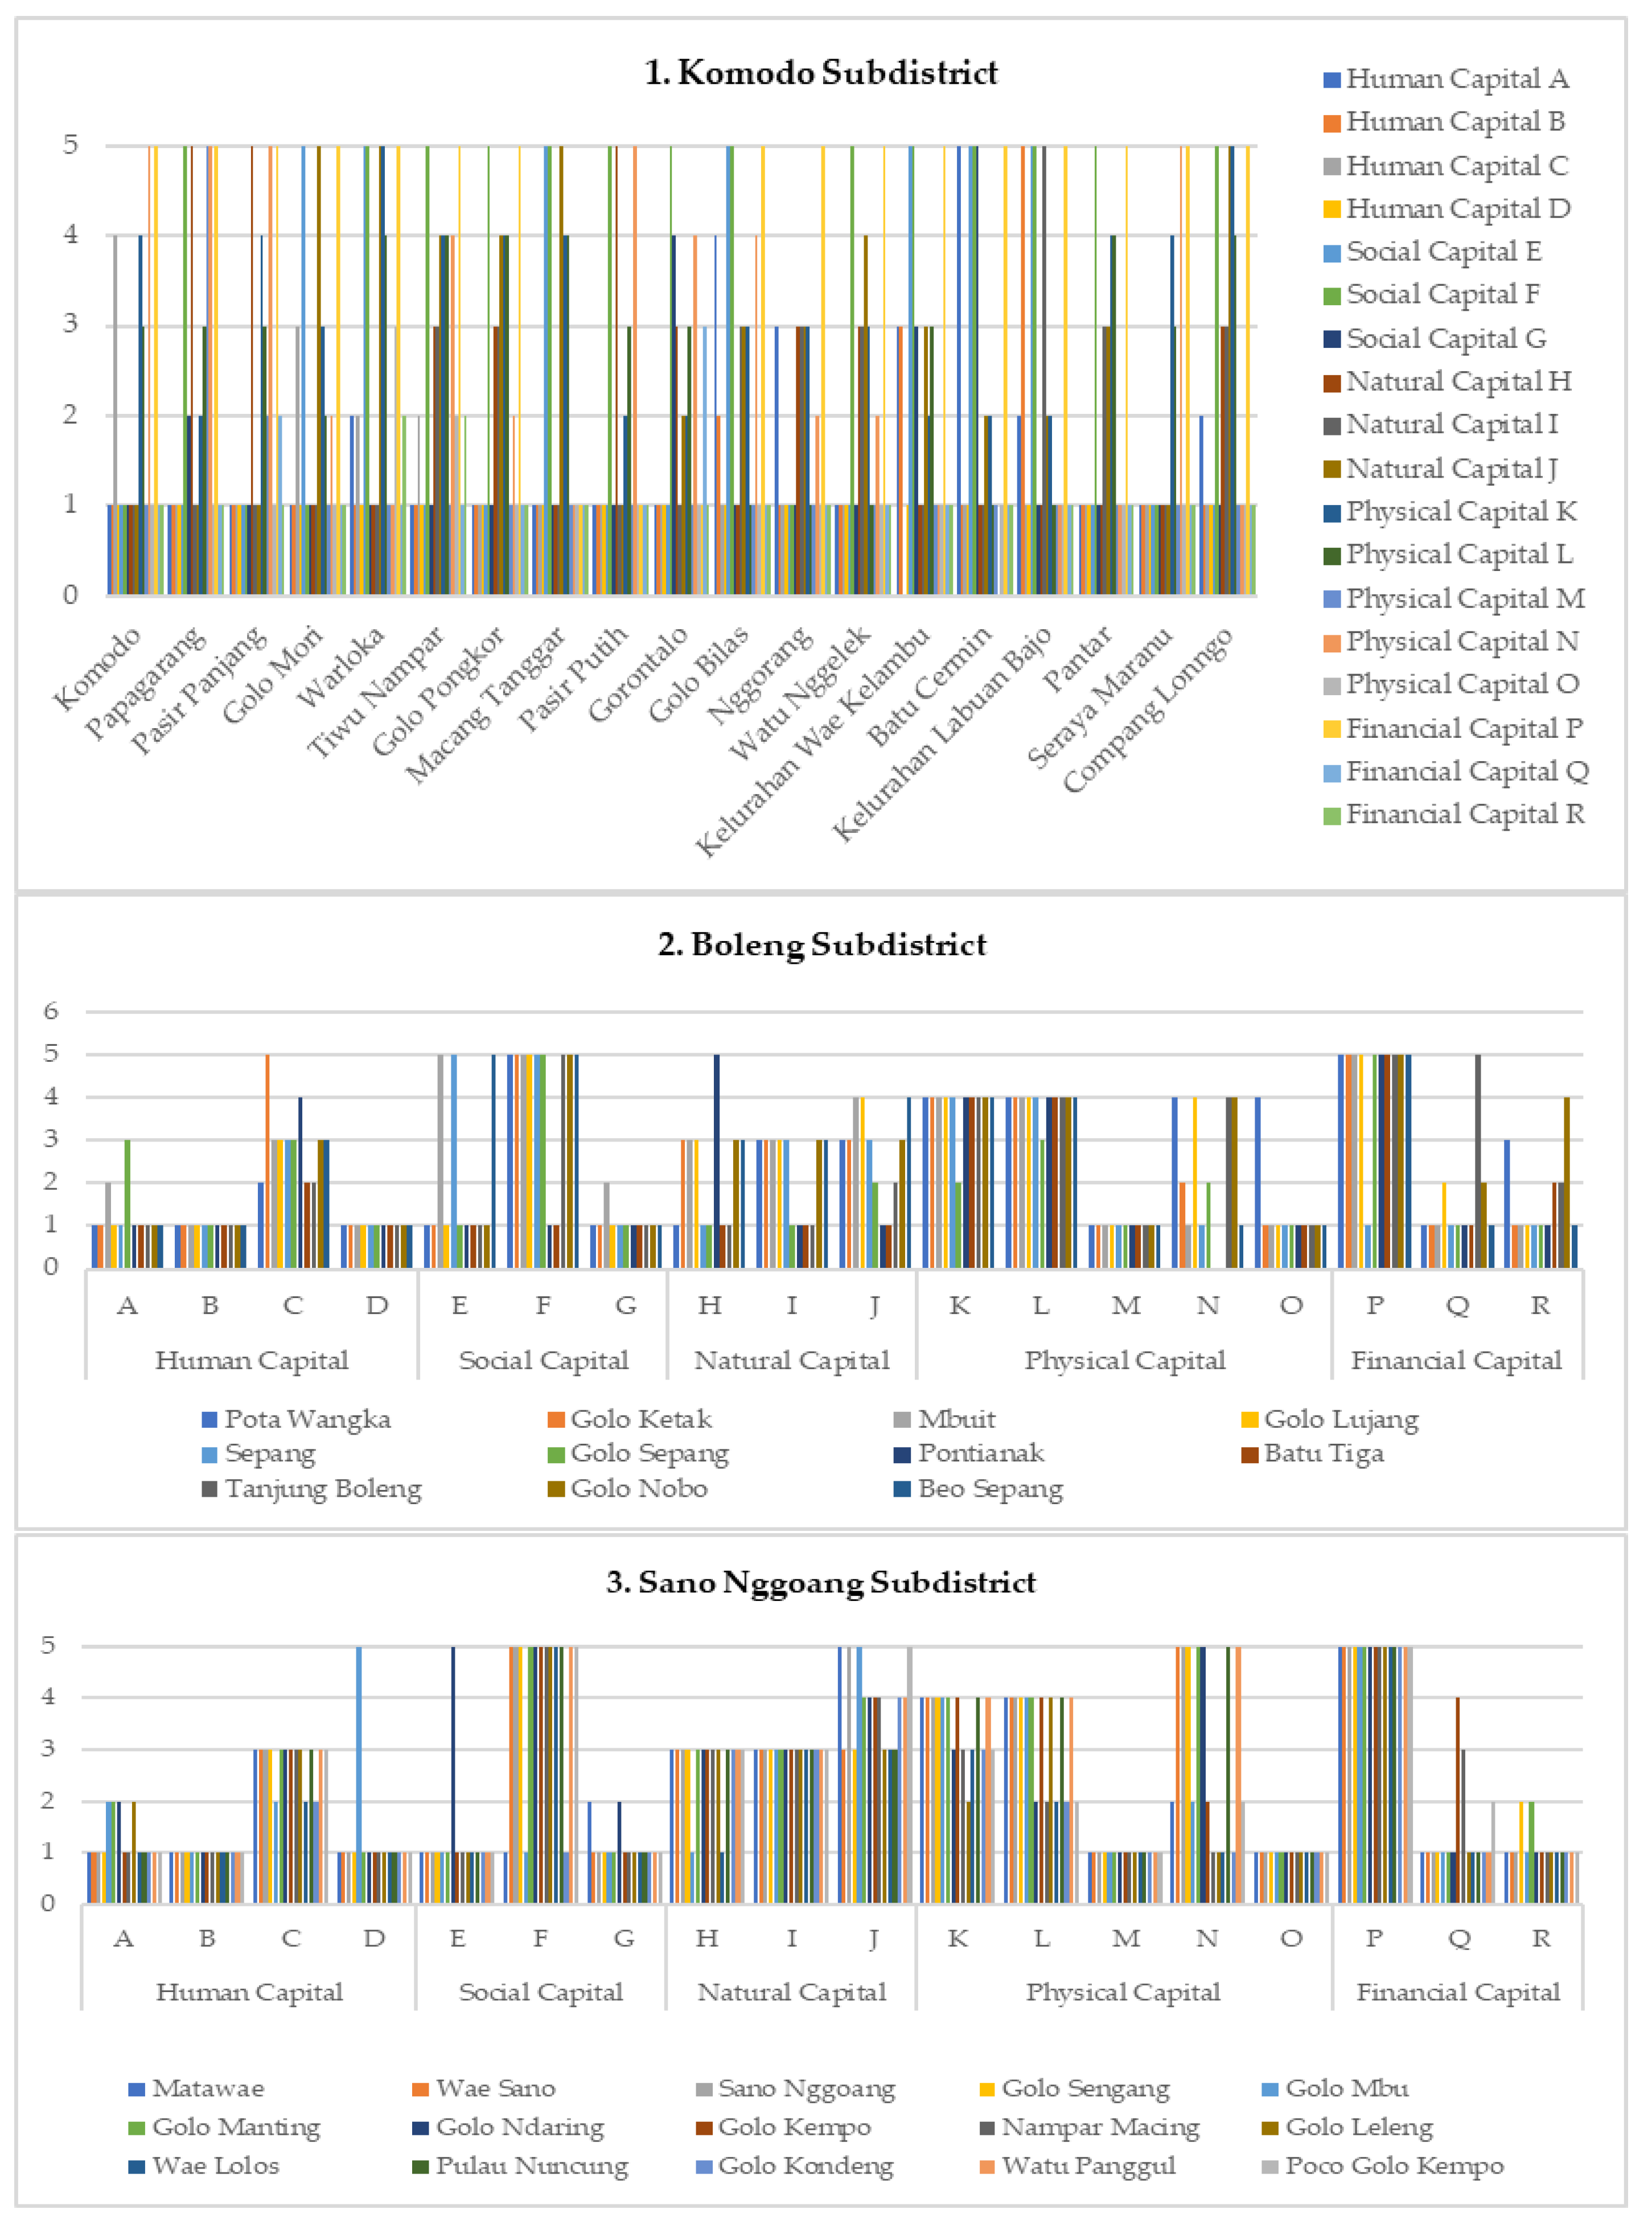
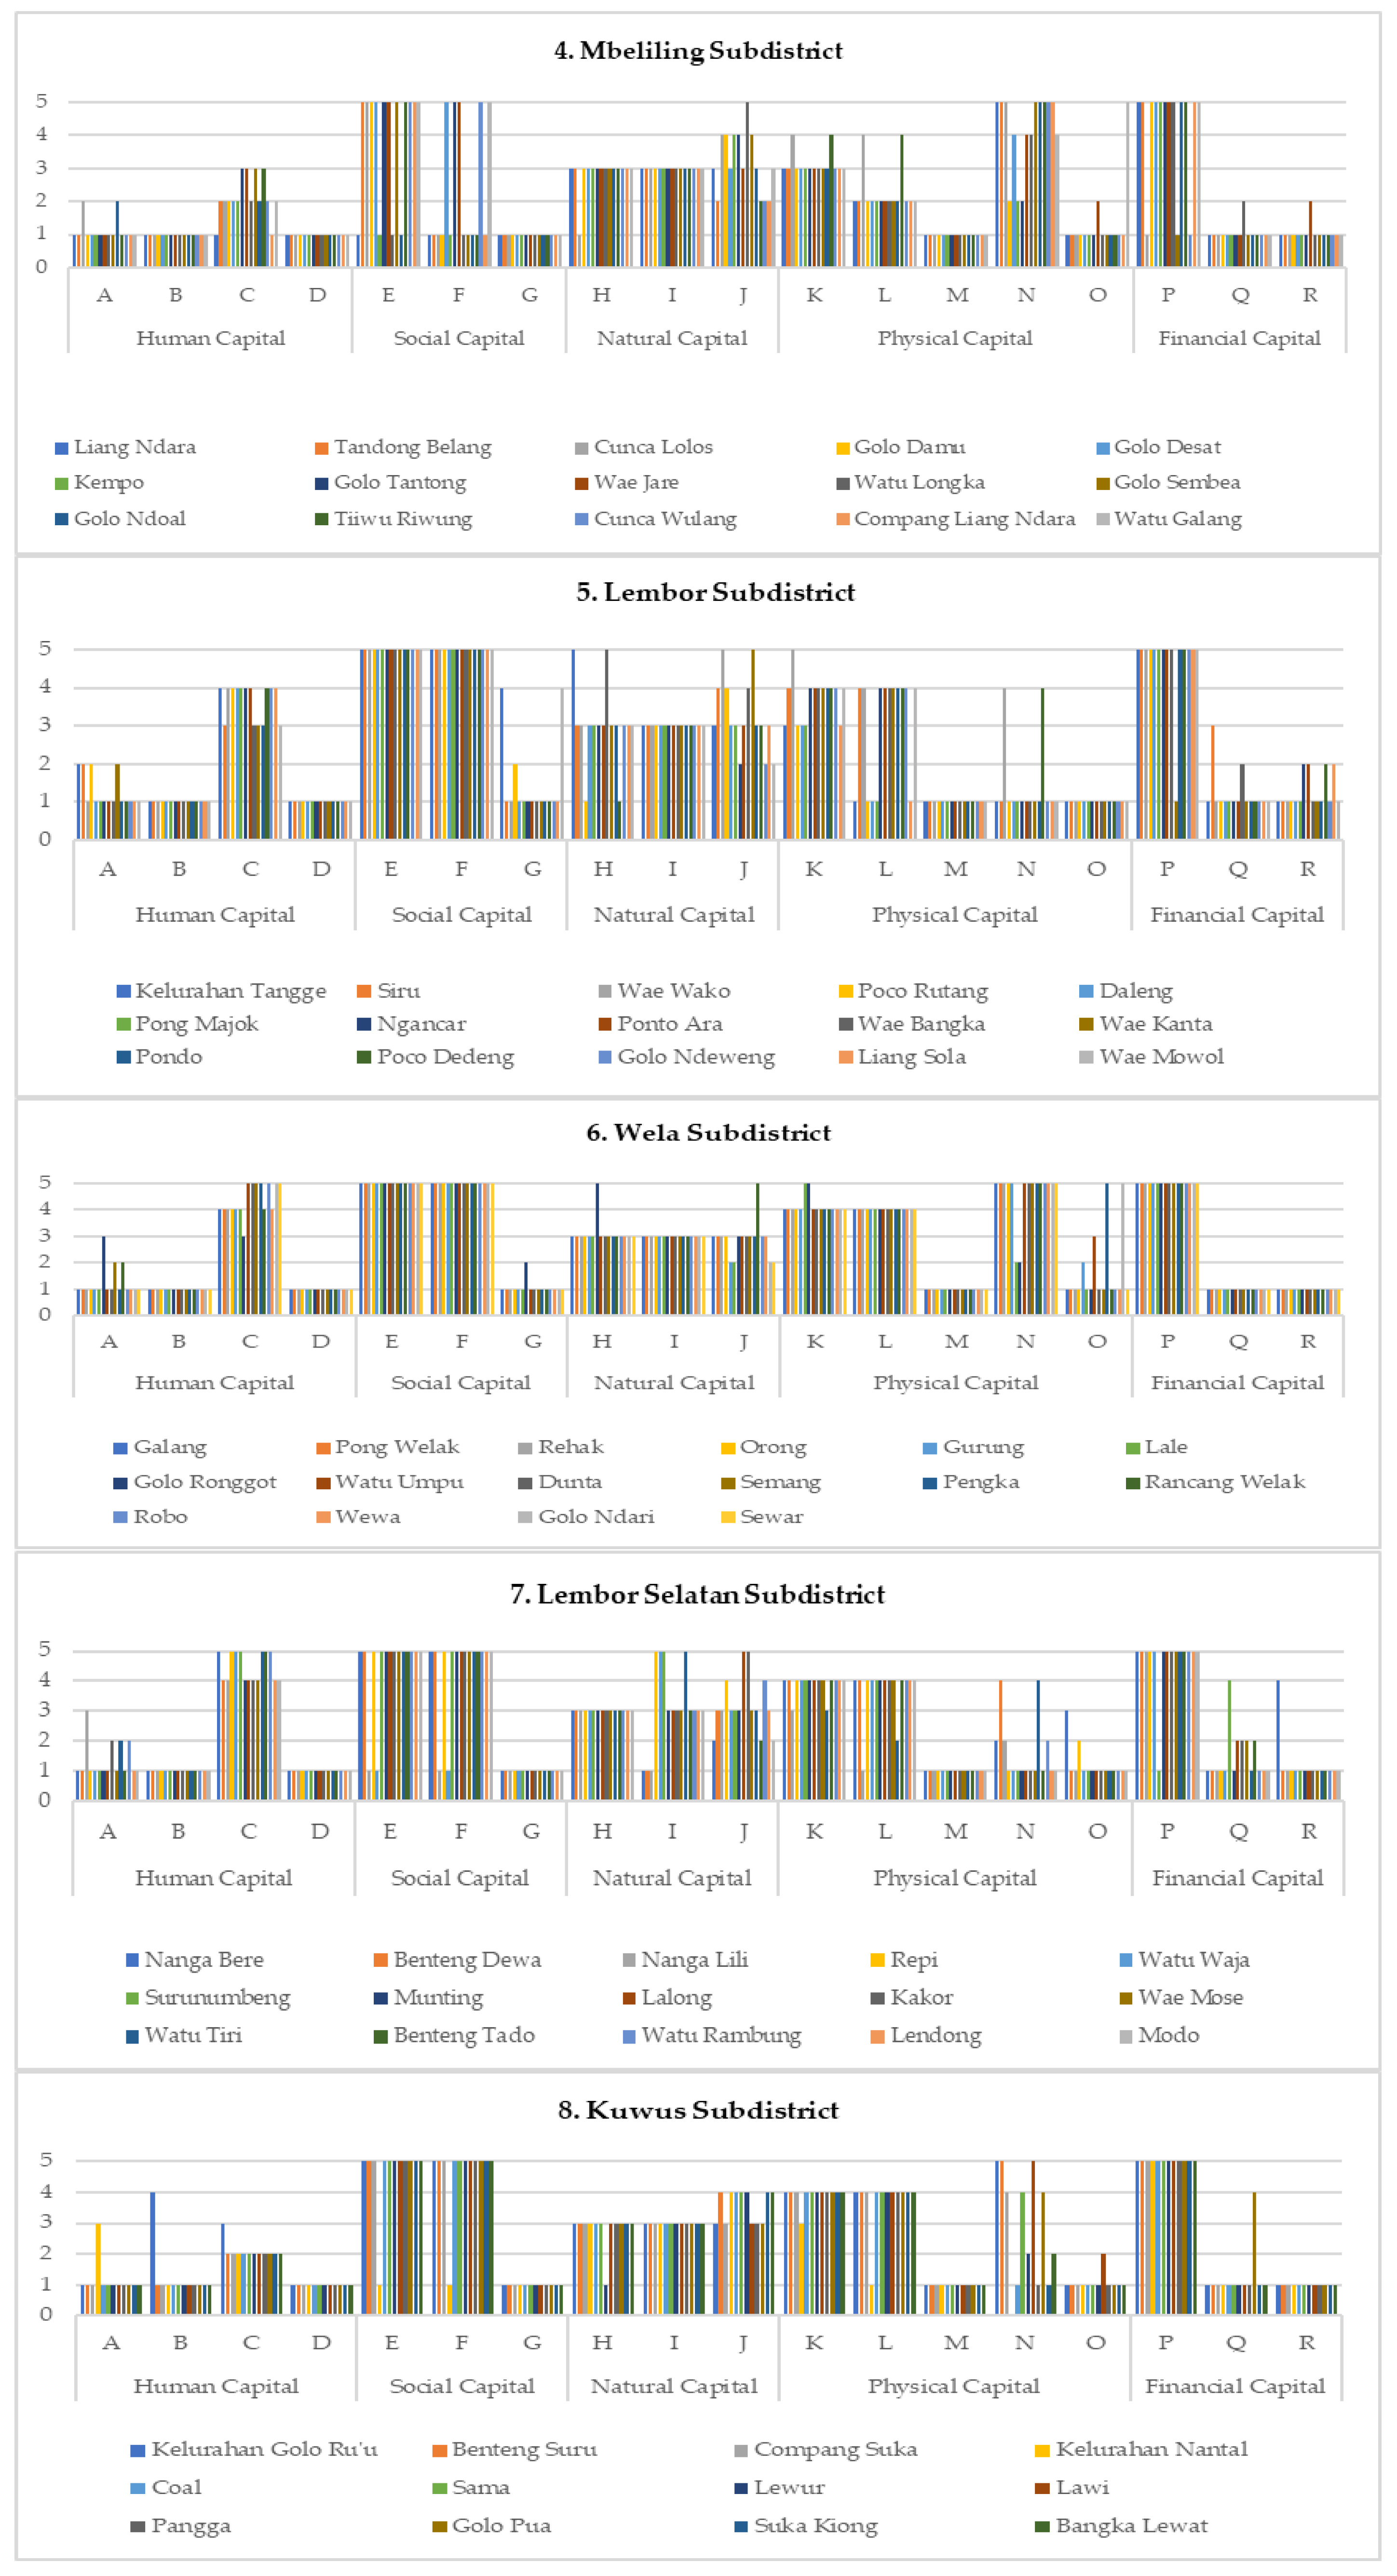
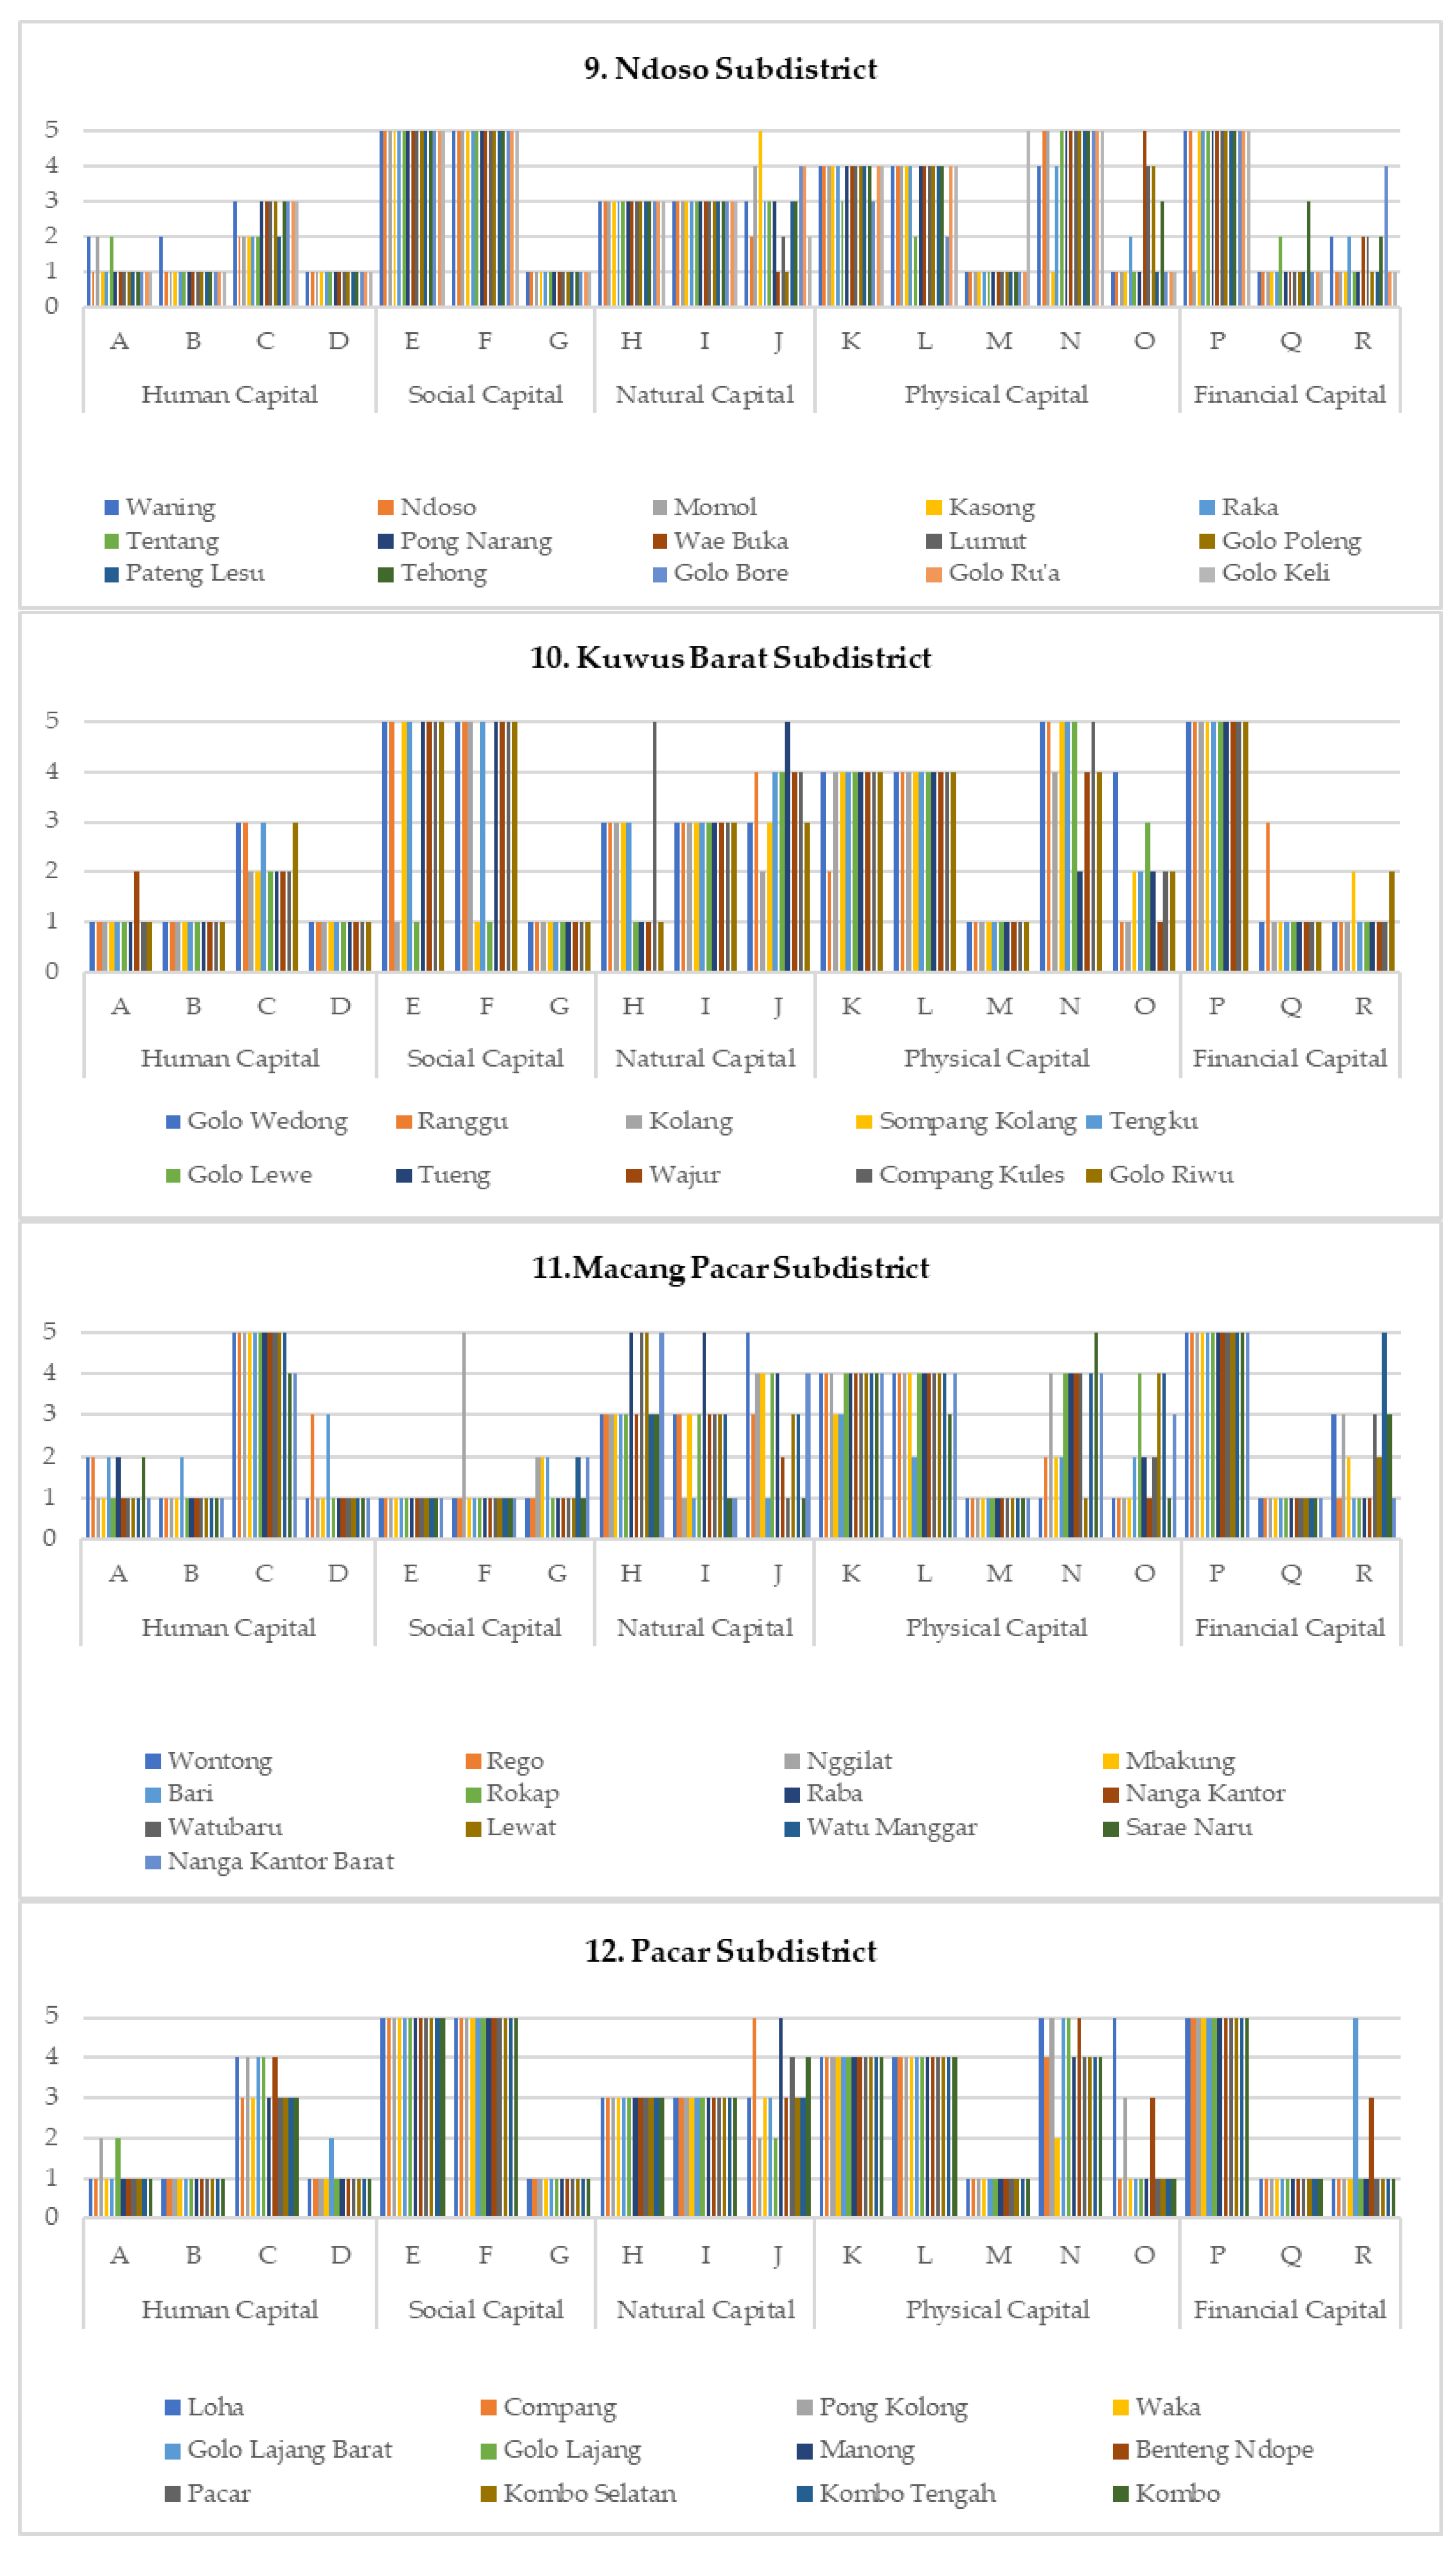
Table 1.
Capitals and Indicators of SRLA.
| Livelihood Capital | Indicators |
| Human Capital | Literacy rate, school attendance, number of high schools, distance to nearest university, incidence of extraordinary disease cases, etc. |
| Social Capital | Number of village-owned enterprises (BUMDes), group participation (proxied through the presence of community security measures), neighbourhood security activation, etc. |
| Natural Capital | Access to clean water (drinking and bathing), source of drinking water (categorized into five classes), presence of mangrove ecosystem, etc. |
| Physical Capital | Road accessibility, household toilet type, electricity usage (inverse of percentage of non-users), crime variation, distance to nearest hospital, etc. |
| Financial Capital | Household income level (via proxy), number of bank agents within radius, access to a credit institution, etc. |
Disclaimer/Publisher’s Note: The statements, opinions and data contained in all publications are solely those of the individual author(s) and contributor(s) and not of MDPI and/or the editor(s). MDPI and/or the editor(s) disclaim responsibility for any injury to people or property resulting from any ideas, methods, instructions or products referred to in the content. |
© 2025 by the authors. Licensee MDPI, Basel, Switzerland. This article is an open access article distributed under the terms and conditions of the Creative Commons Attribution (CC BY) license (http://creativecommons.org/licenses/by/4.0/).
Copyright: This open access article is published under a Creative Commons CC BY 4.0 license, which permit the free download, distribution, and reuse, provided that the author and preprint are cited in any reuse.


