
Submitted:
13 August 2025
Posted:
14 August 2025
You are already at the latest version
Abstract
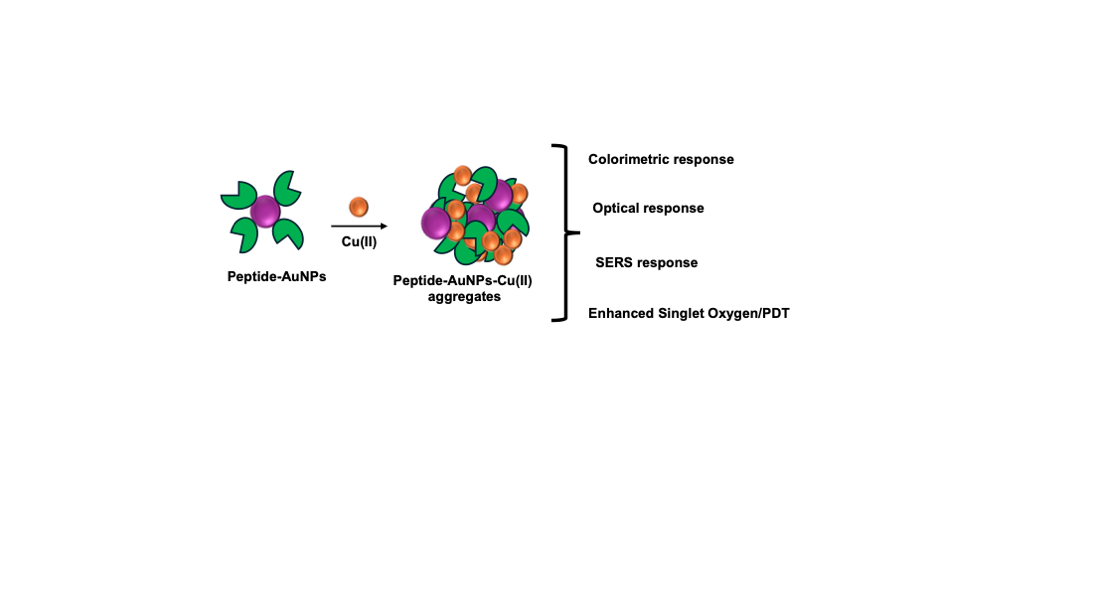
Excessive copper ions in the human body can cause variety of diseases such as gastrointestinal disorders, cirrhosis, and Alzheimer's diseases. Techniques like Inductively Coupled Plasma Mass, and Atomic Absorption Spectroscopy are available for copper detection, but the associated cost issue for sample preparation and labor limited their application for on-site detection. Herein we are reporting a versatile method for detecting copper ions using a peptide-functionalized gold nanoparticle sensor in combination with various optical spectroscopic techniques. The peptide (CW) showed a selective sensing ability for Cu (II) with visual colorimetric and optical spectroscopic changes as compared with other metal ions tested. CW showed a visual colorimetric response from colorless to light brown color after interaction with Cu (II). Converting CW to gold nanoparticle appended (CW-AuNPs) nanoplatform allowed a multimode detection platform for Cu (II) which utilizes colorimetric, optical spectrum changes, and surface-enhanced Raman spectroscopy (SERS) to enable highly sensitive sensing of Cu (II), even at extremely low concentrations (76 nM). CW-AuNPs exhibit a controlled aggregation property in the presence of Cu (II), resulting in the creation of hot spots for SERS-based detection. Moreover, the peptide unit attached to the gold nanoparticles serves both as a binding motif for Cu (II) and as a Raman reporter for Cu (II) sensing. Our comprehensive analysis, including solution-state and dry-mapping Raman spectroscopic studies, demonstrates remarkable picomolar sensitivity of the peptide-gold nanoparticle system for Cu (II) detection. Moreover, we prepared a paper test strip from CW-AuNPs and used it as a visual colorimetric platform for sensitive detection of copper ions. The CW-AuNPs-Cu (II) nanoaggregate was used as a photodynamic therapy agent (PDT) for invitro studies with a singlet oxygen quantum yield of 0.21%.
Keywords:
peptides
; gold nanoparticles
; copper
; colorimetric response
; Raman based detection
; singlet oxygen
; photodynamic therapy
1. Introduction
Metal ion sensing carries significant implications across diverse fields. While many metal ions contribute to vital biochemical reactions, a few pose hazards and toxicity risks [1,2]. Essential trace elements such as zinc, copper, and manganese are crucial for living organisms, yet their concentrations beyond optimal levels can lead to adverse effects [3]. Among these metals, copper finds wide industrial applications, but its environmental accumulation can result in severe environmental and health concerns [4,5]. Consequently, the development of sensitive and selective detection methods for copper becomes imperative to ensure environmental safety and human well-being. Although standard techniques like atomic absorption spectroscopy [6], inductively coupled plasma-mass spectrometry [7,8], and voltametric techniques [9] offer favorable detection limits for a broad concentration range, they suffer from drawbacks such as costly sample preparation, time-consuming procedures, and the need for bulky equipment . These techniques are unsuitable for on-site applications, and specialized methods are required for biological sample evaluation. Progress in science has yielded novel detection platforms, including colorimetric [10,11], fluorometric [12,13], magnetic resonance imaging [14,15], and strip-based techniques [16,17]for metal ion detection.
Gold nanoparticles (AuNPs) have gained significant attention as promising materials in biosensing applications due to their unique optical and electronic properties [18,19]. The utilization of colorimetric assays with AuNPs has become an appealing approach for detecting a wide range of analytes. Their strong surface-plasmon resonance peaks (SPR) enable monitoring of minute molecular level changes. The selection of AuNPs is justified by their ability to exhibit size tunable optical properties and undergo surface modifications. Notably, surface functionalization of AuNPs with peptides offers specific recognition and binding sites for target analytes [20,21]. Peptides are highly desirable ligands for biosensing applications due to their exceptional selectivity, stability, and multiple binding sites [22,23]. By combining the plasmonic nature of AuNPs with the metal binding properties of peptides, various metal ion sensors can be fabricated. Peptide capped AuNPs provide tunability for metal ion sensing by facilitating multipoint interactions between peptides and different metal ions. This assay platform offers advantages such as sensitivity, rapid in situ metal ion detection, and visible color changes resulting from NP aggregation. The surface functionalities can be adjusted using a range of peptides to induce such aggregation [24,25].
The alteration of SPR peaks of AuNPs directly determines the associated color change when they bind to metals. This change can be attributed to factors such as variations in particle size, shape, surface chemistry, or interparticle distance during aggregate formation [26]. Consequently, these modifications in the SPR peaks play a pivotal role in significantly enhancing the Raman scattering of molecules near the AuNPs or aggregates through Surface Enhanced Raman Spectroscopy (SERS) [27,28]. SERS-based sensors have proven to meet the essential requirements for metal ion sensing, including high sensitivity, selectivity, and suitability for on-site applications, and for biomedical applications [29,30,31]. The fundamental principle underlying this technique lies in the observed alterations in the Raman spectrum of the material adsorbed on the SERS active nanomaterial upon binding with the analyte. The distinctive spectral features of the adsorbed material, in combination with the SERS activity, enable the development of sensitive and accurate assays for detecting metal ions [32,33,34].
In this study, we present a peptide-Au-based nanoparticle system for the selective detection of Cu (II) ions in aqueous media. The dipeptide (CW) containing cystine and tryptophan as backbone without AuNPs showed excellent binding property towards Cu (II) ions. After conjugating CW with AuNPs, we demonstrated a colorimetric and Raman-based detection assay with high sensitivity and reproducibility for Cu (II) detection. While previous studies have explored the use of various nanoparticles for Cu (II) detection, the application of SERS for sensitive and onsite detection is relatively scarce. Our peptide-Au nanoparticle (CW-AuNPs) system provides a versatile platform for Cu (II) ion detection, employing multiple optical spectroscopy techniques and Raman spectroscopy. The nanoparticles were carefully designed to ensure excellent dispersity, indicating no non-specific interactions between the peptide and Au. Upon the addition of Cu (II) ions, we observed selective aggregation of the Au nanoparticles, distinguishing Cu (II) from other metal ions. Our solution-based SERS measurements demonstrated picomolar sensitivity, while dry-state Raman mapping studies showed femtomolar sensitivity.
2. Materials and Methods
2.1. General Techniques
1H, 13C NMR spectra were recorded on a Bruker Avance II 500 MHz NMR spectrometer at 25 °C. Absorption spectra were recorded on a Shimadzu UV-2600 UV-visible spectrophotometer in 3 mL quartz cuvettes with a path length of 1 cm. Emission spectra were recorded on Hitachi F7000 instrument with slit width of 2 nm. Circular dichroism (CD) spectra were recorded on JASCO J-815spectropolarimeter. Fluorescence lifetimes were measured by the time-correlated single-photon counting (TCSPC) technique on a Deltaflex modular fluorescence lifetime system from HORIBA Scientific using a nano-LED pulse diode light source. The instrument response function (IRF) of the setup was 200 ps and measured using 1% ludox (colloidal silica) solution. For dynamic light scattering analysis, a Malvern Zetasizer 2000 DLS spectrometer equipped with a 633 nm CW laser was employed. Transmission electron microscopic images were obtained using Hitachi (Tokyo, Japan), H-7100 series TEM instrument. Raman spectral data were acquired using an inverted Raman microscope (NOST, South Korea) equipped with a 60× objective lens (0.6 numerical aperture, Olympus, Tokyo, Japan). A 633 nm laser (CNI Laser, China) was employed to excite the sample solution. The resulting scattered Raman signals were collected through a 100 µm confocal motorized pinhole and directed to a spectrometer (FEX-MD, NOST, South Korea) fitted with a 1200 g mm⁻¹ grating. The final signal detection was carried out using a charge-modified device camera (Andor DV401A-BVF, Belfast, Northern Ireland).
2.2. Materials
Metal perchlorates, HEPES buffer, HAuCl4, NaBH4, 3-(4,5-dimethylthiazolyl-2)-25-diphenyl tetrazolium bromide (MTT), calcein AM, propidium iodide, singlet Oxygen Sensor green (SOSG), Methylene blue were purchased from Sigma-Aldrich.
2.3. Synthesis of CW
CW was prepared from previous literature reports [31,35]. CW is characterised using 1HNMR, 13CNMR, and by mass spectrometry. 1HNMR: (500 MHz, D2O) ppm δ: 3.06 (dd, J = 15.0, 7.5 Hz, 2H), 3.17 (m, 4H), 3.24 (m, 2H), 3.63 (s, 6H), 4.47 (m, 2H), 4.71 (br s, 2H), 7.09 (s, 2H), 7.18 (s, 4H), 7.45 (br d, 2H), 7.52 (br d, 2H).; 13CNMR (125 MHz, D2O): 26.48, 37.83, 51.49, 52.96, 53.94, 108.68, 111.94, 118.21, 119.35, 121.98, 124.48, 126.75, 136.10, 167.66, 173.19. HRMS calcd. for C30H37N6O6S2, m/z = 641.2211, obtained m/z = 641.2241
2.4. Metal Ion Binding Studies Using UV-Visible and Emission Spectroscopy
Solutions of CW were prepared in HEPES buffer (pH = 7.4) at a concentration of 10μM. Similarly, metal perchlorate solutions (60 μM) were also prepared in HEPES buffer. These metal ions were gradually added to the solutions of CW and for titration. UV-Vis absorption spectra were recorded throughout the process using a Shimadzu UV-2400 double-beam spectrophotometer. Titration was carried out until no further spectral changes were observed, indicating saturation. A similar experiment was performed for emission spectroscopy studies, were the samples excited at 290 nm and spectrum recorded using Hitachi F7000 instrument with slit width of 2 nm.
2.5. Determination of Stoichiometry of Complex
An equimolar Solutions of CW, and Metal perchlorate were prepared in HEPES buffer (10 μM). The mole fraction of CW was systematically adjusted from 0.1 to 1. After applying the necessary correction factors, the corresponding changes in absorbance were recorded and plotted as a function of receptor mole fraction.
2.6. Estimation of Binding Constant via Benesi-Hildebrand Approach
The binding affinity between compound 4 and dopamine was evaluated using UV-Visible spectroscopy, applying the Benesi-Hildebrand equation. This method enables the calculation of the association constant (K) by analyzing changes in absorbance. The relationship used is:
1/ A0-A = 1/(A0-A∞)K[G]+ 1/(A0-A∞)
In this equation, A and A0 are the absorbance values of CW in the presence and absence of Cu(II), respectively, while A∞ denotes the absorbance at saturation (infinite dilution with Cu(II)).
2.7. Calculation of Limit of Detection (LOD)
The limit of detection (LOD) for dopamine using compound 4 was determined based on the standard method:
LOD = K*Sb/k.
Here, K is a constant (typically 3), Sb represents the standard deviation of the blank (ligand-only) solution, and k is the slope derived from the calibration curve. This calculation provides a measure of the sensor’s sensitivity to low concentrations of Cu(II).
2.8. Preparation of CW-AuNPs
An aqueous solution of CW (3mL, 0.5 mM) was subjected to reduction using NaBH4 (0.2 mL, 10 mM) in the presence of HAuCl4 (1.8 mL, 0.5 mM). This reaction resulted in the formation of CW-AuNPs which was confirmed form the visual response of the reaction from colorless to light pink color.
2.9. SERS-Based Detection
For the surface-enhanced Raman scattering (SERS)-based detection of Cu(II), CW-AuNPs (50 μg) was incubated with varying concentrations of Cu(II) ranging from 10⁻6 M to 10⁻15 M. These samples were then drop-cast onto glass slides using a silicone isolator. Raman spectra were recorded using a 633 nm laser (6.8 mW, 10 s exposure time) and a 60× objective lens. Following drying, the solid residues containing CW-AuNPs and bound Cu(II) were subjected to Raman mapping. A region approximately 1.5–2.0 mm in diameter on each glass slide was scanned at 25 × 25 pixels resolution, with 10 seconds of exposure per pixel. Raman mapping images were generated based on the intensity at 1414 cm⁻¹.
2.10. Investigation of Singlet Oxygen Generation
Stock solutions of photosensitisers and the reference dye, methylene blue (MB), Singlet Oxygen Sensor Green (SOSG) were prepared in water. In a typical experiment, 1.8 mL of the aqueous photosensitizer solution was transferred to a cuvette, followed by the addition of 0.2 mL of SOSG solution. After recording the initial fluorescence, the sample was exposed to light from a Xenon lamp equipped with a 475 nm cut-off filter. The increse in emission for SOSG 520 nm was tracked over time to evaluate singlet oxygen generation.
2.11. Cell Culture
The breast cancer cell line f was maintained in Dulbecco’s Modified Eagle’s Medium, supplemented with 10% fetal bovine serum and 1% antibiotic–antimycotic solution. The cultures were incubated at 37 °C in a humidified atmosphere with 5% CO2 and subcultured twice a week.
2.12. Live and Dead Cell Assay
MDA-MB-231 cells were cultured in 24-well plates at a density of 20,000 cells per well and incubated overnight at 37 °C with 5% CO₂. The next day, the cells were exposed to CW-AuNPs-Cu(II) at a concentration of 50 μg/mL and incubated for 1 hour. Afterward, the wells were rinsed with PBS, followed by irradiation using an 808 nm laser at 2 W/cm² for 1 minute. The cells were then returned to the incubator and maintained overnight under the same conditions. On the third day, post-treatment, the cells were again washed and stained with 1 μM calcein AM and 2 μM propidium iodide and fluorescence imaging was performed.
3. Results
3.1. Characterisation and Photophysics for CW
CW was synthesized following previous literature reports and were characterized by 1H, 13C-NMR and mass spectrometry technique (Scheme S1, Figures S1–S3). CW was fully soluble in water and in HEPES buffer due to the presence of free amino groups in the backbone. CW exhibited an absorption peak at 290 nm, corresponding to the tryptophan unit (Figure S3A). Additionally, excitation at 290 nm resulted in a monomer emission band at 330 nm corresponds to tryptophan fluorescence (Figure S3B). CD spectral studies indicated a random coil structure for CW, with a positive band at 220 nm and a negative band at 197 nm (Figure S3C). The design strategy for CW relies on the metal ion binding property of the disulfide bond, free amine group and the ability of indole unit to form cation-pi interactions. Furthermore, the fluorescence properties of tryptophan make it suitable as a signaling unit after the binding event. The disulfide bond can be easily cleaved using reducing agents, enabling the thiolate peptide to be anchored to AuNPs for sensing applications by taking advantage of the surface plasmon properties of AuNPs for sensing applications.
3.2. Metal Ion Detection Using Spectroscopic Techniques
Following the characterization of CW, we proceeded to examine the optical spectroscopic response of CW when exposed to various metal ions in HEPES buffer (10 mM, pH 7.5). Among the various tested metal ions (Na(I),K(I), Cs(I), Mg(II), Ba(II), Ag(I), Cd(II), Zn(II), Pb(II), Mn(II), Cu(II), Hg(II), Fe(II), Co(II), Fe(III)); Cu (II) was found to induce changes in the absorption spectra as shown in Figure S5A. The addition of Cu (II) resulted in a red shift in the absorption spectrum, accompanied by the emergence of new absorption bands at 460 nm (Figure 1A). These higher wavelength absorption bands indicated an interaction between Cu(II) and CW, resulting a metal-induced aggregation of CW. This aggregation resulted in a slight color change from colorless to light brown for the Cu(II)-CW aggregates (Figure 1A inset). To confirm the peptide aggregation, scanning electron microscopy studies were conducted, revealing changes in the morphological features of CW (Figure 1B-C). CW showed vesicle like morphology with an average diameter of vesicle from 700-800 nm (Figure 1B). It is widely acknowledged that peptides containing tryptophan can form vesicles due to the pi-pi interaction of indole rings [31,36]. However, the interaction of Cu(II) disrupted this pi stacking due to the strong binding of Cu (II) with the indole rings resulted in aggregation of CW (Figure 1C) [23,31]. Consequently, the peptide aggregation caused discernible chiroptical changes in the CD spectrum of CW, characterized by an inversion of CD signal by the addition of Cu (II) (Figure 1D). This chiroptical changes is due to the structural rearrangement and conformational changes in CW because of Cu(II) binding. There are studies which showed that copper binding to amyloid-β peptides can induce β-sheet formation with a chiroptical changes in the spectroscopic signals, in a similar way CW showed a chiral optical inversion after Cu(II) binding [37,38].
Emission spectroscopy studies provided further insights into Cu (II) sensing. Among the various tested metal ions introduction Cu (II) resulted in a reduction of fluorescence intensity at 330 nm, after the Cu (II) interaction (Figure 2A and Figure S5B). Notably, the addition of Hg (II) also led to fluorescence quenching, suggesting their ability to bind with CW. To confirm this binding properties in detail we performed time-resolved spectroscopy experiments for CW with Cu(II) and Hg(II). The studies showed the observed quenching after Cu (II) binding is due to a static type since there was no change in the lifetime of the monomer emission peak at 330 nm after the addition of Cu (II), indicating a complex formation between CW and Cu (II) (Figure 2B, Table S1). Whereas addition of Hg(II) induced a change in fluorescence lifetime for CW, indicate there is a dynamic quenching which can be attributed to the random collison between CW and Hg (II) [23,31]. Thus, the observed change in fluorescence with Hg(II) is due to the paramagnetic properties of Hg(II) rather than complex formation with CW (Table S1). The response of CW to Cu (II) exhibited linearity within the concentration range of 0 to 6.0×10⁻⁷ M, with a detection limit of 0.3 μM (Figure S6A). The association constant for CW with Cu (II) was calculated using the BindFit model for supramolecular interactions [39,40]. The supramolecular BindFit model showed an accurate fitting data for a 1:1 stoichiometry with an association constant of 4.91×10⁴ M-1 which was further supported by the Benesi-Hildebrand association constant values (4.86×10⁴ M-1) (Figure S6B-C). The stoichiometry of CW-Cu(II) complex was confirmed further by Jobs plot analysis, and it showed a 1:1 stoichiometry with an inflation points at 0.5 molefraction value (Figure S6D).
The binding mode of Cu (II) with CW was investigated through 1HNMR studies in D20 (Figure 2C). CW showed distinctive NMR peaks for the -S-CH2 proton at 3.26, and 2.98 ppm. Addition of 0.5 equivalent of Cu (II) resulted in down field shift of the –S-CH2- protons by 0.3 ppm indicating a strong interaction between Cu (II) and –S atom in Cystine moiety. Further addition of Cu (II) resulted in an increased multiplicity of the –S-CH2- protons. The aromatic protons in the tryptophan moiety showed considered up field because of the Cu (II) binding after addition of 2 equivalents of Cu(II). It’s well known that tryptophan can induce cation-pi interactions, and this interaction induced an up-field shift of the aromatic protons due to the developed ring current in tryptophan moiety after Cu(II) binding.
To validate the complex formation, we have performed density functional theory (DFT) calculations for CW-Cu (II) complex (Figure 2D). The DFT studies were performed using Gaussian 09 implying B3LYP functional. C, N, O, S and H atoms were6-31G(d) basis set while Cu was treated with Lanl2dz basis set. DFT studies showed that Cu(II) (green color) possess a distorted square pyramidal structure, where Cu(II) ions were coordinated with one of the sulphur atoms from cysteine (yellow color), indole carbon atoms (grey color), indole nitrogen atom (blue color) and with carbonyl oxygen atoms (red color). It should be noted that Cu(II) form a three membered ring structure with indole ring from tryptophan, indicating a delocalized pi electron cloud for the stabilization. Thus, the observed complex multiplicity in NMR spectra for the S-CH2 proton and the upfield shift for aromatic indole protons can be explained as follows from the DFT studies. The NMR resonance peaks for -S-CH2- in the complex is due to the presence of both uncomplexed and complexed -S-CH2- with Cu (II) ions with CW. Only one of the -S- atom is involved in coordination with Cu(II). The up-field shift observed for the indole aromatic ring proton is due to the ring current developed in the indole moiety after Cu (II) binding.
3.3. Surface Plasmon Resonance Based Detection
In recent years, there has been a significant advancement in the field of sensing applications with the development of nanoparticles. These nanoparticles have gained attention due to their surface plasmon resonance peaks (SPR), which exhibit a strong and easily detectable color change with analytes. This unique characteristic allows for a straightforward and practical nanoparticle-based detection technique. Among various nanoparticles, gold nanoparticles (AuNPs) showed potential sensing applications since it offers advantages such as affordability, a wide range of color tunability and easy surface modifications for sensing applications. The colorimetric response observed in nanoparticle-based detection techniques is attributed to two main factors. Firstly, the color change occurs because of the direct interaction between AuNPs and the analyte being detected [18]. Alternatively, the analyte may interact with surface-capped functionalities on the AuNPs, leading to the aggregation of nanoparticles [41]. To enhance stability and introduce desired functionalities, ligands are often added to the surface of AuNPs such as amines, thiols, hydroxyl, etc. This intrigued us to investigate effect of disulfide bond (-S-S-) in CW which can be easily reduced to thiol -SH bond and can attach to AuNPs [42]. This modification not only imparts stability but also enhances the detection sensitivity for metal ions through the strong coupling effect of SPR bands from Au and the absorption features of CW. Consequently, the colorimetric response of AuNPs can be effectively utilized for the detection of Cu (II).
3.3.1. Synthesize of CW-AuNPs and Photophysics
An aqueous solution of CW (3mL, 0.5 mM) was subjected to reduction using NaBH4 (0.2 mL, 10 mM) in the presence of HAuCl4 (1.8 mL, 0.5 mM). This reaction resulted in the formation of CW-AuNPs which was confirmed form the visual response of the reaction from colorless to light pink color (Figure 3A inset). The UV-Visible spectrum exhibited a SPR band at 550 nm indicating the presence of AuNPs (Figure 3A). To determine the size of the AuNPs, transmission electron microscopy (TEM) and dynamic light scattering (DLS) experiments were performed. CW-AuNPs showed a hydrodynamic diameter of 105.63 nm with a polydispersity index of 0.082, indicating a highly disperse and stable particles (Figure 3B). TEM analysis revealed an average size of 45.1 nm for CW-AuNPs (Figure 3B inset). Fluorescence spectra were recorded for CW-AuNPs, and excitation of CW-AuNPs at 290 nm, showed an emission spectra with maximum at 405 nm (Figure 3C). Compared with the emission spectra of CW, the CW-ANPs showed emission peak at 405 nm indicate a strong aromatic π-π stacking interactions on the metal surface resulting in an excimer emission peak rather than monomer emission compared to CW [43].
To investigate the capping of CW onto the surface of the AuNPs, Fourier Transform Infrared Spectroscopy (FTIR) and Raman spectroscopy were utilized. FTIR studies showed the characteristic peptide peaks on the surface of AuNPs (Figure S7). IR peaks at 1639 and 1522 cm-1 corresponds to the amide I and amide II bending vibrations from the CW functional group. A similar IR peaks were observed in the CW-AuNPs with slight shift in the peak positions such as 1630 for amide I stretching and 1528 for amide II bending indicated successive capping of CW on AuNPs. Raman spectroscopy was used to provide additional evidence for the capping of CW on the AuNPs (Figure 3D). The characteristic Raman peak at 497 cm-1, corresponding to the disulfide bond, was absent in the CW-AuNPs spectrum, indicating the formation of a -S-Au bond. The peaks observed at 1010 indole ring breathing vibration, 1270 and 1326 corresponds to the -CH rocking vibrations in the Raman spectrum were attributed to the Raman peaks of tryptophan which further confirmed the successful capping of CW on the surface of AuNPs [44]. The slight shifts in peak position of CW-AuNPs compared with CW indicates the interaction of CW with AuNPs.
3.3.2. Metal Ion Sensing for CW-AuNPs
Subsequently, our research focused on exploring the potential of CW-AuNPs as a means of detecting metals in HEPES buffer solution (10 mM, pH 7.5). Among the various metal ions tested, the introduction of Cu(II) to CW-AuNPs triggered a noticeable color change from pink to bluish, due to the plasmonic properties of Au (Figure 4A). Addition of Cu(II) resulted in dramatical changes in the absorption spectrum for CW-AuNPs, with the formation of absorption bands at higher wavelengths (Figure 4B). The formation of higher wavelength absorption band indicated the aggregation of AuNPs as it was visible from the observed color change from pink to blue. There were no changes in color and absorption spectrum features of CW-AuNPs by the addition of other metal ions, indicating the selectivity of CW-AuNPs for Cu (II) detection because of the peptide binding moieties on the surface of AuNPs. CW-AuNPs showed a linear relation with the absorbance at 550 nm various concentrations of Cu(II) from with a limit of detection 0.076 μM for Cu(II) (Figure 4C). There is a visual colorimetric response was observed depending on the concentration of Cu(II) added in to CW-AuNPs due to the strong coupling of SPR properties of CW-AuNPs with metal ions (Figure 4C inset).
As another detection mode next we have utilized the fluorescence from CW-AuNPs as a signal reader for the copper detection. The excimer peak at 410 nm corresponding to the tryptophan excimer quenched after Cu(II) addition indicated a strong interaction between CW-AuNPs and Cu(II) (Figure 4D). By incorporating CW into AuNPs, we achieved an enhanced sensitivity for the copper detection as compared with CW alone. The selectivity of CW-AuNPs with various metal ions were further validated from the colorimetric, UV and emission-based studies, but CW-AuNPs showed a selectivity towards Cu(II) (Figure S8A-B). Through competitive binding experiments with other metal ions, we demonstrated that CW-AuNPs can selectively detect Cu(II), even in the presence of other metal ions (FigureS8A-B). TEM studies showed that addition of Cu(II) induced aggregation of NPs and which supports the formation of higher wavelength absorption bands and the observed colorimetric response with Cu(II) (Figure 4E).
3.3.4. Paper Strip Based Colorimetric Response for Cu(II)
Paper strip-based sensing platforms offer a low-cost, portable, and user-friendly approach for detecting metal ions, making them ideal for on-site and point-of-care applications. These strips require minimal sample volume and enable rapid visual readouts through color changes, eliminating the need for complex instrumentation. Their biodegradable nature ensures environmental sustainability, while the surface can be easily functionalized for selective and sensitive detection. Additionally, they demonstrate good shelf-life and can be engineered for multiplexed sensing, further enhancing their practicality in diverse analytical settings.
For practical application we have developed test strips coated with CW-AuNPs. For this a Whatman filter paper was immersed in a solution of CW (3 mL, 0.5mM) and incubated for an hour at room temperature. Afterwards a solution of HAuCl4 (1.8 mL, 0.5 M) was added on to the test paper and left for an hour for adsorption. Followed by this period NaBH4 (10 mM) was added on to the test paper, an immediate visible color change was observed on the filter paper from white to light pink. The test strips were air dried at room temperature. Upon treatment with Cu(II) the pads exhibited a light bluish color compared to the untreated (blank) strips, as illustrated in Figure 5A. These visually responsive test strips present a user-friendly, cost-effective, and environmentally sustainable approach for Cu(II) detection. To assess storage stability, the strips were kept at for a duration of one month, during which they retained their functionality, indicating strong shelf life and reliability for detecting Cu(II). The test strips demonstrated high selectivity toward Cu(II) with a distinct color transition from pink to blue and eventually to dark blue with increasing concentrations of Cu (II) (Figure 5B).
3.4. Surface-Enhanched Raman Spectroscopy Based Detection
Controlled manipulation of nanoparticle aggregation can significantly amplify the formation of localized electromagnetic fields, commonly known as "hot spots," which are highly advantageous for SERS applications. Figure 6A illustrates the underlying concept of using SERS nanoprobe technology to detect Cu(II). This detection relies on the unique interaction between CW and Cu(II), resulting in alterations in the SERS intensity of CW appended to AuNPs. These intensity changes are directly proportional to the concentration of Cu(II). Cu(II) can bind with the free amino groups and the indole moiety of CW strongly and resulted in aggregation of CW-AuNPs. As shown in Figure 3E, CW powder sample barely showed any vibrational characteristics in the Raman spectrum. But incorporation of CW to AuNPs showed vibrational peaks with an enhanced Raman signal intensity for the characteristic functional moieties in CW. In this context, when CW-AuNPs are exposed to Cu(II) ions, they exhibit an aggregation phenomenon, by leveraging this aggregation behavior, the detection of Cu(II) can be achieved using more sensitive SERS technique. The addition of Cu(II) induces changes in the characteristic Raman peaks of CW-AuNPs, and these changes exhibit a linear correlation with the concentration of Cu(II). Raman analysis was performed on both the solution and solid states (Raman mapping) in the presence of Cu(II). The aggregation of CW-AuNPs with Cu(II) leads to an enhancement in the Raman intensity, thus improving the SERS signal of the system. Here CW act as a Raman reporter and which showed enhanced SERS due to aggregation of AuNPs by Cu (II) to form the so-called hot spots.
As shown in Figure 6B, addition of Cu (II) increased the SERS intensity of CW-AuNPs. To optimize the sensitivity of copper ion detection, we relied on the SERS peak at at 1416 cm-1 because of its high intensity after copper-induced aggregation. According to the strategy of Cu(II) detection, the concentration of Cu(II) plays an essential role in aggregation of CW-AuNPs and in the formation of hot-spots for SERS based detection. Thus, Raman spectral changes of CW-AuNPs were monitored using varying concentrations of Cu(II) from 1x10⁻⁵ M to 1x10-15 M. The dose dependent curve showed a linear correlation for the most intense Raman peak in CW with varying concentrations of Cu (II) (Figure 6C). It was observed that CW-AuNPs showed a detectable Raman intensity for the peak even at a lower concentration of Cu(II) such as 10 nM, indicating a highly sensitive detection platform than the optical spectroscopy-based detection. We have studied the selectivity in Cu(II) detection using SERS study using other potential competitive metal ions. Interestingly SERS studies showed a Raman signal enhancement for the peak at 1416 cm-1, for Cu(II) even in the presence of other metal ions tested (Figure 6D). Raman mapping studies were performed for CW-AuNPs with varying concentration of Cu(II) (Figure 6E). Since Raman mapping is performed with dry samples it offers an enhanced aggregation, and in turn hot-spot formation for SERS applications. The mapping images showed a detectable signal pattern with bright spots for a lower concentration of Cu(II) up to 10 pM (Figure 6F). The bright red spots indicate a measure of the Raman spectrum intensity for the peak at 1416 cm−1 (Figure 6F). Thus, both solution state and dry Raman mapping studies improved the detection limit for Cu (II) using CW-AuNPs as compared to optical spectroscopic based detection methods.
4. Activatable Photosensitisation and Biomedical Application
Activatable photosensitizers offer precise spatiotemporal control in photodynamic therapy (PDT) by responding to specific tumor microenvironment cues such as pH, enzymes, and hypoxia, thereby improving selectivity and therapeutic outcomes. We examined the photosensitization behavior of CW-AuNPs-Cu nanoaggregates under light irradiation and confirmed their reactive oxygen species (ROS) generation using Singlet Oxygen Sensor Green (SOSG). Among the ROS produced, singlet oxygen plays a key role in enhancing PDT efficacy [45]. SOSG, a selective singlet oxygen probe, is non-fluorescent under normal conditions but emits at 520 nm upon reaction with singlet oxygen [46]. In our experiments, CW-AuNPs-Cu mixed with SOSG and irradiated through a 500 nm band-pass filter displayed a marked fluorescence at 520 nm, confirming singlet oxygen production (Figure 7A). No fluorescence was detected in control experiments conducted in the dark or with sodium azide, a singlet oxygen quencher, verifying the photosensitizer’s specificity (Figure 7B). Using methylene blue as a reference, the singlet oxygen quantum yield (ΦΔ) was determined to be 0.21.
For biological validation, the nanoaggregates were evaluated in MDMBA tumor cells. The cytotoxicity of nanoaggregates was tested, and it was shown that for higher concentrations such as 75, 100, and 200 μg/mL, the nanoaggregates showed cytotoxicity (Figure 7C). So, we have performed the in vitro experiments at a concentration of 50 mg/μL. Following incubation, cells were exposed to an 808 nm laser at 2 W/cm² for 1 minute. Live/dead staining revealed significant laser-induced cell death (red fluorescence) in treated samples compared to non-irradiated controls, demonstrating the potential of CW-AuNPs-Cu nanoaggregates as effective PDT agents (Figure 7D).
5. Discussion
The present work introduces a peptide-functionalized gold nanoparticle (CW-AuNPs) platform that achieves ultra-sensitive and selective detection of Cu(II) ions through a synergistic combination of peptide recognition and plasmonic signal amplification. The CW peptide, rich in tryptophan and cystine residues, facilitates strong coordination with Cu(II), triggering nanoparticle aggregation and inducing distinct optical changes. This aggregation not only alters the surface plasmon resonance band but detectable by colorimetric and UV-Vis measurements but also generates nanoscale “hot spots” that dramatically enhance Raman scattering signals, enabling detection down to 10 pM in SERS-based assays. Such detection limits surpass most reported peptide nanoparticle sensors, highlighting the exceptional signal enhancement achievable via controlled nanostructure assembly. Importantly, the CW-AuNPs retained high specificity in the presence of competing biologically relevant metal ions, which is critical for deployment in complex biological and environmental samples. The development of a solid-phase sensing format, in the form of functionalized paper strips, further underscores the practicality of the platform for rapid, on-site Cu(II) monitoring without the need for sophisticated instrumentation. A comparative analysis with previously reported Cu(II) sensors (Table 1) highlights the superior sensitivity of the CW-AuNPs platform, with detection limits several orders of magnitude lower than most nanoparticle- or peptide-based probes, alongside excellent selectivity.
Beyond sensing, the CW-AuNPs–Cu(II) aggregates exhibited notable photodynamic therapy (PDT) potential, with a singlet oxygen quantum yield of 0.21% and significant phototoxicity against cancer cells upon laser irradiation. The ability to combine ultrasensitive detection with therapeutic functionality positions this system as a promising theranostic nanoplatform, particularly for conditions where copper dysregulation is implicated, such as Wilson’s disease or certain malignancies. Future investigations should focus on validating the sensor’s performance in real biological fluids, optimizing PDT efficiency through ligand engineering or nanoparticle morphology control, and assessing in vivo biocompatibility and clearance of the system. Overall, this dual-function CW-AuNPs construct bridges the gap between rapid diagnostics and targeted therapy, offering a versatile approach to precision nanomedicine.
6. Conclusion
In summary we have successfully demonstrated a peptide-gold nanoparticle system with multimode detection capability for Cu(II) metal ions. The prepared CW-AuNPs, leverage the advantage of peptide moiety for selective and sensitive binding of Cu(II) among all other metal ions tested. The NPs showed colorimetric, optical and SERS based sensitive detection for Cu(II). The optical based detection allowed a sensitivity upto 76 nM, whereas the SERS based study offered 10 pM, with high reproducibility for both solution and mapping studies. A paper strip developed from this NPs, allowed onsite application for the detection of Cu(II). The nanoaggregate from peptide NPs, showed enhanced ROS generation with PDT applications in vitro, with a singlet oxygen quantum yield of 0.21. Overall, our results highlight the potential of peptide-AuNP conjugates as a versatile and robust platform for copper ion detection, addressing current challenges in sensitivity, selectivity, and cost-effectiveness. Future studies could extend this strategy to multiplex sensing or real-sample testing in complex matrices such as serum, wastewater, and food extracts.
Supplementary Materials
The following supporting information can be downloaded at the website of this paper posted on Preprints.org. Figure S1: 1H NMR spectrum (D2O, 300 MHz) of CW; Figure S2. 13C NMR spectrum (D2O, 75 MHz) of CW; Figure S3. Mass spectrometry data for CW. Figure S4. Photophysics for CW; Figure S5. Metal ion selectivity study for CW with various metal ions; Table S1: Time resolved spectroscopic data; Figure S6. Binding constant and stoichiometry measurements. Figure S7. FT-IR data for CW-AuNPs; Figure S8. Metal ion selectivity study for CW-AuNPs with various metal ions.
Funding
KU-KIST Graduate School of Converging Science and Technology and the BK21 fellowship program, Korea University. Science and Engineering Research Board, New Delhi, India (PDF/2017/001221).
Institutional Review Board Statement
Not applicable.
Informed Consent Statement
Not applicable.
Data Availability Statement
The data can be made available on request.
Acknowledgments
P.K shows sincere gratitude to Dong-Kwon Lim, KUKIST, South Korea and BK21 fellowship program, South Korea. P. K acknowledges Prakash P. Neelakandan, INST, Mohali, Punjab, India, for accepting the short-term visit to his lab and the help provided by him for the synthesis of CW peptide. The author acknowledges the instrumentation facilities in KUKIST and INST Mohali for this work.
Conflicts of Interest
Declare no conflicts of interest.
References
- Moustakas, M. The Role of Metal Ions in Biology, Biochemistry and Medicine. Materials 2021, 14, 549. [CrossRef]
- Turner, R.J. The Good, the Bad, and the Ugly of Metals as Antimicrobials. Biometals 2024, 37, 545–559. [CrossRef]
- Attar, T. A Mini-Review on Importance and Role of Trace Elements in the Human Organism. Chem. Rev. Lett. 2020, 3. [CrossRef]
- Gaetke, L.M.; Chow-Johnson, H.S.; Chow, C.K. Copper: Toxicological Relevance and Mechanisms. Arch. Toxicol. 2014, 88, 1929–1938. [CrossRef]
- Shabbir, Z.; Sardar, A.; Shabbir, A.; Abbas, G.; Shamshad, S.; Khalid, S.; Natasha; Murtaza, G.; Dumat, C.; Shahid, M. Copper Uptake, Essentiality, Toxicity, Detoxification and Risk Assessment in Soil-Plant Environment. Chemosphere 2020, 259, 127436. [CrossRef]
- Hill, S.J.; Fisher, A.S. Atomic Absorption, Methods and Instrumentation. In Encyclopedia of Spectroscopy and Spectrometry; Elsevier, 2017; pp. 37–43 ISBN 978-0-12-803224-4.
- Liu, Y.; Hu, Z.; Gao, S.; Günther, D.; Xu, J.; Gao, C.; Chen, H. In Situ Analysis of Major and Trace Elements of Anhydrous Minerals by LA-ICP-MS without Applying an Internal Standard. Chemical Geology 2008, 257, 34–43. [CrossRef]
- Goullé, J.-P.; Mahieu, L.; Castermant, J.; Neveu, N.; Bonneau, L.; Lainé, G.; Bouige, D.; Lacroix, C. Metal and Metalloid Multi-Elementary ICP-MS Validation in Whole Blood, Plasma, Urine and Hair. Forensic Sci. Int. 2005, 153, 39–44. [CrossRef]
- Buffle, J.; Tercier-Waeber, M.-L. Voltammetric Environmental Trace-Metal Analysis and Speciation: From Laboratory to in Situ Measurements. TrAC, Trends Anal. Chem. 2005, 24, 172–191. [CrossRef]
- Lu, M.; Fu, X.; Xie, H.; Liu, M.; Wei, P.; Zhang, W.; Xie, Y.; Qi, Y. Colorimetric Determination of Copper Ion Based on the Silver-Coated Gold Nanobipyramids. J. Food Compos. Anal. 2023, 120, 105363. [CrossRef]
- Cai, R.; Shoukat, C.A.; Zhang, C.; Gao, X.; Li, H.; Chen, J.; Ji, Y.; Wu, X. A Colorimetric Chemosensor for Sensitive and Selective Detection of Copper( ii ) Ions Based on Catalytic Oxidation of 1-Naphthylamine. Analyst 2023, 148, 3306–3311. [CrossRef]
- Wang, Y.-R.; Tan, Y.-W.; Zhang, A.-H.; Li, Y.-Y.; Hu, J.-L.; Wu, J.-R.; Tian, Z.-Q.; Ting-Liang; Kang, Y.-F. The Highly Selective and Sensitive Fluorescence Probe for Detection of Copper (II) Ions and Its Bioimaging in Vitro and Vivo. Spectrochim Acta A Mol. Biomol. Spectrosc. 2024, 316, 124328. [CrossRef]
- Wang, H.; Cui, J.; Fang, X.; Zhang, W.; Wang, J.; Chen, S.; Qian, J. Fluorescent Detection of Copper Ions with Acylhydrazine-Based Probes: Effects of Substitute and Its Position. Dyes and Pigments 2022, 197, 109954. [CrossRef]
- Paranawithana, N.N.; Martins, A.F.; Clavijo Jordan, V.; Zhao, P.; Chirayil, S.; Meloni, G.; Sherry, A.D. A Responsive Magnetic Resonance Imaging Contrast Agent for Detection of Excess Copper(II) in the Liver In Vivo. J. Am. Chem. Soc. 2019, 141, 11009–11018. [CrossRef]
- Shah, A.; Taylor, M.J.; Molinaro, G.; Anbu, S.; Verdu, M.; Jennings, L.; Mikulska, I.; Diaz-Moreno, S.; El Mkami, H.; Smith, G.M.; et al. Design of the Elusive Proteinaceous Oxygen Donor Copper Site Suggests a Promising Future for Copper for MRI Contrast Agents. Proc. Natl. Acad. Sci. U.S.A. 2023, 120, e2219036120. [CrossRef]
- Sannok, T.; Wechakorn, K.; Jantra, J.; Kaewchoay, N.; Teepoo, S. Anal. Bioanal. Chem. 2023, 415, 4703–4712. [CrossRef]
- Amalraj, A.; Ayyanu, R.; Pavadai, R.; Govindaraj, T.S.; Aham, E.C.; Li, X.; Deng, Y.; Zhang, Z. Smartphone Assisted Paper Strip-Based Colorimetric Sensing of Phosphate and Copper Ions Utilizing Bi-Ligand Intercalated Cobalt-MOF as a Dual Functional Nanozyme. J. Environ. Chem. Eng. 2024, 12, 113522. [CrossRef]
- Kumalasari, M.R.; Alfanaar, R.; Andreani, A.S. Gold Nanoparticles (AuNPs): A Versatile Material for Biosensor Application. Talanta Open 2024, 9, 100327. [CrossRef]
- Ferrari, E. Gold Nanoparticle-Based Plasmonic Biosensors. Biosensors 2023, 13, 411. [CrossRef]
- Kumar, N.; Singh, A.; Dhaka, P.; Singh, A.; Agarwala, P.; Sharma, K.; Bhargava, A.; Bhatia, S.; Launey, T.; Kaushik, R.; et al. A Label-Free Gold Nanoparticles Functionalized Peptide Dendrimer Biosensor for Visual Detection of Breakthrough Infections in COVID-19 Vaccinated Patients. Sens. Bio-Sens. Res. 2025, 47, 100718. [CrossRef]
- Parnsubsakul, A.; Oaew, S.; Surareungchai, W. Zwitterionic Peptide-Capped Gold Nanoparticles for Colorimetric Detection of Ni2+. Nanoscale 2018, 10, 5466–5473. [CrossRef]
- Luo, Y.; Zhang, Y.; Xiong, Z.; Chen, X.; Sha, A.; Xiao, W.; Peng, L.; Zou, L.; Han, J.; Li, Q. Peptides Used for Heavy Metal Remediation: A Promising Approach. Int. J. Mol. Sci. 2024, 25, 6717. [CrossRef]
- Haridas, V.; Praveen Kumar, P.P.; Suresh, C.H. Cysteine-Based Fluorescence “Turn-on” Sensors for Cu2+ and Ag+. RSC Adv. 2014, 4, 56539–56542. [CrossRef]
- Boas, D.; Remennik, S.; Reches, M. Peptide-Capped Au and Ag Nanoparticles: Detection of Heavy Metals and Photochemical Core/Shell Formation. J. Colloid. Interface Sci. 2023, 631, 66–76. [CrossRef]
- Shinde, S.; Kim, D.-Y.; Saratale, R.; Syed, A.; Ameen, F.; Ghodake, G. A Spectral Probe for Detection of Aluminum (III) Ions Using Surface Functionalized Gold Nanoparticles. Nanomaterials 2017, 7, 287. [CrossRef]
- Catanzaro, L.; Scardaci, V.; Scuderi, M.; Condorelli, M.; D’Urso, L.; Compagnini, G. Surface Plasmon Resonance of Gold Nanoparticle Aggregates Induced by Halide Ions. Mater. Chem. Phys. 2023, 308, 128245. [CrossRef]
- Tian, F.; Bonnier, F.; Casey, A.; Shanahan, A.E.; Byrne, H.J. Surface Enhanced Raman Scattering with Gold Nanoparticles: Effect of Particle Shape. Anal. Methods 2014, 6, 9116–9123. [CrossRef]
- Inoue, Y.; Yoshinare, Y.; Yamaguchi, A.; Oshima, A.; Yamaguchi, M.; Heya, A.; Sumitomo, K. Aggregation Control of Gold Nanoparticles and Surface-Enhanced Raman Scattering within Giant Unilamellar Vesicles. Langmuir 2025, 41, 9567–9573. [CrossRef]
- Lin, C.; Li, Y.; Peng, Y.; Zhao, S.; Xu, M.; Zhang, L.; Huang, Z.; Shi, J.; Yang, Y. Recent Development of Surface-Enhanced Raman Scattering for Biosensing. J. Nanobiotechnol. 2023, 21, 149. [CrossRef]
- Kumar, P.P.P.; Saxena, S.; Joshi, R. Advancements in SERS: Revolutionizing Biomedical Analysis and Applications. Nanotheranostics 2025, 9, 216–261. [CrossRef]
- Kumar, P.P.P.; Suresh, C.H.; Haridas, V. A Supramolecular Approach to Metal Ion Sensing: Cystine-Based Designer Systems for Cu2+ , Hg2+ , Cd2+ and Pb2+ Sensing. RSC Adv. 2015, 5, 7842–7847. [CrossRef]
- Yin, J.; Wu, T.; Song, J.; Zhang, Q.; Liu, S.; Xu, R.; Duan, H. SERS-Active Nanoparticles for Sensitive and Selective Detection of Cadmium Ion (Cd2+ ). Chem. Mater. 2011, 23, 4756–4764. [CrossRef]
- Song, C.; Yang, B.; Zhu, Y.; Yang, Y.; Wang, L. Ultrasensitive Sliver Nanorods Array SERS Sensor for Mercury Ions. Biosens Bioelectron. 2017, 87, 59–65. [CrossRef]
- Dugandžić, V.; Kupfer, S.; Jahn, M.; Henkel, T.; Weber, K.; Cialla-May, D.; Popp, J. A SERS-Based Molecular Sensor for Selective Detection and Quantification of Copper(II) Ions. Sensors and Actuators B: Chemical 2019, 279, 230–237. [CrossRef]
- Sapra, R.; Gupta, M.; Khare, K.; Chowdhury, P.K.; Haridas, V. Fluorescence by Self-Assembly: Autofluorescent Peptide Vesicles and Fibers. Analyst 2023, 148, 973–984. [CrossRef]
- Shao, J.; Kuiper, B.P.; Thunnissen, A.-M.W.H.; Cool, R.H.; Zhou, L.; Huang, C.; Dijkstra, B.W.; Broos, J. The Role of Tryptophan in π Interactions in Proteins: An Experimental Approach. J. Am. Chem. Soc. 2022, 144, 13815–13822. [CrossRef]
- Yugay, D.; Goronzy, D.P.; Kawakami, L.M.; Claridge, S.A.; Song, T.-B.; Yan, Z.; Xie, Y.-H.; Gilles, J.; Yang, Y.; Weiss, P.S. Copper Ion Binding Site in β-Amyloid Peptide. Nano Lett. 2016, 16, 6282–6289. [CrossRef]
- Wärmländer, S.; Tiiman, A.; Abelein, A.; Luo, J.; Jarvet, J.; Söderberg, K.L.; Danielsson, J.; Gräslund, A. Biophysical Studies of the Amyloid β-Peptide: Interactions with Metal Ions and Small Molecules. Chem.Bio.Chem. 2013, 14, 1692–1704. [CrossRef]
- Brynn Hibbert, D.; Thordarson, P. The Death of the Job Plot, Transparency, Open Science and Online Tools, Uncertainty Estimation Methods and Other Developments in Supramolecular Chemistry Data Analysis. Chem. Commun. 2016, 52, 12792–12805. [CrossRef]
- Thordarson, P. Determining Association Constants from Titration Experiments in Supramolecular Chemistry. Chem. Soc. Rev. 2011, 40, 1305–1323. [CrossRef]
- Chatterjee, S.; Lou, X.-Y.; Liang, F.; Yang, Y.-W. Surface-Functionalized Gold and Silver Nanoparticles for Colorimetric and Fluorescent Sensing of Metal Ions and Biomolecules. Coord. Chem. Rev. 2022, 459, 214461. [CrossRef]
- Praveen Kumar, P.P.; Kathuria, L.; Haridas, V. Cysteine-Based Silver Nanoparticles as Dual Colorimetric Sensors for Cations and Anions. New J. Chem. 2016, 40, 8382–8389. [CrossRef]
- Gruszczyńska, E.; Lewkowicz, A.; Czarnomska, M.; Koczur, J.; Walczewska-Szewc, K.; Kaliszan, M.; Balwicki, Ł.; Bojarski, P. Spectroscopic Analysis of Tryptophan as a Potential Optical Biomarker for Estimating the Time of Death. Int. J. Mo.l Sci. 2024, 25, 12915. [CrossRef]
- Hirakawa, A.Y.; Nishimura, Y.; Matsumoto, T.; Nakanishi, M.; Tsuboi, M. Characterization of a Few Raman Lines of Tryptophan. J. Raman Spectroscopy 1978, 7, 282–287. [CrossRef]
- Maharjan, P.S.; Bhattarai, H.K. Singlet Oxygen, Photodynamic Therapy, and Mechanisms of Cancer Cell Death. Journal of Oncology 2022, 2022, 1–20. [CrossRef]
- Kim, S.; Fujitsuka, M.; Majima, T. Photochemistry of Singlet Oxygen Sensor Green. J. Phys. Chem. B 2013, 117, 13985–13992. [CrossRef]
- Park, G.J.; Hwang, I.H.; Song, E.J.; Kim, H.; Kim, C. A Colorimetric and Fluorescent Sensor for Sequential Detection of Copper Ion and Cyanide. Tetrahedron 2014, 70, 2822–2828. [CrossRef]
- Deng, H.-H.; Li, G.-W.; Liu, A.-L.; Chen, W.; Lin, X.-H.; Xia, X.-H. Thermally Treated Bare Gold Nanoparticles for Colorimetric Sensing of Copper Ions. Microchim. Acta 2014, 181, 911–916. [CrossRef]
- Guo, Y.; Wang, Z.; Qu, W.; Shao, H.; Jiang, X. Colorimetric Detection of Mercury, Lead and Copper Ions Simultaneously Using Protein-Functionalized Gold Nanoparticles. Biosensors and Bioelectronics 2011, 26, 4064–4069. [CrossRef]
- Lou, T.; Chen, L.; Chen, Z.; Wang, Y.; Chen, L.; Li, J. Colorimetric Detection of Trace Copper Ions Based on Catalytic Leaching of Silver-Coated Gold Nanoparticles. ACS Appl. Mater. Interfaces 2011, 3, 4215–4220. [CrossRef]
- Magarelli, G.; Da Silva, J.G.; Ribeiro, C.L.; De Freitas, T.V.; Rodrigues, M.A.; De Souza Gil, E.; Marraccini, P.; De Souza, J.R.; De Castro, C.S.P.; Bemquerer, M.P. A Voltammetric Peptide Biosensor for Cu2+ Metal Ion Quantification in Coffee Seeds. J. Inorg. Biochem. 2024, 251, 112441. [CrossRef]
- Nguyen, N.K.; Poduska, B.; Franks, M.; Bera, M.; MacCormack, I.; Lin, G.; Petroff, A.P.; Das, S.; Nag, A. A Copper-Selective Sensor and Its Inhibition of Copper-Amyloid Beta Aggregation. Biosensors 2024, 14, 247. [CrossRef]
- Shi, Y.; Liu, Q.; Yuan, W.; Xue, M.; Feng, W.; Li, F. Dye-Assembled Upconversion Nanocomposite for Luminescence Ratiometric in Vivo Bioimaging of Copper Ions. ACS Appl. Mater. Interfaces 2019, 11, 430–436. [CrossRef]
- Gerdan, Z.; Saylan, Y.; Denizli, A. Recent Advances of Optical Sensors for Copper Ion Detection. Micromachines 2022, 13, 1298. [CrossRef]
- Safran, V.; Göktürk, I.; Derazshamshir, A.; Yılmaz, F.; Sağlam, N.; Denizli, A. Rapid Sensing of Cu+2 in Water and Biological Samples by Sensitive Molecularly Imprinted Based Plasmonic Biosensor. Microchem. J. 2019, 148, 141–150. [CrossRef]
- Liu, Y.; Wu, Y.; Guo, X.; Wen, Y.; Yang, H. Rapid and Selective Detection of Trace Cu2+ by Accumulation- Reaction-Based Raman Spectroscopy. Sens. Actuators B-Chem. 2019, 283, 278–283. [CrossRef]
Figure 1.
Binding studies for CW with Cu(II). (A) Changes in the absorption spectra for CW (10x10-6M) alone and with various amount of Cu(ClO₄)₂·6H₂O in HEPES buffer (pH =7.4). Scanning electron microscopy images for CW without (B) and (C) with Cu(ClO₄)₂·6H₂O [60 μM]. Scale bar 1 μm. (D) Circular dichroism spectra for CW (60x10-6 M) alone and with addition of various amounts of Cu(ClO₄)₂·6H₂O.
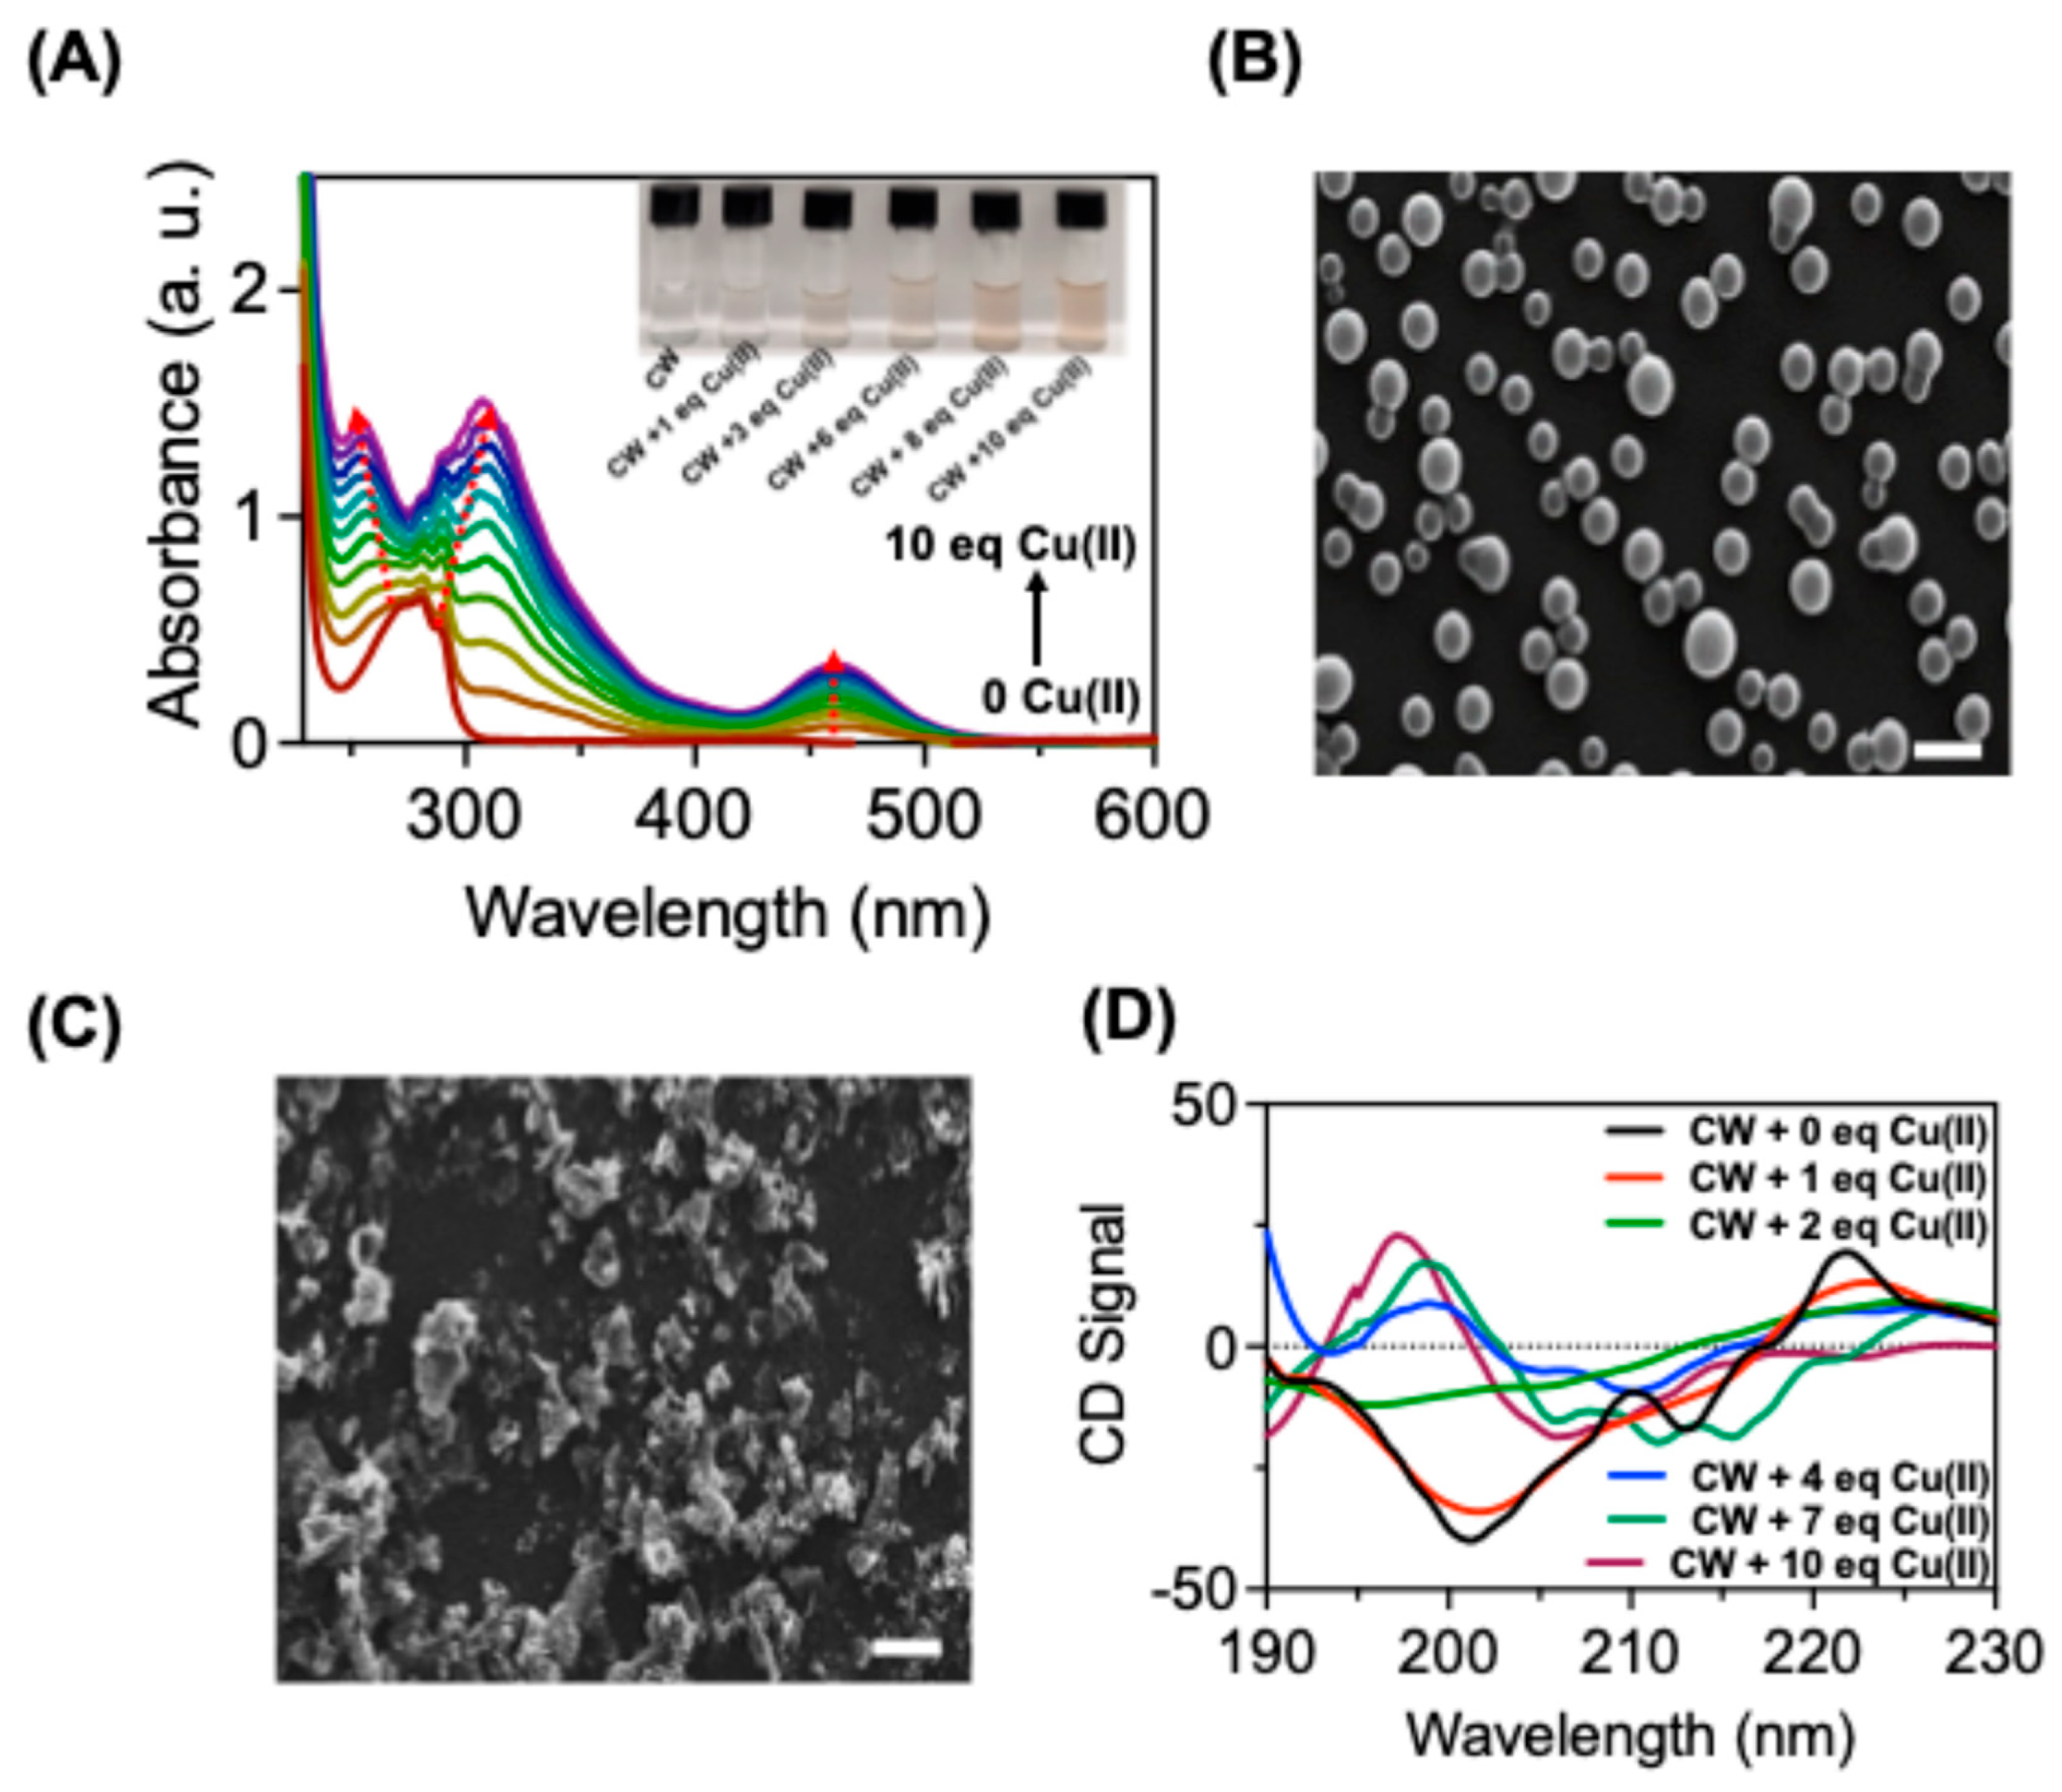
Figure 2.
Binding studies for CW with Cu(II). (A) Changes in the emission spectra for CW (10x10-6M) alone and with various amount of Cu(ClO₄)₂·6H₂O in HEPES buffer (pH =7.4). (B) Time resolved spectra for CW with Cu(II). (C) Partial 1H-NMR spectra for CW, and CW with various amounts of Cu(II). The NMR experiments were performed in D2O. The green dotted lines indicate the changes in NMR peak positions for CW and after the addition of Cu(II). (D) Optimized structure for the CW with Cu(II).
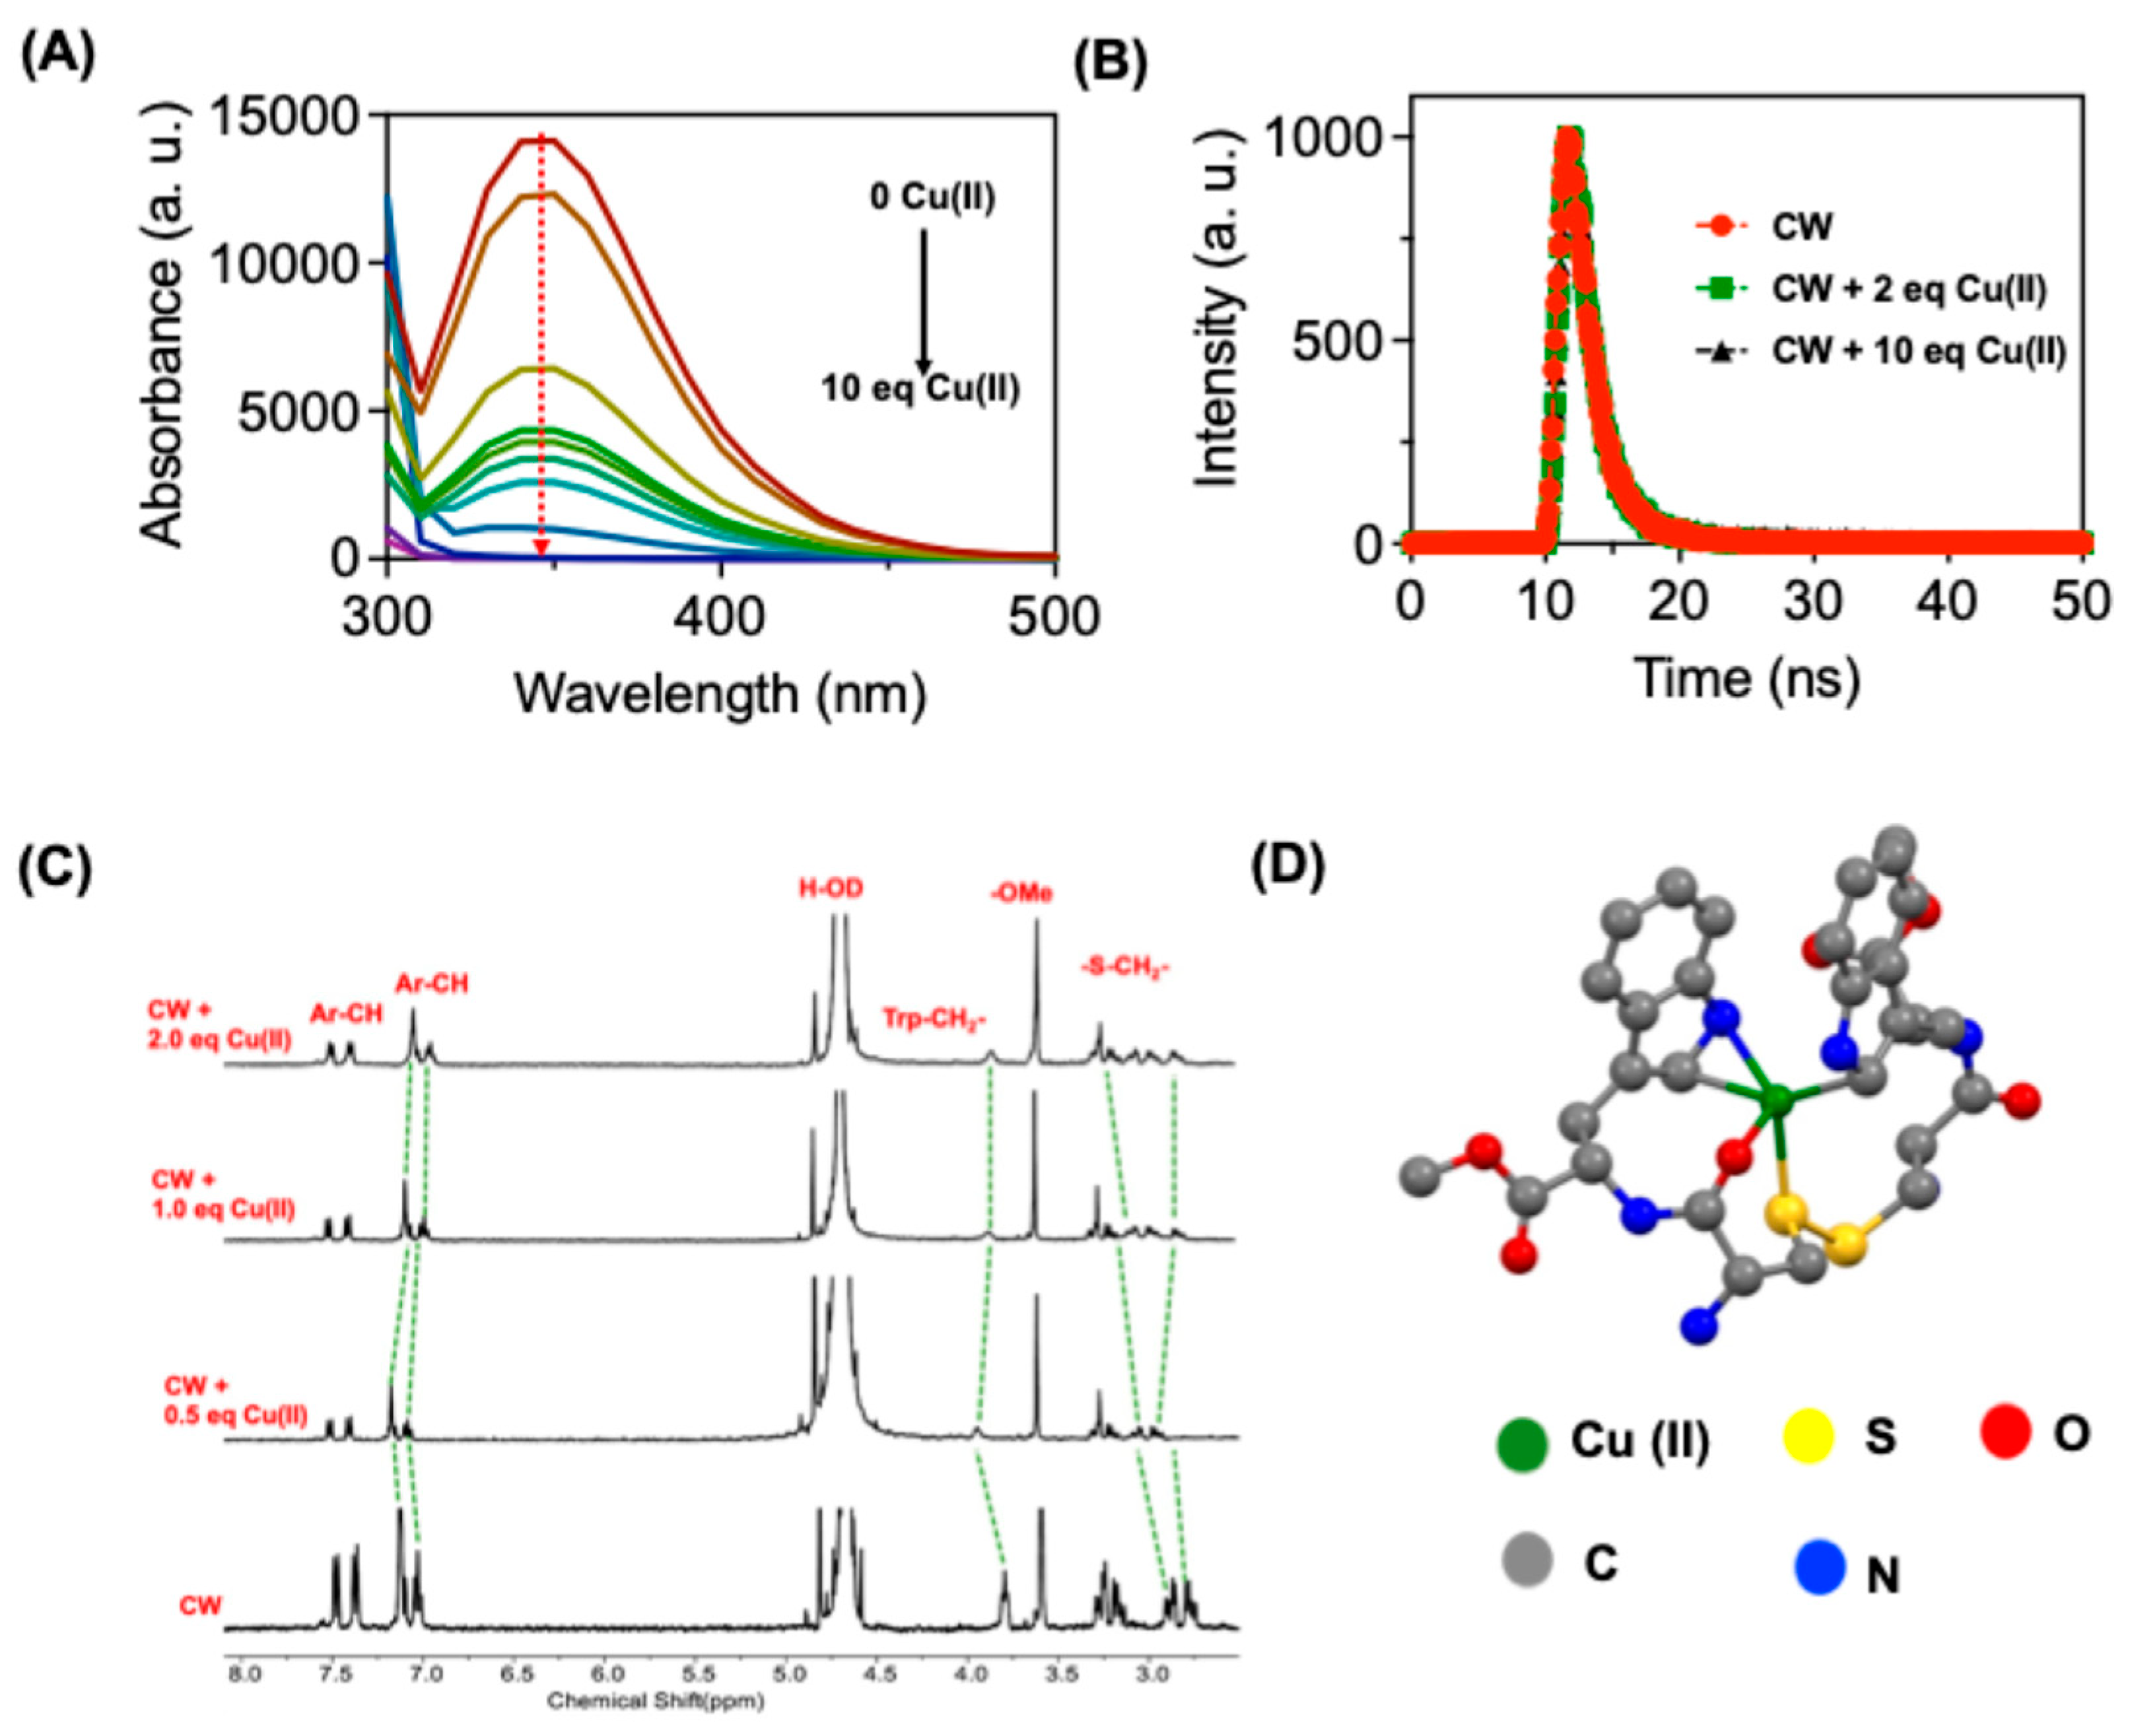
Figure 3.
Characterization for CW-AuNPs. (A) Extinction spectra for CW-AuNPs (100 μg/mL) in HEPES buffer. (B) Dynamic light scattering measurement for CW-AuNPs. The inset showing transmission electron microscopic image for CW-AuNPs. Scale bar 100 nm. (C) Emission spectra for CW-AuNPs (100 μg/mL) in HEPES buffer. λexc = 290 nm. (D) Raman spectrum for CW, and CW-AuNPs. Data were collected using a laser source of excitation at 633 nm laser (6.8 mW); Exposure time: 10 s.
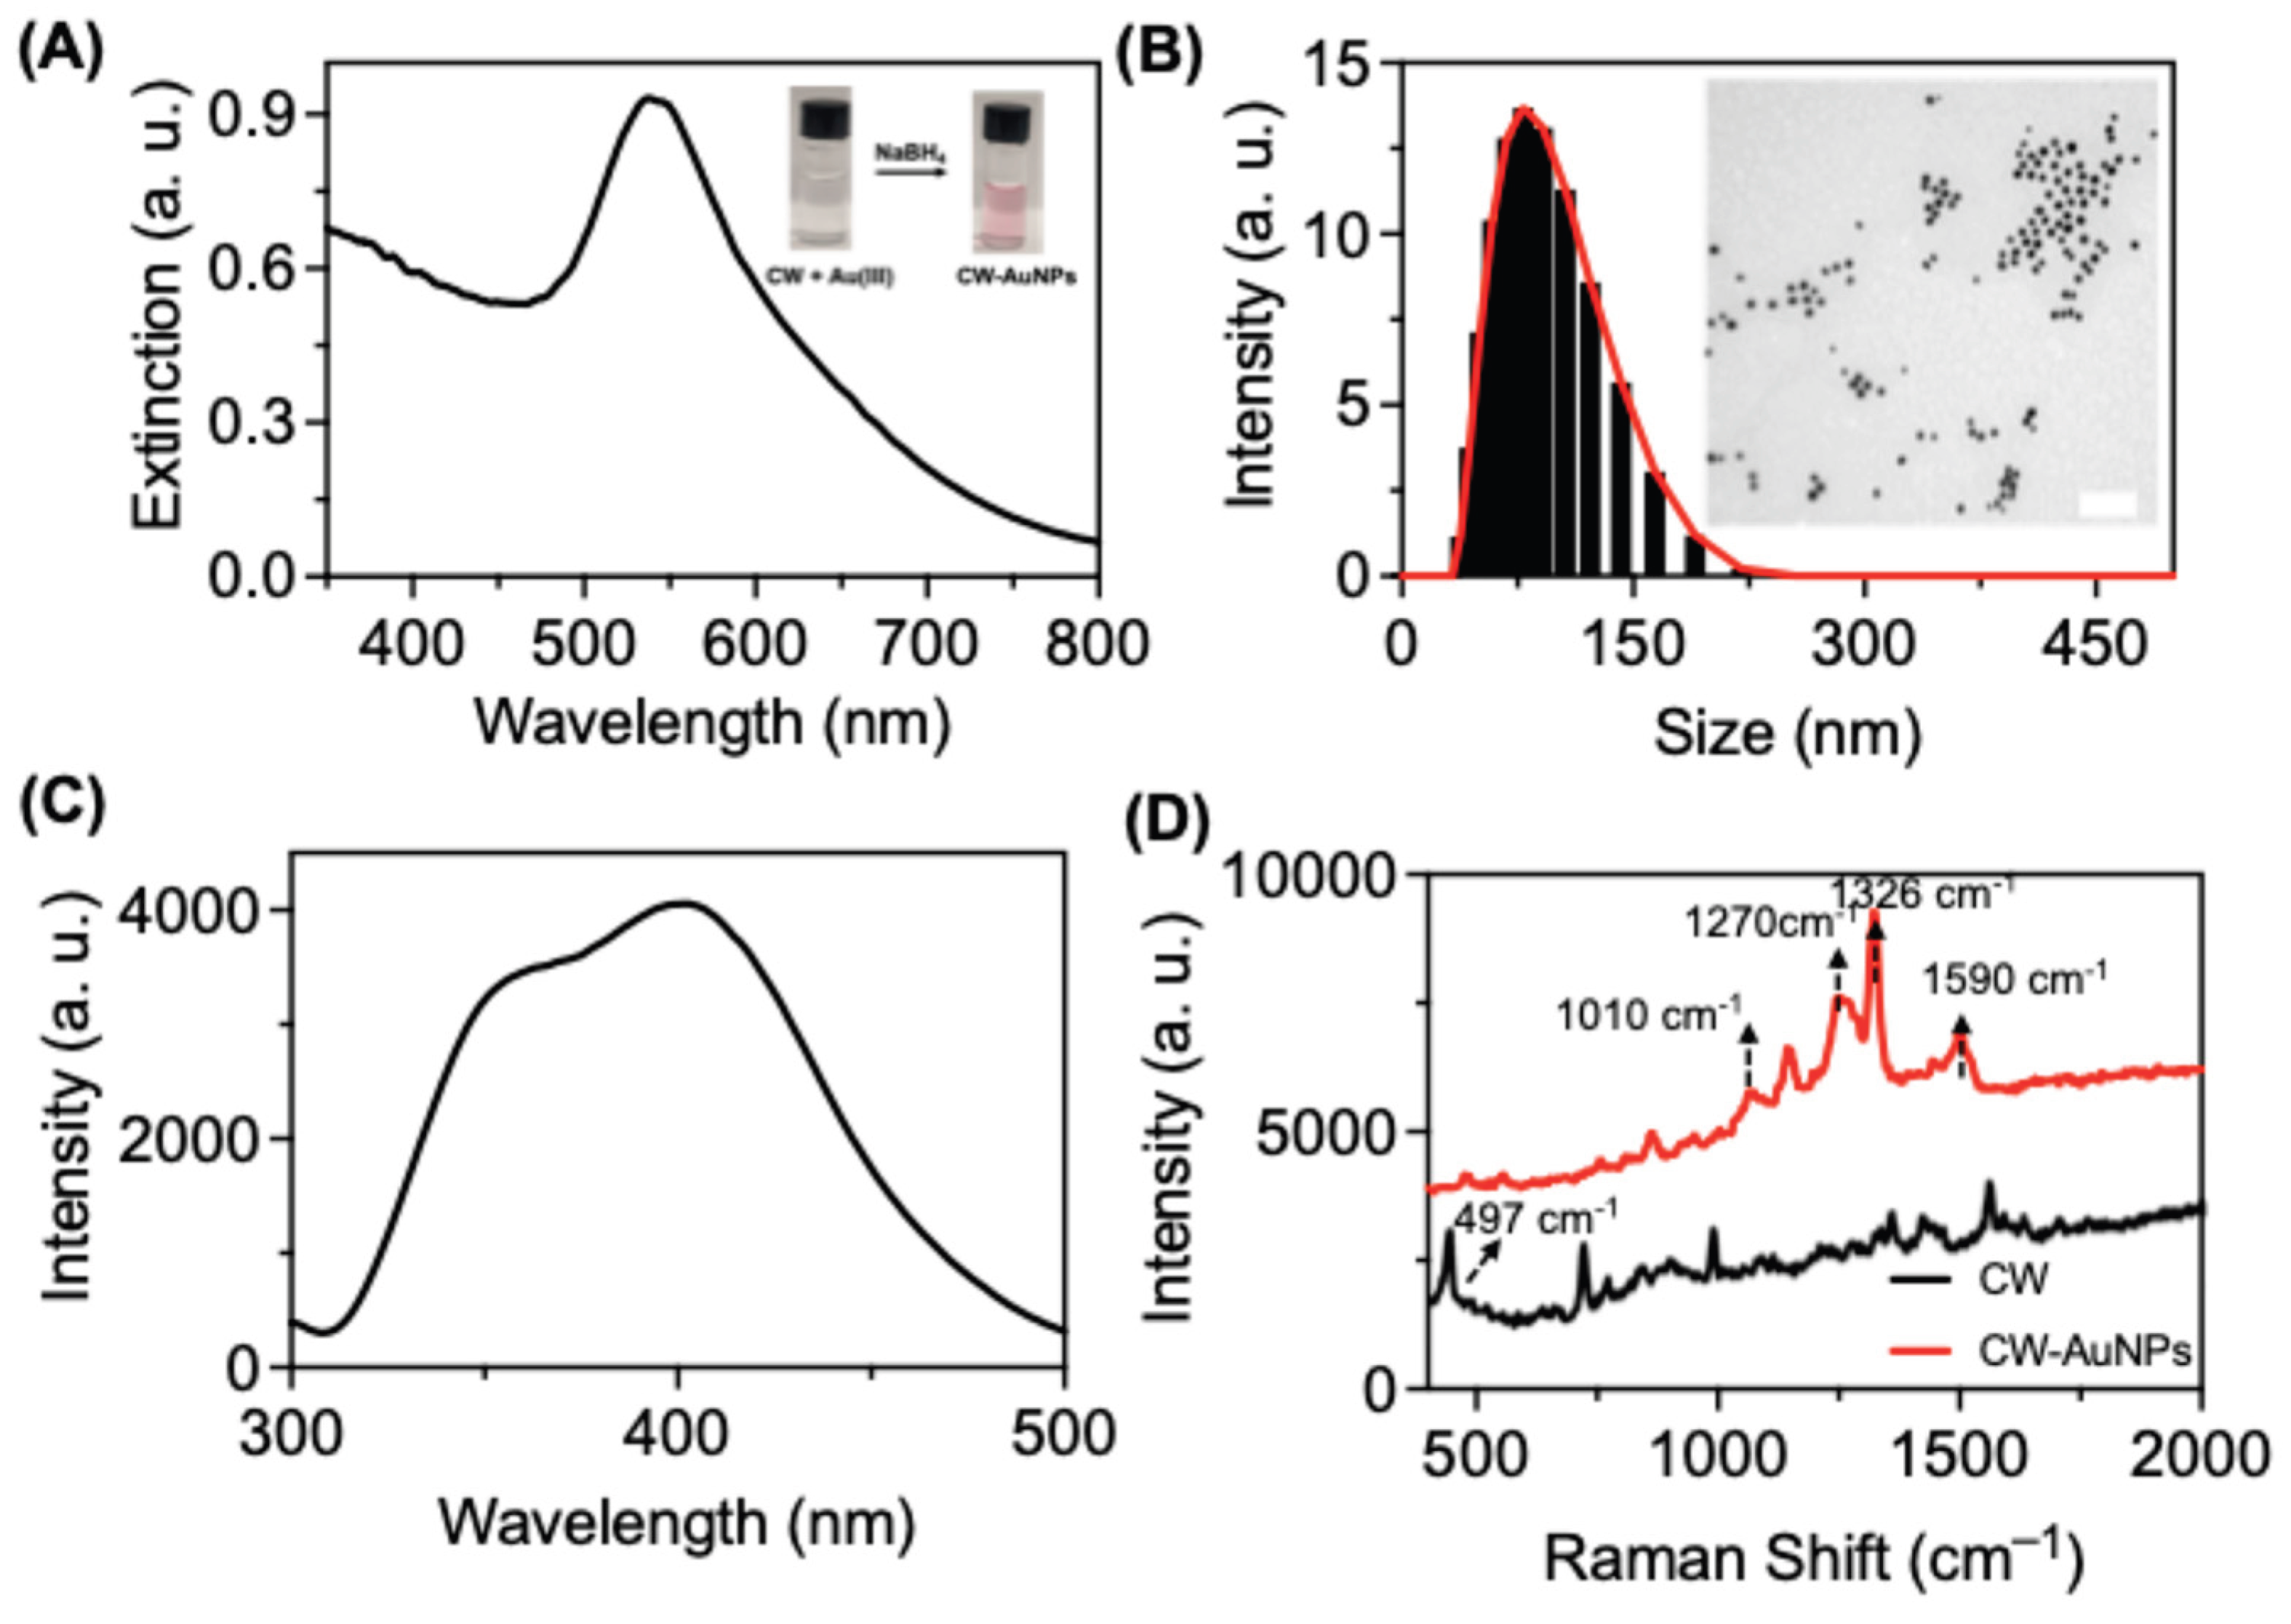
Figure 4.
Metal sensing properties of CW-AuNPs. (A) Visual colorimetric response for CW-AuNPs with various metal ions. [CW-AuNPs (100 mg/mL); Metal ions 20 μM]. (B) Changes in the extinction spectra for CW-AuNPs with Cu(II), where [CW-AuNPs (100 mg/mL); Cu(II) 20 μM]. (C) A quantitative measurement for the detection of Cu(II) using CW-AuNPs. Inset showing the visual colorimetric response of CW-AuNPs with various amount of Cu(II) added. (D) Changes in the emission spectra for CW-AuNPs with Cu(II), where [CW-AuNPs (100 μg/mL); Cu(II) 20 μM].λexc = 290 nm. (E) TEM micrographs for CW-AuNPs with Cu(II). Scale bar 100 nm.
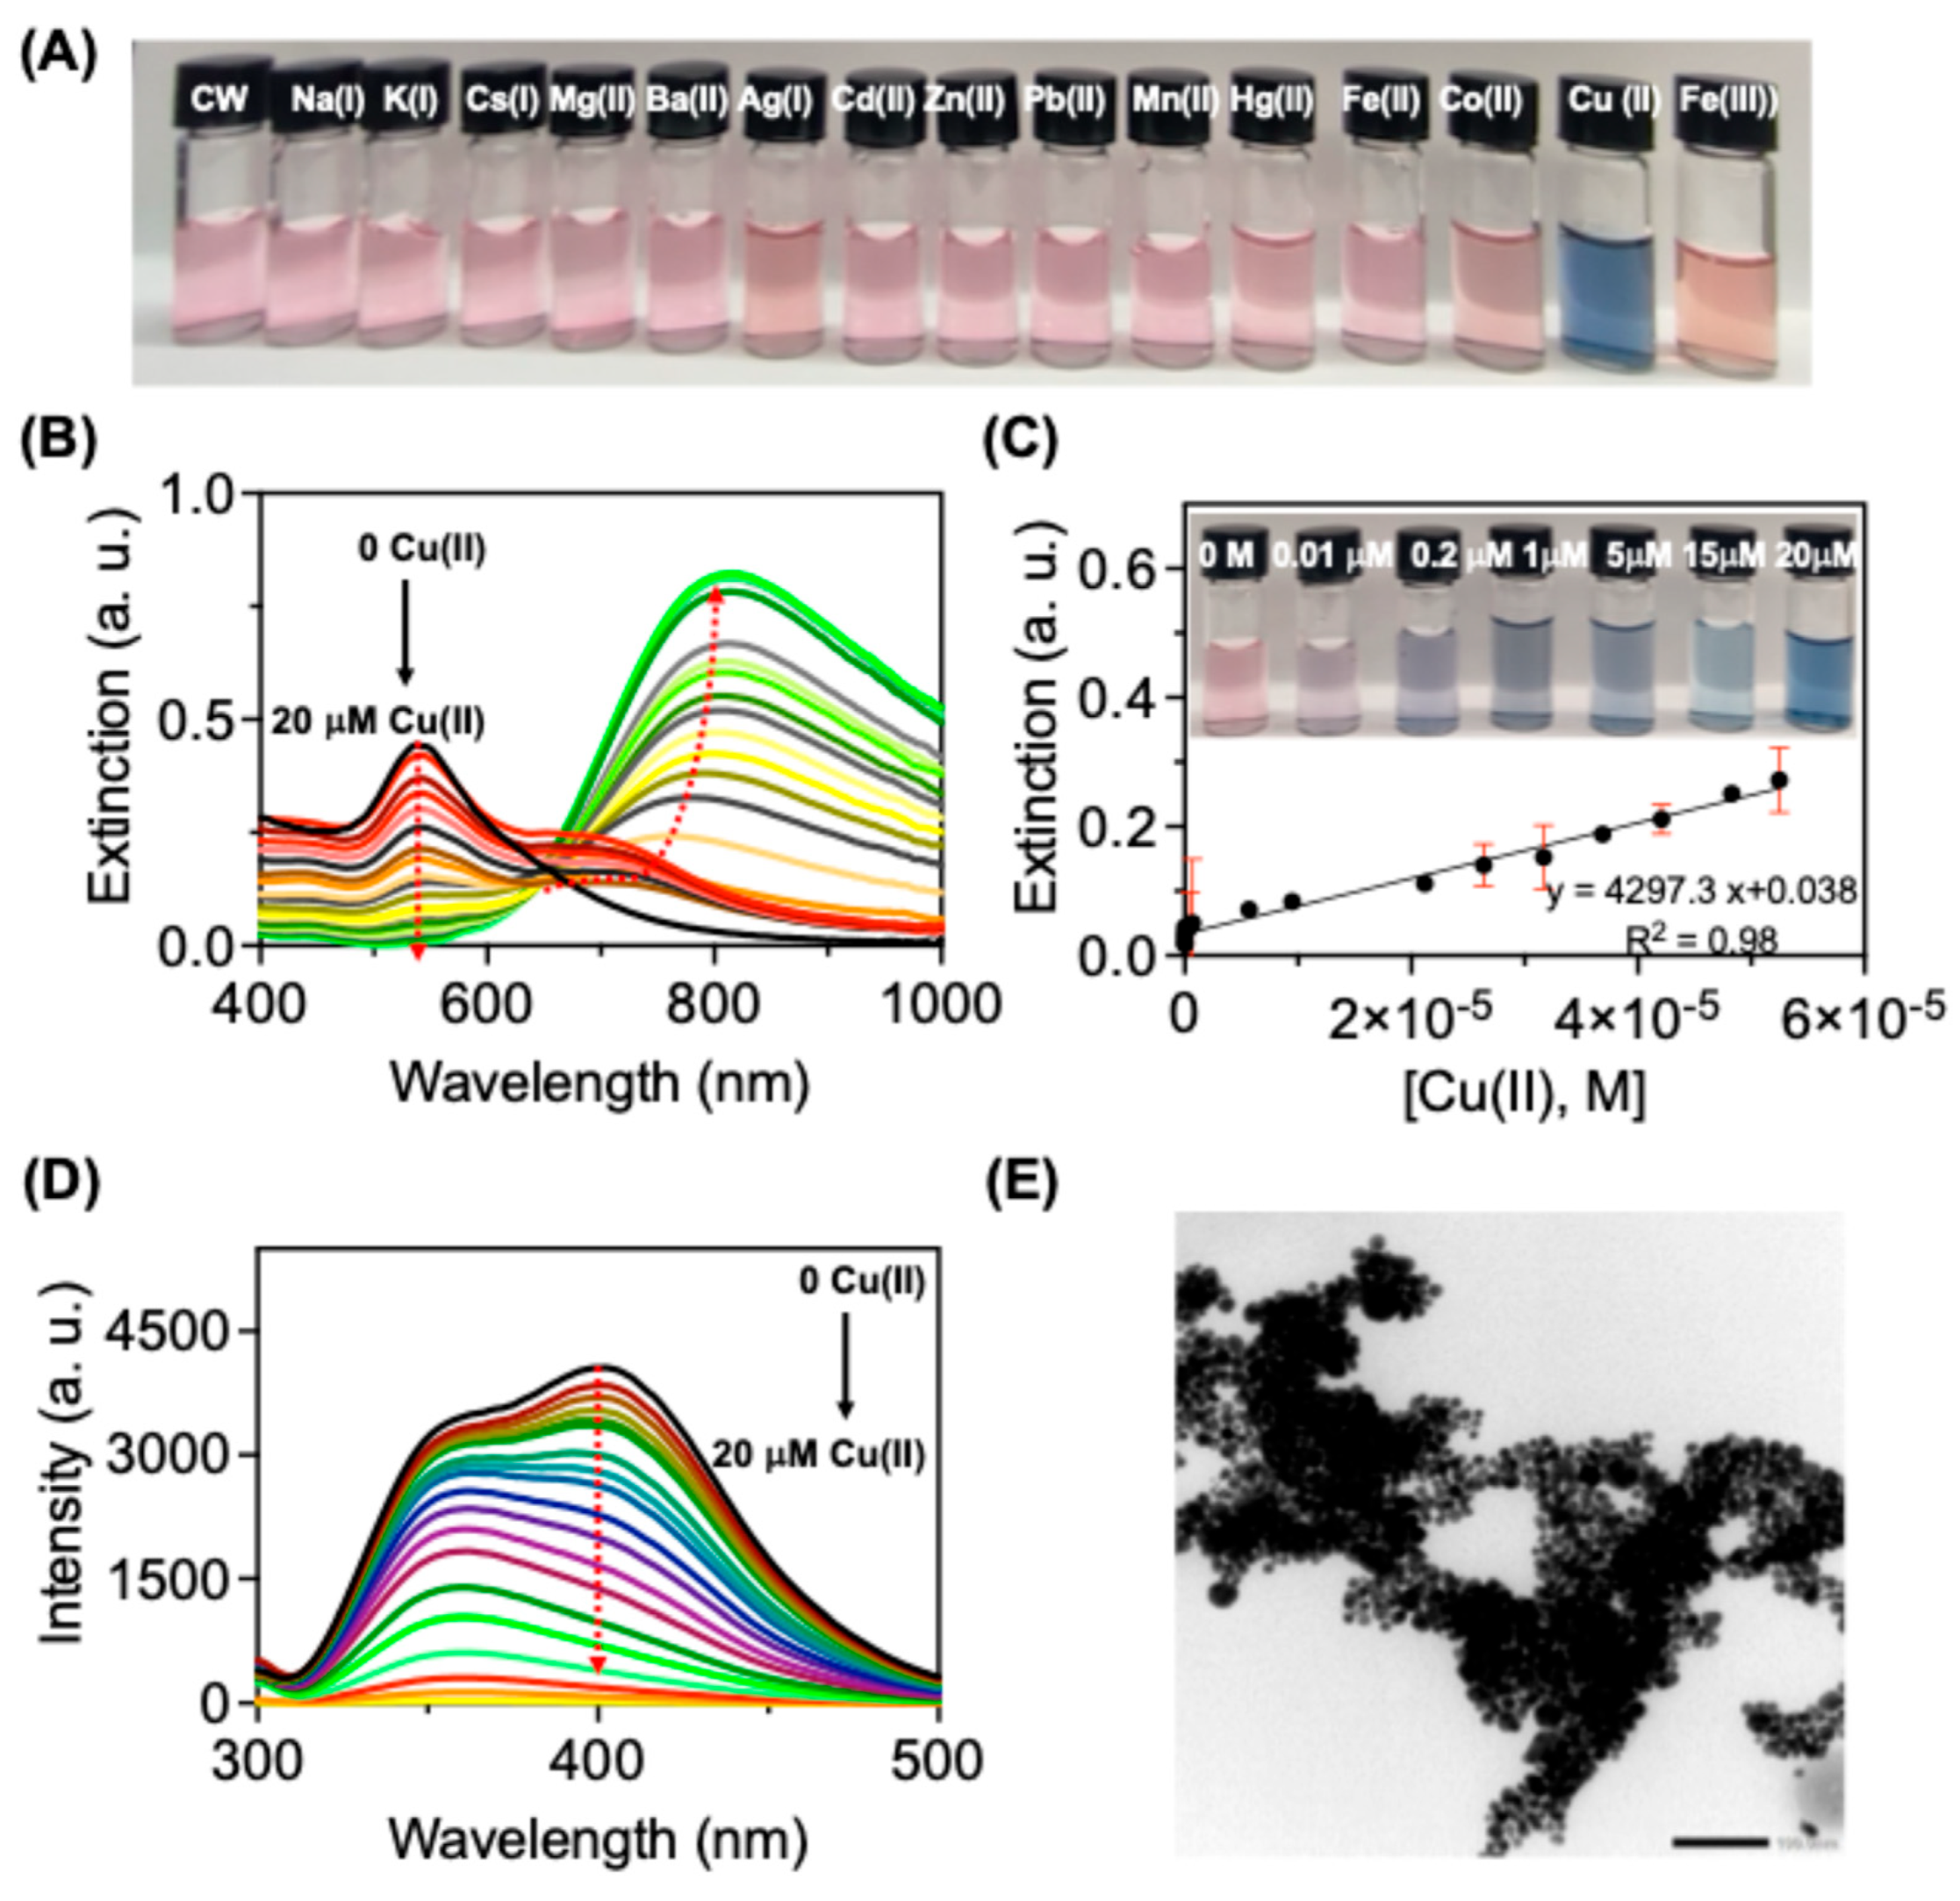
Figure 5.
Paper strip-based sensing of Cu(II). (A) Test strip prepared from CW-AuNPs. (B) Colorimetric response of paper strip with varying concentration of Cu(II).
Figure 5.
Paper strip-based sensing of Cu(II). (A) Test strip prepared from CW-AuNPs. (B) Colorimetric response of paper strip with varying concentration of Cu(II).
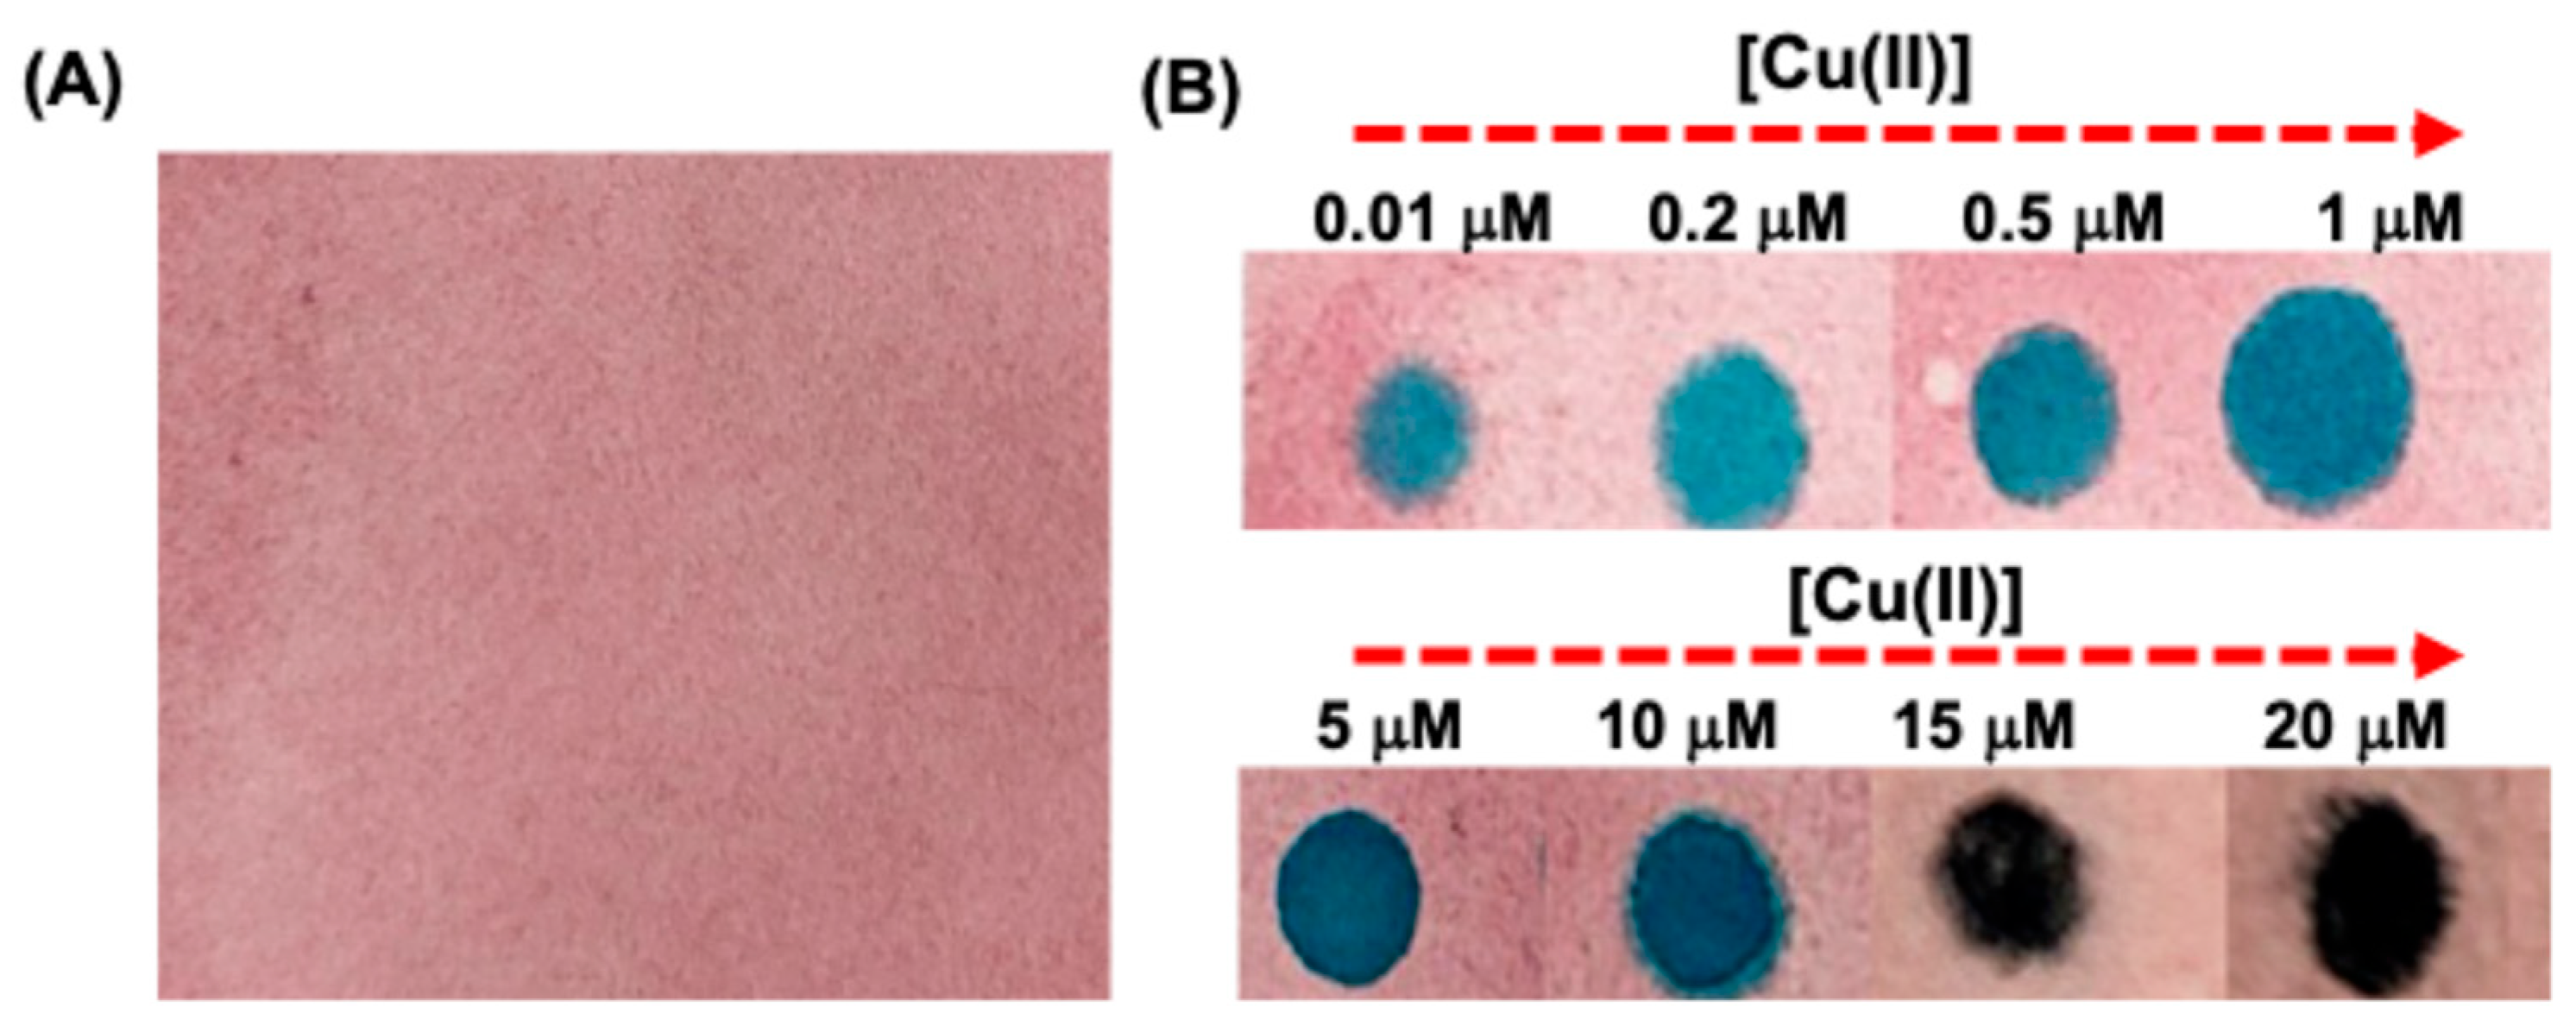
Figure 6.
SERS based copper detection. (A) A schematic representation for the SERS based Cu(II) detection using CW-AuNPs. (B) Raman spectra for CW-AuNPs (50 μg/mL) with the addition of various amounts of Cu(II). (C) Linear relationship between SERS peak intensities at 1416 cm−1 and Cu(II) concentrations. (D) Raman spectra for CW-AuNPs, CW-AuNPs + Cu(II) and CW-AuNPs + Cu(II) + various other metal ions. Studies showed high selectivity of CW-AuNPs with Cu(II), even with the addition of various other metal ions. (E) SERS for the dried samples of CW-AuNPs with Cu(II). Blue shade box indicated Raman Shift at 1416 cm-1. (F) Raman mapping images for the dried samples from CW-AuNPs with various concentrations of Cu(II). Excitation: 633 nm laser (6.8 mW); exposure time: 10 s.
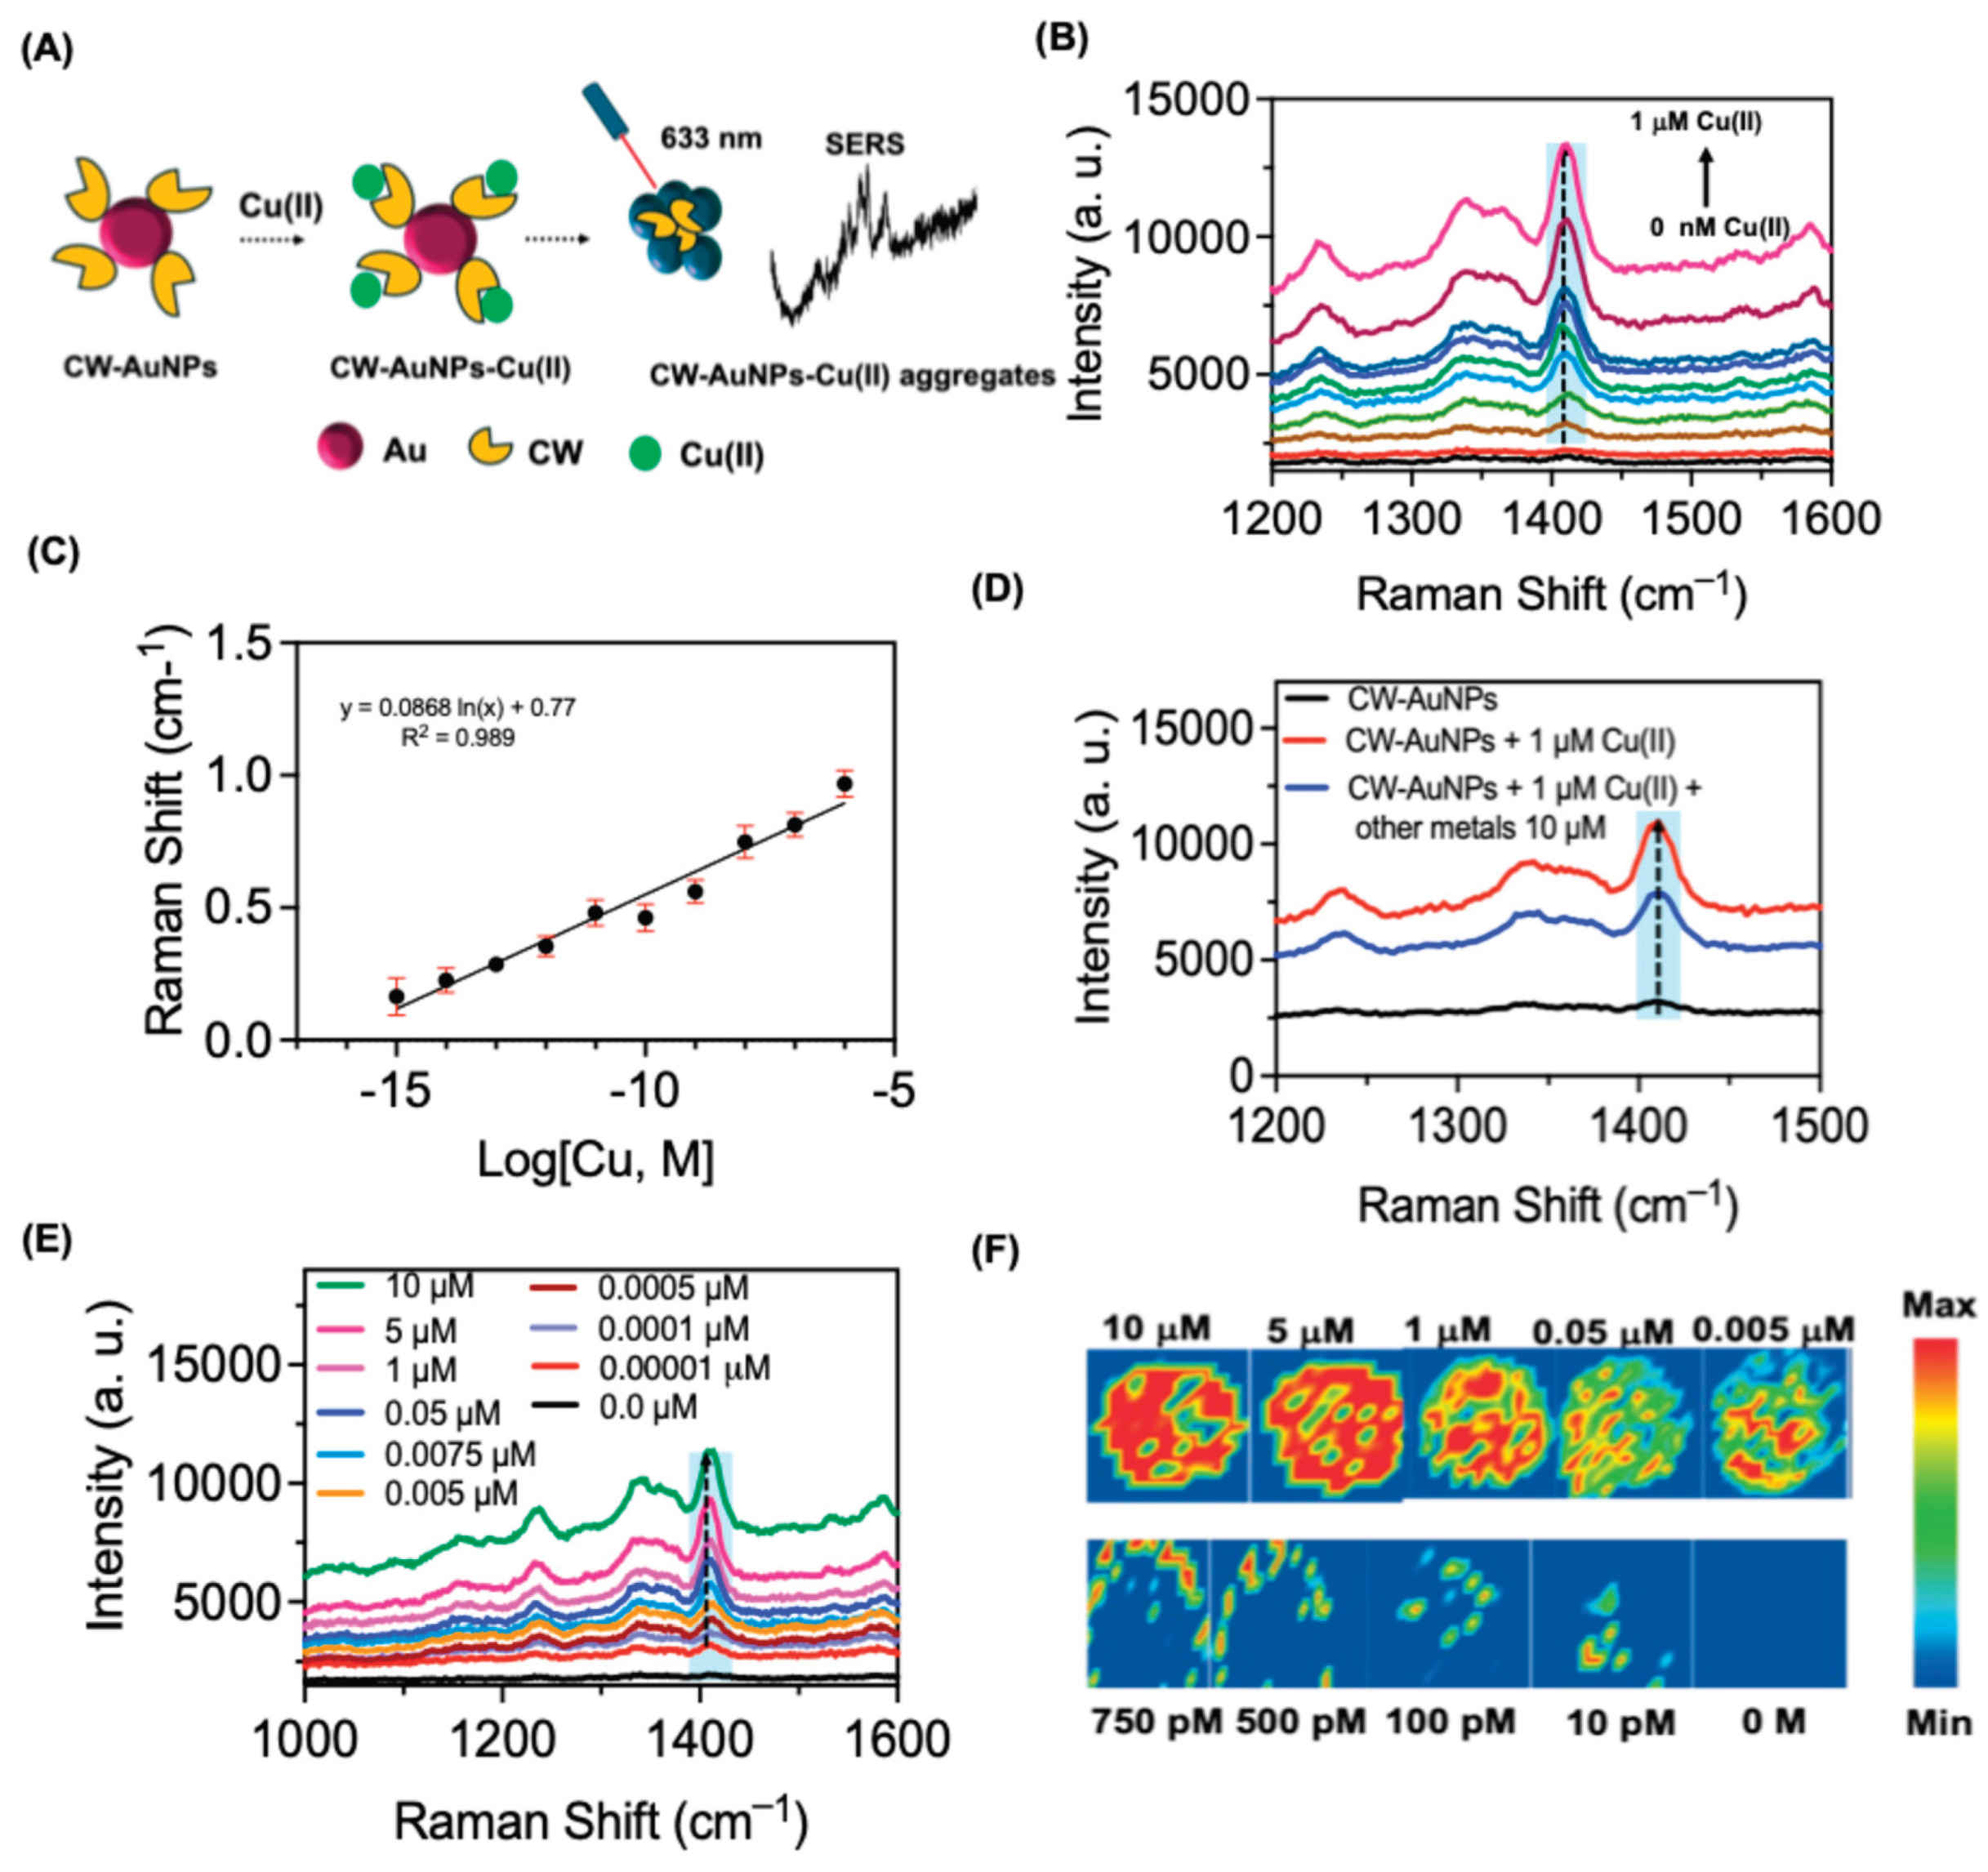
Figure 7.
ROS generation from CW-AuNPs-Cu nanoaggregate. (A) Time dependant fluorescence spectra (λexc =490 nm; λem =520 nm) of SOSG solutions (5 μM) after exposure with CW-AuNPs-Cu nanoaggreate (50 mg/mL) under light. (B) A comparative plot for the fluorescence from SOSG under different conditions. (C) Cell viability assay for CW-AuNPs-Cu nanoaggregate on MDMBA cell lines. Where ns- statistically non-significant; *p< 0.05. (D) Live and dead staining studies for MDMBA cells after exposure of 808 nm laser for 2 minutes. The white circles show the area of laser exposure. Scale bar 50 μm. .
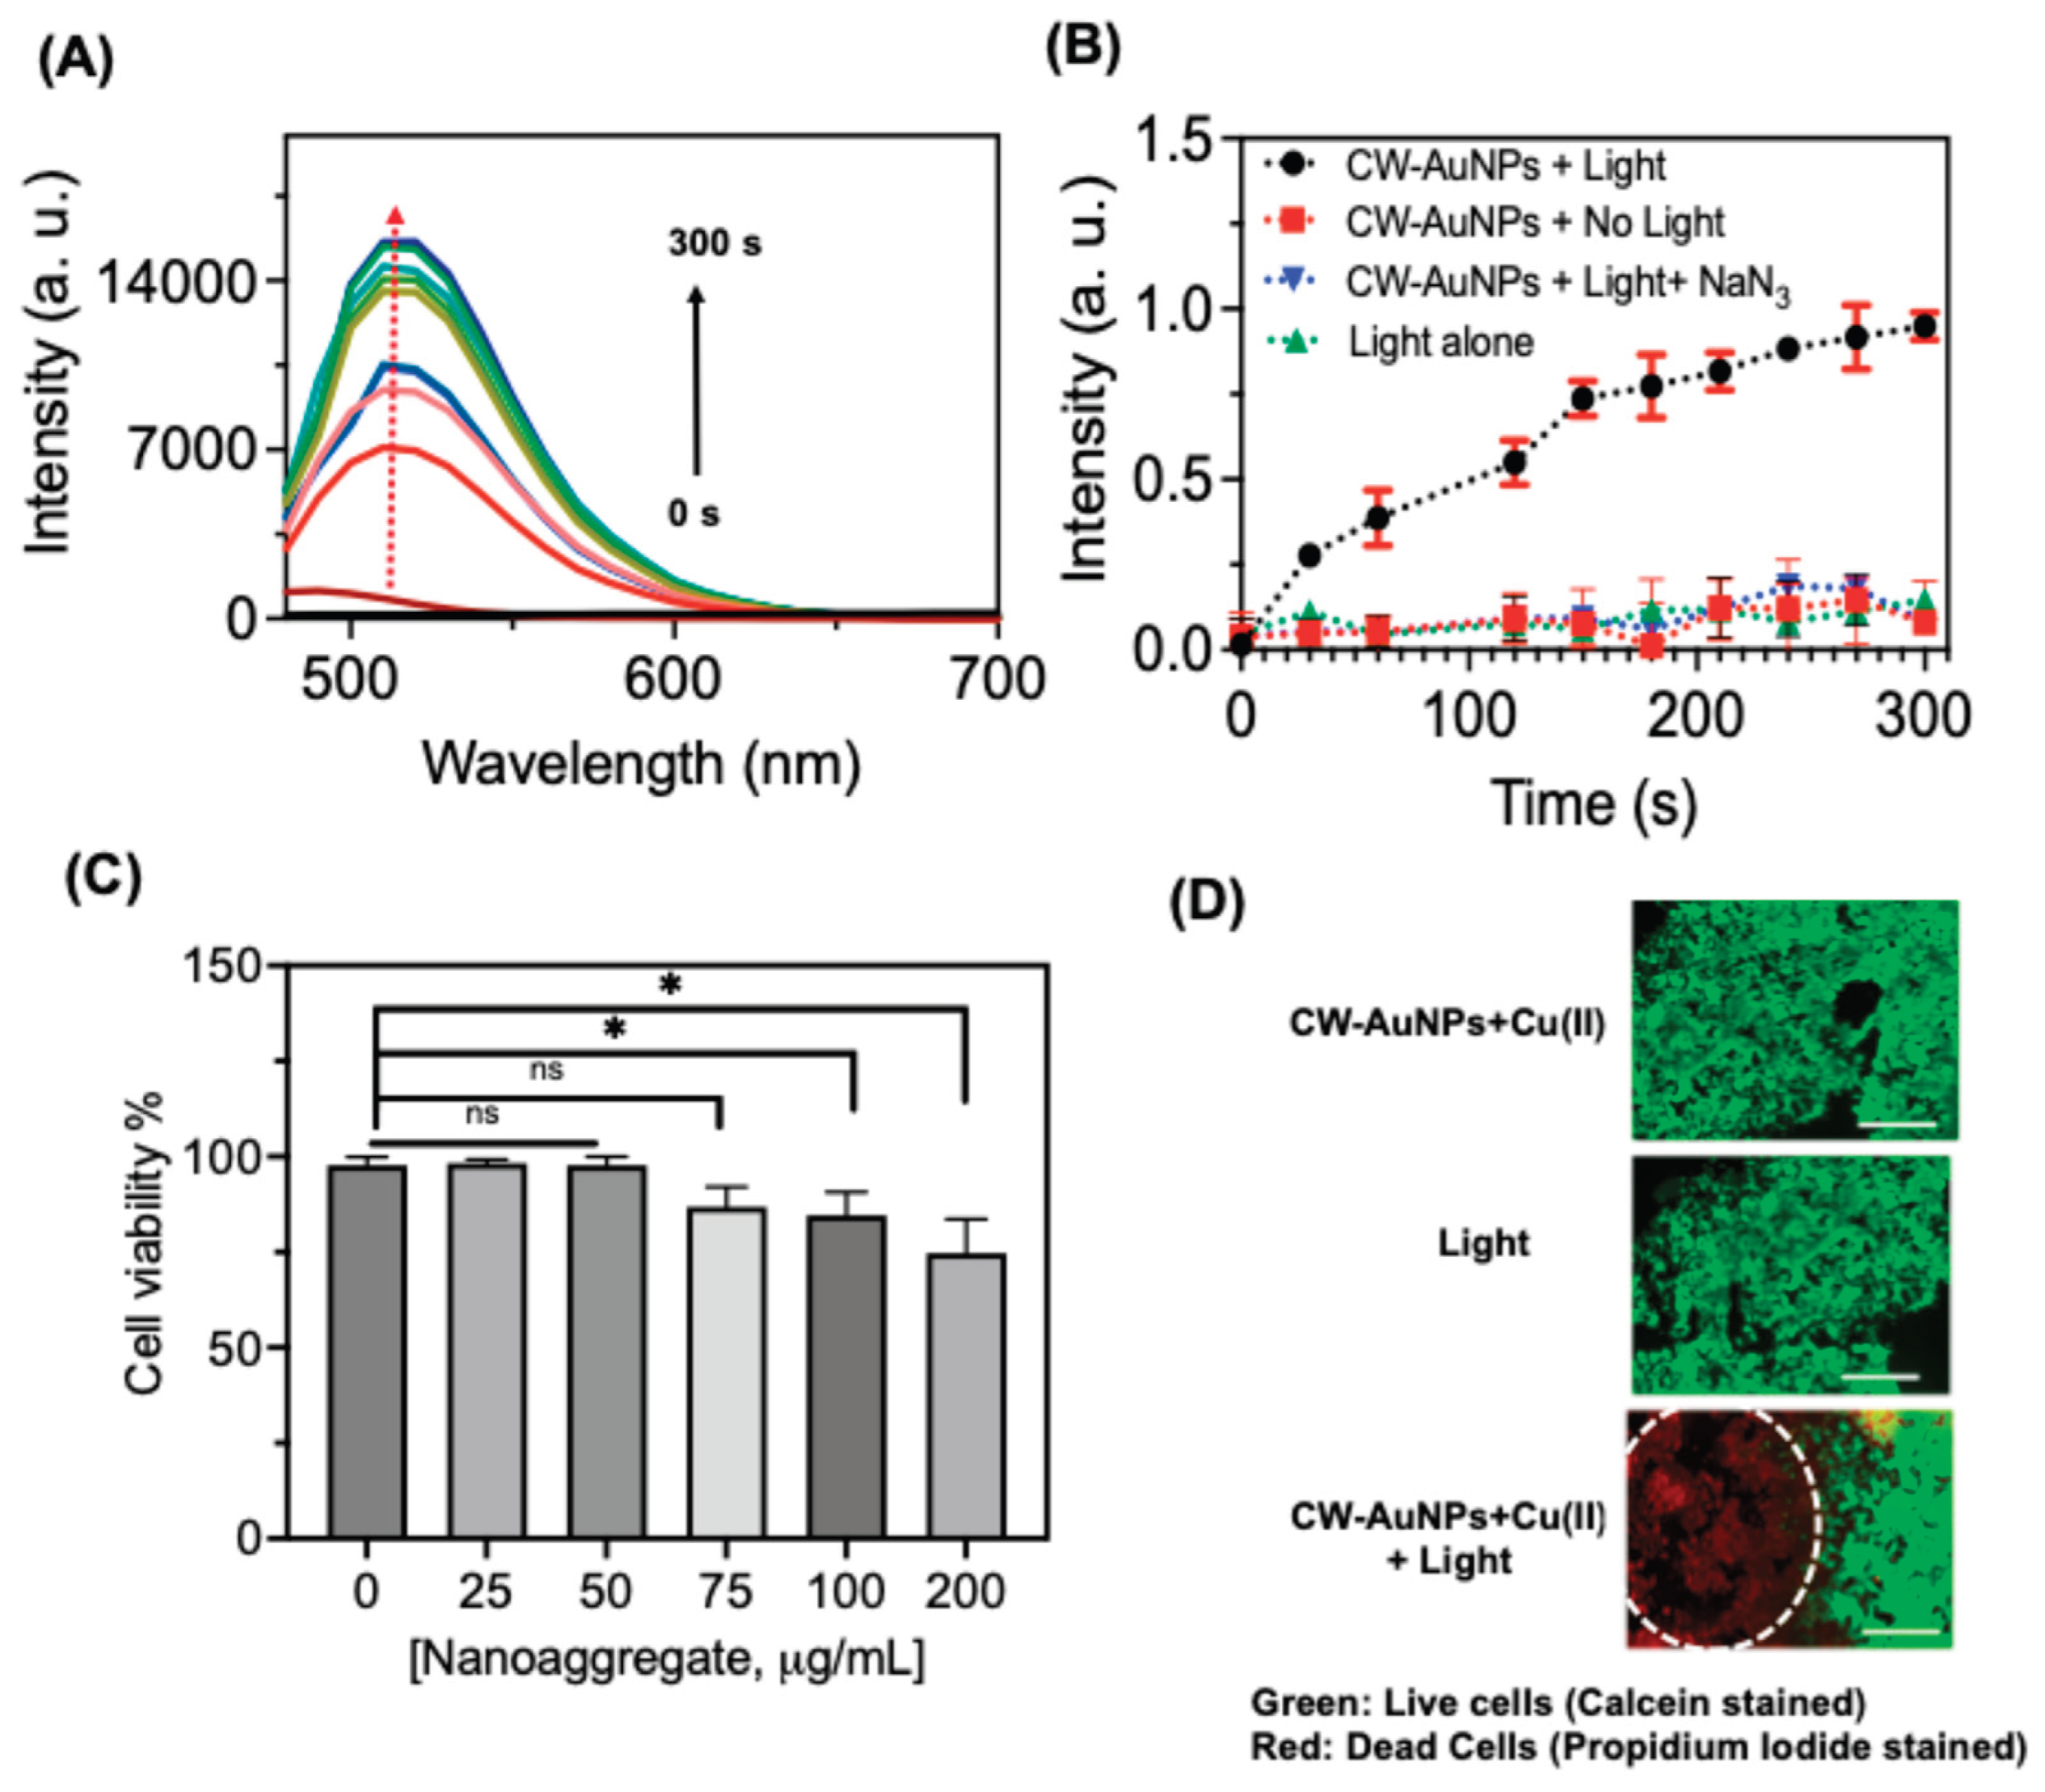

Table 1.
Comparison of reported Cu(II) detection systems with the present CW-AuNPs platform.
| Sensor type | Mode of detection | Limit of detection | Ref |
|---|---|---|---|
| Julolidine-containing naphthol-based probe | Colorimetric | 2 μM | [47] |
| Gold nanoparticles (AuNPs) |
Colorimetric and UV-visible | 0.04 μM | [48] |
| Papain-functionalized AuNPs | Colorimetric | 200 nM | [49] |
| Silver-coated gold nanoparticles | Colorimetric | 1 nM | [50] |
| H-CVNITKQHTVTTTT-NH2 (Peptide) | Electrochemical | 80 nM | [51] |
| peptide–chelator | Fluorescence | 2 μM | [52] |
| Up conversion lanthanides | Luminescence | 37 nmol/L | [53] |
| Molecularly imprinted nanofilm | Surface plasmon resonance | 0.027 µM | [54] |
| Molecularly imprinted nanoparticles | Surface plasmon resonance | NA | [55] |
| Pyridine-AuNPs | SERS | 50 nM | [34] |
| Silver nanoparticles | SERS | 10pM | [56] |
| Peptide-AuNPs | SERS, Colorimetric, Fluorescence, Paper strip | 0.3 M by optical spectroscopy 76 nM with SPR detection 10 pM by SERS |
Present work |
Disclaimer/Publisher’s Note: The statements, opinions and data contained in all publications are solely those of the individual author(s) and contributor(s) and not of MDPI and/or the editor(s). MDPI and/or the editor(s) disclaim responsibility for any injury to people or property resulting from any ideas, methods, instructions or products referred to in the content. |
© 2025 by the authors. Licensee MDPI, Basel, Switzerland. This article is an open access article distributed under the terms and conditions of the Creative Commons Attribution (CC BY) license (http://creativecommons.org/licenses/by/4.0/).
Copyright: This open access article is published under a Creative Commons CC BY 4.0 license, which permit the free download, distribution, and reuse, provided that the author and preprint are cited in any reuse.


