
Submitted:
13 August 2025
Posted:
14 August 2025
You are already at the latest version
Abstract
Low-temperature oxidation of titanomagnetite in oceanic basalts distorts the primary thermoremanent magnetization (TRM) signal essential for reconstructing Earth’s magnetic field history, though the specific impact of magma intrusion-induced oxidation on paleointensity preservation remains poorly constrained. This investigation simulates such oxidation processes through isothermal annealing (260 ◦C; 50 μT field; durations 12.5–1300 hours) of Red Sea rift basalts (P72/4), employing the Thellier-Coe method to quantify how chemical remanent magnetization (CRM) overprinting affects TRM fidelity under controlled field orientations aligned either parallel or perpendicular to the initial TRM. Results demonstrate bimodal Arai-Nagata plots with reliable TRM preservation below 360 ◦C but significant alteration artifacts above this threshold. Crucially, field orientation during oxidation critically influences accuracy: parallel configurations maintain fidelity (±3% deviation at Z = 0.48), while perpendicular fields introduce systematic biases (38% overestimation at Z = 0.15; 20% underestimation at Z > 0.48), attributable to magnetostatic interactions in core-shell grain structures. These findings establish that paleointensity reliability in oxidized basalts depends fundamentally on the alignment between oxidation-era magnetic fields and primary TRM direction, necessitating stringent sample selection and directional constraints in marine paleomagnetic research to mitigate CRM-TRM interference.
Keywords:
paleomagnetism
; titanomagnetite
; TRM
; low-temperature oxidation
; thellier method
1. Introduction
Titanomagnetite is a typical, widely spread in nature ferrimagnetic mineral critical to paleomagnetic studies. They can be found frequently as tiny grains randomly scattered in the “non-magnetic” matrix of igneous and metamorphic rocks. Titanomagnetite Fe3-x Tix O4, is a cubic mineral with inverse spinel structure and forms a complete solid solution series between end-members magnetite (Fe3 O4, ) and ulvöspinel (Fe2 Ti O4, ), where x gives the fraction of ulvöspinel. The magnetic properties of a titanomagnetite heavily rely on their composition, degree of oxidation and distribution of cations within their crystal structure. As a result, these properties can be influenced not just by their formation process, but also by their thermal history afterward.
During the formation of basalts, titanomagnetite grains record information about the direction and intensity of the Earth’s magnetic field in the form of NRM. This record finds applications in many areas of geophysics, as it carries information about the evolution of the Earth’s geomagnetic dynamo and the movement of tectonic plates [1]. In an ideal case, assuming that no chemical transformations of titanomagnetite grains have occurred, this information can be extracted with great accuracy. However, most basalts undergo chemical transformations that distort the initial natural remanent magnetization (NRM).
Under appropriate conditions, titanomagnetites can oxidize to form titanomaghemites Fe(3-x)R Tix R 3(1−R) O4, where □ represents a vacant lattice site that is typically occupied in the stoichiometric state and [2,3]. The contraction of the crystal lattice near a highly oxidized grain surface can cause crystal failure where composition gradients and resulting stress are high. Microstructural changes due to grain splitting or cracking are also likely to affect the intensity and stability of remanence.
It is generally accepted that the majority of titanomagnetites found in volcanic rocks (for example oceanic basalts) possess NRM of a thermal origin (TRM). The thermodynamic instability of natural titanomagnetite particles in natural conditions not only results in alterations to their magnetic properties [3,4], but also facilitates the formation of what is referred to as chemical remanent magnetization (CRM) when chemical changes occur at a constant temperature [5,6]. However, another form of chemical magnetization that can develop in rocks is known as thermochemical remanent magnetization (TCRM). This type of magnetization is defined as the magnetization that arises from chemical changes occurring during the primary cooling of the rock from its Curie temperature [7].
Alteration processes in titanomagnetites, resulting in modifications to its NRM, obviously influences on paleointensity experiments conducted in laboratory conditions. The NRM of the ocean floor is carried by titanomagnetite grains and shows a consistent long-term pattern that is related to the amplitudes of marine magnetic anomalies. Initially, there is a significant decline in magnetization intensity, followed by a minimum point at around 20 million years (Myr) old and a gradual increase in magnetization intensity up to the age of 120 Myr afterward [8]. The decrease in NRM in the first 10–20 million years is due low-temperature oxidation of titanomagnetite which occurs after initial cooling [9]. The superimposed TRM and CRM (TCRM) poses significant challenges for paleointensity determination, as secondary CRM components can overprint the primary TRM signal, rendering conventional interpretation of Zijderveld and Arai-Nagata diagrams invalid [10,11,12]. At the same time, the formation of TRM in titanomagnetite grains within underwater basalt during primary cooling occurs without oxidation. This is due to the quenching type of cooling and an excess of sulfur over oxygen following the crystallization of oxides and silicates [1].
The uncertainties in existing literature data regarding the ability to reliably constrain paleointensity estimates have stimulated renewed investigations into single-phase oxidized titanomagnetites. In studies focused on laboratory modeling of titanomagnetite oxidation and comparative analysis of chemical (CRM) and thermoremanent (TRM) magnetization properties [13,14,15,16], the authors have reached a consensus on several key findings, despite quantitative discrepancies. First, CRM and TRM acquired by single-phase oxidized titanomagnetites exhibit near-indistinguishable behavior on Arai-Nagata diagrams. Second, the direction of CRM aligns consistently with the applied magnetizing field (the reaction temperature is higher than the curie temperature). Third, paleointensity estimates derived from CRM are systematically underestimated by a factor of 1.5 to 5. These observations underscore a critical implication: if the natural remanent magnetization of volcanic rocks is a priori interpreted as TRM, this assumption may lead to significant errors in reconstructing the magnitude of the ancient geomagnetic field.
Despite recent publications on this topic, it should be noted that none of the aforementioned studies have investigated the possibility of determining paleointensity from the magnetization of single-phase oxidized titanomagnetite when the reaction temperature is below the Curie temperature () of the original phase. Previous studies under such conditions primarily focused on the kinetics of single-phase oxidation [6,17,18], the directional properties of CRM and TRM during reaction progress [9,19,20], as well as the potential for self-reversal of magnetization in partially oxidized titanomagnetites [21,22,23].
Recent studies have simulated CRM formation scenarios under geologically realistic conditions, which distort the original paleomagnetic signal recorded in TRM or NRM of thermal origin [24,25]. In particular, the work [24] demonstrated that Arai-Nagata diagrams exhibit dual slopes when CRM and NRM (TRM origin) are superimposed almost perpendicularly, causing a 25% to 30% underestimation of paleointensity. The study [25] demonstrates that secondary CRM obscures the primary TRM, rendering the standard interpretation of linear segments on Zijderveld and Arai-Nagata diagrams unreliable. This results in significant inaccuracies: magnetic field intensity estimates may deviate by up to , while paleodirectional errors can exceed . The authors highlight the critical need for an integrated methodology that combines mineralogical analysis with advanced paleomagnetic techniques. Such an approach is essential to improve the reliability of reconstructions of the Earth’s ancient magnetic field, ensuring robust differentiation between primary and secondary magnetization components.
This study investigates the potential for determining magnetic field intensity through thermoremanent magnetization (TRM) in titanomagnetite subjected to varying degrees of low-temperature single-phase oxidation, specifically modeling magma intrusion-induced oxidation processes. Utilizing a laboratory-controlled approach validated in prior experimental studies [24], we simulate CRM overprinting onto primary TRM through isothermal annealing of natural basalt samples. This methodology replicates key aspects of natural geodynamic processes where secondary thermal events (e.g., magma intrusion into fracture systems) create thermal gradients that differentially affect titanomagnetite grains based on their intrinsic properties.
The experimental design enables precise simulation of CRM acquisition under controlled magnetic fields ( T) at sub-Curie temperatures (), characteristic of low-temperature oxidation. Critically, our approach accounts for the heterogeneous response of titanomagnetite grains: those with retain primary TRM characteristics, while grains with develop CRM - a dichotomy directly analogous to thermal zonation during magma intrusion. Given the persistent challenge of distinguishing TRM from CRM in natural remanent magnetization (NRM), we examine component separation methods relevant to such thermally stratified systems. While laboratory oxidation cannot perfectly replicate natural maghemitization, this investigation advances paleointensity determination accuracy by quantifying CRM-TRM interference in realistically transformed titanomagnetite systems.
2. Equipment and Experimental Procedure
2.1. Selection and Preparation of Samples
Samples were taken from 30 cm long piece of basalt P72/4 from the Red Sea rift zone. This piece of basalt was collected during the 30th voyage (1980) of the Akademik Kurchatov research vessel [26,27]. Red Sea rift basalts from this collection [26] are low-potassium oceanic tholeiites (K2O ≤ 0.2%) exhibiting large-porphyritic textures with plagioclase phenocrysts up to 15 vol%. They display depleted geochemistry—low lithophile elements (Li, Be, Rb, Sr, Zr, Nb, Ba, Hf) and minimal volatiles (dominant H2O)—alongside iron enrichment and normative quartz. These features indicate deep tholeiitic melt differentiation under low pressures (<5 kbar), confirming mid-ocean ridge-type spreading forms young oceanic crust here.
The selection site is located in the southern Red Sea, specifically in the region with the coordinates 56.00’ N and 5.60’ E. Based on the tectonic scheme proposed by Monin in 1985 [27], the piece of rock was obtained from the Holocene basalt plain.
The piece of basalt P72/4 was initially separated into layers approximately 10–11 mm high. These layers underwent polishing and were subsequently sliced into narrow strips. Finally, parallelepiped strips were then transformed into small cubic samples, each possessing a uniform edge length of 10 millimeters.
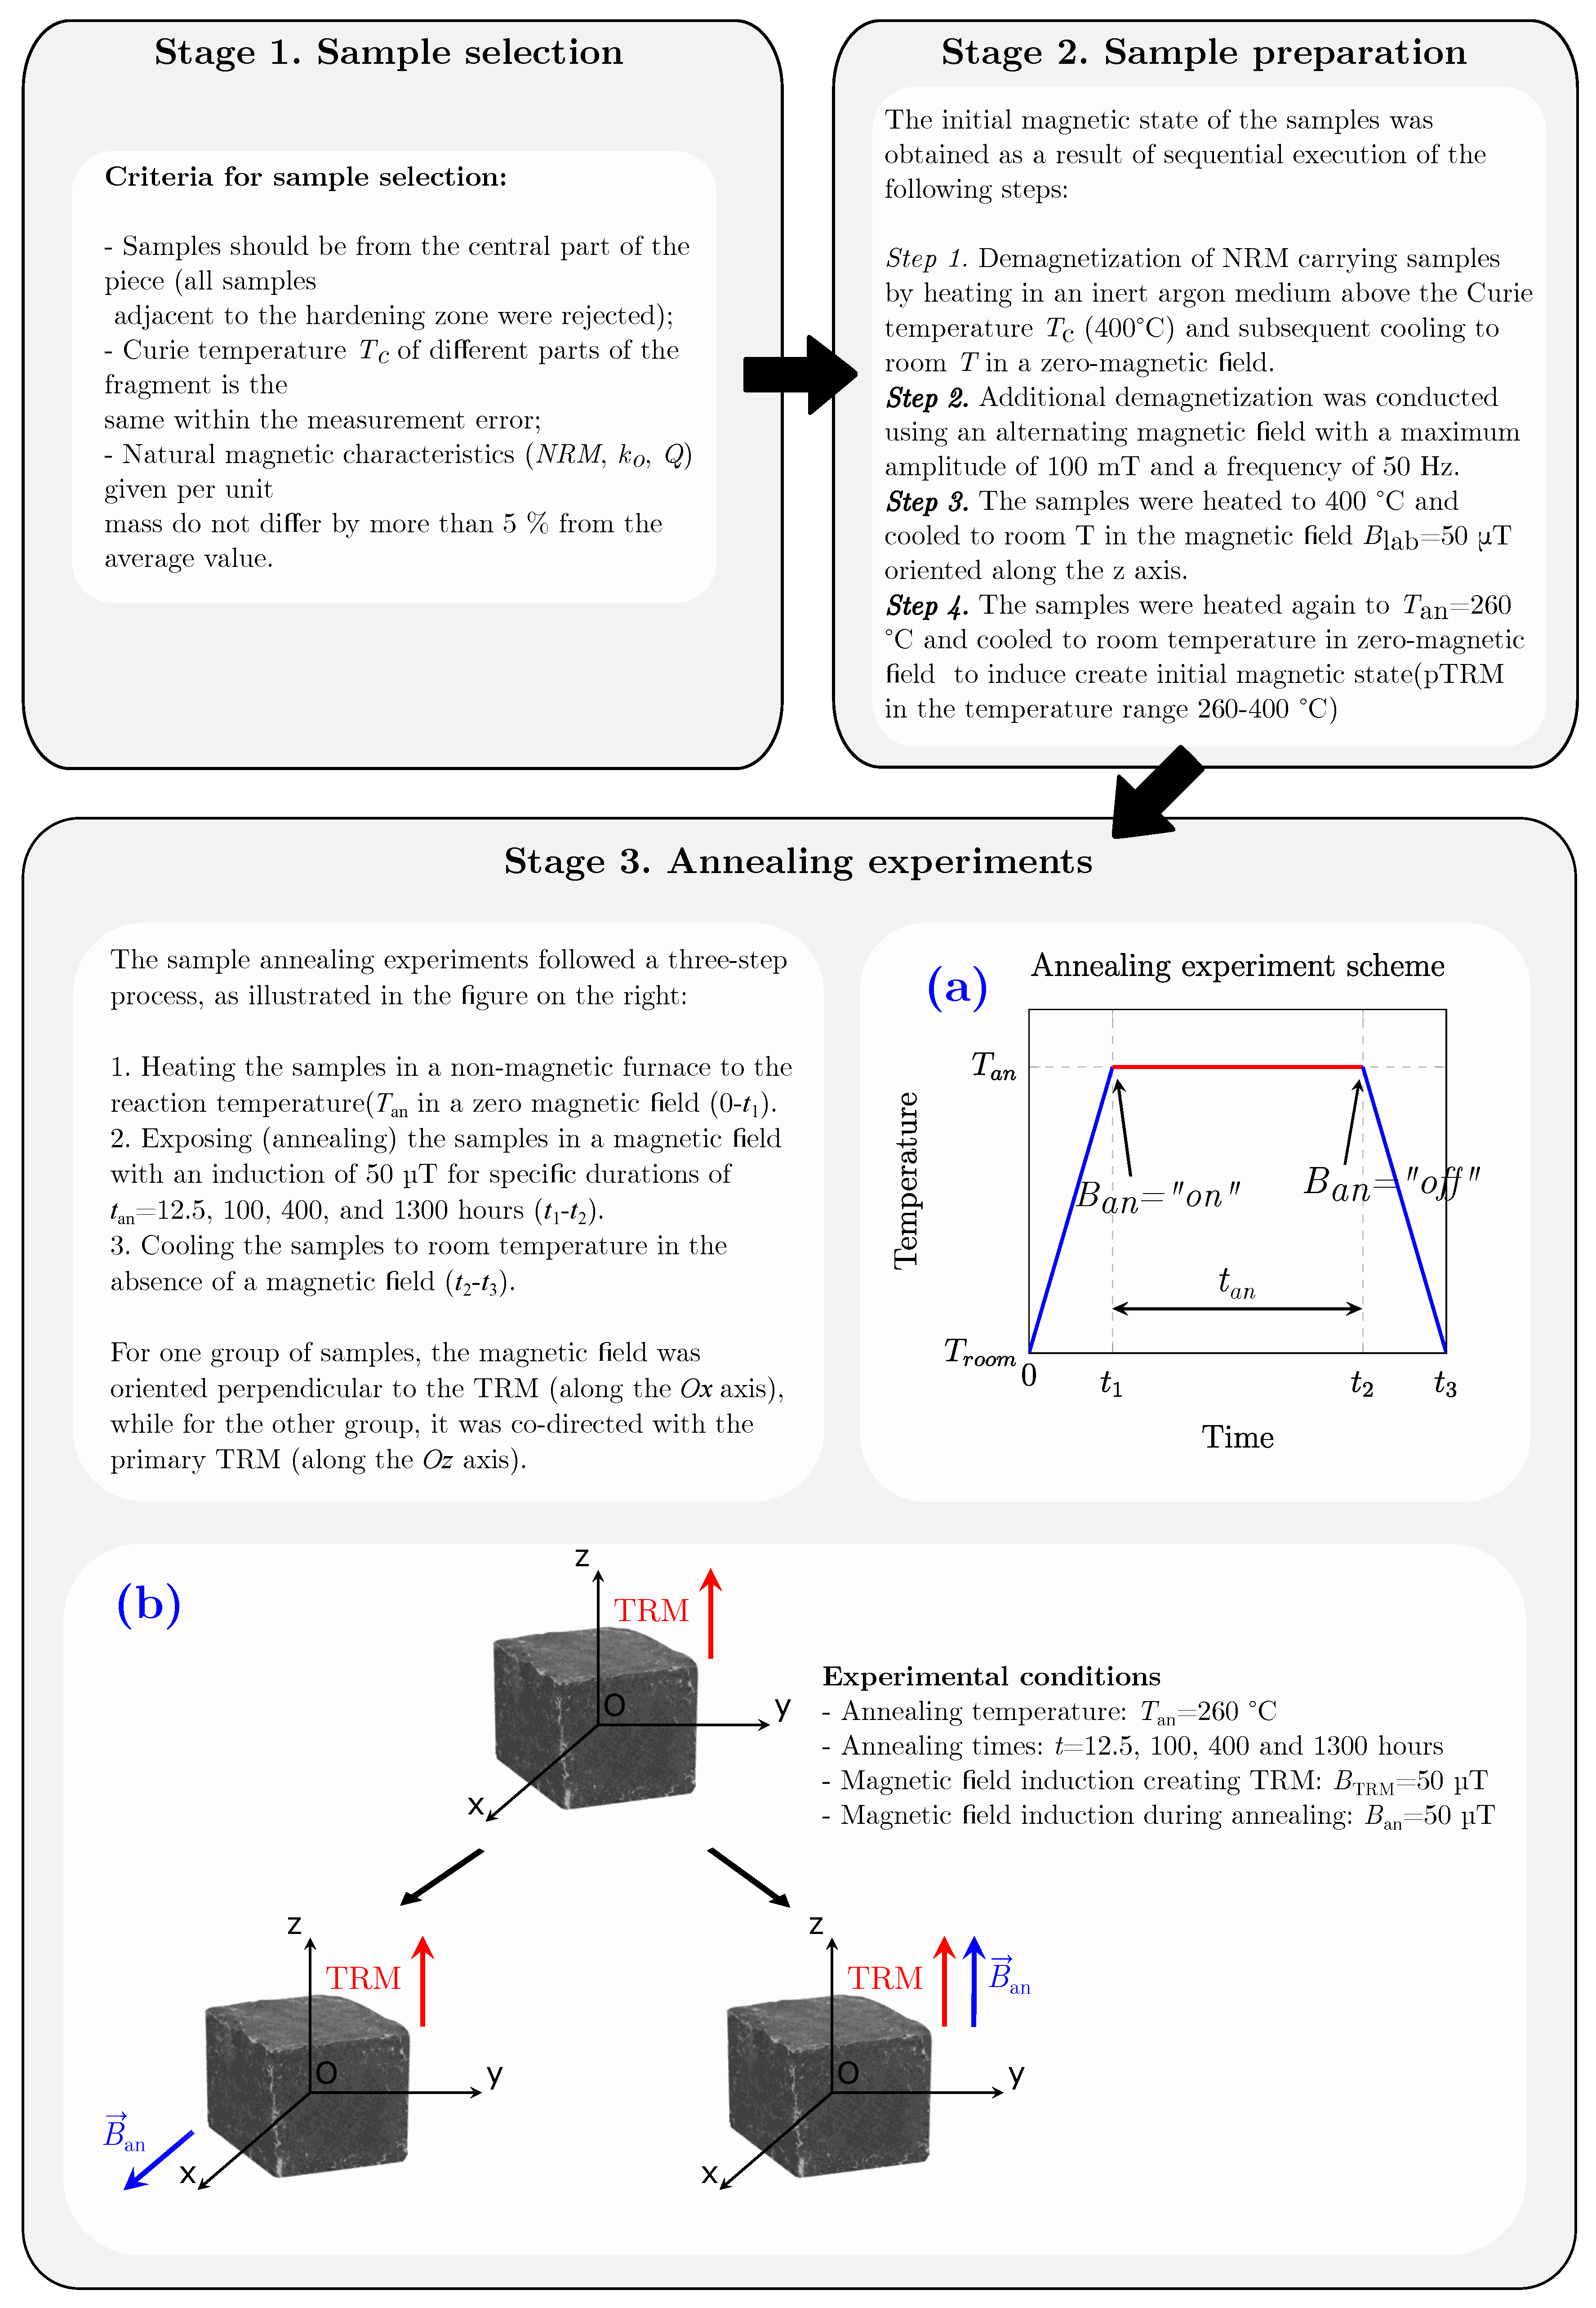
A significant fraction of the cubic samples P72/4 were culled and a collection with a low variation of natural magnetic characteristics was formed. In forming the collection, we were guided by the following criteria:
- Samples should be from the central part of the piece (all samples adjacent to the hardening zone were rejected);
- Curie temperature of different parts of the fragment is the same within the measurement error;
During the “sampling” phase, the NRM was systematically removed. As illustrated in A1, the samples were first subjected to demagnetization at a temperature of within an inert argon atmosphere. Following this treatment, the samples were exposed to a variable magnetic field with an amplitude of T. The residual magnetization observed after both treatments was measured to be less than 0.3 A/m, which corresponds to approximately 0.5% of the initial NRM value.
Therefore, a collection of about 50 cubic samples of a P72/4 basalt were selected for alteration (CRM acquisition) experiments. These demagnetized specimens were subsequently prepared to acquire laboratory-induced thermoremanent magnetization (TRM) in a controlled magnetic field, simulating paleomagnetic signal acquisition conditions.
2.2. CRM Acquisition Experiment Scheme
The in situ oxidation of titanomagnetite grains from P72/4 basalt was modeled using a classical approach involving isothermal annealing at elevated temperature in a magnetic field . The experimental methodology for CRM acquisition consisted of the following sequential steps A1:
- Primary TRM acquisition: Samples were heated to and cooled to room temperature () in a controlled magnetic field oriented along the z-axis.
- Initial state preparation: Samples were reheated to and cooled to in zero magnetic field, establishing a partial thermoremanent magnetization (pTRM) in the 260 to 400 interval.
-
Isothermal annealing: Samples underwent thermal processing in a non-magnetic furnace according to the protocol:
- (a)
- Heating: Heating to in zero field
- (b)
-
Annealing: Isothermal exposure at for durationsin field
- (c)
- Cooling: Return to in zero magnetic field
Thus, the initial "paleomagnetic" signal is encapsulated within a partial thermoremanent magnetization (pTRM) characterized by blocking temperatures ranging from 260 to 400. For the purposes of this study, we will refer to this as thermoremanent magnetization (TRM) or original TRM.
2.3. Instruments
To investigate the magnetic properties of titanomagnetites subjected to oxidation through laboratory annealing, a comprehensive suite of standard experimental techniques employed in rock magnetism and paleomagnetism was utilized. NRM of samples was quantified using the JR–6A rotational magnetometer (AGICO). This variant of the rotational magnetometer is characterized by the incorporation of an automatic sample positioning manipulator, which facilitates the automated measurement of all components of the remanent magnetization vector using only one setting.
Curie points were determined through experimental investigations of temperature-dependent magnetic susceptibility , employing both heating and cooling curves. These experiments were conducted using the AGICO MFK1–A kappa bridge within an argon atmosphere. Moreover, measurements of the initial magnetic susceptibility of basalt samples at room temperature were conducted both before and after the annealing process, utilizing this installation.
To evaluate hysteresis properties, including remanent saturation magnetization (), coercive force (), remanent coercive force (), and the evolution of chemical magnetization at the annealing temperature, measurements were performed using the VMA–1 vibration magnetometer. In order to ascertain the saturation magnetization () of ferrimagnetic grains, a magnetization curve was constructed with a maximum magnetic field of 1.5 T. The contribution of the paramagnetic matrix of basalt to the magnetization was considered, and its influence on the overall magnetization was evaluated from the linear region of the magnetization’s dependence on the magnetic field within the range of 1 T to 1.5 T.
Isothermal annealing was conducted in a cylindrical furnace featuring a magnetic shield designed by the authors, which enables the maintenance of temperature with an accuracy of ± over a range from room temperature to . To enhance the precision of thermal control, the heating power of the furnace was intentionally restricted. A special feature of this furnace is the ability to simultaneously create a weak magnetic field both along and across the axis of the furnace.
Demagnetization by an alternating field was performed on an AGICO LDA–3A installation. This demagnetizer allows the use of AF demagnetization fields from 1T to 100T. Stepwise temperature demagnetization was carried out in a special two-chamber furnace of the authors design, described in detail in previous work. The Thellier-Coe procedure was performed in the same furnace, as it is the only unit in our laboratory enabling Thellier method experiments in an argon atmosphere.
Electron probe microanalysis, including SE/BSE imaging and local X-ray spectroscopy, was performed at the Scanning Microscopy Group (D. S. Korzhinskii Institute of Experimental Mineralogy, RAS) using:
- Tescan Vega TS5130MM SEM with INCA Energy 450 EDS (Si(Li) PentaFET x3 detector)
- Tescan Vega II XMU SEM with INCA Energy 450 EDS (Si(Li) x-sight) and WDS (INCA Wave 700)
Spectrometer control and compositional analysis utilized INCA Suite v4.15 software. Experiments employed 20 kV accelerating voltage and 250pA to 500pA beam currents, with calibration against reference standards.
3. Results
3.1. Properties of the P72/4 Basalt in Initial State
The initial magnetic state of sample P72/4 basaltwas characterized by NRM = 38.8–63.3 A/m ( A/m), mass-normalized susceptibility /kg (/kg), and Königsberger ratio ( A/m) = 54–99 ().
The measured hysteresis parameters include the ratios (1.28) and (0.37) in Table 1. These ratios indicate that the ferrimagnetic grains reside in a pseudo-single-domain (PSD) state [28]. Thermomagnetic analysis confirms single-phase magnetic behavior for the titanomagnetite grains from basalt P72/4. The Curie point temperatures, determined from the heating and cooling curves, are and (Table 1). Chemical stability of the titanomagnetite grains upon heating in an argon atmosphere up to is indicated by the coincidence of and , derived from the heating and cooling branches of the curve, respectively. Saturation magnetization (), measured at T, is 2400 A/m.
The exceptional mean (81) far exceeds values typical of titanomagnetite-bearing oceanic basalts (–20), indicating dominant single-domain (SD) or pseudo-single-domain (PSD) grains. These form during rapid volcanic cooling or quenching, contrasting with slower-cooled multi-domain (MD) basalts. The observed linear correlation between NRM and confirms that magnetic variations primarily reflect domain state distributions (SD/PSD vs. MD), consistent with rapid cooling conditions that enhance magnetic stability.
Scanning electron microscopy (SEM) revealed that the ore fraction of sample P72/4 comprises skeletal or irregularly shaped titanomagnetite grains (Figure 1), with characteristic sizes on the order of and maximum dimensions of approximately . This morphology is indicative of rapid magma cooling, a hallmark of oceanic basalts.
Microprobe analysis of the grains in sample P72/4 revealed an ulvöspinel content ranging from 49.9%–55.08%. The average Curie temperature of the titanomagnetite grains, accounting for minor impurities of Mg ( at.%) and Al ( at.%), was determined to be , which aligns closely with experimentally measured values.
X-ray structural analysis yielded a lattice constant for the titanomagnetite. This value is consistent with the lattice parameter reported for basalts from the same region in a prior study [29]. The minimal discrepancy () further supports the compositional homogeneity of the titanomagnetite in sample P72/4. However, while the lattice parameters are closely matched, notable differences emerge in Curie temperatures: our sample exhibits , contrasting with the lower reported by Gribov et al. [29]. This difference suggests either a higher ulvöspinel component in their titanomagnetite solid solution and/or slightly elevated aluminum and manganese impurity content, both known to suppress Curie temperatures in titanomagnetites.
These results collectively indicate that the titanomagnetite within the basalt sample exhibits a chemically stable and uniform composition, with no significant deviations from regional magmatic trends.
3.2. Phase, Structural and Magnetic Characteristics of the P72/4 Basalt Sample After Annealing
From the data presented in Table 1, it is evident that annealing the P72/4 basalt sample at in a magnetic field results in partial destruction of the initial laboratory TRM. After h of annealing, the TRM decreases by ∼ 25 , despite an increase in saturation magnetization from 2400 A/m to 3030 A/m (a enhancement). The coercive force decreases from T to T ( reduction), while the remanent coercive force (calculated as ) declines from T to T ( reduction). Concurrently, the oxidation parameter Z increases from 0 to 0.56, and the Curie points shift from to . These changes in magnetic properties are consistent with single-phase oxidation of titanomagnetite. Minerals exhibiting similar maximum coercivities often display distinct unblocking temperatures, allowing for their subdivision according to the method proposed by Lowrie [30]. Notably, titanomagnetite and titanomaghemite are exceptions to this rule, as their coercivities are comparable to those of magnetite, but their unblocking temperatures can range from room temperature to the Curie temperature of magnetite, depending on grain distribution and mineral composition. However, this peculiarity can be leveraged to confirm the single-phase nature of titanomagnetite oxidation. The thermal demagnetization behavior of the three-component IRM of the P72/4 basalt in initial state, Figure 2a, reveals a smooth decrease in all three orthogonal components of the isothermal remanent magnetization (IRM) between and , indicating a broad range of release temperatures and the absence of additional magnetic minerals besides titanomagnetite.
The oxidation of titanomagnetite through annealing in air does not alter the temperature dependence of the IRM components, but rather results in an increase in the maximum temperature of IRM destruction, reaching approximately for Z ≈ 0.5. This feature confirms the single-phase nature of titanomagnetite oxidation, which preserves the spinel structure. In contrast, hematite and magnetite are not detected according to the results of this procedure in agreement with the results of a thermomagnetic analysis.
Figure 3.
Stepwise alternating field (AFD) (a) and temperature demagnetization (TD) (b) of P72/4 basalt samples undergoing single-phase oxidation in a magnetic field parallel to the initial TRM. Normalized and component intensity is plotted as a function of applied AF field peak and temperature. The AFD and TD curves representing the initial thermoremanent magnetization (TRM) are depicted by red dashed lines. Magnetic field induction creating initial TRM 50T
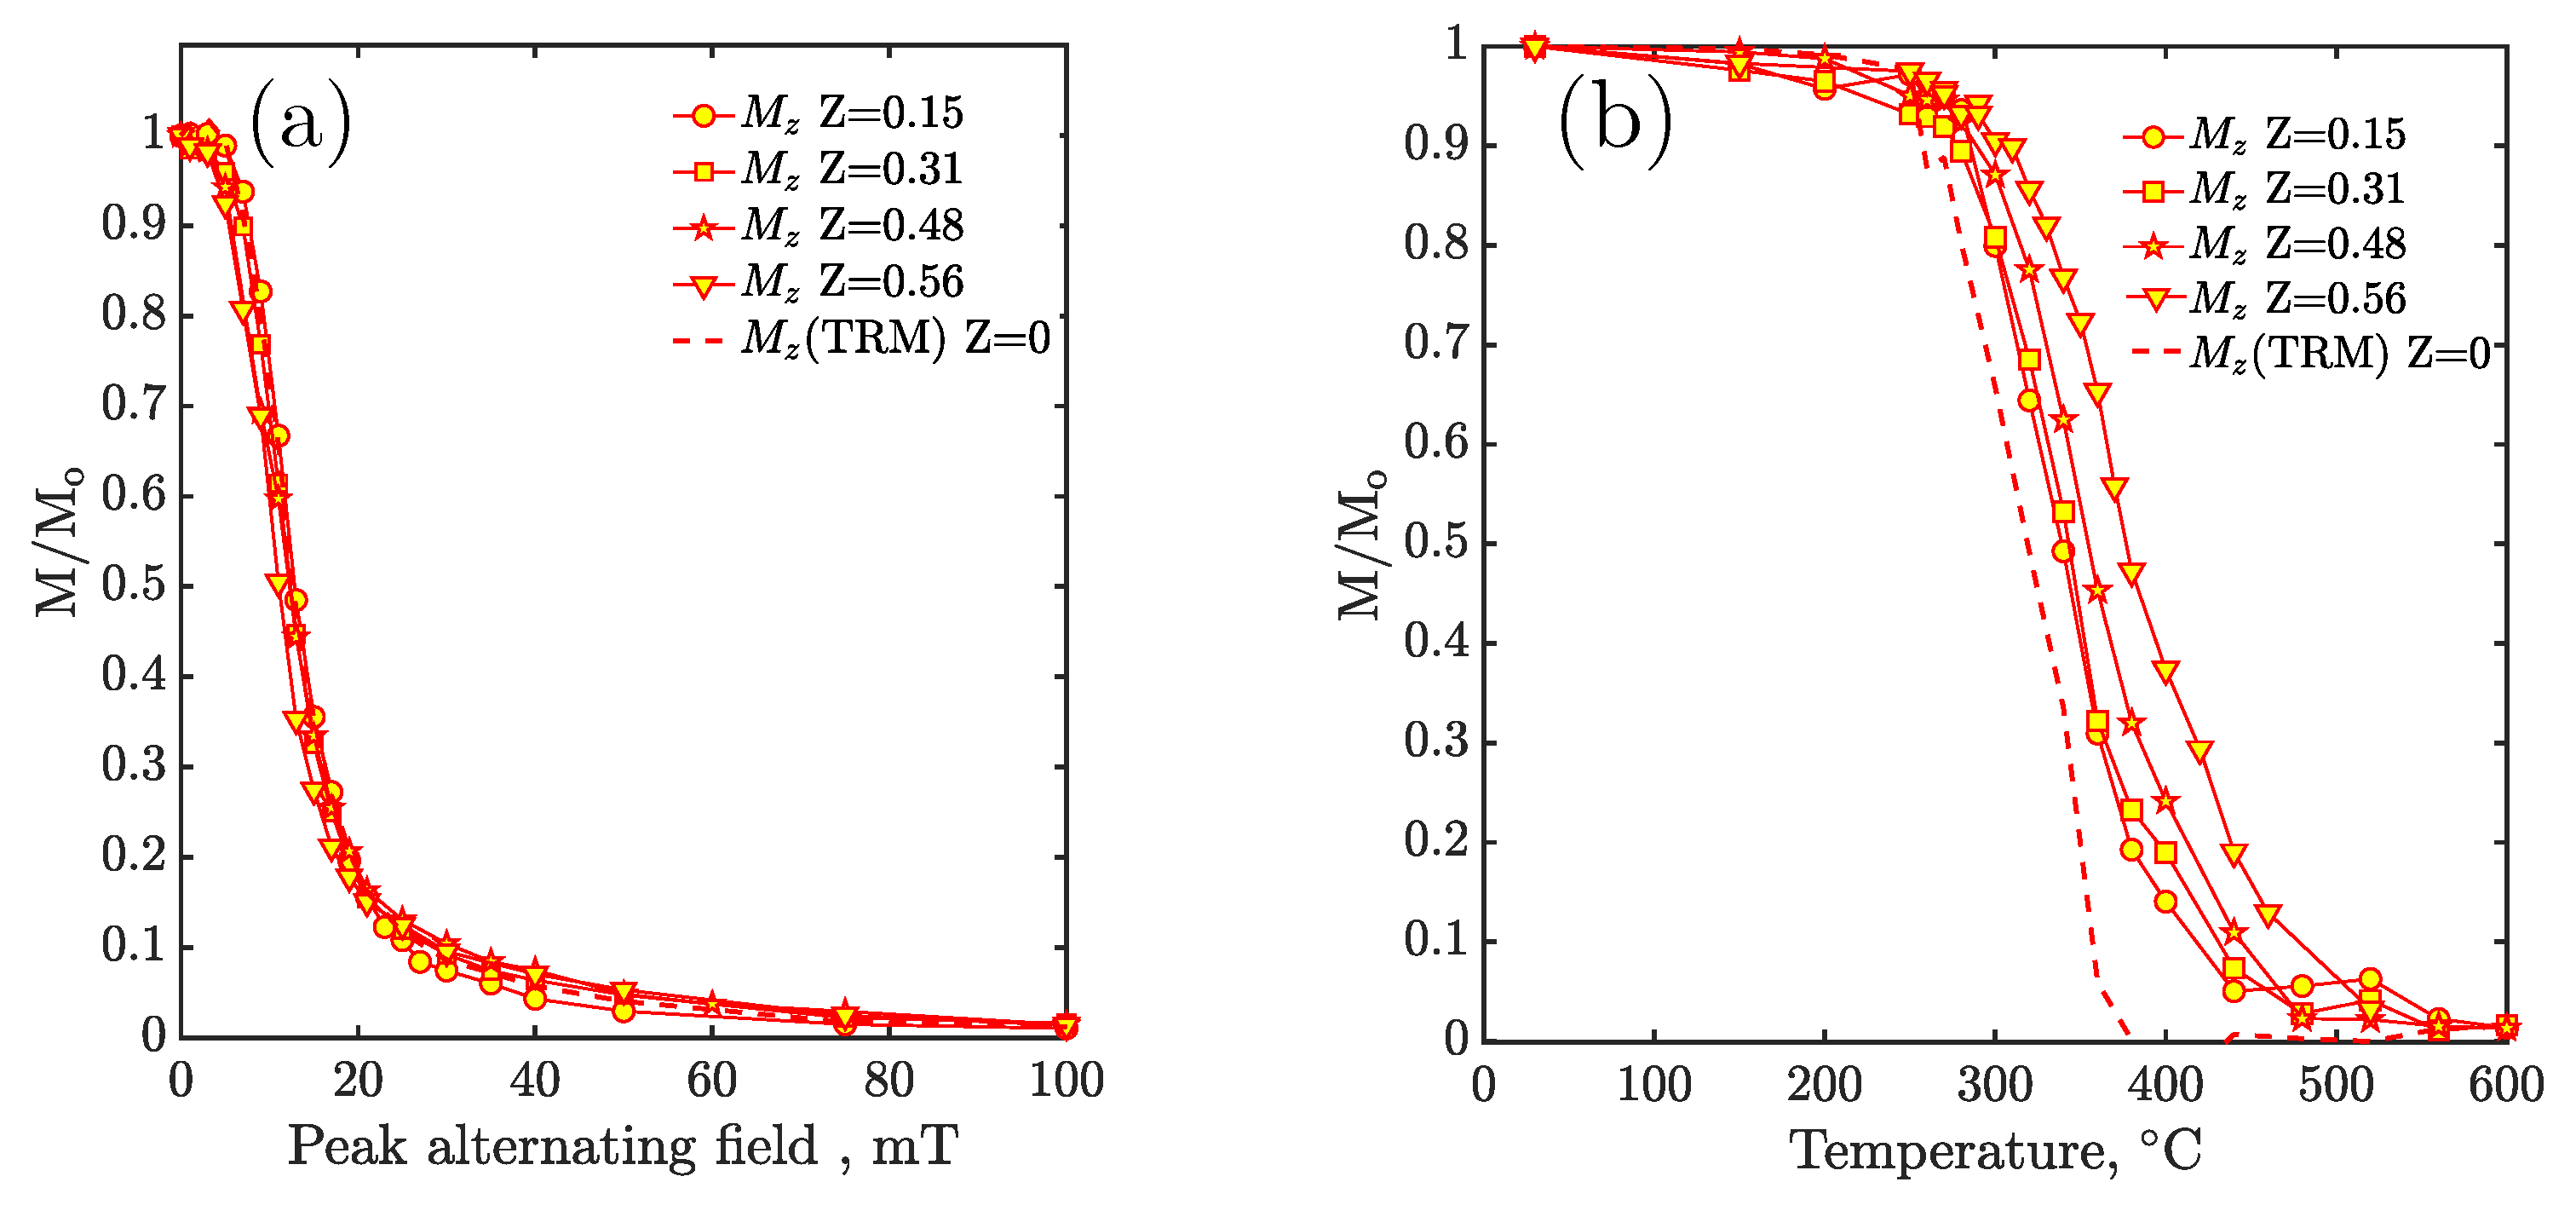
The stepwise alternating field (AFD) and temperature demagnetization(TD) showed that the magnetization of most samples mainly consists of two components. When the CRM was acquired in a magnetic field parallel to the initial TRM, the superimposed components could not be effectively resolved. Zijderveld diagrams exhibited a single linear segment, indicative of a unimodal magnetization composition (Figure 2a. In contrast, annealing in a perpendicular magnetic field enabled discrimination between the CRM and TRM components through both thermal demagnetization and alternating field (AF) stepwise demagnetization (Figure 2b)
A greater interest is represented by the results of TD and AFD samples oxidized in a magnetic field perpendicular to the original TRM Figure 4. The CRM component (denoted as ), acquired on grains with Curie temperatures () below the reaction temperature of , displayed a broader coercivity spectrum and higher magnetic stability in fields exceeding 17mT–20mT (Figure 4a). Progressive annealing over 1300 hours induced a systematic shift in the blocking temperature spectrum of the primary TRM () toward higher values, with maximum unblocking temperatures reaching (Figure 4b). This shift correlates with an oxidation degree parameter .
3.3. Thellier Experiments on Oxidized Titanomagnetite
Basalt samples P72/4, which underwent oxidation due to annealing in a magnetic field oriented both perpendicular and parallel to the TRM, were subjected to the Thellier procedure [31] in the modified form of the Coe[32] definition for the calculation of the TRM creation field.
Based on the experimental scheme A1 detailing the thermal effects on the samples, it can be concluded that information regarding the calculated value of the magnetic field (“paleointensity”) can only be obtained from the portion of the thermoremanent magnetization (TRM) characterized by blocking temperatures . This conclusion arises from the fact that the cooling process from to room temperature transpired in the absence of an external magnetic field.
The suitability of the starting material for absolute intensity determination was assessed using the Thellier-Coe method. As illustrated in the Arai plot Figure 5 the calculated field intensity value T for sample P72/4(95) demonstrates satisfactory agreement with the laboratory-induced TRM creation field T, acquired during cooling from to room temperature. The Zijderveld diagram for the zero-field steps is characterized by a singular linear segment. The close correspondence between and (relative deviation of ), combined with the dominant linear segment in the Arai plot, suggests that sample P72/4(95) generally fulfills the criteria for reliable paleointensity determination. This conclusion is quantitatively supported by statistical parameters from Table 2: the quality factor substantially exceeds the acceptance threshold (), while the uniformity parameter and fraction used approach ideal values. The mean deviation of pTRM checks () falls below critical levels (), and the standard deviation of the slope indicates minimal data scatter.
Deviations of the Arai-Nagata plot on Figure 5 on from ideal behavior occurs in two temperature intervals: (1) Below C, minor departures from linearity in the Arai plot are attributed to viscous remagnetization effects, and (2) above C, nonlinearity likely results from chemical alteration of magnetic carriers during thermal treatment. Notably, these high-temperature alterations persist despite implementing an inert argon atmosphere during the experiment.
The Arai plots for basalt samples P72/4 oxidized under a magnetic field parallel to initial TRM consistently exhibited bimodal linear segments: C and C Figure 6 (1a-1d). This structural feature persisted across all annealing durations () and oxidation intensities (Z), reflecting fundamental characteristics of titanomagnetite oxidation under controlled magnetic conditions. The lower-temperature segment (C) corresponds to grains retaining primary TRM characteristics, where initial Curie temperatures (C) exceeded the reaction temperature ().
Interpretation of the C interval as recording the original paleointensity () reveals significant oxidation-dependent accuracy variations:
- -
- For moderately oxidized samples ( after h; Table 1), specimen 72/4(98) yielded versus (deviation ∼3%), consistent with favorable statistical parameters: quality factor , fraction used , and mean deviation Table 2).
- -
- Under advanced oxidation ( after h; Table 1), specimen 72/4(138) demonstrated significant overestimation ( versus , ). This distortion correlates with compromised quality metrics: although remains formally acceptable, the reduced usable fraction () and elevated approach critical thresholds.
The divergent accuracy between oxidation stages highlights progressive alteration mechanisms: while moderate oxidation () preserves TRM fidelity, extended annealing induces CRM overprinting that systematically biases results despite maintained Arai plot linearity. The upper segment (C) consistently yielded unreliable estimates regardless of Z, confirming its association with secondary chemical remanence.
For titanomagnetite grains in P72/4 basalt oxidized under perpendicular magnetic fields ( TRM), paleointensity determinations exhibited systematic inaccuracies across all oxidation levels. As shown in Figure 5 (2a-2d), Arai plots displayed consistent bimodal segments (C and C), but directional bias increased with oxidation severity:
- -
- After brief annealing (12.5 h, ), specimens showed severe overestimation (), exemplified by specimen 72/4(153) yielding versus despite acceptable q-factor.
- -
- Under advanced oxidation (400-1300 h, ), results shifted to consistent underestimation (). Specimen 72/4(157) () returned , while 72/4(160) () showed identical underestimation (), both exhibiting degraded q-factors and elevated DRAT values.
This directional sensitivity - where orthogonal CRM acquisition systematically distorts paleointensity estimates - contrasts fundamentally with parallel-field results. The transition from over- to underestimation with increasing Z suggests progressive dominance of CRM components antiparallel to the original TRM direction.
Figure 7.
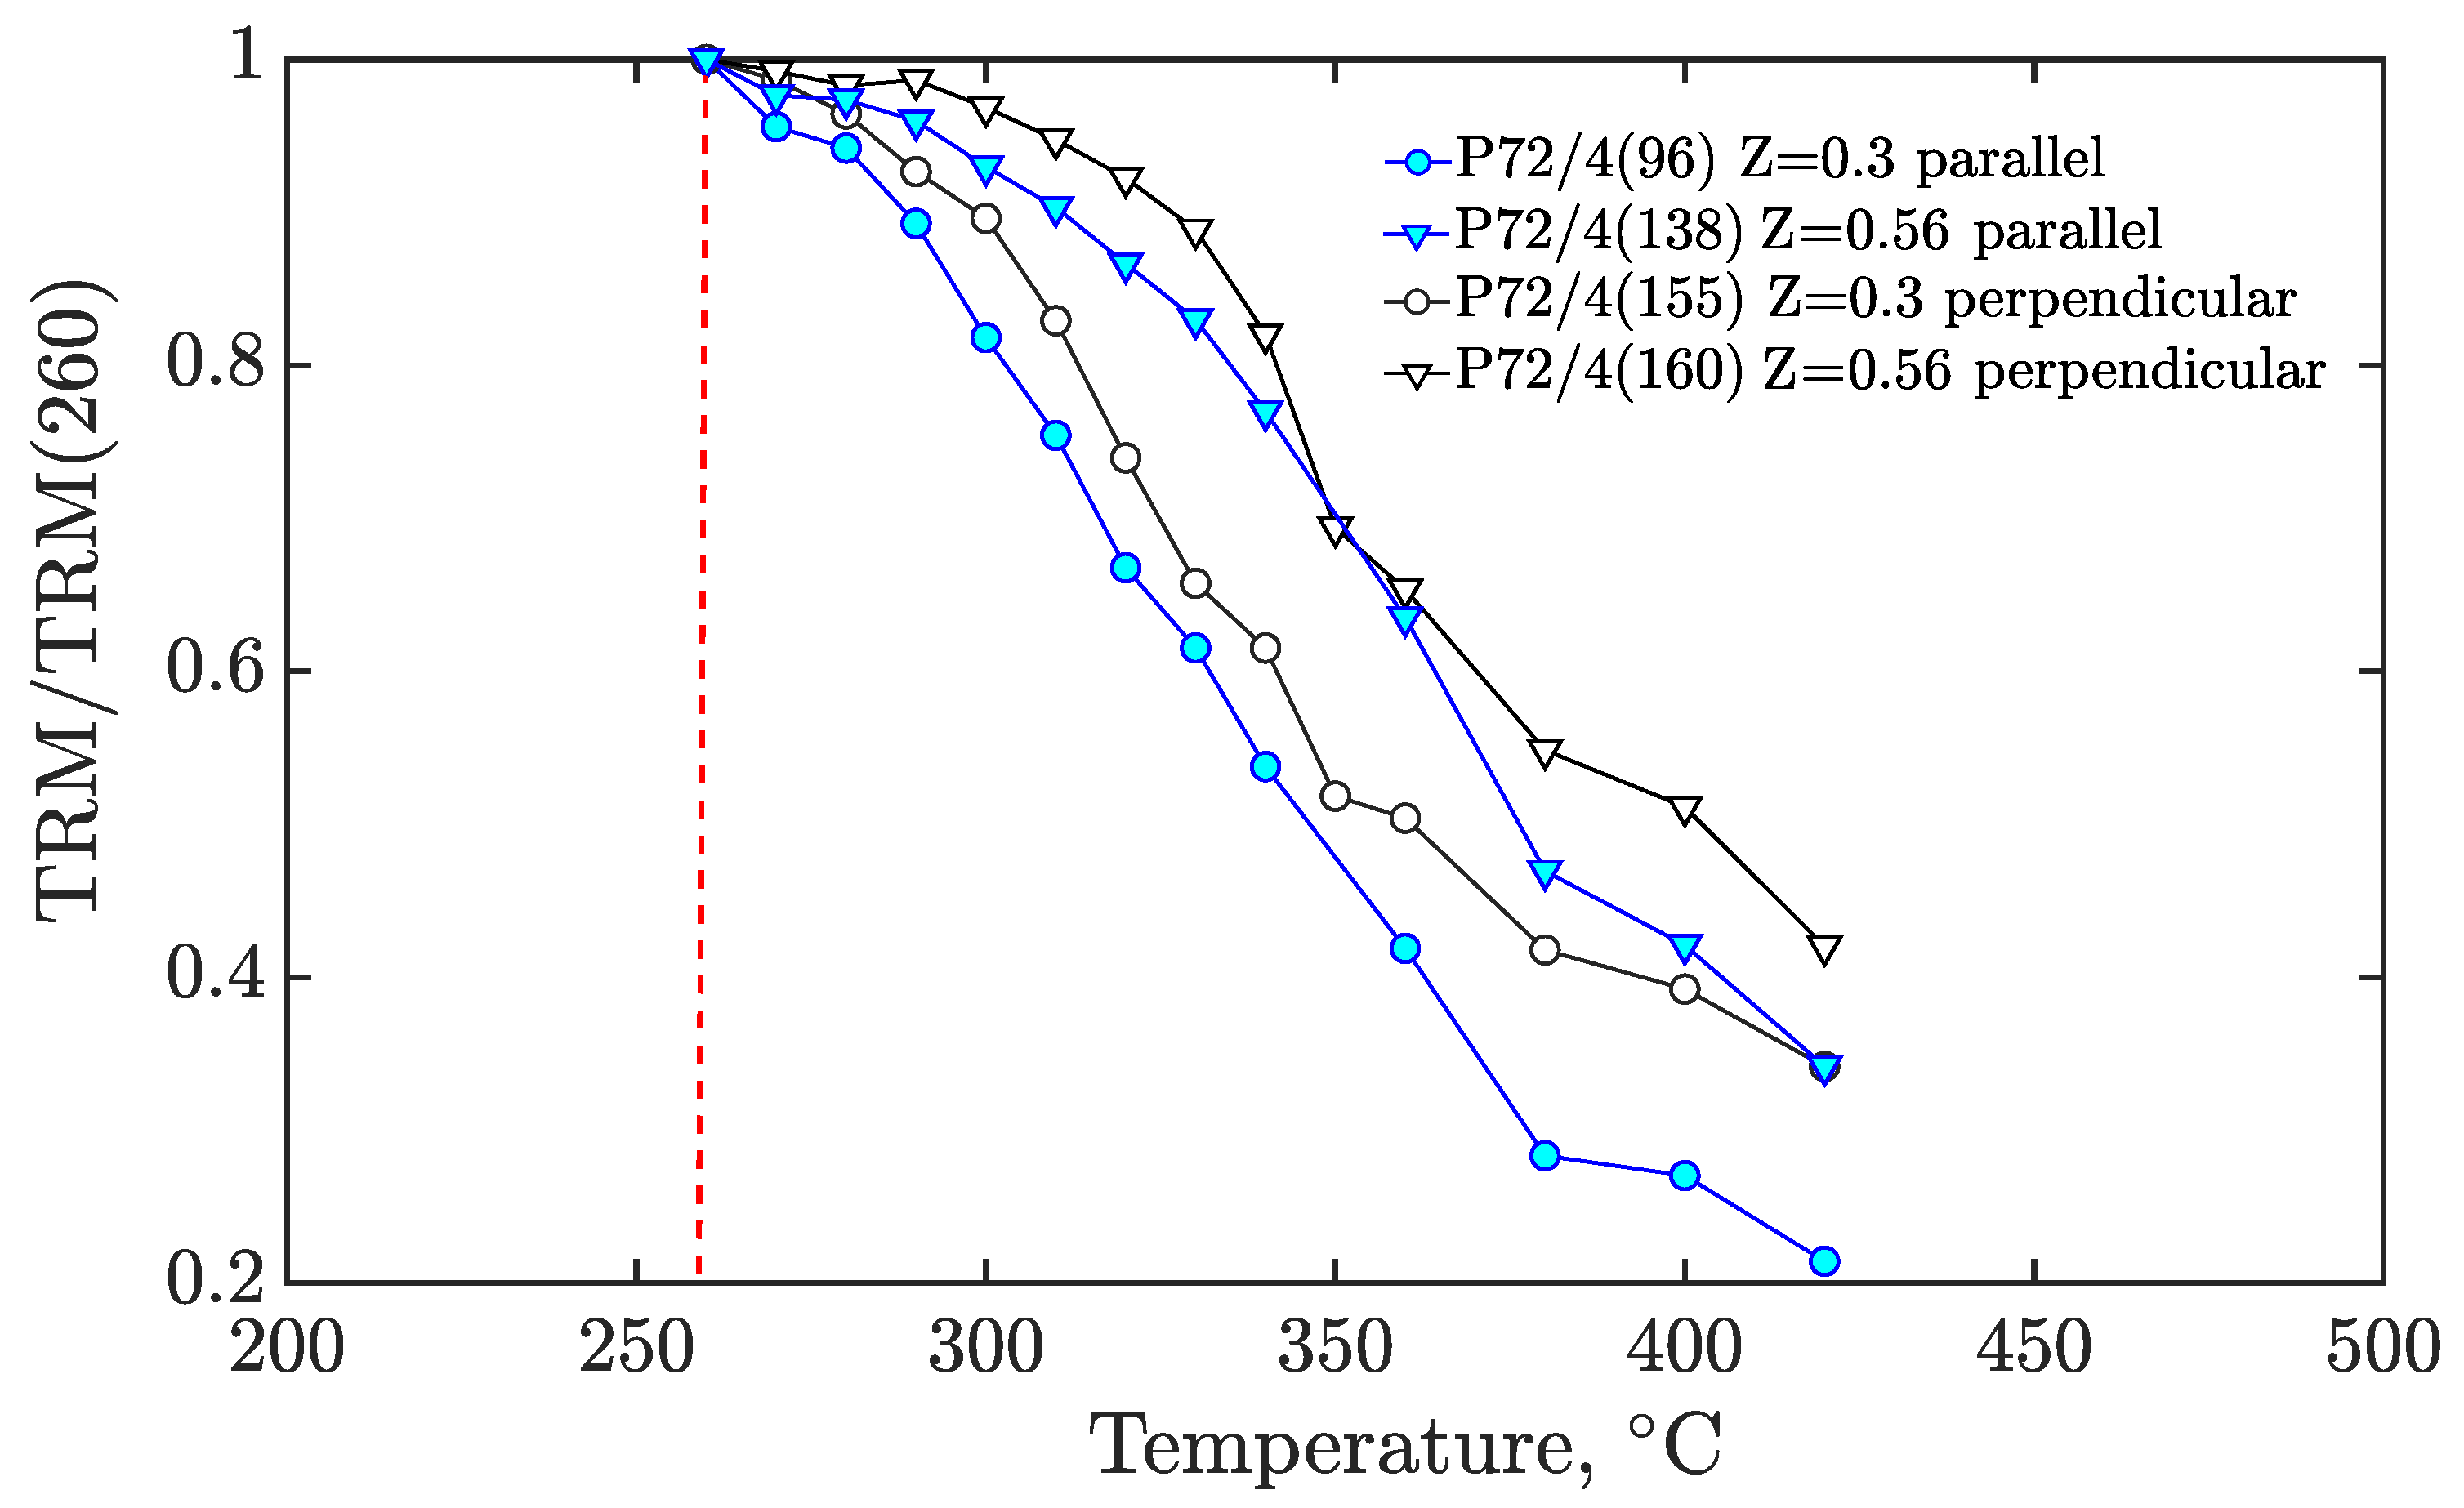
Stepwise temperature demagnetization (TD) acquired in zero field steps of Thellier-Coe procedure of P72/4 basalt samples undergoing single-phase oxidation in a magnetic field parallel and perpendicular to the initial TRM. The TRM obtained in zero field cycles is normalized to the value of TRM at a temperature of 260. Magnetic field induction creating initial TRM: 50T.
Figure 7.
Stepwise temperature demagnetization (TD) acquired in zero field steps of Thellier-Coe procedure of P72/4 basalt samples undergoing single-phase oxidation in a magnetic field parallel and perpendicular to the initial TRM. The TRM obtained in zero field cycles is normalized to the value of TRM at a temperature of 260. Magnetic field induction creating initial TRM: 50T.
4. Discussion
Experiments on titanomagnetite oxidation at a temperature of °C corresponding approximately to the maximum of the blocking temperatures spectrum on basalt samples with thermoremanent magnetization showed that the quality of determining paleointensity depends both on the degree of single-phase oxidation and on the direction of the magnetic field during oxidation.
Let us try to understand the processes that lead to such a result. It is known from the literature [6,8] that with an increase in the degree of single-phase oxidation, the Curie temperature of titanomagnetite also increases. We have previously [13,14] shown on the same basalt samples that with an increase in the annealing time or the degree of single-phase oxidation, the spectrum of blocking temperatures also shifts toward higher values. With an increase in the annealing time, the unimodal distribution of the unblocking temperature spectrum becomes bimodal. For example, after annealing for 1300 hours, two maxima were observed in the blocking temperatures spectrum at temperatures of approximately C and C; in the initial state the maximum of the blocking temperatures spectrum was in the region of C.
It was previously described that part of the thermoremanent magnetization formed from °C was demagnetized as a result of heating the samples to temperatures of °C in the absence of a magnetic field, i.e., part of the TRM with blocking temperatures °C was removed. This magnetization was designated by us as TRM*. Thus, annealing in a magnetic field was carried out on samples having part of the initial thermoremanent magnetization with unblocking temperatures above C.
A model is proposed that qualitatively explains the properties of TRM* altered by annealing. Let the rock be dominated by randomly oriented elongated particles, which is typical for the skeletal structure of titanomagnetite grains in the basalts studied. In the initial stages of titanomagnetite oxidation in basalts, the formation of core-shell particle assemblies is typical.
Let us choose two limiting cases, parallel and perpendicular arrangement of the ellipsoid axis relative to the external field and the initial TRM. In the experiment, we tested two variants of the direction of the magnetic field acting during the annealing process: and . The magnetization states that arise during oxidation in the core-shell particles are schematically illustrated in Figure 8. In the figure, the number I denotes grains whose initial blocking temperature is lower than the annealing temperature , and the number II denotes .
Let us consider the case of , . During annealing in air, the surface part of the grain is strongly oxidized, and when passes through , chemical magnetization (CRM) is formed on it along the field [15,19,20]. The blocking temperatures of the inner part of the grain (shell) remain below during a short holding time. When the sample is cooled to room temperature, due to magnetostatic interaction, the less oxidized core of the grain, of which is lower than , will be magnetized for case Ia against CRM and for case Ib along CRM.
For grains with , the initial TRM* core will also change due to oxidation. The direction of the core magnetization in this case should coincide with the direction of the initial TRM* due to the exchange interaction between the core and shell atoms [19,20]. The magnetic state of such particles after annealing and cooling is shown in Figure 8, IIa and IIb.
For the case of , the magnetic states of core-shell particles with initial after annealing and cooling are shown in Figure 8, configurations Ic and Id), for particles with initial – in Figure 8, configurations IIc and IId.
As can be seen, for particles whose initial is less than , the formation of magnetization of the inner part of the grain (core) depends on the direction and magnitude of the magnetization of the shell, and for grains whose initial is greater than , the magnetization of the shell depends on the magnetization of the core.
For the cases of perpendicular and parallel orientations of the magnetic field acting during single-phase oxidation, relative to the initial TRM*, different magnetic states are obtained in grains Ia, Ib and Ic, Id, respectively.
The experiment showed that the properties of the "oxidized" TRM* are also different in both cases. The values of the magnetic field determined by the Thellier-Coe method depend on the direction of the magnetic field acting during the annealing process (see Figure 6). It should be noted that the direction of the laboratory field () in the Thellier experiments was along the z-axis, i.e., in the direction of the initial TRM. For and annealing time of 12.5 hours, overestimated values of were obtained compared to the TRM formation field, while for annealing times of 400 and 1300 hours, underestimated values were obtained. Within the framework of the proposed model, this can be explained as follows. In particles Ia and Ib (Figure 8), at a low degree of oxidation, due to magnetostatic interaction, the formation of partial thermoremanent magnetization in Thellier cycles along the z-axis will be hindered, since magnetization of the core and shell is perpendicular to . All states contribute to the thermal destruction of magnetization in the Thellier-Coe cycles, i.e., unblocking temperatures should be slightly lower than blocking temperatures. With increasing of annealing time, the difference in the oxidation state between the core and shell decreases, turns out to be higher than . This leads to a decrease in magnetostatic interaction, and the magnetization becomes more and more "chemical". This leads to an underestimation of the calculated value of the magnetic field, despite the fact that some of the grains IIa and IIb have a state close to thermoresidual.
The growth of the x-component of magnetization in the temperature range = C during thermal demagnetization of oxidized TRM* in the case of at short annealing times (see Figure 4) and can also be explained within the framework of this model by the demagnetization of the induced magnetization of the inner part of the grains of configuration Ia, the unblocking temperature of which, as noted above, is lower than .
With parallel orientation of the magnetic field, i.e., for , magnetizations of the core and shell parts of the grains in three cases are directed along the field in the Thellier cycles, in one case the core magnetization is directed against it (state Id). Magnetostatic interaction will enhance the formation of pTRM for grains Id and will reduce the formation of pTRM for grains Ic, i.e., it can be considered that magnetostatic interaction in grains I in this case does not affect the total change in magnetization in the Thellier cycles. Thus, changes in magnetization in the Thellier cycles will be determined by grains of IIc and IId configurations, the state of which, as noted above, can be considered thermoresidual at short annealing times, i.e., at a low degree of oxidation of the core. This can probably explain the fact that the Thellier-Coe method in the temperature range of 260-C reconstructs a magnetic field value close to the field of TRM formation. The overestimation of the calculated field value at a high degree of oxidation ( h) remains unexplainable.
For unblocking temperatures above C, the underestimated magnetic field value we obtained, both for and , can be explained by the chemical nature of the magnetization of the grains shell [15,25]. With increasing annealing time (and oxidation degree), the contribution of this component to the total magnetization increases, since the volume of the highly oxidized part of the grains increases.
This study underscores the dual role of low-temperature oxidation as both a preserver and distortor of paleomagnetic signals. While parallel-field annealing preserves TRM integrity, perpendicular configurations introduce irreproducible biases. Future work should explore multi-phase oxidation scenarios and validate these findings against geological timescales using submarine basalts with known eruption ages.
5. Conclusions
The experimental investigation of low-temperature oxidation effects on TRM-bearing titanomagnetite in Red Sea basalt samples yielded critical insights into the preservation and reliability of paleomagnetic signals. The principal findings are summarized as follows:
- CRM and TRM components exhibit distinct coercivity and unblocking temperature spectra, enabling their discrimination in orthogonal field configurations. The CRM component () demonstrated higher magnetic stability in fields >17-20 mT and broader unblocking temperature distributions compared to TRM (Figure 2).
- The Lowrie method confirmed the single-phase oxidation nature of titanomagnetite, as evidenced by smooth thermal demagnetization of three-component IRM without discrete unblocking temperatures characteristic of multi-phase systems (Figure 1).
- Thellier-Coe analysis revealed bimodal Arai-Nagata behavior, with reliable TRM preservation below and chemical alteration artifacts above despite argon-atmosphere protocols.
- Magnetic field orientation during oxidation critically influenced paleointensity accuracy. Parallel field annealing preserved TRM fidelity ( vs. ), while perpendicular fields introduced systematic biases (up to 38 % overestimation and 20 % underestimation). This directional dependence arises from magnetostatic interactions in core-shell structured grains during single-phase oxidation.
- Marine basalt studies require stringent sample pre-selection for oxidation degree and directional field alignment during paleointensity experiments to mitigate CRM-TRM interference.
This study represents the first comprehensive methodology for modeling Magma Intrusion-Induced Oxidation under controlled magnetic field conditions at sub-Curie temperatures (). The developed experimental protocol enables quantitative assessment of CRM-TRM interference while maintaining the integrity of the original paleomagnetic record - a crucial advancement for reliable paleointensity determination in oxidized basaltic systems.
Author Contributions
R. Grachev: all experimental data acquisition (except electron microscopy data), conceptualization, methodology, investigation, data analysis, writing, editing, visualization, original draft preparation; R. Rytov: data analysis, writing, editing, visualization, original draft preparation; V. Maksimochkin: funding acquisition, methodology, writing, editing, data curation, original draft preparation; A. Tselebrovskiy: data analysis, editing, visualization; A. Nekrasov: electron microscopy data acquisition, data analysis. All authors have read and agreed to the published version of the manuscript.
Funding
The research was carried out at the expense of the grant of the Russian Science Foundation No. 24-27-00250, https://rscf.ru/project/24-27-00250/
Institutional Review Board Statement
Not applicable.
Data Availability Statement
The datasets generated and analyzed during this study are available in the Mendeley Data repository at https://data.mendeley.com/datasets/xxxxx [persistent identifier will be provided upon acceptance]. All data are provided in standardized formats with corresponding metadata descriptors.
Acknowledgments
The authors express their sincere gratitude to Pavlov V. E., Markov G. P., and Veselovskiy R. V. (Institute of Physics of the Earth, Russian Academy of Sciences) for providing access to experimental facilities and their invaluable assistance in conducting isothermal annealing experiments. We deeply appreciate their technical expertise and unwavering support throughout this research project.
Conflicts of Interest
The authors declare no conflict of interest.
Sample Availability
P72/4 basalt samples are available from the authors.
Abbreviations
The following abbreviations are used in this manuscript:
| NRM | Natural Remanent Magnetization |
| TRM | Thermoremanent Magnetization |
| CRM | Chemical Remanent Magnetization |
| TCRM | Thermochemical Remanent Magnetization |
| pTRM | partial Thermoremanent Magnetization |
| PSD | Pseudo-Single-Domain |
| AFD | Alternating Field Demagnetization |
| TD | Thermal Demagnetization |
| IRM | Isothermal Remanent Magnetization |
| SEM | Scanning Electron Microscopy |
| EDS | Energy-Dispersive X-ray Spectroscopy |
| WDS | Wavelength-Dispersive X-ray Spectroscopy |
| BSE | Backscattered Electrons |
| RAS | Russian Academy of Sciences |
| TMA | Thermomagnetic Analysis |
Appendix A.
Appendix A.1
Figure A1.
Experiment scheme.
References
- Dunlop, D.J.; Özdemir, Ö. Rock magnetism: fundamentals and frontiers; Number 3 in Cambridge Studies in Magnetism, Cambridge university press, 1997.
- O’Reilly, W. The identification of titanomaghemites: model mechanisms for the maghemitization and inversion processes and their magnetic consequences. Physics of the Earth and Planetary Interiors 1983, 31, 65–76. [Google Scholar] [CrossRef]
- Haggerty, S.E. Oxidation of opaque mineral oxides in basalts. Oxide minerals 1976, 3, Hg1–Hg100. [Google Scholar]
- Haggerty, S.E. Opaque mineral oxides in terrestrial igneous rocks. Oxide minerals. Short course notes 1976, 3. [Google Scholar]
- Johnson, H.; Merrill, R. Low-temperature oxidation of a titanomagnetite and the implications for paleomagnetism. Journal of Geophysical Research 1973, 78, 4938–4949. [Google Scholar] [CrossRef]
- Ozima, M.; Larson, E. Low-and high-temperature oxidation of titanomagnetite in relation to irreversible changes in the magnetic properties of submarine basalts. Journal of Geophysical Research 1970, 75, 1003–1017. [Google Scholar] [CrossRef]
- Geissman, J.W.; Van der Voo, R. Thermochemical remanent magnetization in Jurassic silicic volcanics from Nevada, USA. Earth and Planetary Science Letters 1980, 48, 385–396. [Google Scholar] [CrossRef]
- Bleil, U.; Petersen, N. Variations in magnetization intensity and low-temperature titanomagnetite oxidation of ocean floor basalts. Nature 1983, 301, 384–388. [Google Scholar] [CrossRef]
- Brown, K.; O’Reilly, W. The effect of low temperature oxidation on the remanence of TRM-carrying titanomagnetite Fe2.4Ti0.6O4. Physics of the Earth and Planetary Interiors 1988, 52, 108–116. [Google Scholar] [CrossRef]
- Tanaka, H.; Kono, M. Preliminary results and reliability of palaeointensity studies on historical and 14C dated Hawaiian lavas. Journal of geomagnetism and geoelectricity 1991, 43, 375–388. [Google Scholar] [CrossRef]
- Smirnov, A.; Tarduno, J. Thermochemical remanent magnetization in Precambrian rocks: Are we sure the geomagnetic field was weak? Journal of Geophysical Research: Solid Earth 2005, 110. [Google Scholar] [CrossRef]
- Draeger, U.; Prévot, M.; Poidras, T.; Riisager, J. Single-domain chemical, thermochemical and thermal remanences in a basaltic rock. Geophysical Journal International 2006, 166, 12–32. [Google Scholar] [CrossRef]
- Maksimochkin, V.I.; Tselebrovskiy, A.N. The influence of the chemical magnetization of oceanic basalts on determining the geomagnetic field paleointensity by the Thellier method. Moscow University Physics Bulletin 2015, 70, 566–576. [Google Scholar] [CrossRef]
- Maksimochkin, V.I.; Grachev, R.A.; Tselebrovskiy, A.N. Determination of the formation field of artificial CRM and pTRM by the Thellier method at different oxidation stages of natural titanomagnetite. Izvestiya, Physics of the Solid Earth 2020, 56, 413–424. [Google Scholar] [CrossRef]
- Gribov, S.; Dolotov, A.; Shcherbakov, V. Experimental modeling of the chemical remanent magnetization and Thellier procedure on titanomagnetite-bearing basalts. Izvestiya, Physics of the Solid Earth 2017, 53, 274–292. [Google Scholar] [CrossRef]
- Gribov, S.; Shcherbakov, V.; Aphinogenova, N. Magnetic properties of artificial CRM created on titanomagnetite-bearing oceanic basalts. In Proceedings of the Recent Advances in Rock Magnetism, Environmental Magnetism and Paleomagnetism: International Conference on Geomagnetism, Paleomagnetism and Rock Magnetism (Kazan, Russia). Springer, 2019, pp. 173–194.
- Gapeev, A.K.; Gribov, S.K. Kinetics of single-phase oxidation of titanomagnetite. Physics of the earth and planetary interiors 1990, 63, 58–65. [Google Scholar] [CrossRef]
- Nishitani, T.; Kono, M. Curie temperature and lattice constant of oxidized titanomagnetite. Geophysical Journal International 1983, 74, 585–600. [Google Scholar]
- Özdemir, Ö.; Dunlop, D.J. An experimental study of chemical remanent magnetizations of synthetic monodomain titanomaghemites with initial thermoremanent magnetizations. Journal of Geophysical Research: Solid Earth 1985, 90, 11513–11523. [Google Scholar] [CrossRef]
- Walderhaug, H.J.; Torsvik, T.H.; Løvlie, R. Experimental CRM production in a basaltic rock; evidence for stable, intermediate palaeomagnetic directions. Geophysical Journal International 1991, 105, 747–756. [Google Scholar] [CrossRef]
- Trukhin, V.I.; Bezaeva, N.S. Self-reversal of the magnetization of natural and synthesized ferrimagnets. Physics-Uspekhi 2006, 49, 489. [Google Scholar] [CrossRef]
- Krása, D.; Shcherbakov, V.P.; Kunzmann, T.; Petersen, N. Self-reversal of remanent magnetization in basalts due to partially oxidized titanomagnetites. Geophysical Journal International 2005, 162, 115–136. [Google Scholar] [CrossRef]
- Doubrovine, P.V.; Tarduno, J.A. Self-reversed magnetization carried by titanomaghemite in oceanic basalts. Earth and Planetary Science Letters 2004, 222, 959–969. [Google Scholar] [CrossRef]
- Maksimochkin, V.; Grachev, R.; Tselebrovskiy, A. Effect of Single-Phase Oxidation of Titanomagnetite in Basalts on the Determination of Intensity and Direction of Paleomagnetic Field. Izvestiya, Physics of the Solid Earth 2022, 58, 216–229. [Google Scholar] [CrossRef]
- Shcherbakov, V.; Lhuillier, F.; Gribov, S.; Tselmovich, V.; Aphinogenova, N. Potential bias in volcanic paleomagnetic records due to superimposed chemical remanent magnetization. Geophysical Research Letters 2024, 51, e2024GL109630. [Google Scholar] [CrossRef]
- Shreider, A.A.e.a. Detailed Geomagnetic Investigations of the Rift Zone in the Southern Red Sea (in russian). Oceanology 1982, 22, 439–445, In Russian. [Google Scholar]
- Bogdanov, Y.A.; Zhuleva, E.V.; Zonenshajn, L.P.; Matveenkov, V.V.; Mirlin, E.G.; Sagilevich, A.M.; Sborschikov, I.M. Atlas of Underwater Photographs of the Red Sea Rift (in russian); Nauka, 1983; p. 139.
- Dunlop, D.J. Theory and application of the Day plot (Mrs/Ms versus Hcr/Hc) 1. Theoretical curves and tests using titanomagnetite data. Journal of Geophysical Research: Solid Earth 2002, 107, EPM–4. [Google Scholar] [CrossRef]
- Gribov, S.; Shcherbakov, V.; Aphinogenova, N. Magnetic properties of artificial CRM created on titanomagnetite-bearing oceanic basalts. In Proceedings of the Recent Advances in Rock Magnetism, Environmental Magnetism and Paleomagnetism: International Conference on Geomagnetism, Paleomagnetism and Rock Magnetism (Kazan, Russia). Springer, 2018, pp. 173–194.
- Lowrie, W. Identification of ferromagnetic minerals in a rock by coercivity and unblocking temperature properties. Geophysical research letters 1990, 17, 159–162. [Google Scholar] [CrossRef]
- Thellier, E. Sur l’intensite du shamp magnetique terrestre dans le passe historique et geologique. Ann. Geophys. 1959, 15, 285–376. [Google Scholar]
- Coe, R.S. The determination of paleo-intensities of the Earth’s magnetic field with emphasis on mechanisms which could cause non-ideal behavior in Thellier’s method. Journal of geomagnetism and geoelectricity 1967, 19, 157–179. [Google Scholar] [CrossRef]
- Selkin, P.A.; Tauxe, L. Long-term variations in palaeointensity. Philosophical Transactions of the Royal Society of London. Series A: Mathematical, Physical and Engineering Sciences 2000, 358, 1065–1088. [Google Scholar] [CrossRef]
Figure 1.
SEM images of fresh P72/4 basalt sample in backscattered electrons. (a) A general plan of the sample; (b) The central area of the sample surface; (c) and (d) examples of individual grains of titanomagnetite. Titanomagnetite grains are represented by the lightest areas on the polished surface.
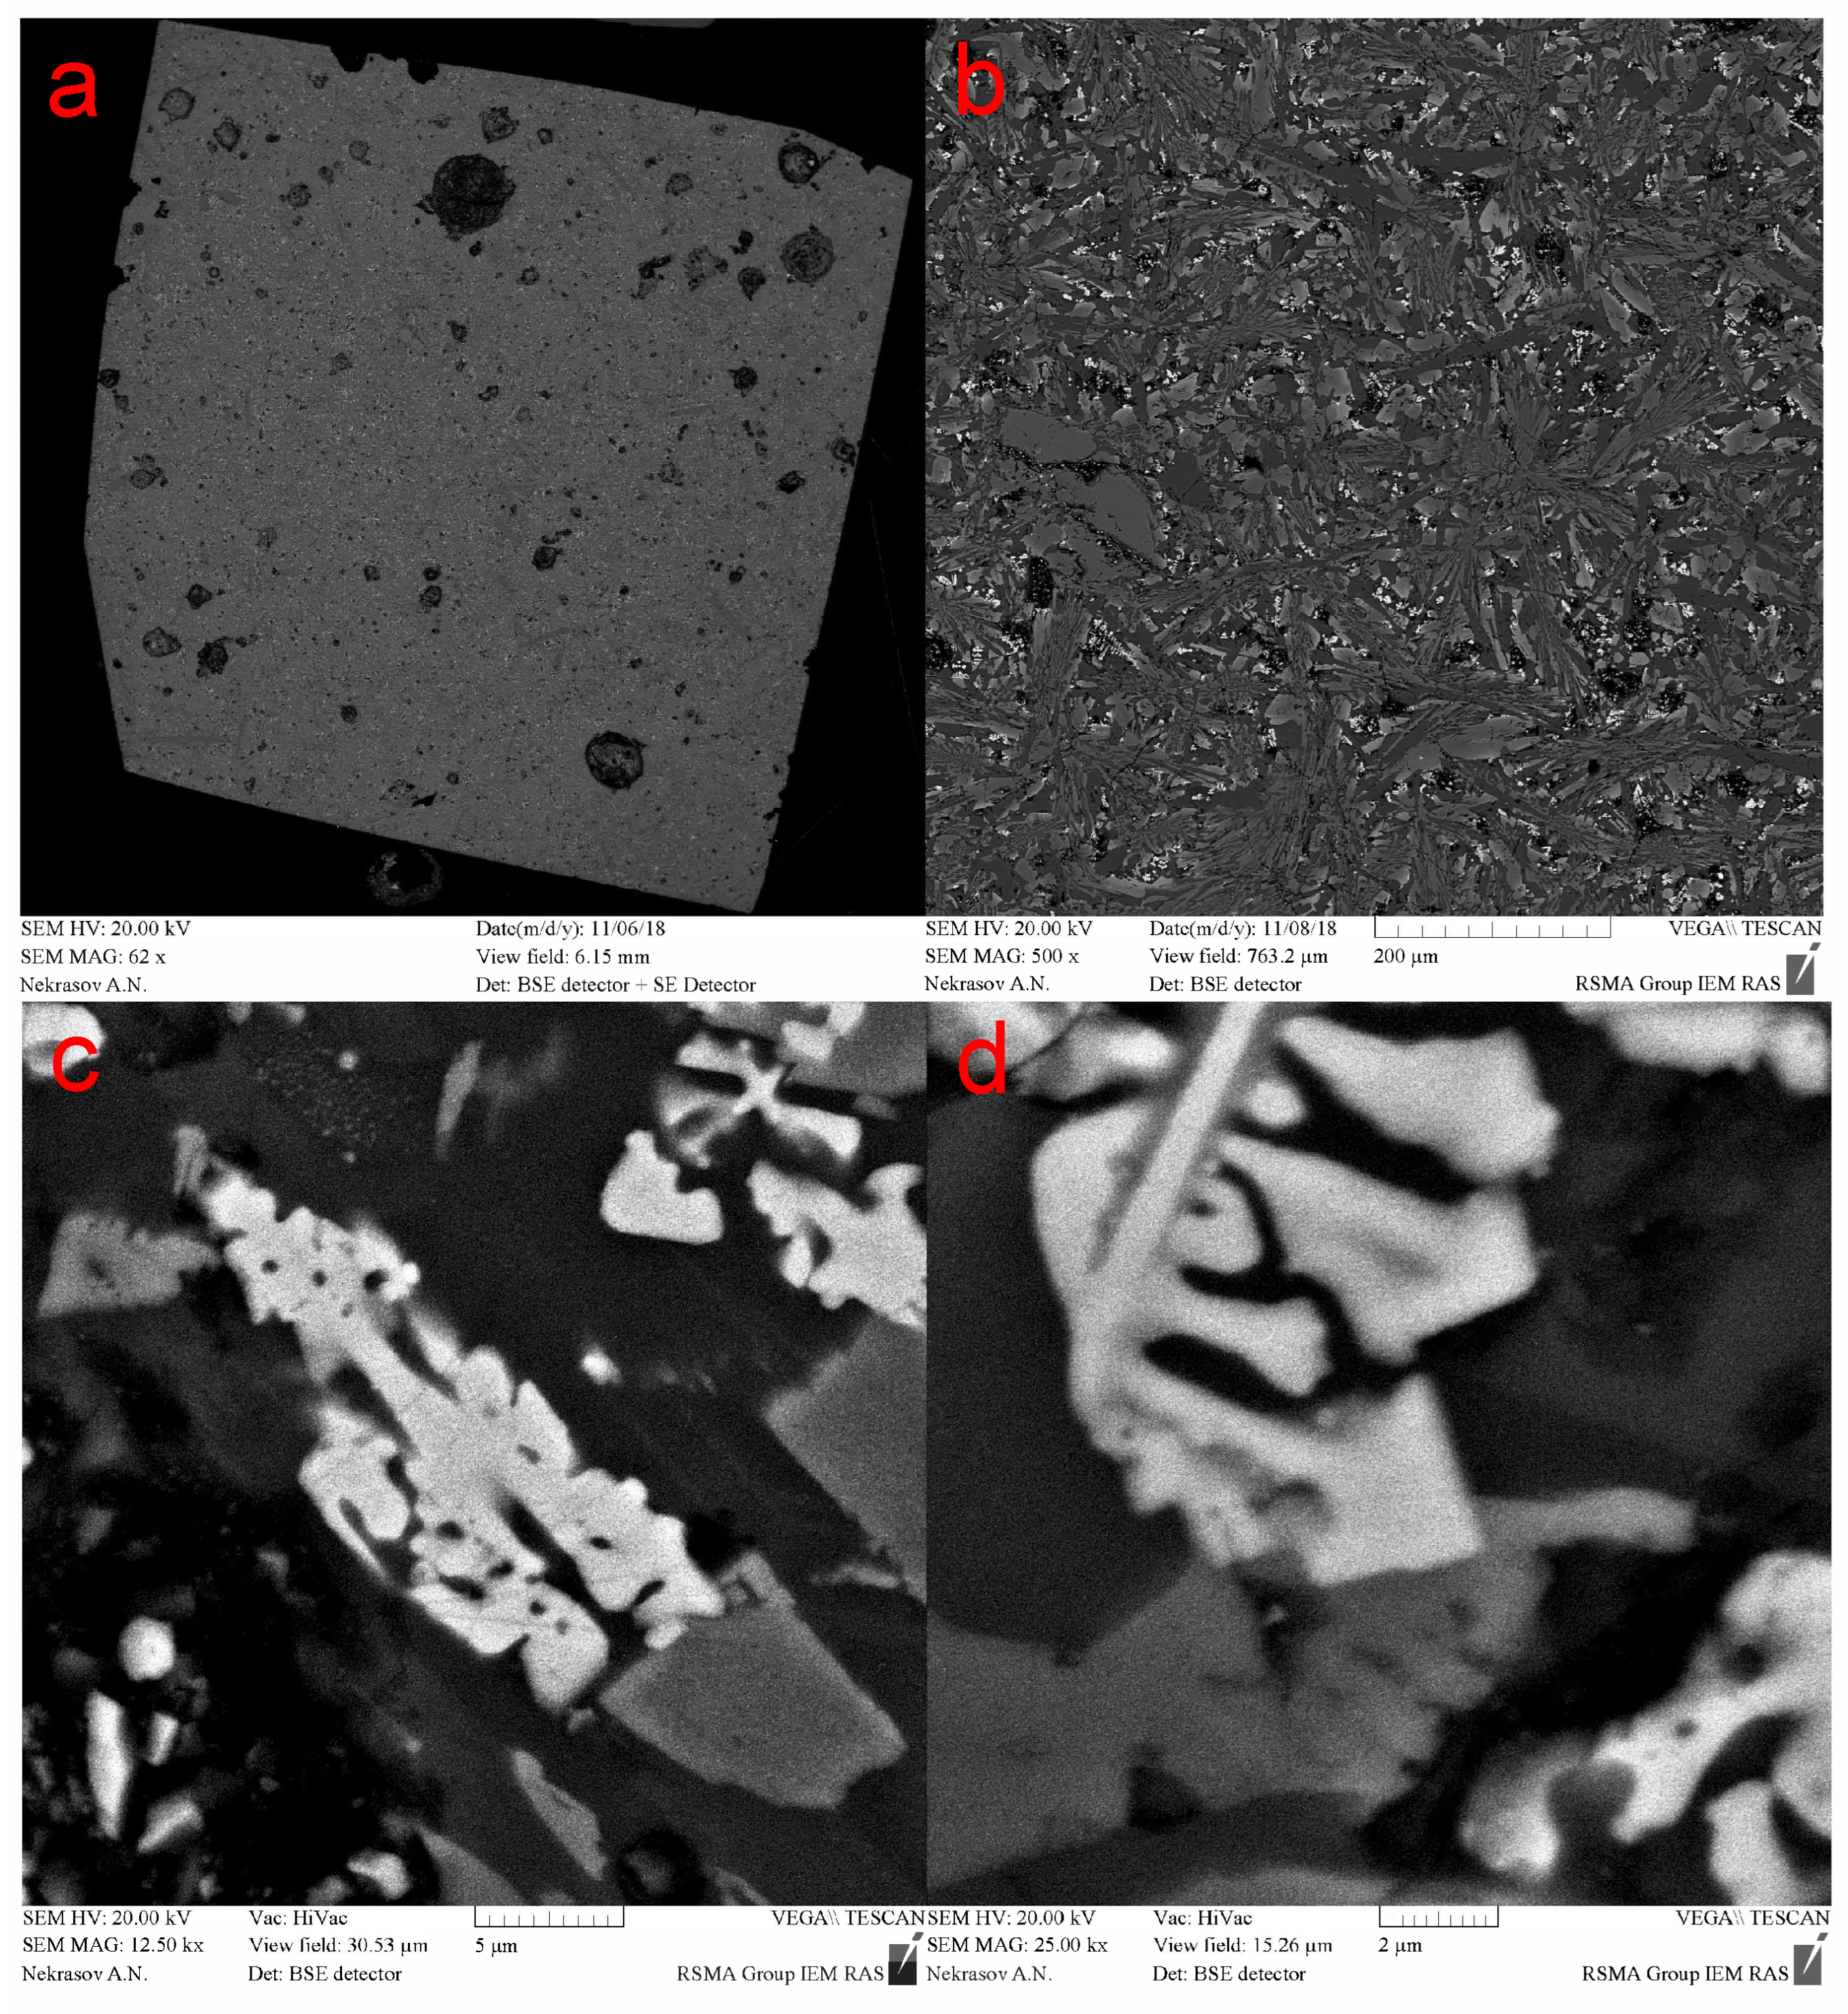
Figure 2.
Thermal demagnetization of a three-component IRM produced by magnetizing the sample in 1.5 T along its z-axis, followed by 0.05 T along the y-axis, and finally 0.018 T along the x-axis. Data for P72/4 Red Sea basalt sample in initial state and annealed different time.
Figure 2.
Thermal demagnetization of a three-component IRM produced by magnetizing the sample in 1.5 T along its z-axis, followed by 0.05 T along the y-axis, and finally 0.018 T along the x-axis. Data for P72/4 Red Sea basalt sample in initial state and annealed different time.
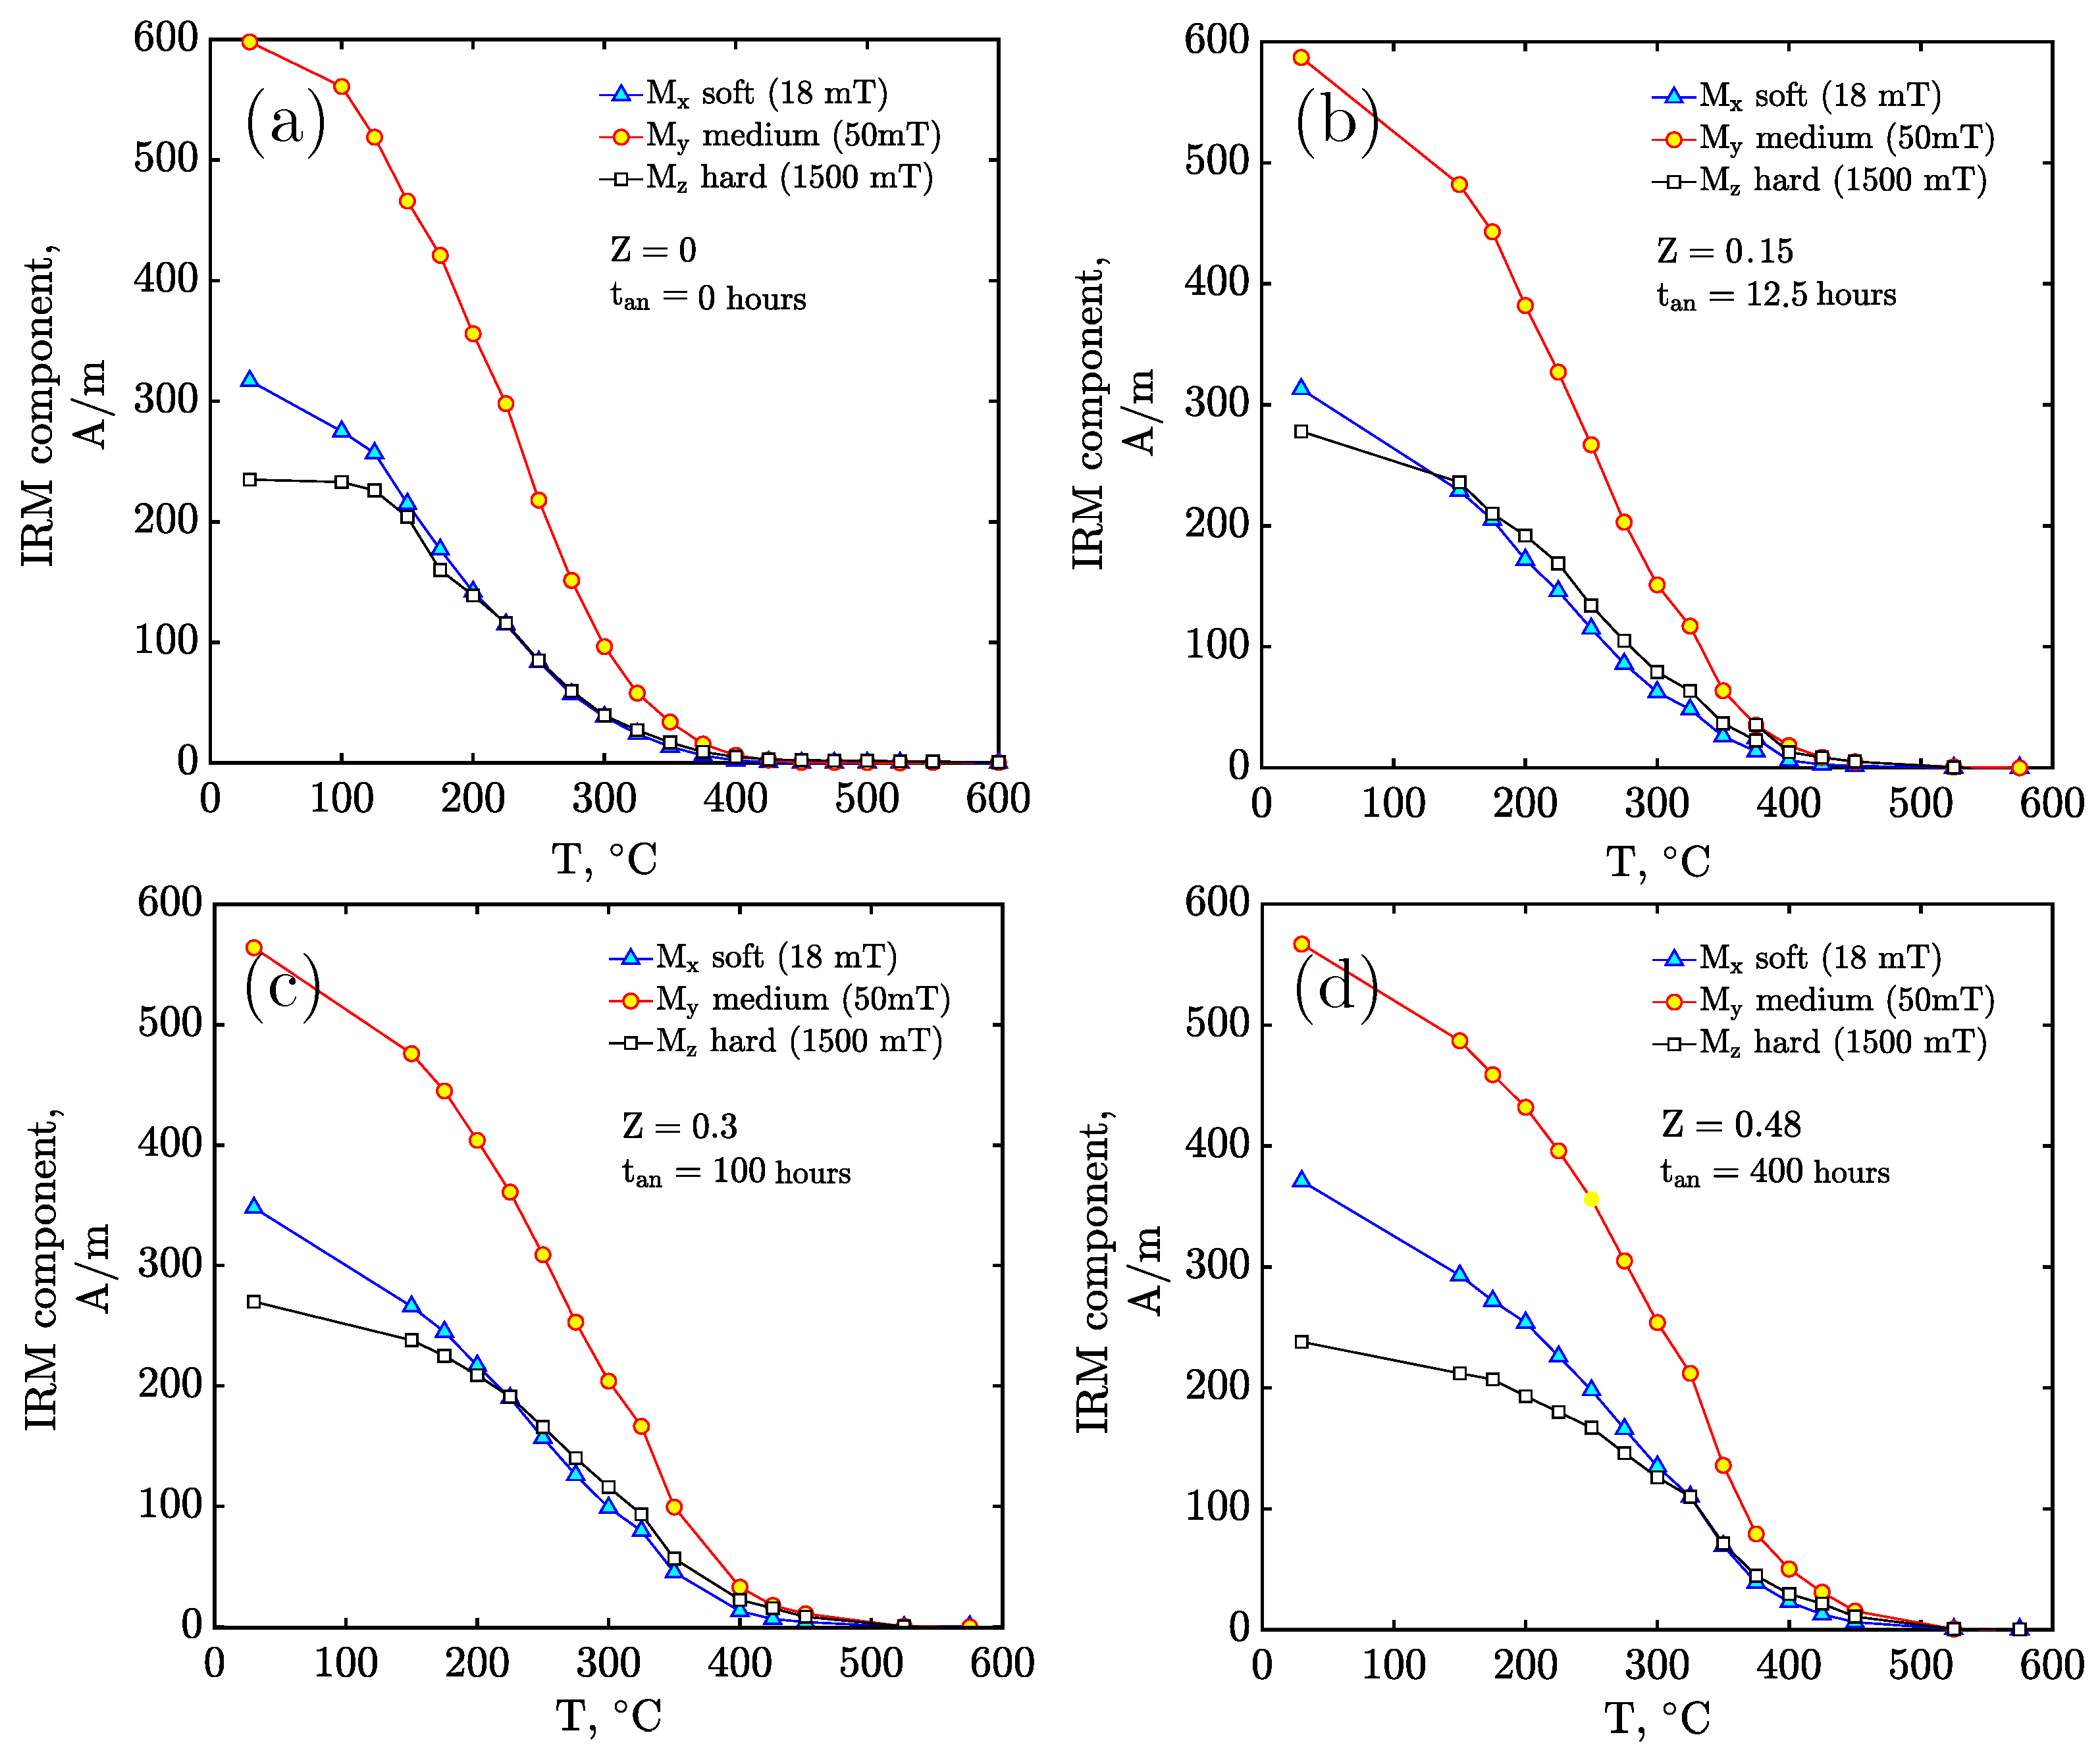
Figure 4.
Stepwise alternating field (AFD) (a) and temperature demagnetization (TD) (b) of P72/4 basalt samples undergoing single-phase oxidation in a magnetic field perpendicular to the initial TRM. Normalized and component intensity is plotted as a function of applied AF field peak and temperature. The AFD and TD curves representing the initial thermoremanent magnetization (TRM) are depicted by red dashed lines. Magnetic field induction creating initial TRM 50T
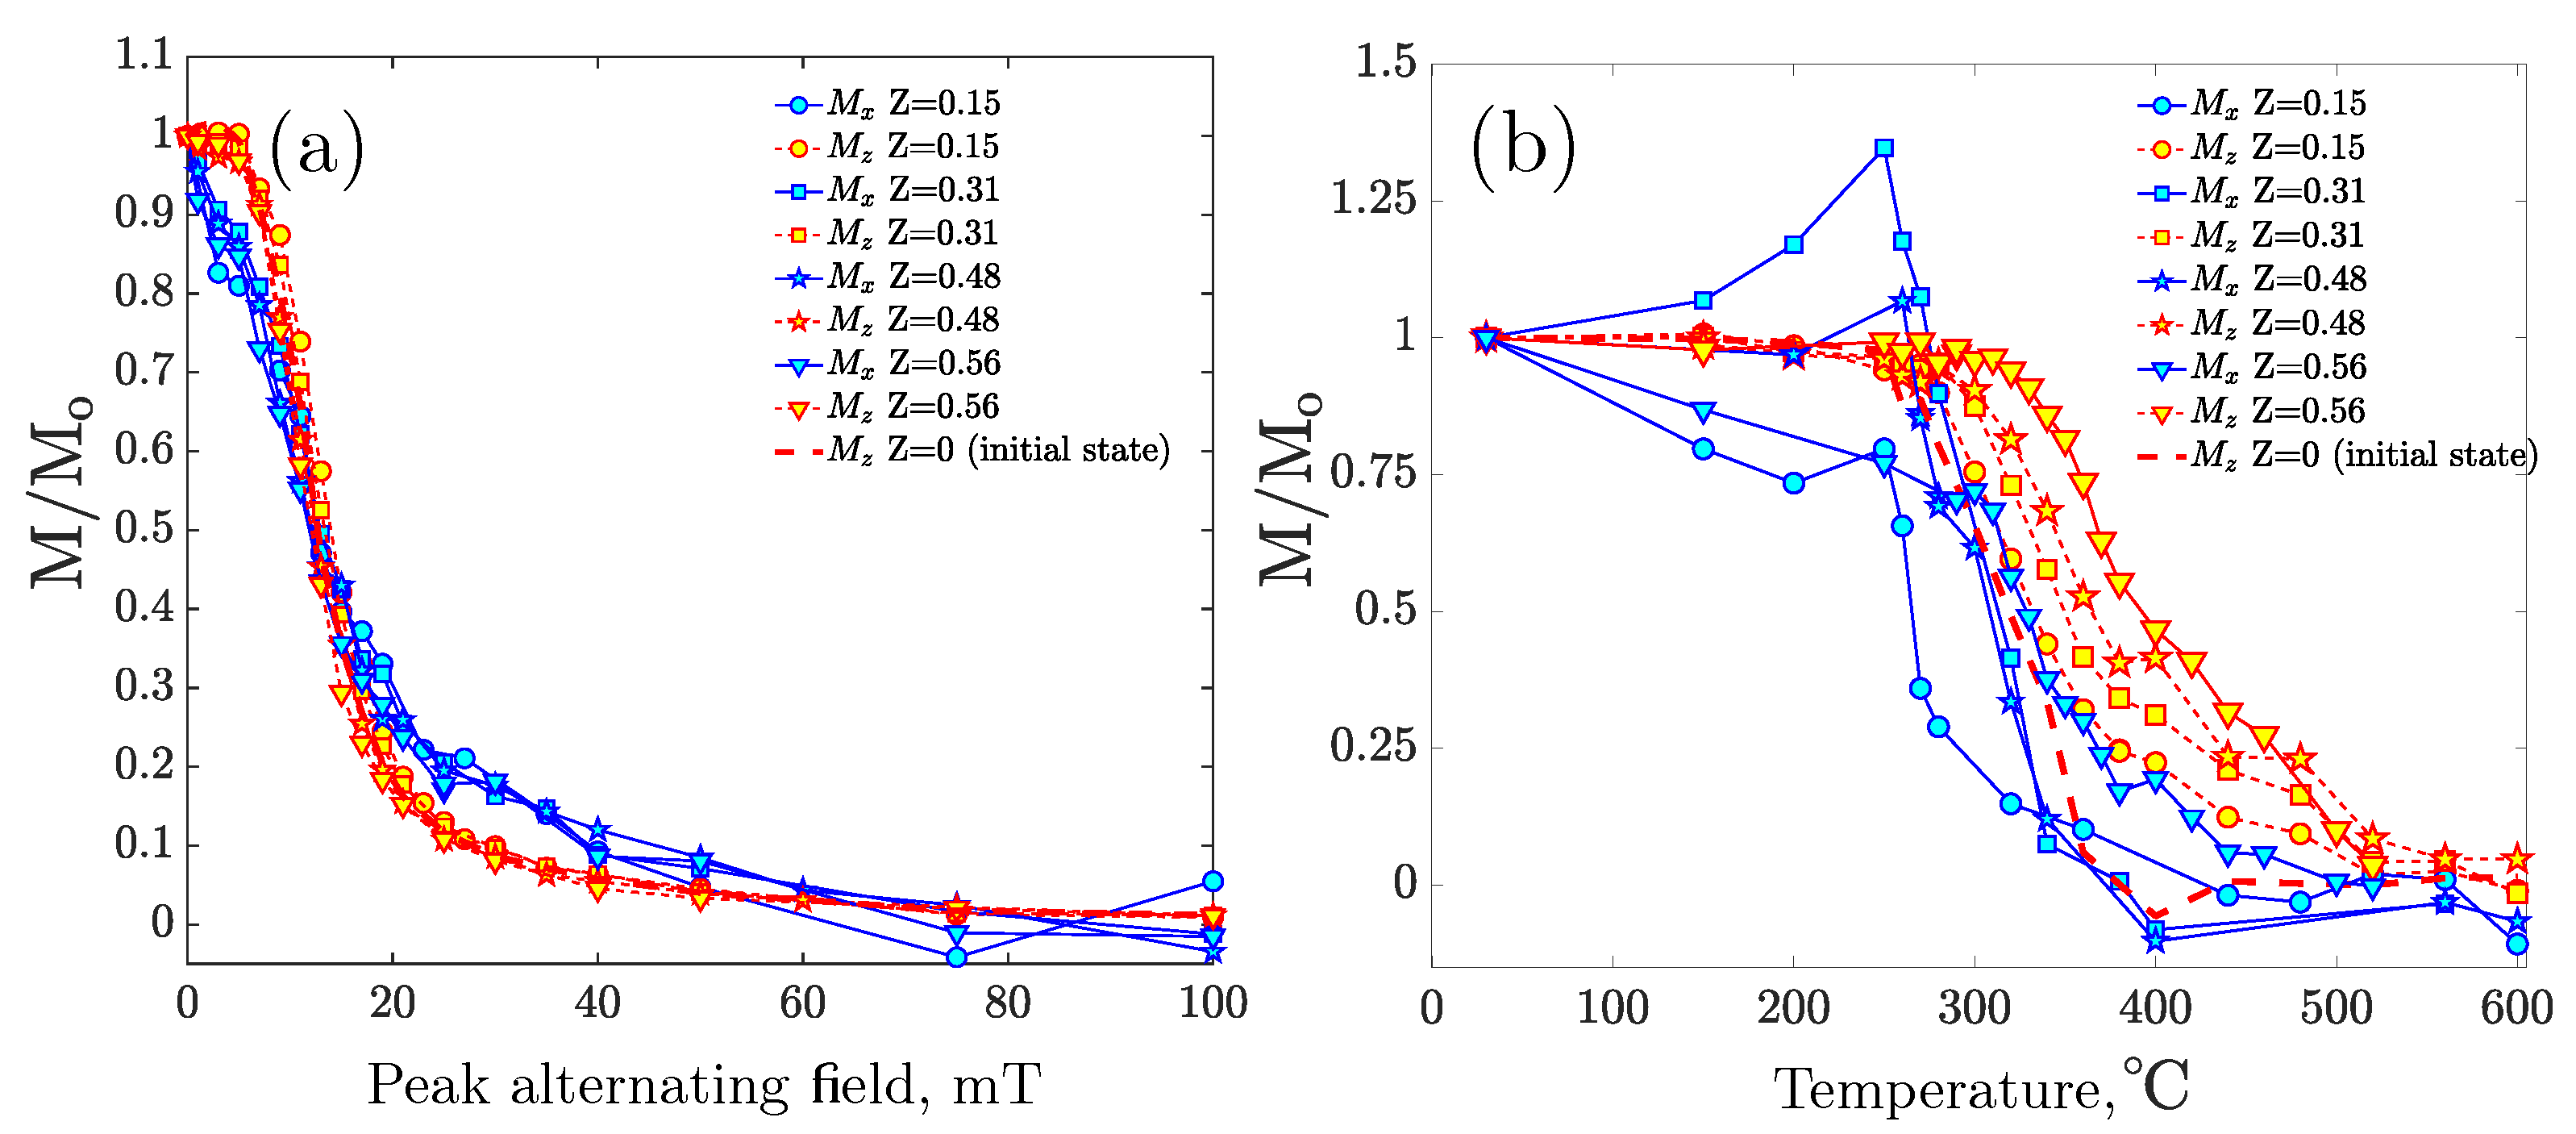
Figure 5.
Arai-Nagata plot of initial laboratory TRM of P72/4(95) basalt specimen (a) and dependencies of pTRM(T), TRM(T) (b) obtained as a result of the Thellier-Coe procedure. The insets, located in the bottom-left corner, depict Zijderveld diagrams for the zero field steps, illustrating the projection of the magnetization vector onto the xy-plane (in blue) and the yz-plane (in white). Magnetic field induction creating initial TRM 50T.
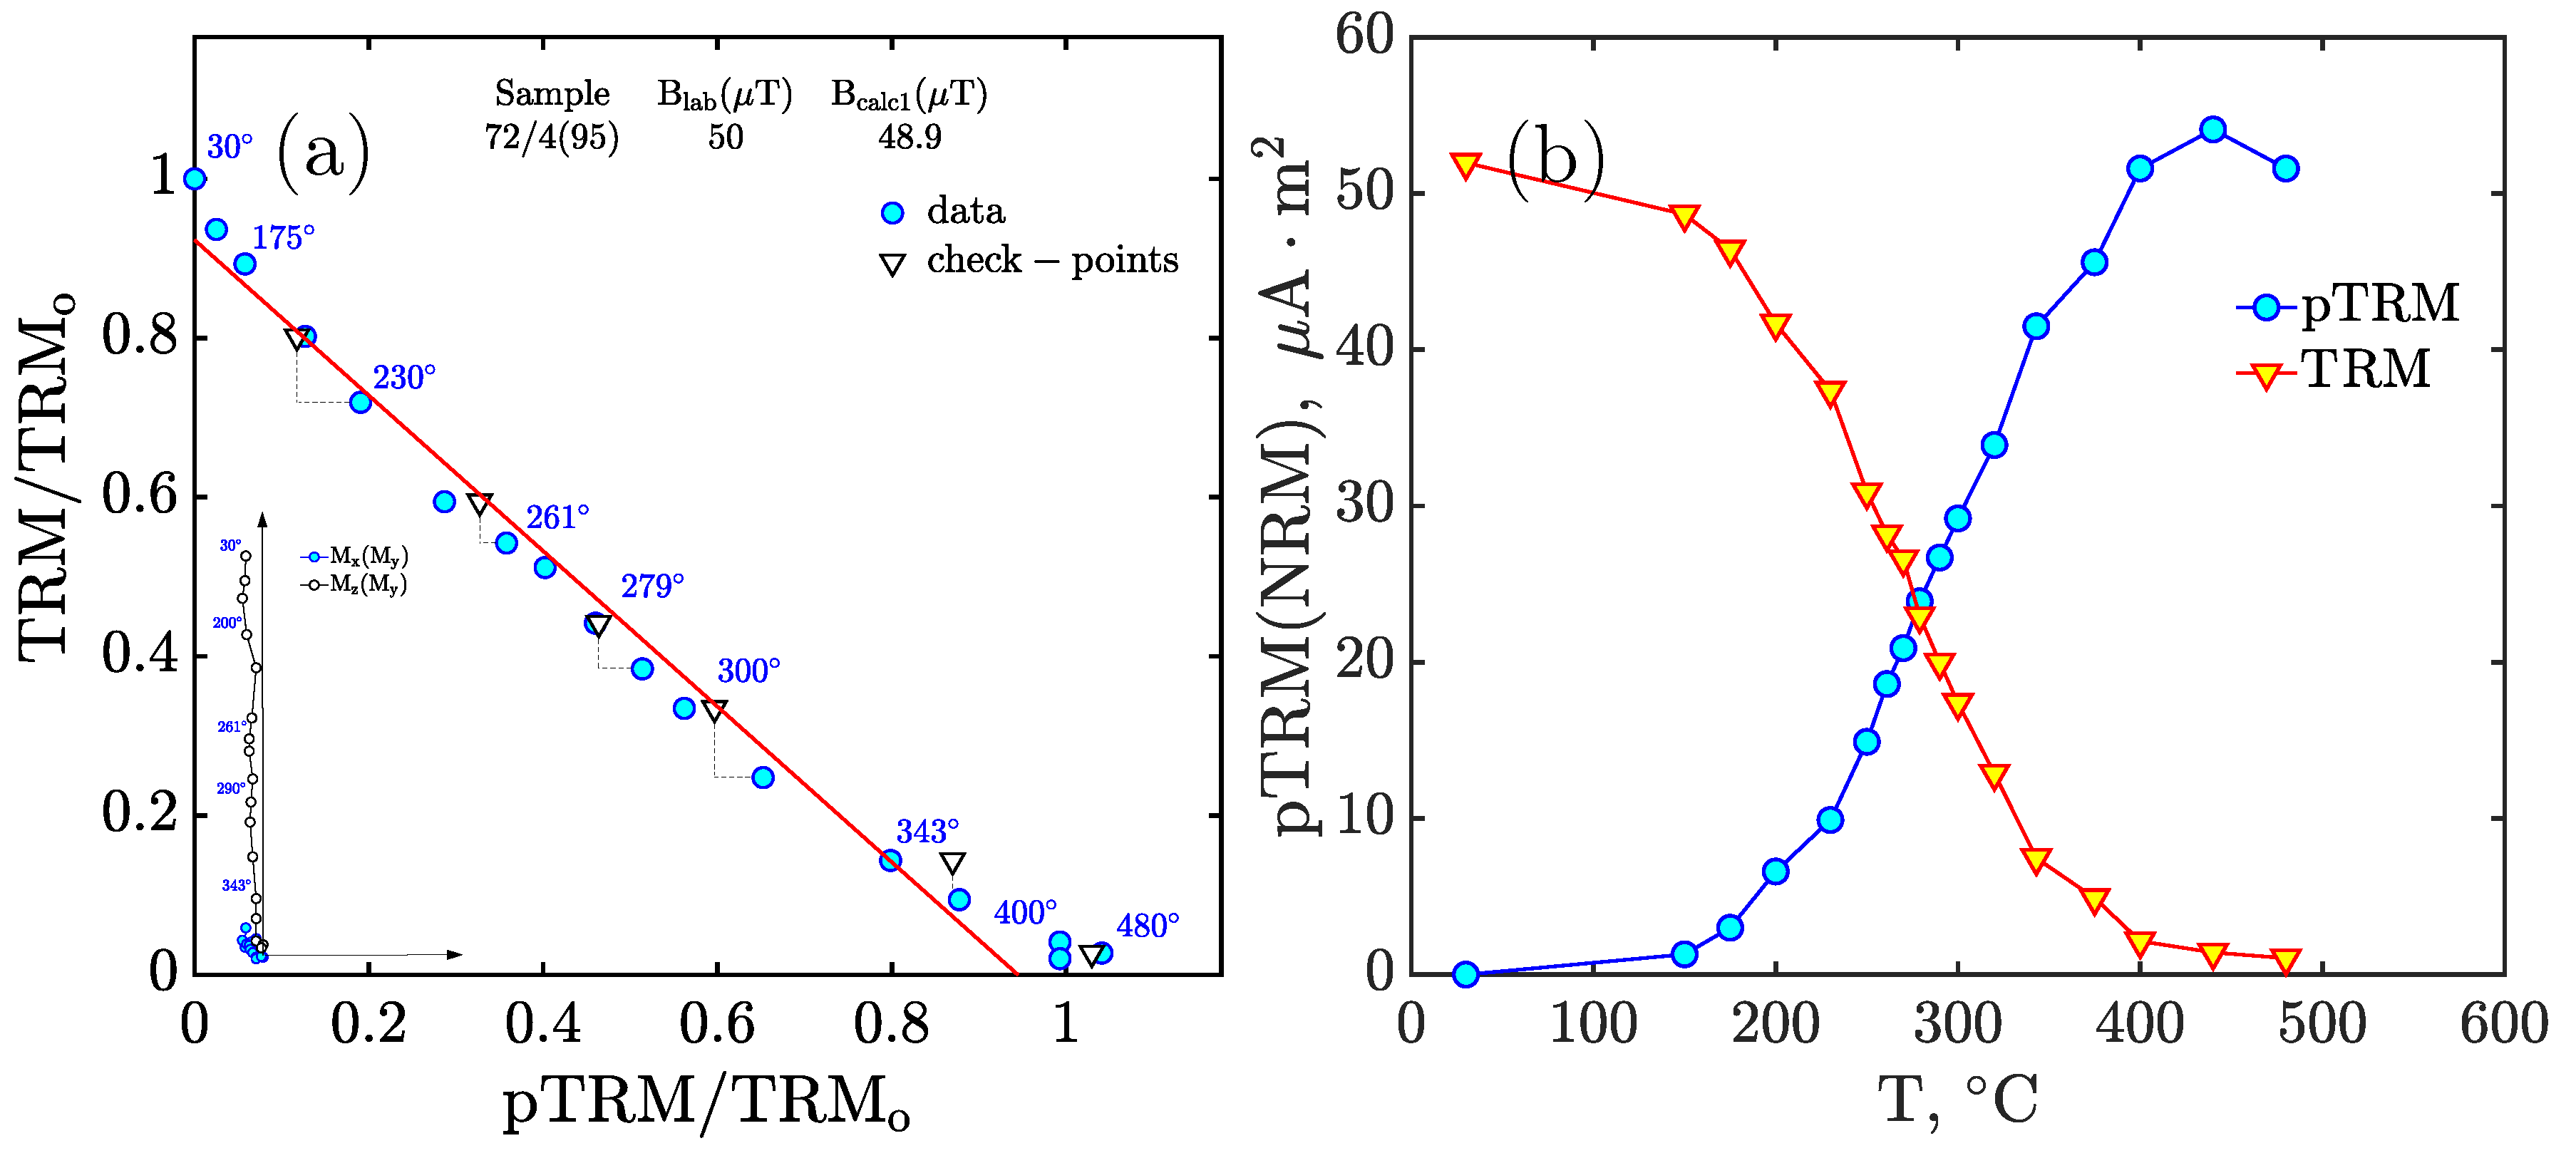
Figure 6.
Arai-Nagata plots for basalt specimens P72/4 after annealing in a 50T magnetic field. Plots 1a–1d: Annealing field oriented parallel to TRM (Oz axis). Plots 2a–2d: Annealing field oriented perpendicular to TRM (Oz axis). Annealing durations: (a) , (b) , (c) , (d) . Insets show Zijderveld diagrams for zero-field steps: xy-plane (blue) and yz-plane (white). Initial TRM creation field: .
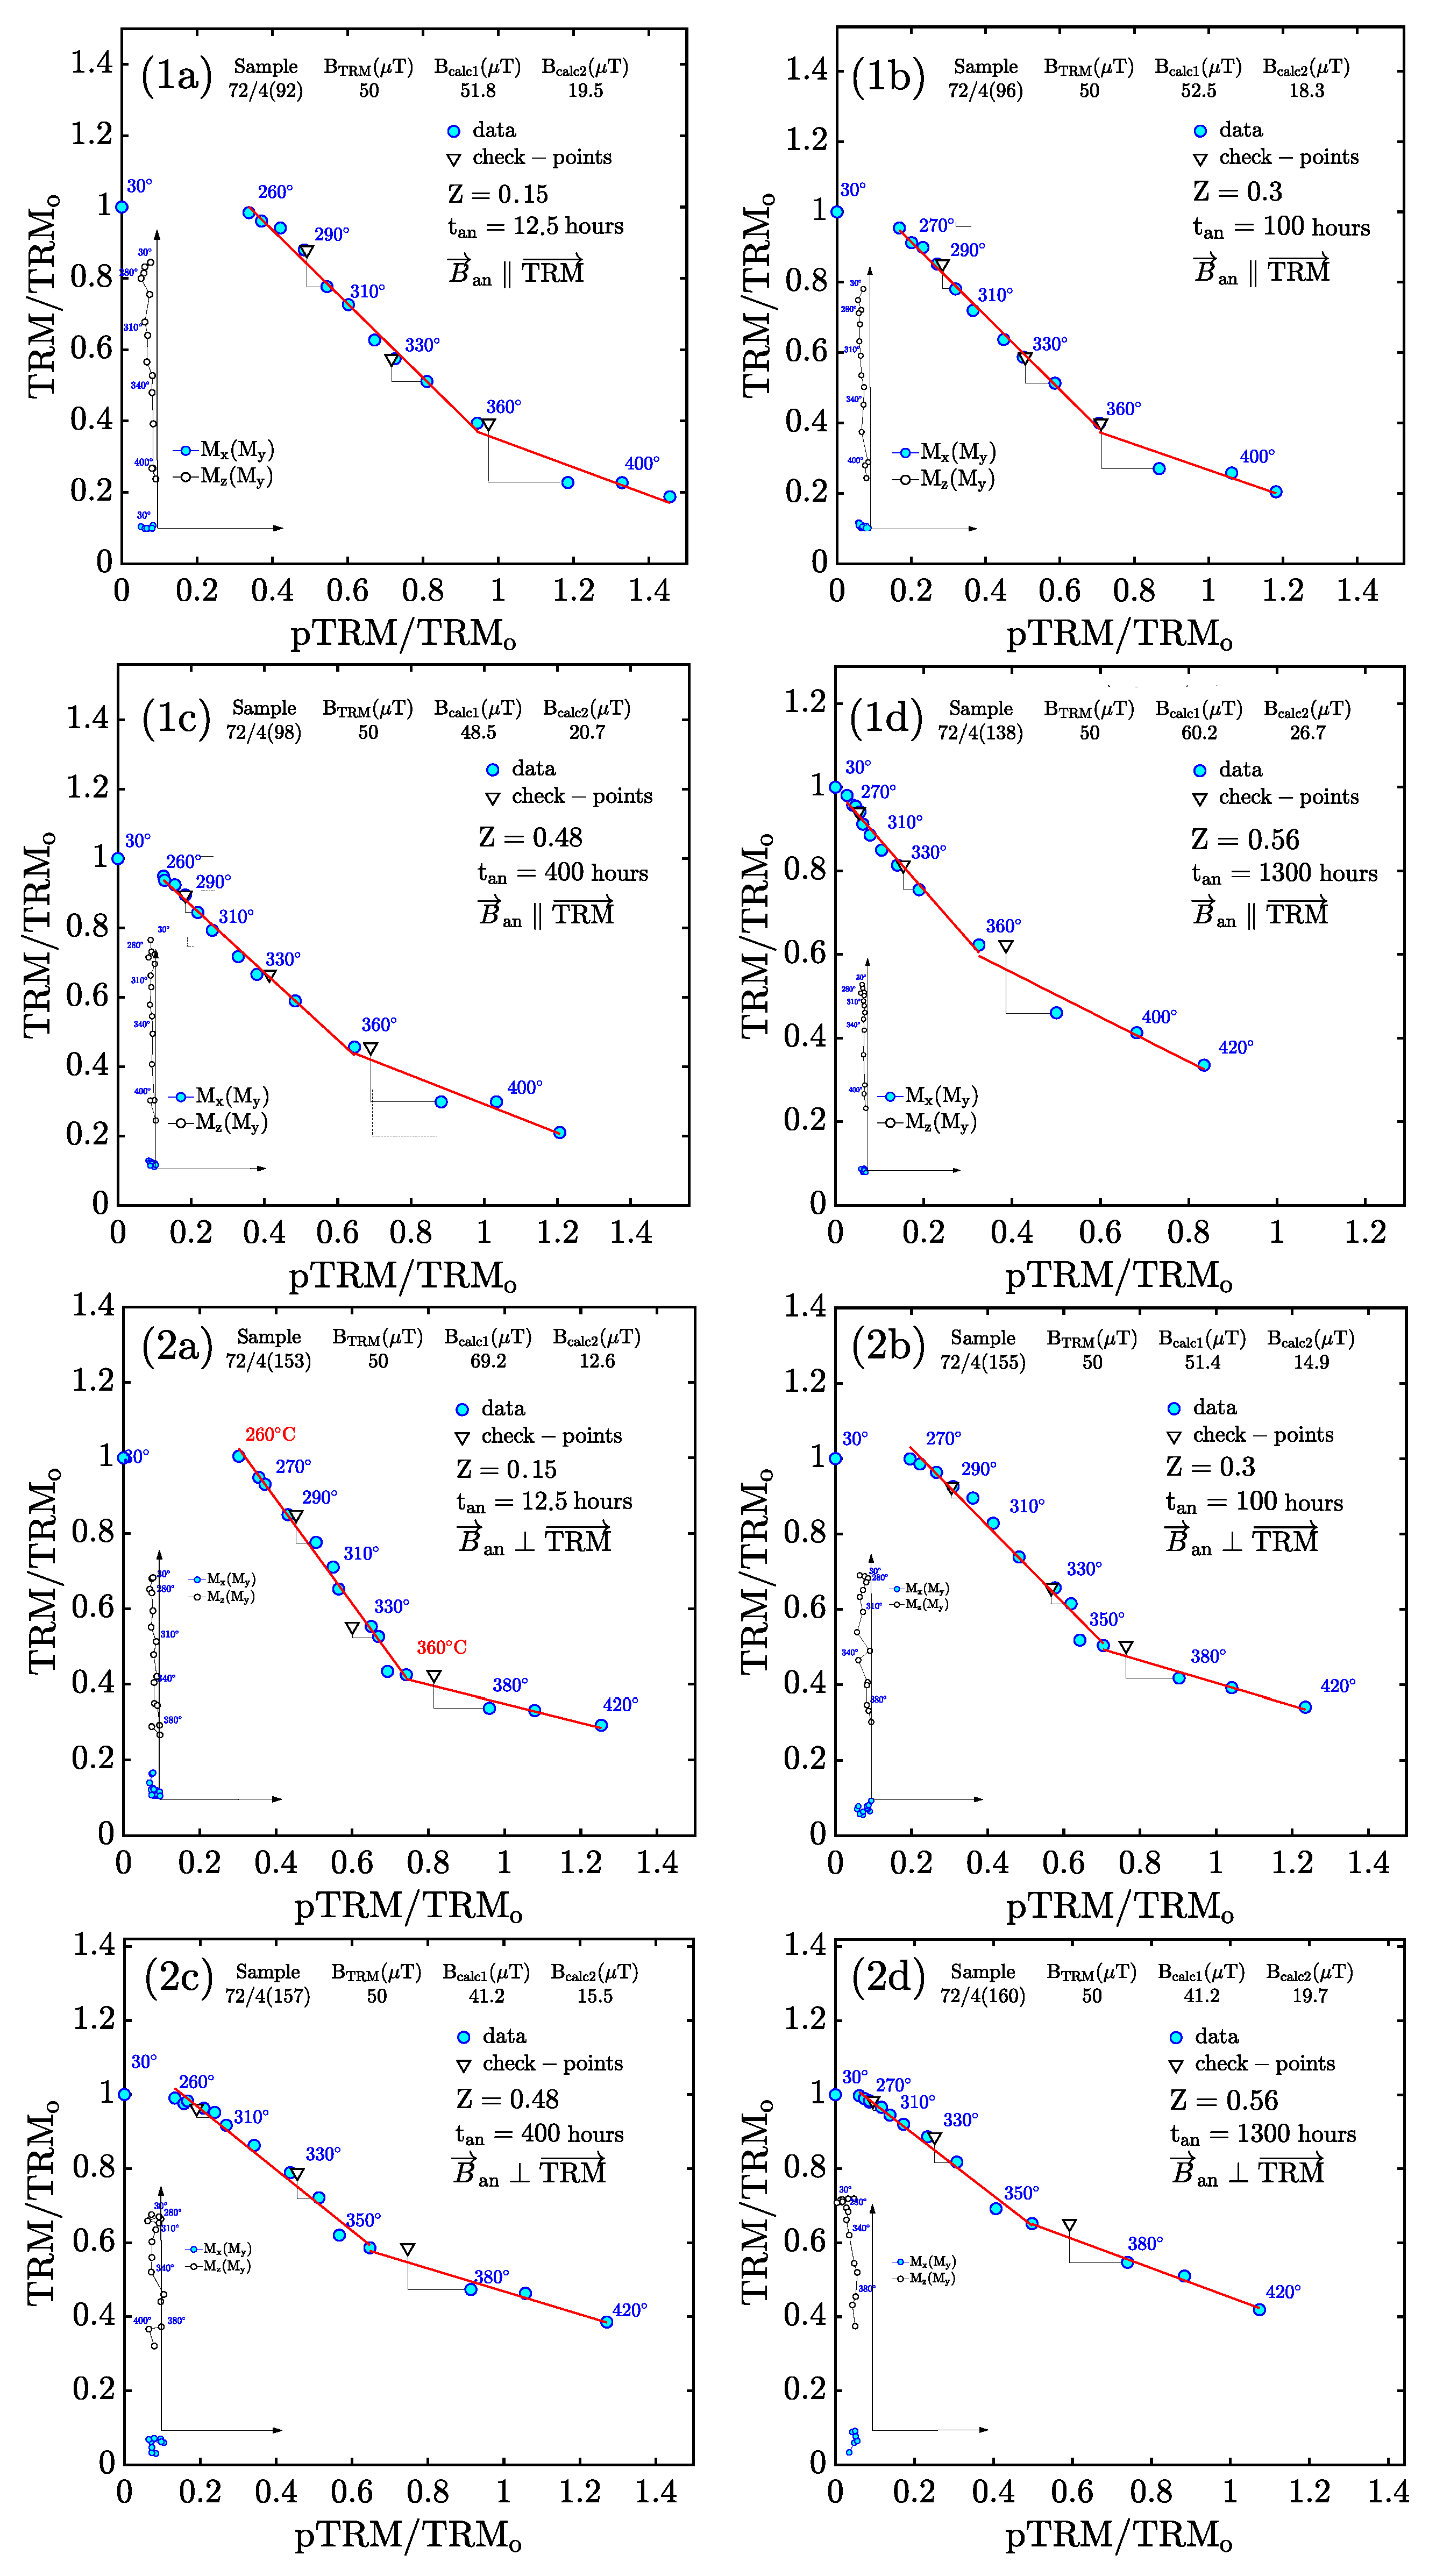
Figure 8.
Scheme of magnetization formation in titanomagnetite grains as a result of annealing with a perpendicular and parallel field arrangement relative to the initial TRM.
Figure 8.
Scheme of magnetization formation in titanomagnetite grains as a result of annealing with a perpendicular and parallel field arrangement relative to the initial TRM.
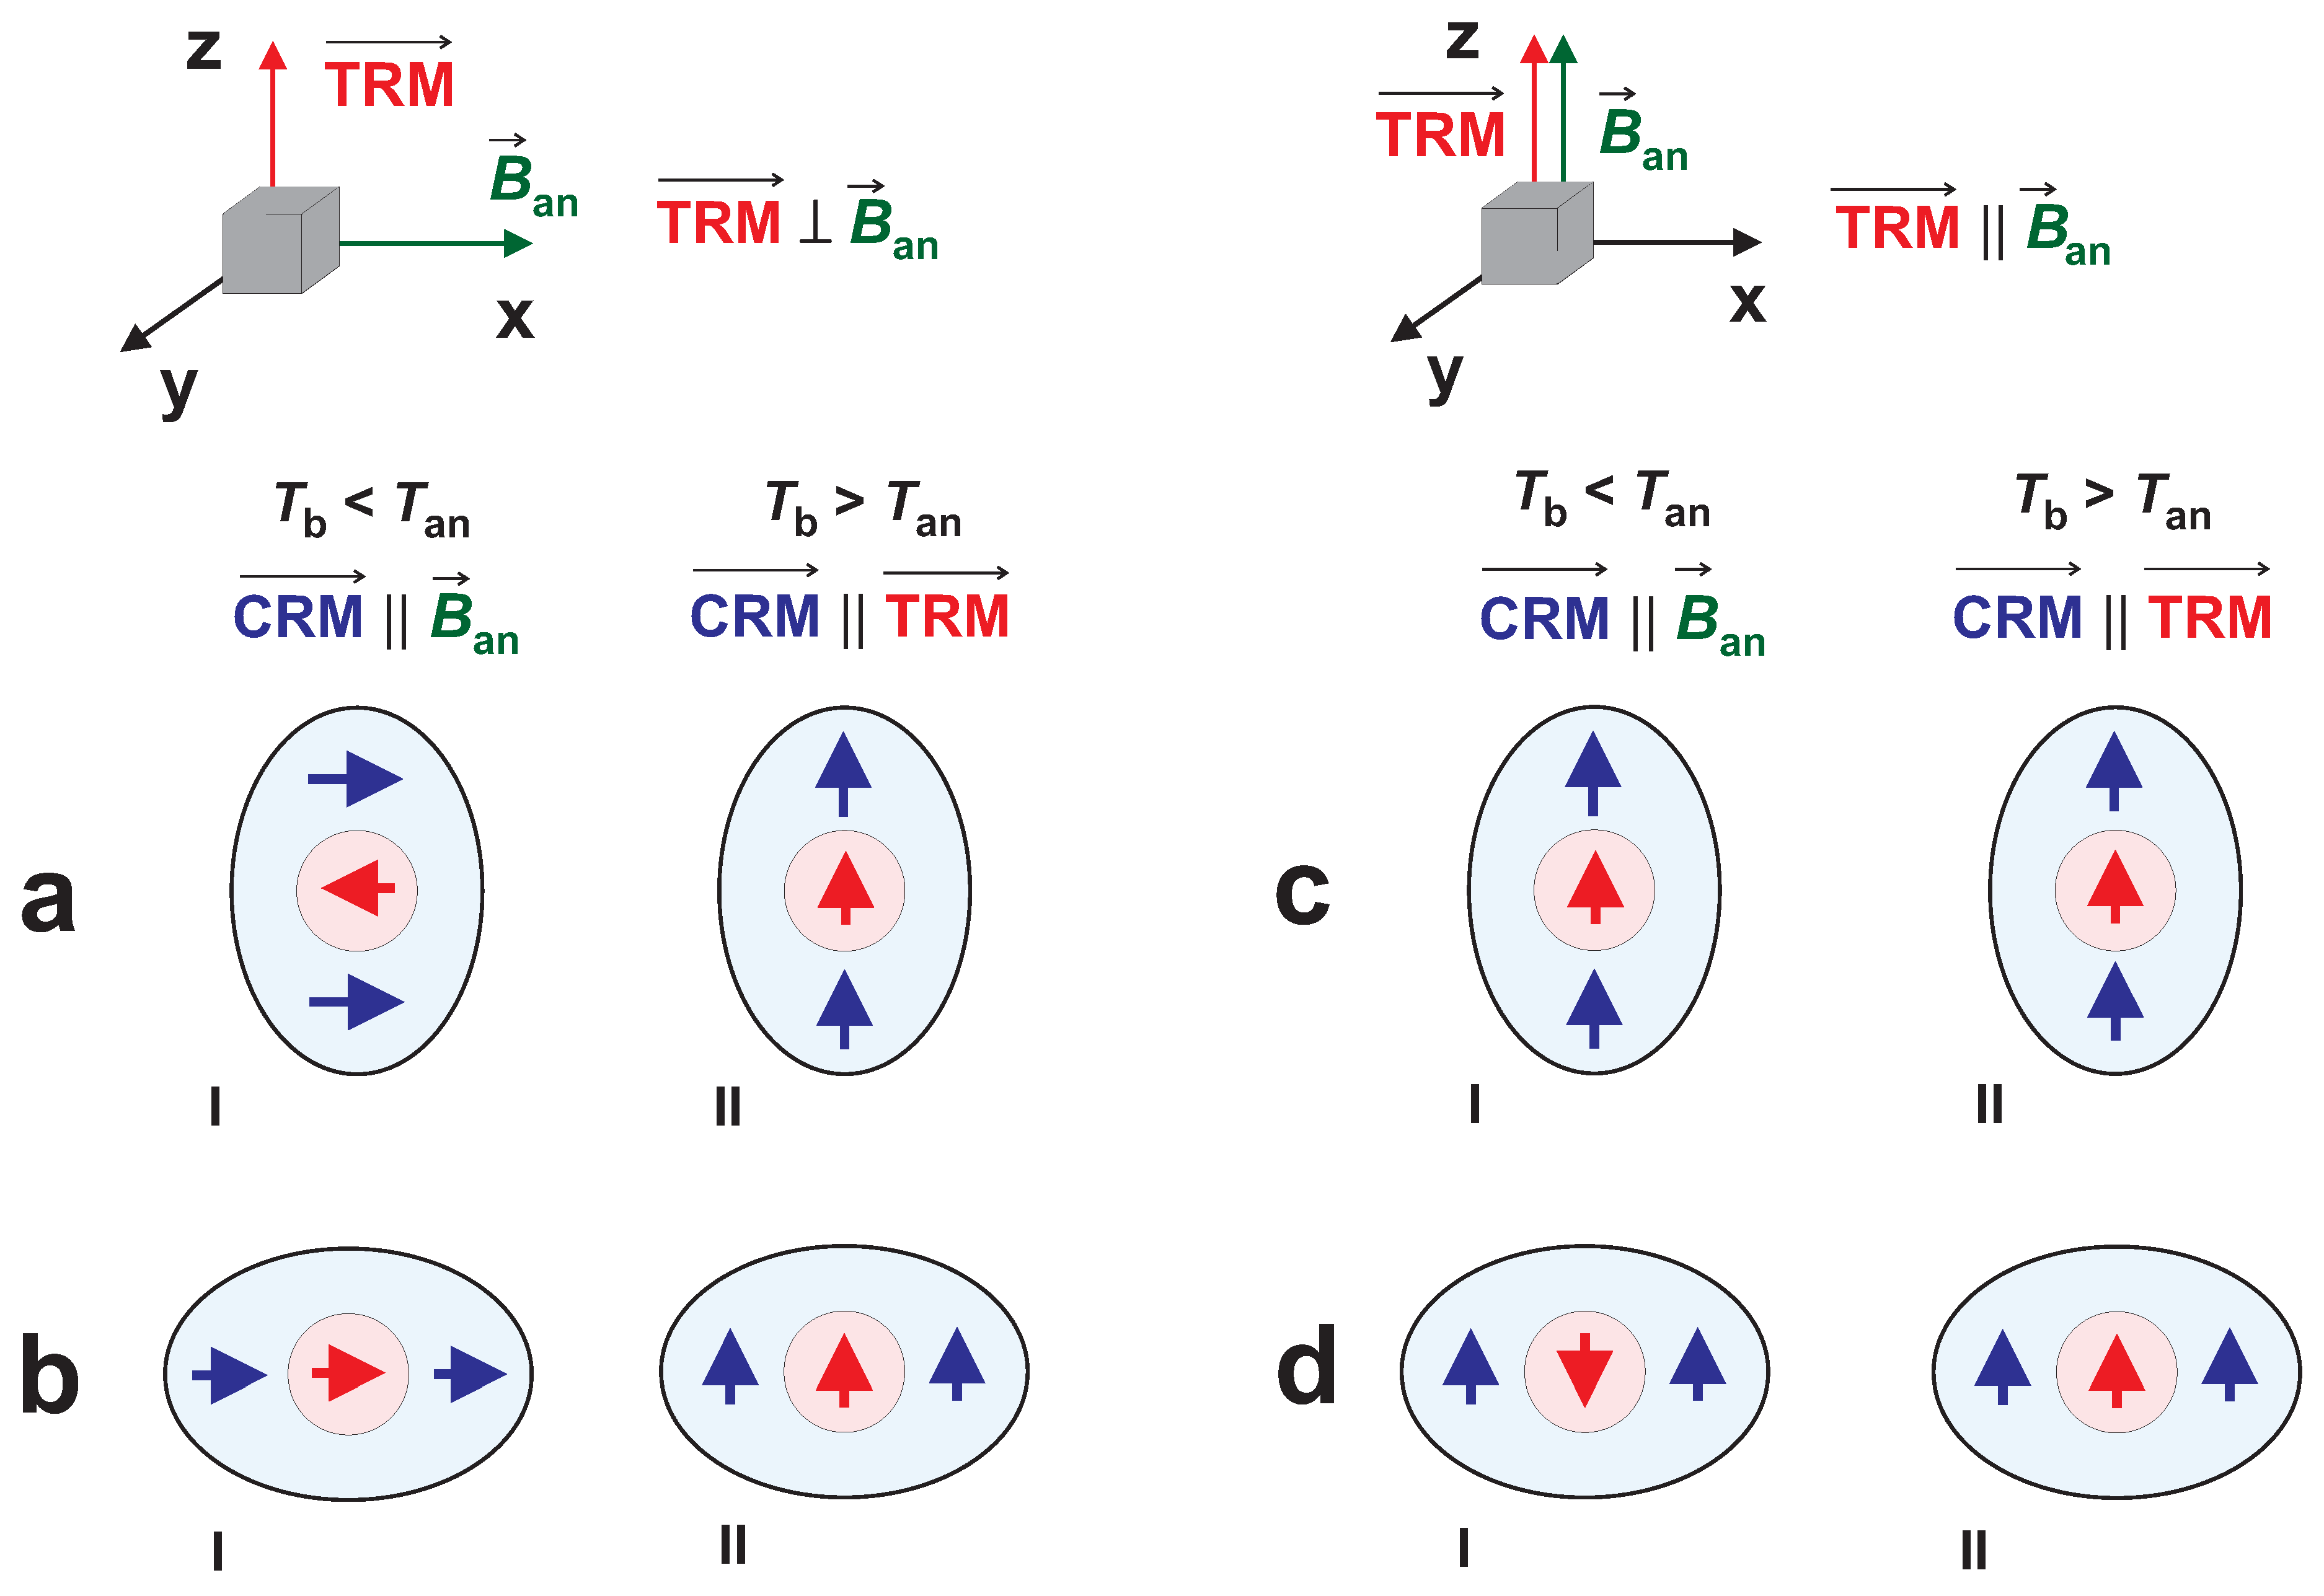

Table 1.
Magnetic characteristics of P72/4 basalt samples before and after annealing.
| tan, | CRM‖TRM | CRM⊥TRM | κ0⋅10−2, | Bc, | Bcr/Bc | Msa | Mrs/Ms | Tc1b, | Tc2b, | Zc | ||
| hours | Mx, A/m |
Mz, A/m |
Mx, A/m |
Mz, A/m |
SI/g | μT | A/m | °C | °C | |||
| 0 | – | 30* | – | 28* | 0.54 | 17.3 | 1.28 | 2400 | 0.37 | 260 | 265 | 0 |
| 12.5 | – | 33.8 | 2.8 | 24.4 | 0.59 | 17.4 | 1.28 | 2520 | 0.36 | 301 | 260 | 0.15 |
| 100 | – | 32.3 | 3.1 | 22.7 | 0.65 | 16.4 | 1.29 | 2730 | 0.35 | 340 | 267 | 0.31 |
| 400 | – | 33.3 | 4.4 | 21.9 | 0.73 | 14.4 | 1.29 | 2820 | 0.30 | 350–415 | 269 | 0.48 |
| 1300 | – | 33.9 | 6.1 | 21.6 | 0.83 | 14.3 | 1.34 | 3030 | 0.31 | 370–435 | 285 | 0.56 |
a Ms is saturation magnetization measured at 1.5 T; b Tc1 corresponds to the heating curve and Tc2 to the cooling curve of thermomagnetic analysis (TMA) of magnetic susceptibility as a function of temperature; c Z is the average degree of oxidation of titanomagnetite grains determined from the Curie temperature, see [18].
Table 2.
Thellier-Coe absolute "paleointensity" determinations (with corresponding statistical parameters) from P-72/4 basalt following annealing at 260 in a 50T magnetic field, oriented both parallel and perpendicular to initial TRM. The magnetic field during the Thellier-Coe procedure was also set to 50T.
| Sample | tan | Field | Z | ΔT | Bcalc1 | N | g | f | |b| | σ(b) | q | DRATmean, |
| number | hours | orientation | °C | μT | % | |||||||
| 95 | 0 | – | 0 | 20–400 | 48.9 | 15 | 0.92 | 0.96 | 0.98 | 0.0447 | 19.25 | 2.2 |
| 92 | 12.5 | ‖ | 0.15 | 260–360 | 51.8 | 10 | 0.86 | 0.59 | 1.04 | 0.0221 | 23.89 | 1.7 |
| 153 | 12.5 | ⊥ | 0.15 | 260–360 | 69.2 | 11 | 0.87 | 0.58 | 1.38 | 0.0239 | 29.37 | 6.4 |
| 96 | 100 | ‖ | 0.31 | 260–360 | 52.5 | 10 | 0.87 | 0.55 | 1.05 | 0.0142 | 35.59 | 1.0 |
| 155 | 100 | ⊥ | 0.31 | 260–360 | 51.4 | 11 | 0.86 | 0.50 | 1.03 | 0.0275 | 15.97 | 3.4 |
| 98 | 400 | ‖ | 0.48 | 260–360 | 48.5 | 10 | 0.84 | 0.49 | 0.97 | 0.0180 | 22.38 | 3.6 |
| 157 | 400 | ⊥ | 0.48 | 260–360 | 41.2 | 11 | 0.84 | 0.40 | 0.82 | 0.0226 | 12.33 | 6.9 |
| 138 | 1300 | ‖ | 0.56 | 260–360 | 60.2 | 10 | 0.80 | 0.36 | 1.20 | 0.0162 | 21.26 | 5.5 |
| 160 | 1300 | ⊥ | 0.56 | 260–360 | 41.2 | 11 | 0.79 | 0.35 | 0.82 | 0.0142 | 15.89 | 7.2 |
tan - annealing time; ΔT - temperature interval for Bcalc determination - N - number of representative points; b - slope of regression line - g - uniformity parameter; f - used magnetization fraction - σ(b) - standard deviation of slope; - quality parameter (acceptable q ≥ 5 [32]) - DRATmean - mean deviation of check-point TRM values (thresholds: ≤3.5-5% [33])
Disclaimer/Publisher’s Note: The statements, opinions and data contained in all publications are solely those of the individual author(s) and contributor(s) and not of MDPI and/or the editor(s). MDPI and/or the editor(s) disclaim responsibility for any injury to people or property resulting from any ideas, methods, instructions or products referred to in the content. |
© 2025 by the authors. Licensee MDPI, Basel, Switzerland. This article is an open access article distributed under the terms and conditions of the Creative Commons Attribution (CC BY) license (http://creativecommons.org/licenses/by/4.0/).
Copyright: This open access article is published under a Creative Commons CC BY 4.0 license, which permit the free download, distribution, and reuse, provided that the author and preprint are cited in any reuse.


