Preprint
Article

This version is not peer-reviewed.

Rare Inclusions of Coexisting Silicate Glass and Cu-PGM Sulfides in Pt-Fe Nuggets, Northwest Ecuador: Fractionation, Decompression Exsolutions and Partial Melting

A peer-reviewed article of this preprint also exists.

Submitted:

30 October 2025

Posted:

30 October 2025

You are already at the latest version

Abstract

Pt-Fe alloys with abundant inclusions from the Camumbi River placer deposit, Ecuador, are derived from unknown Alaskan-Uralian type intrusion(s) within the Late Cretaceous Naranjal accreted terrane. Our previously documented silicate inclusions are increasingly fractionated from hydrous ferrobasalt to rhyolite in terms of TAS (total alkalis vs. silica). Liquid lines of descent change from tholeiitic to the calc-alkaline magma series. Here, we document seven exceptional composite inclusion parageneses of Cu–PGM (platinum-group mineral) sulfides, each exsolved from coexisting, fractionated silicate glass (melt). Differentiation is dominated by fractional crystallization in PGM bulk compositions from tholeiitic silicate melts at highest T ~1018 °C. Silicate inclusions following the lower T calc-alkaline trend coexist with sulfide PGMs likely differentiated (in terms of Pt-Rh-Pd and BMs, base metals) by incongruent melting due to decompression and S-degassing at ~983–830 °C. S-saturated sulfide melts become S-undersaturated below 845 °C. Calculated Ts are for silicate glass. Pt-rich braggite shows increasing fractionation towards Pd-rich vysotskite within one inclusion paragenesis. A late braggite–vysotskite trend is towards decreasing minor BMs. Thiospinels are dominated by cuprorhodsite. Minor thiospinels indicate Fe- then strong Ni-enrichment at lowest Ts. Decompression exsolutions, deflation and partial melting of some sulfide inclusion parageneses support rapid ascent to higher crustal levels within a deep-sourced cumulate intrusion.

Keywords: 
;  ;  ;  ;  ;  

1. Introduction

Silicate glass inclusions in Alaskan-Uralian type Pt-Fe nuggets, from the Sabaleta placer deposit, Camumbi River, NW Ecuador (Figure 1), define a fractionated comagmatic series from primitive hydrous ferrobasalt to basaltic andesite, andesite and most fractionated is groundmass silicate glass of dacite–rhyolite composition in feldspar-porphyritic inclusions [1]. Primitive tholeiitic ferrobasaltic melt inclusions are progressively fractionated towards calc-alkaline compositions, a trend that compares with fractionation of experimental hydrous ferrobasalt of Botcharnikov et al. [2]. Trace elements of fractionated silicate melt inclusions [1] share a similar pattern with their Late Cretaceous accreted Naranjal island arc terrane [3] and suggest a possible back-arc setting. The ‘wet’ residual silicate melts concentrate platinum group element (PGE)-clusters and ligands, facilitating crystallization of PGM during mush/melt intrusion within a fault-located conduit/pipe. Compressed by the intruding cumulate, the fractionating, increasingly more felsic ‘wet’ melts are sequentially expelled, forming the typical cylindrical zoned layering of Alaskan type intrusions [1].
Pt-Fe alloy nugget chemistry [6] shows almost equal proportions of native platinum and isoferroplatinum with depleted Rh, Os, and Ru. Mineral inclusions of Os-Ir alloy and laurite [(RuOsIr)S2] are first crystallised at high T in native platinum while isoferroplatinum is crystallised at lower T [6]. This is supported by the finding that laurite and Os–Ir–Ru alloys are liquidus phases first crystallized at high temperature and low sulfur fugacity [7].
Experimental studies confirm that a primitive Cu-bearing PGE–S-(As) melt is first exsolved from primitive basalt and that a subordinate exsolved Cu-depleted PGE–As-(S) melt exsolves at lower T [6,8,9,10]. It is also shown experimentally that from an As-(S) melt the immiscible melts Pt-As-(S) and Pd-As-(S) crystallize distinctive PGM [11,12,13].
We document similar natural Cu-depleted PGE mineral inclusions hosted in two separate isoferroplatinum nuggets from the Camumbi River deposit [6]. In the first, zoned sulfarsenides sperrylite and genkinite define a Pt-enriched sub-system (Pt>Rh, (Pd, Ir,Ru), As>S>>Sb,Bi). In the second, mineral inclusions of zoned arsenopalladinite, sperrylite, törnroosite, and gold define a lower T, fractionated Pd enriched sub-system Pd>Rh≈Pt> Ir>As>S>Te>>Sb,Bi>Au. In the latter, we define (in terms of Pt-Ir-Rh) the previously undocumented natural S-rich sperrylite (formerly “platarsite”) solid solution series and later-crystallized irarsite series.
In the experimental system Pt, Pd, S, As, Se, and Te, also at high T (~1250 °C), the highest concentrations of S, As, Se, and Te in basaltic melt are recorded by Helmy et al. [14] when the Fe2+ cation is the principal metal ligand. Comparable natural conditions of increasing FeO define initial tholeiitic basaltic fractionation. Importantly, it is also shown experimentally (in the absence of silicate melt) that the affinities of the chalcophile metals for an immiscible arsenide melt follow the order Pt > Pd > Ni > Fe > Cu [13,15]. Therefore, Cu is the least likely element to partition into a subordinate exsolved As melt, and the residual sulfide melt is further enriched in Cu. The latter is like our Cu-enriched and Ni-bearing PGE sulfide natural system considered below.
In a separate study [16], inclusions of mineral (crystal) and melt parageneses within one host isoferroplatinum nugget define a complex, natural Cu-enriched and Ni-bearing PGM sulfide system, possibly co-exsolved with [2] above. Here, at highest T, cooperite crystal inclusions are first crystallised, then Cu-bearing sulfide PGMs [kingstonite ± Rh-rich cuprorhodsite–(malanite) and monosulfides] while in an adjacent domain are eight melt inclusions with Cu-PGM sulfide parageneses. The latter are dominated by a fractionated cuprorhodsite–(malanite) solid solution series coexisting with conjugate, exsolved monosulfide minerals. Fractionated compositions of the cuprorhodsite–(malanite) series define four narrow, subparallel crystallization ‘fronts’ of sequentially cooled residual decompression melts. Under conditions of decreasing T (and fS2), the natural cuprorhodsite–(malanite) compositions show decreasing Rh and increasing Pt (±Ir) defining a relative T stability range [16]. Supporting our findings, experiments of Li et al. [17] show that at 1000 and 1100 °C, under S-saturated conditions, Rh is compatible and is fractionated into Mss (monosulfide solid solution) but Pt, Pd and Cu are strongly incompatible and are fractionated into residual sulfide melts.
Here we consider the lower T fractionation of rare composite melt inclusions in seven separate host Pt-Fe nuggets. Each inclusion type comprises quenched silicate glass and exsolved, coexisting PGM parageneses (Cu-PGE-bearing sulfides ± minor As, Te). Compositions of the fractionated silicate glass vary from hydrous ferrobasalt, basaltic andesite, andesite and finally dacite-rhyolite and here we document the complex fractionation of their coexisting PGM parageneses.

2. Samples and Methods

Samples of heavy mineral concentrate are from the Rio Dorado Limited Sabaleta Project area, Ecuador (Figure 1, above). Petrological/mineralogical examination confirms significant platinum and gold nuggets. Pt-Fe alloy nuggets selected for this study are labelled by Rio Dorado with prefix numbers (A2, Mag 5, A1 and B). Area numbers (4, 5, 7 and 9) refer to areas marked on polished thin sections to locate individual grains for EPMA (electron probe micro analysis) in inclusions within each host Pt-Fe alloy nugget.

2.1. Platinum-Group Sulfide Mineral Analysis

Prior to analysis all samples were coated with 20 nm of carbon using a HHV Auto 306 carbon evaporator.
Compositional analyses were acquired on a JEOL JXA-8530F Plus field emission electron microprobe at the Central Science Laboratory, University of Tasmania, equipped with five wavelength dispersive spectrometers and using an accelerating voltage of 20 kV, probe current of 20 nA, and beam diameter in the range from 0.1 to 1 µm, depending on the size of the respective feature.
The data was acquired and processed with the ‘Probe For EPMA’ software package by Probe Software, Inc. (Eugene, OR, USA) and quantified with the Armstrong/Love-Scott matrix correction algorithm and FFAST mass absorption coefficients. For analytical details see Supplementary Table A (Data Availability Statement below).
Detailed settings for the different elements are listed below. For elements Ir, Pt, and Au, X-ray intensities were acquired for both Lα and Mα lines. Depending on individual mineral compositions, the Mα lines were used for quantification, except in the following cases:
• Ir Lα used instead of Mα in case of major Os (>10 wt.%) due to strong Os interference on Ir Lα.
• Pt Lα in case of major Ir (>5 wt.%).
• Au Lα in case of major Pt (>15 wt.%).
Silicon and Ca were analyzed as indicators for analysis contributions from gangue minerals across grain boundaries or from inclusions.
Conventional two-point off-peak background measurements were performed and converted to multi point background curves using the shared background technique [18]. Background fit curves for each element were optimized individually for different mineral compositions.
A Thermo Pathfinder Pinnacle energy dispersive X ray spectrometry (EDS) system with UltraDry Extreme 30 mm2 silicon drift detector and the JEOL backscattered electron (BSE) detector on the same EPMA instrument were used to acquire BSE images and semi quantitative EDS analyses to aid selection and documentation of microprobe analysis locations.

2.2. Element Mapping of Cu-PGM-Sulfide Exsolution Inclusion Assemblages

X-ray element maps and corresponding BSE images were acquired on a Hitachi SU-70 field emission scanning electron microscope (SEM) fitted with an Oxford AZtec EDS system with XMax 80 silicon drift detector and Hitachi photo diode BSE detector at the Central Science Laboratory, University of Tasmania, using an accelerating voltage of 17 kV and beam current of 3 nA. 90-100 individual frames were acquired and integrated per map at an individual pixel dwell time of 100-200 µs, leading to a total acquisition time per pixel of 10-20 ms with pixel sizes ranging from 0.2 to 0.5 µm.

3. Samples: Silicate Inclusions with Coexisting Cu-PGM Sulfide Parageneses

Seven Pt-Fe alloy nuggets host melt inclusions of Cu- enriched, Rh- and Pt-bearing sulfide parageneses, each coexisting with (or closely associated with) their quenched parental silicate melt (mainly quenched glass). Here we consider samples in the order of increasingly fractionated silicate glass compositions from primitive hydrous basalt to ferrobasalt, basaltic andesite, andesite and finally those with dacite-rhyolite and rhyolite groundmass fractions, Barron et al. [1].

3.1. Samples, Mineralogy and Analyses

3.1.1. Sample A2 Area 7

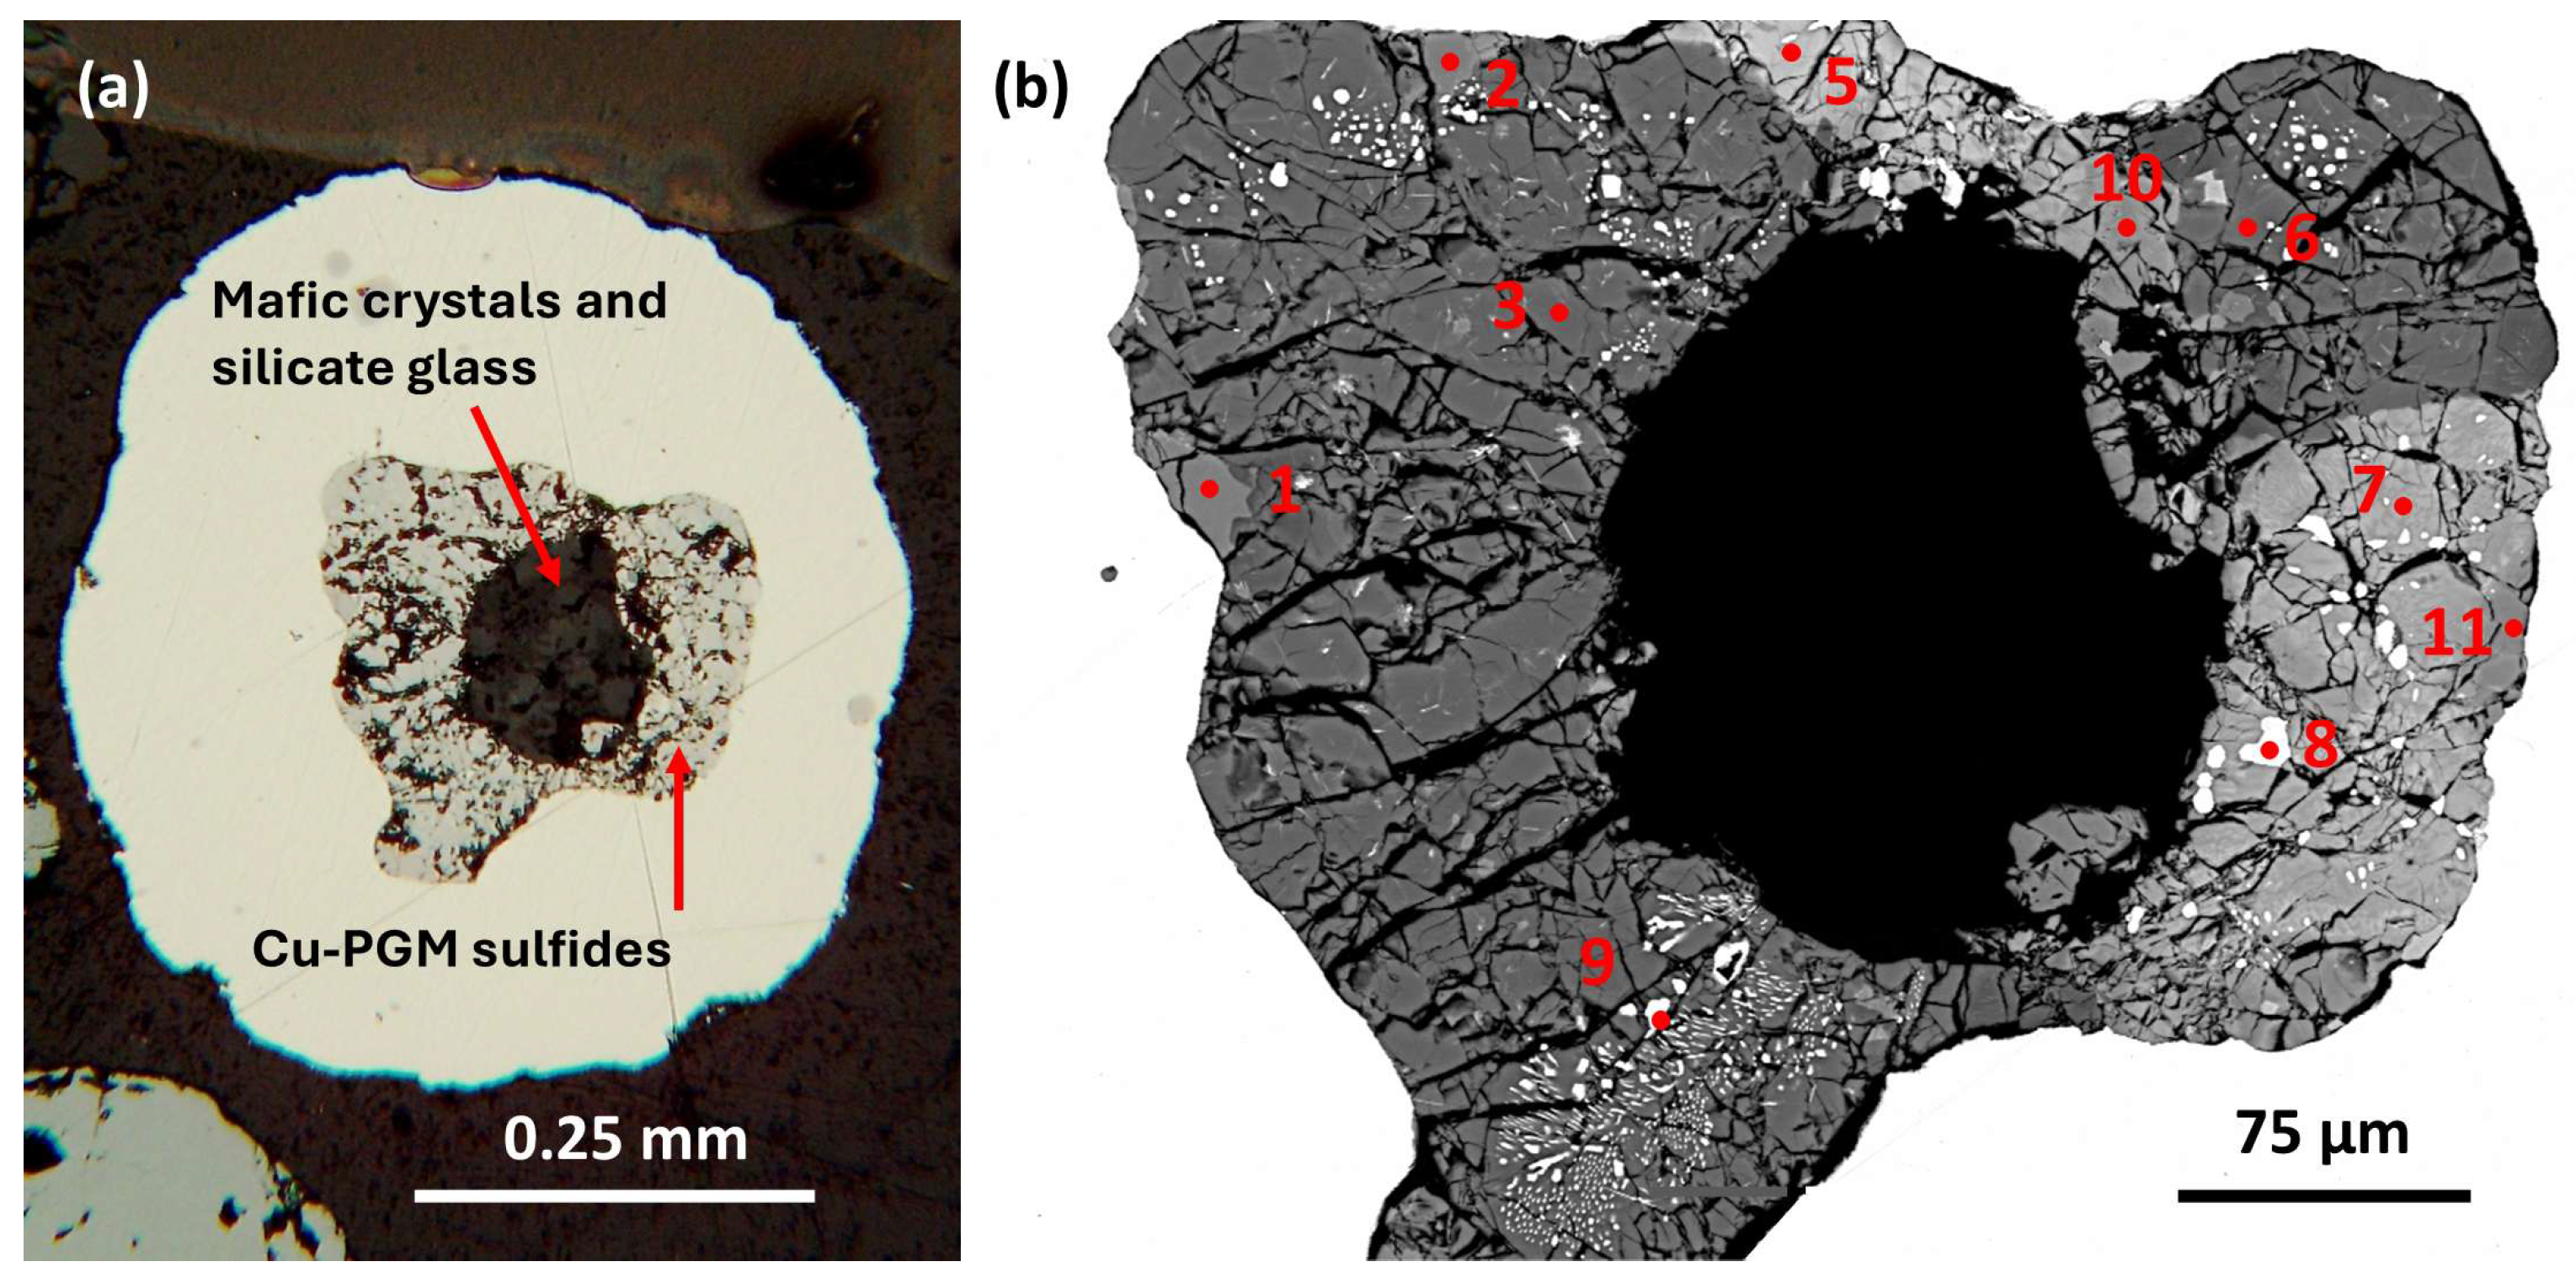
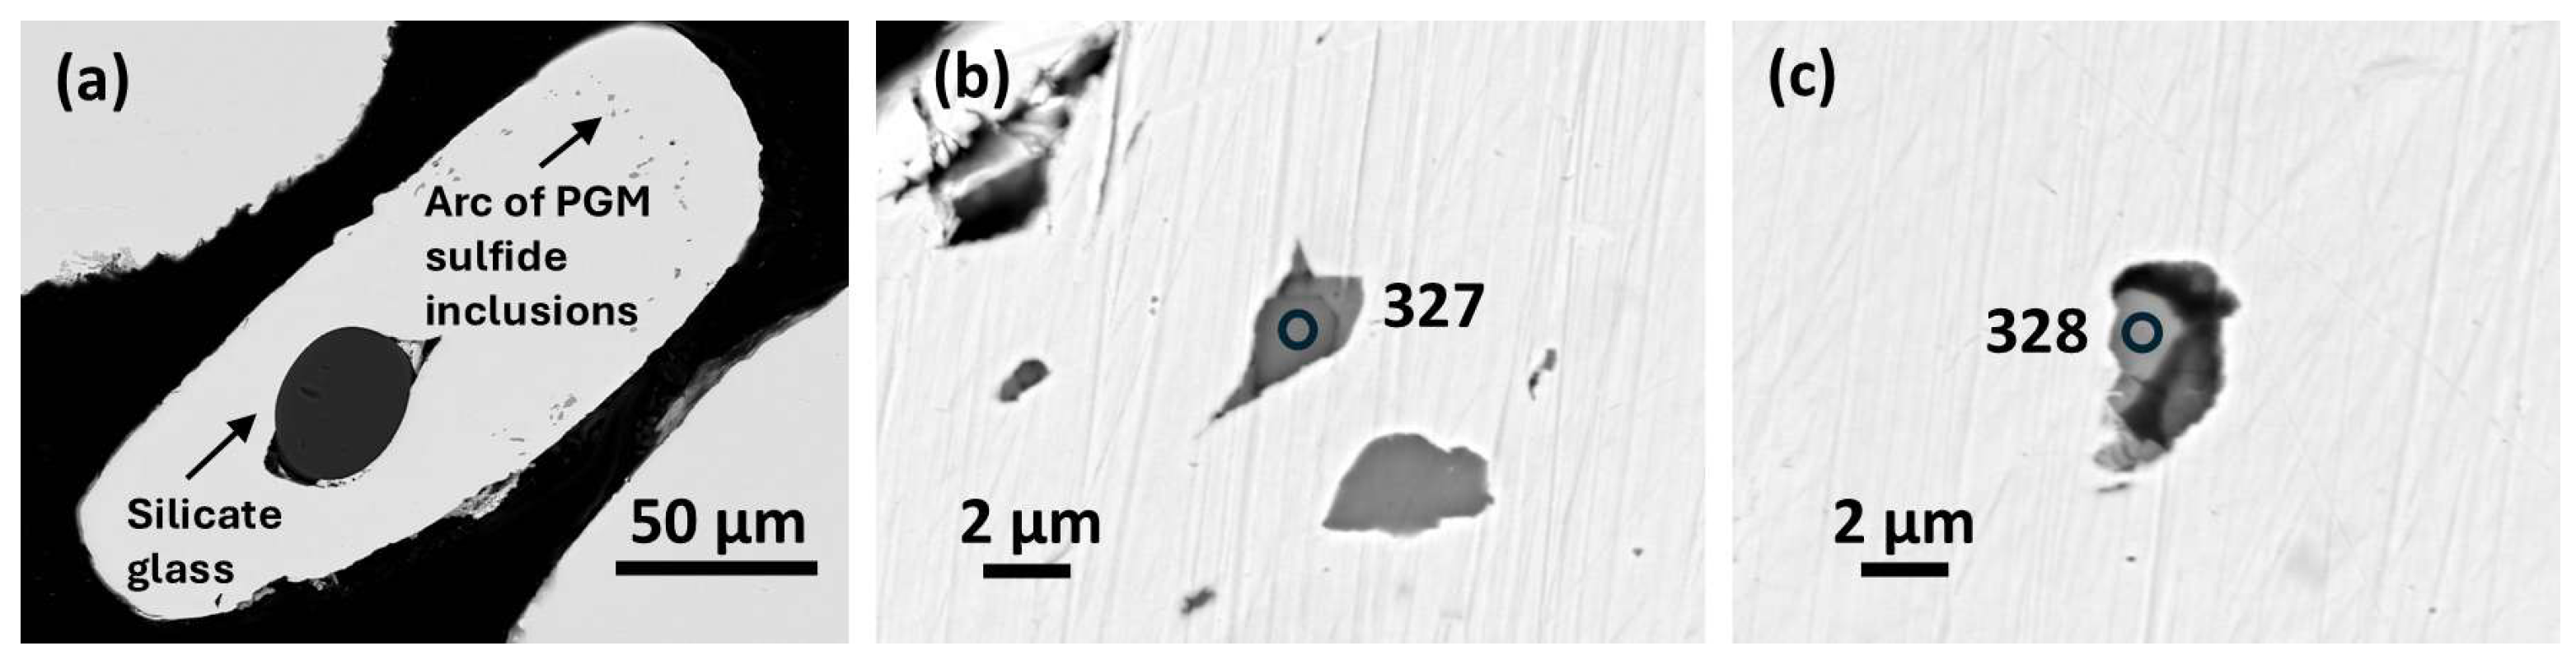
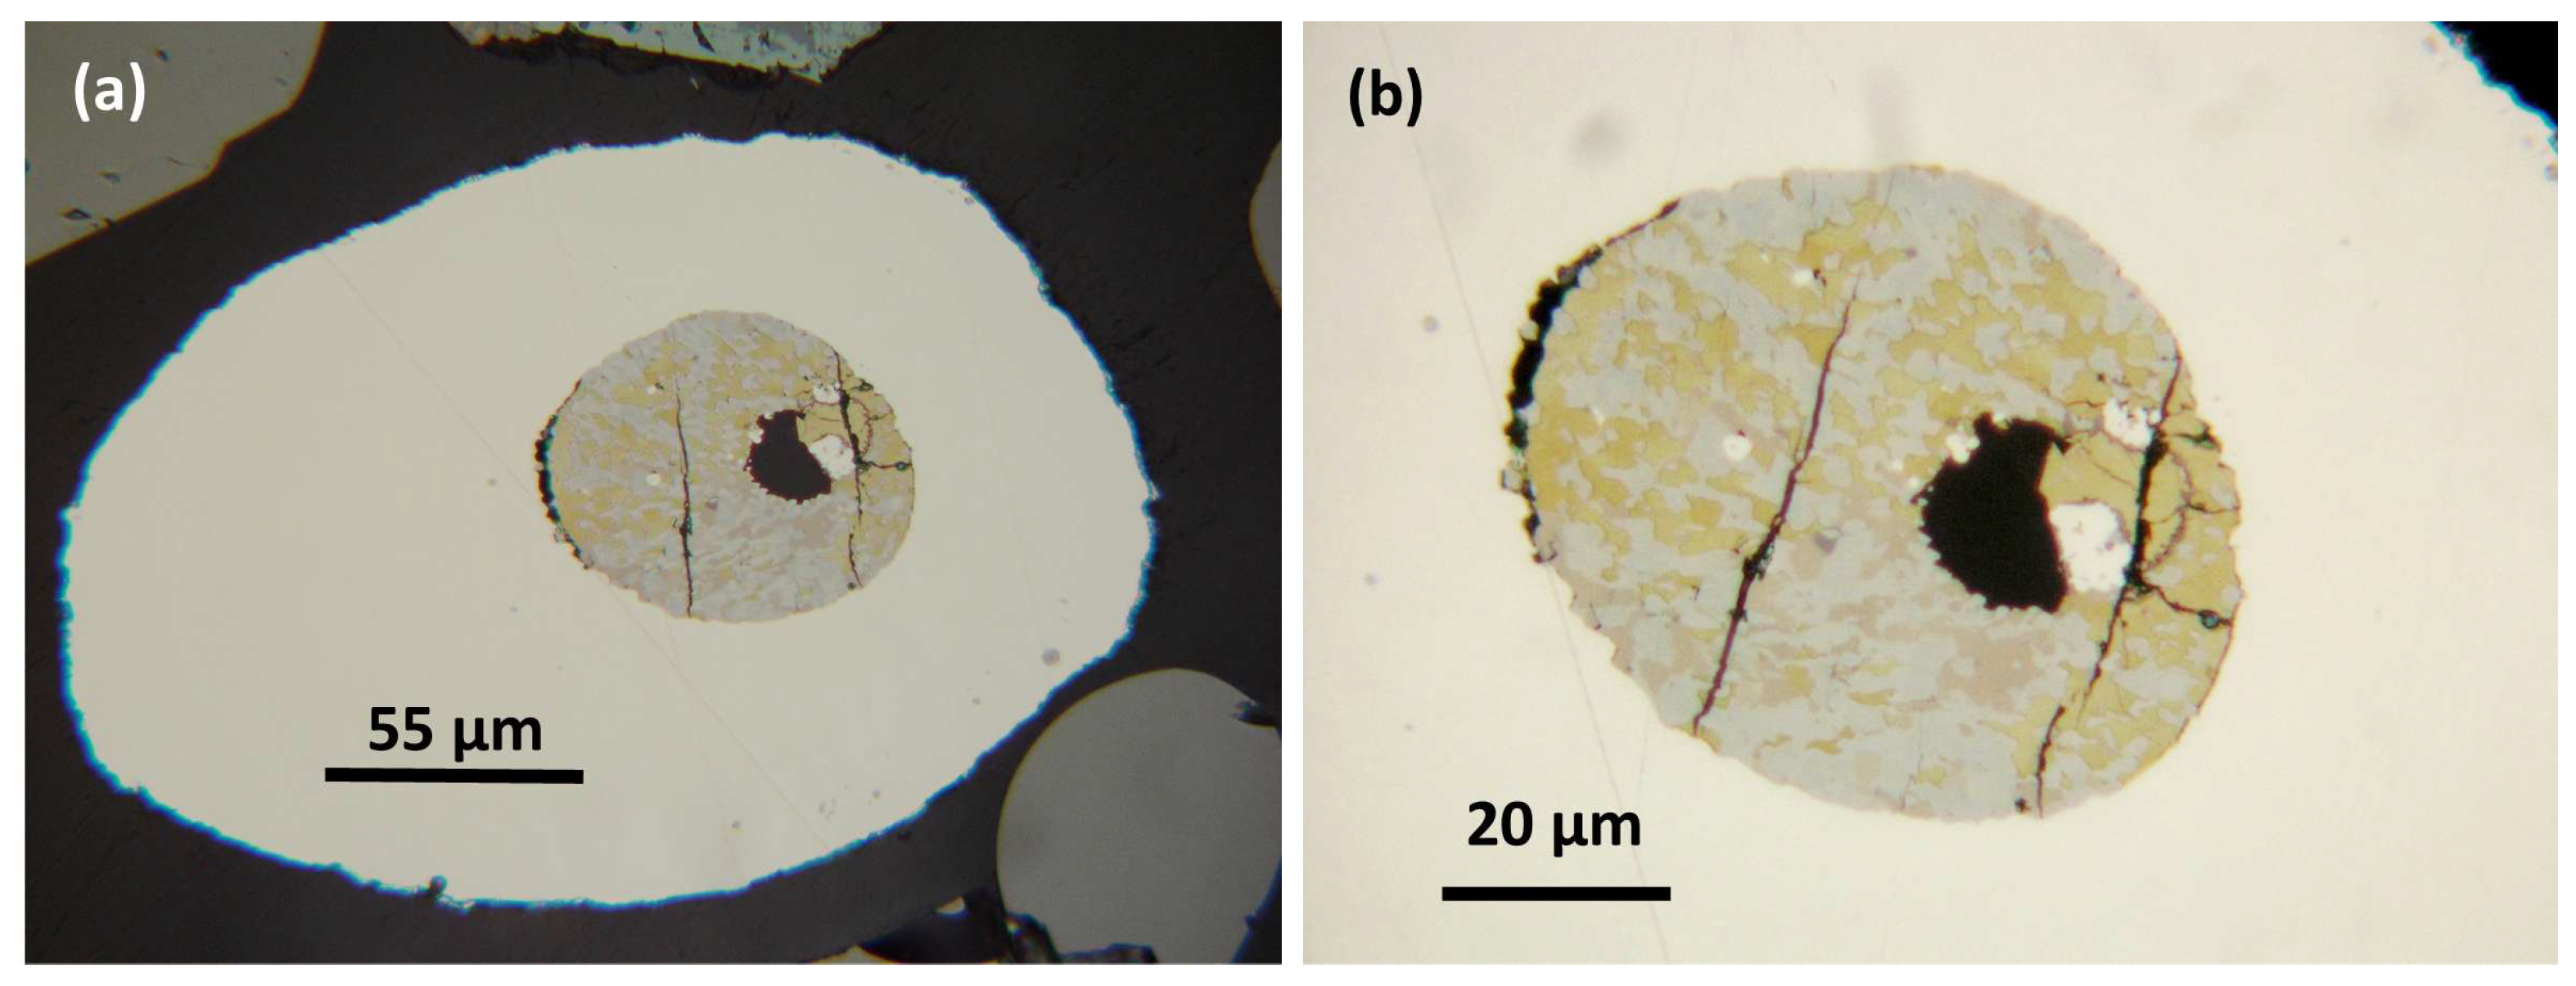
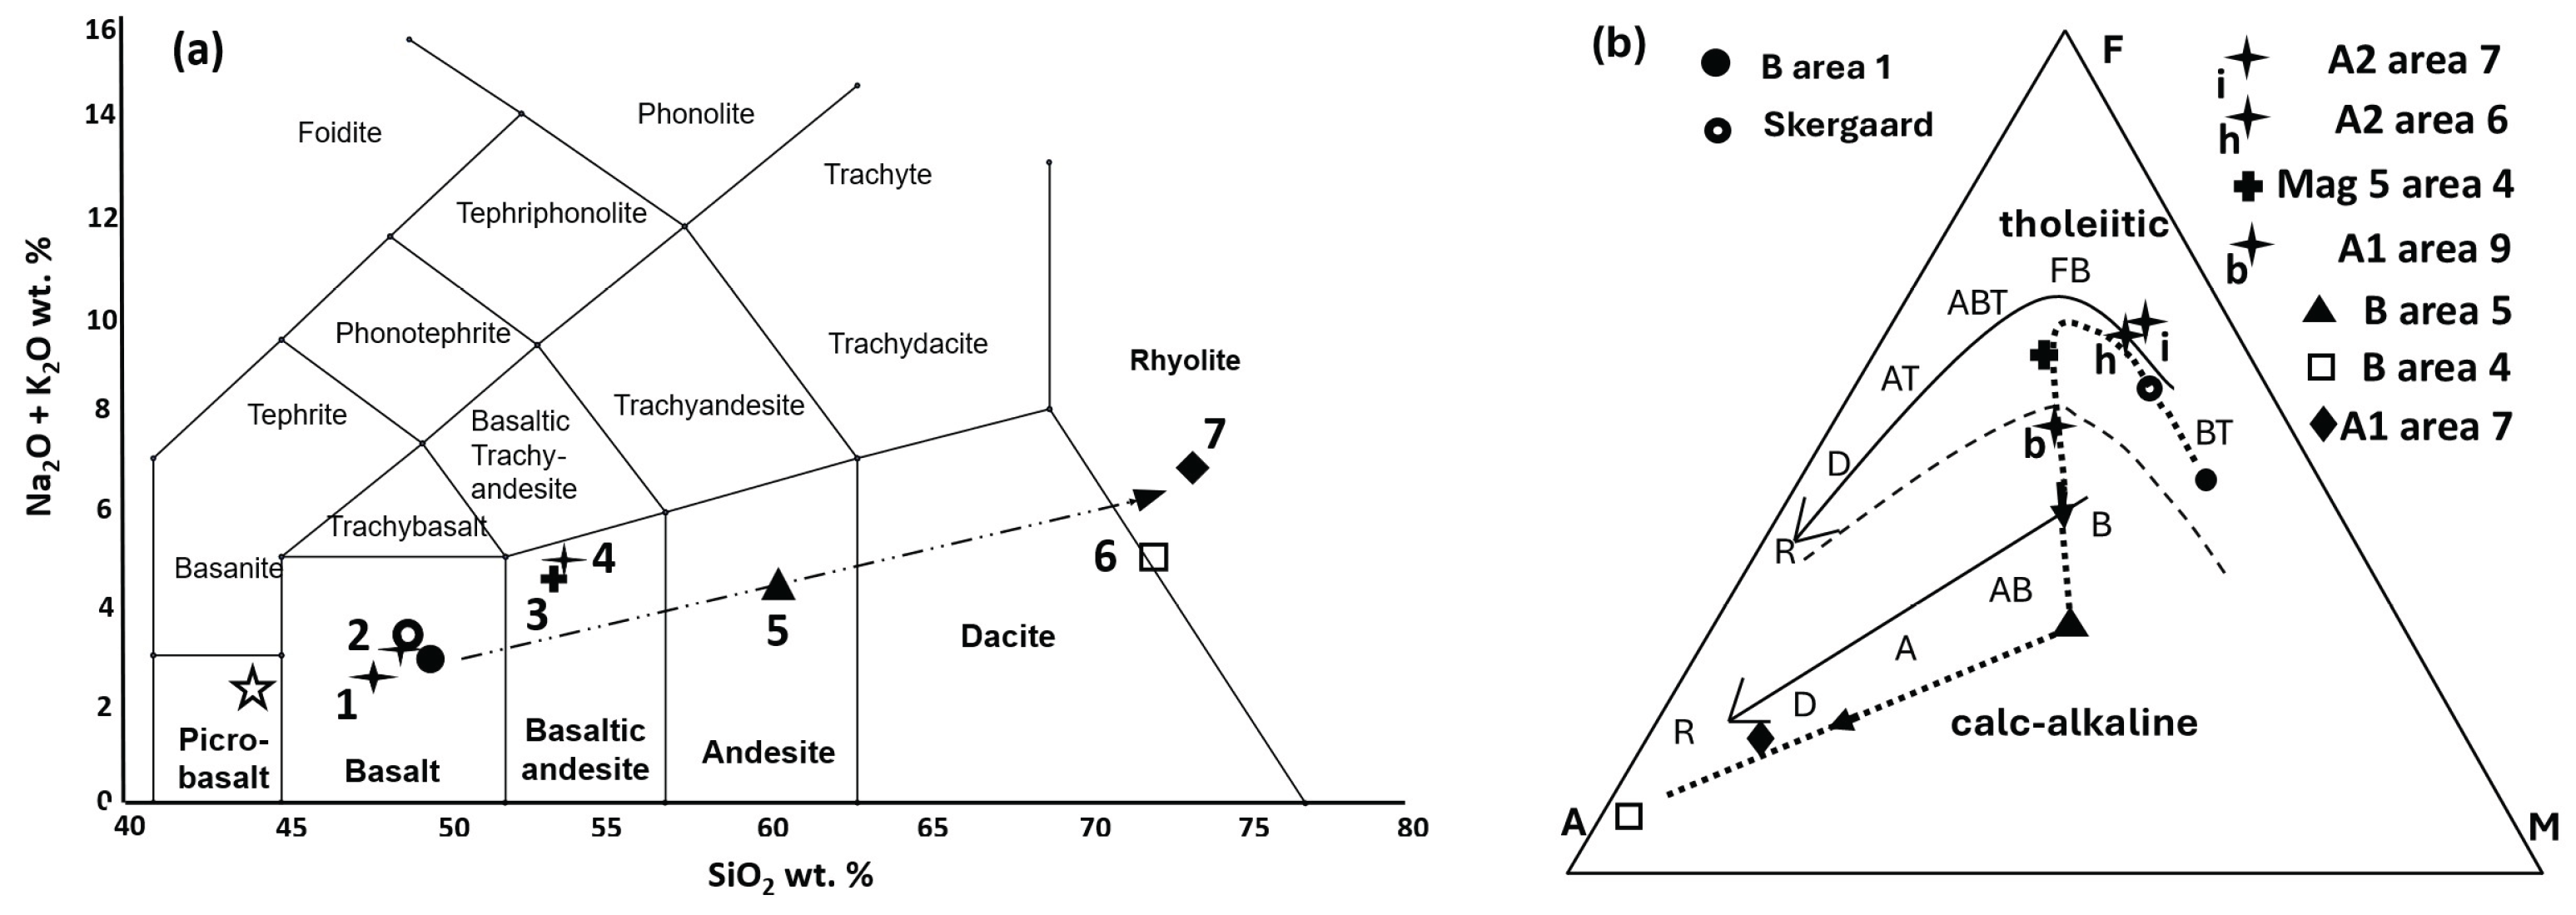
a) Host alloy and ferrobasalt silicate glass (SiO2 47.43 wt. %).
This host nugget is rounded (Figure 2a) but distinctly deformed (flattened) and reaches ~987 µm long and ~370 µm across. The prominent rounded silicate glass inclusion (~191 µm long and ~146 µm across) also is flattened; with adjacent, elongate triangular strain shadows, possibly parallel to a foliation direction. Analysis 277 (Barron et al. [1] Tables 1A and 1B; and Table 1 below) indicates host native platinum (Pt2.95Rh0.09Pd0.06 Ir0.01Os0.01)3.12(Fe0.80Cu0.07Ni0.01)0.88 with the following minor elements in decreasing order of abundance Rh, Cu, Pd, Ir, Os and Ni.
A distinct ‘corona’ is defined by an arc of small (~1–5 µm) inclusions with Cu-PGE sulfide parageneses located near the nugget margin and distant from their host basaltic glass inclusion (Figure 2a). These inclusions have irregular shapes and also show elongate narrow strain shadows in Figure 2b.
Analysis 176 (Barron et al. [1] Table 2E) indicates coexisting (host) silicate glass in this inclusion is ferrobasalt with SiO2 47.43, FeO 17.62, MgO 6.13 (wt. %) and minor H2O ~0.31. This glass is the least siliceous of the present samples.
b) PGM sulfide paragenesis.
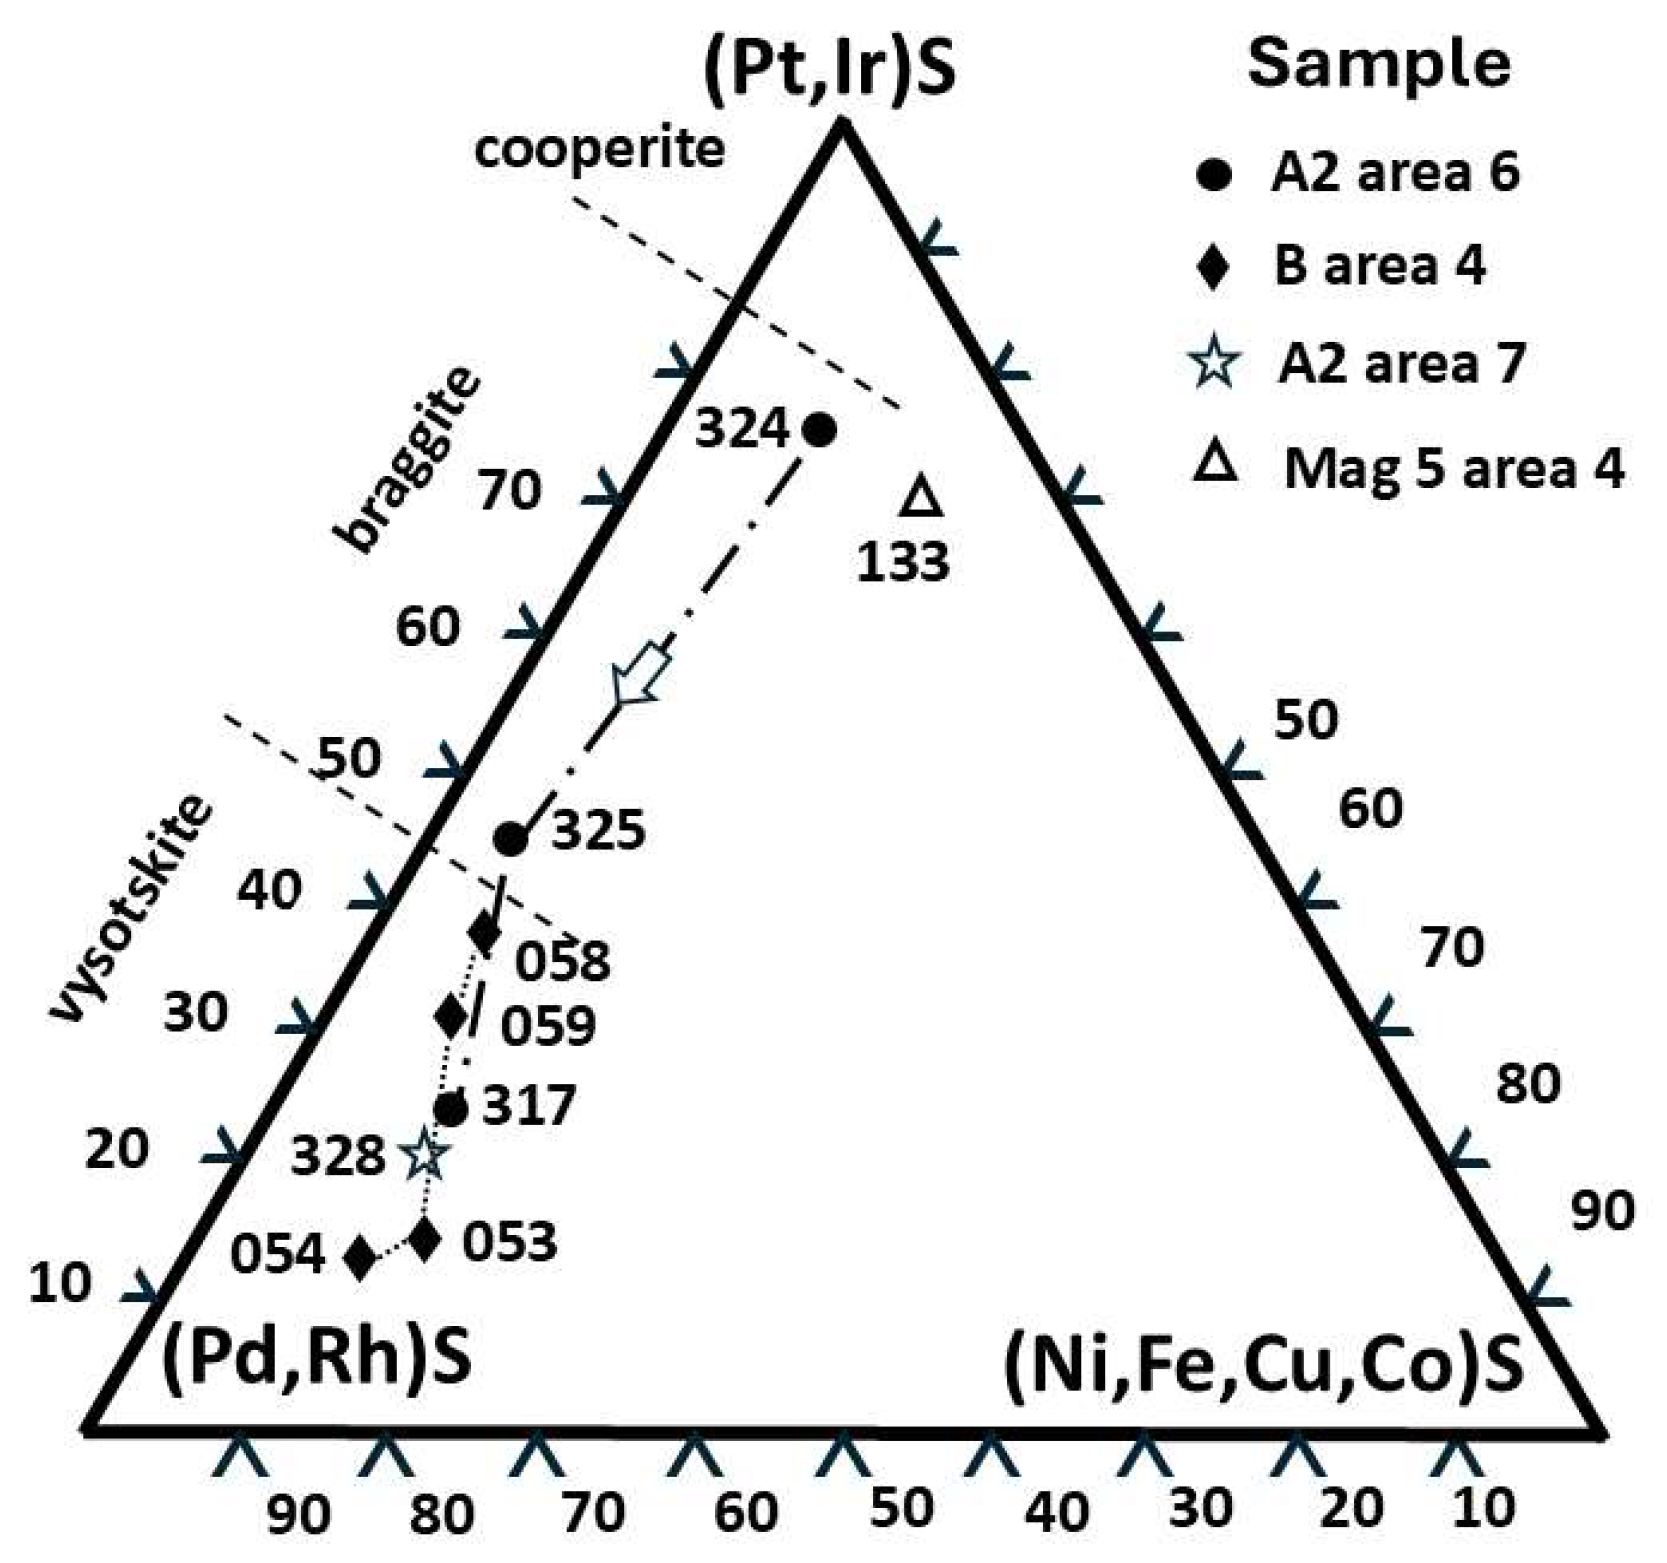
Cuprorhodsite–(malanite) (Figure 2b) is a small (~2.5 µm) subhedral crystal set in a strain shadow microstructure. Analysis 327 (Table 1) indicates (Cu0.85Fe0.12Ni0.03)1.00(Rh1.26Pt0.62Pd0.05Ru0.05Ir0.03Os0.01)1.96S3.96. The strain shadow host mineral is too small for accurate analysis.
Vysotskite occurs as a subhedral crystal in a separate inclusion (Figure 2c). Analysis (328) (Table 1) indicates the following Pd-rich vysotskite formula (Pd0.64Pt0.20Cu0.04Fe0.04Ni0.03)0.91S1.04 (cf. Cabri and McDonald [19] their Figure 1). A fibrous irregular matrix fraction is too small for analysis.

3.1.2. Sample A2 Area 6

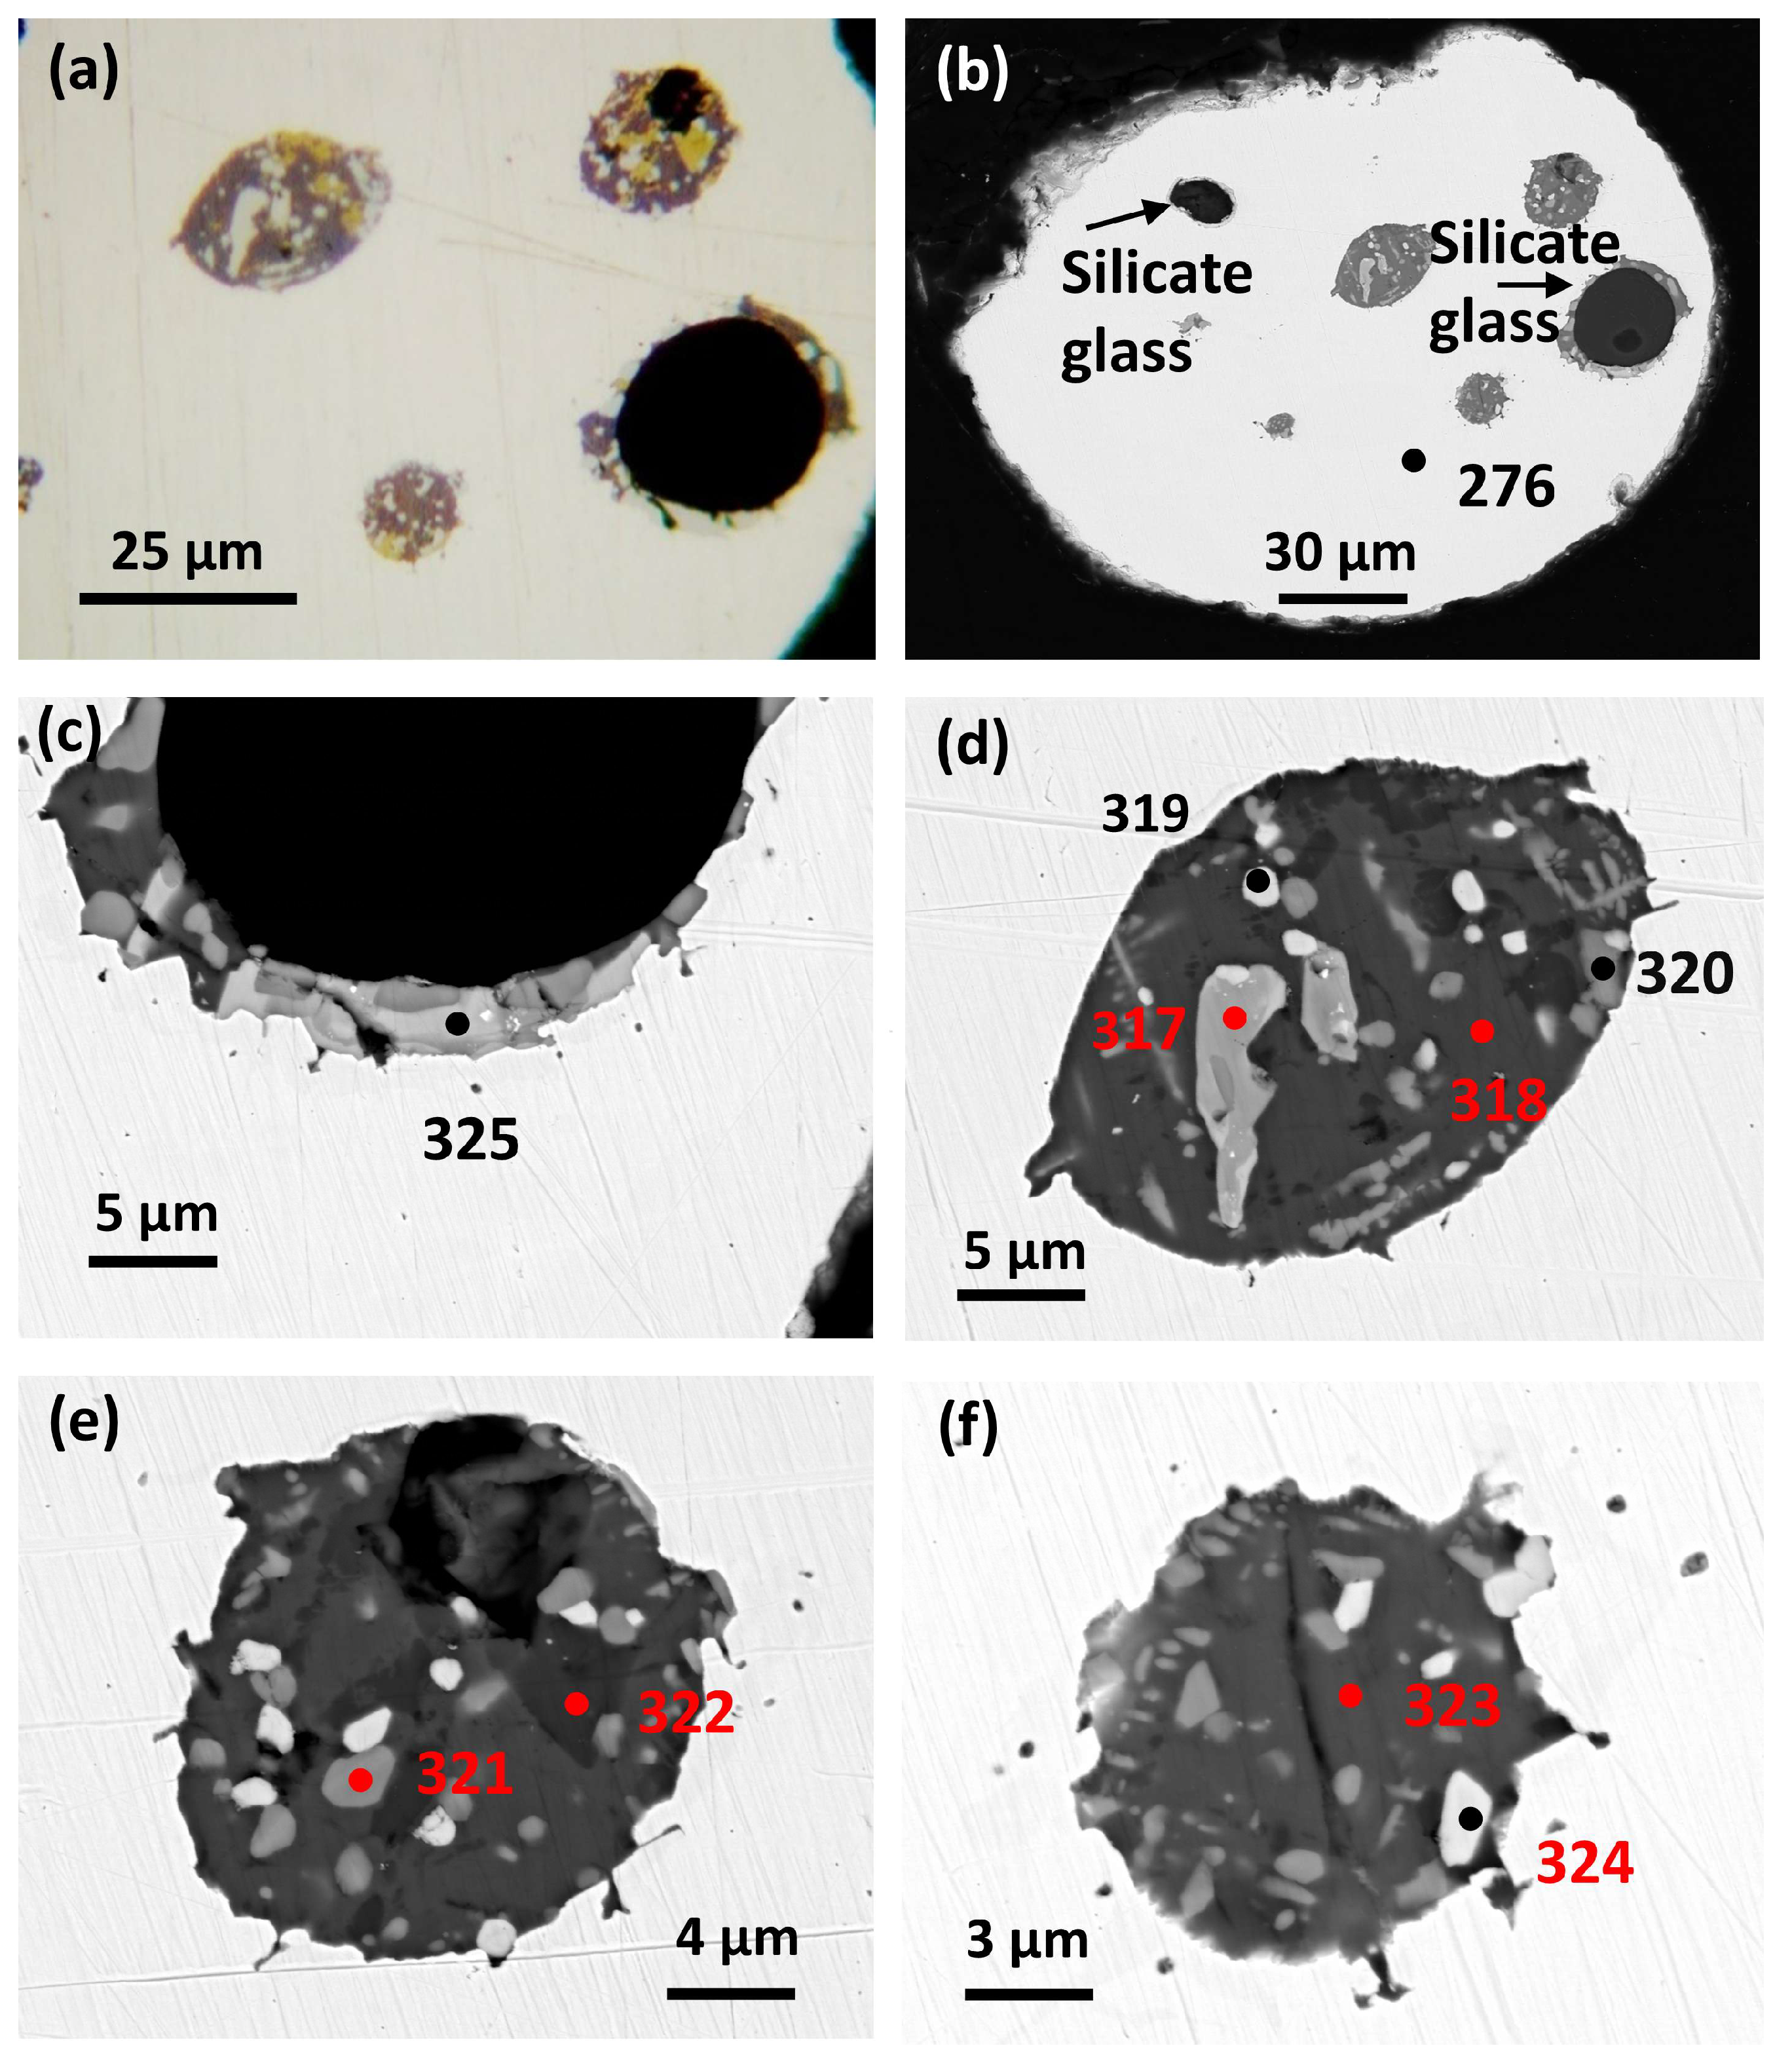
a) Host alloy and ferrobasalt silicate glass (SiO2 47.83 wt. %).
This host Pt-Fe nugget (~0.7 mm diameter) is rounded with a partly broken margin (Figure 3a,b). Analysis 276 (Barron et al. [1] Tables 1A and 1B and Table 2 below) is isoferroplatinum (Pt2.95Rh0.08Pd0.05 Ir0.01)3.09(Fe0.74Cu0.17)0.91 with minor Cu, Rh and Pd.
Seven inclusions are present, four of which are considered here (Figure 3a,b). The largest is a rounded silicate glass inclusion (~28 µm diameter) with a small vesicle (possible gas cavity) about 7 µm across, located near the margin. The silicate glass has a narrow but irregular partial rim of exsolved PGM with Cu-sulfides, the boundary of which against the host nugget is exceptional. It shows well preserved quench textures of cuspate crests and related small ‘droplets’ within the host Pt-Fe alloy. A similar very narrow rim of exsolved Cu-PGM occurs around a smaller silicate glass inclusion not considered here. Three smaller, rounded inclusions are Cu-PGM parageneses like that of the exsolved PGM sulfide rim of the largest silicate glass inclusion (above). They show similar, well preserved, irregular boundaries against the host nugget.
Analysis 172 of the silicate glass (Barron et al. [1] Table 2E) indicates ferrobasalt with SiO2 47.83, FeO 15.68, MgO 5.52 and minor H2O ~1.17 (wt. %).
b) PGM and Cu-sulfide paragenesis.
Sulfide parageneses and their textural features are similar in each of five melt inclusions (Figure 3). Small subhedral crystals are braggite and cuprorhodsite, while zoned braggite occurs as subhedral to anhedral patches (up to 13 µm long). Bornite contains up to ~20% of PGE monosulfide as exsolved crystallites (see below). Some of the latter are subhedral (up to ~3.0 µm grain size) and many are skeletal, branching and crystallographically controlled (reaching ~5 µm long). Bornite also hosts subordinate irregular patches of chalcopyrite (yellow, Figure 3a).
Braggite occurs as subhedral white crystals (Figure 3f). Analysis 8(324) Table 2 gives Pt 35.21 Pd 5.56 with 4.17 at. % minor elements (Cu, Fe, Rh, Ni and Os) and slightly high S. A second braggite analysis 9(325) (Table 2, Figure 3c) gives Pt 19.64, Pd 19.55 (at. %) and minor PGE 6.19 (at. %) (cf. Figure 1, Cabri and McDonald [19]). This analysis is for an anhedral interstitial grain with marginal zoning. It occurs within the narrow rim of PGM sulfide parageneses adjacent to the largest silicate glass inclusion (Figure 3c).
A third, semiquantitative [20] analysis (317) is for an irregular, narrow (~3 µm across) zoned grain (Figure 3d) indicating Pd reaches 30.76 and Pt is 11.41 at. % (+ ~6.50 at. % PGE minor elements, and Se also is present). The formula for this composition (Fe0.02Ni0.05Cu0.05Pd0.59Pt0.22S1.00) defines vysotskite (cf. Cabri and McDonald [19] Figure 1).
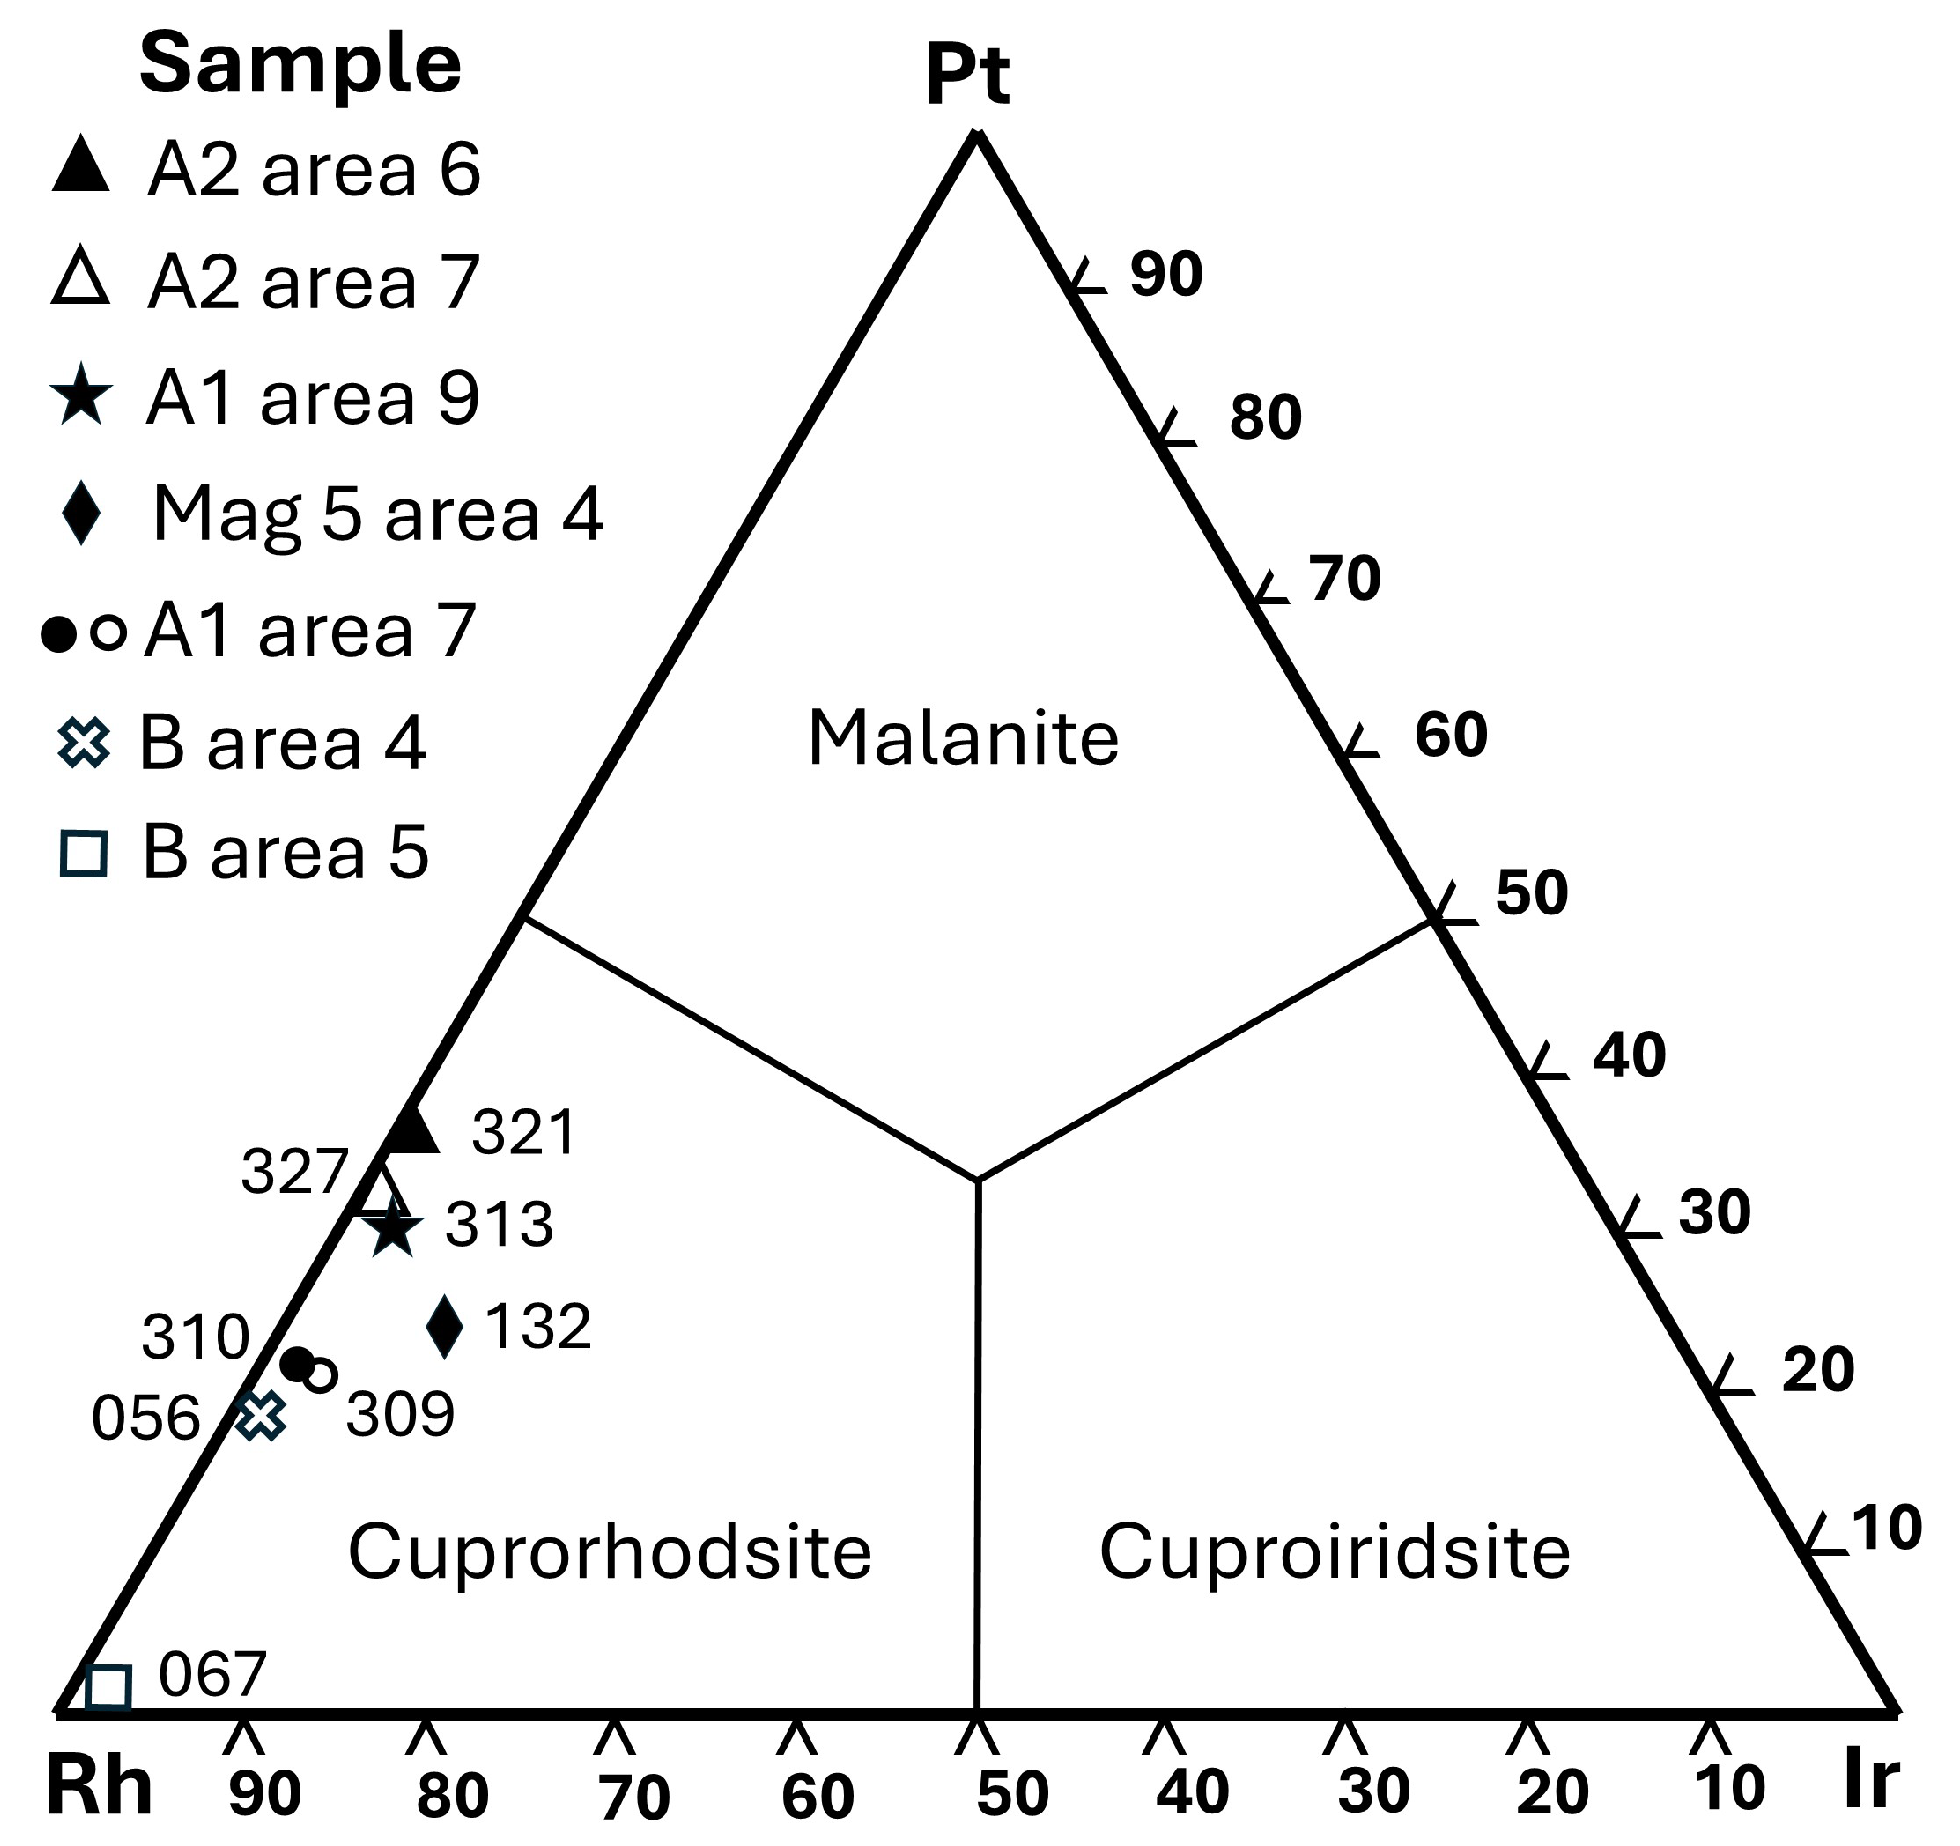
Cuprorhodsite–(malanite) occurs as mid-grey subhedral crystals (Figure 3e) set in bornite. Analysis 4(321), Table 2, gives the following formula Cu0.95(Rh1.08Pt0.63Fe0.19Ir0.02Co0.02Ni0.01Ru0.01)1.95(S3.99Se0.01)4.00 with Rh 15.64 at. % and Pt(+Ir) 9.39. Bornite and chalcopyrite are confirmed as anhedral interstitial minerals. Semiquantitative [20] analyses 318 and 323 (Figure 3d,f) are bornite. Analysis 322 (Figure 3e) is chalcopyrite. Respective formulae are Cu4.69Fe0.90S3.99Se0.01 for bornite and Cu1.00Fe0.90S2.00 for chalcopyrite.
A monosulfide mineral occurs as irregular and skeletal shaped exsolutions set in host bornite [Figure 3(c, e)]. WDS analysis (320) (Table 2) of the latter [a small (< 3 µm) grain] gives a slightly low total, thus is semiquantitative cf. Nesterenko et al. [20]. However, a distinctive formula indicates the Cu-rich, Ni-poor PGE monosulfide mineral (Cu0.55Fe0.11)∑0.66(Rh0.19Pt0.13Ir0.01)∑0.33S1.00 with dominant Cu(+Fe), subordinate PGE and minor detectable Co, Ru and Ni (cf. Tolstykh & Krivenko [21]).

3.1.3. Sample Mag 5 Area 4

a) Host alloy and basaltic andesite silicate glass (SiO2 52.30 wt. %).
The host nugget for this sample is oval shaped (~0.22 mm long dimension) and hosts a composite rounded inclusion (~0.09 mm diameter) located near one margin (Figure 4a).
Analysis 129 (Tables 1A and 1B of Barron et al. [1] and Table 4, below) indicates isoferroplatinum (Pt2.89Ir0.06Pd0.02Os0.01)2.98(Fe0.88Cu0.06Rh0.08)1.02 with minor Rh, Cu, Pd, Os and S. The inclusion comprises a remarkable PGM paragenesis coexisting with a small rounded to partly irregular ‘pool’ of exsolved silicate glass partly infilled with late Pt-Fe alloy and subhedral chalcopyrite (Figure 4a,b).
The small ‘pool’ of host silicate glass shows a minutely scalloped boundary with the variably thick rim of exsolved PGM. The boundary of the latter against the host nugget is partly rounded and partly finely scalloped. A small void along part of the curved margin of the inclusion suggests minor compressional deformation (possibly in the alluvial pile) accompanied by distinct parallel brittle fractures in the PGM paragenesis.
Analysis of the silicate glass inclusion indicates tholeiitic basaltic andesite with SiO2 52.30, FeO 12.96 and H2O ~0.45 wt. % (average of analyses Sp24 and Sp25, Barron et al. [1] Table 2C). Silicate glass accounts for ~ 5.7% of the total composite inclusion.
b) PGM sulfide paragenesis.
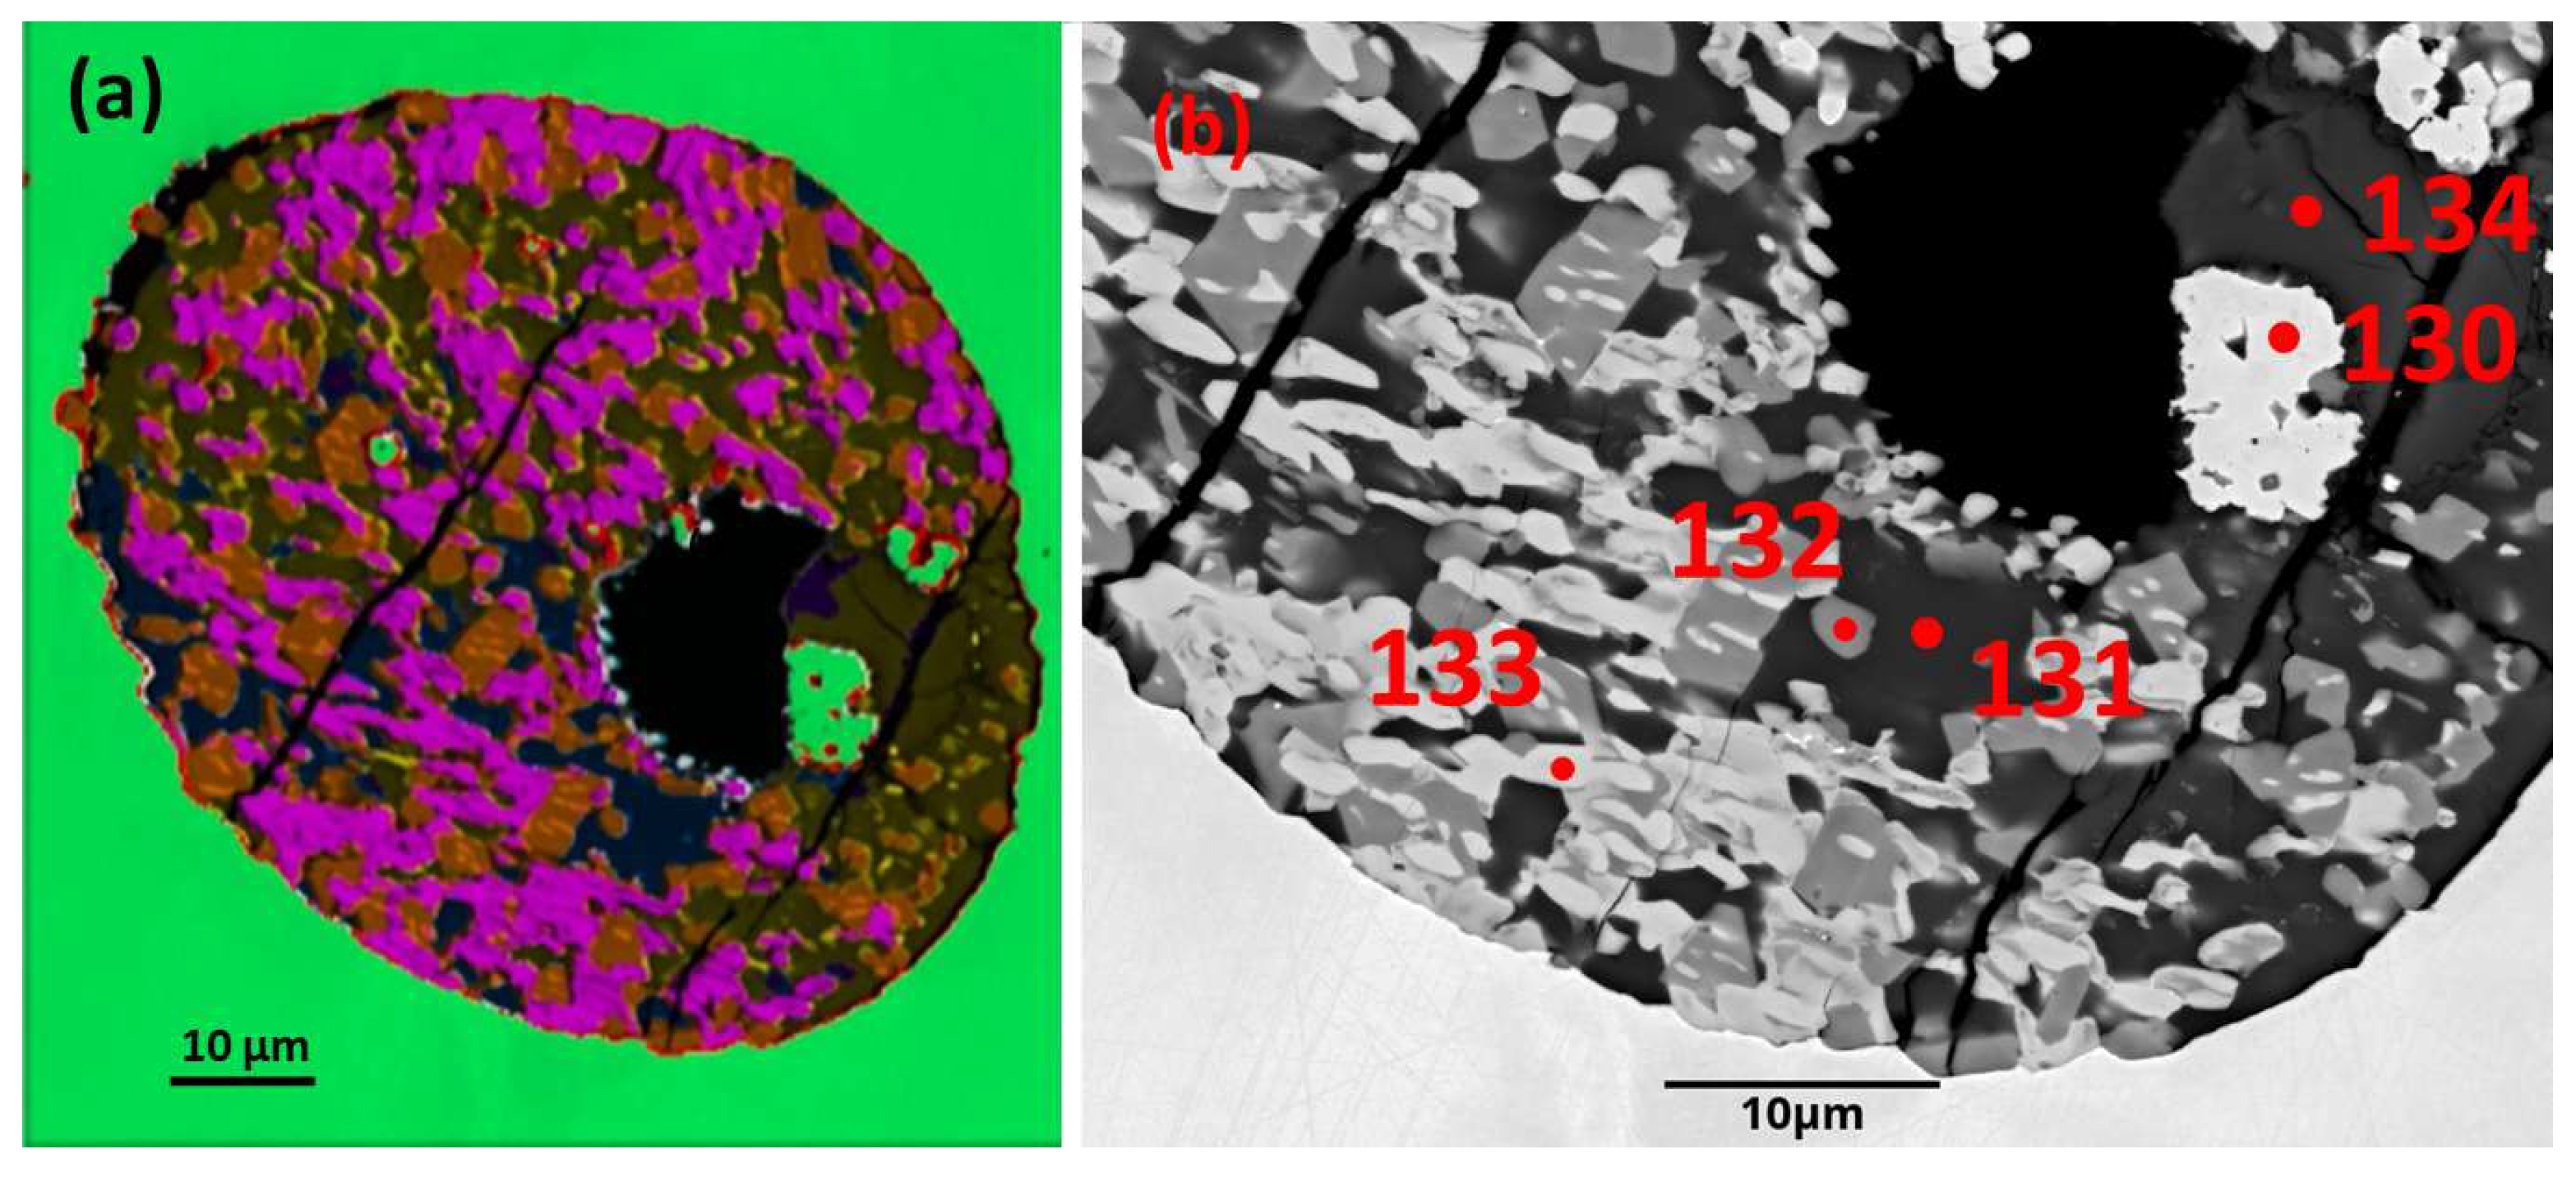
Phase mapping, based on EDS analysis of this inclusion (Figure 5a), gives an approximate fraction % based on relative pixel counts for each phase. There are five significant minerals detected, and their approximate fraction % (minus 5.7% silicate glass) is as follows: Green is Pt-Fe alloy 3.18; PtSRhFe (composite cuprorhodsite + alloy = monosulfide) 24.92; PtSPd (braggite) 30.22; SCuFePt (chalcopyrite) 33.40; and FeS (pyrrhotite) 8.27. A minor mineral (analysis FeSCu) also is detected.
An approximate calculated bulk chemistry (Fe>Cu>Pt>>>Pd>Rh>>Ir>Ni>Co>Os at. %) based on EDS element mapping of the PGM paragenesis is given in Table 3.
A composite monosulfide mineral PtSRhFe identified by phase mapping (Table 4) is tan with orange exsolutions (Figure 5a). It comprises small (from ~2µm up to ~8 µm long and ~3-4 µm across) subprismatic to equant crystals that are evenly disseminated throughout. This mineral accounts for ~23.5% of the inclusion area in the plane of the present section (see above). In some domains the crystals are sub-parallel but elsewhere are unoriented. Thin exsolved lenses are subparallel and crystallographically controlled in many larger crystals but some smaller crystals (minus alloy lenses) are homogeneous in the present section (Figure 5a,b).
Table 4. Analyses, sample Mag 5 area 4. Composite monosulfide mineral and cuprorhodsite lacking alloy exsolutions. Calculation of exsolved tetraferroplatinum exsolutions. 
3PtSRhFeΔ S Se Fe Co Ni Cu Ru Rh Pd Os Ir Pt Total
wt. % Ms 26.85 10.90 0.24 0.15 8.27 12.60 2.86 0.84 3.13 34.18 100.00
at. % ~Ms 55.30 12.89 0.26 0.17 8.59 8.09 1.77 0.29 1.07 11.57 100.00
apfu ~Ms 1.00 0.23 0.01 0.16 0.15 0.04 0.01 0.02 0.21 0.83
3(132)^ S Se Fe Co Cu Ru Rh Pd Os Ir Pt Total
wt. % Crh 29.19 0.03 5.58 0.29 11.39 0.24 26.48 1.84 6.73 17.78 99.55
at. % Crh 57.25 0.02 6.28 0.31 11.27 0.15 16.18 0.61 2.20 5.73 100.00
apfu Crh 4.02 0.44 0.02 0.79 0.01 1.14 0.04 0.15 0.40 Me 2.99
Alloy* 6.61 1.77 5.84 14.22
~ Tfpt at. % 46.48 12.44 41.07 100.00
ΔPhase map EDS 3PtSRhFe (minus minor O, includes alloy lenses). ^WDS 3(132). Ms=monosulfide. Crh=cuprorhodsite–(malanite). Tfpt=tetraferroplatinum. *Calculated exsolved alloy (Fe, Pd, Pt), PtSRhFe minus Fe, Pd, Pt of Crh 3(132).
The lenses in the PtSRhFe host mineral, EDS phase map analysis (Figure 5a) are too fine grained for accurate EMPA. However, as a composite PGM, both lenses and their host mineral are analysed together (analysis 3PtSRhFe, Table 4, normalised minus minor O). This composite mineral analysis, including the host mineral and narrow lenses, gives a Me (metal) deficient formula indicating the monosulfide mineral (Fe0.23Pt0.21Cu0.16Rh0.15Pd0.04Ir0.02Os0.01Co0.01)0.83S1.00. However, the WDS analysis 3(132) (Table 4 and Table 5; Figure 5b) of the host mineral lacking exsolutions is Fe, Pt, Pd poor cuprorhodsite(malanite) with formula (Cu0.79Fe2+0.19Co0.02)1.00(Rh1.14Pt0.40Fe3+0.25Ir0.15Os0.04)1.98S4.02. This suggests that a composite monosulfide precursor mineral has exsolved Fe-Pt-(Pd) alloy lenses in Fe, Pt, Pd poor cuprorhodsite. 
An approximate calculated composition for the exsolved alloy lenses is ~ Fe 46.48, Pt 41.07, and Pd 12.44 at. % (Table 4) indicating Pd-bearing tetraferroplatinum with a composition near PtFe cf. Cabri et al.; Jung et al. [22,23].
Pt-Fe alloy, green (Figure 5a), accounts for only ~3.0% of the inclusion area and occurs as anhedral patches with variable grain size (up to ~5 µm across). Analysis 1(130) Table 5 and Figure 5(b) shows that this alloy also is isoferroplatinum, distinct from host isoferroplatinum, with unusually high concentration of minor elements (8.35 at. %); Cu (2.91 at. %), Pd (2.65 at. %), Au (1.82 at. %), Rh, Ag and Os (in order of abundance).
Braggite, pink in Figure 5a, accounts for ~ 28.5% of the inclusion area and forms elongate (possibly deformed) anhedral patches enclosing subhedral prisms of the composite monosulfide mineral with alloy exsolutions (above). Analysis 4(133) (Figure 5b, Table 5) shows that this mineral, with Pt 69.80 wt.% and Pd 4.50 wt. %, contains significant (6.62 at. %) minor elements (Cu, Rh, Ni, Ir, Os, Co, Ir).
Chalcopyrite, yellow in Figure 5a, accounts for ~31.5% of the inclusion area. It is a prominent anhedral, interstitial mineral in three quadrants of the thick rim of PGM sulfides and forms an unevenly distributed mineral throughout the fourth quadrant where it is intergrown with pyrrhotite (below). A semiquantative analysis 5(134) (Figure 5b) confirms chalcopyrite Cu0.50Fe0.50S1.02 with minor detectable <0.02 at. % elements Se, Pt, Zn and Ca.
Pyrrhotite, blue in Figure 5a, accounts for ~7.8% of the inclusion area. It is also anhedral and interstitial, intergrown with minor patchy chalcopyrite. Analysis 2(131) (Table 5) shows that seven minor elements are detected Pt 0.71 wt. % and < 0.22 wt. % each of Cu, Rh, Ni, Ca, Pd and Co (in decreasing order of abundance).
Isocubanite, identified by phase mapping (Figure 5a) accounts for only ~1.1% of the inclusion area. It occurs as irregular, narrow interstitial patches up to ~5.8 µm long but < 3 µm across, so the crystals are too narrow for accurate EPMA. An EDS analysis (8FeSCu Table 5) indicates isocubanite (Fe0.66Cu0.32Ni0.02)1.00S0.98 first defined by Caye et al. [24].

3.1.4. Sample A1 Area 9

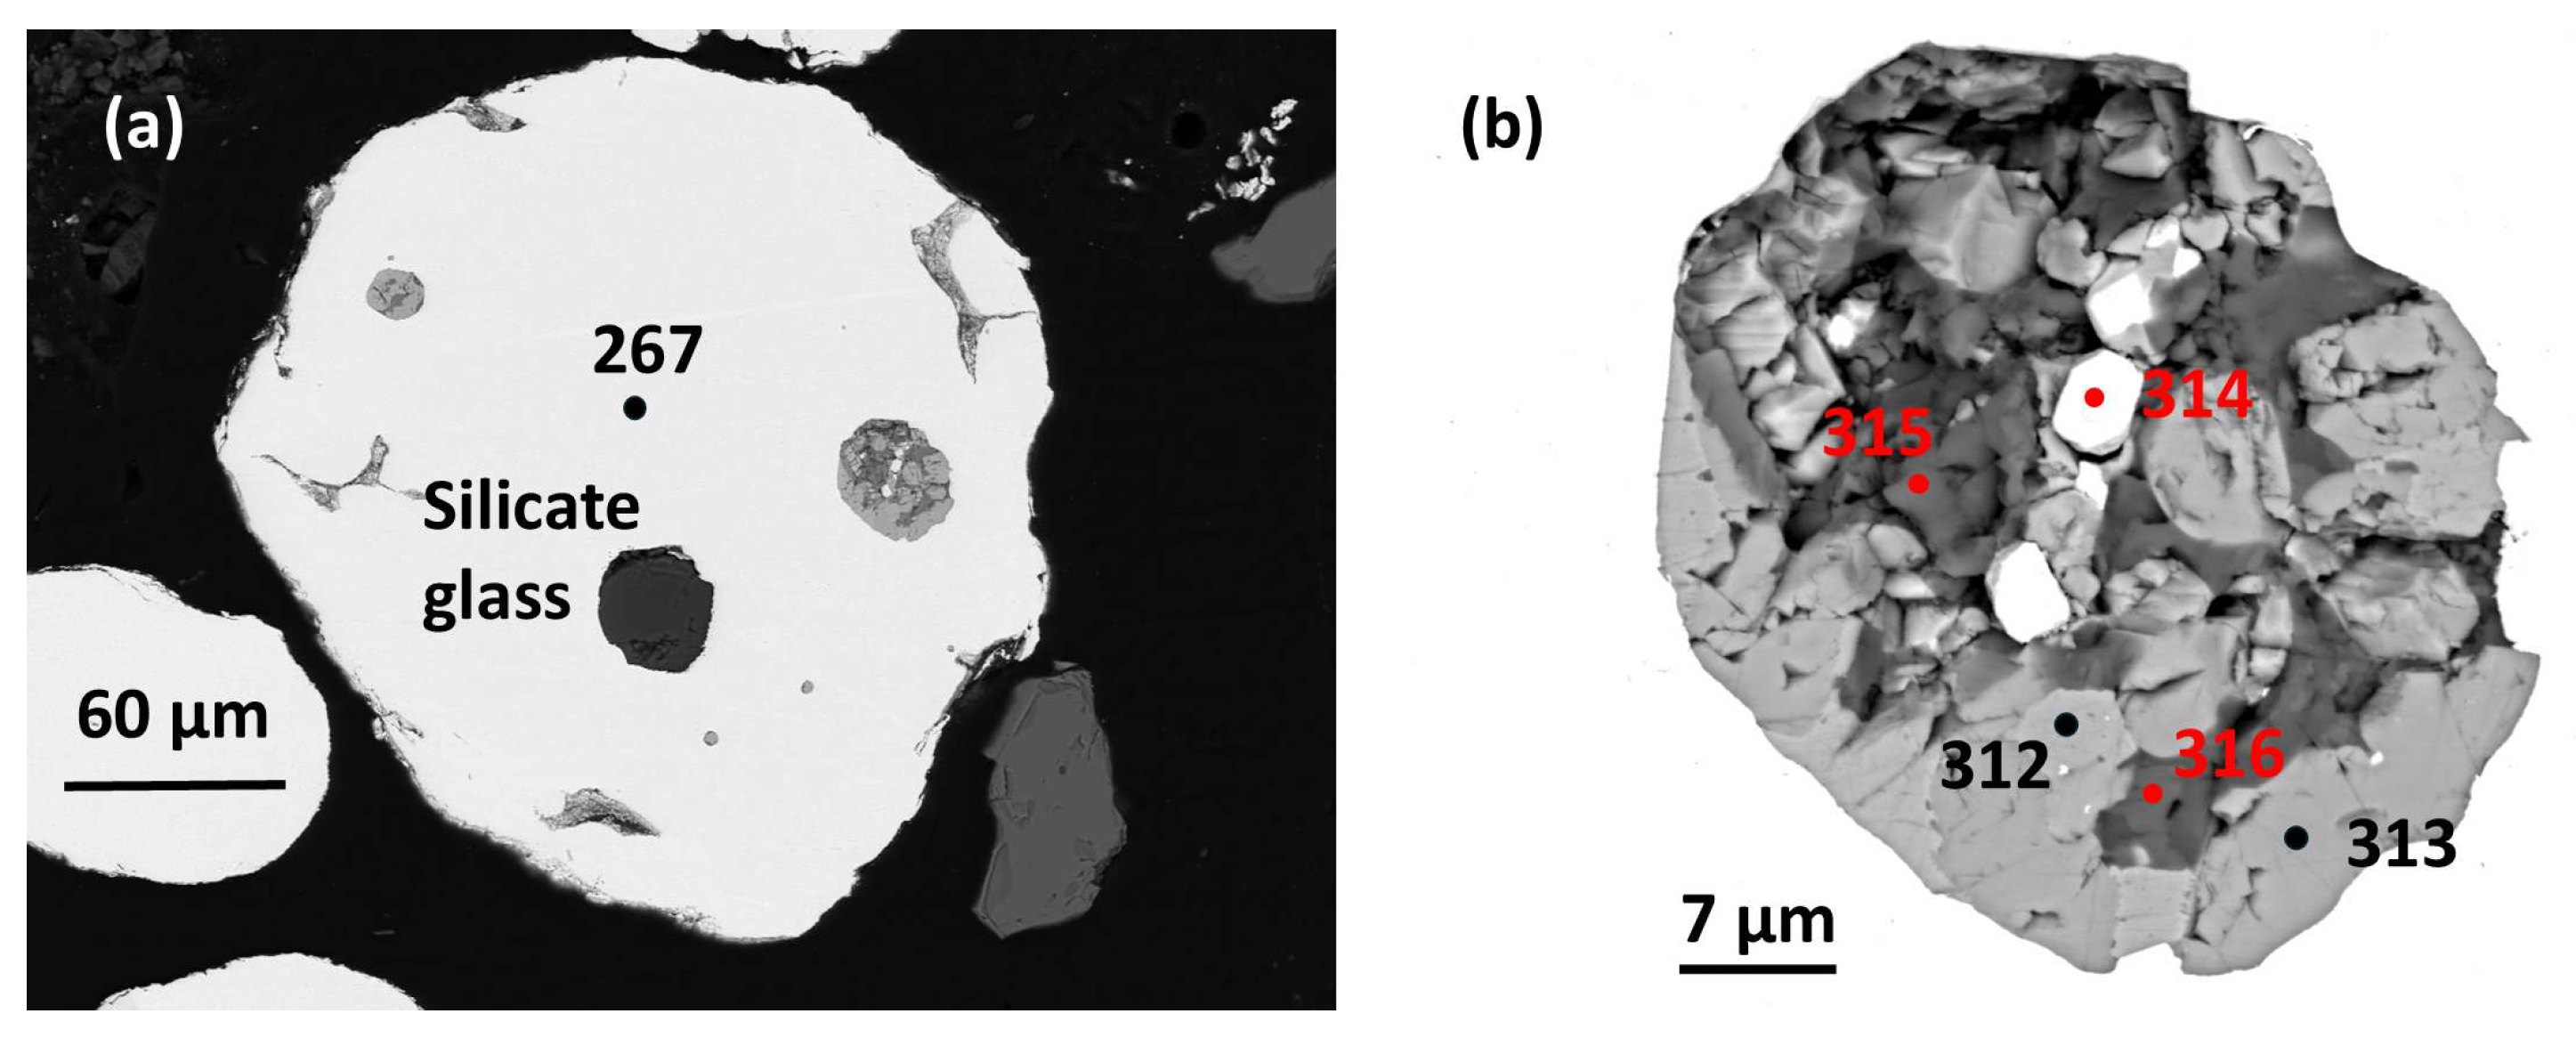
a) Host alloy and basaltic andesite silicate glass (SiO2 52.75 wt. %).
The host nugget for this sample is ~0.29 mm across. It is rounded and but is partly chipped and broken (Figure 6a). Analysis (267) (Barron et al. [1] Tables 1A and 1B and Table 6, below) indicates isoferroplatinum (Pt2.89Ir0.04Pd0.02Rh0.02Os0.01Ru0.01)2.99(Fe0.88Cu0.06Rh0.06)1.00 with minor Rh, Cu, Ir, Pd, Os and Ru.
Three inclusions are present (Figure 6a). The first inclusion is slightly fractured, homogeneous silicate glass (~42.9 µm across) lacking coexisting exsolved PGMs. Two separate inclusions (~75-90 µm across and ~20 µm across respectively) have subrounded shapes with somewhat irregular margins and comprise melt inclusions with similar Cu-PGM sulfide parageneses. Three separate Cu-PGM sulfide ‘droplet’ shaped inclusions are minute (< 4 µm across).
Analysis 154 of the largest of two silicate glass inclusions indicates alkali-enriched basaltic andesite with SiO2 52.75, FeO 10.54 and H2O ~1.71 (wt. %) Barron et al. [1] Table 2E.
b) Cu-PGM sulfide paragenesis.
The texture of the largest PGM-bearing sulfide inclusion shows that subhedral crystals (up to ~ 10 µm) are set in anhedral interstitial minerals (Figure 6b).
Pt-Fe alloy forms irregularly disseminated, sparse, small (up to ~6 µm) subhedral crystals, but this mineral is absent in the smaller inclusion in the plane of the present section. Analysis 4(314) (Table 6) indicates isoferroplatinum (Pt2.75Pd0.08Rh0.05Os0.01Cu0.12Ni0.01)3.02Fe0.99, with significantly high minor Pd, Cu, Fe and Ni and low concentrations of Rh and detectable S. This is distinct from the host alloy, analysis 1(267).
Cupororhodsite–(malanite) also forms subhedral crystals (some reaching >7 µm grain size) and accounts for ~40% of the inclusion area (Figure 6b). Analysis 3(313) (Table 6) gives the following formula (Cu0.69Fe0.25Ni0.06)1.00(Rh1.18Pt0.54Ir0.06Os0.01Ru0.01)1.80S4.00. This analysis is distinctly Me-deficient and contains an unusually high number (9) of detectable metal elements.
Vasilite (~20% of the inclusion area) forms anhedral to subhedral crystals (up to ~6 µm) interstitial to cupororhodsite–(malanite) above (Figure 6b). Analysis 2(312) (Table 6) gives a slightly Me-deficient formula (Pd11.77Cu3.03Fe0.11Ni0.03Pt0.02Rh0.02)14.99(S6.97Se0.02Te0.01)6.99.
Chalcopyrite is anhedral forming irregular interstitial patches (up to ~7 µm across). It accounts for ~ 20% of the relevant section area (Figure 6b). Analysis 5(315) (Table 6) indicates 0.45 at. % PGE (Rh, Pt, Pd and Ir) and the calculated formula (Cu0.89Fe0.88Zn 0.02Pt0.01Rh0.01)1.81S2.00 suggests it is Me-deficient.
Pentlandite forms sparse anhedral patches intergrown with interstitial chalcopyrite (Figure 6b). Analysis 6(316) indicates the formula (Fe4.37Ni2.64Pd0.61Cu0.48Rh0.23Co0.06Zn0.02Pt0.01)8.42S8.00 [(Me)9-xS8, x=0.58]. It incorporates significant minor elements particularly Pd, Cu, and Rh.

3.1.5. Sample B Area 5

a) Host alloy and andesite silicate glass (SiO2 59.89 wt. %).
The rounded host nugget for this sample reaches ~0.4 mm across. It is isoferroplatinum (Pt2.88Pd0.01Rh0.08Os0.01Ir0.02)3.00(Fe0.95Cu0.05S0.01)1.01 with minor Rh, Cu, Pd, Ir, Os, Ni analysis 061, (Barron et al. [1] Tables 1A and 1B and 
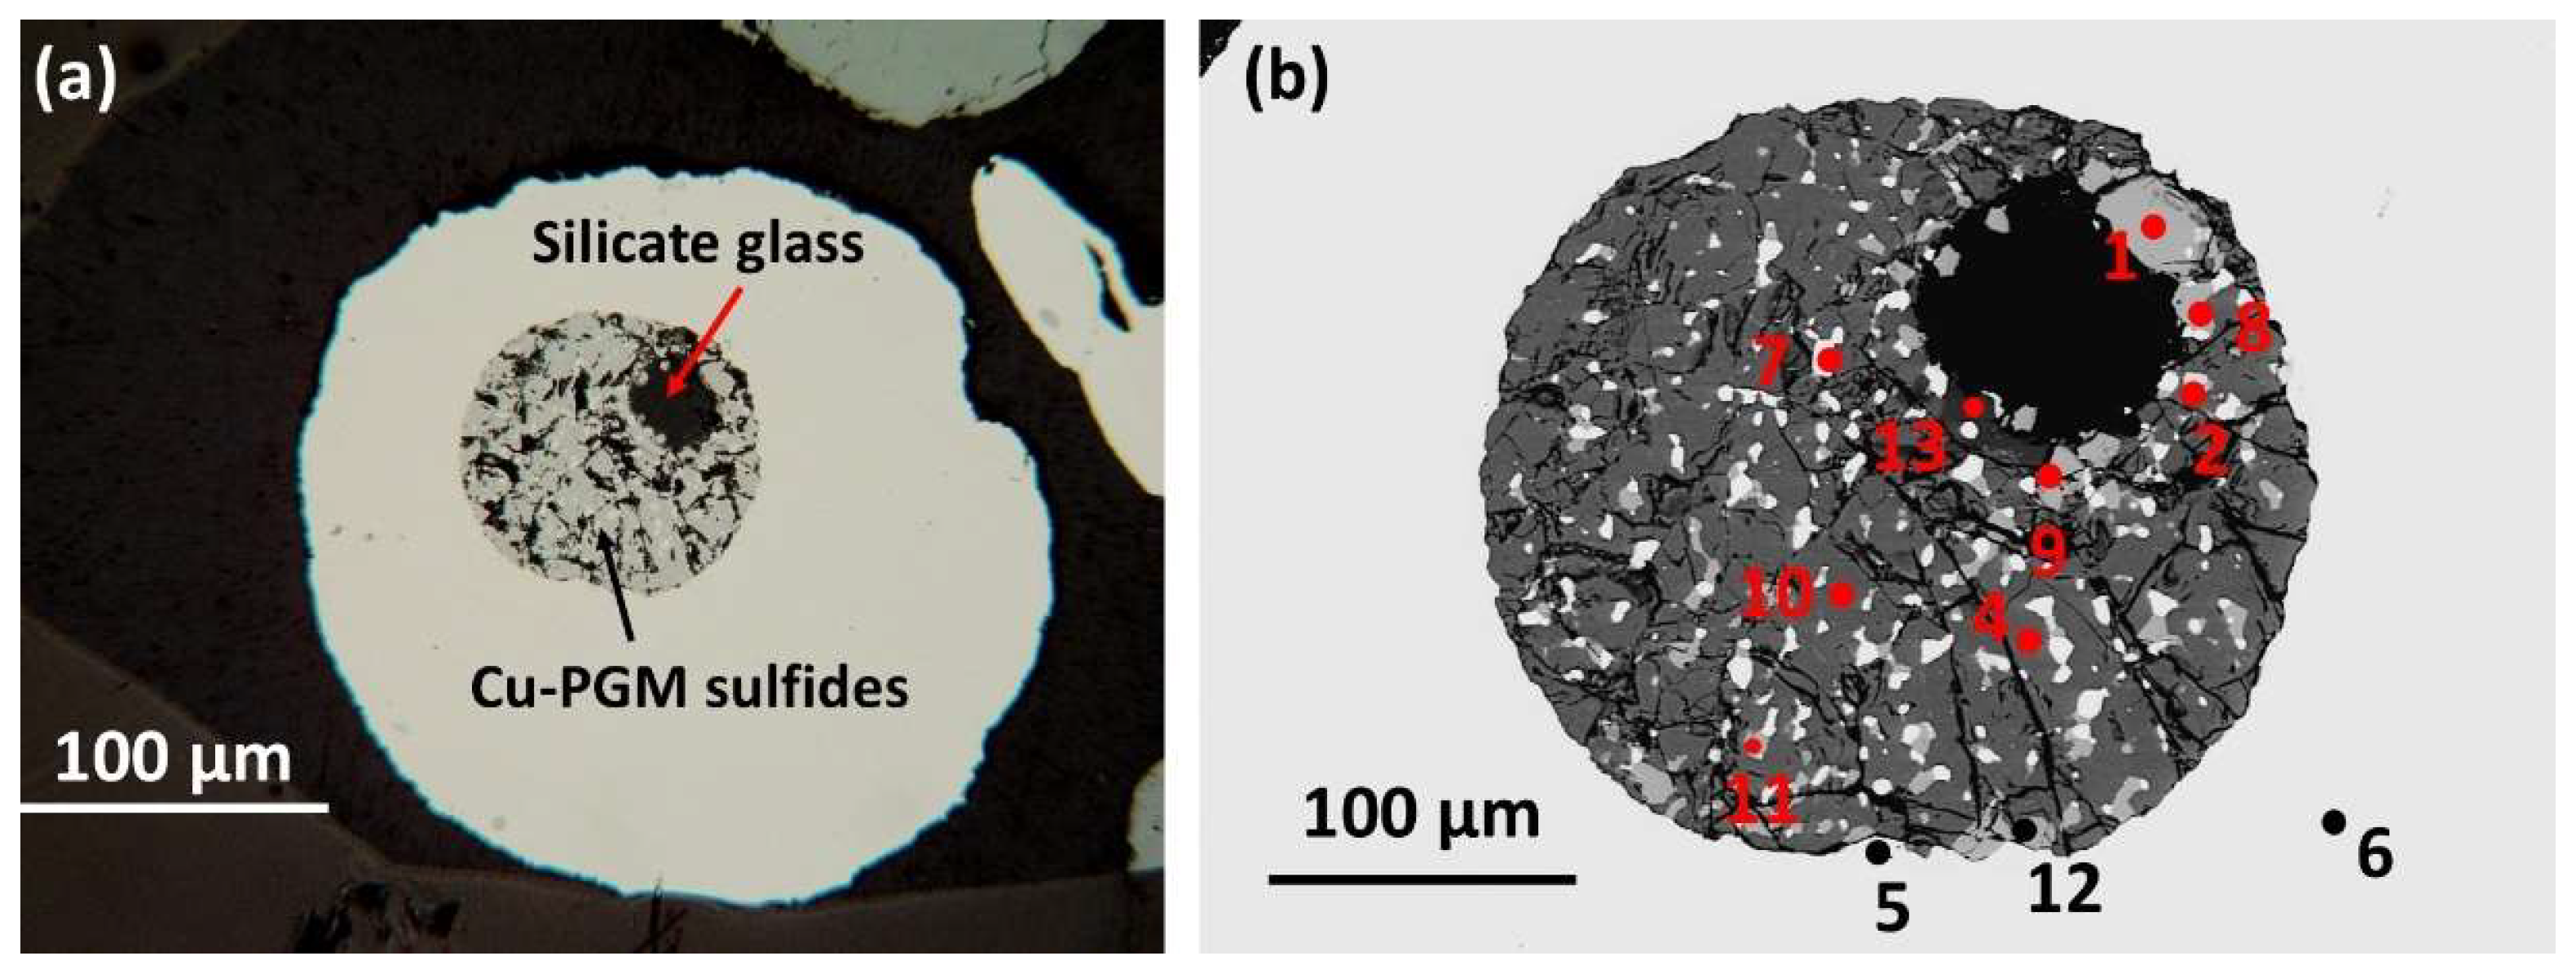
Table 8 below). A prominent round composite inclusion ~175 µm (~0.18 mm) across is not centrally located in the host nugget. It comprises a dominant rim of PGM enclosing a small rounded ‘pool’ (~ 50 µm across) of quenched silicate glass located near one margin of the PGM paragenesis (Figure 7a,b).
Analysis of the silicate glass in this composite inclusion indicates andesite with SiO2 59.89, FeO 3.25 and H2O ~1.06 (wt. %) (average of analyses Sp38, Sp39 and Sp40 (Barron et al. [1] Table 2D).
b) PGM sulfide paragenesis.
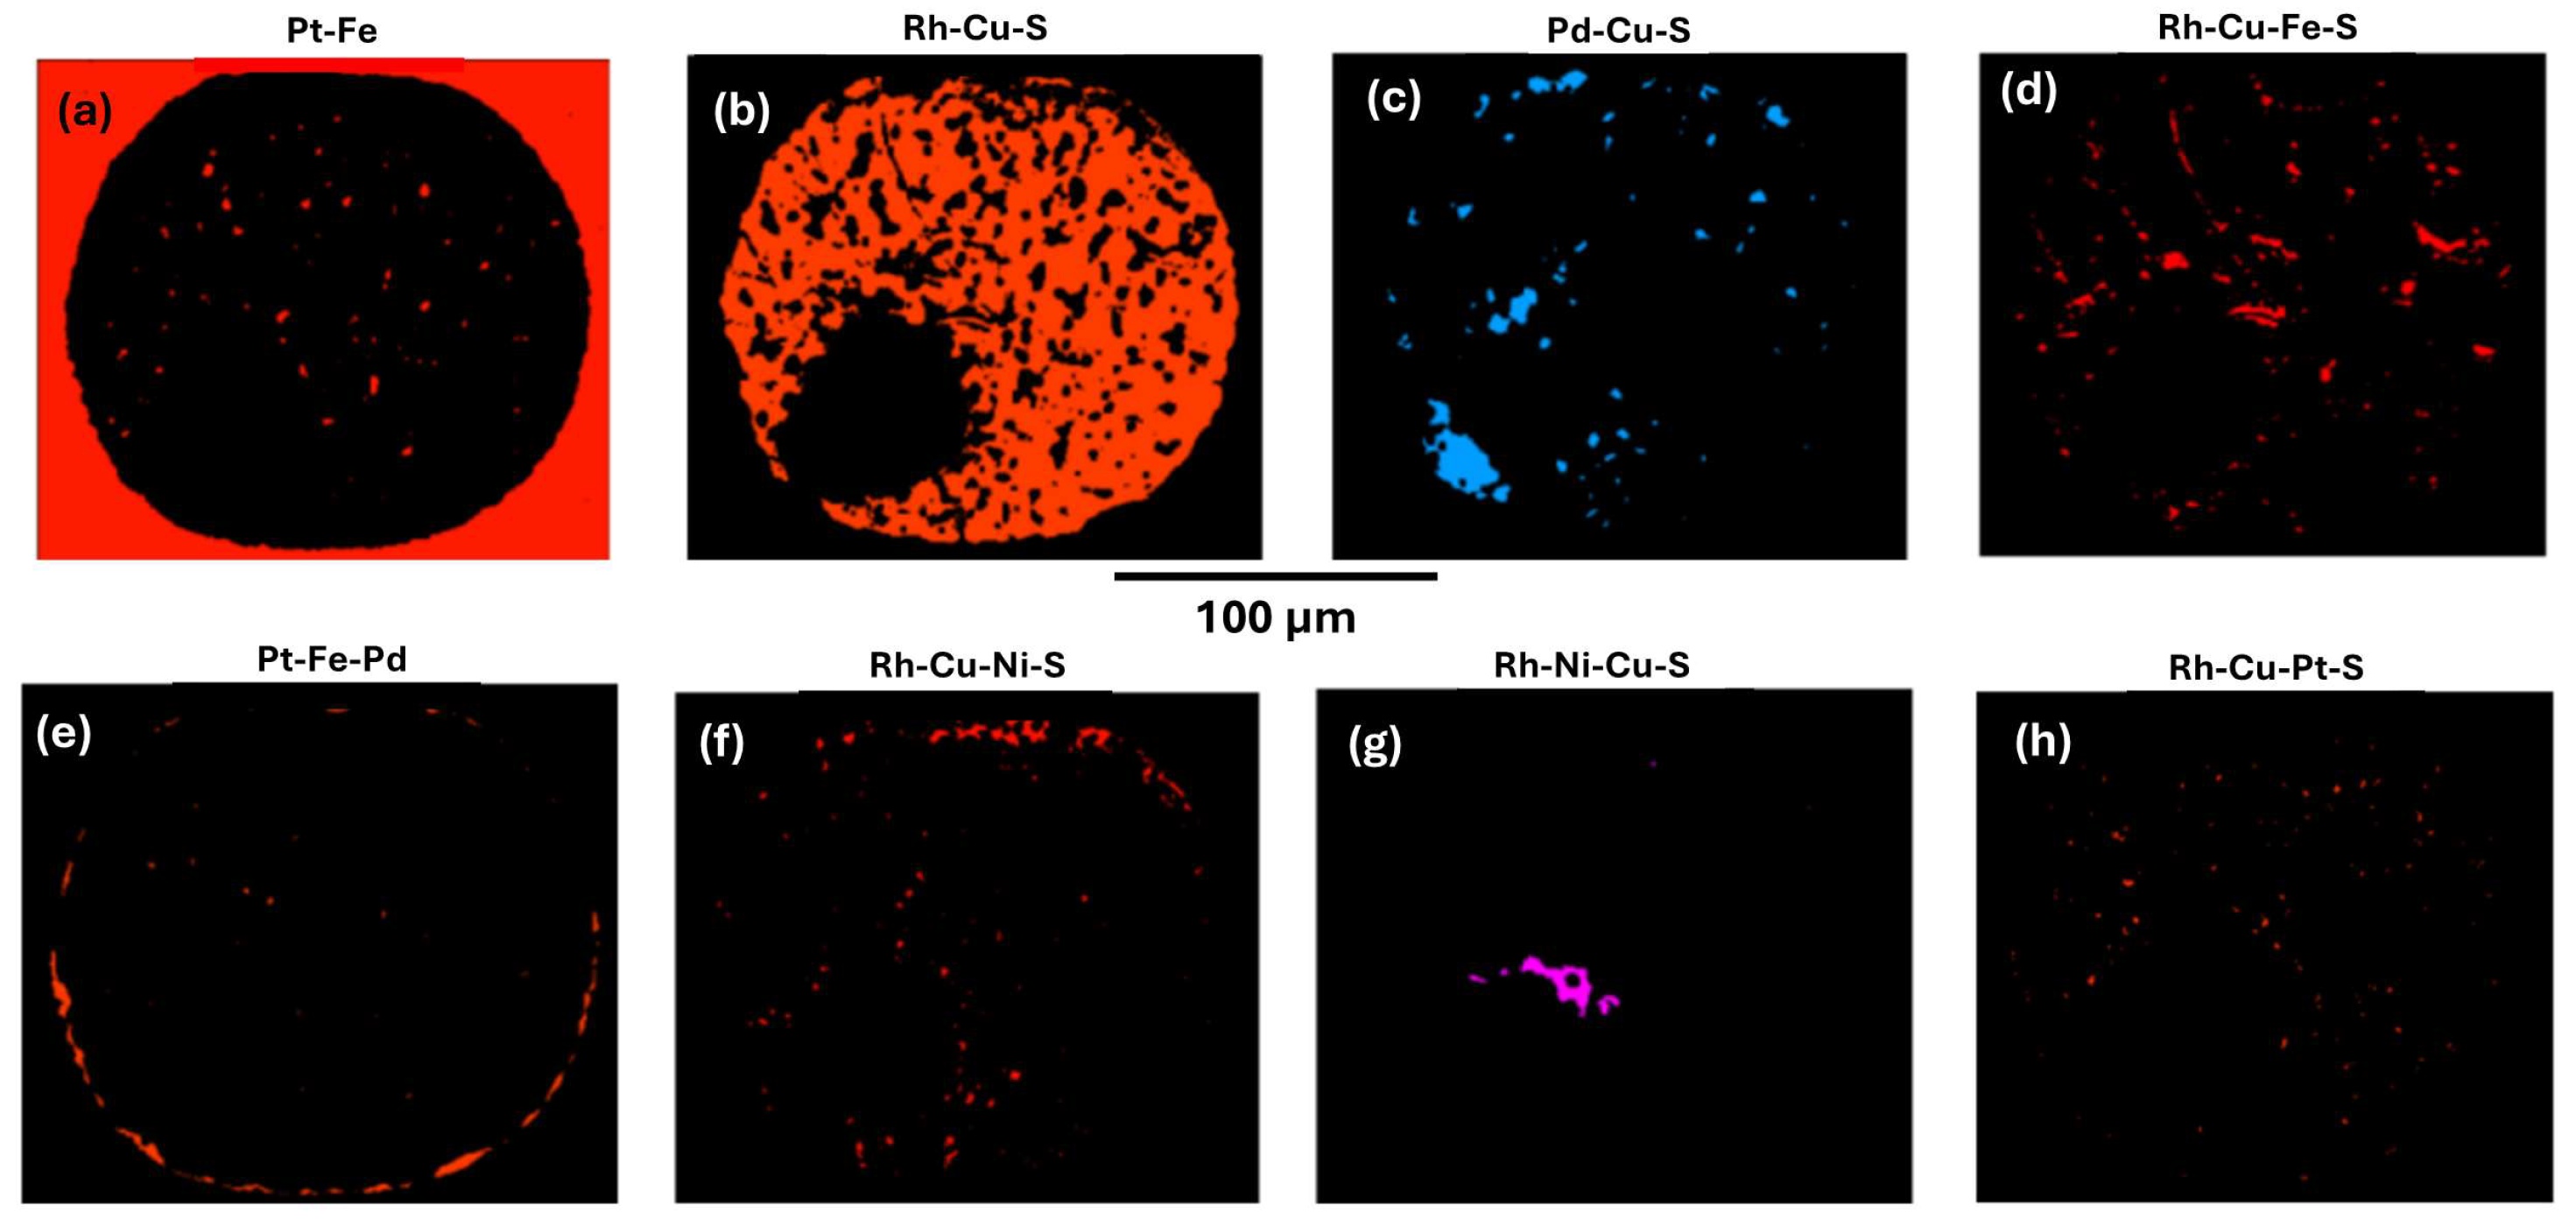
Phase mapping of the inclusion using EDS analyses and relative pixel counts for each phase indicates silicate glass is 6.72 fraction %. Eight minerals are identified in the PGM paragenesis (Figure 8) and the normalised fraction % for each is as follows (fraction % is minus unassigned pixels); Pt-Fe alloy 4.98; Rh-Cu-S cuprorhodsite 80.25; Pd-Cu-S vasilite 4.98; Rh-Cu-Fe-S thiospinel 3.98; Pt-Fe-Pd alloy 2.59; Rh-Cu-Ni-S thiospinel 2.00; Rh-Ni-Cu-S thiospinel 1.00; Pd-Te keithconnite 0.20; and hematite 0.20.
An approximate calculated bulk chemistry based on EDS element mapping of the PGM paragenesis is given in Table 7. Order of major elements present is as follows Rh>>Cu>Fe>>Pd>Ni.
Table 7. Sample B area 5 Calculated bulk chemistry droplet wt. % (minus silicates). 
S Fe Co Ni Cu Se Rh Pd Te Pt Total
wt. %
29.22 8.55 0.02 1.09 11.70 0.17 43.10 3.83 0.04 2.29 100.00
at. %
52.48 8.82 0.02 1.07 10.60 0.12 24.12 2.07 0.02 0.68 100.00
Me 47.52: S(+Se+Te) 52.62 = 0.90 at. % ~ S-saturated
Table 8. WDS analyses. Sample B Area 5. 
wt. % S Fe Ni Cu Se Rh Pd Te Os Ir Pt Total
6(061)Ifp Host 0.04 8.31 0.03 0.50 1.22 0.17 0.18 0.64 88.29 99.40
1(063) PdCu Vs 13.53 0.12 0.04 13.60 0.09 0.06 72.56 0.52 100.53
2(064)* PdTe Kei 0.12 0.21 0.04 0.43 0.09 70.97 29.31 0.11 102.26
4-2(067) Crh 33.07 5.96 0.26 8.54 0.19 51.12 1.17 1.68 102.01
5-2(069) Ifp Rim 0.04 9.75 0.27 1.36 0.65 11.24 0.13 75.94 99.54
7(070) PtFe Incl. 0.08 9.17 0.10 1.27 2.87 2.57 0.14 84.68 100.88
9(071) PdCu Vs 13.66 0.22 0.35 13.53 0.21 73.33 0.10 0.45 101.84
13^ Ms 27.05 12.40 11.00 5.74 20.60 0.12 7.89 12.79 101.07
Co 0.02; *Sn 0.11, Sb 0.06, Pb, 0.45, Bi 0.87, Ag 0.10. Co 0.02, Au 0.16. ^As 0.1,Ru 0.07.
at. % S Fe Ni Cu Se Rh Pd Te Os Ir Pt Total
6(061) Ifp host 0.18 23.65 0.07 1.24 1.89 0.26 0.15 0.53 71.96 100.00
1(063) PdCu Vs 31.83 0.17 0.06 16.15 0.09 0.04 51.46 0.20 100.00
2(064)** Kei 0.42 0.40 0.08 0.73 0.10 72.35 24.91 0.06 100.00
4-2(067) Crh 57.55 5.94 0.26 7.51 0.14 27.67 0.33 0.59 100.00
5-2(069)††Ifp Rim 0.19 24.78 0.66 3.03 0.90 14.99 0.10 55.23 100.00
7(070) Ifp Incl 0.39 24.31 0.24 2.97 4.13 3.57 0.11 64.28 100.00
9(071) PdCu Vs 31.71 0.29 0.44 15.84 0.20 51.29 0.06 0.17 100.00
13^ Ms 51.05 13.43 11.34 5.46 12.11 0.04 2.48 3.97 100.00
Co 0.06. **Sn0.10, Sb0.06, Pb 0.23, Bi 0.45, Ag 0.11. Co 0.02; †† Au 0.12. ^As 0.08, Ru 0.04.
apfu S Fe Ni Cu Se Rh Pd Te Os Ir Pt ∑Me
6(061) Ifp host 0.01 0.95 0.05 0.08 0.01 0.01 0.02 2.88 4.01
1(063) PdCu ~Vs 7.47 0.04 0.01 3.79 0.02 0.01 12.09 0.05 15.99
2(064)*** Kei 0.11 0.02 0.20 0.03 19.60 6.75 0.02 19.93
4-2(067) Crh 4.02 0.42 0.02 0.52 0.01 1.94 0.02 0.03 2.98
5-2(069)†††Ifp Rim 1.00 0.03 0.12 0.04 0.60 2.21 4.00
7(070) Ifp Incl 0.98 0.12 0.16 0.16 2.56 3.98
9(071) PdCu ~Vs 7.44 0.07 0.10 3.72 0.05 12.03 0.01 0.04 16.01
13 Ms 1.00 0.26 0.22 0.11 0.23 0.05 0.08 0.95
***Pb 0.06, Sn 0.03, Sb 0.02, Bi 0.12, Ag 0.03; †††Au 0.01. Ifp=isoferroplatinum; Crh=cuprorhodsite; Kei=keithconnite; Vs=vasilite; Ms=monosulfide mineral. Italics, semi-quantative analysis, small grain size cf. Nesterenko [20].
Cuprorhodsite (Figure 7 and Rh-Cu-S in Figure 8b) is the dominant mineral (80.25 fraction %) in this inclusion. It forms a spongy framework of skeletal to subhedral and elongate prisms showing partial radial structure away from the silicate ‘pool’. Some curved narrow cuprorhodsite crystals are intergrown with ~20 fraction % of all other finer grained patchy minerals. Analysis 4-2(067) Table 8 indicates (Cu0.52Fe0.42Ni0.02)0.96(Rh1.94Ir0.02Pt0.03)1.99(S4.02Se0.01)4.03 and phase-mapped analysis 3(22) Table 9 also indicates cuprorhodsite (Cu0.56Fe0.44)1.02(Rh1.91Ni0.03Fe0.02)1.96(S3.99Se0.01).
Three additional Rh-thiospinel minerals (notably Pt deficient), are identified by chemical differences of element abundances in phase maps (using pixel counts) as follows:
(1) Rh-Cu-Fe-S thiospinel [red in Figure 8d, analysis 14(33) Table 9] fills some sub-parallel and curved grain boundaries and also marks the silicate/PGM boundary. It has an Fe-enriched composition (Cu0.73Fe0.27Ni0.05)1.05(Rh1.76Fe0.29)2.05S3.99. In this analysis after Rh (24.83 at. %), Cu and Fe have the highest concentrations (Cu 10.33 and Fe 7.83 at. %) while Ni (0.76 at. %) is a minor metal element. Thus this minor thiospinel is ferrorhodsite cf. Cabri et. al. [19]. In Figure 8d this mineral is fine grained with a patchy distribution and also defines some sub-parallel curving brittle fractures.
(2) Rh-Cu-Ni-S thiospinel is red in Figure 8f, and analysis 7(26) Table 9 indicates it is cuprorhodsite–(polydymite), (Cu0.60Ni0.17Fe0.13)0.90(Rh1.86Ni0.14)2.00S4.00. This mineral occurs along part of the rounded inclusion boundary with host Pt-Fe alloy. It also forms small blebs and partly defines minor fractures along the silicate glass boundary with the PGM sulfide fraction.
(3) Rh-Ni-Cu-S thiospinel is a well defined small anhedral pink mineral in Figure 8g. It forms an irregular aggregate (~23 µm long) in the PGM paragenesis adjacent to the rounded silicate glass fraction. Analysis 10(29) Table 9 indicates polydymite–(cuprorhodsite) (Cu0.44Fe0.30Ni2+0.26)1.00(Rh1.40Ni3+0.56)1.96S4.00 with significantly higher concentration of Ni than (2) above.
Vasilite [Pd-Cu-S Figure 8c] also occurs as fine grained patches, but has an uneven distribution. Analysis 1 (063) (Table 8) indicates (Pd12.09Cu3.80Pt0.05Fe0.04Ni0.01Rh0.01)16.00(S7.48Se0.02)7.50.
The minor monosulfide mineral (red specks in Rh-Cu-Pt-S Figure 8h) occurs as small grains crystallised along mineral boundaries and fractures. Analysis 11(30) Table 9 indicates (Rh0.42Pt0.18Fe0.16Cu0.13Ni0.02)0.91S1.00. The latter is Me-deficient.
Keithconnite and hematite each account for only 0.2 fraction % of the PGM paragenesis. Keithconnite forms minor, very small anhedral patches similar to vasilite. Analysis 2(064) (Table 8) indicates keithconnite with formula (Pd19.44Cu0.20Fe0.11Pb0.06Rh0.03Ag0.03Os0.02Ni0.02)19.94(Te6.72S0.11Bi0.12Sb0.02)6.97. This has a remarkably high Me:S=2.86. Hematite occurs as wispy grains marking the boundary between the silicate and PGM fractions. Analysis 16(35) Table 9 indicates (Fe1.95Ni0.02Al0.02Si0.03)2.02O3.00S0.03.
Minor Pt-Fe alloy is approximately evenly distributed as fine grained (< ~5 µm across) anhedral patches (white in Figure 7a,b and red Pt-Fe in Figure 8a). Analysis 7(070) Table 8 indicates isoferroplatinum (Pt2.56Pd0.16Rh0.16)2.98(Fe0.96Cu0.12)1.08 with significant Pd 3.57 Rh 4.13 and Cu 2.97 (at. %) with detectable Ni. A second minor Pt-Fe-Pd alloy (also red in Figure 8e) forms a wisy discontinuous boundary with the host nugget. Analysis 6(25) (Table 9) indicates Pd- (and Cu) enriched isoferroplatinum [(Pt2.24Pd0.58Cu0.14)2.96Fe1.04]4.00.

3.1.6. Sample B Area 4

a) Host alloy and porphyritic dacitic/rhyolitic groundmass silicate glass (SiO2 70.67 wt. %).
The host nugget for this sample is round (~0.48 mm diameter) but slightly irregular (Figure 9). Analysis 051 (Tables 1A and 1B of Barron et al. [1] and Table 11 below). indicates isoferroplatinum (Pt2.90Pd0.04Ir0.02Os0.01)3.05(Fe0.88Rh0.08Cu0.05Ni0.01S0.01)1.03 with FeO 22.09 (at. %) and minor Rh, Cu, Pd and Ir. It hosts a remarkable composite inclusion up to ~120 µm across with an unusual irregular, distinctly wavy outline (Figure 9). The inclusion is located almost centrally in the host nugget. The central silicate fraction (~65 µm across) is rounded, except for an inward bulge. This fraction is micro-porphyritic with subhedral amphibole and diopsidic clinopyroxene micro-phenocrysts set in chilled silicate glass of dacite/rhyolite composition [1].
Figure 9. Sample B area 4. (a) Platinum nugget with irregular (deflated) rim of PGM inclusion paragenesis exsolved from central silicate host with mafic phenocrysts and dacite-rhyolite groundmass (black). Reflected light. (b) WDS analysis points (Table 10); 1, 2 vasilite; 3 cuprorhodsite; 5 vysotskite (1); 6 Rh-Pt-Cu-S cuprorhodsite; 7 vysotskite (1); 8 Pd-isoferroplatinum; 9 Pt-Fe alloy (EDS analysis); 10 vysotskite (2); 11 vysotskite (2).
Preprints 182921 g009
Table 10. Sample B area 4 Calculated bulk chemistry PGM (minus silicates). 
S Fe Ni Cu Rh Pd Os Ir Pt Te As Total
wt. %
18.10 7.04 1.90 3.48 12.20 37.50 0.07 0.72 14.42 4.54 0.04 100.00
at. %
41.42 9.25 2.37 4.02 8.70 25.86 0.03 0.27 5.42 2.61 0.04 100.00
Me:S (+ ligands) = 55.92:44.07 = 1.27 at. %. S-undersaturated.
Table 11. WDS analyses sample B area 4. 
wt. % S Se Fe Ni Cu Rh Pd Ag Os Ir Pt Total
(051) Ifp host 0.04 7.72 0.05 0.47 1.32 0.65 0.22 0.62 88.55 99.77
1(052) Vs 13.45 0.14 0.06 0.03 12.70 0.08 74.29 0.17 0.31 101.39
2(055) Vs 13.49 0.06 0.13 0.04 12.67 74.26 0.08 0.51 101.23
3(056)* Crh 31.22 2.38 0.75 10.83 37.47 0.06 0.15 3.08 16.15 102.17
5(058) Vys (1) 21.34 0.10 2.10 0.12 0.23 31.91 44.82 100.61
7(059) Vys (1) 22.54 0.05 3.10 0.15 38.51 0.07 36.78 101.20
8(060) Ifp 0.07 9.14 0.35 0.62 0.43 6.77 0.10 83.25 100.83
10(053)^ Vys (2) 23.96 0.32 0.11 4.17 0.09 0.07 52.77 19.54 101.07
11(054) Vys (2) 23.92 0.27 0.08 4.14 0.08 55.25 17.40 101.13
Pb 0.14; Te 0.06, Bi 0.09; *Co 0.08; Ru 0.10; ^Te 0.05.
at. % S Se Fe Ni Cu Rh Pd Ag Os Ir Pt Total
(051) Ifp host 0.21 22.09 0.15 1.18 2.05 0.98 0.19 0.51 72.56 100.00
1(052) †† ~Vs 31.65 0.14 0.08 0.04 15.07 0.06 52.66 0.12 0.12 100.00
2(055) ~Vs 31.75 0.06 0.17 0.05 15.04 52.67 0.05 0.20 100.00
3(056)** Crh 58.47 2.56 0.77 10.23 21.87 0.04 0.05 0.96 4.97 100.00
5(058) Vys (1) 53.81 0.14 2.89 0.15 0.18 24.15 18.58 100.00
7(059) Vys (1) 53.69 0.07 4.04 0.11 27.65 0.05 14.40 100.00
8(060) Ifp 0.32 24.15 0.88 1.45 0.62 9.38 0.08 62.98 100.00
10(053) ^^Vys (2) 52.52 0.28 0.14 4.99 0.10 0.05 34.86 7.04 100.00
11(054) Vys (2) 52.15 0.24 0.10 4.93 0.05 36.30 6.23 100.00
Pb 0.11; ††Te 0.04, Bi 0.03; **Co 0.08; Ru 0.14; ^^Te 0.03.
apfu S Se Fe Ni Cu Rh Pd Ag Os Ir Pt Me
(051) Ifp host 0.01 0.88 0.01 0.05 0.08 0.04 0.01 0.02 2.90 4.00
1(052)††† Vs 6.97 0.03 0.02 0.01 3.32 0.01 11.60 0.03 0.03 15.03
2(055) Vs 6.99 0.01 0.04 0.01 3.31 11.60 0.01 0.05 15.02
3(056)*** Crh 4.00 0.18 0.05 0.70 1.50 0.07 0.34 2.85
5(058) Vys (1) 1.00 0.06 0.40 0.31 0.77
7(059) Vys (1) 1.00 0.08 0.52 0.27 0.87
8(060) Ifp 0.97 0.04 0.06 0.03 0.38 2.52 4.02
10(053) Vys (2) 0.99 0.01 0.09 0.66 0.13 0.90
11(054) Vys (2) 1.00 0.09 0.67 0.12 0.88
†††Te 0.01; ***Co 0.01; Ru 0.01. Crh=cuprorhodsite; Ifp= isoferroplatinum; Vs=vasilite Vys=vysotskite.
Analysis of the groundmass silicate glass indicates dacite-rhyolite with SiO2 70.67, very low FeO 0.24, and H2O ~2.17 (wt. %), average of analyses (004) and (005), Table 3 of Barron et al. [1].
b) PGM sulfide paragenesis.
The PGM paragenesis forms a ‘rim’ of variable thickness (about ~5 µm up to ~50 µm) around the almost centrally located silicate ‘pool’, Figure 9(a, b). This assemblage comprises an irregularly intergrown aggregate of anhedral grains > 60 µm across.
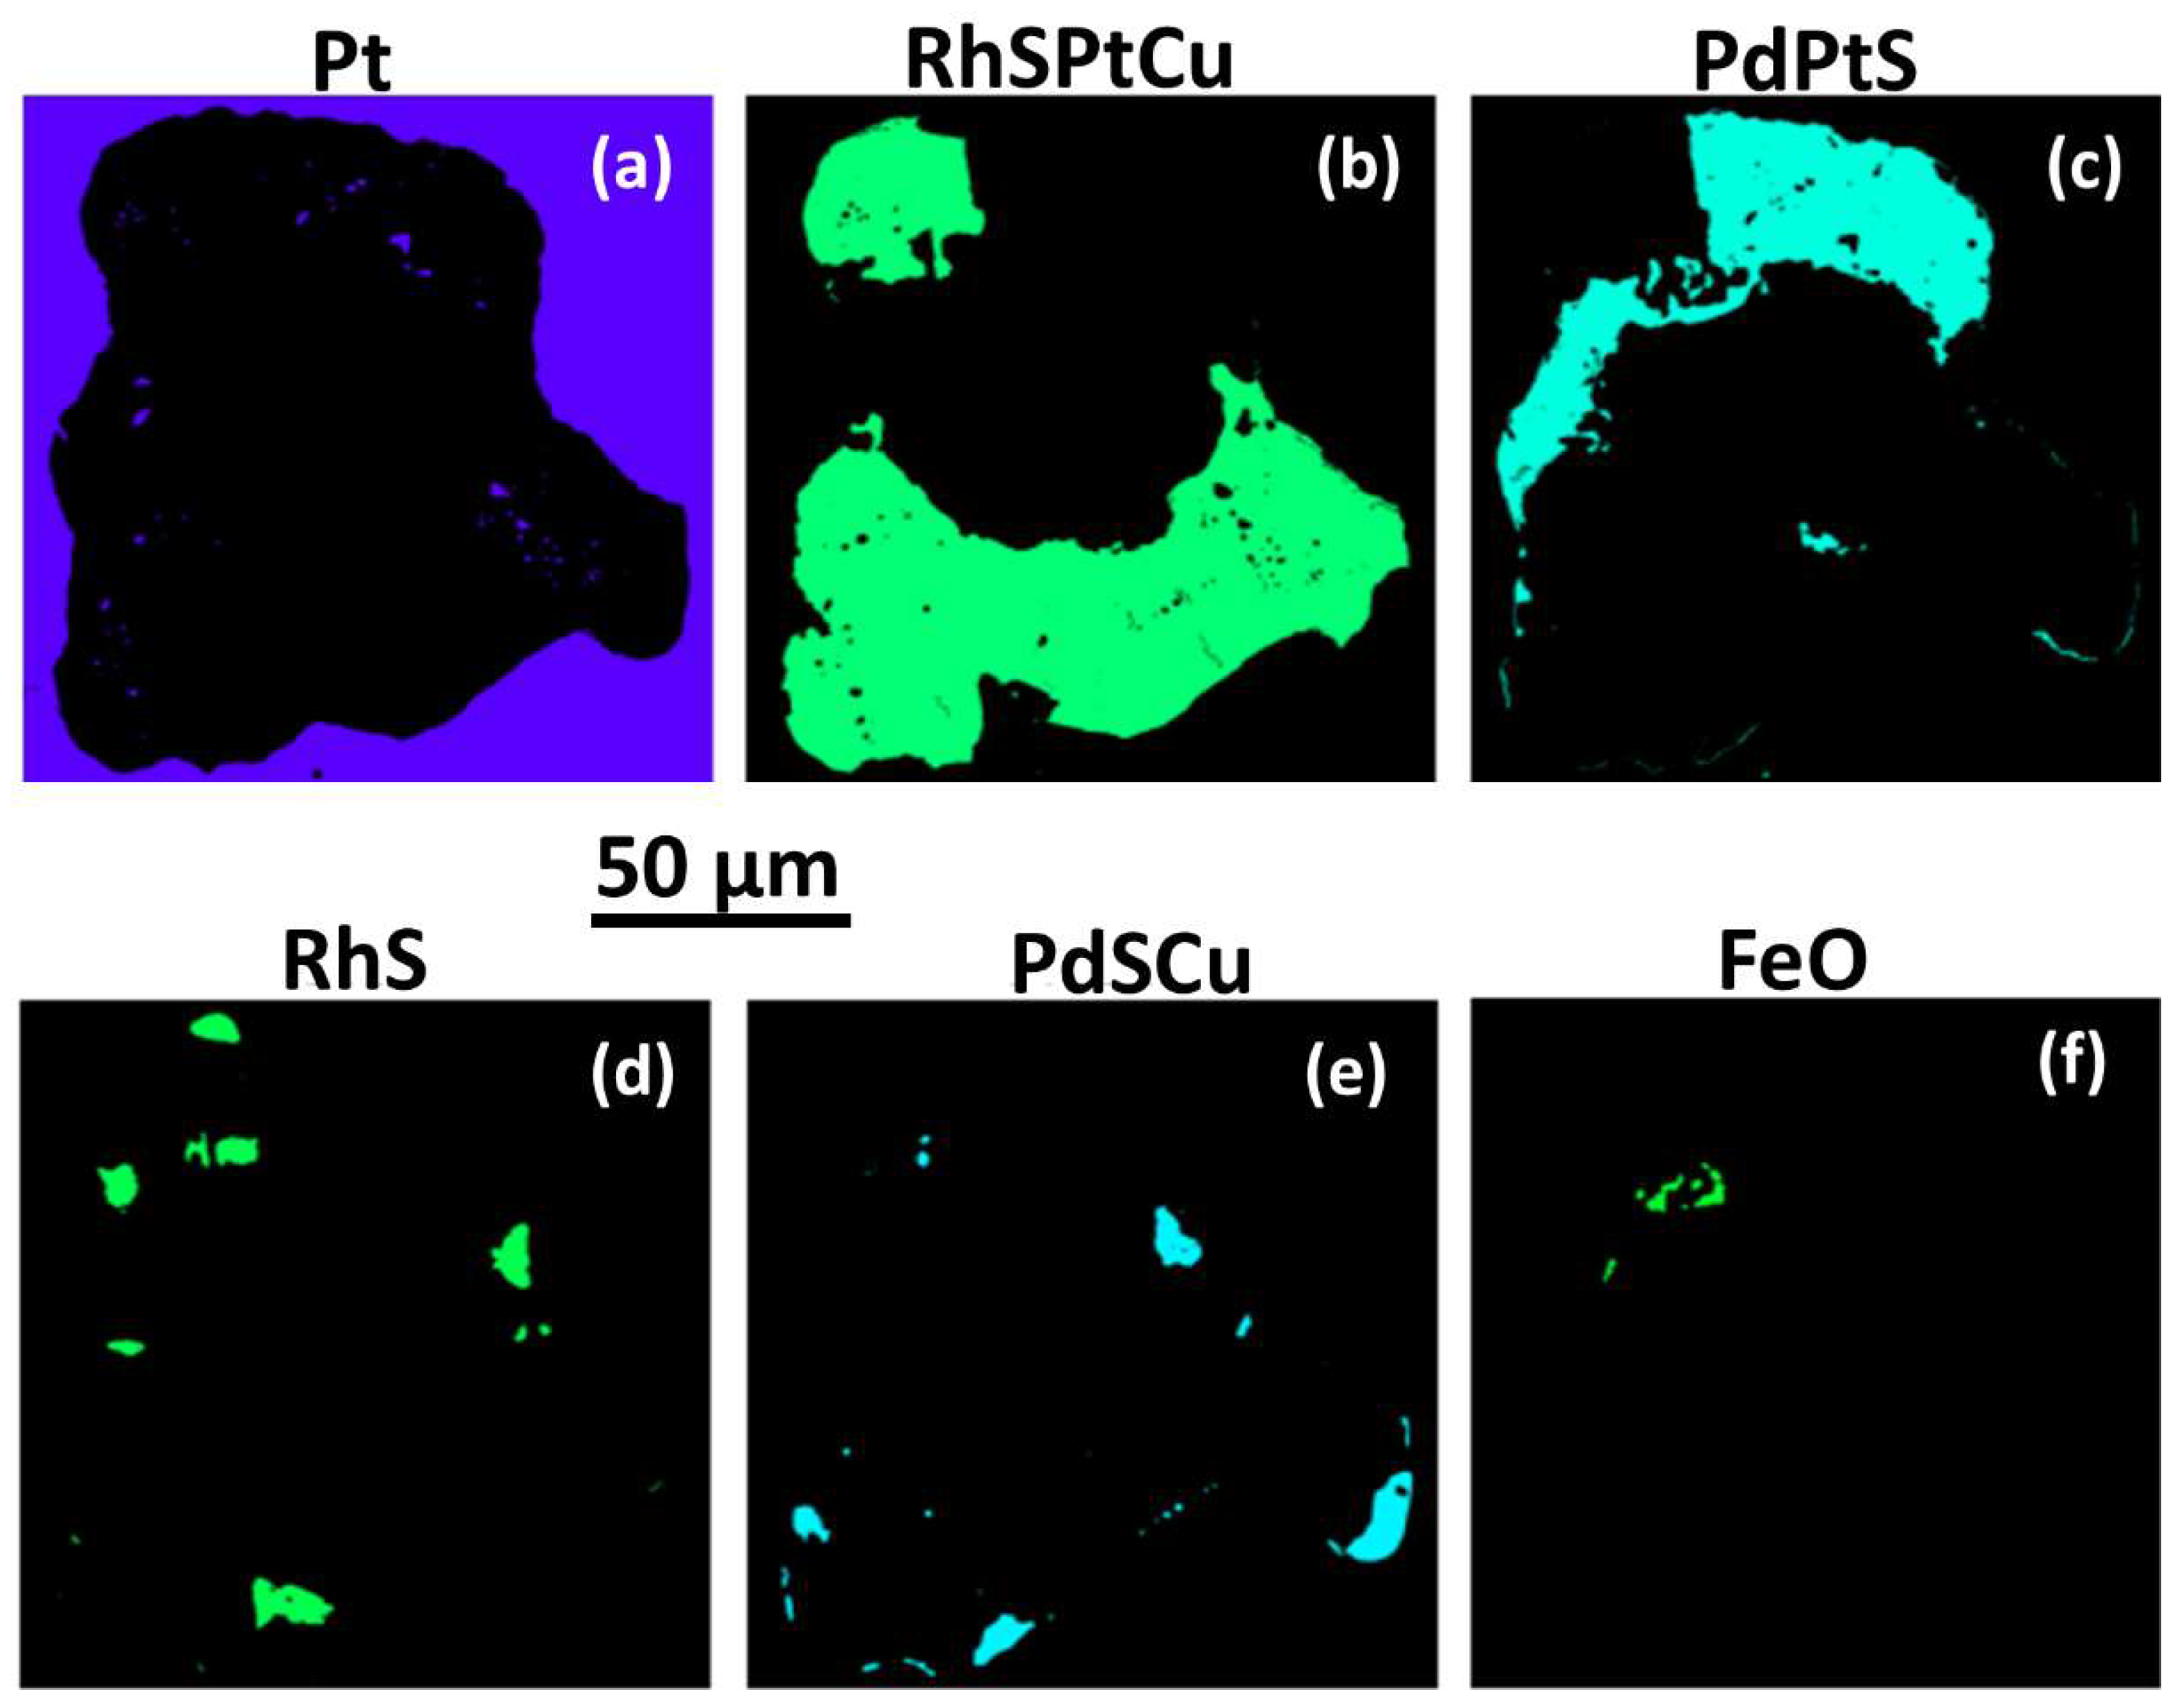
Phase mapping (Figure 10) gives an approximate fraction % for each mineral present (based on relative pixel counts using EDS analysis and BSE imaging minus unassigned pixels). The PGM fraction accounts for 77.8 fraction % of the inclusion, while the exsolved silicate fraction is 22.2 fraction % of the inclusion area. An approximate normalised modal mineralogy for the PGM fraction is as follows (fraction %) (a) Pt-Fe alloy ~1.5; (b) cuprorhodsite 65.3; (c) braggite (and subordinate Ni-vysotskite) 25.6; (d) bowieite 3.6; (e) vasilite 3.6; and UM (unnamed mineral) 0.42. PdTeSRh, is a sulfide-telluride analogue of palladoarsenide (Pd2As).
An approximate calculated bulk chemistry (Table 10) is based on EDS element mapping of the PGM paragenesis.
Pt-Fe alloy forms small clusters of purple grains (Pt, Figure 10a) in the PGM sulfide paragenesis fraction. Pt-Fe alloy set in cuprorhodsite (Figure 9b) is Rh-enriched isoferroplatinum (Pt2.94Rh0.06)3.00(Fe0.85Rh0.16)1.01 (EDS analysis 9Ifp, Table 11). In contrast, Pt-Fe alloy set in vysotskite is Pd rich isoferroplatinum (Pt2.52Pd0.38Rh0.03Ru0.01)2.94 (Fe0.97Cu0.06Ni0.04)1.07 analysis 8(060), Table 11, Figure 9(c).
Cuprorhodsite (Rh-Cu-Fe-S, green in Figure 10b) is the dominant mineral in this inclusion and occurs as two anhedral domains; the largest is ~ 0.15 mm across. Analysis 3(056) Table 11 indicates cuprorhodsite–(malanite) (Cu0.72Fe0.18Ni0.05Co0.01)0.96(Rh1.53Ir0.07Pt0.35)1.92S4.00 (Me-deficient).
Vysotskite (1) (Vys, turquoise in Figure 10c) occurs as irregular large patches that are pale grey in Figure 9b. Analysis 5(058) Table 11 gives Pd 24.15 and Pt 18.58 with 3.36 (at. %) minor elements (Cu, Fe, Rh, Ni and Os). It has slightly high S. Analysis 5(059) is similar. Minor vysotskite (2) is slightly darker grey in Figure 10. Analyses 10(053) and 11(054) Table 11, are more Pd- and Ni-enriched with lower Pt.
Bowieite (RhS, green in Figure 10d) occurs as irregular small patches, at margins of cuprorhodsite. EDS analysis 5RhS (Table 12) gives the following empirical formula (Rh1.73Pd0.13Ir0.05Pt0.04Os0.01Cu0.05Ni0.02Fe0.02)2.05S3.00.
Vasilite (PdSCu in Figure 10e) forms sparse anhedral patches along margins of the irregular inclusion. The average of three analyses [1(052), 2(055) and 9(053) Table 11] give similar formulae. Analysis 2(055) gives (Pd11.60Cu3.31Pt0.05 Ag0.01Fe0.04Ni0.01)15.02(S6.99Se0.01)7.00. This is slightly Me-deficient and Me:S=~2.15.
Hematite (FeO in Figure 10f) occurs as a small (10 µm) cluster of anhedral grains as inclusions in vysotskite (2). EDS analysis 17FeO (Table 12) is ~Fe2O3.
An UM (unnamed mineral) (PdTe) occurs as eight very small (up to ~3 µm) grains located mainly along the boundary of the PGM sulfide fraction with the silicate fraction. EDS analysis 18PdTe (Table 12) indicates (Pd1.79Pt0.11Ni0.07Cu0.03)2.00(S0.56Te0.48As0.01)1.05. It is a Pd-dominant sulfide-telluride analogue of palladoarsenide (Pd2As) and possibly naldrettite (Pd2Sb).
The PGM paragenesis in this inclusion is dominated by cuprorhodsite with significant intergrown irregular patches of vysotskite (1) and subordinate vysotskite (> Ni) (2), minor bowieite, and minor vasilite. Pt-Fe alloy is unevenly distributed as fine grained (< ~5 µm across) anhedral (exsolved) patches in both cuprorhodsite and vysotskite (1) but is lacking from vysotskite (2) (Figure 9b and Figure 10a). ‘Sprays’ of Pt-Fe alloy inclusions define exsolutions in cuprorhodsite in Figure 9b. Pt-Fe-Pd alloy also forms a wisy discontinuous boundary with the host nugget. Vasilite occurs as similar fine grained patches, but has an uneven distribution.

3.1.7. Sample A1 Area 7

a) Host alloy and porphyritic rhyolitic groundmass silicate glass (SiO2 70.31 wt. %).
The small (~0.26 mm across) host nugget is partly rounded with some subhedral-shaped indents filled with alteration products suggesting previous coexisting crystal sites (Figure 11a). Analysis 1(264) (Tables 1A and 1B of Barron et al. [1] and Table 13 below) indicates Pd and Rh-enriched native platinum (Pt2.83Pd0.12Rh0.12Ir0.10Os0.02Ru0.01Fe0.68 Cu0.13)4.01.
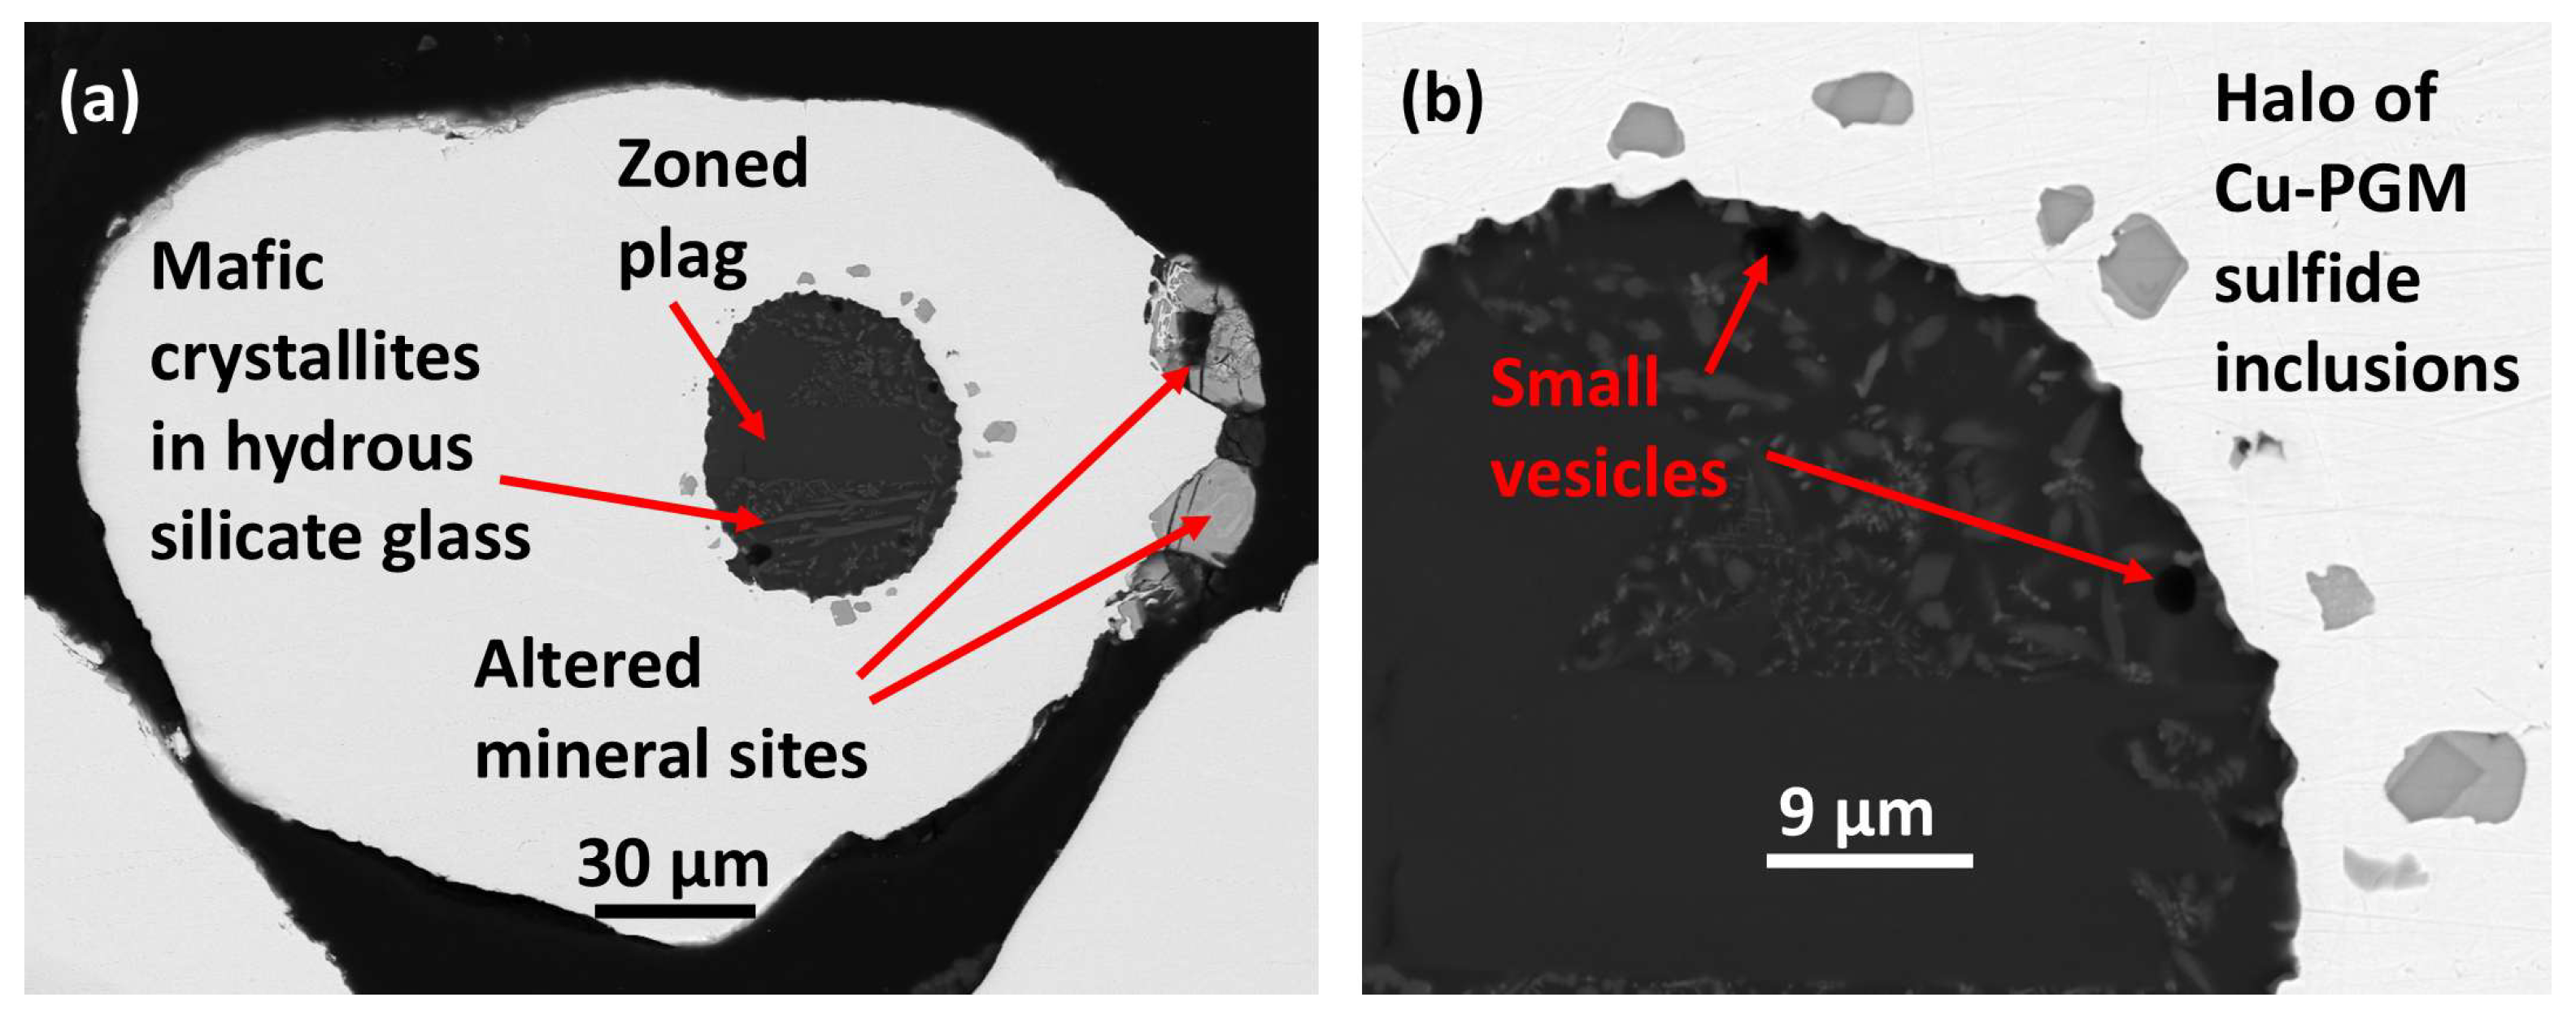
An exceptional oval shaped silicate inclusion (about 65 µm across) with a finely scalloped margin is located towards one side of the host alloy. Plagioclase prisms, skeletal mafic-(possibly amphibole) microlites and minor wispy oxides are set in chilled silicate glass with SiO2 70.31 and significant H2O ~ 4.23 wt. % (Barron et al. [1] analyses 145 and 147, Table 4). Significant quench textures are small, gas/volatile vesicles at the silicate droplet margin, near to ejection into host alloy. A prismatic plagioclase phenocryst is normally compositionally zoned, with a calcic core of bytownite suggesting a picrobasaltic or picritic primitive parent melt and sustained fractionation [1].
b) PGM sulfide paragenesis.
The PGM sulfide paragenesis comprises 18 small inclusions (mainly < 7 µm across) forming a ‘halo’ within the host Pt-Fe alloy adjacent to the silicate inclusion; up to ~14 µm from the scalloped silicate inclusion margin, Figure 11b. They are not in contact with the silicate fraction (
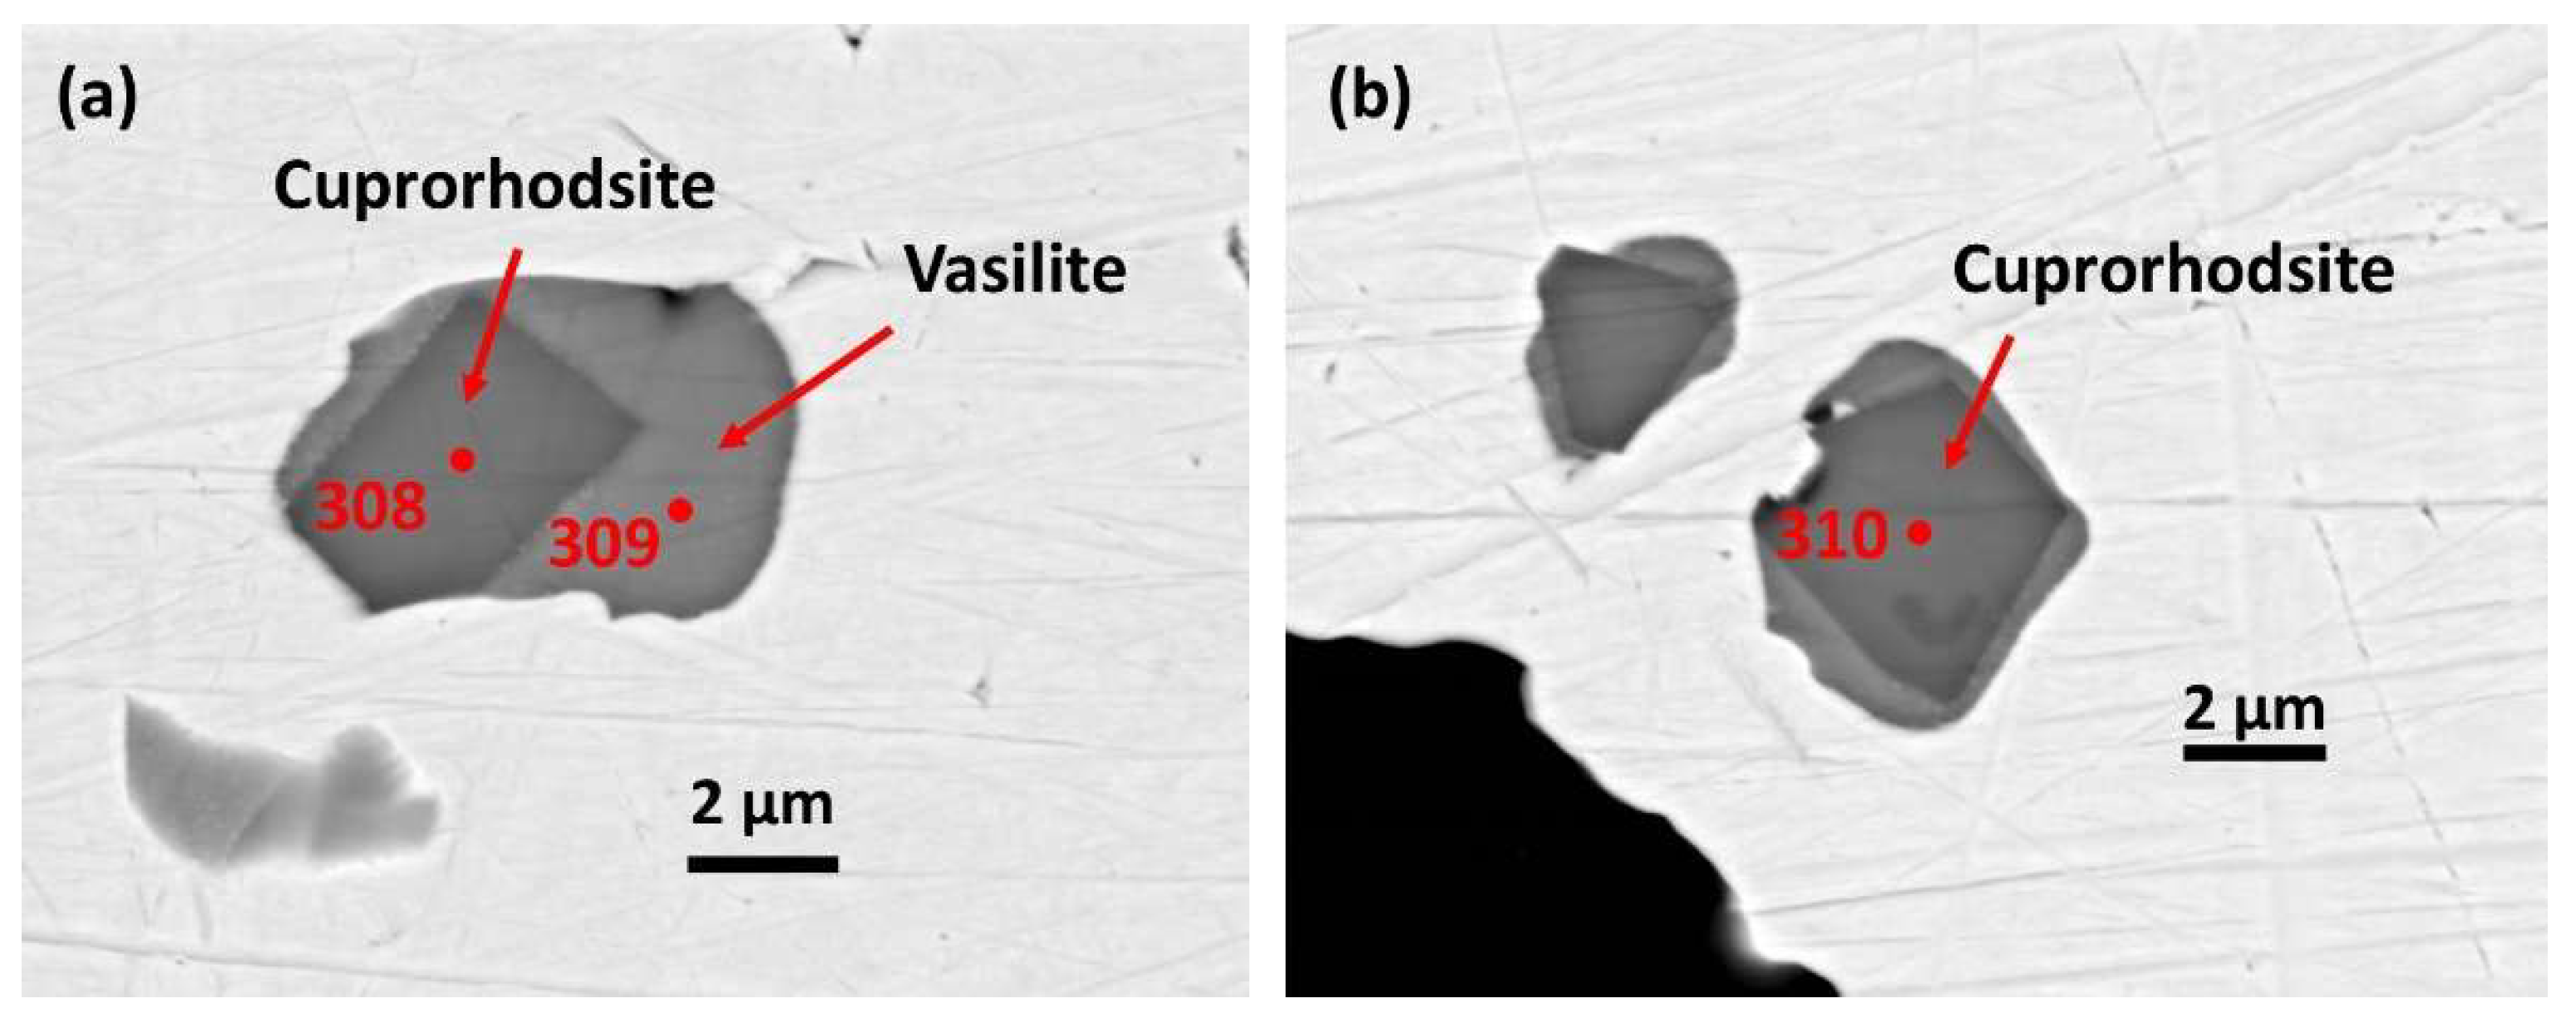
Figure 11a). Each PGM paragenesis is simple, comprising a euhedral crystal of cuprorhodsite set in vasilite (Figure 12a,b).
Cuprorhodsite crystals reach ~4.5 µm long and ~2.7 µm across. Analysis 2(308) Rh-Pt-Cu-S (Table 13) gives the following formula (Cu0.80Fe0.08Ni0.03)0.91(Rh1.42Pt0.39Ir0.09Ru0.01Os0.01)1.92S4.00 (Me-deficient, Me:S=0.71) indicating cuprorhodsite-(malanite) with minor Fe and Ni. Analysis 4(310) in a separate inclusion gives the similar formula (Cu0.80Fe0.08Ni0.03)0.91(Rh1.40Pt0.39Ir0.08Ru0.01Os0.01)1.89S4.00 (also Me-deficient Me:S=0.70).
Vasilite is anhedral and forms a matrix for the cuprorhodsite crystals in each inclusion above. Analysis 3(309) Pd-Cu-S (Table 13) indicates (Pd11.25Rh0.13Pt0.12Ag0.05Cu3.82Fe0.05Ni0.01)15.42(S6.96As0.03Se0.01)7.00 (Me:S=2.20), with significant Rh and Pt. Additional ligands are detectable As and Se.
We calculate the approximate inclusion bulk chemistry (Table 14) for the Cu-PGM sulfide fraction in the present sample using the simple ore mineralogy of cuprorhodsite and almost equally abundant vasilite (Figure 12a). Order of major elements present is as follows Rh >>Cu>Fe>>Pd>Ni.

4. Discussion

4.1. Host Pt-Fe Alloys and Composite Inclusions

Composite melt inclusions of silicate glass with coexisting exsolved Cu-PGM sulfides are hosted in seven Pt-Fe alloy nuggets dominated by isoferroplatinum (five nuggets) and native platinum (two nuggets) [1]. In one example (Figure 10) an exsolved thick rim of ore paragenesis is distinctly deflated (degassed). Another inclusion comprises silicate glass surrounded by an adjacent corona of small exsolved PGM sulfide ‘droplet’ inclusions set in the host alloy (Figure 11). In a third composite inclusion, the silicate melt fraction has a thin partial rim of exsolved Cu-PGM sulfides, while separate small inclusions are exsolved PGM sulfides lacking coexisting silicate melt (Figure 3). One host Pt-Fe nugget is distinctly flattened and deformed. It hosts a once rounded but now similarly deformed silicate inclusion, with a distant partial arc defined by related PGM droplet inclusions located near the nugget margin (Figure 2). These examples represent latest stages of Cu-PGM sulfide melt exsolution and expulsion from host silicate melt into molten (or plastic) host alloy.
Excellent preservation of the composite inclusions likely is due to rapid quenching after fractionation then partial decompression ± partial melting during deep-sourced cumulate intrusion up to a high crustal level [1,6,16]. Also, these samples are likely to be geologically ‘young’ and ‘belong’ in their Late Cretaceous Narajal accreted arc terrane [1,3]. Therefore, they have undergone little degradation by weathering/alteration compared with more ancient and deformed Alaskan-Uralian type intrusions. The youngest recorded Alaskan-Uralian type intrusion (20 Ma) is Condoto in Colombia with its related primitive Viravira lavas [25,26,27]. This intrusion and other zoned Alaskan-Uralian type complexes are located along a Tertiary (Santa Cecilia arc) and an adjacent Late Cretaceous (Cañasgordas arc) trend extending southwards into north western Ecuador towards the Camumbi River alluvial deposit. The nearby Santiago River alluvial deposit, from which similar nuggets are reported, also is located in this region [28,29].

4.1.1. Fractionation and Ts of Host Silicate Melts Coexisting with Cu-PGM Sulfides

Analyses of the silicate glass in seven (melt) inclusions coexisting with Cu-PGM sulfide parageneses indicate they are increasingly fractionated [1] from hydrous ferrobasalt to basaltic andesite, andesite and groundmass dacite-rhyolite in terms of the total alkali-silica (TAS) diagram (Figure 13a). This shows the differentiation trend (or liquid line of descent, dot dash line) of the quenched silicate glass fractions, in terms of alkalies (Na+K oxides)-FeO-MgO (AFM), each of which hosts a distinctive, coexisting (exsolved) Cu-bearing PGM sulfide ore paragenesis.
Here we calculate the Ts of quenching for coexisting silicate glass fractions using the Yuan et al. [32] geothermometer based on SiO2 wt. % (anhydrous). This shows that the silicate glass inclusion with the most primitive basalt composition coexisting with small Ti-bearing chromite crystals, sample B area 1 (Barron et al. [1] Figure 13a,b), is quenched at 1021.2 °C. This glass is hydrous ferrobasalt (SiO2 48.52 and FeO 10.93 wt. % with estimated 2.24 wt. % H2O). It compares with the synthetic primitive hydrous ferrobasalt composition for the Skaergaard intrusion, Greenland, Botcharnikov et al. [2]. They show that at 200 MPa and 940-1200 °C “the addition of H2O decreases liquidus temperatures and changes significantly the proportions, temperature range and sequence of crystallizing mineral phases”. They also found that their “experimental data are in agreement with the experimental results of Sisson & Grove [33] who showed a change in the trend of liquid lines of descent from tholeiitic to calc-alkaline with increasing aH2O and fO2”, confirming results of Berndt et al. and Koepke et al. [34,35].
The most primitive silicate glass coexisting with PGM sulfides in this study also is tholeiitic ferrobasalt, quenched at 1018.5 °C (samples A2 area 7 and A2 area 6) with slightly lower SiO2 than primitive sample B area 1, but significantly higher FeO with low H2O. This strongly Fe-enriched basalt silicate glass plots near the top of the Fe-enrichment trend of tholeiitic melts (Figure 13b), but with little H2O (0.31 wt. %). Basaltic andesite silicate glass (sample Mag 5 area 4) quenched at 1017.5 °C, also follows the tholeiitic trend, but with lower FeO and significantly higher H2O (~2.55 wt. %) while quenched glass in sample A1 area 9, also of basaltic andesite composition, plots near the tholeiite/calc-alkaline boundary in Figure 13b. In the latter FeO is still elevated but with moderate H2O (~1.71 wt. %).
In contrast, a sharp decrease in Fe is shown during melt fractionation from tholeiitic basaltic andesite (above) to calc-alkaline andesite glass quenched at 983 °C (sample B area 5) with minor FeO 3.25 wt. %, Figure 13b (cf. Barron et. al. [1] Figure 12).
The sequentially more siliceous, groundmass silicate glass compositions of microporphyritic dacite-rhyolite (quenched at 845 °C, sample B area 4) and sample A1 area 7 rhyolite glass (quenched at 830 °C) show substantially increasing H2O, ~2.32 to ~4.28 wt. % respectively. They follow the calc-alkaline trend with continuous Fe and Mg depletion and concentration of remaining PGE, S, and minor Te. This data is from Barron et al. [1].
Ballhaus et al. [36] report that “sulfide droplets entrained from the mantle source may become dissolved as the basalt is decompressed on its passage to the surface, and that all the elements contained in sulfide, including the noble metals, are then released to the silicate melt”. If the silicate melt is PGE-saturated, as in the present silicate glass inclusions, crystallization of PGE minerals further fractionates noble metals [37,38].
Supporting PGM mineralization in strongly differentiated silicate melts are two volcanic examples. Firstly, is the unusual Early Cretaceous (~125 Ma) occurrence hosted in evolved explosive andesite breccia in the Poperechny iron-manganese deposit (Lesser Khingan Range, Far East Russia) [39]. Here the PGM are Fe-Pt alloy solid solutions (85%) and other PGM (mostly Os-Ir-Ru) solid solutions, sulfides and sulfarsenides (15%). They suggest formation by “high-temperature fractionation of a mantle-derived mafic parental melt (similar to Alaskan-type complexes) and that the PGM were entrained in the evolved andesitic melt during its emplacement in the crust”. Also, that the “Early Cretaceous (~125 Ma) age of ferroplatinum in the explosive breccia suggests that PGM-bearing ultramafic material could have been sampled during regional slab window tectonics related to the Late Mesozoic subduction of Izanagi plate along southern margin of the North Asian continent.”
The second example is a young (~2 Ma) deposit of PGE sulfide mineral compositions, mainly Cu-poor monosulfide solid solution (Mss), formed at distinct stages of magma evolution from deep to shallow crustal levels reported in dacitic rocks recently recovered from the Okinawa Trough [40]. They also note that such PGEs have a strong affinity for sulfur and tend to accumulate in deep continental crust. The Okinawa Trough is an active back-arc basin located behind the Ryukyu Island Arc.

4.1.2. Bulk Compositions; Fractionation of Selected Coexisting Cu-PGM Sulfide Parageneses

Element and phase mapping is used (above), for inclusions in three samples (Mag 5 area 4; B area 5 and B area 4), to estimate from pixel counts the fraction % of each mineral present and to calculate bulk chemistry of each Cu-PGM sulfide paragenesis. We also calculate inclusion bulk chemistry for the Cu-PGM sulfide fraction (almost equally abundant cuprorhodsite and vasilite) in sample A1 area 7. Coexisting silicate glass in these four samples spans a SiO2 range of 52.30–70.67 (wt. %) and temperature range of 187.5 °C.
It is interesting to note that Borisov and Danushevsky [41] show experimentally in the pseudobinary diopside-anorthite eutectic–silica system, that the effect of adding silica (up to 50 wt. %) results in a dramatic but systematic decrease in Pt and Rh solubilities, and maximum decrease in melts with 70 wt. % SiO2 (cf. coexisting silicate glass in samples B area 4, SiO2 70.67 wt. % and A1 area 7 SiO2 70.31 wt. %). Their study, at 1450 °C (in air) is well above the Ts considered here. Nevertheless, their results indicate that SiO2 affects Pt, Rh (and Pd) solubilities and “support a suggestion that magmatic fractionation from basaltic to silicic compositions under sulfur under-saturated conditions may result precipitation of Pt-Fe alloys”.
In Figure 14a we plot the fractional crystallization path (black dashed lines) of the four Cu-PGM sulfide bulk compositions (in terms of Pt+Pd+Rh–Cu–Fe(+Ni+Co) at. %). Their stability is correlated with quenching Ts calculated above for coexisting silicate glass. This path, from the bulk composition of sample Mag 5 area 4 (highest T 1018 °C), shows that with falling T at constant Cu, ∑PGE (mainly Rh) increases at the expense of Fe(+Ni+Co) resulting in the extreme Rh-enriched bulk composition (at 983 °C) of Cu-PGM sulfides in sample B area 4. With further falling T and constant Fe(+Ni+Co), ∑PGE (mainly Pd) increases, resulting in the extreme Pd-enriched composition of sample B area 4 at 845 °C. With further decreasing T and constant ∑PGE, Cu is enriched at the expense of Fe(+Ni+Co) resulting in the bulk composition of PGM in sample A1 area 7 (at 830 °C.)
Figure 14b shows bulk compositions of the four Cu-PGM sulfide fractions (in terms of Pt–Rh–Pd at. %) follow a strongly fluctuating path of fractional crystallization (black dashed lines) depending on selective enrichment of each major PGE; first Pt 11.04 at. % in sample Mag 5 area 4), then Rh 24.12 at. % at the expense of Pt (0.68 at. % in sample B area 5), then Pd 25.86 at. % at the expense of Rh (8.70 at. % in sample B area 4) in successive residual melts with falling T within the range 1018–830 °C. The inclusion bulk composition of sample A1 area 7 at 830 °C, shows minor Pt depletion (with significant increase of Cu) compared with that of sample B area 4 at 845 °C.
Instead of fractional crystallization (above), we suggest incongruent melting has influenced bulk composition fractionation in three calc-alkaline Cu-PGM sulfide parageneses, shown by red lines in Figure 14a,b. At mantle depth, incongruent melting of Mss is likely to occur due to decompression, lowering melt Ts in Mss [42]. Thus, incongruent melting of the S-saturated, Cu-PGM-sulfide bulk composition of sample Mag 5 area 4 (coexisting with silicate melt at 1017.5 °C) is likely to produce (at respectively 983 °C and at ~830 °C) the two extreme Rh- and Pd-enriched S-undersaturated bulk inclusion compositions (samples B area 5 and B area 4). Solubility of Pt, Rh and Pd in these separate melts as above may be influenced by SiO2 concentrations in melt bulk compositions [cf. [41]].
Also supporting incongruent melting due to decompression, we identify dominant Pt-poor cuprorhodsite (24.92 fraction %) with exsolved alloy lenses of Pd-tetraferroplatinum in sample Mag 5 area 4 (Figure 4) and propose a possible PGE-enriched monosulfide mineral precursor prior to decompression. The incongruent melting model also is supported by experimental work of Fonseca et al. [43] indicating that sulfides in subducted eclogite (and peridotite) can melt incongruently in the mantle, producing Cu–Ni-poor sulfide melt and residue of mss into which are selectively partitioned highly siderophile PGE (particularly Pt, Pd, Rh, Ru, Os and Ir).
In this natural system Cu is the only additional incompatible element to partition into the melt at 845 °C (possibly a partial melt of Cu-PGM sulfide bulk composition in sample B area 4) and is strongly compatible in the Cu-rich PGM sulfide fraction of sample A1 area 7, coexisting with quenched silicate glass at 830 °C. Concentrations of Pd and Rh compare with those in the sulfide PGM inclusion bulk composition of sample B area 4 (above).

4.1.3. S-Saturation of Cu-PGM Bulk Compositions

Bulk compositions of two inclusion Cu-PGM sulfide parageneses considered above are slightly S-saturated (samples Mag 5 area 4 and the extremely Rh-enriched sample B area 5). Their fractionation path represents a T decrease of only 35 °C (red line in Figure 14a,b) and shows a precipitous increase in ∑PGE dominated by Rh, with decreasing Pt (+Pd) and concomitant decreasing Fe(+Ni+Co). In contrast, the fractionation path from the Cu-PGM sulfide bulk composition of sample Mag 5 area 4 towards the extremely Pd-enriched sample B area 4 (crystallized at 845 °C), represents a greater T decrease of 173 °C, and shows S(+Se+Te)-undersaturation confirming a significant increase of metal elements with moderate Cu depletion in Figure 15a. The S-undersaturated bulk composition of PGM sulfide paragenesis in sample A1 area 7 at 830 °C is relatively Cu-enriched by a very small T decrease (15 °C) from that of sample B area 4 (Figure 15a).
Thus, the bulk compositions for Cu–Fe(+Ni)–PGE natural parageneses coexisting with silicate melt in four samples show that Pt, Rh and Pd are differentiated with cooling from 1018 °C to ~830 °C, firstly in slightly S-saturated sulfide melt (two samples) and secondly in melt that is S-undersaturated at 845 °C and 830 °C (two samples).
Experiments of Peregoedova and Ohnenstetter [44] at the lower T of 760 °C showed that “rhodium is characterized by a dual behavior. Like Pd, Rh preferentially partitions into base metal sulfides, especially monosulfide solid solution (up to 2.6 at. % Rh) but at conditions of very low or very high sulfur fugacity, it forms Rh minerals as does platinum”.
In the experimental system Fe–Ni–Cu–PGE–S, Ballhaus et al. [45] indicate that the higher the bulk metal/S ratio, the lower are the liquidus and solidus temperatures and the lower is the temperature to which a sulfide melt may fractionate and be enriched in Cu. This is the case in the present system for bulk compositions of the two S-undersaturated bulk compositions above.
Partition coefficients of Rh, Pt and Pd also depend on the bulk S contents of the melt, and they are known experimentally to increase with increasing S contents in both Mss and liquid [17]. However, in the present natural Cu–Fe(+Ni)–PGE system we show that Pt, Rh and Pd are differentiated with cooling from 1018 °C to ~830 °C in slightly S-saturated sulfide melts that become S-undersaturated.
Further experiments of Peregoedova et al. [42] show that under conditions of declining sulfur fugacity and high T (~1200 °C) “the depletion of Mss in sulfur…. might lead to formation of individual PGE alloys and lead to Mss partial melting, producing a Cu–Ni-rich sulfide melt, and changing completely the original PGE distribution pattern”. This is describing incongruent melting. They also found that sulfur fugacity plays an extremely important role in the formation of individual PGE minerals. Their sulfur buffered experiments show that “variation in fS2 directly affects the bulk metal/S ratio of sulfide assemblages and leads to a change in the stable assemblages of base–metal sulfides and PGE phases”.

4.2. Cu-PGM Sulfide Compositions and Stability

4.2.1. Braggite–Vysotskite

Braggite–vysotskite compositions in two samples indicate strong fractionation of Pt and Pd within their confined inclusion boundaries. In the first sample (A2 area 6) we analyse braggite and vysotskite in three sulfide melt inclusions within one Pt-Fe host nugget (Figure 15; cf. Cabri and McDonald [19] Figure 1). One braggite composition, plots close to the boundary with cooperite in Figure 15 suggesting equilibration at high T (possibly >1000 °C). This sulfide paragenesis coexists with quenched silicate glass at 1018 °C. Elevated minor elements (~4.17 at. %) other than Ni and Fe (1.29 at. %) preclude the use of the Verryn geothermometer [46].
A second, more fractionated composition in this paragenesis also is braggite (Figure 15) that plots near the boundary with vysotskite. Here, Pt in braggite is considerably lower (19.64 at. %) with an almost equal concentration of Pd (19.55 at. %) and Ni+Fe (2.08 at. %). However, minor elements are high (4.11 at. %) also precluding T estimation [46].
A third irregularly zoned grain [semiquantitative analysis (317) above; Figure 3d] indicates Pd-rich vysotskite with high (~5.17 wt. %) PGE minor elements. The subhedral and partly zoned braggite and vysotskite crystals span a compositional range of Pt 35.21–11.41 at. % with concomitant Pd from 4.17–30.76 at. % (Figure 15).
In the second sample (B area 4), four vysotskite analyses define two distinctly fractionated compositions. The first two analyses (058 and 059 Table 11, Figure 15) indicate dominant Pd (at. %) vysotskite (1). The second two analyses (053 and 054, Figure 16) represent strongly Pd enriched vysotskite (2) compositions (near Pd 36.30 at. %). The analyses of Pd-rich vysotskite (2) also indicate Ni 4.15 and 0.08 Fe (at. %) with remarkably low minor elements (Rh 0.07 at. %). Therefore, since no elements other than Ni and Fe play a significant role in the compositional variation, an estimated experimental maximum temperature is possible using the Ni versus Pt (at. %) thermometer of Verryn and Merkle [46] their Figure 6. In the present analysis Ni(+Fe) accounts for 4.23 at. % which gives an approximate crystallization T ~ 900 °C. The calculated T from coexisting silicate glass is 845 °C.
Clusters of small Pd-rich isoferroplatinum grains (Table 11) set in vysotskite (1) likely represent decompression exsolutions. Their Pd-rich isoferroplatinum composition is distinctive, but compare with Pt-rich isoferroplatinum grains hosted in coexisting cuprorhodsite grains (below). In contrast, grains of vysotskite (2) lack alloy exsolutions and most likely crystallised at a higher crustal level.
In Figure 15, a single braggite composition, analysis 133 (sample Mag 5 area 4, Table 5) (~9.41 at. % minor elements) plots near cooperite. This is consistent with the high T (1018 °C) of coexisting silicate glass. In contrast, vysotskite (sample in A2 area 7, analysis 328 Table 1) suggests late, low T crystallization in a negative crystal space within the host nugget, Figure 2(c).

4.2.2. Thiospinels

Cuprorhodsite–(malanite) occurs in all inclusion Cu-PGE sulfide parageneses. A range of Ir-poor compositions is represented in terms of Pt, Rh and Ir (Figure 16), except for analysis 132 (sample Mag 5 area 4) which is weakly Ir enriched (2.20 at. %). In terms of the binary Pt–Rh, this cuprorhodsite–(malanite) solid solution series varies from Pt:Rh= 21/79 at. % (sample B area 4) to Pt:Rh=37/63 at. % (sample A2 area 6), with the extreme example Pt:Rh= 2/98 at. % (sample B area 5). Excluding the latter, this range compares with the compositional range of cuprorhodsite–(malanite) compositions, Pt:Rh = ~20/80 at. % to Pt:Rh = ~47/53 at. %, in melt inclusion parageneses in one Pt-Fe alloy nugget (sample Mag 4 area 1) [16].
Cuprorhodsite–(malanite) analyses here can be subdivided into two groups based on Rh concentrations. In the first group Rh in cuprorhodsite–(malanite) varies from 15.64–18.08 at. % representing the four highest T (1020–1017 °C) samples that were fractionated along the tholeiitic trend. In the second group Rh in cuprorhodsite–(malanite) varies from 21.79–27.67 at. % in the three (lower T, 983–830 °C) samples that were fractionated along the calc-silicate trend [1].
Phase mapping of the Cu-PGM sulfide fraction in the inclusion of sample B area 5 reveals that of seven sulfide minerals present, four are identified as thiospinels. Apart from dominant cuprorhodsite–(malanite) we identify three additional minor thiospinels; Rh-Cu-Fe-S is Fe-enriched ferrorhodsite (3.98 volume %), Rh-Cu-Ni-S is cuprorhodsite–(polydymite) (2.00 volume %) and Rh-Ni-Cu-S polydymite–(cuprorhodsite) with significantly higher concentration of Ni (1.00 volume %). Very small volumes of the latest-crystallized thiospinels suggest a low T residual melt was frst enriched in Fe, then Ni and finally the most Ni-enriched thiospinel composition of polydymite–(cuprorhodsite). This unusual compositional range of the three minor thiospinels represents a sequentially fractionated low T solid solution series.
The most Ni-enriched Rh-Ni-Cu-S thiospinel shows concomitant decrease in Rh, Cu and Fe. It also is the thiospinel that is least abundant. Such compositions show that different thiospinels can form sequentially in minor, latest fractionating sulfide melts, and that Ni in these thiospinels increases as temperature falls.

4.2.3. Minor Cu-PGE Sulfide Minerals Coexisting with Thiospinel

Significant minor minerals are present in parageneses of Cu-PGE sulfide melt inclusions in six samples. Minor minerals of the sample A2 area 7 are too fine grained for accurate analyses. As above, we discuss these in order of increasing SiO2 fractionation (therefore decreasing calculated T of coexisting glass).
Minor chalcopyrite and bornite in sample A2 area 6 coexist with braggite–vysotskite and cuprorhodsite–(malanite). Bornite shows exsolutions and possible intergrowths of a distinctive monosulfide UM (unnamed mineral). This mineral compares with two analyses (Sp31) and (Sp38) Table 7B of Barron [16] and possibly is a Pt enriched analog of the minerals generalized as Me1-xS of Tolstykh & Krivenko [21] showing lower Cu and lacking significant Pt compared with the present two analyses.
In contrast, minor minerals in sample Mag 5 area 4 are Me-deficient pyrrhotite (with a variety of minor elements) and unusual isocubanite. In this inclusion, cuprorhodsite–(malanite) with tetraferroplatinum exsolutions is dominant (see below).
Minor, equally dominant vasilite and chalcopyrite are present in sample A1 area 9 indicating increasing Pd and Cu respectively in latest sulfide residual melt. Subordinate pentlandite, rich in minor elements, is Me-deficient [semiquantative analysis 6(316) Table 6] indicating low fS2. This Cu-PGE sulfide melt paragenesis also is dominated by cuprorhodsite–(malanite) but lacks braggite or vysotskite.
In sample B area 5 minor alloy (Pt>Pd>Fe>Cu) and associated keithconnite indicate low fS2. These form interstitial patches that are evenly sized and distributed suggesting exsolution. Minor vasilite is unevenly distributed. This paragenesis is dominated by cuprorhodsite–(malanite) and similarly lacks braggite or vysotskite. Three minor thiospinels representing late low T deposits indicate increasing Fe then Ni. A minor Me-deficient monosulfide mineral with Rh>Pt>Fe>Cu>>Ni occurs along mineral boundaries and fractures. Hematite, dominated by Fe and O, possibly is latest crystallized in sample B area 5 and indicates that S is completely depleted and not available to escape as a gas so the round shape of the inclusion is preserved (Figure 7); unlike the deflated inclusion in sample B area 4.
In sample B area 4 (Figure 9) minor minerals are Pd-rich isoferroplatinum exsolved as blebs within dominant cuprorhodsite and vysotskite indicating decompression; possibly representing initial crystallization at mantle conditions then rapid intrusion up to a higher crustal level. Also present are the minor minerals bowieite, vasilite, a Pd-dominant sulfide-telluride UM analogue of palladoarsenide Pd2As and naldrettite Pd2Sb, and hematite. These minerals indicate low fS2 with significant increasing Pd, and Te at the latest stage of fractionation.
Small inclusions encircling their host silicate melt inclusion form a close corona in the adjacent host alloy of sample A1 area 7. They have a simple fractionated mineralogy dominated by subhedral cuprorhodsite–(malanite) crystals set in slightly subordinate vasilite indicating latest enrichment in Pd and Cu with high Me:S = ~3.3, again confirming low fS2.

4.3. Deformation and Decompression

4.3.1. Deformation

Distinct plastic deformation (flattening with decompression) of the host native platinum in sample A2 area 7 (Figure 2) may have influenced expulsion of PGE melt inclusions from the host glass to the nugget margin. The round inclusion of basalt glass (1018.5 °C) also is moderately flattened. This suggests early intrusion and possibly tectonic compression of mantle-derived basalt melt at highest T.

4.3.2. Decompression Alloy Exsolutions in Cuprorhodsite and Vysotskite

Decompression exsolutions in cuprorhodsite occur in Cu-PGM sulfide fractions of two inclusions. In the first example, we sho that tetraferroplatinum exsolutions are crystallographically controlled, subparallel, narrow lenses in prismatic cuprorhodsite (sample Mag 5 area 4, Figure 5). Combining the compositions of lenses and cuprorhodsite, we define a precursor Pt-enriched monosulfide mineral (equivalent to Mss) likely stable at higher P and T conditions. Coexisting basaltic andesite glass was crystallized at 1017.5 °C.
In the second example, an irregular (deflated) rim of exsolved PGM sulfide paragenesis encloses a central silicate host in the inclusion of sample B area 4, with groundmass glass of dacite-rhyolite composition, crystallized at 845 °C (Figure 10b). Deflation is interpreted to result from decompression induced degassing. Also supporting decompression in this sample are remarkable clusters of alloy blebs (unlike the alloy in narrow subparallel lenses above) forming sprays and patches set in host domains of cuprorhodsite. The exsolved blebs are very fine grained, but semiquantitative EDS analysis 9Ifp (Table 12) indicates Rh-enriched isoferroplatinum (with Cu 2.54 wt. %). Rh enrichment reflects its Rh-enriched host thiospinel. This compares with the Pd-enrichment of alloy exsolutions in Pd-rich vysotskite (above).
The host cuprorhodsite is Me-deficient (Me 2.88: S 4.00 = 0.72), possibly due to the exsolved alloy exsolutions. Sulfur degassing clearly is associated with decreasing fS2 and this is proposed here to facilitate exsolution of alloys, possibly from an earlier-crystallised monosulfide mineral.
Similarly, in the paragenesis of sample B area 4, small alloy blebs are exsolved in coexisting vysotskite [analyses 7(059) and 11(054), Table 11] suggesting a precursor mineral with significant Pt enrichment at higher P (and T). Analysis 8(060) Table 11 indicates the exsolved alloy is significantly Pd-enriched (9.38 at. %) isoferroplatinum compared with the Pt-enriched exsolved alloy in cuprorhodsite above.
Thus, a desulfurization process potentially could occur due to depressurization of ascending magma with entrained mineralized droplets. Supporting this conclusion, the experimental study of Peregoedova et al. [42] found that PGE-bearing Mss undergoing S loss can produce Pt and Ir exsolution from the Mss matrix in the form of PGE bearing alloys.

4.3.3. Partial Decompression Melting

Partial decompression melting in sample A1 area 7 is indicated by conspicuous negative indents in some Cu-PGM sulfide inclusions, indicating resorption. One inclusion is torn apart with host alloy filling a wide gap (Figure 13a). This shows that the pre-existing composite inclusion is fractured then partly resorbed by a Pt-Fe alloy decompression partial melt at lower T. We compare the latter with an example from the Durance River, France (Johan et al. [31] Plate 1F). Here, two fragments of an early-quenched round, brittle-fractured, silicate glass inclusion are hosted in Pt-Fe alloy.
Also in sample A1 area 7, decompression partial melting together with the hydrous (H2O ~4.28 wt. %) silicate (rhyolitic) glass host composition quenched at 830 °C, could have influenced the expulsion into the adjacent host Pt-Fe alloy of the corona of small Cu-PGM sulfide inclusions. This texture, including the scalloped outline of the silicate fraction, could result if the PGM paragenesis initially comprised an exsolved discontinuous thin rim (a small fraction of the whole inclusion) compared with the relatively thick exsolved Cu-PGM sulfide rims in other samples. A strongly zoned plagioclase phenocryst with bytownite centrally confirms a long fractionation history for this sample [1].

5. Conclusions

  • Rare inclusions of fractionated silicate glass melts coexist with related, exsolved Cu-bearing PGM parageneses hosted in seven Pt-Fe alloy nuggets from the Camumbi River, NW Ecuador. Two are high T native platinum and five are isoferroplatinum. Some Cu-PGM melt inclusion parageneses enclose ‘pools’ of silicate glass from which they are exsolved. In others, Cu-PGM melt inclusion ‘droplets’ are expelled into host Pt-Fe alloy. Trace element patterns in silicate glass inclusions [1] match those from arc volcanics in their accreted Cretaceous Naranjal terrane [3].
  • Primitive silicate glass in this inclusion suite is hydrous ferrobasalt, similar to the experimental starting material of Botcharnikov et al. [2] from the Skaergaard intrusion, Greenland. Like their fractionation, the present suite first follows a tholeiitic path of Fe-enrichment (basaltic andesite) then sharply shifts to follow the calc-alkaline trend (calc-alkaline andesite, dacite, rhyolite) coinciding with Fe-depletion due to mafic/oxide crystallization and presence of water [1,2,33,47]. Calculated quenching temperatures for inclusion silicate glass vary from ~1018 °C to ~830 °C, based on the Yuan et al. [32] silicate geothermometer.
  • Four Cu-PGE sulfide inclusion parageneses coexist with basalt and basaltic andesite silicate melts within the high T, high Fe tholeiitic trend. Their Pt enriched bulk compositions are moderately to slightly S-saturated, and we suggest that differentiation is by crystal fractionation at high T (1020–1018 °C). In contrast, extreme bulk compositions of Cu-PGE sulfide inclusion fractions are respectively Rh-enriched (just S-saturated) and Pd–Cu-enriched (S-undersaturated). They coexist with andesite at 983 °C and dacite-rhyolite groundmass glass 845 °C respectively, and are crystallised along the lower Fe calc-alkaline trend at lower T. Latest fractionation is marked by strong Cu-enrichment in sample A1 area 7. This bulk composition also is S-undersaturated and coexists with rhyolitic silicate glass quenched at ~830 °C. Pt, Rh and Pd are differentiated with cooling from >1018 °C to ~845 °C in S-saturated sulfide melts that become S-undersaturated.
  • The abrupt change from tholeiitic to the calc-alkaline trend for host silicate melt inclusions in the three samples above is correlated here with decompression exsolutions in braggite–vysotskite and cuprorhodsite–(malanite) and with partial (incongruent) melting. It is known [42] that incongruent (partial) melting of experimental Mss is due to decompression (lowering of melt Ts of Mss) resulting in extreme bulk compositions, such as those in the samples above.
  • Decreasing fS2 with decreasing T is characteristic of the present Cu-PGM sulfide melt inclusions; confirmed by increasing Me:S ratios of late-crystallised minerals. Further lowering of melt fS2 by S-degassing is supported by the deflated shape of one composite inclusion indicating decompression in a rapidly ascending Alaskan-Uralian type melt.
  • Braggite–vysotskite compositions in two inclusions indicate strong fractionation of Pt and Pd within their confined boundaries. Braggite firstly is Pt-enriched and plots close to the boundary with cooperite indicating equilibration at high T, ~1000 °C. Other grains show increasing Pd towards Pd-enriched vysotskite. Coexisting silicate glass indicates a high T (1018 °C see above). Vysotskite analyses define two distinctly fractionated compositions. Vysotskite (1) is Pt enriched, but Pd still is dominant and shows alloy exsolutions due to decompression, while vysotskite (2) is more fractionated (Pd enriched, near Pd 36.30 at. %) and lacks alloy exsolutions. Thus, the latter likely crystallised at a higher intrusion level.
  • Cuprorhodsite–(malanite) occurs in all inclusion Cu-PGE sulfide parageneses. A range of Ir-poor compositions is represented in terms of Pt, Rh and Ir. This solid solution series varies from Pt:Rh= 21/79 at. % to Pt:Rh=37/63 at. %, with an extreme example Pt:Rh= 2/98 at. %. Rh concentrations are lower in cuprorhodsite–(malanite) from four inclusions equilibrated along the tholeiitic trend at highest Ts. Rh is highest in cuprorhodsite–(malanite) from three inclusions equilibrated along the calc-alkaline trend, partly due to decompression exsolution of Pt.
  • Decompression exsolutions of Pt-Fe alloy in cuprorhodsite is Rh-enriched isoferroplatinum reflecting its Rh-enriched host thiospinel, unlike the Pd-enrichment of alloy exsolutions in coexisting vysotskite (1), Figure 9.
  • Decompression partial melting in sample A1 area 7 (Figure 11) is supported by negative indents in shapes of Cu-PGM sulfide inclusions indicating resorption. One inclusion is torn apart with host alloy filling a wide gap. Figure 13a shows that the pre-existing sulfide inclusion is fractured and partly resorbed by a late Pt-Fe alloy decompression melt. This is compared with a fractured glass inclusion with infill of isoferroplatinum in a nugget from the Durance River, France ([31] Plate 1F). We suggest the latter possibly represents a lower T, partial decompression melt. Also in this sample decompression partial melting could have influenced the separation of the Cu-PGM sulfide fraction (halo of small inclusions that surround the host silicate inclusion). Here, partial melting also may have been influenced by water from the hydrous (~4.23 wt. %) silicate groundmass (glass) fraction quenched at 830 °C.
  • Minor inclusion minerals in Cu–Fe(+Ni)–PGE parageneses depend on bulk compositions after crystallization of braggite–(vysotskite) and cuprorhodsite–(malanite). Minor chalcopyrite and bornite mark strong, late Cu enrichment. Bornite shows rare exsolutions of an UM (possibly a Pt enriched analog of the minerals generalized as Me1-xS [21]. Minor pyrrhotite and isocubanite are also present. A series of Fe- then Ni-enriched thiospinels [ferrorhodsite, cuprorhodsite–(polydymite) and polydymite–(cuprorhodsite)] are minor minerals in one sample. They represent the lowest T latest stage of crystallization. Other minor minerals are bowieite, hematite and a minor UM (unnamed mineral) (PdTe) is identified as an analogue of palladoarsenide Pd2As. Minor vasilite is last crystallized in two samples.
  • A strongly zoned plagioclase phenocryst with unusually calcic bytownite centrally is set in rhyolitic groundmass silicate glass of one sample, confirming a long silicate fractionation history [1].

Author Contributions

Conceptualization, B.J.B; methodology, B.J.B.; investigation, B.J.B.; data curation, B.J.B and L.M.B.; writing—original draft preparation, B.J.B.; references—original draft preparation B.J.B and L.M.B.

Funding

This research received no external funding.

Data Availability Statement

For analytical details see Supplementary Table A. Supplementary Data are available from the Depository of Unpublished Data on the MAC website (http://mineralogic alassociation.ca/), “Ecuador Platinum, CM62, 23-00025”.

Acknowledgments

Samples were supplied by RioDorado Limited (now liquidated) from their Sabaleta Project, Camumbi River, Ecuador. Many conclusions here depend on recent experimental studies and particularly the new silicate glass geothermometer of Yuan et al. [32]. We are very grateful to Karsten Goemann SEM & X-Ray Microanalysis, Central Science Laboratory, University of Tasmania, Hobart, Australia, for discussions and continued support for our ongoing research. Thanks also to Lin Sutherland for encouragement and suggestion to publish in Minerals. Invaluable ongoing access to library facilities at UNSW also is much appreciated.

Conflicts of Interest

The authors declare no conflict of interest.

References

  1. Barron, B.J.; Barron, L.M.; Goemann, K.; Danyushevsky, L. Silicate glass/crystal inclusions (some with PGM/Cr-spinel) in placer Pt-Fe alloy nuggets, northwest Ecuador: Genesis and evolution of a Ural-Alaskan type zoned intrusion. Can. J. Min. Pet. 2023, 61, 273-311. [CrossRef]
  2. Botcharnikov, R.E.; Almeev, R. R.; Koepke, J.; Holtz, F. Phase Relations and Liquid Lines of Descent in Hydrous Ferrobasalt–Implications for the Skaergaard Intrusion and Columbia River Flood Basalts. J. Petrol. 2008, 49, 1687-1727. [CrossRef]
  3. Kerr, A. C.; Aspden, J.A.;Tarney, J.; Pilatasig, L.F. The nature and provenance of accreted oceanic terranes in western Ecuador: Geochemical and tectonic constraints. J. Geol. Soc. London 2002, 159, 577-594. [CrossRef]
  4. Jaillard, E.; Lapierre, H.; Ordonez, M.; Toro Alava, J.; Amortegui, A.; Vanmelle, J. Accreted oceanic terranes in Ecuador: Southern edge of the Caribbean plate? Geol. Soc. Lond. Spec. Publ. 2009, 328, 469-485. [CrossRef]
  5. Jaillard,E. Late Cretaceous-Paleogene orogenic build-up of the Ecuadorian Andes: Review and discussion. Earth Sci. Rev. 2022, 230,104033. [CrossRef]
  6. Barron, B.J.; Barron, L.M. Inclusions in placer Pt-Fe alloy nuggets, Northwest Ecuador: Evolution of a Ural-Alaskan type PGE mineralizing system (Cr-spinel, IPGE sulfarsenides, and Cu-depleted PGM). Can. J. Min. Pet. 2024, 62, 253-306. [CrossRef]
  7. Zaccarini, F.; Garuti, G.; Pushkarev, E.; Thalhammer, O. Origin of Platinum Group Minerals (PGM) Inclusions in Chromite Deposits of the Urals. Minerals 2018, 8, 379;. [CrossRef]
  8. Makovicky, E.; Karup-Moller, S; Makovicky, M.; Rose-Hansen, J. Experimental Studies on the Phase Systems Fe-Ni-Pd-S and Fe-Pt-Pd-As-S Applied to PGE Deposits. Mineral. Petrol., 1990, 42, 307-319. [CrossRef]
  9. Helmy, H. M.; Bragagni, A. Platinum-group elements fractionation by selective complexing, the Os, Ir, Ru, Rh-arsenide-sulfide systems above 1020 °C. Geochim.Cosmochim.Acta 2017, 216, 169–183. [CrossRef]
  10. Helmy, H.M.; Botcharnikov, R. Experimental determination of the phase relations of Pt and Pd antimonides and bismuthinides in the Fe-Ni-Cu sulfide systems between 1100 and 700 °C Am. Mineral. 2020, 105,344-352. [CrossRef]
  11. Wood, M. Arsenic in Igneous Systems: An Experimental Investigation. Unpublished B. Sc. 2003 University of Toronto, Toronto, Ontario, Canada.
  12. Helmy, H.M.; Ballhaus C.; Wohlgemuth-Ueberwasser, C.; Fonseca, R.O.C.; Laurenz, V. Partitioning of Se, As, Sb, Te and Bi between monosulfide solid solution and sulfide melt—application to magmatic sulfide deposits. Geochim. Cosmochim. Acta, 2010, 74, 6174–6179. [CrossRef]
  13. Helmy, H.M.; Ballhaus, C.; Fonseca, R.O.C.; Nagel, T.J. Fractionation of platinum, palladium, nickel, and copper in sulfide–arsenide systems at magmatic temperature. Contrib. Mineral. Petrol. 2013, 166, 1725–1737. [CrossRef]
  14. Helmy, H.M.; Ballhaus, C.; Fonseca, R.O.C.; Leitzke,F.P. Concentrations of Pt, Pd, S, As, Se and Te in silicate melts at sulfide, arsenide, selenide and telluride saturation: evidence of PGE complexing in silicate melts? Contrib. Mineral. Petrol. 2020, 175, 65. [CrossRef]
  15. Piña, R.; Gervilla, F.; Helmy, H.; Fonseca, R.O.C.; Ballhaus, C. Partition behavior of platinum-group elements during the segregation of arsenide melts from sulfide magma. Am. Mineral. 2020, 105, 1889–1897. [CrossRef]
  16. Barron, B. J. Inclusions in Pt-Fe alloy Ecuador: Evolution of an Alaskan-Uralian type mineralizing system (Cu-PGE sulfide minerals and ore parageneses from partial decompression melt). Can. J. Min. Pet. In Press.
  17. Li, C.; Barnes, S.-J.; Makovicky, E.; Rose-Hansen, J.; Makovicky, M. Partitioning of nickel, copper, iridium, rhenium, platinum, and palladium between monosulfide solid solution and sulfide liquid: Effects of composition and temperature. Geochim. Cosmochim. Acta 1996, 60, 1231- 1238. [CrossRef]
  18. Allaez, J.M.; Williams, M.L.; Jercinovic, M.J.; Goemann, K.; Donovan, J. Multipoint background analysis: Gaining precision and accuracy in microprobe trace element analysis. Microscopy and Microanalysis 2019, 25(1), 30–46. [CrossRef]
  19. Cabri, L.J.; McDonald, A.M. Mineralogy of Pt-Pd sulfides: The Redefinition of Braggite and Vysotskite (With comments on the extent of solid solution in the PtS–PdS binary). Can. J. Min. Pet. 2023, 61, 167-175. [CrossRef]
  20. Nesterenko, G.V.; Zhmodik, S.M.; Belyanin, D.K.; Airiyants, E.V.; Karmanov, N.S. Micrometric Inclusions in Platinum-Group Minerals from Gornaya Shoria, Southern Siberia, Russia: Problems and Genetic Significance. Minerals 2019, 9, 327. [CrossRef]
  21. Tolstykh, N.D.; Krivenko, A.P. On the composition of sulfides containing platinum group elements. Zapiski Vaeross. Mineral. Obshch. 1994, 123, 41-49.
  22. Cabri, L.J.; Oberthur,T.; Schumann, D. The mineralogy of Pt-Fe alloys and phase relations in the Pt-Fe binary system. Can. Mineral. 2022, 60,1–9. [CrossRef]
  23. Junge, M.; Goldmann, S.; Wotruba, H. Mineralogy and mineral chemistry of detrital platinum-group minerals and gold particles from the Elbe, Germany. Eur. J. Mineral. 2023, 35, 439–459. [CrossRef]
  24. Caye, R.; Cervellet, B.; Cesbron, F.; Oudin, E.; Picot, P.; Pillard, F. Isocubanite, a new definition of the cubic polymorph of cubanite CuFe2S3. Mineral. Mag. 1988, 52, 509-514. [CrossRef]
  25. Tistl, M.; Salazar, G. The magmatic evolution of northwestern South America: Zentralblatt fiir Geologic und Palantologie 1993, part 1, v. 2, p. 439-452.
  26. Tistl, M. Geochemistry of Platinum-Group Elements of the Zoned Ultramafic Alto Condoto Complex, Northwest Colombia. Econ. Geol. 1994, 89, 158-167. [CrossRef]
  27. Tistl, M.; Burgath, K.P.; Hohndorf, A.; Kreuzer,H.; Mufioz,R.; Salinas, R. Origin and emplacement of Tertiary ultramafic complexes in northwest Colombia: Evidence from geochemistry and K-Ar, Sm-Nd and Rb-Sr isotopes. Earth Plan. Sci. Lett. 1994, 126, 41-59. [CrossRef]
  28. Weiser, T.; Schmidt-Thome, M. Platinum Group Minerals from the Santiago River, Esmeraldas Province, Ecuador. Can. Mineral. 1993, 31, 6l-73.
  29. Gervilla, F., Garcίa-Guinea, J., Capitián-Vallvey, L.F. Platina in the 18th century: Mineralogy of the crude concentrate used in the first modern attempts at refining platinum. Mineral. Mag. 2020, 84, 289–299. [CrossRef]
  30. Le Bas, M. J.; LeMaitre, R. W.; Streckeisen, A. A chemical classification of volcanic rocks based on the total alkali-silica diagram. J. Petrol. 1986, 27(3), 745-750. [CrossRef]
  31. Johan, Z.; Ohnenstetter, M.; Fischer, W.; Amossé. J. Platinum-Group Minerals from the Durance River alluvium, France. Mineral. Petrol. 1990, 42, 287-306. [CrossRef]
  32. Yuan, S.; Williams-Jones, A.E.; Bodnar, R. J.; Zhao, P.; Zajacz, Z.; Chou, I-M.; Mao, J. The role of magma differentiation in optimizing the fluid-assisted extraction of copper to generate large porphyry-type deposits. Sci. Advanc. 2025, 11, eadr8464. [CrossRef]
  33. Sisson, T.W.; Grove, T.L. Experimental investigations of the role of H2O in calc-alkaline differentiation and subduction zone magmatism. Contrib. Mineral. Petrol. 1993, 113, 143–166. [CrossRef]
  34. Berndt, J.; Koepke, J.; Holtz, F. An experimental investigation of the influence of water and oxygen fugacity on differentiation of MORB at 200MPa. J. Petrol. 2005, 46, 135-167. [CrossRef]
  35. Koepke, J.; Berndt, J; Feig, S.T.; Holtz, F. The formation of SiO2-rich melts within the deep oceanic crust by hydrous partial melting of gabbros. Contrib Mineral Petrol. 2007, 153, 67–84. [CrossRef]
  36. Ballhaus, C.; Bockrath, C; Wohlgemuth-Ueberwasser, C.; Laurenz, V.; Berndt, J. Fractionation of the noble metals by physical processes and mantle-melting controls on calc-alkaline differentiation trends. Contrib. Mineral. Petrol. 2006, 152, 667–684. [CrossRef]
  37. Borisov, A.; Palme, H. Experimental determination of the solubility of Pt in silicate melts. Geochim. Cosmochim. Acta 1997, 61, 4349–4357. [CrossRef]
  38. Borisov, A.; Palme, H. Solubilities of noble metals in Fe-containing silicate melts as derived from experiments in Fe-free systems. Am. Mineral. 2000, 85, 1665–1673. [CrossRef]
  39. Berdnikov, N.V.; Nevstruev, V.G; Kepezhinskas, P.K.; Mochalov, A.G.; Yakubovich, O.V. PGE mineralization in andesite explosive breccias associated with the Poperechny iron-manganese deposit (Lesser Khingan, Far East Russia). Ore Geol. Rev. 2020, 118, 103352. [CrossRef]
  40. Li, Z.; Mungall, J.E.; Georgatou, A.A.; Wang, H.; Dong, Y.H.; Shi, G.Y.; Chen, L.; Chu, F.Y.; Li, X.H. Magmatic sulfide oxidation drives crustal PGE mobilization: Implications for hydrothermal PGE mineralization. Geochim. Cosmochim. Acta, 2024, 378, 114–126. [CrossRef]
  41. Borisov, A.; Danushevsky, L. The effect of silica contents on Pd, Pt and Rh solubilities in silicate melts: an experimental study. Eur. J. Mineral. 2011, 23, 355–367. [CrossRef]
  42. Peregoedova, A.; Barnes, S.J.; Baker, D.R. The formation of Pt-Ir alloys and Cu-Pd-rich sulfide melts by partial desulfurization of Fe-Ni-Cu sulfides: Results of experiments and implications for natural systems. Chem. Geol. 2004, 208, 247–264. [CrossRef]
  43. Fonseca, R.O.C.; Beyer, C.; Bissbort, T.; Hartmann, R.; Schuth, S. Partitioning of highly siderophile elements between monosulfide solid solution and sulfide melt at high pressures. Contrib. Mineral. Petrol. 2024,179, 17. [CrossRef]
  44. Peregoedova, A.; Ohnenstetter, M. Collectors of Pt, Pd and Rh in an S-Poor Fe–Ni–Cu Sulfide System at 760 °C: Experimental data and application to ore deposits. Can. Mineral. 2002, 40, 527-561. [CrossRef]
  45. Ballhaus, C.; Tredoux, M.; Späth, A. Phase relations in the Fe-Ni-Cu-PGE-S system at magmatic temperature and application to massive sulphide ores of the Sudbury Igneous Complex. J. Pet. 2001, 42, 10, 1911-1926. [CrossRef]
  46. Verryn, S.M.C.; Merkle, R. K. W. The System PtS–PdS–NiS between 1200° And 700 °C. Can. Mineral. 2002, 40, 571-584. [CrossRef]
  47. Grove, T. L.; Elkins-Tanton, L. T.; Parman, S. W.; Chatterjee, N.; Muntener, O.; Gaetani, G. A. Fractional crystallization and mantle-melting controls on calc-alkaline differentiation trends. Contrib. Mineral. Petrol., 2003, 145, 515-533. [CrossRef]
Figure 1. Location of the Sabaleta Project area, Camumbi River, and accreted arc terranes, northwestern Ecuador. The Late Cretaceous Naranjal Terrane comprises island arc lavas and intrusions. After geological map [4,5].
Preprints 182921 g001
Figure 2. Sample A2 area 7. BSE (backscatter electron images). (a) Native platinum nugget sample A2 area 7 showing slightly oval-shaped chilled basalt glass inclusion with distinctive strain shadow microstructures. Small inclusions of PGM sulfide parageneses form an outlying arc-shaped ‘corona’. (b) Cuprorhodsite–(malanite) crystal (analysis 327) set in an unanalysed mineral that fills adjacent strain shadow microstructures. (c) Vysotskite crystal (analysis 328) set in a fibrous irregular crystal site too small for analysis.
Preprints 182921 g002
Figure 3. Sample A2 area 6. Inclusions and analysis numbers. (a) Reflected light image. Cu-PGM sulfide melt inclusions. Note PGM are (pale grey), bornite (dark purple) and chalcopyrite (yellow). Round inclusion (black) is silicate glass with coexisting rim of Cu-PGM sulfides. (b) BSE image. Partly broken round nugget enclosing two rounded silicate glass inclusions (black) with narrow rims of exsolved Cu- PGM sulfides showing scalloped margins. Analysis 276 is host isoferroplatinum. (c) BSE image. Detail of rounded silicate glass inclusion (black) coexisting with narrow rim of multiphase sulfide PGM. Note highly irregular (once molten) boundary of sulfide PGM paragenesis with host alloy. Minute PGM inclusions form a halo in host alloy. Analysis 325 is braggite. (d) BSE image. Analysis 317 is in central zone of braggite–(vysotskite); analysis 319 is subhedral braggite. PGE monosulfide mineral, analysis 320, forms skeletal crystallites in bornite (analysis 318). (e) BSE image. Note wispy irregular melt penetration into host alloy. Subhedral cuprorhodsite (321); chalcopyrite (322). (f) Wispy irregular melt penetration into host alloy and small sulfide droplets. Bornite (323). Subhedral braggite (324) is near cooperite composition.
Preprints 182921 g003
Figure 4. (a) Sample Mag 5 area 4. Reflected light. Oval-shaped host Pt-Fe alloy nugget (~220 µm long dimension) and composite inclusion (~90 mm diameter) of silicate glass (black) coexisting with thick rim of Cu-PGM sulfides. (b) Reflected light. Composite inclusion. Silicate glass black; thiospinel and braggite (grey); chalcopyrite (yellow) and pyrrhotite (pink). Minor patchy Pt-Fe alloy is white.
Preprints 182921 g004
Figure 5. Sample Mag 5 area 4. BSE images. (a) EDS phase mapped false colours of host isoferroplatinum (green); native platinum (green); silicate glass (black); and PGM paragenesis braggite (pink); chalcopyrite (dark brown); pyrrhotite (dark blue); cuprorhodsite (tan with orange exsolutions); minor isocubanite (FeSCu, dark purple). (b) Part of inclusion showing WDS analysis points: Isoferroplatinum, analysis 130; pyrrhotite, 131; cuprorhodsite without exsolutions, 132; braggite, 133; and chalcopyrite, 134. Silicate glass (black).
Preprints 182921 g005
Figure 6. Sample A1 area 9. BSE images. Analysis points, Table 6. (a) Rounded but partly chipped and broken host isoferroplatinum (analysis 267). Silicate glass (black) and two rounded Cu-PGM sulfide inclusions. (b) Largest Cu-PGM sulfide inclusion ; isoferroplatinum is subhedral (analysis 314); cupororhodsite–(malanite) 313; vasilite 312; pentlandite 316; and chalcopyrite 315.
Preprints 182921 g006
Figure 7. Sample B area 5. BSE images. (a) Platinum nugget with quenched round inclusion. The dominant PGM paragenesis is grey with abundant white (alloy) patches. Round black patch is exsolved silicate glass. Reflected light. (b) BSE image. WDS analysis points (Table 8). Analysis 6 is host nugget ferroan platinum; analyses 1, 8, 9, 12 are vasilite; 2, 11 are keithconnite; 4 cuprorhodsite; 5 Pt-Fe-Pd-Cu alloy rim; 7 is Pt-Fe-Rh-Pd-Cu alloy; and 13 is Fe-Rh-Ni monosulfide mineral.
Preprints 182921 g007
Figure 8. Sample B area 5 showing the approximate fraction % of seven minerals based on relative pixel counts for each. (a) Pt-Fe=alloy; (b) Rh-Cu-S=cuprorhodsite; (c) Pd-Cu-S=vasilite; (d) Rh-Cu-Fe-S=cuprorhodsite–(ferrorhodsite); (e) Pt-Fe-Pd=alloy; (f) Rh-Cu-Ni-S=cuprorhodsite–(polydymite); (g) Rh-Ni-Cu-S=polydymite–(cuprorhodsite); and (h) Rh-Cu-Pt-S=monosulfide mineral.
Preprints 182921 g008
Figure 10. Phase maps using EDS analysis and BSE images for mineral identification and approximate fraction % based on relative pixel counts. (a) Pt=Pt-Fe alloy; (b) RhSPtCu=cuprorhodsite; (c) PtPdS = vysotskite (1) and subordinate Ni-vysotskite (2); (d) RhS=bowieite; (e) PdSCu=vasilite; (f) FeO (hematite). The minor UM (unnamed mineral) Pd-dominant sulfide-telluride is not shown.
Preprints 182921 g010
Figure 11. Sample A1 area 7. BSE images. (a) Subrounded to subhedral Pt-Fe alloy host nugget with coexisting altered subhedral grains at the nugget margin. Scalloped outline of porphyritic silicate inclusion (dark grey) with an irregular ‘halo’ of small PGM inclusions (pale grey) located in the host Pt-Fe alloy (white). (b) Detail showing prismatic outlines of subhedral silicate phenocrysts, wispy crystallites and small, marginal vesicles (black) in silicate glass. Partial halo of rounded and partly resorbed, fractured and displaced PGM inclusions.
Preprints 182921 g011
Figure 12. BSE images. (a) PGM inclusion with subhedral prismatic cuprorhodsite–(malanite), analysis point (308), set in vasilite, analysis point (309). This inclusion has been torn apart and rounded negative indents suggest resorption. The two portions now are displaced and separated by host Fe-Pt alloy. The smaller portion also shows partial irregular resorption by host Pt-Fe alloy (partial decompression melt, see discussion below). (b) Two inclusions with similar mineralogy to (a). The larger inclusion shows complex rounded indents in subhedral cuprorhodsite and vasilite (possibly a gas cavity). Negative indentsin vasilite suggest resorption. In the smaller inclusion euhedral cuprorhodsite–(malanite) extends beyond the rounded (possibly vasilite) matrix.
Preprints 182921 g012
Figure 13. (a) Total alkali-silica (TAS) diagram (after Le Bas et al. [30]), with all analyses recalculated to 100% minus volatiles) showing the differentiation trend (or liquid line of descent) of silicate glass inclusions in Pt-Fe alloy coexisting with Cu-PGE sulfide parageneses, dot dash line cf. Barron et al. [1] (their Figure 11). Filled circle, sample B area 1, silicate glass (1021.2 °C) coexists with Cr-spinel; open circle, synthetic ferrobasaltic glass (940-1200 °C) Skaergaard (Greenland), (Botcharnikov et al. [2]; open star, proposed approximate primitive picrobasalt melt (cf. Johan et al. [31] SiO2 ~ 44 wt.%), this value may not be volatile-free). The following numbers refer to quenched glass in the present seven samples considered here. 1, thin star i (A2 area 7); 2, thin star h (A2 area 6); 3, filled plus (Mag 5 area 4); 4, thin star b (A1 area 9); 5, filled triangle (B area 5); 6, open square (B area 4); 7, filled diamond (A1 area 7). Temperatures are calculated using the SiO2 concentrations in coexisting silicate glass [32]. (b) AFM diagram showing liquid lines of descent for quenched silicate glass in the seven samples considered here, following first the tholeiitic and then calc-alkaline magma series trends (dotted line). The dashed line marks the boundary between tholeiitic and calc-alkaline compositions. A=alkali (Na + K oxides), F=Fe-oxide, M=Mg oxide. BT=tholeiitic basalt, FB=ferrobasalt, ABT=tholeiitic basaltic andesite, AT=tholeiitic andesite, D=dacite, R=rhyolite, B=basalt, AB=basaltic andesite, A=andesite. (Barron et al. [1] Figure 12).
Preprints 182921 g013
Figure 14. The path of differentiation by fractional crystallization is shown by black dashed lines. The path of differentiation by incongruent melting is shown by solid red lines. (a) Inclusion bulk compositions of Cu-PGM sulfide fractions in four samples in terms of Pt+Pd+Rh–Cu–Fe(+Ni+Co) (at. %). (b) Inclusion bulk compositions of Cu-PGM sulfide fractions in four samples in terms of Pt–Rh–Pd (at. %). Temperatures are calculated using the SiO2 concentrations in coexisting silicate glass [32].
Preprints 182921 g014
Figure 15. Triangular plot in terms of (Pd,Rh)S-(Pt,Ir)S and (Ni,Fe,Cu,Co)S for nine EPMA analyses (numbered, mol. % following Cabri et al. [19] their Figure 1). Dashed lines mark their boundaries for cooperite, braggite and vysotskite. Three analyses from inclusions in one sample (filled circles) show a wide range of fractionated compositions from braggite (near cooperite) to vysotskite (dot dash lines). Arrow indicates direction of fractionation. Four analyses in the second sample (filled diamonds) also show a large compositional range from vysotskite (near braggite) to the most (Pd, Rh)-enriched vysotskite (analysis 054) indicating a late trend towards decreasing base metal elements.
Preprints 182921 g015
Figure 16. Pt–Rh–Ir ternary plot (at. %), showing the compositional range of cuprorhodsite-(malanite) in seven samples.
Preprints 182921 g016
Table 1. Analyses sample A2 area 7. 
wt. % S Fe Ni Cu Ru Rh Pd Os Ir Pt Total
1 (277) Pt 6.95 0.05 0.68 1.50 1.01 0.17 0.23 89.38 99.96
3 (327)* Crh 27.02 1.49 0.43 11.49 1.01 27.70 1.22 0.30 1.12 25.91 97.74
4 (328) Vys 22.40 1.31 1.30 1.62 0.07 0.93 45.27 26.26 99.17
at. % S Fe Ni Cu Ru Rh Pd Os Ir Pt Total
1 (277) Pt 20.05 0.13 1.74 2.35 1.53 0.14 0.19 73.87 100.00
3 (327)** Crh 56.58 1.79 0.49 12.14 0.67 18.08 0.77 0.11 0.39 8.92 100.00
4 (328) Vys 52.16 1.75 1.65 1.91 0.05 0.67 31.76 10.05 100.00
apfu S Fe Ni Cu Ru Rh Pd Os Ir Pt Me
1 (277) Pt 0.80 0.01 0.07 0.09 0.06 0.01 2.95 3.99
3 (327) Crh 3.96 0.12 0.03 0.85 0.05 1.26 0.05 0.01 0.03 0.62 3.02
4 (328) Vys 1.04 0.04 0.03 0.64 0.20 0.91
*Co 0.07, **Co 0.07, ***Co 0.01. Pt=native platinum. Crh=cuprorhodsite. Vys=vysotskite. Me=metal elements.
Table 2. WDS analyses. Sample A2 area 6. 
wt. % S Se Fe Ni Co Cu Ru Rh Pd Os Ir Pt Total
1 (276) ~ Ifp 6.37 1.69 1.27 0.83 0.22 88.62 99.00
(320) Ms 27.15 0.16 4.85 0.02 0.16 27.53 0.08 15.74 1.13 19.92 96.73
4 (321) Crh 28.98 0.16 2.41 0.15 0.22 13.71 0.13 25.18 0.09 0.90 27.75 99.69
8 (324) Bg 18.72 0.71 0.06 1.61 0.46 6.27 0.11 72.84 100.79
9 (325) Bg 21.41 0.34 0.50 0.98 1.45 2.69 25.61 0.34 47.16 100.47
at. % S Se Fe Ni Co Cu Ru Rh Pd Os Ir Pt Total
1 (276) ~Ifp 18.51 4.31 2.00 1.27 0.19 73.73 100.00
(320) Ms 51.83 0.13 5.31 0.02 0.16 26.53 0.05 9.36 0.36 6.25 100.00
4 (321) Crh 57.77 0.13 2.76 0.17 0.24 13.79 0.09 15.64 0.03 0.30 9.09 100.00
8 (324) Bg 55.06 1.20 0.09 2.40 0.42 5.56 0.06 35.21 100.00
9 (325) Bg 54.26 0.35 0.73 1.35 1.85 2.12 19.55 0.14 19.64 100.00
apfu S Se Fe Ni Co Cu Ru Rh Pd Os Ir Pt Me
1 (276) ~Ifp 0.74 0.17 0.08 0.05 0.01 2.95 4.00
(320) Ms 1.00 0.10 0.51 0.18 0.01 0.12 0.92
4 (321) Crh 3.99 0.01 0.19 0.01 0.02 0.95 0.01 1.08 0.02 0.63 2.91
8 (324) Bg 1.00 0.02 0.04 0.01 0.10 0.64 0.81
9 (325) Bg 0.99 0.01 0.01 0.03 0.03 0.04 0.36 0.36 0.83
Bg= braggite; Crh= cuprorhodsite–(malanite); Ifp=isoferroplatinum; Ms=monosulfide mineral. Italics, semiquantative analysis, small grain size < 3 µm cf. Nesterenko et al. [20].
Table 3. Sample Mag 5 area 4 calculated bulk chemistry of PGM (minus silicate glass). 
S Fe Co Ni Cu Rh Pd Os Ir Pt Total
wt. %
26.08 16.50 0.16 0.18 12.00 4.36 5.74 0.22 0.78 34.03 100.00
at. %
51.50 18.70 0.17 0.19 11.96 2.68 3.42 0.07 0.26 11.04 100.00
Me:S = 48.49:51.50 = 0.94 at. %. ~S saturated
Table 5. WDS Analyses Sample Mag 5 area 4. 
wt. % S Fe Co Ni Cu Rh Pd Ag Os Ir Pt Total
(129) Ifp 0.05 7.82 0.37 0.69 0.31 0.28 0.45 90.21 100.17
1(130)*Ifp 0.07 10.27 1.26 0.46 1.92 0.16 0.12 85.53 102.31
2(131) Po 37.78 58.52 0.04 0.07 0.22 0.21 0.10 0.71 97.70
3(132) Crh†† 29.19 5.58 0.29 11.39 26.48 1.84 6.73 17.78 99.55
4(133) Br 17.79 2.17 0.02 0.11 3.01 0.90 4.50 0.19 0.22 69.80 98.69
8FeSCu^Icb 34.56 40.42 0.57 1.05 22.34 1.05 100.00
*Zn 0.03, Si 0.01, Ca 0.02; **Te 0.06, Au2.45; Ca 0.04; ††Se 0.03, Ru 0.24.
at. % S Fe Co Ni Cu Rh Pd Ag Os Ir Pt Total
(129) Ifp host 0.23 22.47 0.94 1.08 0.46 0.24 0.37 74.21 100.00
1(130)* Ifp 0.34 26.96 2.91 0.66 2.65 0.22 0.09 64.27 100.00
2(131) Po 52.62 46.80 0.03 0.05 0.15 0.09 0.04 0.16 100.00
3(132) Crh†† 57.25 6.28 0.31 11.27 16.18 0.61 2.20 5.73 100.00
4(133) Br 52.63 3.68 0.03 0.18 4.49 0.83 4.01 0.09 0.11 33.95 100.00
8 FeSCu^Icb 49.30 33.09 0.44 0.82 16.08 0.25 100.00
*Zn 0.02, Ca 0.03; **Te 0.07, Au 1.82; Ca 0.04; ††Se 0.02, Ru 0.15.
apfu S Fe Co Ni Cu Rh Pd Ag Os Ir Pt Me
(129) Ifp 0.01 0.90 0.04 0.04 0.02 0.01 0.01 2.97 4.00
1(130)* Ifp 0.01 1.08 0.12 0.03 0.11 0.01 2.57 3.99
2(131) Po 1.00 0.89 0.90
3(132) Crh 4.00 0.44 0.02 0.79 1.13 0.04 0.15 0.40 2.97
4(133) Br 1.00 0.07 0.09 0.02 0.08 0.65 0.91
8 FeSCu^Icb 2.97 2.00 0.06 0.97 3.03
*Au 0.07; (Co 0.001+Ni 0.001+Cu 0.003+Rh 0.002+Pd 0.001+Pt 0.003 = 0.01). ^EDS, minus minor O, Si and Ca. Ifp=isoferroplatinum; Po=pyrrhotite; Crh=cuprorhodsite–(malanite) minus alloy lenses; Br=braggite. Icb=Isocubanite.
Table 6. WDS analyses Sample A1 area 9. 
wt. % S Se Fe Co Ni Cu Ru Rh Pd Os Ir Pt Total
1 (267)Ifp host 7.67 0.04 0.62 1.29 0.29 0.28 1.72 88.54 100.45
2(312)* vs. 13.24 0.11 0.36 0.12 11.39 0.10 74.19 0.29 99.85
3(313) Crh 30.39 3.28 0.03 0.79 10.50 0.25 28.82 0.37 2.64 25.18 102.25
4(314) Ifp incl 0.06 9.07 0.13 1.25 0.78 1.37 88.32 100.98
5(315) Cpy 35.67 27.21 0.16 31.61 0.39 0.23 0.10 0.62 96.03
6(316)^ Pn 31.64 30.16 0.46 19.14 3.80 2.91 8.06 0.08 0.26 96.55
at. % S Se Fe Co Ni Cu Ru Rh Pd Os Ir Pt Total
1(267) Ifp host 21.90 0.11 1.56 1.99 0.44 0.23 1.43 72.34 100.00
2(312)** Vs 31.71 0.10 0.50 0.15 13.76 0.08 53.55 0.11 100.00
3(313)Crh 58.76 3.64 0.03 0.83 10.24 0.15 17.36 0.12 0.85 8.00 100.00
4(314) Ifp incl 0.28 24.64 0.34 2.98 1.16 1.95 68.66 100.00
5(315)††Cpy 52.73 23.09 0.13 23.57 0.18 0.10 0.02 0.15 100.00
6(316)^^ Pn 48.69 26.62 0.39 16.09 2.95 1.40 3.74 0.02 0.07 100.00
apfu S Se Fe Co Ni Cu Ru Rh Pd Os Ir Pt Me
1(267) Ifp 0.88 0.06 0.08 0.02 0.01 0.06 2.89 4.00
2(312)*** ~Vs 6.97 0.02 0.11 0.03 3.03 0.02 11.99 0.02 15.20
3(313 Crh 4.00 0.25 0.06 0.73 0.01 1.24 0.01 0.06 0.54 2.93
3(313) UM 9.98 0.62 0.01 0.12 1.79 0.03 2.95 0.02 0.14 1.36 7.04
4(314) Ifp incl 0.99 0.01 0.12 0.05 0.08 0.01 2.75 4.01
5(315)†† Cpy 2.00 0.88 0.89 0.01 0.01 1.79
6(316)^^ Pn 8.00 4.37 0.06 2.64 0.48 0.23 0.61 0.01 8.42
*Te 0.06; **Te 0.03; ***Te 0.01. Zn 0.03; ††Zn 0.02. ^Zn 0.03; ^^Zn 0.02. Cpy=chalcoppyrite; Ifp=isoferroplatinum; Pn=pentlandite; Vs= vasilite. Italics, semiquantative analyses, small grain size ~3 µm [20].
Table 9. Sample B Area 5. PGM analyses (EDS based on pixel counts). 
wt. % Mineral S Fe Ni Cu Rh Pd Pt O Total
3(22) Crh^ Rh-Cu-S 33.17 6.53 0.41 9.19 50.49 100
6(25) PtFePdCu Pt-Fe-Pd 10.27 1.56 10.91 77.25 100
7(26) Crh-Pld Rh-Cu-Ni-S 33.48 1.83 4.68 9.96 50.05 100
10(29) Crh-Pld Rh-Ni-Cu-S 35.13 4.68 13.32 7.57 39.30 100
11(30) Ms Rh-Cu-Pt-S 25.00 6.86 0.75 6.49 34.06 26.83 100
14(33)*Crh-(Fe) Rh-Cu-Fe-S 32.81 7.95 0.81 11.94 46.48 100
16(35)+ Hem Fe-O 0.61 68.07 0.88 29.56 100
at. % S Fe Ni Cu Rh Pd Pt O Me
3(22) Crh^^ Rh-Cu-S 57.02 6.51 0.39 8.05 27.31 42.41
6(25) PtFePdCu Pt-Fe-Pd 26.01 3.48 14.51 56.00 100
7(26) Crh-(Pld) Rh-Cu-Ni-S 58.02 1.82 4.43 8.71 27.02 41.98
10(29) Crh-(Pld) Rh-Ni-Cu-S 57.44 4.40 11.90 6.25 20.02 42.57
11(30) Ms Rh-Cu-Pt-S 52.47 8.27 0.86 6.87 22.27 9.25 47.52
14(33)*Crh-(Fe) Rh-Cu-Fe-S 56.24 7.83 0.76 10.33 24.83 43.75
16(35)++ Hem Fe-O 0.61 38.91 0.48 58.98 98.37
*Recalculated minus O. +Al 0.35; Si 0.54. ++Al 0.42; Si 0.61. ^Se=0.22; ^^Se=0.15. Crh=cuprorhodsite. Pld= polydymite. Ms=monosulfide mineral. Hem=hematite.
Table 12. Sample B (Area 4). EDS analyses, additional PGM identified by phase map analysis. 
wt. % S Fe Ni Cu Rh Pd Te As Os Ir Pt O Total
5Bow^ 30.81 0.29 0.33 0.95 56.85 4.39 0.65 3.26 2.46 100.00
9Ifp 7.37 3.45 89.18 100.00
17Hem 3.23 54.80 1.38 9.26 3.45 26.81 100.00
18 UM^ 5.98 1.33 0.54 63.64 20.82 0.32 7.38 100.00
at. % S Fe Ni Cu Rh Pd Te As Os Ir Pt O Total
5RhS^ 59.56 0.31 0.34 0.92 34.28 2.56 0.21 1.07 0.78 100.00
9Ifp 21.20 5.38 73.42 100.00
17Hem 3.47 33.80 0.81 2.99 0.18 0.61 57.68 100.00
18 UM^ 18.25 2.21 0.82 58.58 15.97 0.42 3.70 100.00
^Recalculated minus minor O, Si. Bow=bowieite; Hem=hematite; Ifp=isoferroplatinum; UM=Pd sulfide-telluride.
Table 13. WDS analyses. Sample A1 area 7. 
wt. % S As Se Fe Ni Cu Ru Rh Pd Os Ir Pt Total
1(264) Pt-Fe 5.99 1.26 0.13 1.88 2.02 0.51 3.12 86.67 101.58
2(308) Crh 30.13 1.09 0.34 11.97 0.25 34.29 0.27 4.15 17.59 100.20
3(309)†† Vs 12.88 0.13 0.07 0.16 0.02 14.01 0.74 69.13 1.32 98.79
4(310) *Crh 30.58 0.04 1.00 0.36 12.10 0.24 34.28 0.26 3.90 18.23 101.02
Co 0.03; †† Te 0.05, Ag 0.29; *Co 0.04.
at. % S As Se Fe Ni Cu Ru Rh Pd Os Ir Pt Total
1(264) Pt-Fe 17.06 3.14 0.21 2.91 3.02 0.42 2.59 70.66 100.00
2(308) Crh 58.62 1.22 0.36 11.74 0.15 20.79 0.19 1.35 5.65 100.00
3(309)†† Vs 31.03 0.13 0.06 0.22 0.03 17.03 0.56 50.18 0.52 100.00
4(310) * Crh 58.88 0.03 1.10 0.37 11.75 0.14 20.56 0.08 1.25 5.77 100.00
Co 0.03; †† Te 0.03, Ag 0.21; *Co 0.04.
apfu S As Se Fe Ni Cu Ru Rh Pd Os Ir Pt Me
1(264) Pt-Fe 0.68 0.13 0.01 0.12 0.12 0.02 0.10 2.83 4.01
2(308) Crh 4.00 0.08 0.02 0.80 0.01 1.42 0.01 0.09 0.39 6.82
3(309)†† Vs 6.96 0.03 0.01 0.05 0.01 3.82 0.13 11.25 0.12 22.42
4(310) * Crh 4.00 0.07 0.03 0.80 0.01 1.40 0.01 0.09 0.39 6.80
Co 0.03; †† Te 0.03; *Co 0.04, Ag0.05; +Co 0.01. Crh=cuprorhodsite–(malanite). Vs=vasilite. (Mla)=malanite
Table 14. Sample A1 (area 7) Calculated bulk chemistry (assuming equal Crh & Vs). 
S Fe Ni Cu Rh Pd Os Ir Pt Total
wt. %
20.01 0.54 0.15 13.34 14.34 41.91 0.11 1.68 7.92 100.00
at. %
43.67 0.67 0.18 14.69 9.75 27.55 0.04 0.61 2.84 100.00
Me:S = 43.67:56.33 = 1.29 at. %. S-undersaturated.
Disclaimer/Publisher’s Note: The statements, opinions and data contained in all publications are solely those of the individual author(s) and contributor(s) and not of MDPI and/or the editor(s). MDPI and/or the editor(s) disclaim responsibility for any injury to people or property resulting from any ideas, methods, instructions or products referred to in the content.
Copyright: This open access article is published under a Creative Commons CC BY 4.0 license, which permit the free download, distribution, and reuse, provided that the author and preprint are cited in any reuse.
Prerpints.org logo

Preprints.org is a free preprint server supported by MDPI in Basel, Switzerland.

Subscribe

Disclaimer

Terms of Use

Privacy Policy

Privacy Settings

© 2025 MDPI (Basel, Switzerland) unless otherwise stated